Embed Size (px)
Citation preview

Competition, Insurance, and Quality in the
Market for Advanced Infertility Treatment
Barton H. Hamilton and Brian McManus�
January 2004
Abstract
For the 10%-15% of American married couples who experience reproductive problems, in
vitro fertilization (IVF) is the leading technologically advanced treatment procedure. Two im-
portant issues are at the center of policy debates regarding IVF markets: 1) expanding access
to infertility treatment, and 2) encouraging IVF clinics and patients to minimize the risk of
multiple births, which can be expensive and dangerous. This paper evaluates the two principle
policy proposals �insurance mandates and competition restrictions �for meeting these issues.
Insurance mandates, which require that insurers pay for a couple�s initial IVF treatments, suc-
ceed in attracting more patients into the market while also reducing multiple birth risks, but
mandates may unfavorably a¤ect clinics�incentives to use new treatment technology. Compe-
tition restrictions have been proposed as a way to reduce risky behavior by clinics and patients,
but we �nd that this reasoning does not apply to the U.S. IVF market. Like insurance man-
dates, additional competition can substantially increase the number of patients while reducing
the multiple birth rate.
Keywords: infertility; in vitro fertilization (IVF); access to IVF treatment; multiple births;
insurance mandates; competition restrictions.
JEL Classi�cations: I110 Analysis of Health Care Markets; L100 Market Structure, Firm
Strategy, and Market Performance: General
�We thank Lyda Bigelow, Gautam Gowrisankaran, Glenn MacDonald, Randall Odem, and seminar participants
at Northwestern, Washington University, and the 2003 UBC summer IO conference for many helpful comments.
Thomas Piper, Director of the Missouri CON program, provided us with information on state CON laws. Peter
Laakman, Jason Liauw, and Mindy Marks provided excellent research assistance. Contact information: Hamil-
ton: [email protected], 314-935-8057; McManus: [email protected], 314-935-4915. John M. Olin School of
Business, Washington University in St. Louis, Campus Box 1133, One Brookings Dr., St. Louis, MO 63130.
1

1 Introduction
An estimated 10%�15% of American married couples with a wife of reproductive age are infertile.1
For these 5 million couples, infertility treatment can include simple medical advice, ovulation drugs,
or the use of an assisted reproductive technology (ART) such as in vitro fertilization (IVF).2 ART
procedures are the most technologically advanced treatment for infertility, as they involve the
deliberate creation of an embryo outside of a woman�s body. Since the �rst test tube baby was
born in 1978, the use of IVF has spread rapidly. Between 1995 and 2000 (the time period of this
study) the number of ART treatment cycles3 rose from approximately 60,000 to 100,000, and the
number of ART-conceived babies increased from 16,600 to 35,000.4 The latter �gure comprises
about 1% of all births in the U.S. in 2000. Despite the growing prevalence of ART and IVF, to
our knowledge there have been no previous studies of the economics of infertility treatment access
and within-treatment choices.5 This paper provides a �rst examination of these issues.
There are two critical economic issues in markets for technologically advanced infertility treat-
ment. First, there are questions regarding access. While ART use is growing, the substantial
di¤erence between the numbers of infertile and treated couples is largely due to the price of the
procedure. In contrast to most medical care in the United States, patients pay out-of-pocket for
the majority of IVF cycles. The expense of one cycle in 2000 was typically between $10,000 and
$15,000, with 70% of the expense for the IVF clinic�s fees and the remainder for drugs. Addition-
ally, the probability of a birth following treatment is fairly low (about a third), which substantially
increases the expected expense of IVF.
1 Infertility is generally de�ned as the inability to become pregnant after 12 months of trying to conceive without
contraception (Stephen and Chandra [2000]). Data from the 1995 National Survey of Family Growth indicate that
21% of childless women aged 35-44 have received infertility treatments (Abma et al. [1997]).
2Over 90% of ART treatments are IVF. In the remainder of the paper we often using these terms interchangeably,
except where noted.
3ART services consist of a sequence of treatments performed over about two weeks, so it is more appropriate to
think of an ART procedure as a cycle of treatments.
4Many of these children were born as a twin, triplet, or more. To calculate the number of babies born through
ART in 1995, we assume that women giving birth to triplets or more had 3.2 babies, since the CDC did not report
this number in that year. See Reynolds et al. [2003] for additional details on the relative importance of ART to
multiple birth rates in the United States.
5There is an earlier paper on the pricing of ART by Schmittlein and Morrison [1999]. That paper considers the
use of success guarantees by IVF clinics. Bitler (2003) examines the impact of IVF on twin birth health outcomes.
2
Low birth probabilities are central to the second economic issue: decisions made during treat-
ment. Patients and doctors choose the number of embryos transferred to the woman during IVF.
Additional embryos increase the likelihood that a treatment cycle concludes with a birth, but they
also increase the probability of twins, triplets, or more. Multiple births are socially expensive and
dangerous,6 but patients and clinics do not bear all of the costs. Thus, there may be moral hazard
in embryo-transfer decisions. The current incentives and technology for infertility treatment has
yielded a multiple gestation rate that is much higher with ART (30%� 40%) than is true naturally
(2%). Finally, treatment choices and success rates are also a¤ected by the technology that an IVF
clinic uses to treat its patients. The use of more advanced techniques can increase birthrates, lower
multiple birth risks, or both.
To meet the concerns of the two economic issues identi�ed above, there are two main public
policy prescriptions. The �rst is the mandatory provision of insurance for IVF treatment.7 Insur-
ance coverage may induce some couples to substitute IVF for less expensive drug therapies, or to
try ART at an earlier point in their life cycle. During our sample period of 1995 to 2000, thirteen
states had mandates regarding insurance for ART costs.8 In 2001, two additional states enacted
insurance mandates for infertility treatment, while thirteen others are currently considering similar
legislation in order to increase access to IVF. The primary objective of insurance-coverage advo-
cates is to increase access to ART for less-wealthy couples who have had di¢ culty with natural
conception. A central tenet of this position is that infertility is a medical condition, and couples
with unfavorable fertility characteristics should not bear extraordinary costs to receive medical
care. An additional possible bene�t of insurance coverage for IVF is that patients may request less
aggressive treatment with regard to the number of embryos transferred. Insurance could allow a
couple to take treatment multiple times if necessary, so the couple would not feel the same incentive
to maximize the birth probability during their �rst treatment.
The second policy prescription is a reduction in competition between clinics. The welfare
bene�ts of competition on medical services is an open question. For example, Dranove, Shanley,
6High-order pregnancies involve more health risks for a woman, and low-birthweight children require additional
neonatal care and may experience more health problems later in life. Goldfarb et al. [1996] calculate the mean
medical cost of delivering a singleton baby or set of twins to be $39,000, while the average cost of delivering triplets
is $342,000.
7As noted by Gruber [1993], mandates may have little impact if insurance companies would cover ART services
even in the absence of regulation.
8Drug expenses are generally excluded from insurance coverage.
3

and Simon [1992] investigate whether hospital competition may lead to over-investment in high-cost
specialized services �a �medical arms race.� Recently, some medical researchers have questioned
the role of competition in the market for IVF services. In order to attract patients in a competitive
ART market, it is argued that a clinic has an incentive to transfer a high number of embryos to
each patient in order to increase the clinic�s birthrate, which in turn attracts more patients (Bergh
et al. [1999]; Wells [1999]).9 If this is correct, then limits on competition will reduce the number
of embryos transferred and the subsequent incidence and cost of multiple births.10 However, this
reasoning ignores the possibility that a monopoly clinic may exploit its market power to raise the
price of an IVF cycle.11 Low, competitive prices increase access to treatment in a way similar
to an insurance mandate. Additionally, a patient who faces high monopoly prices may choose
to transfer more embryos in order to reduce the likelihood that she will return for an additional
expensive ART treatment. Thus, limits on competition may in fact increase multiple birth rates.
The objective of this paper is to evaluate the e¤ects of insurance mandates and competition
on infertility treatment markets. Our analysis of insurance mandates complements the results of
Jain et al. [2002], who use 1997 state-level cross-sectional data to argue that insurance increases
access to IVF while reducing the risk of multiple births. However, Jain et al. do not control for
market-speci�c e¤ects like income and demographic characteristics that could a¤ect ART choices.12
Consequently, it is not clear from their study whether the introduction of a mandate in a particular
market will expand access to IVF treatment or change treatment patterns. Regarding the e¤ects
of competition on IVF, there have been no previous studies of this topic. We seek to resolve the
questions of whether competition can improve access through lower prices, and whether competitive
pressures drive clinics to in�ate multiple birth risks.
9Bergh et al. submit this argument following their study of IVF as practiced in Sweden. The authors may be
correct in describing the IVF market in that country, given the various details of medical treatment and regulations
there. Our paper evaluates whether the same argument can be applied to American IVF markets, which have their
own incentives and structure. We �nd that it cannot.
10For this to be true, parent must bear relatively few of the costs of multiple births.
11A survey of the literature by Dranove and White (1994) suggests that more concentrated hospital markets are
associated with higher prices for hospital services.
12The Jain et al. study is written for an audience of medical researchers and professionals, and the authors do not
emphasize that market characteristics other than insurance laws may shift the outcome variables of interest. They
aggregate ART statistics at the state level, while we prefer market-level analysis. This accounts for di¤erences in
markets within a state, and it allows us to address situations in which a market straddles state (and insurance regime)
borders.
4

Our results on insurance�s e¤ect on IVF access and treatment are similar to those of Jain
et al. in two areas. First, we �nd that an insurance mandate increases IVF usage in a market,
controlling for demographic characteristics. Second, we corroborate the �nding that women receive
fewer embryos (immediately decreasing their risk of multiple birth) in mandate states. However,
we note that an increase in competition can expand ART access too, and that insurance mandates
create an incentive for clinics to use (relatively) low-technology treatment for their patients.13
Among the new patients who may use ART, we infer that insurance induces more low-fertility
couples to take treatment than competition. The full e¤ects of both insurance and competition on
patient selection, treatment choices, and technology lead to a reduction in the multiple birth rate
for women under age 35, while only competition has a signi�cant e¤ect on this outcome for older
women. Finally, we examine market characteristics that attract the entry of new ART clinics, and
we �nd that clinics are generally attracted to areas where women are more educated and wealthier.
This last �nding suggests the broader importance of ART. The recent increase in IVF cycles
is not just due to new technology; the changing economic environment of the late 20th century
has shifted the demand for infertility treatment. As women�s labor force participation rates and
real wages have increased, couples have deferred the decision to have children.14 The average age
of the mother at �rst birth in the United States rose 3.5 years between 1970 and 2000 (Mathews
and Hamilton [2002]). However, biological fertility decreases with age (Menken et al. [1986]), so
there has been growth in the number of couples who choose to delay having children while in their
twenties only to encounter reproductive problems in their thirties. For many of these couples, an
IVF clinic o¤ers the �last best hope�of treating their infertility.
2 A Primer on ART and IVF
2.1 What happens during an IVF cycle?
An individual or couple seeking infertility treatment generally begins with medical tests and advice
on how to get pregnant without additional medical intervention. The next step is usually infertility
13 In their study of hospital quality in the Los Angeles area, Gowrisankaran and Towne [2002] also �nd that payer
identity matters in determining risk-adjusted medical treatment quality.
14The relationships among (in)fertility, labor, and human capital decisions are very similar to the issues described
by Goldin and Katz [2002] in their study of the impact of the introduction of the contraceptive pill.
5

Figure 1: An IVF Treatment Cycle
drugs to stimulate egg production, for which the couple pays several hundred dollars out-of-pocket.15
If these simple and relatively inexpensive treatment methods are unsuccessful or if the woman�s
reproductive window is closing due to her age, an ART procedure may be recommended by the
doctor or demanded by the patient. ART is a procedure in which eggs are surgically removed
from a woman�s ovaries, combined with sperm in the laboratory, and embryos (fertilized eggs) are
returned to the woman�s body or donated to another recipient.16
The dominant type of ART used in the U.S. is IVF. Events within an cycle of IVF treatment
are illustrated in Figure 1. A woman �rst receives drugs that stimulate egg production. While
there are broad guidelines for recommended dosages of these drugs to yield the optimal quantity
and quality of eggs, the dosage received may vary by physician and patient. During this period,
the woman visits the fertility clinic frequently to monitor egg development. The patient then
undergoes surgery to retrieve the eggs for insemination in the laboratory. While the sperm and
egg may be simply placed together to achieve fertilization, a more advanced technique known as
intracytoplasmic sperm injection (ICSI) may be used. With ICSI, a single sperm is injected directly
into the egg. ICSI is used to increase the likelihood of fertilization, although some reproductive
physicians may prefer more �natural�fertilization when possible for reasons of natural selection of
the sperm.17 The use of ICSI generally adds $900 � $1200 to the $10; 000 � $15; 000 in expenses
15 Infertility drugs alone are lower-quality treatment than IVF in two ways. First, per-egg success probabilities
are lower because fertilization is not assisted. Second, the variance in the multiplicity of embryos is higher because
the drugs may generate a large number of eggs available for fertilization. The relatively low price of drug treatment
combined with the high variance in multiple birth risk leads to the unfortunate coincidence of low income families
and dangerously high-order pregnancies.
16An exception to this set of steps is gamete intrafallopian transfer (GIFT), which does not include combining eggs
and sperm outside of a woman�s body. See below for additional details on GIFT.
17Hansen et al. [2002] examine birth defect risks among children conceived using IVF with and without ICSI, and
they are unable to reject the hypothesis that defect rates are una¤ected by ICSI use.
6

from the other steps of an IVF cycle.
The fertilized embryos are then cultured in the lab for 2 to 6 days as the cells begin to divide.
A lab technician grades the quality of the embryos, and a decision is made as to when embryos
should be transferred into the patient�s uterus. Additionally, the patient and her doctor must decide
how many embryos will be transferred, based on embryo quality.18 ;19 This is perhaps the most
important decision made by the doctor and patient during the IVF treatment cycle. Increasing
the number of embryos to transfer increases the likelihood of pregnancy. However, it also raises
the likelihood of multiple gestation, which is associated with higher miscarriage rates and lower
birthweights. If the patient has a large number of high-quality embryos and the lab is adept at
culturing the embryos, the physician may delay the transfer until day 5 or 6. At this point there
is more information as to which embryos are the most viable; this allows the physician to transfer
fewer embryos and minimize the multiple pregnancy risk for a given birthrate. Otherwise, the
transfer is made at day 2 or 3. A high-quality ART clinic will transfer fewer embryos and have a
lower rate of multiple births while still maintaining a high pregnancy and birthrate. A low-quality
clinic might transfer more embryos and have more multiple births in order to raise its birthrate.20
Some clinics also use less advanced forms of ART, which include gamete intrafallopian transfer
(GIFT) and zygote intrafallopian transfer (ZIFT). In GIFT, a laporascope is used to implant
unfertilized eggs and sperm in the woman�s fallopian tubes through a small incision in her abdomen,
while ZIFT uses the same surgical approach but �rst fertilizes the eggs in the lab. Both GIFT
and ZIFT are older methods that tend to have lower pregnancy rates and are more invasive for the
woman. Currently, IVF is by far the preferred procedure at most ART clinics.
Tables 2.1 and 2.2 summarize recent trends in IVF�s popularity and practices. About half of
18 In cases where the woman is unable to produce eggs, donor eggs from another woman, or frozen embryos from a
previous IVF cycle may be used. These phenomena were not very common during 1995-2000, and we do not consider
them in this paper.
19When there are �left over�embryos that are not transferred to the patient, the extra embryos are usually frozen
and preserved. Schieve et al. [1999] use patient-speci�c ART data to test whether cryopreservation is a signi�cant
indicator of quality-based selection among embryos. They �nd that the presence of cryopreservation is positively
correlated with live birth rates, but there was no signi�cant relationship between this treatment practice and multiple
births.
20Of course, these e¤ects are complicated by variation in the innate fertility of patients. Once patients are allowed
to sort themselves across clinics by their treatment needs, simple relationships between outcomes and quality are
unlikely to exist.
7

all IVF patients are under 35 years old, and birthrates for the procedure decline with a patient�s
age. Relatively young women have an average success rate near 30%, while women over 40 give
birth after only 10% of all cycles. Multiple birth risks also decline with age (while the average
number of embryos rises); these factors together re�ect the decline in fertility by age among IVF
patients. It is important to note that changes to biological fertility as well as selection e¤ects
(through survivorship bias) create this pattern. Table 2.2 shows the increases in IVF and ICSI
during 1995-2000, and the corresponding increase in birthrates over this period. The trends are
certainly favorable; the chance of a cycle ending with a birth has increased while multiple birth
risks have fallen.
2.2 Insurance mandates for ART
Between 1995 and 2000, a �xed set of thirteen states had mandates regarding insurance for ART.21
An interesting aspect of these mandates is that they were generally passed in the late 1980s, before
IVF was introduced on a wide scale to the general public. The states vary in whether insurers
are required to cover ART expenses for all clients or just o¤er ART coverage for a fee. The states
also di¤er in the number of ART cycles that may be covered, the types of technology that may be
used, and the conditions that a patient must satisfy before receiving covered treatment. Ten of
the thirteen states include IVF in their ART laws, while the remaining three states omit IVF from
insurance coverage regulations.22 Our main focus in this paper is the use of IVF to treat infertility,
so when we refer to �insurance states�in the analysis below, we intend this to mean the ten states
with regulations that apply to IVF. We continue to use the terms ART and IVF interchangeably.
On Table 2.3 we compare the characteristics of states with and without IVF-speci�c insurance
mandates. Our goal is to describe how residents of these groups of states are di¤erent, and whether
the di¤erences are likely to a¤ect couples�decisions regarding IVF demand and treatment choices.
The statistics on Table 2.3 show that the ten states with IVF-speci�c regulations are similar to the
remaining states in several relevant demographic measures from the 1990 decennial census.23 We
21The states are Arkansas, California, Connecticut, Hawaii, Illinois, Maryland, Massachusetts, Montana, New York,
Ohio, Rhode Island, Texas, and West Virginia. Montana is an interesting case, as it did not have any clinics between
1995 and 2000.
22California and New York explicitly exclude IVF from their insurance regulations. Montana does not mention
IVF in its laws, but whether the Montana law could apply to IVF is an untested question due to the absence of clinics
in that state.
23We use the 1990 census instead of the 2000 census because we use Table 2.3 to describe the preferences and
8

examine female labor force participation rates, female educational attainment, average family size,
and median household income. Tests of equality of means for these variables from mandate and
non-mandate states fail to reject the null hypotheses that the means are equal. The main di¤erences
between states with and without ART regulations appear to be in their residents�preferences for
government intervention in medical markets. ART regulations tend to be a small part of a broad
slate of insurance mandates that cover a variety of health issues. The bottom rows on Table 2.3
demonstrate that the presence of an ART mandate is correlated with laws that support colorectal
cancer screenings, Medicaid funding of abortions, and mental health parity. A related characteristic
of IVF insurance states is that their residents are more likely to vote for a Democrat in presidential
elections. In total, these �ndings on demographic variables and political tendencies are evidence
that state residents vary in their governing tastes but not necessarily their preferences for children
or other related life-cycle decisions. This is important for the empirical analysis below, in which
assume that residents of markets with insurance mandates do not have unobserved preferences
with a substantial impact on their likelihood of initiating an IVF cycle or making certain treatment
choices.24
3 A Model of the ART Market
Many factors simultaneously a¤ect the choices of ART clinics and their potential patients. In
order to better understand the main ways in which insurance regulations and market structure
a¤ect these choices, we present a simple model of an ART market.25
3.1 Preferences, fertility, and technology
Assume that the market for ART treatment is populated withN initially childless couples (potential
ART patients) who make one choice regarding reproduction. All couples share the goal of having
one child, and the lifetime utility value of one child is B. Couples vary in their innate fertility, t,
characteristics of the states before IVF achieved its late-1990s level of popularity.
24One might argue that the extensive use of health insurance mandates in states with coverage for IVF may lead
employers to drop insurance coverage for employees or to self-insure. If true, IVF mandates may have little e¤ect
on access to ART. However, Gruber [1994] �nds no evidence that states with more mandates have lower rates of
insurance coverage or higher rates of self-insurance.
25 In a related working paper (Hamilton and McManus [2003]), we provide a more rigorous analysis of dynamic
decisions by patients and clinics.
9

which is distributed uniformly on [0; ] with < 1: Couples, who have no uncertainty regarding
their own value of t, may attempt to conceive naturally or use an ART clinic. Natural reproduction
occurs with probability t, while a clinic with technology k > 1 provides the conception probability
�(t; k) � t. For convenience, we parameterize � as �(t; k) = kt for t � 1=k and �(t; k) = for
t > 1=k. An advantage of this functional form is that a higher k implies (weakly) higher birth
probabilities; this is illustrated on Figure 2. Additionally, �(0; k) = 0 and �( ; k) = , so very low
and very high fertility couples do not gain much from using the clinic�s services. The clinic collects
a price of p for each use of its services, and couples pay the additional fee d (for drugs and other
expenses) when they use ART. Let x = p + d be the full expense of one ART cycle. We assume
the ART clinic uses the same technology in treating all of its patients, and all patients are charged
the same price. Each couple has a stock of assets, A, that it divides between consumption and
infertility treatment.26 The utility from consumption is given by the increasing, strictly concave
function u. Depending on a couple�s infertility treatment choice, utility from consumption is either
u(A� p� d) or u(A). Let �(p) = u(A)� u(A� p� d) represent the lost utility from consumption
when a couple pays p+ d for infertility treatment.
3.2 Optimal choices by patients and clinics
We begin by considering what happens when theN couples in the ART market have the opportunity
to use a monopoly clinic. Given the clinic�s p and k; couples evaluate whether they will purchase
treatment by comparing the expected utility from their two options. The return from treatment
is B�(t; k)+u(A� p� d), and a couple has expected utility of Bt+u(A) if they forego ART. The
simple form of � yields a pair of indi¤erence conditions that de�nes the set of couples who seek
treatment. Couples with values of t in [t1; t2] use the ART clinic,27 with
t1 =�(p)
B(k � 1) and t2 = ��(p)
B:
These couples have the largest gain in birth probability from treatment. The separation of couples
across reproduction options is illustrated in Figure 3. The set of fertility types who choose treat-
26We maintain a fairly open interpretation of A. If we want to think about wealth di¤erences across markets, this
a¤ects A in an obvious way. If we want to consider the dynamic e¤ects of a price reduction, we think of potential
second-time patients making their current treatment decision with a larger amount of assets left over from previous
periods.
27We assume that the zero-measure population of consumers who are indi¤erent among treatment options always
break these ties by taking �more�treatment.
10

ment expands with technology k and contracts with p (through �). Also, if we increase the stock
of assets A �perhaps because couples become more wealthy or they have not spent as much in
periods prior to the present one �the measure of treated couples increases because of the concavity
of u.
We assume that the monopoly clinic sets k and then p to maximize pro�t.28 The clinic faces
demand D(p; k) = N [t2� t1]. Assume that the clinic has a marginal cost of treating one additional
couple equal to c(k), and this is independent of quantity. Pro�t is D(p; k)[p� c(k)]�F (k); where
F is �xed cost. Both c and F are increasing and convex in k. For a given k; the clinic sets p by
making a simple trade-o¤ between expanding market share and collecting a high margin from its
patients. The solution for the optimal k in this static model is straightforward as well.29
3.3 Extensions to insurance, embryos, and competition
We now consider a group of extensions to the simple model introduced above. A thorough consider-
ation of many issues related to the ART market requires a dynamic model of repeated reproductive
decisions. We believe that including such a model is beyond the scope of the present paper, but
many of the relevant dynamic issues may be explored su¢ ciently if we simply think of patients
going through several iterations of the choices described above.
3.3.1 Insurance
Mandated insurance coverage allows couples to take a small number of cycles with the clinic�s fees
(p) covered by their insurance providers, but the expenses of all subsequent cycles are paid out-of-
pocket. We model this policy as the opportunity for a couple to take one cycle under insurance.
This reduces the total expense of treatment to d for an insured couple. The direct price e¤ect
of this change in x expands the fertility thresholds t1 and t2, and the market grows as new lower-
and higher-fertility couples are treated. In addition, the e¤ect of insurance mandates on birthrates
28An alternative (perhaps opposite) assumption would be that a clinic takes the maximization of its client�s utility
as the clinic�s own objective function. While doctors certainly make many choices for the bene�t of their patients,
they are not immune from �nancial incentives (Gaynor and Rebitzer [2003]). With the present data we are unable
to evaluate what enters a clinic�s objective function, so our model of pro�t-maximizing clinics may be interpreted as
one important component of what might actually be a more complex set of clinic goals.
29The concavity of u, the convexity of c and F , and the simple distribution of t together insure that the clinic�s
pro�t maximization problem is concave in p and k.
11

depends on the relative fractions of low- and high-fertility patients induced to enter the IVF market
as a result of insurance.
The dynamic e¤ect of the limited insurance policy is likely to move patients toward earlier treat-
ment. Consider a couple�s trade-o¤ between enhanced fertility today and additional consumption
(and possibly treatment) tomorrow. A high out-of-pocket p means that the bene�ts of delaying
ART include a substantial avoided cost if the couple becomes pregnant naturally while young.
Insurance reduces this bene�t of waiting, and couples will take treatment earlier.30 As a result,
we expect insurance mandates to expand the IVF market relatively more for younger couples than
older couples.
Next, consider how insurance coverage might a¤ect a clinic�s technology choices. The clinic
in an insurance mandate market serves two sub-markets simultaneously: a group of out-of-pocket
patients whose insurance coverage has been exhausted and a group of insured couples. It is
reasonable to conjecture that the reimbursement fee paid to the clinic by insurance �rms is less
than the out-of-pocket price, so the uninsured patients provide a higher pro�t margin.31 This
creates an incentive for the clinic to build its most pro�table patient segment, but this only occurs
through unsuccessful cycles for the same patients while they are insured. Thus, an insurance
mandate may encourage a clinic to adopt or employ lower levels of technology, so that the clinic
may treat the same couple multiple times.
3.3.2 Embryos and insurance
As noted in Section 2, perhaps the most important decision within an IVF treatment concerns the
number of embryos transferred to the woman. Suppose that a couple can choose to take either
one or two embryos for the same treatment price p. The one-embryo option is exactly as we
describe treatment in Section 3.1. The two-embryo choice increases the chance of a birth as if
k has increased to �k, with � > 1. We assume that the probability of twins conditional on two
embryos is �kt, so that chance of bearing twins is increasing in the clinic�s general level of k and
the couple�s innate fertility. The probability of a singleton birth conditional on two embryos is
30An additional implication of optimal choices for insurance is that couples who plan to take treatment multiple
times if necessary (beyond what their insurer would cover) should use their insurance coverage on their �rst trips to
the clinic. The couple would not want to �risk� success on their �rst try at ART while paying out-of-pocket and
leave their insurance coverage on the table.
31Conversations with a local IVF clinic director suggested that in many instances reimbursement rates were sub-
stantially below the patient out-of-pocket price.
12

�(t; �k)� �kt. The utility value of twins is (1� �)B, with � 2 (0; 1) to capture the additional costs
and risks associated with multiple births.
This speci�cation of ART technology leads lower-t couples with t 2 [tE1 ; tE2 ] to choose two
embryos, while higher-t couples with t 2 (tE2 ; tE3 ] take one embryo.32 These threshold values of t
have the property tE1 < tE2 < t
E3 , and
tE1 =�(p)
B[k(�� ��)� 1] tE2 =
k(1� ��) tE3 = ��(p)
B:
Couples with fertility less than tE2 have the most to gain from an additional embryo because their
chance of twins is relatively small. We illustrate this separation among couples on Figure 4.
If one-time insurance coverage becomes available, we expect the market to grow (a reduction in
tE1 and an increase in tE3 ) due to the price e¤ect of insurance. Because couples pay the same
price for treatment regardless of the number of embryos, insurance does not immediately a¤ect tE2 .
However, this threshold might decrease due to an intertemporal income e¤ect. The large out-of-
pocket expense of ART may encourage couples without insurance to take more aggressive treatment
(i.e., two embryos) because they cannot a¤ord treatment again in a later period. Insured treatment
in the present period allows couples to carry more assets into subsequent periods. Overall, the
e¤ect of insurance on embryo choice is ambiguous. For a given k, the average number of embryos
declines if tE2 falls and tE3 increases su¢ ciently to outweigh the entrance of new low-fertility couples
into the market.
When a clinic has the opportunity to adjust k; an additional complication is introduced to
the total e¤ect of insurance on embryo choice. The clinic has the same incentive to reduce k as
discussed above, but now couples can respond to a reduction in technology with an increase in
embryos.33 Note that a reduction in multiple birth risk (average embryos weighted by t) does not
imply a reduction in multiple births. The increase in the number of treated two-embryo couples
may overwhelm a reduction in twins risk.
32We require the parameters �, �, and � to take �reasonable�values so that both embryo choices are selected and
the market shares are adjacent in t.
33Therefore, a clinic in an insurance market may cousel a patient against taking a high number of embryos not just
for health reasons but also to increase the expected number of cycles.
13

3.3.3 Competition
Finally, we consider how duopoly competition may a¤ect the market.34 Suppose there are two
vertically di¤erentiated clinics, H and L, which o¤er technologies and prices such that kH > kL and
pH > pL: Given �; couples sort themselves so that low-fertility couples choose the high-k clinic and
vice versa. As in the case of embryo choice, we assume that the sets of couples who take treatment
are adjacent. That is, couples with t 2 [tC1 ; tC2 ] use clinic H while those with t 2 (tC2 ; tC3 ] use clinic
L. The thresholds tC1 and tC3 are nearly identical to t1 and t2, respectively, as de�ned above, but
with H and L added as appropriate to indicate clinic-speci�c characteristics. The value of t that
separates the market shares is
tC2 =1
kL
� �
��(pH)��(pL)
B
��:
On Figure 5 we illustrate the separation of couples across treatment options.
This sorting pattern suggests caution in inferring clinic quality from success rates. Although the
high-k clinic can provide a (weakly) better success probability to a couple of �xed t than the low-k
clinic, in equilibrium the high-k clinic may report a lower success rate for its patients. Additionally,
clinics�incentives to vertically di¤erentiate may lead a pair of clinics to choose k levels above and
below the monopoly k. The observed market-level average technology depends on the distribution
of couples across clinics. The di¤erentiation of clinics and e¤ect of competition on prices provide
two ways in which a duopoly market may improve couples�welfare relative to a monopoly. First, a
wider variety of k values provides better matches between a clinics�technology and couples fertility
treatment needs. Second, lower prices due to competition means that more couples can a¤ord to
take treatment.
In considering how embryo choice is a¤ected by competition, we note that an income e¤ect
similar to that of insurance may also occur when competition leads to lower prices. When a couple
pays a lower out-of-pocket price for treatment, they carry more assets into future. Couples can
a¤ord to be less aggressive (with respect to embryos) in today�s treatment because they know that
treatment tomorrow is also possible.
34We do not consider insurance and competition simultaneously. The data suggest that markets with insurance
mandates are more concentrated. We can think of two reasons why this might be so. First, an insurance �rm may
prefer to contract with a small number of clinics in order to obtain a more favorable reimbursement rate. (Consider
the incentive to reduce bids in a procurement auction in which there is one winner v. two.) Second, insurance
coverage could foreclose competition endogenously if couples can choose their clinic. All couples would prefer the
highest-quality clinic, and any lower-quality clinic would not receive enough patients to remain open.
14

4 Market and ART Clinic Data
We have collected data from 1995 to 2000 on 494 unique U.S. ART clinics and their (potential)
markets. During this period, the number of active clinics grew from 259 in 1995 to 405 in 2000. All
active clinics in the U.S. are required to report treatment statistics to the Centers for Disease Control
(CDC). These statistics are our primary data source.35 The remaining data are demographic
information from the U.S. Census Bureau, hospital and medical personnel data from the Area
Resource File, and information on state Certi�cate of Need (CON) laws regulating health care
providers.36
4.1 Markets
We assume that the United States�Metropolitan Statistical Areas (MSAs) comprise the markets
for ART services.37 Two facts support this assumption. First, during our sample period there
were only 5 clinics (with 21 clinic-year combinations) that operated outside of an MSA. Second,
we believe that ART treatment is expensive and important enough to compel a couple to travel
across a metropolitan area to receive the treatment they think is best, but the repeated clinic visits
required for an ART cycle are likely to restrict a couple from seeking treatment outside of their
home city.
The number of MSAs with at least one clinic grew from 99 to 114 within the sample period.
Most of the entry by new clinics occurred in markets where other clinics were already present. We
have demographic data from 277 U.S. MSAs during 1995-2000, but much of the data are derived
from the 2000 Census.38
35The compliance rate among clinics is high. The CDC released data from 94% of the clinic-year combinations
between 1995 and 2000. The clinics that do not comply are frequently those that have just entered a market or are
about to exit. Unfortunately, clinics are not required to report their price schedules to the CDC.
36CON laws restrict the entry of new medical establishments and capital expenditures by hospitals.
37We also use Consolidated MSAs (CMSAs) boundaries, where applicable, to de�ne a market. For example, we
de�ne the large CMSA that includes New York City to be one market, instead of treating the region as a set of
smaller markets de�ned by the MSA borders within this CMSA. When an MSA is not a part of a larger CMSA, as
in the case of St. Louis, we treat the MSA as the relevant market.
38Population estimates are available every year, but more detailed demographic information (like the number of
women between ages 25 and 44 with a graduate degree) is available only from the decennial census.
15

4.1.1 Demand shifters
The number of clinics in a market and the number of treatment cycles are a¤ected by several
important exogenous demographic characteristics. MSAs with ART clinics tend to be larger,
richer, and more educated. See Table 4.1 for a description of markets with and without ART
clinics in 2000.39 It is not surprising that a large population of potential patients is required to
support clinics with substantial �xed costs of entry. However, it is interesting to note that MSAs
with clinics have larger percentages of women working and with post-secondary degrees. This
supports the notion that clinics may largely serve women who delayed childbearing in favor of
education or employment. We note the percentage of Catholics in the market because this is the
only major religion in the U.S. which counsels its adherents to forego IVF and virtually all other
infertility treatments (U.S. Congress O¢ ce of Technology Assessment [1988]).
4.1.2 Cost shifters
We are concerned that the number of �rms in a market is correlated with unobserved factors that
also a¤ect consumer demand and treatment decisions. Since we use competition as a predictor
of treatment measures in our analysis below, we obtain a set of �ve cost-shifting instruments to
control for the endogeneity of clinic entry decisions. Summary statistics for these variables are
provided on Table 4.1.
In general, ART clinics face high �xed costs for equipment, and they need trained embryologists
and lab personnel. We identify two instruments �the number of hospitals in a market and the
number of beds per hospital �with the �xed costs in mind. Many clinics are associated with hos-
pitals, with which they may share administrative expenses and medical facilities or equipment. We
anticipate that larger, more specialized hospitals are more likely to have equipment or services that
might be shared with an IVF clinic. Our choices of the remaining three instruments are motivated
by labor supply issues. First, we employ a wage index for medical personnel. Second, we construct
an indicator for whether a market contains zero medical researchers. IVF procedures are generally
performed by reproductive endocrinologists, who are research-oriented gynecology specialists. A
market without medical researchers is likely to contain few reproductive endocrinologists who might
start or operate an IVF clinic. Finally, we employ a measure of a state�s Certi�cate of Need (CON)
39The variables on Table 4.1 are not an exhaustive list of all demand-shifting factors that we employ in our empirical
analysis below.
16

laws, which limit the entry of new medical facilities and may also indirectly40 a¤ect the number of
IVF clinics in a market.41 For example, a state with restrictive CON laws is likely to have a small
number of hospitals and medical clinics, and this will decrease the state�s supply of experienced lab
technicians that an IVF clinic may hire. While the CON score and medical wage index statistics
on Table 4.1 have the counterintuitive property that they are higher in markets with ART clinics,
we have found that the correlation between each variable and the number of clinics in a market
has the expected (negative) sign once we condition on a positive number of clinics and control for
other factors.
4.1.3 Insurance
We incorporate insurance mandates into our data by calculating the portion of each MSA�s popu-
lation under an IVF-speci�c regulation. This treatment of insurance coverage accounts for MSA
boundaries that cross state lines. For example, the St. Louis MSA is a mixture of Missouri and
Illinois counties, and these states have di¤erent insurance laws.42 Our coverage measure therefore
accounts for the fact that some of the patients at Washington University�s ART clinic, which is
located in Missouri, live and work in Illinois. An MSA that is entirely within one state is a simpler
case �all of its population is exposed to the same insurance regime. A shortcoming of our data
is that we do not know the decisions of insurance companies to o¤er ART coverage when they are
not legally obligated to do so. However, it is reasonable to assume that privately o¤ered insurance
for ART would be more expensive than other insurance options within the same market, and fewer
potential patients in unregulated states would receive ART under insurance coverage.
We take a preliminary look at the relationship between insurance coverage and demand with
the statistics on Table 4.2. We divide the MSAs with clinics into two groups: one where more than
50% of the population resides in a state with an IVF-speci�c insurance coverage mandate, and the
other group with all other markets. While markets with insurance mandates are typically more
populous and have a greater number of clinics, the average number of clinics per 100,000 women
ages 25-49 is actually lower in markets with insurance mandates. Despite this relationship between
40 IVF clinics are not subject to CON laws.
41The CON score data used in our analysis were compiled by the state of Missouri to weigh the restrictiveness of
di¤erent states�regulatory regimes.
42 Illinois is a state with mandatory insurance coverage of ART procedures. Missouri has no regulation of insurance
coverage and ART.
17

insurance status and entry, we note that the number of cycles per 10,000 women is substantially
larger in markets with insurance mandates.
4.1.4 Competition
To gauge the amount of competition in these markets, we calculate Her�ndahl-Herschman Indices
(HHI) for all cycles across a market�s clinics and for the distribution of cycles within our broad age
categories. The summary statistics on HHI, which increases from 0 to 10,000 as a market moves
from perfect competition to monopoly, indicate that most ART markets are quite concentrated.
The mean HHI of approximately 7,100 requires that one �rm has a market share over 80%. In 295
market-year observations, there is only one clinic present. Among the 347 market-year observations
with at least two clinics, the median HHI is 4,885. A small number of highly populated markets
contain a relatively large number of clinics. During 1995-2000, the MSAs with the �ve largest
populations had an average of 20.8 clinics with mean HHI of 1,238.43
4.2 Clinics and infertility treatment
The treatment data are aggregate statistics that track the progress of cycles initiated at an ART
clinic. The statistics are divided into age brackets that vary from year to year, so we focus on
treatment procedures and results for two broad types of patients: those under age 35 and those
older than 35. With this approach to the data, we observe the number of cycles performed on
women in an age category at a particular clinic, the number of cycles at the clinic that led to
pregnancies, the number of pregnancies that lead to a birth,44 and other related information.
Continuing with the same division of markets by insurance coverage, we summarize treatment
choices in Table 4.2. IVF is used more frequently in markets with a large proportion of insured
patients, but ICSI is more prevalent in markets without insurance mandates.45 A distinct pattern in
Table 4.2 is that clinics in markets with an insurance mandate transfer fewer embryos, which reduces
the risk of multiple pregnancies and birth, ceteris paribus. This is the pattern discussed in Jain et
43The �ve markets are New York City, Los Angeles, Chicago, Washington D.C-Baltimore, and San Francisco. All
are CMSAs.
44A cycle is said to lead to a live birth if one or more infants are born at the end of a cycles. Singleton and multiple
births are grouped together in the reporting of live births.
45The IVF and ICSI data are fairly coarse. We observe only the overall rate of IVF and ICSI usage within a clinic;
we do not know how they vary with patients�characteristics.
18

al. An important selection consideration is whether an insurance mandate draws predominantly
high- or low-fertility couples into ART clinics. High-fertility couples require fewer embryos to
obtain a target probability of a live birth, which could explain the result on embryos transfers on
Table 4.2. However, the data show that live birthrates are lower in markets with insurance coverage.
We address these issues with more precision in Section 6.3. Finally, the rate of twin gestations is
similar across insurance regimes, while triplet pregnancies are more common in markets without
an insurance mandate.
5 The Market-Level E¤ects of Insurance and Competition
In Sections 1 and 3 we conjectured that certain demographic and policy variables a¤ect the existence
and behavior of ART clinics. These predictions may be divided into two broad areas, market-level
and clinic-level e¤ects. We begin our empirical analysis by considering two important issues at
the market level. First, we evaluate whether a change to insurance regulations a¤ects the number
of ART clinics in a market. This is also an opportunity to learn which demographic features of a
market attract additional clinics. Second, we examine how an insurance mandate and competition
a¤ect the total number of cycles in a market.
5.1 What determines the number of clinics in a market?
Entry of new IVF clinics and subsequent price competition clearly bene�ts potential patients by
expanding access to treatment. A market may attract clinics because of characteristics such as high
incomes or a large population of likely patients. Additionally, the increase in demand for ART that
is likely to follow an insurance mandate may lead to the establishment of new clinics. If insurance
mandates stimulate clinic entry, this would provide an additional indirect bene�t of insurance to
ART patients. Competition among clinics would reduce treatment expenses for patients whose
insurance coverage is exhausted and are required to pay for ART out-of-pocket.
We use an ordered probit model to estimate the e¤ects of various market characteristics and
insurance policy on the number of clinics. In this empirical model, the latent continuous dependent
variable is the total pro�t (�it) that might be divided among the clinics in market i during year t.
The market�s observable characteristics are in X1it and include insurance mandates and the demand
and cost shifters described above. We model total pro�t as �it = X1it� + "it, with "it distributed
N(0; 1); iid across markets (i), but clustered within i across t. Clinics enter the market until their
19

individual pro�t (i.e., their share of �it) is smaller than their �xed cost of entry. Although we do
not observe �, we are able to estimate � with the number of clinics in each market during each year.
In estimating the model, we use the observed number (n) of clinics in the market if n � 10; observed
market-year pairs with n > 10 are grouped together.46 We note that this empirical speci�cation
does not account for the suspected product di¤erentiation in the ART market.47 However, we
believe that employing a simple empirical model here is still useful in identifying which market and
policy characteristics are important in attracting new ART clinics into a market.48
The results from our entry model are presented in the �rst column of Table 5.1. In the previous
section we described data that indicate that markets with insurance mandates have larger ART
clinics without necessarily having more clinics. This pattern in the data is con�rmed in the ordered
probit estimates, which show no signi�cant e¤ect of insurance on the number of clinics.49 Several
parameter estimates from the model con�rm our suggestion in Section 1 that fertility treatment
is related to human capital investment. There is a strong positive relationships between the
percentage of women with a professional degree and the number of clinics. It is not surprising
that the number of clinics in a market is positively and signi�cantly related to the market�s median
income, but our �nding of a negative relationship between the upper quartile house value and n was
not expected. Given that ART is usually a fairly expensive patient-pay procedure, we anticipated
that this measure of wealth would be positively correlated with the number of clinics because it
describes a more relevant part of the income/wealth distribution. The proportion of a market�s
population that is Catholic has no signi�cant e¤ect on the number of clinics.
To verify that we have selected an appropriate set of cost-shifting instruments to control for
the endogeneity of competition, we also report the e¤ects of these variables within the ordered
probit model. With the exception of the medical wage index, the instruments�coe¢ cients have the
expected signs. Three instruments (the number of hospitals, the number of beds per hospital, and
46There are 34 market-year observations (2% of the relevant data) that are censored in this way.
47Ordered probit methods are theoretically sound in homogeneous-product markets when competitors have sym-
metric pro�ts (e.g., Bresnahan and Reiss [1991]), but markets with observably heterogeneous �rms typically bene�t
from analysis with more advanced econometric techniques (e.g., Mazzeo [2003], Seim [2002]).
48We are not as con�dent in interpreting the relative importance of the explanatory variables and their coe¢ cients.
Our use of an ordered probit model for di¤erentiated clinics, if taken literally, requires strong assumptions on the
homogeneity of the strategies played across markets as demographics change.
49A similar result is uncovered by Abraham, Gaynor, and Vogt [2003] in their study of factors that a¤ect hospital
entry. The authors �nd that the presence of an HMO reduces entry in a market.
20

whether the market contains any medical researchers) have a statistically signi�cant e¤ect on the
number of ART clinics. We interpret these results as indicating that the instruments can jointly
have a substantial e¤ect on the number of clinics in a market.
At this stage in the di¤usion of ART, we believe that the reported correlations between education
and the number of clinics are due to clinics entering markets in which they are most likely to �nd
willing customers. That is, we do not believe that the presence of ART clinics is su¢ cient (yet) to
compel women in certain markets to delay childbearing in order to build their human capital and
careers. Despite the growing prevalence of ART, the education and initial fertility decisions of the
women who are today�s most likely patients were made a decade ago.
5.2 How do insurance and competition a¤ect ART utilization?
A primary objective of insurance mandate legislation is to improve couples�access to and usage
of ART. In Section 3 we argued that insurance coverage and competition can both increase the
number of couples who receive fertility treatment. Despite the insigni�cant e¤ect of insurance on
entry (reported above), our data suggest that couples with mandated insurance coverage may still
receive ART treatment at a relatively high rate. Indeed, a policy-maker who is primarily concerned
about access to ART may not have a strong preference among possible market structures, so long
as the number of patients receiving treatment increases signi�cantly.
We evaluate whether an insurance coverage mandate improves access to ART services, and
whether an increase in competition may achieve the same result. We begin by examining market-
level data on the percentages of women under- and over-35 years old who initiate an ART cycle.
A key concern in the analysis is that unobserved factors in�uencing the entry of one or more clinics
into a market may be correlated with unobservable factors, such as consumer tastes, that in�uence
the utilization of ART in the market. Moreover, markets with multiple ART clinics may also di¤er
from monopoly ART markets in ways that are correlated with the demand for IVF treatment cycles
in each of these types of markets. Consequently, to examine the roles of insurance and market
competition on utilization of ART in a market, we estimate selection-corrected regressions of the
form
yint = X2it�n + 'n�int + �int;
where yint indicates the (log) cycles per 10,000 women of age 25-34 or 35-45 in market i in year t
which has n clinics.50 The impact of the market level characteristics X2it on utilization of ART in
50We adjust the age of women (25-34, 35-45, or 25-45) included in the denominator (�per 10,000 women�) of the
21

market i in year t is allowed to vary by the number of clinics in the market. To account for selection
bias, we use the ordered probit estimates shown in the �rst column of Table 5.1 to construct the
inverse Mills ratio terms, �int:51 The sign and signi�cance of 'n provides an indication of the
nature of selection of clinics into the market. While we could estimate separate regressions for
each value of n, we choose to distinguish markets with a monopoly clinic (n = 1) from those with
multiple clinics (n > 1).52
The results from our selection-corrected regressions for the (log) number of cycles reported
in columns (2) and (4) of Table 5.1 indicate that insurance mandates increase the utilization of
IVF by women under 35, regardless of the number of clinics serving the market. Comparison of
columns (2) - (3) and (4) - (5) shows that, as we predict in our model of the ART market, the
impact of insurance on the growth in cycles is smaller for older (over 35) women. Older couples in
insurance mandate states may be less sensitive to insurance status when they are over 35 because
they already received ART when they were younger.53 The results in the table also show that
the e¤ect of insurance on the number of cycles is slightly reduced by the presence of more than
one clinic in the market, but the coe¢ cient estimates are not signi�cantly di¤erent. Surprisingly,
while higher income markets tend to have more clinics, there does not appear to be a signi�cant
relationship between income and number of cycles. Finally, the bottom row of the table suggests
that unobserved characteristics that lead to greater entry into a market are positively correlated
with unmeasured factors a¤ecting the utilization of IVF services by women both under and over
35 in markets with two or more clinics. Consequently, simple comparison of the number of cycles
across markets will yield biased estimates of the impact of adding one or more clinics to a market.
To examine the impact of the number of clinics in a market on the utilization of IVF services, we
dependent variable to match the numerator.
51The inverse mills ratio �int with an ordered probit selection equation takes the form�(cn�X1it�)��(cn+1�X1it�)
�(cn+1�X1it�)��(cn�X1it�),
where �(:) and �(:) are the standard normal density and distribution functions, respectively, and the fcng are the
cut points from the ordered probit.
52Our speci�cation is similar to the structural ordered-probit/market quantity model described in Abraham,
Gaynor, and Vogt (2003). However, we estimate a reduced form equation for the number of clinics in the mar-
ket, since we do not focus on obtaining structural cost parameters but rather investigate the impact of the number
of clinics on market size.
53The number of unique couples entering fertility treatment is lower, since this count of cycles does not identify
when a single couple attempts multiple cycles during a year. This problem is likely to be exacerbated in when less
fertile couples are drawn to treatment, as these patients are more likely to start an ART cycles that does not yield a
birth.
22

use the coe¢ cient estimates from Table 5.1 to construct the percentage di¤erence in the number of
cycles for a market with a speci�ed set of characteristics of having one versus more than one clinic
present. The predictions in Table 5.2 address the question: What would be the impact on IVF
utilization if a market went from having a monopoly clinic to two or more clinics? As suggested
by our intuition in Section 3, the �rst row of the table indicates that a randomly selected market
(a market with average characteristics) would show a 55% increase in the number of cycles among
women under 35 if additional clinics entered a monopoly market, with a slightly smaller increase for
the 35 and over population.54 The second and third rows of the table indicate that clinic entry has
a larger impact in markets without insurance, but the e¤ect is still positive even in those markets
covered by an insurance mandate. This re�ects in part the fact that insurance mandates generally
cover only the �rst cycle initiated by the couple, whereas the e¤ect of competition through price
reduction applies to all cycles initiated by a couple.
Overall, the results in Tables 5.1 and 5.2 suggest that while insurance mandates do not appear to
have a signi�cant impact on the entry of clinics into a market, they do lead to increased utilization
of IVF services by women under 35. Adding one or more clinics to a monopoly market has a
similar e¤ect to that of insurance on ART demand by women under 35. The e¤ect of competition
on cycles for women over 35 is greater than the e¤ect of insurance, perhaps because fewer women
in this age group are covered by the mandate due to prior IVF cycles.
6 Clinic-Level E¤ects of Insurance and Competition
Given the �nding that insurance and competition both in�uence the number of treatment cycles in
the market, we now consider the impact of these factors on clinic treatment decisions and outcomes.
In all of the analyses of this section, we employ variations55 on a single regression model:
yaijt = �1aINSit + �2aCOMPait + �3aZaijt + eaijt: (1)
54The predicted percentage di¤erentials reported in Table 5.2 are constructed using the formulaexp(X2�2+ + 0:5�s22+)exp(X2�1 + 0:5�s21)
� 1, where s2n is the untruncated residual variance for the n clinic quantity equation.
55 In most situations below, y is a continuous, unbounded variable. However, in some cases the speci�cation or
characteristics of y require probit or tobit estimation methods.
23

For patients of age category a in market i at clinic j during year t, we regress treatment prac-
tices or outcomes (as yaijt) on a measure of i�s insurance mandate status (INSit),56 a measure
of the competitiveness of the market (COMPait), and a vector (Zaijt) of demand-shifting demo-
graphic features of the market and the clinic�s characteristics.57 COMP is simply constructed as
(�HHI=1; 000); with the Her�ndahl Index calculated within age groups where appropriate.58 The
error term eaijt accounts for unobserved clinic and market features.
As above, we suspect that our measure of competition may be correlated with e; so we report
(at least) two sets of estimates for each regression model that we analyze. First, we estimate (1)
under the assumption that COMP is exogenous, as in OLS. Next, we estimate (1) while treating
COMP as an endogenous variable. We correct for endogeneity by constructing a �rst-stage tobit
model (truncated at HHI = 10; 000) that estimates the relationship between COMP and Z, INS,
and the cost-shifting instruments identi�ed above. The predicted values of COMP from the tobit
model are then used in the estimation of (1). In the discussion below, we refer to the set of
estimates obtained under the assumption of exogenous COMP as OLS (or tobit or probit where
appropriate) and the estimates that treat COMP as an endogenous variable are identi�ed as IV
results.
6.1 Do clinics grow with insurance and competition?
We demonstrated above that insurance and competition increase the overall IVF utilization in a
market. We also investigate how these e¤ects are distributed across individual clinics, and we
report our results in Table 6.1. After accounting for competition and other market-level controls,
the point estimates indicate that the number of patients in both age groups grows with insurance
coverage, but only the estimate for the under-35s is statistically signi�cant using conventional
56INSit is a continuous variable in [0; 1]. Its value is determined by the percentage of a market�s population living
in a state with an insurance coverage mandate.
57Demographic features of i in Z include the population of women in age category a, median income, measures of
labor force participation and education for women in a, and year dummies. At the clinic level, we include a dummy
variables for whether the clinic is associated with the Society for Assisted Reproductive Technology and whether the
clinic accepts single women as patients.
58We have also estimated this model with COMP speci�ed as a vector of dummy endogenous variables. In that
speci�cation, an entry of COMP provides the probability that a market�s HHI falls within a discrete range. While
several results from that model are similar to those reported below, we encountered di¢ culties due to the small
number of observations that correspond to some entries of COMP .
24

standards. There is not a strong e¤ect of competition on cycles per clinic after we account for
the potential endogeneity of COMP using the instruments described in Table 4.1. The general
e¤ect (across ages) of a decrease in market concentration is neither large nor signi�cantly di¤erent
from zero.59 We interpret this �nding as a positive result from a welfare perspective, because it
indicates that the expanded number of cycles in a market under competition described in Table
5.2 may not be associated with severe market share cannibalization and redundant expenditures
on �xed costs.
6.2 What a¤ects ART treatment procedures?
Recent temporal improvements in ART success rates have generally been credited to advances in
technology and expertise in fertility treatment. With the model presented in Section 3, we argued
that insurance coverage may actually reduce a clinic�s incentive to adopt more advanced technology,
while the e¤ect of competition is to vertically di¤erentiate clinics in their technology choices. We
also noted that two important factors a¤ect the number of embryos transferred. First, we must
consider the characteristics and optimal choices of new patients who enter the market because of
lower treatment prices due to insurance and competition. Second, we note that an individual�s
dynamic treatment strategy with regard to embryo choice may be a¤ected by the intertemporal
income e¤ects of insurance coverage and competitive prices.
We now ask whether these relationships among market characteristics and treatment procedures
exist in the data. We focus on the use of ICSI and the number of embryos transferred during an
IVF procedure.60 Recall from Section 2 that ICSI improves the chance that a retrieved egg is
successfully fertilized, and that a reduction in transferred embryos lowers the risk of a multiple
59 In regressions not reported here, we estimate the e¤ect of insurance and competition on the percentage of a
clinic�s cycles initiated by a patient under 35. Our results, which show that the share of under-35s increases due to
insurance and the share of over-35s increases due to competition, are only marginally signi�cant.
60There is an additional decision doctors and patients must make that we do not consider in this paper. At various
points during an IVF cycle they must decide whether to continue treatment. For example, a doctor and patient may
consider whether the number and quality of embryos is su¢ cient to warrant transferring them to the patient. In
regressions not reported in this paper, we have found that cycles are cancelled less frequently with the introduction
of an insurance mandate and also with an increase in competition. There are many possible explanations for these
results. For example, these �ndings could be attributed to: di¤erences in the amount of money saved by ending
treatment, intertemporal income e¤ects that a¤ect the probability of re-starting treatment in the future, or one
clinic�s concern that it will lose a patient to a competitor.
25

pregnancy and birth. A concern about highly competitive ART markets is that clinics transfer
�too many�embryos in order to increase their birthrates, although this also increases the chance
of a multiple pregnancy.
ICSI usage rates are available at only the clinic level (rather than by age), so for each clinic-year
combination we regress ICSI usage on clinic, market, and patient characteristics.61 The results
of these regressions are reported in Table 6.2. We �nd that both insurance and competition lead
to a reduction in the frequency of ICSI. These results support the model and incentives discussed
above.62 The competition result implies that as new patients and clinics enter an ART market,
their choices are more heavily weighted toward lower-technology procedures. This may occur
because the new patients are more price-sensitive, or because they have relatively favorable fertility
characteristics and do not require the most advanced treatment.63
In interpreting the e¤ect of insurance on ICSI, we note an additional fact that complicates
matters: some insurance mandates do not require coverage for ICSI treatment, and the couples
attracted into the ART market because of insurance coverage may be too price-sensitive to pay for
ICSI. To investigate this possible explanation for our results, we re-estimate the model including
interactions between insurance and the upper quartile house value (as a measure of wealth).64 If
mandates are attracting patients into the IVF market with less ability to pay for ICSI, then the
impact of insurance on ICSI utilization should be greater in higher wealth markets. The negative
estimates of the interaction e¤ect shown in Table 6.2 do not support this hypothesis. The estimates
indicate that insurance reduces ICSI use more in high-wealth rather than low-wealth markets.
In Section 3 we did not distinguish between a situation in which insurance discourages a clinic
from investing in ICSI technology from one in which ICSI is available at a clinic but insurance
61 In the regressions presented in this section (and subsequent sections where appropriate), the observations are
weighted by the number of cycles at the clinic to account for the fact that the dependent variable is a percentage
rate.
62As we mention above, we are unable to test our assumption of pro�t maximization, which yielded our intuition
on the negative e¤ect of insurance on technology. It may be argued that insurance�s e¤ect on the ICSI rate simply
re�ects patients demanding more conservative treatment.
63Our results in Section 6.3 suggest that competition does not signi�cantly a¤ect the distribution of innate fertility
among treated couples.
64We have also estimated the models using median income rather than house value. The median income results
were not as precise as those reported here, and this income variable probably does not capture the appropriate part
of the income or wealth distribution in a market. The high price of IVF is likely to imply that most patients are
substantially above their local median income.
26

reduces the willingness of the doctor or patient to use it. To determine whether clinics in non-
mandate markets are more likely to invest in ICSI technology, we estimate probit models of whether
the clinic in question o¤ers ICSI to its patients.65 The estimates in the lower half of Table 6.2
show that insurance mandates have no e¤ect on the decision of a clinic to o¤er ICSI services.
Consequently, insurance appears to reduce ICSI use even though it is likely to be available to the
doctor and patient at a given clinic. This result, plus our �nding on the e¤ect of house value
on ICSI, suggests that the most likely reason why ICSI is less prevalent in insurance markets is
because doctors counsel patients against the procedure. Similarly, the availability of ICSI is not
signi�cantly a¤ected by competition.
Our next step is to examine how insurance and competition a¤ect decisions on the number of
embryos to transfer to the patient during an IVF cycle. Recall that some argue that IVF clinics
have incentives to transfer too many embryos in order to boost birthrates at the expense of multiple
births, the cost of which is not incurred by the IVF clinic nor completely by the patient. Both the
OLS and IV estimates in Table 6.3 show that the presence of an insurance mandate signi�cantly
reduces the number of embryos transferred for women under and over 35. These �ndings are
consistent with the view that insurance mandates reduce moral hazard in embryo transfers since
the patient may be more willing to accept an unsuccessful ART cycle when she does not pay a large
portion of the cycle expense out-of-pocket. An alternative explanation of these results is that they
are driven by patients who would not have received treatment at all if not for an insurance mandate.
Insurance might attract a large group of relatively high-fertility couples into the market, and these
couples need to transfer fewer embryos in order to attain a target birthrate. However, our results
on birthrates described below make it unlikely that high fertility couples are disproportionately
induced to attempt IVF in mandate markets. In fact, if less fertile couples (who need more
embryos to achieve a desired birthrate) are disproportionately encouraged to enter the market,
insurance mandates appear to be very e¤ective in encouraging clinics and patients to take fewer
embryos. With clinic-level data, we cannot discern the extent to which this �nding re�ects patient
choices resulting from the income e¤ect of insurance, or whether doctors more vigorously counsel
patients about the risks of multiple births (as they might also counsel against ICSI to e¤ectively
reduce k), or both.
The IV estimates of the e¤ect of competition on embryos transferred suggest that patients in
65A clinic is de�ned as o¤ering ICSI if it is used in more than 10% of IVF cycles initiated at a clinic in a given
year.
27

clinics located in more concentrated markets are likely to receive more embryos. This is evidence
against the assertion made recently by medical researchers (e.g., Berg et al [1999]; Wells[1999]) that
competition will lead to greater embryo transfers and a higher risk of multiple births because of
pressure to report high success rates. One explanation for this �nding suggested by the model in
Section 3 is that if IVF prices are higher in concentrated markets, couples will choose to transfer
more embryos in an e¤ort to increase the likelihood of birth and avoid incurring the cost of an
additional IVF cycle.
6.3 Birthrates, multiple birth risk, and patient selection
The introduction of an insurance mandate or a reduction in clinic concentration increases the
number of couples in a market who receive fertility treatment. Are these couples more or less fertile
than those who use ART in a relatively concentrated market or one without insurance coverage?
The position that infertility is a serious and widely untreated medical condition suggests that a
policy goal should be to improve the conception chances of couples with poor fertility characteristics.
Thus, a policy that results in new ART treatment by (relatively) high-fertility couples would not
achieve the apparent objective of insurance mandate proponents. However, such an outcome
would certainly bene�t the couples who take treatment, and may be defended from a social welfare
perspective.
We evaluate indirectly the ability of insurance mandates and competition to attract new, low-
fertility ART patients. We estimate a model of birth outcomes and check whether success prob-
abilities decline with competition or an insurance mandate. After controlling for the number of
embryos transferred and the use of ICSI, unobserved patient fertility is likely to have an important
e¤ect on outcomes. If we observe that birth probabilities fall, we infer that the fertility characteris-
tics of the couples receiving treatment must be less favorable than those treated in markets without
insurance coverage or competition among ART clinics. We estimate OLS and IV regression models
on two types of outcomes: birthrates and multiple births. We also report corresponding estimates
for speci�cations in which number of embryos transferred and the use of ICSI are excluded in order
to provide an indication of the full impact of insurance and competition on success rates, since the
�ndings in Tables 6.2 and 6.3 suggest that insurance and competition in�uence treatment decisions.
The results from models of birth probabilities shown in Table 6.4 indicate that the percentages
of women under 35 and over 35 who give birth after IVF treatment are lower in markets covered
by an insurance mandate. Given our controls for clinic technology and embryo choice, this seems
28

to indicate lower innate fertility of ART clients in these markets. Excluding these treatment
choice variables magni�es the impact of insurance for women over 35. One might argue that the
negative relationship between insurance and birthrate re�ects provision of lower-quality services by
IVF clinics in these markets rather than the introduction of less fertile women. Note, however,
that these �ndings hold even when a measure of clinic quality, the use of ICSI, is included in the
regression.66 While we cannot rule out explanations highlighting decreased quality provision in
clinics, the �ndings in Table 6.4 are consistent the view that insurance mandates expand the IVF
market include more couples with lower fertility.
In contrast to the e¤ect of insurance, competition has no signi�cant impact on birthrates af-
ter we account for the potential endogeneity of market structure. This may indicate that the
types of couples who are attracted to ART with the addition of new clinics have similar fertility
characteristics to those couples who seek treatment in a more concentrated market.
Using the available data on multiple birth rates at IVF clinics between 1996 and 2000, we next
turn to the question of whether insurance and competition reduce the incidence of these costly
events. These results are presented on Table 6.5. For women under 35, mandates appear to
mitigate the moral hazard problem associated with IVF, since patients of clinics located in these
markets have a signi�cantly lower incidence of multiple births. The negative but insigni�cant
estimates shown for women over 35 may re�ect the fact that these patients have reduced fertility
and are at less risk of a twin-or-more birth.
With regard to the impact of competition, there is little evidence to support the concern that a
clinic operating in a more competitive market will generate multiple births more frequently. When
we omit the controls for the number of embryos and the use of ICSI, we �nd that the overall
e¤ect of competition is a weakly signi�cant reduction in the frequency of multiple births for women
in both age groups. These results are consistent with the argument that by driving up prices,
monopoly clinics may cause couples to become more aggressive in their treatment choices in an
attempt to get pregnant. However, our preferred interpretation is tempered by the complexity of
ART markets. While competitive pricing may a¤ect multiple birth rates, we also acknowledge that
patient selection and clinic technology choices together may yield a lower per-patient risk of twins
or more. Finally, it is important to note that a reduction in multiple birth risk does not necessarily
66 If insurance mandates lead clinics to substantially reduce their (unobserved) quality, then one would expect an
increase in the percentage of cycles cancelled before embryo transfer. We have investigated this question, and we �nd
that cycle cancellations decrease with insurance. This is evidence against a reduction in unobserved clinic quality.
29

mean few multiple births when there is su¢ cient growth in the number of patients treated.
7 Discussion and Conclusions
Several million American couples are medically infertile, but many could become pregnant with the
assistance of an advanced fertility treatment such as IVF. Although IVF has been fairly recently
introduced, its use is spreading rapidly. The percentage of all births in the U.S. due to IVF
procedures using fresh, non-donor eggs has grown from 0.3% in 1995 to 0.7% in 2000. For women
over age 35, the share of IVF births has increased from 0.9% to 1.6% during the same period. We
expect the use of IVF to continue to grow, as more women account for this possibility while making
related life cycle choices regarding education, career, and marriage. Perhaps the most important
factor to the continuing growth of IVF is a likely decline in the full price of the procedure. The
current expected expense of receiving IVF until a woman bears a child is $40,000, if we assume a
price of $12,000 and a 30% success probability. If technological improvements and a more fertile
selection of IVF patients67 increased the birthrate to 50%, and reductions in market concentration
reduced the price of the procedure to $8,000, the expected expense of IVF would fall considerably
to $16,000. A price decrease of this magnitude could substantially increase both the use of ART
and its share of births in the U.S.
The most important economic issues in contemporary ART markets are: 1) access to treatment
and 2) choices made during treatment, especially regarding embryos and technology. To address
these issues, there are two leading policy prescriptions. The �rst is the mandatory provision of
insurance for IVF, which has been predicted to bring new patients into the market and reduce
the incentive to transfer a dangerously high number of embryos during treatment. The second
prescription is to restrict competition so that clinics do not attempt to win new patients by in�ating
birthrates using treatments that also raise the risk of multiple births. With the present paper, we
empirically test each of these conjectures about policy and ART market activity, plus we identify
a number of additional potential e¤ects that are new to the literature on infertility treatment.
Regarding insurance, we argue that clinics may reduce their use of technology because of the low
return from treating insured patients. For competition, we point out that low prices can increase
access to IVF while also reducing patients�incentives to pursue an aggressive treatment strategy
67We anticipate that as IVF becomes more widely known and available, the procedure will be used more frequently
by couples who have better innate fertility characteristics but have elected to delay childbearing.
30

with respect to the number of embryos transferred.
Our empirical analysis con�rms the existing intuition and evidence that insurance increases
access to IVF while decreasing the number of embryos that patients transfer during treatment.
However, we also establish that competition has the same e¤ect on access and embryos. The results
on embryo transfer rates under insurance, considered jointly with our inference that a less fertile
selection of patients enters the market, suggests that the estimated decline in embryos transferred is
due to the intertemporal income e¤ect of insurance.68 While we also �nd a reduction in the number
of embryos with an increase in competition, it is di¢ cult to compare the magnitude of this e¤ect
to that of insurance because of our measure of market concentration. Our �ndings on the reduced
use of ICSI technology in insurance markets was not anticipated in the prior literature on infertility
treatment. This pattern may be explained by incentives felt by clinics to reduce treatment quality,
or it could simply re�ect the preferences of patients to take more conservative treatment when they
know that the current cycle is less costly (due to insurance) and future treatment is feasible. While
we cannot rule out this explanation, our model suggests that the less-fertile couples who enter the
ART market due to insurance should instead bemore willing to use high-technology treatment. Our
results on birthrates suggest that the couples who enter the market due to an insurance mandate
have relatively low innate fertility, while we infer no signi�cant e¤ect of competition on the fertility
characteristics of new patients. Finally, we report that insurance reduces the multiple birthrate for
under-35 women, while competition has a favorable e¤ect on rates for women of both age groups.
This rebuts the argument that competition in ART markets leads to a costly �birthrate race�
among clinics.
Although our results indicate that both insurance and competition reduce the multiple birth
risk for women who undergo IVF, it is important to note that this does not mean that fewer twins
and triplets will be born. In fact, our results imply that the opposite is likely to occur because
of the substantial growth in the number of ART cycles following an insurance mandate or an
increase in competition. Consider the case of under-35 women in a monopoly market. We predict
that adding an insurance mandate to the market would result in a 32% increase in the number
of IVF births for these women and a 22% increase in multiple births.69 Whether the increase in
68Our model suggests that, absent intertemporal e¤ects, less fertile women should transfer more embryos.
69These calculations begin with our estimate of a 45% increase in cycles for under-35 women following the introduc-
tion of insurance to a monopolized market. Insurance leads to a slight decline in the birthrate (from 31.1% to 28.2%)
and multiple birth risk (from 41.4% to 38.7%). The key point is that the substantial expansion of women receiving
31

multiple births observed in these markets will lead to substantially higher healthcare costs depends
on the types of patients induced to attempt IVF. If new IVF patients are drawn entirely from
the population of women who are taking no alternative infertility treatment, the number of twins
and triplets in the population would increase due to the e¤ects that we identi�ed above and the
substantial di¤erence between the natural rate of multiple births and that under ART. However,
if new infertility patients take IVF instead of continuing with ovulation drugs, there is again an
ambiguous e¤ect of expanding ART on the number of multiple births. Ovulation drugs tend to
have higher variation in their outcomes, and may have a higher risk of twins than IVF.
There are several areas for future research to complement the present paper. First, we would
like to analyze the treatment choices of individual women who use ART. This would allow us to
describe how treatment decisions change after IVF fails or insurance coverage expires, and could
provide a more accurate description of the incentives and objectives of clinics. Second, we could
further expand our analysis of competition among clinics with data on prices, advertising, and
clinic-speci�c characteristics. Our goals with these data could include a cost-bene�t analysis of
expanding insurance mandates versus allowing (or even subsidizing) additional competition among
clinics. Third, we would like to learn more about how patients substitute between IVF and less
technologically-advanced treatments like ovulations drugs. With additional data on this topic, we
could evaluate the full e¤ects of providing insurance coverage for one treatment but not the other
(as is currently the case). Additionally, we might predict whether IVF will replace drug therapy
in a way similar to IVF�s dominance of alternative ART procedures like GIFT and ZIFT.
IVF treatment in an insured market far outweighs the slight reduction in birth probabilities, yielding a large increase
in multiple births. Repeating this calculation for competition is not as feasible because of our continuous measure
of market concentration. However, we note that a change to market concentration leads to a similarly substantial
increase in access with a smaller decrease in twin risk.
32

References
[1] Abma, J; A Chandra; W Mosher; L Peterson; L Piccinino (1997): �Fertility, Family Planning,
and Women�s Health: New Data from the 1995 National Survey of Family Growth,�National
Center for Health Statistics, Vital Health Statistics 23 (19), 1997.
[2] Abraham, Jean; Martin Gaynor; William B. Vogt (2003): �Entry and Competition in Local
Hospital Markets,�Carnegie-Mellon University working paper.
[3] Bergh, T; A Ericson; T Hillensjo; K-G Nygren, and U-B Wennerholm (1999): �Deliveries and
Children Born after In Vitro Fertilization in Sweden 1982-95: a Retrospective Cohort Study,�
Lancet 354, 1579-85.
[4] Bitler, Marianne (2002): �E¤ects of Increased Access to Infertility Treatment on Infant Health
Outcomes: Evidence from Twin Births,�RAND working paper.
[5] Bresnahan, Timothy and Peter Reiss (1991): �Entry and Competition in Concentrated Mar-
kets,�Journal of Political Economy 99 (5), 977-1009.
[6] Dranove, David; Shanley, Mark; and Carol Simon (1992): �Is Hospital Competition Waste-
ful?,�Rand Journal of Economics, 247-262.
[7] Dranove, David and William D. White (1994): �Recent Theory and Evidence on Competition
in Hospital Markets,�Journal of Economics and Management Strategy 3(1), 169-209.
[8] Gaynor, Martin and James Rebitzer (2003): �Incentives in HMOs,� Case Western Reserve
University working paper.
[9] Goldfarb, James; Cynthia Austin; Hanna Lisbona; Barry Peskin; and Marge Clapp (1996):
�Cost-E¤ectiveness of In Vitro Fertilization�Obstetrics and Gynecology 87 (1), 18-21.
[10] Goldin, Claudia and Lawrence Katz (2002): �The Power of the Pill: Oral Contraceptives and
Women�s Career and Marriage Decisions,�Journal of Political Economy 110 (4), 730-770.
[11] Gowrisankaran, Gautam and Robert Towne (2003): �Competition, Payers, and Hospital Qual-
ity,�forthcoming in Health Services Research.
[12] Gruber, Jonathan (1994): �State Mandated Bene�ts and Employer Provided Insurance,�
Journal of Public Economics 55(3), 433-464.
33

[13] Barton H. Hamilton and Brian McManus (2003): �A Model of an Assisted Reproductive
Technology (ART) Market,�Washington University Olin School of Business working paper.
[14] Hansen, Michele; Jennifer Kurinczuk; Carol Bower; Sandar Webb (2002): �The Risk of Major
Birth Defects after Intracytoplasmic Sperm Injection and In Vitro Fertilization,�New England
Journal of Medicine 346 (10), 725-730.
[15] Jain, Tarun; Bernard Harlow; and Mark Hernstein (2002): �Insurance Coverage and Outcomes
of In Vitro Fertilization,�New England Journal of Medicine 347 (9), 661-666.
[16] Mathews, TJ and BE Hamilton (2002): �Mean age of mother, 1970-2000,� National Vital
Statistics Reports 51 (1).
[17] Mazzeo, Michael (2003): �Product Choice and Oligopoly Market Structure,�RAND Journal
of Economics 33 (2), 221-242.
[18] Menken, Jane; James Trussell; Ulla Larsen (1986): �Age and Infertility,�Science 233 (4771),
1389-1394.
[19] Reynolds, Meredith; Laura Schieve; Joyce Martin; Gary Jeng; Maurizio Macaluso (2003):
�Trends in Multiple Births Conceived Using Assisted Reproductive Technology, United States,
1997-2000,�Pediatrics 111 (5), 115-1162.
[20] Schieve, Laura; Herbert Peterson; Susan Meilke; Gary Jeng; Isabella Danel; Nancy Burnett;
Lynne Wilcox (1999) �Live-Birth Rates and Multiple-Birth Risk Using In Vitro Fertilization,�
Journal of the American Medical Association 282 (19), 1832-1838.
[21] Schmittlein, David and Donald Morrison (1999): �A Live Baby or Your Money Back: the
Marketing of In Vitro Fertilization Procedures,�University of Pennsylvania, Wharton School
of Business working paper.
[22] Seim, Katja (2002): �An Empirical Model of Firm Entry with Endogenous Product-Type
Choices,�Stanford GSB Working Paper.
[23] Stephen, Elizabeth Hervey and Anjani Chandra (2000): �Use of Infertility Services in the
United States: 1995,�Family Planning Perspectives 32 (3), 132-137.
[24] U.S. Congress, O¢ ce of Technology Assessment (1988): Infertility: Medical and Social Choices,
OTA-BA-358, Washington, D.C.: U.S. Government Printing O¢ ce.
34

[25] Wells, Matt (1999): �Doctors Warn on Test-Tube Births,�The Guardian, November 5 1999.
35
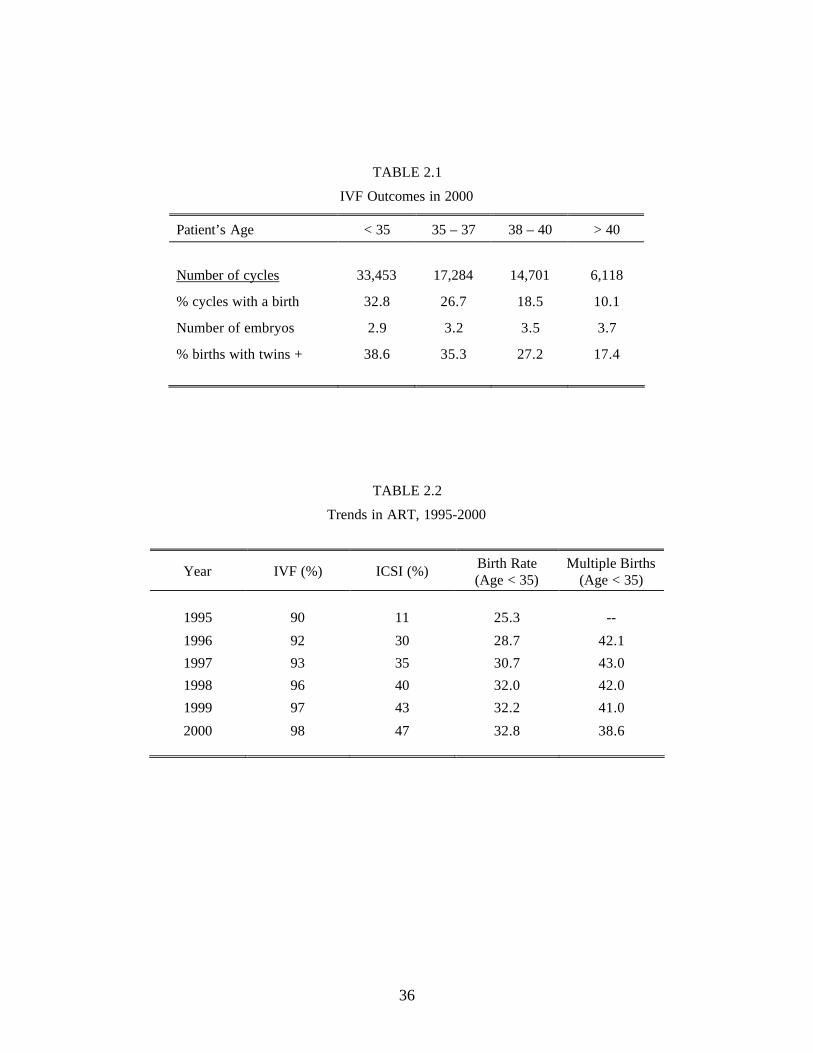
36
TABLE 2.1
IVF Outcomes in 2000
Patient’s Age < 35 35 – 37 38 – 40 > 40
Number of cycles 33,453 17,284 14,701 6,118
% cycles with a birth 32.8 26.7 18.5 10.1
Number of embryos 2.9 3.2 3.5 3.7
% births with twins + 38.6 35.3 27.2 17.4
TABLE 2.2
Trends in ART, 1995-2000
Year IVF (%) ICSI (%) Birth Rate (Age < 35)
Multiple Births (Age < 35)
1995 90 11 25.3 --
1996 92 30 28.7 42.1
1997 93 35 30.7 43.0
1998 96 40 32.0 42.0
1999 97 43 32.2 41.0
2000 98 47 32.8 38.6

37
TABLE 2.3 Characteristics of States with and without IVF-ART Insurance Mandates 1
States with IVF Mandates
States without IVF Mandates
Number of ART clinics in 2000 178 230
State characteristics from the 1990 decennial census
Total population 65 million 208 million
Percentages of women:
Age 25+ with high school degree 74.07 (5.13)
76.62 (5.82)
Age 25+ with bachelor’s degree 18.33 (4.80)
17.05 (2.94)
Age 25+ with post-college degree 2 6.19 (1.98)
5.09 (1.19)
Age 16+ in labor force 56.96 (6.20)
57.60 (3.70)
Average family size 3.17 (0.13)
3.14 (0.12)
Median Household Income (1989) $31,899 (7,448)
$28,403 (4,852)
Political leanings and medical mandates
Percentage of states with mandated insurance coverage for:
Medicaid funding of abortion 70.0 40.0
Contraceptives 60.0 47.5
Colorectal Cancer Screening 60.0 20.0
Percentage of states with:
Plurality of 1992 votes for Bill Clinton 70.0 40.0
Mandated mental health parity 90.0 65.0
N = 10 N = 40
Standard deviations are given in parentheses
1: The states with IVF-specific insurance regulations are: Arkansas, Connecticut, Hawaii, Illinois, Maryland, Massachusetts, Ohio, Rhode Island, Texas, and West Virginia.
2: A “post-college degree” includes master’s, doctoral, and professional degrees.

38
TABLE 4.1
Market Characteristics
MSA Means (2000)
Number of ART Clinics 0 1 > 1
Demand Shifters
Median Household Income $36,811 $41,251 $44,378 Upper quartile home value $137,600 $162,998 $179,015 Percent Catholic 17.0 17.0 19.8
Women, Ages 25-44 Population 29,745 79,757 425,628 % Employed 70.4 73.0 71.4 % with Bachelor’s Degree 16.5 20.8 21.3 % with Graduate Degree 6.0 8.0 8.4
Cost Shifters
Number of hospitals 4.6 9.9 38.4 Beds per hospital 207.6 217.8 227.9 Medical wage index $8,978 $9,689 $9,815 Zero medical researchers? (%) 36.2 1.9 0.0 CON score 7.84 8.35 8.36
N 163 51 62

39
TABLE 4.2
Variation in Mean Market (MSA) and Clinic Characteristics by Insurance Regime
Population under Insurance Mandate: < 50 % > 50 %
Clinics in market 3.17 3.74 Clinics in market, per 100,000 women 1 1.61 1.40 % Markets with monopoly clinic 46.7 41.7 Herfindahl-Herschman Index 7,117 6,764 % Treatment with IVF 93.7 96.5 % Treatment with ICSI 38.0 33.7 Under 35 Over 35 Under 35 Over 35
Cycles per 10,000 women 1 21.7 16.9 28.6 23.4 Cycles per clinic 59.1 56.0 101.0 108.3
Number embryos transferred 2 3.45 3.76 3.21 3.49 Birthrate (% cycles) 2 32.2 19.9 27.1 16.6 Multiple birth rate (% births) 3 41.8 29.1 38.9 26.9
1: women ages 25-49
2: weighted by number of cycles
3: weighted by number of births

40
TABLE 5.1
Clinic Entry and Market Demand for ART
Log Number of Cycles in Market
Monopoly Market 2+ Clinics in Market Variable
Number of Clinics
(1) Under 35
(2) Over 35
(3) Under 35
(4) Over 35
(5)
Constant 3.141 (1.61)
2.835 (1.57)
-1.772 (-1.49)
-1.201 (-0.98)
Insurance Coverage Mandate 0.167 (0.86)
0.450 (1.95)
0.378 (1.39)
0.370 (2.13)
0.262 (1.47)
Median income 0.648 (2.37)
-0.362 (-0.88)
-0.301 (-0.87)
0.146 (0.81)
0.236 (1.46)
Upper quartile home value -0.208 (-1.06)
-0.196 (-0.73)
0.007 (0.02)
-0.210 (-1.77)
-0.059 (-0.53)
Population of women, ages 25-44 (Pop / 10,000)
0.023 (1.25)
-0.056 (-2.02)
-0.042 (-1.43)
0.026 (2.50)
0.002 (2.74)
Percent Catholic -0.007 (-1.17)
0.005 (0.47)
0.012 (1.43)
-0.00001 (-0.00)
0.006 (1.06)
Percentage of women with
Bachelor’s degree 0.027 (0.78)
0.037 (1.27)
0.045 (1.70)
0.023 (0.68)
0.037 (1.20)
Master’s degree 0.021 (0.29)
0.001 (0.01)
-0.022 (-0.23)
-0.042 (-0.62)
-0.062 (-0.99)
Professional degree 0.597 (2.75)
0.312 (0.73)
0.330 (0.79)
0.210 (0.88)
0.273 (1.27)
Doctorate degree -0.241 (-0.91)
-0.037 (-0.07)
0.187 (0.45)
0.002 (0.01)
0.164 (0.63)
Number of hospitals 0.050 (3.57)
Beds per hospital 0.002 (2.52)
Medical Wage Index (/1000) 0.009 (0.10)
Zero medical researchers -1.197 (-4.02)
“Cert. of need” law score -0.012 (-1.34)
Inverse Mills Ratio -0.481 (-1.35)
-0.398 (-0.99)
0.338 (2.59)
0.245 (2.03)
N 1638 279 279 347 347
Note: t-ratios in parentheses. Each regression also includes year dummies and the percentage of women working. Standard errors account for correlation within markets. Ordered probit model in column (1) also estimates 10 cut points.

41
TABLE 5.2
Impact of Number of Clinics in Market on IVF Utilization, by Insurance Mandate and Market Size
Percentage Increase in Number of Cycles in Market
Age under 35 Age over 35
Average Market 55.2% 50.5%
Markets with Insurance mandate 45.0% 36.3%
Markets without Insurance mandate 57.0% 53.3%
Note: All utilization differentials constructed using the average characteristics of markets with n > 0 clinics in the sample.

42
TABLE 6.1
Clinic Size and Market Characteristics
Specification: 1 OLS IV
Dependent variable: Log cycles, Age under 35
Insurance mandate 0.358
(2.09) 0.418
(2.17)
Competition 2 -0.024
(-1.10) 0.061 (0.75)
Dependent variable: Log cycles, Age over 35
Insurance mandate 0.225
(1.38) 0.235
(1.42)
Competition 2 -0.020
(-0.95) 0.057 (0.85)
1: The OLS specification treats Competition as exogenous, while the IV specification uses a predicted value of Competition from a first-stage tobit regression.
2: The variable Competition is equal to −HHI/1,000
N = 1948 clinic-year observations. t-ratios in parentheses. Standard errors account for clustering within clinics. Regressions also include controls for year, income, population by age, education by age, and percent Catholic.

43
TABLE 6.2
Clinic’s Technology Choices
Dependent variable: % cycles with ICSI
Specification: 1 Tobit Tobit IV
Insurance mandate -0.055
(-3.89) 0.069
(1.78) -0.075 (-5.28)
-0.003
(-0.09)
Competition 2 -0.009
(-3.82) -0.008
(-3.70) -0.038 (-7.92)
-0.036 (-7.30)
Insurance mandate × upper quartile house value (/10,000)
-0.006
(-3.45) -0.003
(-1.94)
Dependent variable: Clinic offers ICSI 3
Specification: 1 Probit Probit IV
Insurance mandate -0.203
(-0.83) -0.117
(-0.19) -0.233
(-0.90) -0.174 (-0.28)
Competition 2 -0.002
(-0.05) -0.002
(-0.07) -0.034
(-0.40) -0.033 (-0.39)
Insurance mandate × upper quartile house value (/10,000)
-0.005
(-0.15) -0.003
(-0.10)
1: The tobit (probit) specification treats Competition as exogenous, while the IV specification uses a predicted value of Competition from a first-stage tobit regression.
2: The variable Competition is equal to −HHI/1,000
3: Clinic is defined as offering ICSI if 10% or more of cycles use ICSI in a given year.
N = 1939 clinic-year observations, with 165 observations equal to zero for percentage of cycles with ICSI. t-ratios in parentheses. Standard errors of probit results account for clustering within clinics. Regressions also include controls for year, income, population by age, and education by age. Observations weighted by total number of cycles at the clinic.

44
TABLE 6.3
Embryos Transferred
Specification: 1 OLS IV
Dependent variable: Average number of embryos, Age under 35
Insurance mandate -0.195
(-2.00) -0.220
(-2.25)
Competition 2 0.0002
(0.01) -0.060 (-1.62)
Dependent variable: Average number of embryos, Age over 35
Insurance mandate -0.212
(-1.97) -0.202
(-1.88)
Competition 2 -0.028
(-2.03) -0.059 (-2.15)
1: The OLS specification treats Competition as exogenous, while the IV specification uses a predicted value of Competition from a first-stage tobit regression.
2: The variable Competition is equal to −HHI/1,000
N = 1932 clinic-year observations. t-ratios in parentheses. Standard errors account for clustering within clinics. Regressions also include controls for year, income, population by age, and education by age. Observations weighted by total number of cycles at the clinic.

45
TABLE 6.4
Birth Rates
Specification: 1 OLS IV
Dependent variable: Percentage cycles with a birth, Age under 35
Insurance mandate -2.975 (-1.96)
-2.987
(-2.04) -3.039 (-1.99)
-3.082
(-2.09)
Competition 2 -0.202 (-0.94)
-0.232
(-1.07) -0.353 (-0.76)
-0.463 (-1.02)
Includes controls for ICSI and embryos
Yes No Yes No
Dependent variable: Percentage cycles with a birth, Age over 35
Insurance mandate -3.037
(-3.00) -3.384
(-3.31) -3.030
(-3.00) -3.388
(-3.28)
Competition 2 -0.397 (-2.32)
-0.439
(-2.62) -0.269 (-0.75)
-0.424 (-1.23)
Includes controls for ICSI and embryos
Yes No Yes No
1: The uncorrected specification treats Competition as exogenous, while the IV specification uses a predicted value of Competition from a first-stage tobit regression.
2: The variable Competition is equal to −HHI/1,000
N = 1932 clinic-year observations. t-ratios in parentheses. Standard errors account for clustering within clinics. Regressions also include controls for year, income, population by age, and education by age. Observations weighted by total number of cycles at the clinic.

46
TABLE 6.5
Multiple Birth Rates
Specification: 1 Tobit Tobit IV
Dependent variable: Percentage births with twins+, Age under 35
Insurance mandate -2.171
(-1.94) -2.611
(-2.35) -2.230
(-1.98) -2.733
(-2.44)
Competition 2 -0.373
(-2.13) -0.376
(-2.14) -0.490
(-1.35) -0.643
(-1.77)
Includes controls for ICSI and embryos
Yes No Yes No
Dependent variable: Percentage births with twins+, Age over 35
Insurance mandate -0.738
(-0.64) -1.227
(-1.07) -0.701
(-0.61) -1.167
(-1.01)
Competition 2 -0.325
(-1.47) -0.398
(-1.79) -0.574 (-1.41)
-0.683 (-1.69)
Includes controls for ICSI and embryos
Yes No Yes No
1: The tobit specification treats Competition as exogenous, while the IV specification uses a predicted value of Competition from a first-stage tobit regression.
2: The variable Competition is equal to −HHI/1,000
N = 1664 clinic-year observations for under-35 patients, with 128 observations censored at zero. N = 1624 for over-35 patients, with 261 censored at zero. t-ratios in parentheses. Regressions also include controls for year, income, population by age, and education by age. Observations weighted by total number of cycles at the clinic.

47
FIGURE 2
Fertility-Enhancing Technology
FIGURE 3
Treatment Choice under Monopoly as t Varies
Possible actions are: no treatment (N) and treatment (T). Couples choose the action that provides the highest utility. Notation: uN = u(A), uT = u(A – p – d). uN – uT = ∆(p) > 0.
1/k
Birth Probability
γ 1/k′
γ φ(t,k)
φ(t,1) = t
φ(t,k′)
t
Utility
γ
Bφ(t,k) + uT
Bt + uN
t
– ∆(p)
Use ART

48
FIGURE 4
Embryo Choice under Monopoly as t Varies
Possible actions are: no treatment (N) and treatment (T). Conditional on treatment, couples take one or two embryos. Utility maximization guides choices. Notation: uN = u(A), uT = u(A – p – d). uN – uT = ∆(p) > 0.
Utility
γ
Bφ(t,k) + uT
Bt + uN
t
– ∆(p)
One Embryo
Two Embryos
B[φ(t,αk) – τkt]+ uT

49
FIGURE 5
Clinic Choice under Duopoly as t Varies
Possible actions are: no treatment (N), use the high-k clinic (H), or use the low-k clinic (L). Utility maximization guides choices. Notation: uN = u(A), uH = u(A – pH – d), uL = u(A – pL – d). uN – uH = ∆(pH), uN – uL = ∆(pL). ∆(pH) > ∆(pL).
Utility
γ
Bφ(t,kL) + uL
Bt + uN
t
– ∆(pL)
Clinic L
Clinic H
Bφ(t,kH) + uH
– ∆(pH)