Embed Size (px)
Citation preview
January 2011 Report No. 11-04
Completing Adult Education Programs Improves Students’ Employability, but Program Completion Rates are Low at a glance School districts and colleges annually receive approximately $300 million in funding for adult education programs that serve 330,000 students in a variety of community locations. Some of these students are teenagers (age 18 and under) who enroll for dropout prevention and recovery purposes, but most are adults seeking to improve their employability.
Adult education programs have varying levels of success. Nearly three-quarters of high school students who co-enrolled in adult education stayed in school or graduated. In contrast, most adult students left programs before achieving documented learning gains. Those who remained and made gains had a better chance of improving their employment outcomes. Approximately half of unemployed adult students who made learning gains subsequently found employment. Adults who were employed prior to enrolling experienced higher earnings increases than employed adults who did not make gains.
The Legislature could consider several options for charging tuition and fees for adult education programs that should not jeopardize federal grant funding.
Scope ________________ As directed by the Legislature, OPPAGA examined the adult education programs operated by school districts and Florida College System institutions. This report addresses five questions. What are adult education programs? How are adult education programs
delivered and funded?
What are the primary reasons students enroll in adult education?
What are the student outcomes for adult education programs?
What is the feasibility of charging tuition and fees for adult education programs?
This report is part of a series on Florida’s workforce education programs. Companion reports examine how workforce education programs are funded, the overlap in college and school district responsibilities, the option of consolidating responsibility for workforce education programs, and the performance outcomes of workforce programs. A final report summarizes this series and provides recommendations and policy options.
Questions & Answers ___
What are adult education programs? In 2000, nearly 2 million Floridians over the age of 18 did not have a high school diploma, and more than 1.7 million adults in Florida had reading skills below the 8th grade level.1 Adult education programs are intended to address this problem by helping students become employable, productive citizens.
As shown in Exhibit 1, these programs range from helping adults improve their basic 1 These numbers are from the 2000 U.S. Census data, the most
recent information available at the time of this report.
OPPAGA Report Report No. 11-04
2
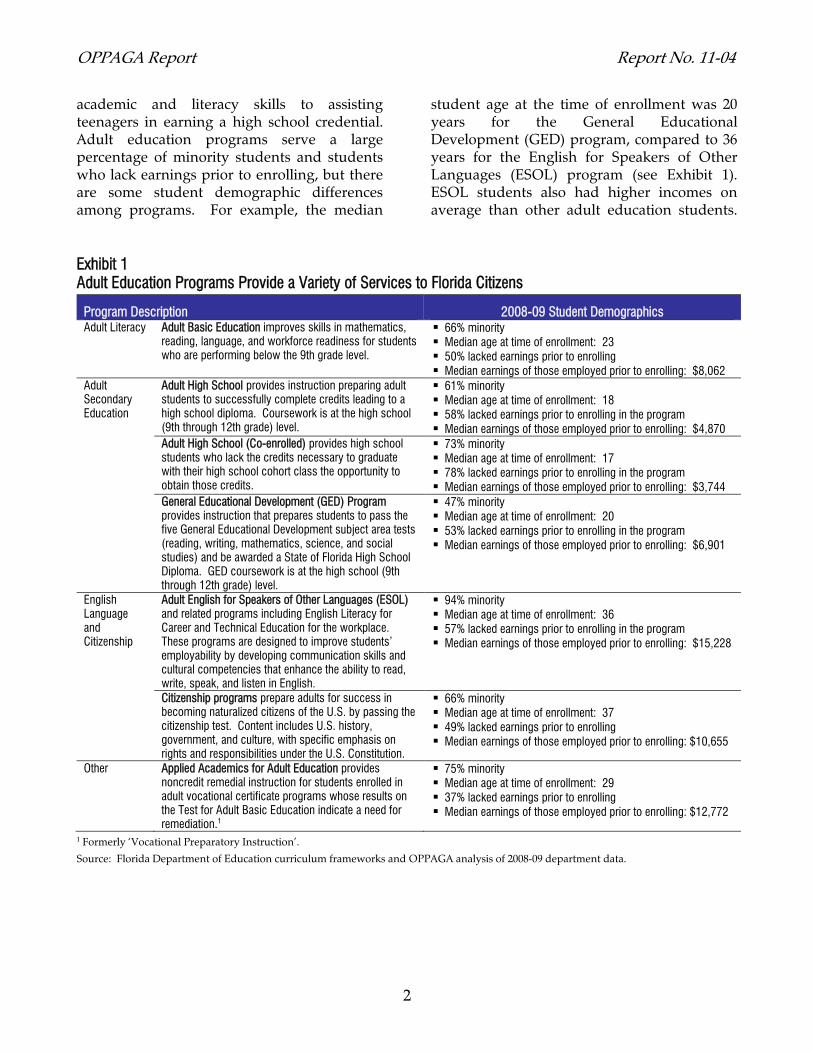
academic and literacy skills to assisting teenagers in earning a high school credential. Adult education programs serve a large percentage of minority students and students who lack earnings prior to enrolling, but there are some student demographic differences among programs. For example, the median
student age at the time of enrollment was 20 years for the General Educational Development (GED) program, compared to 36 years for the English for Speakers of Other Languages (ESOL) program (see Exhibit 1). ESOL students also had higher incomes on average than other adult education students.
Exhibit 1 Adult Education Programs Provide a Variety of Services to Florida Citizens
Program Description 2008-09 Student Demographics Adult Literacy Adult Basic Education improves skills in mathematics,
reading, language, and workforce readiness for students who are performing below the 9th grade level.
66% minority Median age at time of enrollment: 23 50% lacked earnings prior to enrolling Median earnings of those employed prior to enrolling: $8,062
Adult Secondary Education
Adult High School provides instruction preparing adult students to successfully complete credits leading to a high school diploma. Coursework is at the high school (9th through 12th grade) level.
61% minority Median age at time of enrollment: 18 58% lacked earnings prior to enrolling in the program Median earnings of those employed prior to enrolling: $4,870
Adult High School (Co-enrolled) provides high school students who lack the credits necessary to graduate with their high school cohort class the opportunity to obtain those credits.
73% minority Median age at time of enrollment: 17 78% lacked earnings prior to enrolling in the program Median earnings of those employed prior to enrolling: $3,744
General Educational Development (GED) Program provides instruction that prepares students to pass the five General Educational Development subject area tests (reading, writing, mathematics, science, and social studies) and be awarded a State of Florida High School Diploma. GED coursework is at the high school (9th through 12th grade) level.
47% minority Median age at time of enrollment: 20 53% lacked earnings prior to enrolling in the program Median earnings of those employed prior to enrolling: $6,901
English Language and Citizenship
Adult English for Speakers of Other Languages (ESOL) and related programs including English Literacy for Career and Technical Education for the workplace. These programs are designed to improve students’ employability by developing communication skills and cultural competencies that enhance the ability to read, write, speak, and listen in English.
94% minority Median age at time of enrollment: 36 57% lacked earnings prior to enrolling in the program Median earnings of those employed prior to enrolling: $15,228
Citizenship programs prepare adults for success in becoming naturalized citizens of the U.S. by passing the citizenship test. Content includes U.S. history, government, and culture, with specific emphasis on rights and responsibilities under the U.S. Constitution.
66% minority Median age at time of enrollment: 37 49% lacked earnings prior to enrolling Median earnings of those employed prior to enrolling: $10,655
Other Applied Academics for Adult Education provides noncredit remedial instruction for students enrolled in adult vocational certificate programs whose results on the Test for Adult Basic Education indicate a need for remediation.1
75% minority Median age at time of enrollment: 29 37% lacked earnings prior to enrolling Median earnings of those employed prior to enrolling: $12,772
1 Formerly ‘Vocational Preparatory Instruction’.
Source: Florida Department of Education curriculum frameworks and OPPAGA analysis of 2008-09 department data.
Report No. 11-04 OPPAGA Report
3
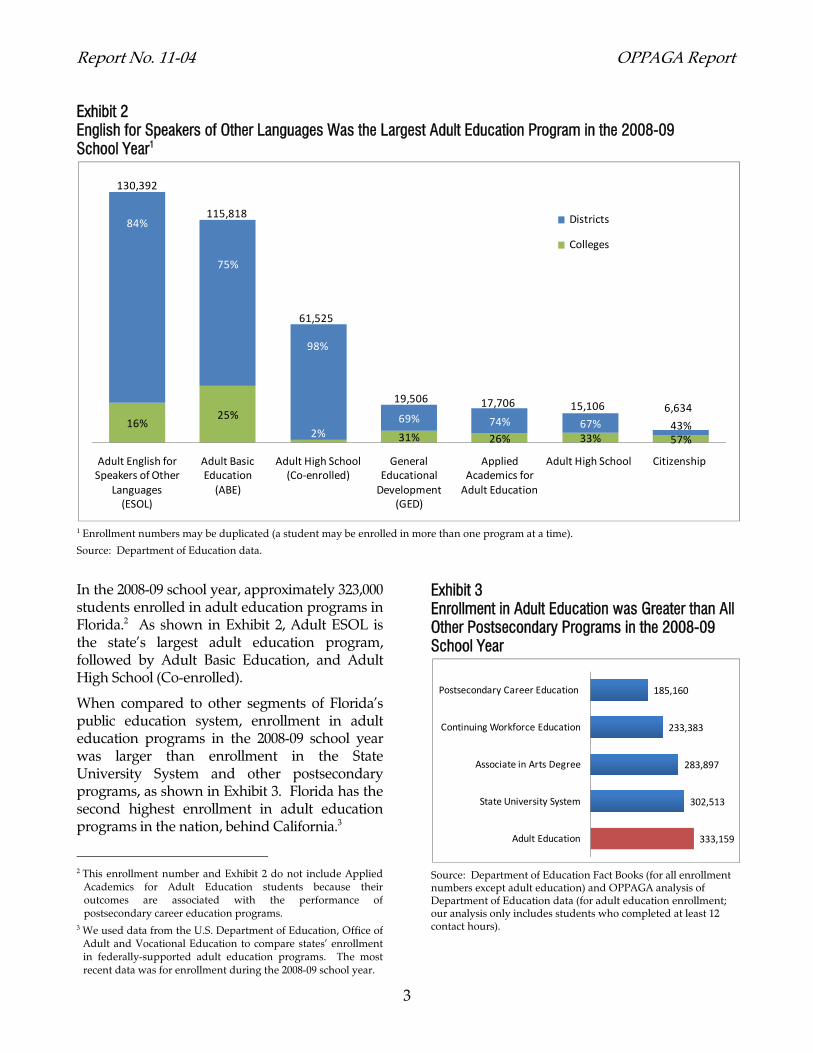
Exhibit 2 English for Speakers of Other Languages Was the Largest Adult Education Program in the 2008-09 School Year1
1 Enrollment numbers may be duplicated (a student may be enrolled in more than one program at a time). Source: Department of Education data.
In the 2008-09 school year, approximately 323,000 students enrolled in adult education programs in Florida.2 As shown in Exhibit 2, Adult ESOL is the state’s largest adult education program, followed by Adult Basic Education, and Adult High School (Co-enrolled).
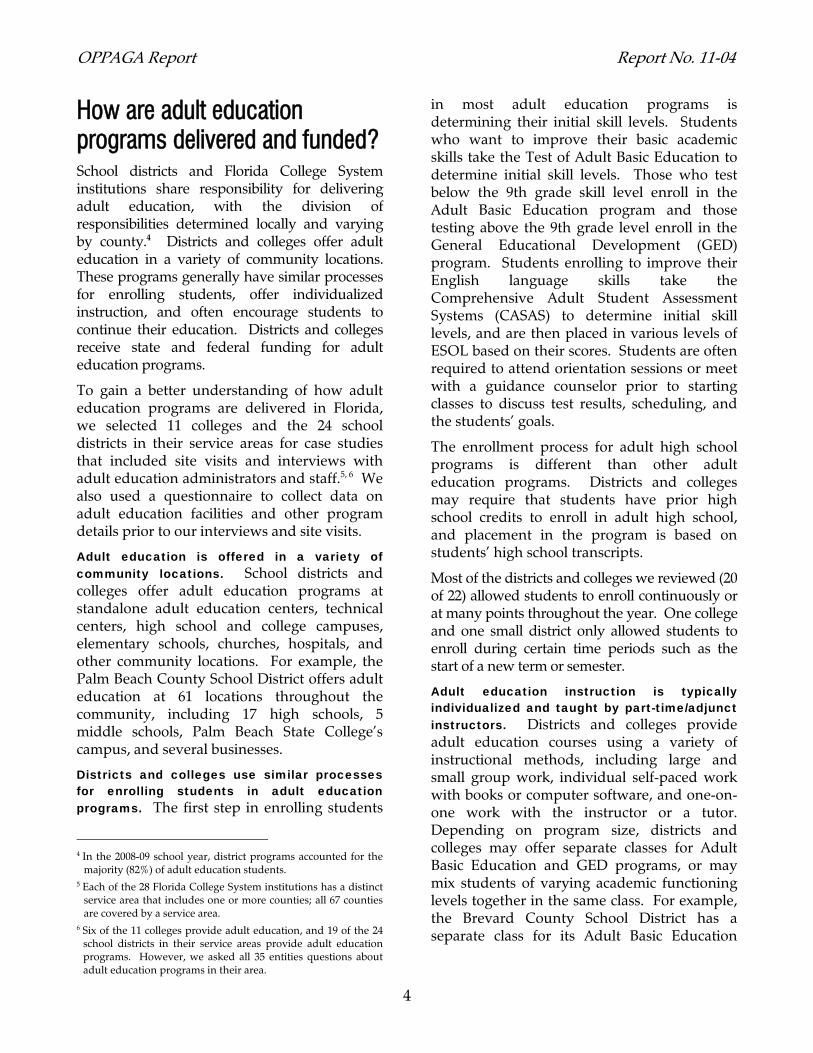
When compared to other segments of Florida’s public education system, enrollment in adult education programs in the 2008-09 school year was larger than enrollment in the State University System and other postsecondary programs, as shown in Exhibit 3. Florida has the second highest enrollment in adult education programs in the nation, behind California.3
2 This enrollment number and Exhibit 2 do not include Applied
Academics for Adult Education students because their outcomes are associated with the performance of postsecondary career education programs.
3 We used data from the U.S. Department of Education, Office of Adult and Vocational Education to compare states’ enrollment in federally-supported adult education programs. The most recent data was for enrollment during the 2008-09 school year.
Exhibit 3 Enrollment in Adult Education was Greater than All Other Postsecondary Programs in the 2008-09 School Year
Source: Department of Education Fact Books (for all enrollment numbers except adult education) and OPPAGA analysis of Department of Education data (for adult education enrollment; our analysis only includes students who completed at least 12 contact hours).
16%25%
2% 31% 26% 33% 57%
84%
75%
98%
69% 74% 67% 43%
Adult English for Speakers of Other
Languages (ESOL)
Adult Basic Education (ABE)
Adult High School (Co‐enrolled)
General Educational Development
(GED)
Applied Academics for Adult Education
Adult High School Citizenship
115,818
61,525
19,50615,106 6,63417,706
130,392
Districts
Colleges
333,159
302,513
283,897
233,383
185,160
Adult Education
State University System
Associate in Arts Degree
Continuing Workforce Education
Postsecondary Career Education
OPPAGA Report Report No. 11-04
4
How are adult education programs delivered and funded? School districts and Florida College System institutions share responsibility for delivering adult education, with the division of responsibilities determined locally and varying by county.4 Districts and colleges offer adult education in a variety of community locations. These programs generally have similar processes for enrolling students, offer individualized instruction, and often encourage students to continue their education. Districts and colleges receive state and federal funding for adult education programs.
To gain a better understanding of how adult education programs are delivered in Florida, we selected 11 colleges and the 24 school districts in their service areas for case studies that included site visits and interviews with adult education administrators and staff.5, 6 We also used a questionnaire to collect data on adult education facilities and other program details prior to our interviews and site visits.
Adult education is offered in a variety of community locations. School districts and colleges offer adult education programs at standalone adult education centers, technical centers, high school and college campuses, elementary schools, churches, hospitals, and other community locations. For example, the Palm Beach County School District offers adult education at 61 locations throughout the community, including 17 high schools, 5 middle schools, Palm Beach State College’s campus, and several businesses.
Districts and colleges use similar processes for enrolling students in adult education programs. The first step in enrolling students
4 In the 2008-09 school year, district programs accounted for the
majority (82%) of adult education students. 5 Each of the 28 Florida College System institutions has a distinct
service area that includes one or more counties; all 67 counties are covered by a service area.
6 Six of the 11 colleges provide adult education, and 19 of the 24 school districts in their service areas provide adult education programs. However, we asked all 35 entities questions about adult education programs in their area.
in most adult education programs is determining their initial skill levels. Students who want to improve their basic academic skills take the Test of Adult Basic Education to determine initial skill levels. Those who test below the 9th grade skill level enroll in the Adult Basic Education program and those testing above the 9th grade level enroll in the General Educational Development (GED) program. Students enrolling to improve their English language skills take the Comprehensive Adult Student Assessment Systems (CASAS) to determine initial skill levels, and are then placed in various levels of ESOL based on their scores. Students are often required to attend orientation sessions or meet with a guidance counselor prior to starting classes to discuss test results, scheduling, and the students’ goals.
The enrollment process for adult high school programs is different than other adult education programs. Districts and colleges may require that students have prior high school credits to enroll in adult high school, and placement in the program is based on students’ high school transcripts.
Most of the districts and colleges we reviewed (20 of 22) allowed students to enroll continuously or at many points throughout the year. One college and one small district only allowed students to enroll during certain time periods such as the start of a new term or semester.
Adult education instruction is typically individualized and taught by part-time/adjunct instructors. Districts and colleges provide adult education courses using a variety of instructional methods, including large and small group work, individual self-paced work with books or computer software, and one-on-one work with the instructor or a tutor. Depending on program size, districts and colleges may offer separate classes for Adult Basic Education and GED programs, or may mix students of varying academic functioning levels together in the same class. For example, the Brevard County School District has a separate class for its Adult Basic Education
Report No. 11-04 OPPAGA Report
5
students, while Indian River County School District combines students into one class.
Most of the adult education instructors in the districts and colleges we reviewed (79%) were part-time/adjunct so that staff could be added or reduced as needed to address fluctuations in student enrollment. All of the adult education programs required instructors to have a minimum of a bachelor’s degree, and many district programs (11 of 16) also required instructors to have a state or district teaching certificate.
Districts and colleges often encourage adult education students to further their education. Many of the adult education programs we reviewed emphasized the importance of continuing education by transitioning into postsecondary education programs, and most programs were structured to encourage this transition. For example, some districts and colleges reported that they take adult education students on tours of college campuses and have college career education advisors discuss the types of programs available. They also help students fill out college applications and financial aid forms.
Some colleges have implemented formal transition programs for adult education students. For example, students in Northwest Florida State College’s transition program work with advisors to create an individualized Postsecondary Transition Plan. This process includes career assessment and advising, career exploration, assistance with financial aid applications and scholarships, academic skill building, and preparation to take the Florida College Placement Test.
In addition, students in the higher levels of adult education may simultaneously enroll in a postsecondary adult vocational certificate program. In the 2008-09 school year, 3% of adult education students were also enrolled in vocational certificate programs.
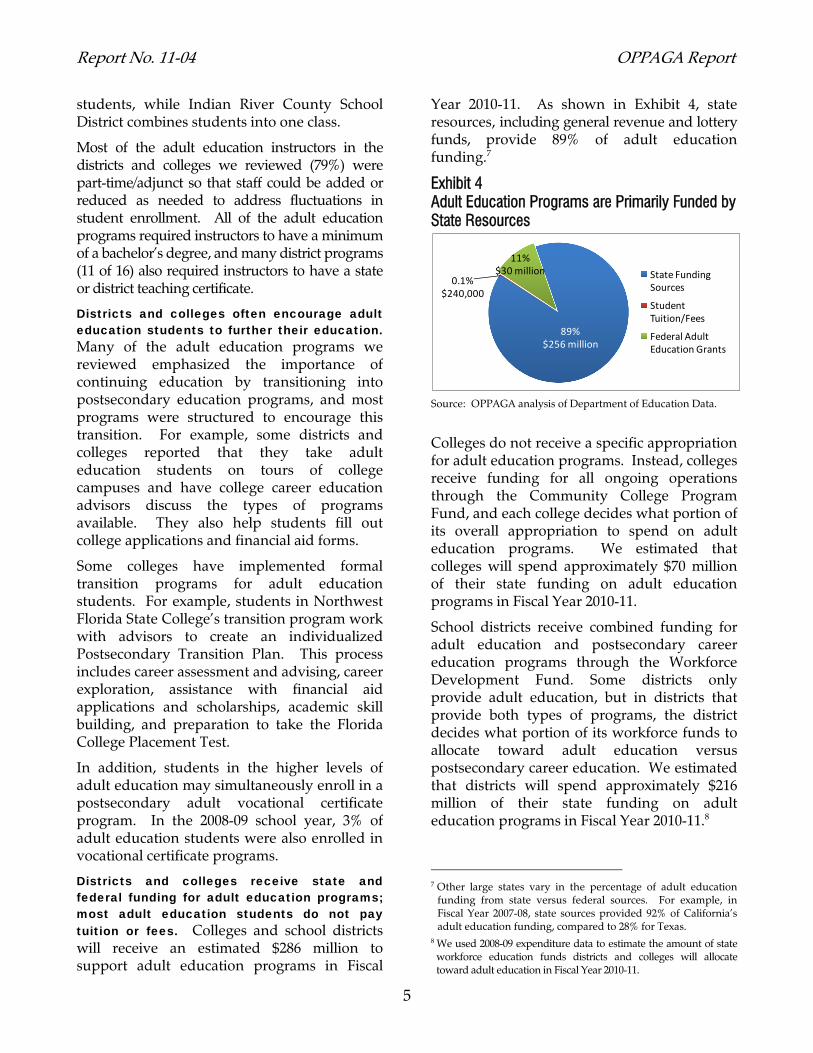
Districts and colleges receive state and federal funding for adult education programs; most adult education students do not pay tuition or fees. Colleges and school districts will receive an estimated $286 million to support adult education programs in Fiscal
Year 2010-11. As shown in Exhibit 4, state resources, including general revenue and lottery funds, provide 89% of adult education funding.7
Exhibit 4 Adult Education Programs are Primarily Funded by State Resources
Source: OPPAGA analysis of Department of Education Data.
Colleges do not receive a specific appropriation for adult education programs. Instead, colleges receive funding for all ongoing operations through the Community College Program Fund, and each college decides what portion of its overall appropriation to spend on adult education programs. We estimated that colleges will spend approximately $70 million of their state funding on adult education programs in Fiscal Year 2010-11.
School districts receive combined funding for adult education and postsecondary career education programs through the Workforce Development Fund. Some districts only provide adult education, but in districts that provide both types of programs, the district decides what portion of its workforce funds to allocate toward adult education versus postsecondary career education. We estimated that districts will spend approximately $216 million of their state funding on adult education programs in Fiscal Year 2010-11.8
7 Other large states vary in the percentage of adult education
funding from state versus federal sources. For example, in Fiscal Year 2007-08, state sources provided 92% of California’s adult education funding, compared to 28% for Texas.
8 We used 2008-09 expenditure data to estimate the amount of state workforce education funds districts and colleges will allocate toward adult education in Fiscal Year 2010-11.
State Funding Sources
Student Tuition/Fees
Federal Adult Education Grants
89%$256 million
11%$30 million
0.1%$240,000
OPPAGA Report Report No. 11-04
6
School districts and colleges also may receive federal adult general, civics, and corrections education grants for adult education programs. Districts and colleges submit applications to the Department of Education for these grant funds, which the department awards on a competitive basis. For Fiscal Year 2010-11, the department allocated $25 million from these grants to districts and $5 million to colleges.
Florida Statutes exempt most adult education students from paying fees.9 Statutes only authorize districts and colleges to charge fees if an adult education student has a high school credential and performs above the 8th grade level but is still in need of remediation. As a result, only a small amount of fees are collected. We estimated that in Fiscal Year 2010-11, colleges will collect approximately $127,000 in tuition and fees from adult education students, and districts will collect approximately $112,000.
What are the primary reasons students enroll in adult education? Florida’s adult education programs serve two groups of students: teenagers who enroll for dropout prevention and recovery purposes and adults over the age of 18 who need to upgrade their basic academic or English literacy skills to improve their employability.
Florida’s adult education programs provide dropout prevention and recovery services to teenagers Adult education programs provide dropout prevention services to currently enrolled high school students who are behind in credits. In the 2008-09 school year, approximately 62,000 of Florida’s 323,000 adult education students (19%) were teenagers who were in these programs for dropout prevention. Statutes allow school districts and colleges to provide adult education services to teenage students who are still enrolled in high school but lack 9 Section 1009.25, F.S.
the credits they need to graduate on time (Adult High School co-enrollment).10 The goal of these services is to keep students from dropping out of high school by giving them additional opportunities to recover credits.11
District policies vary on approving high school students for co-enrollment. Some districts have policies stating that a student must have received a ‘D’ or an ‘F’ in a class to be able to recover credits through adult education, while other districts’ requirements are not clearly defined. Districts in our case studies generally required co-enrolling students to first get written permission from their high school guidance counselor.
The majority of school districts offer co-enrollment to high school students. In the 2008-09 school year, 35 of the 56 districts that provided adult education had co-enrolled high school students, which accounted for 21% of their total enrollment in adult education. The proportion of all high school students who were co-enrolled ranged from 0.1% in the Alachua County School District to 22% in the Miami-Dade County School District. Districts spent approximately $29 million on Adult High School co-enrollment in Fiscal Year 2008-09. (See Appendix B for more information on co-enrollment by district.)
In contrast, few college adult education programs offer co-enrollment services. Only 3 of the 18 colleges that provided adult education programs in 2008-09 served co-enrolled high school students (Daytona State College, Indian River State College, and Pensacola State College). These colleges spent approximately $1.6 million on Adult High School co-enrollment.
10 Section 1004.02(6), F.S. 11 Districts have other funding sources that they may use to
provide credit recovery opportunities for high school students in addition to adult education. The Legislature appropriates approximately $639 million to school districts through the Supplemental Academic Instruction (SAI) categorical fund, which may be used for credit recovery and other initiatives to improve student achievement and help students progress from grade to grade. Supplemental Academic Instruction funds can also be used to provide modified curriculum, reading instruction, after-school instruction, tutoring, mentoring, class size reduction, extended school year, and/or intensive skills development in summer school.
Report No. 11-04 OPPAGA Report
7
Adult education programs also provide services to teenagers who recently dropped out of school. The goal of these services is to help recent dropouts get back on track to earn a high school credential through the Adult High School, Adult Basic Education, or GED programs. Students who complete Adult High School receive standard high school diplomas, while students who complete Adult Basic Education or GED programs and pass the GED exam earn State of Florida High School Diplomas.12 In the 2008-09 school year, approximately 15% of students enrolled in adult education programs were in dropout recovery.
Most adult education students are adults who want to improve their employability In the 2008-09 school year, approximately 66% of students enrolled in adult education programs were adults (over the age of 18) who wanted to improve their employability. These students included adults without a high school education who enrolled to earn a high school credential. Students who are not able to earn a full high school credential may still be able to improve their ability to find a job or increase their earnings. For example, an individual who lacks basic literacy skills could improve from a 2nd to a 9th grade reading level, which would enable him or her to take a driver’s license test, fill out job applications, read the want ads, and engage in other activities that require the ability to read and write.
Adult education students also include adults who are trying to better their English literacy skills to improve employability. These students may also take citizenship courses to prepare for the Naturalization Interview and Civics Test administered by the U.S. Bureau of Citizenship and Immigration Services.13
12 A standard high school diploma denotes that the student met all
state and school district graduation requirements, such as earning 24 academic credits and a minimum grade point average of 2.0. A State of Florida High School Diploma denotes that the student received a high school credential by passing the GED exam.
13 Program administrators also reported that there are some adults who enroll for reasons other than improving employability, such as adults with young children who enroll to improve their basic academic or English literacy skills so that they are better prepared
What are the student outcomes for adult education programs? Adult education programs had varying levels of success. Co-enrolled high school students were significantly more likely than recent dropouts to stay in school or earn a high school credential. Most adult students left programs before achieving documented learning gains, which lessened their ability to find employment and increase their earnings. Approximately half of adult students who made learning gains before leaving adult education were working full-time or continuing their education.
Performance outcomes were significantly better for co-enrolled high school students than recent dropouts Almost three-fourths of high school students who co-enrolled in adult education stayed in school or graduated, but only one-third of recent dropouts who enrolled in adult education returned to high school or earned a high school credential. For this analysis, we defined dropout prevention as high school students who were simultaneously enrolled in adult high school programs, and dropout recovery as recent high school dropouts (under the age of 19) who were enrolled in GED, adult basic education, or adult high school programs. We assessed student outcomes by tracking the percentage of these students who stayed in high school or obtained a high school credential after leaving the adult education program.14 (See Appendix A for more information on our methodology for evaluating adult education programs.)
to help their children with schoolwork.
14 We identified students as having left the program if they were no longer enrolled in an adult education course for at least two consecutive terms. For high school students who were co-enrolled in adult education programs, we defined a positive outcome as either continuing their high school education or earning a high school credential. For the dropout recovery students who left adult education programs, we defined a positive outcome as earning a high school credential or returning to high school.
OPPAGA Report Report No. 11-04
8
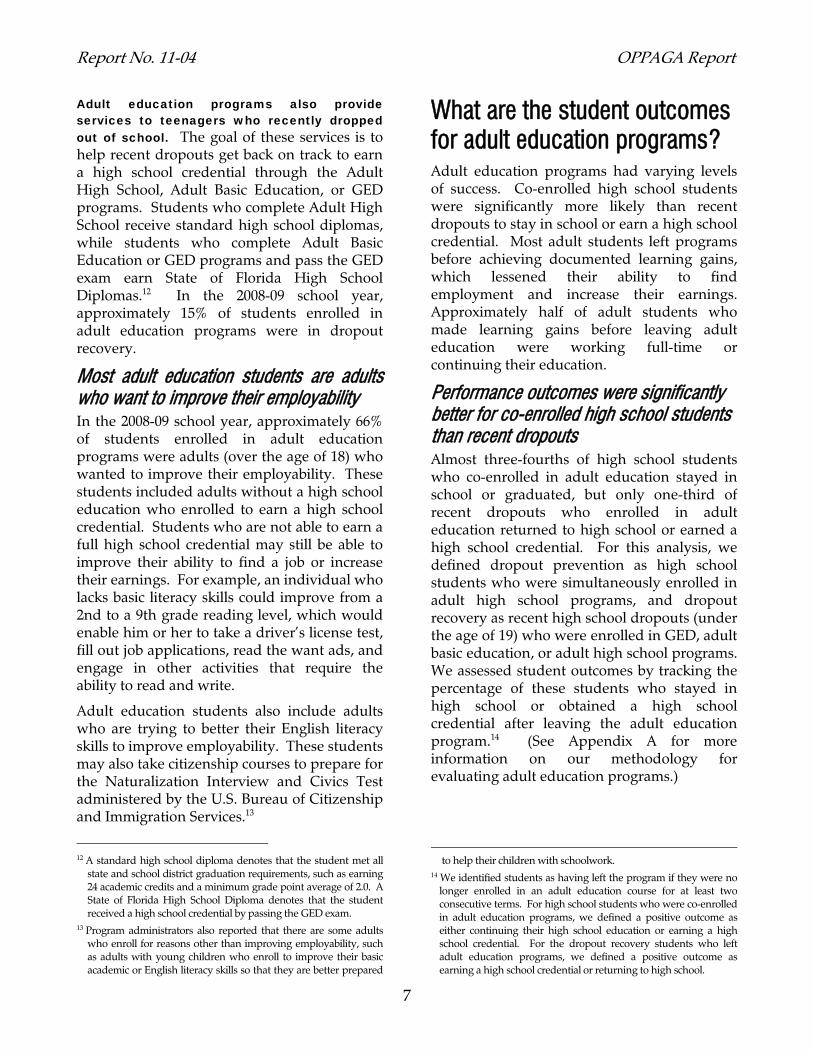
Nearly three-fourths of high school students who co-enrolled in adult education remained in school or graduated. Of co-enrolled high school students who left adult education programs in 2007-08, 72% stayed in school or obtained a high school credential (see Exhibit 5). Individual districts and colleges had varying levels of success with these students, ranging from 3% positive outcomes for Santa Fe College to 91% for the Gulf County School District. (See Appendix C for performance results for each district and college that offers co-enrollment.)
Exhibit 5 Most High School Students Who Co-Enrolled in Adult Education Remained in School or Obtained a High School Credential
Source: OPPAGA analysis of Department of Education data on students who left adult education programs in the 2007-08 school year.
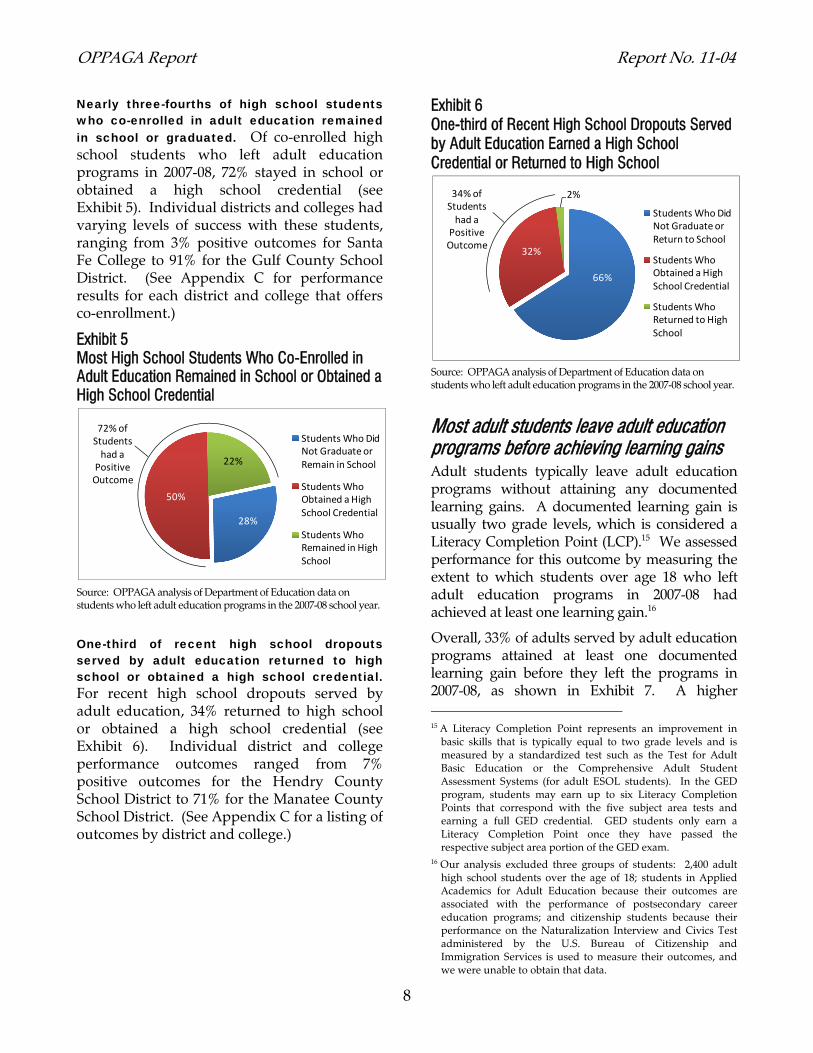
One-third of recent high school dropouts served by adult education returned to high school or obtained a high school credential. For recent high school dropouts served by adult education, 34% returned to high school or obtained a high school credential (see Exhibit 6). Individual district and college performance outcomes ranged from 7% positive outcomes for the Hendry County School District to 71% for the Manatee County School District. (See Appendix C for a listing of outcomes by district and college.)
Exhibit 6 One-third of Recent High School Dropouts Served by Adult Education Earned a High School Credential or Returned to High School
Source: OPPAGA analysis of Department of Education data on students who left adult education programs in the 2007-08 school year.
Most adult students leave adult education programs before achieving learning gains Adult students typically leave adult education programs without attaining any documented learning gains. A documented learning gain is usually two grade levels, which is considered a Literacy Completion Point (LCP).15 We assessed performance for this outcome by measuring the extent to which students over age 18 who left adult education programs in 2007-08 had achieved at least one learning gain.16
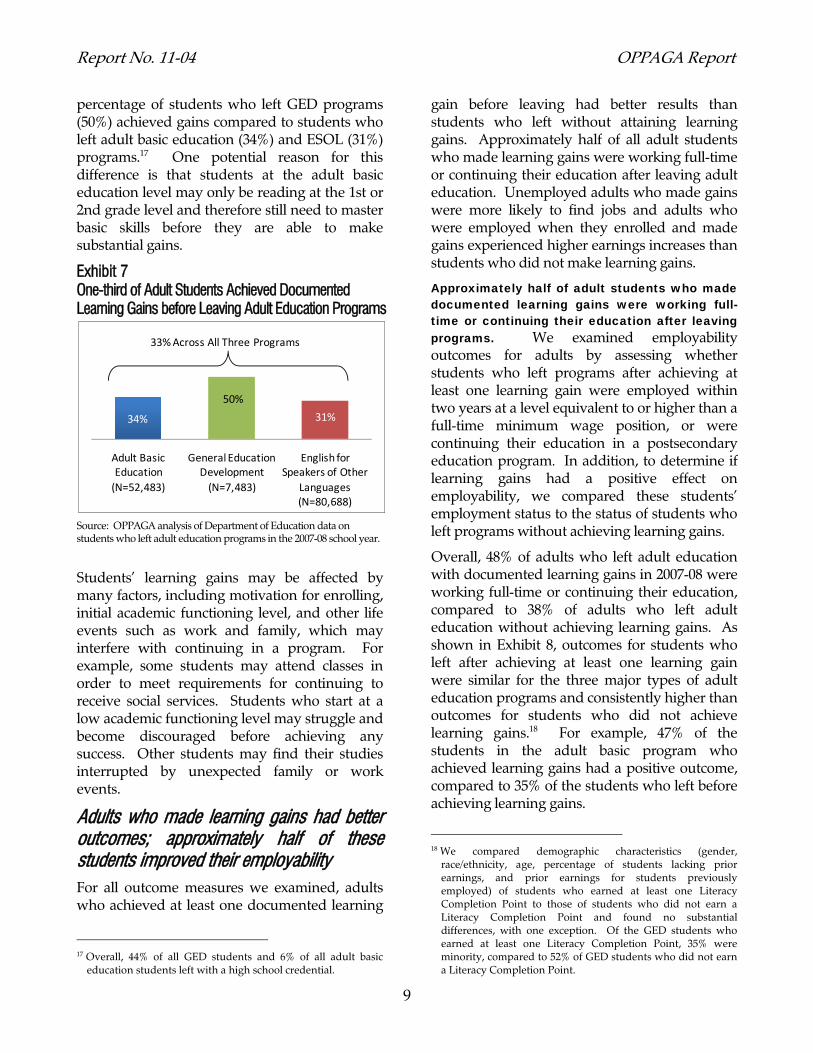
Overall, 33% of adults served by adult education programs attained at least one documented learning gain before they left the programs in 2007-08, as shown in Exhibit 7. A higher 15 A Literacy Completion Point represents an improvement in
basic skills that is typically equal to two grade levels and is measured by a standardized test such as the Test for Adult Basic Education or the Comprehensive Adult Student Assessment Systems (for adult ESOL students). In the GED program, students may earn up to six Literacy Completion Points that correspond with the five subject area tests and earning a full GED credential. GED students only earn a Literacy Completion Point once they have passed the respective subject area portion of the GED exam.
16 Our analysis excluded three groups of students: 2,400 adult high school students over the age of 18; students in Applied Academics for Adult Education because their outcomes are associated with the performance of postsecondary career education programs; and citizenship students because their performance on the Naturalization Interview and Civics Test administered by the U.S. Bureau of Citizenship and Immigration Services is used to measure their outcomes, and we were unable to obtain that data.
28%
50%
22%
Students Who Did Not Graduate or Remain in School
Students Who Obtained a High School Credential
Students Who Remained in High School
72% of Students had a
Positive Outcome
66%
32%
2%
Students Who Did Not Graduate or Return to School
Students Who Obtained a High School Credential
Students Who Returned to High School
34% of Students had a
Positive Outcome
Report No. 11-04 OPPAGA Report
9
percentage of students who left GED programs (50%) achieved gains compared to students who left adult basic education (34%) and ESOL (31%) programs.17 One potential reason for this difference is that students at the adult basic education level may only be reading at the 1st or 2nd grade level and therefore still need to master basic skills before they are able to make substantial gains.
Exhibit 7 One-third of Adult Students Achieved Documented Learning Gains before Leaving Adult Education Programs
Source: OPPAGA analysis of Department of Education data on students who left adult education programs in the 2007-08 school year.
Students’ learning gains may be affected by many factors, including motivation for enrolling, initial academic functioning level, and other life events such as work and family, which may interfere with continuing in a program. For example, some students may attend classes in order to meet requirements for continuing to receive social services. Students who start at a low academic functioning level may struggle and become discouraged before achieving any success. Other students may find their studies interrupted by unexpected family or work events.
Adults who made learning gains had better outcomes; approximately half of these students improved their employability For all outcome measures we examined, adults who achieved at least one documented learning
17 Overall, 44% of all GED students and 6% of all adult basic
education students left with a high school credential.
gain before leaving had better results than students who left without attaining learning gains. Approximately half of all adult students who made learning gains were working full-time or continuing their education after leaving adult education. Unemployed adults who made gains were more likely to find jobs and adults who were employed when they enrolled and made gains experienced higher earnings increases than students who did not make learning gains.
Approximately half of adult students who made documented learning gains were working full-time or continuing their education after leaving programs. We examined employability outcomes for adults by assessing whether students who left programs after achieving at least one learning gain were employed within two years at a level equivalent to or higher than a full-time minimum wage position, or were continuing their education in a postsecondary education program. In addition, to determine if learning gains had a positive effect on employability, we compared these students’ employment status to the status of students who left programs without achieving learning gains.
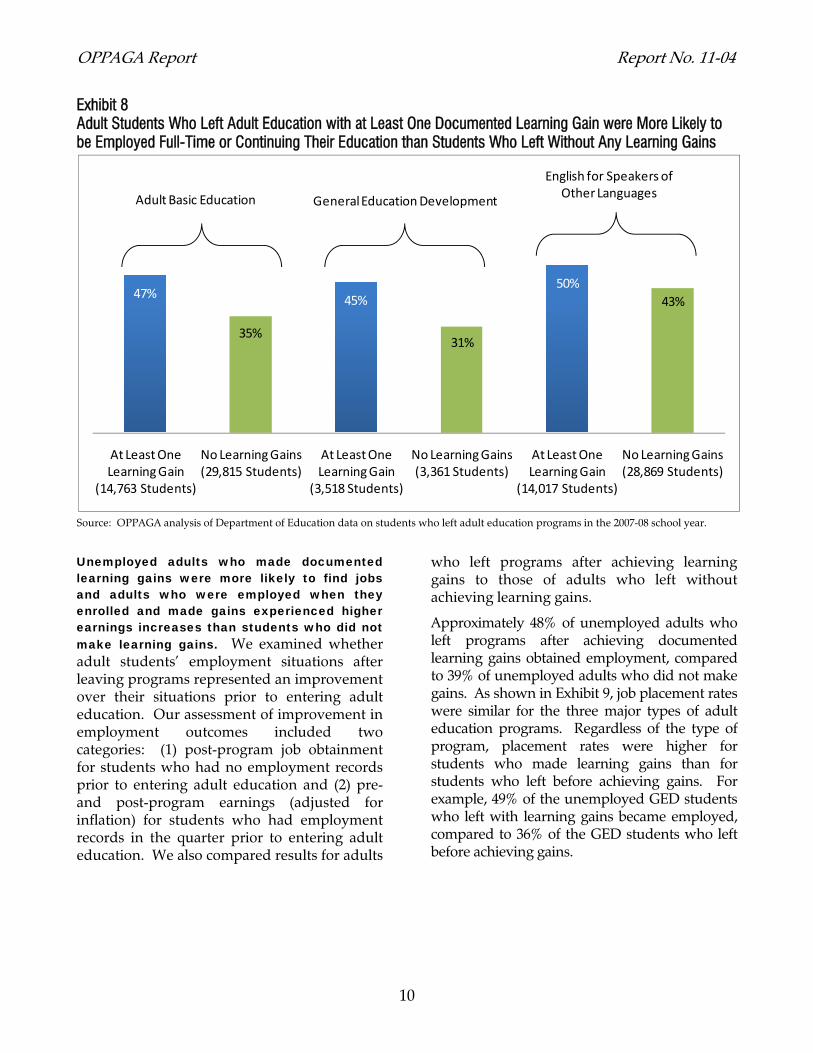
Overall, 48% of adults who left adult education with documented learning gains in 2007-08 were working full-time or continuing their education, compared to 38% of adults who left adult education without achieving learning gains. As shown in Exhibit 8, outcomes for students who left after achieving at least one learning gain were similar for the three major types of adult education programs and consistently higher than outcomes for students who did not achieve learning gains.18 For example, 47% of the students in the adult basic program who achieved learning gains had a positive outcome, compared to 35% of the students who left before achieving learning gains.
18 We compared demographic characteristics (gender,
race/ethnicity, age, percentage of students lacking prior earnings, and prior earnings for students previously employed) of students who earned at least one Literacy Completion Point to those of students who did not earn a Literacy Completion Point and found no substantial differences, with one exception. Of the GED students who earned at least one Literacy Completion Point, 35% were minority, compared to 52% of GED students who did not earn a Literacy Completion Point.
34%
50%
31%
Adult Basic Education
(N=52,483)
General Education Development
(N=7,483)
English for Speakers of Other
Languages (N=80,688)
33% Across All Three Programs
OPPAGA Report Report No. 11-04
10
Exhibit 8 Adult Students Who Left Adult Education with at Least One Documented Learning Gain were More Likely to be Employed Full-Time or Continuing Their Education than Students Who Left Without Any Learning Gains
Source: OPPAGA analysis of Department of Education data on students who left adult education programs in the 2007-08 school year.
Unemployed adults who made documented learning gains were more likely to find jobs and adults who were employed when they enrolled and made gains experienced higher earnings increases than students who did not make learning gains. We examined whether adult students’ employment situations after leaving programs represented an improvement over their situations prior to entering adult education. Our assessment of improvement in employment outcomes included two categories: (1) post-program job obtainment for students who had no employment records prior to entering adult education and (2) pre- and post-program earnings (adjusted for inflation) for students who had employment records in the quarter prior to entering adult education. We also compared results for adults
who left programs after achieving learning gains to those of adults who left without achieving learning gains.
Approximately 48% of unemployed adults who left programs after achieving documented learning gains obtained employment, compared to 39% of unemployed adults who did not make gains. As shown in Exhibit 9, job placement rates were similar for the three major types of adult education programs. Regardless of the type of program, placement rates were higher for students who made learning gains than for students who left before achieving gains. For example, 49% of the unemployed GED students who left with learning gains became employed, compared to 36% of the GED students who left before achieving gains.
47%
35%
45%
31%
50%
43%
At Least One Learning Gain
(14,763 Students)
No Learning Gains (29,815 Students)
At Least One Learning Gain
(3,518 Students)
No Learning Gains (3,361 Students)
At Least One Learning Gain
(14,017 Students)
No Learning Gains (28,869 Students)
Adult Basic Education General Education Development
English for Speakers of Other Languages
Report No. 11-04 OPPAGA Report
11
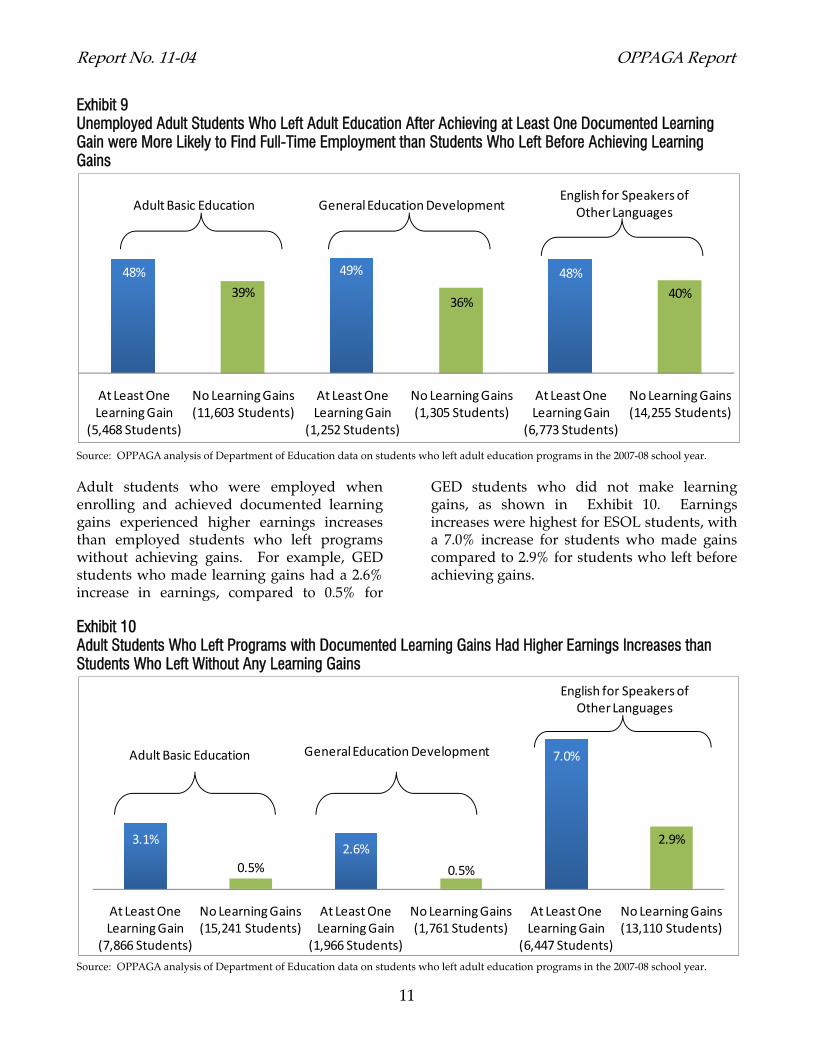
Exhibit 9 Unemployed Adult Students Who Left Adult Education After Achieving at Least One Documented Learning Gain were More Likely to Find Full-Time Employment than Students Who Left Before Achieving Learning Gains
Source: OPPAGA analysis of Department of Education data on students who left adult education programs in the 2007-08 school year.
Adult students who were employed when enrolling and achieved documented learning gains experienced higher earnings increases than employed students who left programs without achieving gains. For example, GED students who made learning gains had a 2.6% increase in earnings, compared to 0.5% for
GED students who did not make learning gains, as shown in Exhibit 10. Earnings increases were highest for ESOL students, with a 7.0% increase for students who made gains compared to 2.9% for students who left before achieving gains.
Exhibit 10 Adult Students Who Left Programs with Documented Learning Gains Had Higher Earnings Increases than Students Who Left Without Any Learning Gains
Source: OPPAGA analysis of Department of Education data on students who left adult education programs in the 2007-08 school year.
48%
39%
49%
36%
48%
40%
At Least One Learning Gain
(5,468 Students)
No Learning Gains (11,603 Students)
At Least One Learning Gain
(1,252 Students)
No Learning Gains (1,305 Students)
At Least One Learning Gain
(6,773 Students)
No Learning Gains (14,255 Students)
Adult Basic Education General Education DevelopmentEnglish for Speakers of
Other Languages
3.1%
0.5%
2.6%
0.5%
7.0%
2.9%
At Least One Learning Gain
(7,866 Students)
No Learning Gains (15,241 Students)
At Least One Learning Gain
(1,966 Students)
No Learning Gains (1,761 Students)
At Least One Learning Gain
(6,447 Students)
No Learning Gains (13,110 Students)
Adult Basic Education General Education Development
English for Speakers of Other Languages
OPPAGA Report Report No. 11-04
12
What is the feasibility of charging tuition and fees for adult education programs? Guidelines for receiving federal adult education funding do not preclude the state from charging reasonable fees for adult education courses. Charging fees could help motivate adult students to achieve learning gains before leaving and offset some state costs, but has the potential to reduce access for students who cannot afford to pay the fees. The Legislature could consider several options for charging tuition and fees for adult education programs that should not jeopardize federal grant funding.
The state could remove adult education fee exemptions without jeopardizing federal funding as long as fees are reasonable Florida statutes exempt most adult education students from paying fees.19 Only 4 colleges and 21 school districts reported collecting adult education tuition and fees in 2008-09. Students are exempt if they do not have a high school credential, or if they have a high school credential but test below the 8th grade level.20 However, some colleges and districts currently charge all students a nominal ($10 or $15) registration fee or a fee to take the Test of Adult Basic Education (TABE). Department of Education staff indicated that statutory language is unclear as to whether registration and TABE testing fees fall under the fee exemption policy.
Some stakeholders have suggested that Florida would jeopardize its federal adult education grant funding ($30 million for Fiscal Year 2010-11) if school districts and colleges were allowed to charge students tuition and fees for adult education courses. However, according to the U.S. Department of Education, Florida’s federal grant funds would not be negatively
19 Section 1009.25, F.S. 20 In addition, adult education students are not required to
document that they are a permanent Florida resident to be exempt from paying fees.
affected if all adult education students were charged a reasonable fee for enrollment. The reasonableness of a fee is loosely defined as a fee that does not deny students access to a program. Fees collected may not exceed the federal award amount and cannot be used to meet the 25% state match requirement for the grant. All fees collected must be kept in a separate account and used for adult education.
Charging students fees for adult education courses has potential advantages and disadvantages Charging fees for adult education programs could potentially increase student buy-in and thus motivate students to make learning gains before leaving, as well as offset some of the state’s cost to provide these services. However, fees could reduce access for students who cannot afford to pay the fees.
We interviewed adult education administrators at 22 school districts and state colleges regarding the advantages and disadvantages of charging nominal fees to students who enroll in adult education programs.
Advantages: Some program administrators stated that charging a nominal fee might increase student buy-in and motivate students to stay in an adult education program and make educational progress. If students paid fees, they would have a financial stake in their education and may take more responsibility for trying to avoid the loss of this investment by completing their training. Students who are less motivated or serious about the training may not enroll if they had to pay fees.
In addition, administrators noted that students attend the classes for a variety of reasons, some of which are not academic in nature or by their own choosing. For example, some students may attend classes in order to meet requirements for continuing to receive social services. Administrators suggested that in some instances, these students are taking up slots that otherwise could be filled with
Report No. 11-04 OPPAGA Report
13
motivated students who are on a waiting list.
Disadvantages: Other program administrators believed that charging fees would restrict student access because many of the students who attend these classes are unemployed or have very low incomes. In the 2008-09 school year, 58% of adult education students lacked employment records prior to entering a program, and the median annual earnings of those with employment was below minimum wage — $9,098 a year. Unlike other postsecondary programs, students enrolled in adult education programs do not currently have access to financial aid. Another potential disadvantage is the time and administrative costs of creating fee payment and tracking systems for adult education students since these students generally do not pay fees under the current system.
Several options exist for charging students reasonable fees for adult education The Legislature could consider several options for charging tuition and fees for adult education programs that should avoid jeopardizing federal grant funding. These options could be implemented independently or in varying combinations with each other, and they could be structured as discretionary fees that districts and colleges could charge at the discretion of their local boards. The Legislature could apply these options to all adult education students or continue to exempt those 18 years and younger.
Pay for the cost of assessments, supplies, and/or administrative services. Students would pay a fee to cover the cost of assessments, supplies, and other administrative services such as registration and identification cards. This could be a one-time fee charged to students upon their initial enrollment or a recurring fee charged to students at the beginning of each term. The fee would be the same regardless of the number of contact hours in which the student is enrolled for a given term.
Pay tuition per contact hour. Students would pay 10% of the tuition rate per contact hour established in law, which is currently only used for students who do not meet fee exemption requirements ($1.01 for residents).21 Using 10 cents per contact hour, the fee would result in a full-time adult education student (900 clock hours) paying approximately $90 over the course of a school year.22 Students could pay this amount in full when they enroll or could pay for blocks of clock hours over the course of the year.
Pay block tuition. Students would pay tuition and fees for adult basic, GED, adult high school, and ESOL courses not to exceed a specified amount annually, such as $50 or $100 per school year. The fee could be pro-rated for each term so that students would not have to pay the full amount at one time. The fee would be the same regardless of number of contact hours in which the student is enrolled for a given term or school year.
Pay tuition based on ability to pay. Tuition would vary by each student’s ability to pay, which could be determined by using the federal free and reduced lunch guidelines. Utah currently has a similar fee policy.23
Non-residents pay tuition. Students who can document that they are permanent Florida residents would pay no tuition (or a nominal amount using the contact hour or block tuition approaches described previously). Students who cannot document permanent residency would pay for the full cost of instruction. Some states
21 While fee-exempt students are not required to provide proof of
residency, s. 1009.22, F.S., provides that non-fee-exempt students who are not residents may be charged a higher tuition rate.
22 In the 2008-09 school year, adult education students completed an average of 192 contact hours, which would have cost each student an average of $19 if a 10% tuition rate had been charged.
23 Utah regulations provide that tuition and fees shall be charged for adult basic, GED preparation, adult high school, or ESOL courses in an amount not to exceed $100 annually per student based on the student's ability to pay as determined by federal free and reduced lunch guidelines. Student fees and tuition are determined by local school boards or community-based organizations’ boards of trustees.
OPPAGA Report Report No. 11-04
14
such as Utah have similar residency requirements for adult education students.
Pay second chance tuition. Students would be provided free academic instruction the first time they enrolled in an adult education program. However, students who left programs or were disenrolled because they met the state’s absentee policy threshold (six consecutive absences), would be charged tuition (contact hour or block) if they re-enrolled at a later date.
Agency Response ______ In accordance with the provisions of s. 11.51(5), Florida Statutes, a draft of our report was submitted to the Commissioner of the Florida Department of Education to review and respond. The department provided a draft of the report to the Adult and Community Educators of Florida, Inc. Their responses have been reproduced in Appendix D.
Report No. 11-04 OPPAGA Report
15
Appendix A
Methodology for Program Outcome Analyses To evaluate the performance of adult education programs, we analyzed student outcomes using 2007-08 student enrollment and completion data and wage data from four calendar years (2006 through 2009); we obtained these data from the Department of Education.1 Our analyses assessed whether students who left programs had received a high school credential or achieved documented learning gains, improved their employment situations, or transitioned into a postsecondary education program.
High school credential or documented learning gains. To account for variations in program length and how adult education programs are structured, we analyzed program completions by calculating the percentage of students who left in a given year having obtained a high school credential, made at least one documented learning gain, or not made any documented gains. We classified students as having left a program if the student could not be accounted for in the data for at least two consecutive academic terms.2
Employment and earnings. We calculated job placement rates and determined if students increased their earnings upon leaving a program. To take into account inflation over the four years we examined, we deflated all quarterly wage amounts to the first quarter of 2006 using the Consumer Price Index.3 We calculated annual earnings for both the time period prior to the student’s first academic record and the time period after the student left a program.4
Job Placement Rates: We identified the students who left programs after achieving some level of academic gain to calculate the percentage who had earnings equivalent to full-time employment. We classified individuals as working full time only if they had annual earnings above the minimum wage.5
Earnings: We compared the annual earnings for the adult students who left adult education programs and who had wage records both prior to an enrollment record and after leaving a program. To do so, we first calculated the percent change between the pre- and post-program earnings for each student. We next calculated the percentage of adult students who left who did not have any pre-program earnings but did have earnings after leaving a program.
Transition. We calculated the percentage of adult education students who were concurrently enrolled in a postsecondary career education program, or enrolled in one of these programs after leaving the adult education program.
1 We obtained student-level workforce data from the Department of Education’s Community College and Technical Center
Management Information System (CCTCMIS) and Workforce Development Information System (WDIS) and wage data from the Florida Education and Training Placement Information Program (FETPIP) office.
2 We omitted students from the analysis if they had not completed at least 12 instructional hours in a program. 3 We used the Consumer Price Index – All Urban Consumers, Not Seasonally Adjusted to adjust wages for inflation. 4 Because students had varying numbers of wage quarter data available both prior to and after programs, we annualized the average
quarterly wages for each student to derive the annual earnings for both time periods. 5 We excluded students who did not have a valid student identifier (proper length of a social security number) from the data, as they
could not be matched to employment records.
OPPAGA Report Report No. 11-04
16
Appendix B
Percentage of High School Students Co-enrolled in an Adult Education Program Varies by District
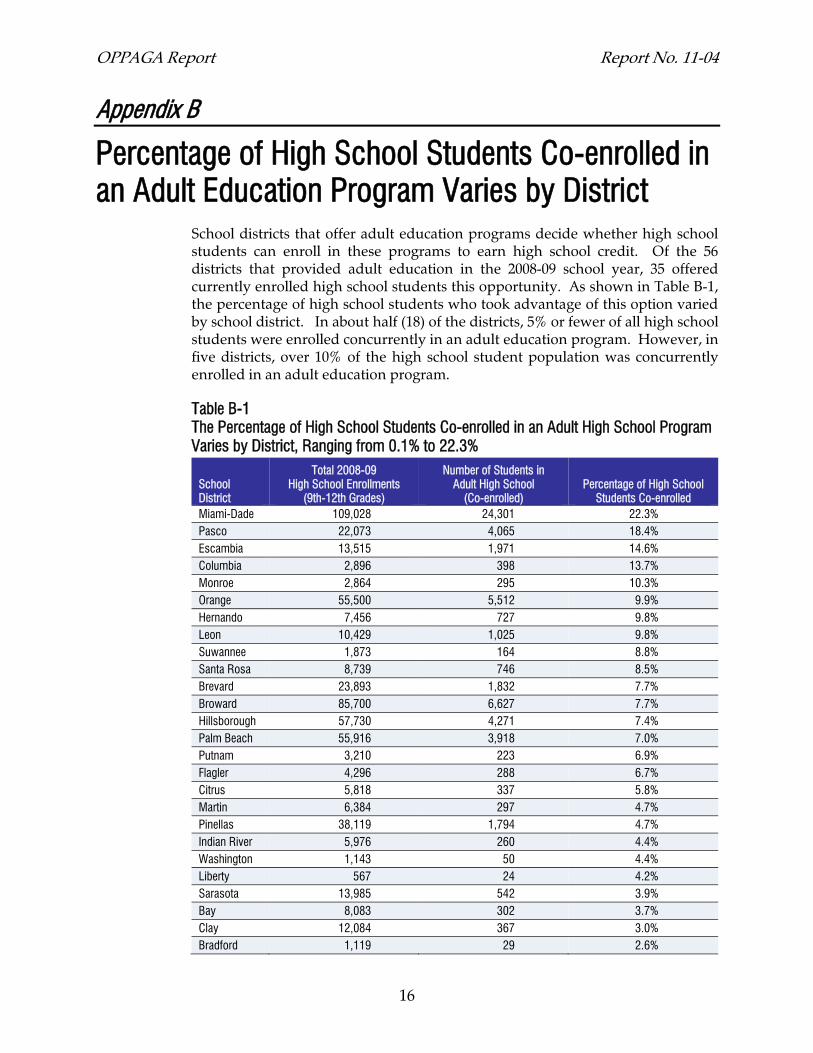
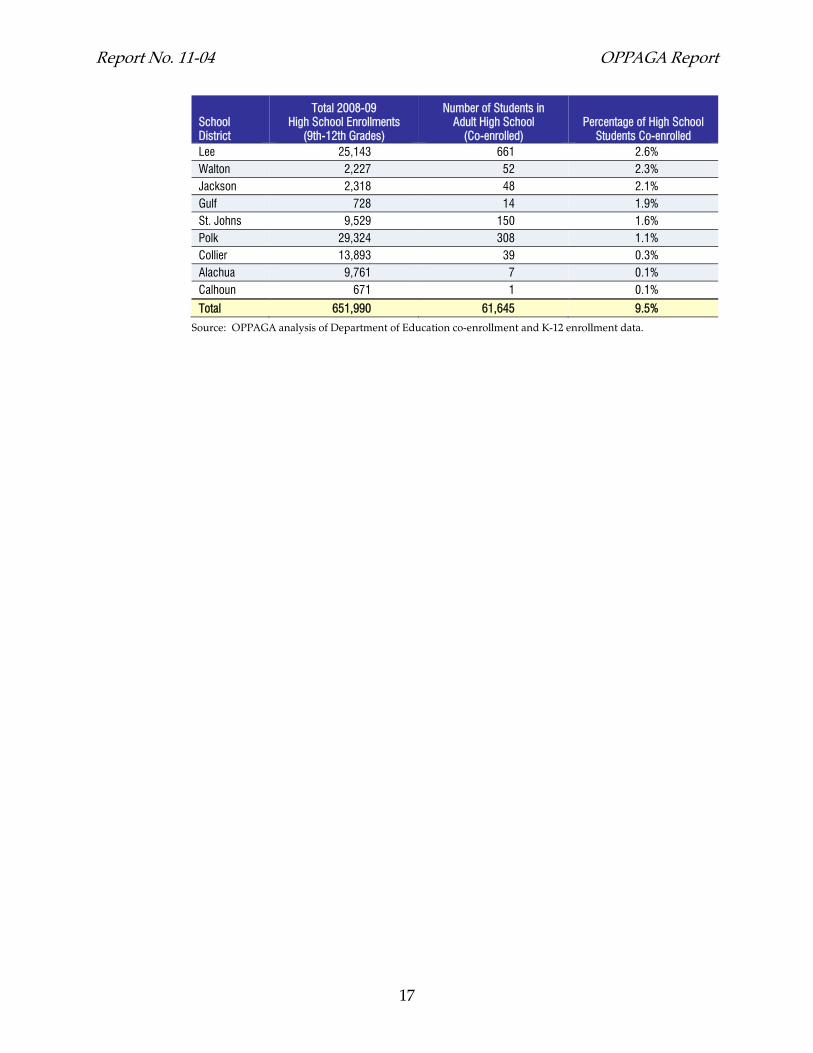
School districts that offer adult education programs decide whether high school students can enroll in these programs to earn high school credit. Of the 56 districts that provided adult education in the 2008-09 school year, 35 offered currently enrolled high school students this opportunity. As shown in Table B-1, the percentage of high school students who took advantage of this option varied by school district. In about half (18) of the districts, 5% or fewer of all high school students were enrolled concurrently in an adult education program. However, in five districts, over 10% of the high school student population was concurrently enrolled in an adult education program.
Table B-1 The Percentage of High School Students Co-enrolled in an Adult High School Program Varies by District, Ranging from 0.1% to 22.3%
School District
Total 2008-09 High School Enrollments
(9th-12th Grades)
Number of Students in Adult High School
(Co-enrolled) Percentage of High School
Students Co-enrolled Miami-Dade 109,028 24,301 22.3% Pasco 22,073 4,065 18.4% Escambia 13,515 1,971 14.6% Columbia 2,896 398 13.7% Monroe 2,864 295 10.3% Orange 55,500 5,512 9.9% Hernando 7,456 727 9.8% Leon 10,429 1,025 9.8% Suwannee 1,873 164 8.8% Santa Rosa 8,739 746 8.5% Brevard 23,893 1,832 7.7% Broward 85,700 6,627 7.7% Hillsborough 57,730 4,271 7.4% Palm Beach 55,916 3,918 7.0% Putnam 3,210 223 6.9% Flagler 4,296 288 6.7% Citrus 5,818 337 5.8% Martin 6,384 297 4.7% Pinellas 38,119 1,794 4.7% Indian River 5,976 260 4.4% Washington 1,143 50 4.4% Liberty 567 24 4.2% Sarasota 13,985 542 3.9% Bay 8,083 302 3.7% Clay 12,084 367 3.0% Bradford 1,119 29 2.6%
Report No. 11-04 OPPAGA Report
17
School District
Total 2008-09 High School Enrollments
(9th-12th Grades)
Number of Students in Adult High School
(Co-enrolled) Percentage of High School
Students Co-enrolled Lee 25,143 661 2.6% Walton 2,227 52 2.3% Jackson 2,318 48 2.1% Gulf 728 14 1.9% St. Johns 9,529 150 1.6% Polk 29,324 308 1.1% Collier 13,893 39 0.3% Alachua 9,761 7 0.1% Calhoun 671 1 0.1%
Total 651,990 61,645 9.5%
Source: OPPAGA analysis of Department of Education co-enrollment and K-12 enrollment data.
OPPAGA Report Report No. 11-04
18
Appendix C
Performance of Adult Education Dropout Prevention and Recovery Services Varies by Institution
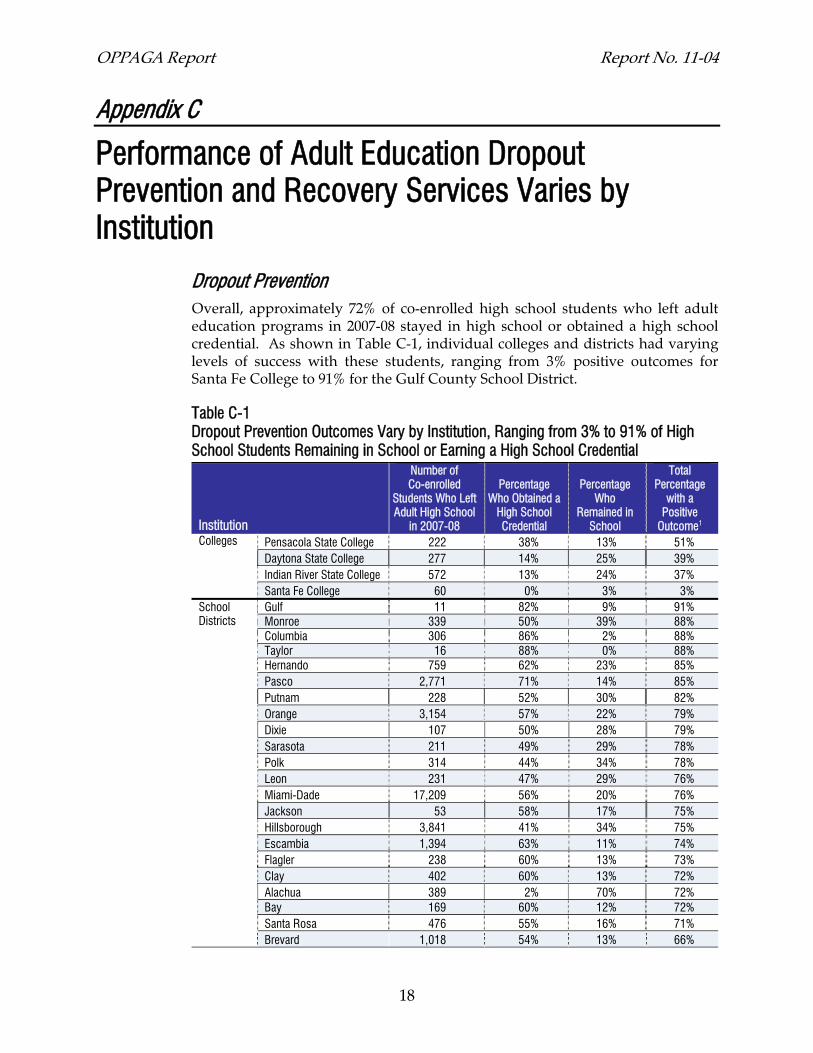
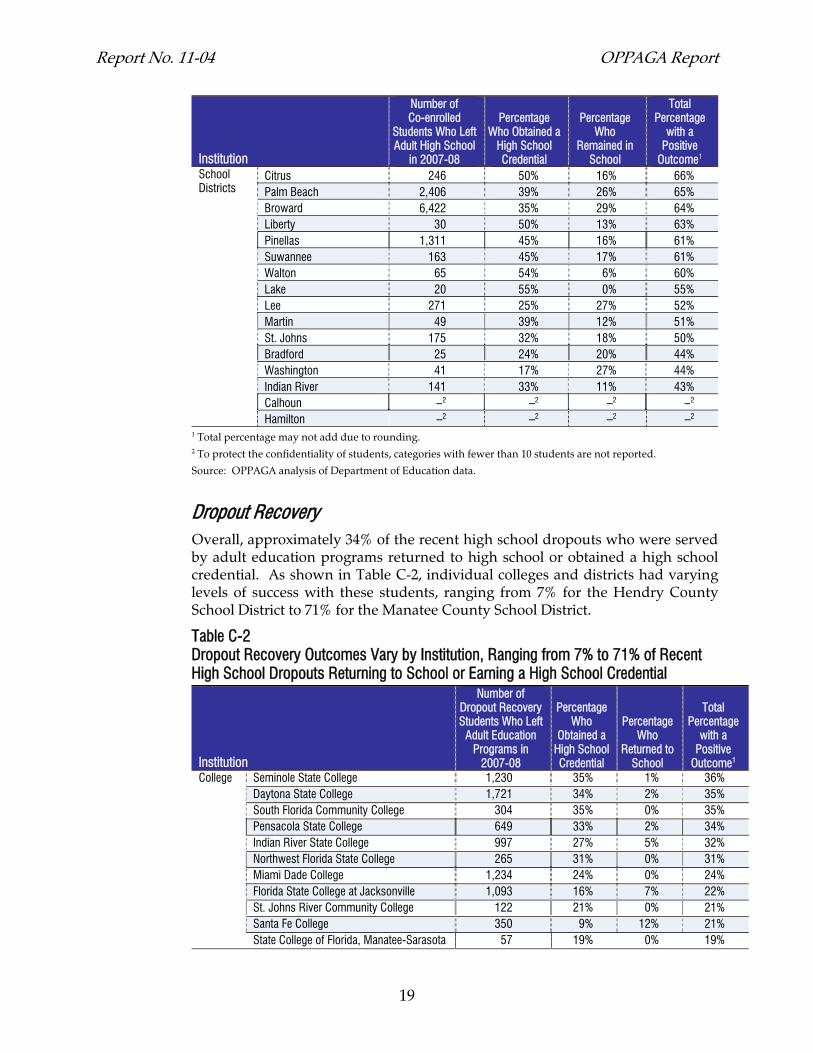
Dropout Prevention Overall, approximately 72% of co-enrolled high school students who left adult education programs in 2007-08 stayed in high school or obtained a high school credential. As shown in Table C-1, individual colleges and districts had varying levels of success with these students, ranging from 3% positive outcomes for Santa Fe College to 91% for the Gulf County School District.
Table C-1 Dropout Prevention Outcomes Vary by Institution, Ranging from 3% to 91% of High School Students Remaining in School or Earning a High School Credential
Institution
Number of Co-enrolled
Students Who Left Adult High School
in 2007-08
Percentage Who Obtained a
High School Credential
Percentage Who
Remained in School
Total Percentage
with a Positive
Outcome1 Colleges Pensacola State College 222 38% 13% 51%
Daytona State College 277 14% 25% 39% Indian River State College 572 13% 24% 37% Santa Fe College 60 0% 3% 3%
School Districts
Gulf 11 82% 9% 91% Monroe 339 50% 39% 88% Columbia 306 86% 2% 88% Taylor 16 88% 0% 88% Hernando 759 62% 23% 85% Pasco 2,771 71% 14% 85% Putnam 228 52% 30% 82% Orange 3,154 57% 22% 79% Dixie 107 50% 28% 79% Sarasota 211 49% 29% 78% Polk 314 44% 34% 78% Leon 231 47% 29% 76% Miami-Dade 17,209 56% 20% 76% Jackson 53 58% 17% 75% Hillsborough 3,841 41% 34% 75% Escambia 1,394 63% 11% 74% Flagler 238 60% 13% 73% Clay 402 60% 13% 72% Alachua 389 2% 70% 72% Bay 169 60% 12% 72% Santa Rosa 476 55% 16% 71% Brevard 1,018 54% 13% 66%
Report No. 11-04 OPPAGA Report
19
Institution
Number of Co-enrolled
Students Who Left Adult High School
in 2007-08
Percentage Who Obtained a
High School Credential
Percentage Who
Remained in School
Total Percentage
with a Positive
Outcome1 School Districts
Citrus 246 50% 16% 66% Palm Beach 2,406 39% 26% 65% Broward 6,422 35% 29% 64% Liberty 30 50% 13% 63% Pinellas 1,311 45% 16% 61% Suwannee 163 45% 17% 61% Walton 65 54% 6% 60% Lake 20 55% 0% 55% Lee 271 25% 27% 52% Martin 49 39% 12% 51% St. Johns 175 32% 18% 50% Bradford 25 24% 20% 44% Washington 41 17% 27% 44% Indian River 141 33% 11% 43% Calhoun –2 –2 –2 –2 Hamilton –2 –2 –2 –2
1 Total percentage may not add due to rounding. 2 To protect the confidentiality of students, categories with fewer than 10 students are not reported.
Source: OPPAGA analysis of Department of Education data.
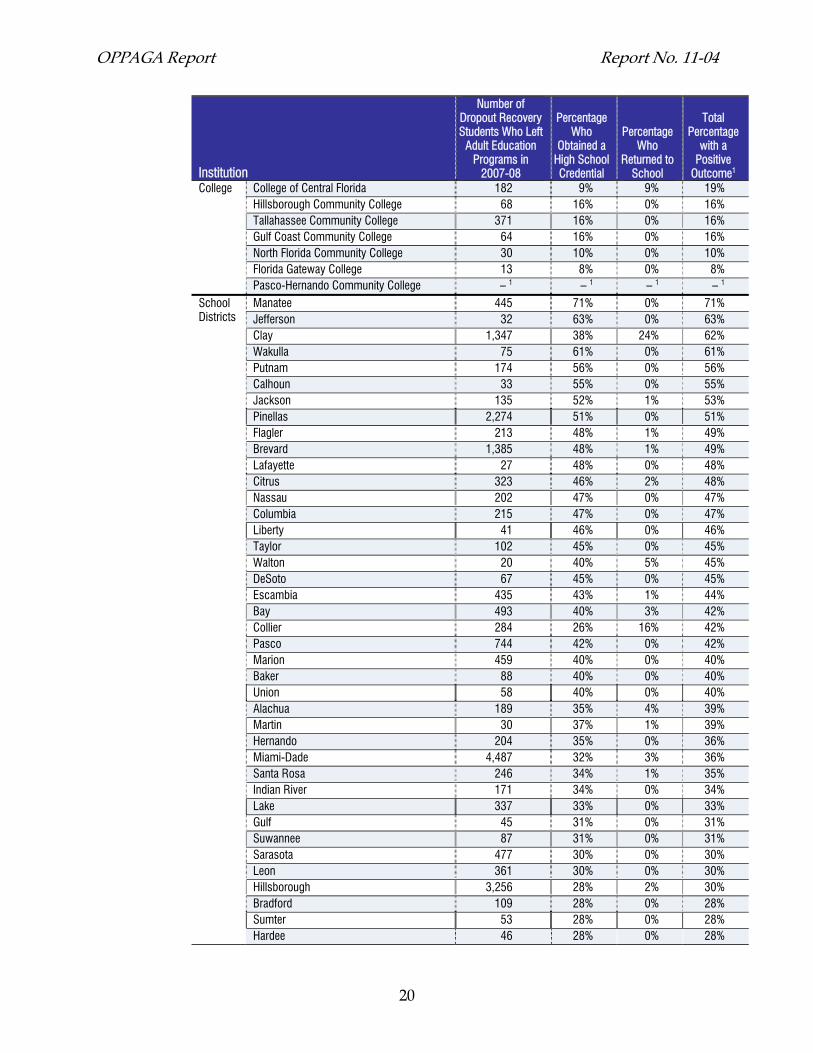
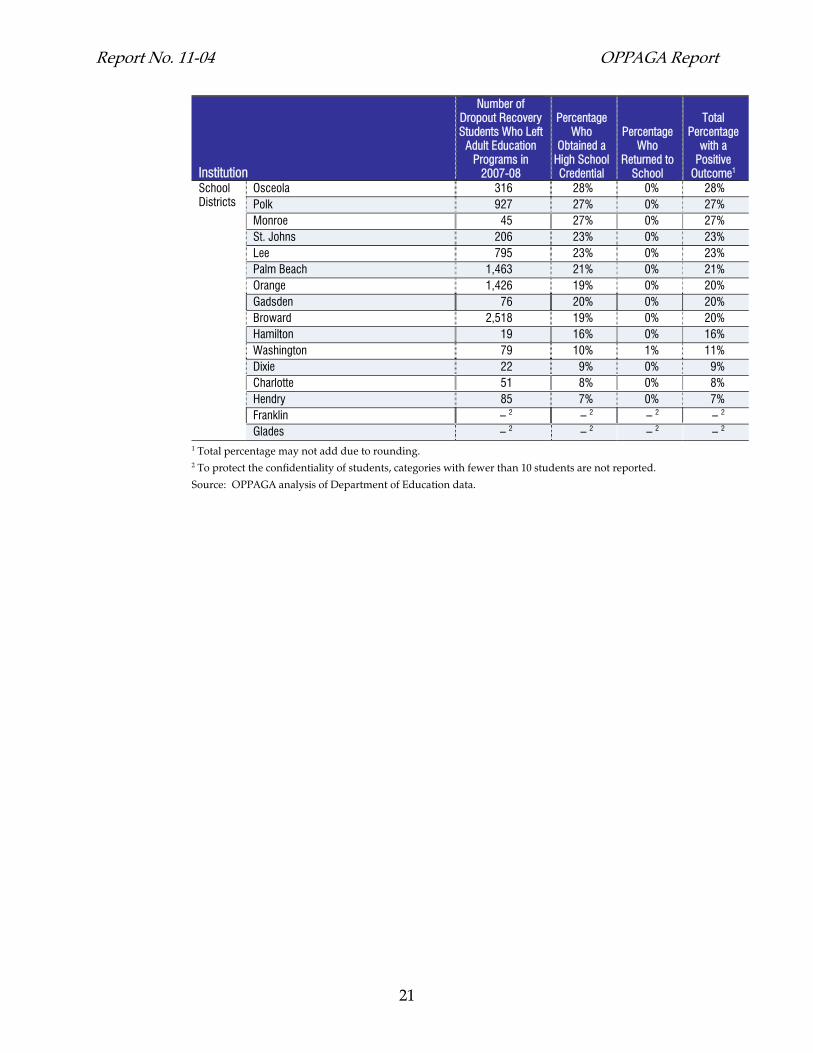
Dropout Recovery Overall, approximately 34% of the recent high school dropouts who were served by adult education programs returned to high school or obtained a high school credential. As shown in Table C-2, individual colleges and districts had varying levels of success with these students, ranging from 7% for the Hendry County School District to 71% for the Manatee County School District.
Table C-2 Dropout Recovery Outcomes Vary by Institution, Ranging from 7% to 71% of Recent High School Dropouts Returning to School or Earning a High School Credential
Institution
Number of Dropout Recovery Students Who Left
Adult Education Programs in
2007-08
Percentage Who
Obtained a High School Credential
Percentage Who
Returned to School
Total Percentage
with a Positive
Outcome1 College Seminole State College 1,230 35% 1% 36%
Daytona State College 1,721 34% 2% 35% South Florida Community College 304 35% 0% 35% Pensacola State College 649 33% 2% 34% Indian River State College 997 27% 5% 32% Northwest Florida State College 265 31% 0% 31% Miami Dade College 1,234 24% 0% 24% Florida State College at Jacksonville 1,093 16% 7% 22% St. Johns River Community College 122 21% 0% 21% Santa Fe College 350 9% 12% 21% State College of Florida, Manatee-Sarasota 57 19% 0% 19%
OPPAGA Report Report No. 11-04
20
Institution
Number of Dropout Recovery Students Who Left
Adult Education Programs in
2007-08
Percentage Who
Obtained a High School Credential
Percentage Who
Returned to School
Total Percentage
with a Positive
Outcome1 College College of Central Florida 182 9% 9% 19%
Hillsborough Community College 68 16% 0% 16% Tallahassee Community College 371 16% 0% 16% Gulf Coast Community College 64 16% 0% 16% North Florida Community College 30 10% 0% 10% Florida Gateway College 13 8% 0% 8% Pasco-Hernando Community College – 1 – 1 – 1 – 1
School Districts
Manatee 445 71% 0% 71% Jefferson 32 63% 0% 63% Clay 1,347 38% 24% 62% Wakulla 75 61% 0% 61% Putnam 174 56% 0% 56% Calhoun 33 55% 0% 55% Jackson 135 52% 1% 53% Pinellas 2,274 51% 0% 51% Flagler 213 48% 1% 49% Brevard 1,385 48% 1% 49% Lafayette 27 48% 0% 48% Citrus 323 46% 2% 48% Nassau 202 47% 0% 47% Columbia 215 47% 0% 47% Liberty 41 46% 0% 46% Taylor 102 45% 0% 45% Walton 20 40% 5% 45% DeSoto 67 45% 0% 45% Escambia 435 43% 1% 44% Bay 493 40% 3% 42% Collier 284 26% 16% 42% Pasco 744 42% 0% 42% Marion 459 40% 0% 40% Baker 88 40% 0% 40% Union 58 40% 0% 40% Alachua 189 35% 4% 39% Martin 30 37% 1% 39% Hernando 204 35% 0% 36% Miami-Dade 4,487 32% 3% 36% Santa Rosa 246 34% 1% 35% Indian River 171 34% 0% 34% Lake 337 33% 0% 33% Gulf 45 31% 0% 31% Suwannee 87 31% 0% 31% Sarasota 477 30% 0% 30% Leon 361 30% 0% 30% Hillsborough 3,256 28% 2% 30% Bradford 109 28% 0% 28% Sumter 53 28% 0% 28% Hardee 46 28% 0% 28%
Report No. 11-04 OPPAGA Report
21
Institution
Number of Dropout Recovery Students Who Left
Adult Education Programs in
2007-08
Percentage Who
Obtained a High School Credential
Percentage Who
Returned to School
Total Percentage
with a Positive
Outcome1 School Districts
Osceola 316 28% 0% 28% Polk 927 27% 0% 27% Monroe 45 27% 0% 27% St. Johns 206 23% 0% 23% Lee 795 23% 0% 23% Palm Beach 1,463 21% 0% 21% Orange 1,426 19% 0% 20% Gadsden 76 20% 0% 20% Broward 2,518 19% 0% 20% Hamilton 19 16% 0% 16% Washington 79 10% 1% 11% Dixie 22 9% 0% 9% Charlotte 51 8% 0% 8% Hendry 85 7% 0% 7% Franklin – 2 – 2 – 2 – 2 Glades – 2 – 2 – 2 – 2
1 Total percentage may not add due to rounding. 2 To protect the confidentiality of students, categories with fewer than 10 students are not reported.
Source: OPPAGA analysis of Department of Education data.

OPPAGA Report Report No. 11-04
22
Appendix D
Report No. 11-04 OPPAGA Report
23
OPPAGA Report Report No. 11-04
24
Report No. 11-04 OPPAGA Report
25
OPPAGA Report Report No. 11-04
26
Report No. 11-04 OPPAGA Report
27

The Florida Legislature
Office of Program Policy Analysis and Government Accountability
OPPAGA provides performance and accountability information about Florida government in several ways.
Reports deliver program evaluation and policy analysis to assist the Legislature in overseeing government operations, developing policy choices, and making Florida government better, faster, and cheaper.
PolicyCasts, short narrated slide presentations, provide bottom-line briefings of findings and recommendations for select reports.
Government Program Summaries (GPS), an online encyclopedia, www.oppaga.state.fl.us/government, provides descriptive, evaluative, and performance information on more than 200 Florida state government programs.
The Florida Monitor Weekly, an electronic newsletter, delivers brief announcements of research reports, conferences, and other resources of interest for Florida's policy research and program evaluation community.
Visit OPPAGA’s website at www.oppaga.state.fl.us
OPPAGA supports the Florida Legislature by providing data, evaluative research, and objective analyses that assist legislative budget and policy deliberations. This project was conducted in accordance with applicable evaluation standards. Copies of this report in print or alternate accessible format may be obtained by telephone (850/488-0021), by FAX (850/487-3804), in person, or by mail (OPPAGA Report Production, Claude Pepper Building, Room 312, 111 W. Madison St., Tallahassee, FL 32399-1475). Cover photo by Mark Foley.
OPPAGA website: www.oppaga.state.fl.us
Project conducted by Brian Underhill (850/410-4793) and Erika Morse (850/487-9219) Tim Elwell (850/487-9228), Staff Director, Education Policy Area
Kathy McGuire, OPPAGA Interim Director