Embed Size (px)
Citation preview
Complex Physiology and Compound Stress Responses duringFermentation of Alkali-Pretreated Corn Stover Hydrolysate by anEscherichia coli Ethanologen
Michael S. Schwalbach,a David H. Keating,a Mary Tremaine,a Wesley D. Marner,a* Yaoping Zhang,a William Bothfeld,a Alan Higbee,a
Jeffrey A. Grass,a,b Cameron Cotten,a,c Jennifer L. Reed,a,c Leonardo da Costa Sousa,d,g Mingjie Jin,d,g Venkatesh Balan,d,g
James Ellinger,a,b Bruce Dale,d,g Patricia J. Kiley,a,e and Robert Landicka,b,f
Great Lakes Bioenergy Research Center, Madison, Wisconsin, USAa; Department of Biochemistry, University of Wisconsin—Madison, Madison, Wisconsin, USAb;Department of Chemical and Biological Engineering, University of Wisconsin—Madison, Madison, Wisconsin, USAc; Department of Chemical Engineering and MaterialScience, Michigan State University, East Lansing, Michigan, USAd; Department of Biomolecular Chemistry, University of Wisconsin—Madison, Madison, Wisconsin, USAe;Department of Bacteriology, University of Wisconsin—Madison, Madison, Wisconsin, USAf; and Great Lakes Bioenergy Research Center, East Lansing, Michingan, USAg
The physiology of ethanologenic Escherichia coli grown anaerobically in alkali-pretreated plant hydrolysates is complex and notwell studied. To gain insight into how E. coli responds to such hydrolysates, we studied an E. coli K-12 ethanologen fermenting ahydrolysate prepared from corn stover pretreated by ammonia fiber expansion. Despite the high sugar content (�6% glucose,3% xylose) and relatively low toxicity of this hydrolysate, E. coli ceased growth long before glucose was depleted. Nevertheless,the cells remained metabolically active and continued conversion of glucose to ethanol until all glucose was consumed. Geneexpression profiling revealed complex and changing patterns of metabolic physiology and cellular stress responses during anexponential growth phase, a transition phase, and the glycolytically active stationary phase. During the exponential and transi-tion phases, high cell maintenance and stress response costs were mitigated, in part, by free amino acids available in the hydroly-sate. However, after the majority of amino acids were depleted, the cells entered stationary phase, and ATP derived from glucosefermentation was consumed entirely by the demands of cell maintenance in the hydrolysate. Comparative gene expression pro-filing and metabolic modeling of the ethanologen suggested that the high energetic cost of mitigating osmotic, lignotoxin, andethanol stress collectively limits growth, sugar utilization rates, and ethanol yields in alkali-pretreated lignocellulosichydrolysates.
Escherichia coli is among the best-understood microorganismsand a workhorse for biotechnology, yet its anaerobic physiol-
ogy in and cellular responses to the complex biomass hydrolysatesessential to exploitation of lignocellulosic materials as feedstocksfor conversion to chemicals and biofuels remain poorly under-stood. Conversion of sugars in lignocellulosic hydrolysates to eth-anol is a well-developed system with which these questions can bestudied (20, 43). Production of lignocellulosic hydrolysates typi-cally requires pretreatment with either an acid or a base, whichrelease different lignin derivatives into hydrolysates (31, 49, 50).We chose to investigate E. coli physiology during ethanologenesisin hydrolysates derived by alkaline pretreatment, specifically, am-monia fiber expansion (AFEX), because it yields a feedstock con-taining both C5 and C6 sugars and generates fewer lignin-derivedinhibitors of microbial growth (19, 81, 82). Furthermore, hydro-lysates prepared from AFEX-pretreated biomass, such as AFEX-pretreated corn stover hydrolysate (ACSH), are replete in nutri-ents and permissive to growth to the extent that engineered strainsof E. coli can consistently produce significant amounts of ethanolfrom glucose (49, 50, 60, 66).
E. coli is a particularly useful organism for design of strains toconvert lignocellulosic hydrolysates, because it can use the mostabundant hexoses and pentoses present in plant cell walls, andbecause its extensive study provides a wealth of assisting knowl-edge (44). The E. coli W-derived strain KO11, which contains aPET cassette, comprised of the Zymomonas mobilis pyruvate de-carboxylase (pdc) and alcohol dehydrogenase (adhB) genes, wasamong the first genetically engineered microbes designed for eth-
anol production (39, 64). Subsequent improvement of KO11 byplacing the PET cassette within an rRNA operon to increase Pdcand AdhB levels, additional pathway engineering, and directedevolution yielded robust E. coli ethanologens with improved eth-anol yields, broadened sugar utilization, and increased ethanoltolerance (31, 52, 88–90). Nonetheless, achieving efficient fer-mentation of concentrated hydrolysates by any microbial etha-nologen remains challenging for multiple reasons (59), includingthe high osmolarity of the medium (57, 67, 83), the presence oflignin derivatives resulting from pretreatment and enzymatic hy-drolysis (collectively known as lignotoxins) (93; X. Tang et al.,unpublished data), the energetic and regulatory challenges of pen-tose sugar fermentation (36), and the toxicity of the biofuelsthemselves (38, 46; D. H. Keating, M. Schwalbach, J. Peters, M.Tremaine, E. Pohlmann, F. Tran, J. Vinokur, A. Higbee, P. Kiley,and R. Landick, submitted for publication). Although many of
Received 26 October 2011 Accepted 22 February 2012
Published ahead of print 2 March 2012
Address correspondence to Robert Landick, [email protected], or DavidH. Keating, [email protected].
* Present address: Applikon Biotechnology, Inc., Foster City, California, USA.
Supplemental material for this article may be found at http://aem.asm.org/.
Copyright © 2012, American Society for Microbiology. All Rights Reserved.
doi:10.1128/AEM.07329-11
The authors have paid a fee to allow immediate free access to this article.
3442 aem.asm.org 0099-2240/12/$12.00 Applied and Environmental Microbiology p. 3442–3457
Dow
nloa
ded
from
http
s://j
ourn
als.
asm
.org
/jour
nal/a
em o
n 21
Dec
embe
r 20
21 b
y 17
9.21
5.83
.242
.
these inhibitory compounds have been examined individually orin combination in defined media (33, 50, 58, 65, 92), the molecu-lar mechanisms by which lignotoxins act in combination withother stresses induced in fermentations of alkali-pretreated hy-drolysates, including osmotic and ethanol stress, have not beenexamined. To understand the molecular responses of ethanolo-genic E. coli to alkali-pretreated lignocellulosic hydrolysates, westudied fermentation of ACSH by an E. coli K-12 strain engineeredfor efficient ethanol production. We compared changes in thecomposition of the growth medium to changes in the patterns ofgene expression during growth in ACSH and during an unusualgrowth-arrested state during which most ethanol production oc-curred. To understand the effect of high osmolarity and otherstresses associated with ACSH and to relate our findings to earlierstudies of E. coli K-12 (GenExpDB [http://genexpdb.ou.edu]), wecompared gene expression in ACSH to expression in a synthetichydrolysate (SynH) and in glucose minimal medium (GMM).These analyses provided insights into the combined demands oncellular energetics caused by stresses in an E. coli ethanologengrowing in ACSH.
MATERIALS AND METHODSStrain construction. An ethanologenic E. coli K-12 with the same ethanolpathway as the E. coli W ethanologen strain KO11 (64) was constructed byPCR amplification of the Z. mobilis PET cassette genes and flanking pflBsequence from KO11 and subsequent insertion into the pflB locus ofMG1655 using lambda Red-mediated recombination (91). This yieldedan insertion of pdc, adhB, and cat between nucleotides 396 and 400 of pflB(3 nucleotides [nt] of pflB were eliminated; pdc and adhB were in the sameorientation as pflB and thus transcribed from pflB promoters). To en-hance ethanol production, the lactate dehydrogenase (ldhA) and acetatekinase (ackA) genes responsible for the production of alternate fermenta-tion end products were deleted as previously described (6, 91), and anadditional copy of the PET cassette was constitutively expressed from thelow-copy-number plasmid pJGG2 (29). The resulting strain was identi-fied as GLBRCE1. Resequencing of GLBRCE1 by the Joint Genome Insti-tute confirmed the ldhA and ack deletions and the PET insertion in pflB. Inaddition, variant alleles of crl, ylbE, glpR, and gatC recently reported to bein many “wild-type” E coli strains (28) and single-nucleotide polymor-phisms in yodD and gltB were identified. Thus, the genotype of GLBRCE1relative to GenBank accession number U00096.2 is ldhA(4_969del3insFRT) ackA(4_1182del 3insFRT) pflB[395ins(pdcZmo adhBZmo cat)]crl(70insIS1) ylbE(253insG) gltB(G3384A) yodD(A85T) glpR(150delG)gatC(916insCC) pJGG2.
The nomenclature used here for the variant alleles is a modification ofthat described for human sequence variations (23). The first number inthe parenthesis specifies the nt position in the orf; ins and del specifyinsertions or deletions, respectively; the last element specifies the identityof the nt or genetic element (e.g., IS1) inserted or deleted. Substitutionsare indicated by, e.g., A85T to indicate that A at position 85 is changed toT. Although the changes to crl, ylbE, glpR, and gatC produced frameshiftsand the changes in gltB and yodD produced substitutions (Gly1062Ser andIle29Phe, respectively) and their impact was not specifically tested, wewould not expect that these variant alleles significantly affect the proper-ties of GLBRCE1 reported here.
Production of ACSH. AFEX pretreatment was adapted from a previ-ously described method (7). Corn stover (Pioneer 36H56) was oven driedat 60°C for �2 weeks, after which the material was passed through aChristy hammer mill (Christison Scientific LTD, Gateshead England)equipped with a 5-mm screen. The moisture content of the milled cornstover was raised to 60% by spraying with distilled water, and the materialwas loaded into a 5-gallon, high-pressure reactor (Parr Instrument Com-pany, Moline, IL). The reactor was charged with nitrogen gas (65 lb/in2).Liquid ammonia was then added (1:1 ammonia-biomass ratio on a dry-
weight basis). The reactor was heated to 100°C for 30 min, after which thepressure was rapidly released to allow the majority of the ammonia gas toescape. The resulting AFEX-treated biomass was transferred to plastictrays and allowed to stand overnight, allowing residual ammonia to evap-orate. The entire pretreatment process was performed in a walk-in fumehood.
For hydrolysis, AFEX-pretreated corn stover (�60 g glucan/liter;�18% solids, adjusted for moisture content) was suspended in deionizedwater to a final volume of 10 liters. The mixture was autoclaved for 30 min,cooled to 50°C, and adjusted to 50 mM phosphate using 1 M K-PO4, pH4.3. Hydrolysis was initiated by adding Genencor Accellerase 1500 to 15g/liter (cellulase, �2,500 U/g; �-galactosidase, �650 U/g), Genencor Ac-cellerase XY to 7.5 mg/ml (xylanase, �25,000 U/g), and Multifect pecti-nase (�155 U/g) to 7.5 g/liter. After 30 to 60 min, the mixture liquefiedand was then adjusted to pH 4.9 using 10 N HCl. Hydrolysis proceeded for7 days at 50°C, after which the remaining solids were removed by centrif-ugation (8,200 � g, 4°C, 10 to 12 h). The supernatant was filter sterilizedin series through 0.5-�m and 0.22-�m filters prior to storage at 4°C. Theresulting hydrolysate was used within 2 months. Prior to fermentation,the hydrolysate was adjusted to pH 7.0 using NaOH pellets and againfiltered through a 0.22-�m filter to remove precipitates and to ensuresterility.
ACSH and medium composition analysis. Samples for analysis ofculture supernatants were obtained by centrifugation (10,000 � g, 3 min,4°C) and filter sterilization through a 0.22-�m syringe filter. The elemen-tal composition of ACSH or culture supernatant was determined using aninductively coupled plasma mass spectrometer (PlasmaQuad PQ2 TurboPlus) at the UW-Madison Soils and Plant Analysis Lab (http://uwlab.soils.wisc.edu/madison). Carbohydrates in hydrolysate were quantified usinghigh performance liquid chromatography and refractive index detection(HPLC-RID), nuclear magnetic resonance (NMR) (see below), and gaschromatography-mass spectrometry (GC-MS) as previously described(2). ACSH osmolality was measured using a Wescor Vapro 5520 osmo-meter.
Amino acid concentrations were assayed at the Molecular StructureFacility laboratory located at University of California, Davis (http://msf.ucdavis.edu/). Two-milliliter supernatant samples were acidified withsulfosalicylic acid, stored overnight at �20°C, and then centrifuged(16,000 � g, 5 min, room temperature) to remove intact proteins. Thesupernatant was then mixed with a lithium citrate buffer diluent andspiked with S-(2-aminoethyl)-L-cysteine as an internal standard, andamino acids were assayed on a Hitachi L-8900 amino acid analyzer usingcommercial standards (Sigma) and the EZ-Chrom software package (Hi-tachi). Methionine, tryptophan, cysteine, and isoleucine were not reliablydetected in ACSH by this method.
Samples were prepared for NMR by addition of D2O (100 �l) contain-ing 6.6 mM 4,4-dimethyl-4-silapentane-1-sulfonic acid (DSS; chemicalshift standard) and 500 �M NaN3 (microbial growth inhibitor) to 570 �lof ACSH. The resulting solution was titrated with concentrated DCl orNaOD to pH 7.4. NMR analysis was conducted at the National MagneticResonance Facility at Madison on a Bruker Avance III spectrometer op-erating at 600 MHz for 1H and equipped with a triple-resonance (1H, 13C,15N, 2H lock) 1.7-mm cryogenic probe and an automated sample changer(SampleJet). The probe temperature was regulated at 298 K. The probewas tuned, matched, and locked to deuterium for the first sample. Sampleshimming and the optimal 90° pulse width calibration were determined inan automated fashion; automated shimming was not always sufficient,and manual shimming was carried out when needed. For each sample,data were collected as 1D 1H and 2D 1H-13C HSQC (heteronuclear single-quantum coherence) spectra, processed with NMRPipe (22), and ana-lyzed using rNMR (51). For metabolites quantified by 1D 1H, peak ampli-tudes were calibrated to DSS. For metabolites quantified by 2D 1H-13CHSQC, concentrations were calculated using calibration curves from me-tabolite standards.
Hydrolysate Stress in an E. coli Ethanologen
May 2012 Volume 78 Number 9 aem.asm.org 3443
Dow
nloa
ded
from
http
s://j
ourn
als.
asm
.org
/jour
nal/a
em o
n 21
Dec
embe
r 20
21 b
y 17
9.21
5.83
.242
.
Synthetic hydrolysate and minimal glucose medium. A synthetic hy-drolysate (SynH) was developed that approximated the composition ofACSH (see Table S1 in the supplemental material). D-Glucose (60 g/liter;330 mM) and D-xylose (30 g/liter; 200 mM) were added to a minimal saltssolution containing 64 mM KPO4 (pH 7.1), 30 mM NH4SO4, micronu-trients, and 100 �M (each) adenine, guanine, cytosine, and uracil (seeTable S1). Amino acids were added to approximately the concentrationsdetected in ACSH (see Table S1) plus 100 �M methionine, 250 �M iso-leucine, and 50 �M (each) tryptophan and cysteine (62). The resultingSynH was filter sterilized through a 0.22-�m membrane prior to use.Minimal M9 medium containing 10 g glucose/liter (GMM; 56 mM glu-cose) was prepared as described previously (62).
Fermentation conditions. Fermentations were conducted in 2-literglass vessels (Applikon Biotechnology) containing 1.2 liters of ACSH,GMM, or SynH. ACSH fermentations were conducted in duplicate;GMM and SynH fermentations were in triplicate. Prior to inoculation ofanaerobic fermentations, the growth medium was sparged with 95%N2–5% CO2 overnight, and gentamicin (Gent) was then added to 15�g/ml (to ensure retention of pJGG2). Inocula for ACSH fermentationswere prepared from single colonies grown on LB-Gent plates from frozenstocks by initial aerobic growth in LB-Gent to mid-log phase (opticaldensity at 600 nm [OD600], �0.3). Cells were diluted 10-fold into ACSH,grown overnight aerobically, transferred to fresh ACSH, grown anaerobi-cally, and then diluted in anaerobic ACSH fermentation vessels to a start-ing OD600 of 0.02 to 0.06. Inocula for fermentations in SynH or GMMwere prepared similarly, except that SynH-Gent or GMM-Gent was usedto dilute the initial LB-Gent culture and for subsequent steps. Fermenta-tions were conducted at 37°C with constant stirring (300 rpm) and sparg-ing (150 ml/min; 95% N2, 5% CO2); neutral pH (7.0) was maintained byautomated addition of 10 M NaOH. The apparent OD600 of cells diluted1:10 in water was determined using a Beckman Coulter DU720 spectro-photometer (1.3-mm slit width) in a 1-ml cuvette. Aerobic cultivation ofMG1655 in GMM was carried out in sparged Roux bottles (500 ml/min;69% N2, 30% O2, 1% CO2) inoculated with cultures grown aerobicallyovernight in GMM.
In amino acid supplementation experiments, amino acids were addedat final concentrations approximately three or eight times the amino acidconcentrations in ACSH. Supplementation experiments in ACSH wereconducted as single fermentations in Sartorius 500-ml fermentation ves-sels containing 300 ml of growth medium kept anaerobic as describedabove. Amino acid supplementation assays in SynH medium were con-ducted in duplicate in covered 2-ml, 96-well plates (Nunc U96) incubatedfor 48 h in an anaerobic chamber (sparged with 10% CO2, 10% H2, 80%N2) prior to measurement of apparent OD600 with a microtiter platereader (Tecan Infinite M200).
End product analysis. Samples (2 ml) for end product analysis werecollected throughout the fermentation. Cells were removed by centrifu-gation (10,000 � g, 4°C, 3 min), and the supernatant was stored at �80°Cprior to analysis. For each sample, glucose, xylose, glycerol, xylitol, suc-cinic acid, lactic acid, formic acid, acetic acid, and ethanol were separatedby high-performance liquid chromatography (HPLC) and subsequentlyquantified using refractive index detection (RID). HPLC-RID was con-ducted with an Agilent 1260 Infinity system (Agilent Technologies, PaloAlto, CA) equipped with an Aminex HPX-87H anion-exchange column,300 by 7.8 mm (Bio-Rad, Hercules, CA). Samples were diluted with 9volumes of H2O, injected into the HPLC-RID system (50-�l injectionvolume), and eluted isocratically with 0.02 N H2SO4 at a flow rate of 0.5ml/min (RID flow cell, 45°C; column, 50°C). Reference compounds(Fisher Scientific) were diluted in H2O and used to generate a standardcurve. Analyte concentrations were calculated using Chem Station soft-ware version B.04.03 (Agilent Technologies).
Intracellular ATP concentration. Cell samples (2 to 10 ml) were rap-idly trapped on a 0.44-�m nylon syringe filter (Millipore) using a 15-mlsyringe as described previously (4) and then extracted by pushing 2 mlacetonitrile-methanol-water (40:40:20), 0.1% formic acid through the fil-
ter into a 15-ml conical tube. The eluent was then pushed through the cellsa second time, flash-frozen in a dry ice-ethanol bath, and stored at �80°C.
The intracellular extract was fractionated by anion-exchange chroma-tography (first mobile phase, 0.5 mM NaOH; second mobile phase, 50mM NaOH; flow rate, 0.35 ml/min) using a Dionex IonPac AS-11HCcolumn (2 by 250 mm) and ASRS 300 ion suppressor coupled to an Agi-lent 6460 QQQ mass spectrometer operated in MRM (multiple reactionmonitoring) mode with negative-mode electrospray ionization (gas flow,11 liter/min, 300°C; nebulizer pressure, 45 lb/in2; sheath gas, 11 liters/min, 360°C; capillary at 3,500 V; nozzle at 1,000 V), as described previ-ously (84). The resulting peak area was integrated, and concentrations ofATP in the extracts were determined by comparison to a standard curve.These values were corrected using similarly extracted uninoculated me-dium and then converted to intracellular molarity assuming 109 cells/mlOD600 and a cell volume of 6.7 � 10�13 ml.
Transcriptomic analysis. Cells (10 ml) for transcriptomic analysiswere collected into tubes containing 1.25 ml ice-cold 5% (vol/vol) unbuf-fered phenol in ethanol (EP) and pelleted by centrifugation (10,000 � g,4°C, 3 min), as described previously (70). To remove residual traces ofhydrolysate, cell pellets were twice resuspended in ice-cold GMM plus0.125 volume of EP, repelleted, then flash frozen in dry ice-ethanol, andstored at �80°C. RNA was extracted from cell pellets as described previ-ously (70), analyzed by agarose gel electrophoresis to confirm integrity,quantified using a Nanodrop spectrophotometer (Thermo Scientific),and stored at �80°C.
Transcript levels were measured using custom gene expression mi-croarrays (Roche NimbleGen) that contained two copies of eight 70-ntsingle-stranded oligonucleotide probes for each E. coli open reading frameand for Z. mobilis pdc and adhB. Random hexamers and SuperScript dou-ble-stranded cDNA synthesis reagents (Invitrogen) were used to generatecDNA. Subsequent cDNA labeling and hybridization protocols were con-ducted according to the manufacturer’s instructions (Roche NimbleGen).Hybridized arrays were scanned with a NimbleGen MS 200 microarrayscanner, and the probe signal intensities were determined using Nimbl-eScan v 2.6 (Roche NimbleGen). Probe signal intensities were prepro-cessed using robust multichip averaging (RMA) (15, 40) in the programArrayStar (DNASTAR), and the resulting gene expression signals werequantile-normalized across all samples using the normalize.quantilesfunction in the Bioconductor package for R. Bioreplicates in the normal-ized data set were screened for a high degree of similarity (Pearson coef-ficient � 0.95) and dissimilar arrays were omitted from subsequent anal-yses. Significant expression changes were assigned to genes exhibiting a2-fold or greater change in signal intensity and a Benjamini-Hochberg-adjusted Student’s t test P value of �0.05 in a given pairwise comparison.For processed array data, see Table S6 in the supplemental material.
Metabolic modeling. The iJR904 E. coli metabolic model (67) wasused to estimate the minimal production of ATP consistent with the ob-served rates of growth, uptake, and secretion. Cells were assumed to be atsteady-state with no net accumulation of intracellular metabolites and tohave a mass of 2.14 g dry weight/liter per OD600 (10). To calculate the ATPproduction rates, reversible iJR904 reactions were split into forward andreverse reactions, and the rates of growth, carbohydrate uptake, and endproduct production were fixed to the observed values. The amount ofATP that is produced by the metabolic pathways was then determinedusing flux balance analysis (68), where the total production of ATP wasminimized using the reaction stoichiometry for ATP. Flux balance anal-ysis predicts fluxes through metabolic reactions, where the total produc-tion rate minus the consumption rate for each metabolite is set to zero. Influx balance analysis, the values for individual reactions are also con-strained using physiological rate measurements (e.g., uptake or growthrates).
Microarray database accession number. Array information and rawdata are available from the Gene Expression Omnibus (accession no.GSE35049).
Schwalbach et al.
3444 aem.asm.org Applied and Environmental Microbiology
Dow
nloa
ded
from
http
s://j
ourn
als.
asm
.org
/jour
nal/a
em o
n 21
Dec
embe
r 20
21 b
y 17
9.21
5.83
.242
.
RESULTS
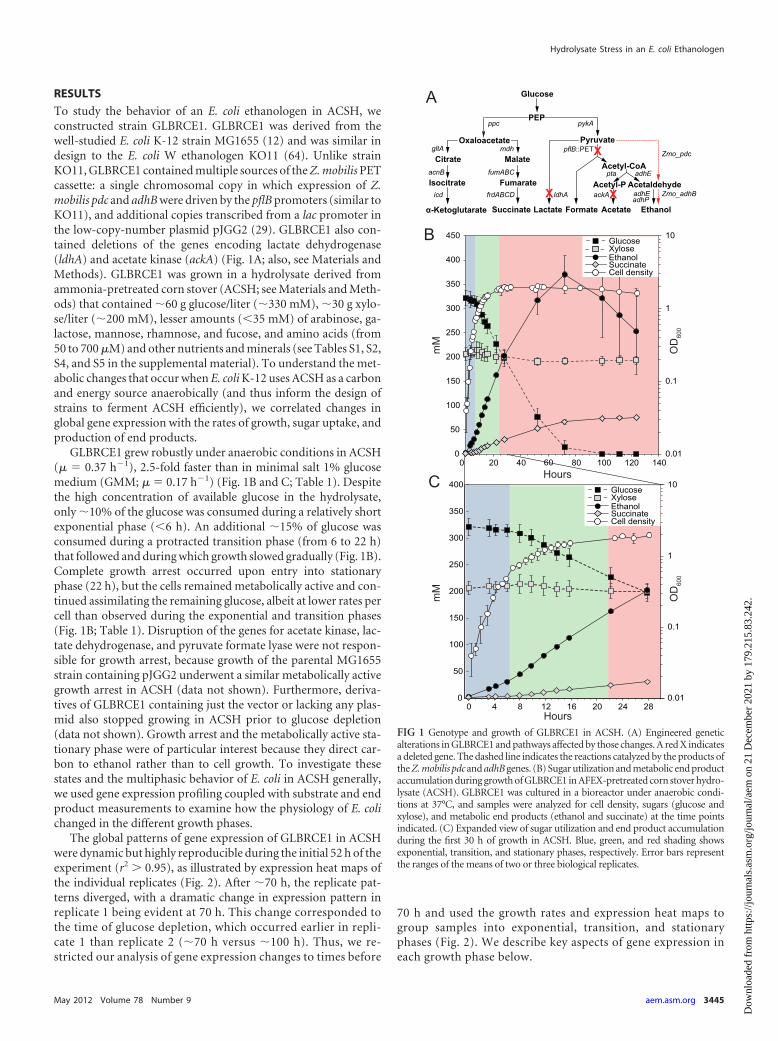
To study the behavior of an E. coli ethanologen in ACSH, weconstructed strain GLBRCE1. GLBRCE1 was derived from thewell-studied E. coli K-12 strain MG1655 (12) and was similar indesign to the E. coli W ethanologen KO11 (64). Unlike strainKO11, GLBRCE1 contained multiple sources of the Z. mobilis PETcassette: a single chromosomal copy in which expression of Z.mobilis pdc and adhB were driven by the pflB promoters (similar toKO11), and additional copies transcribed from a lac promoter inthe low-copy-number plasmid pJGG2 (29). GLBRCE1 also con-tained deletions of the genes encoding lactate dehydrogenase(ldhA) and acetate kinase (ackA) (Fig. 1A; also, see Materials andMethods). GLBRCE1 was grown in a hydrolysate derived fromammonia-pretreated corn stover (ACSH; see Materials and Meth-ods) that contained �60 g glucose/liter (�330 mM), �30 g xylo-se/liter (�200 mM), lesser amounts (�35 mM) of arabinose, ga-lactose, mannose, rhamnose, and fucose, and amino acids (from50 to 700 �M) and other nutrients and minerals (see Tables S1, S2,S4, and S5 in the supplemental material). To understand the met-abolic changes that occur when E. coli K-12 uses ACSH as a carbonand energy source anaerobically (and thus inform the design ofstrains to ferment ACSH efficiently), we correlated changes inglobal gene expression with the rates of growth, sugar uptake, andproduction of end products.
GLBRCE1 grew robustly under anaerobic conditions in ACSH(� � 0.37 h�1), 2.5-fold faster than in minimal salt 1% glucosemedium (GMM; � � 0.17 h�1) (Fig. 1B and C; Table 1). Despitethe high concentration of available glucose in the hydrolysate,only �10% of the glucose was consumed during a relatively shortexponential phase (�6 h). An additional �15% of glucose wasconsumed during a protracted transition phase (from 6 to 22 h)that followed and during which growth slowed gradually (Fig. 1B).Complete growth arrest occurred upon entry into stationaryphase (22 h), but the cells remained metabolically active and con-tinued assimilating the remaining glucose, albeit at lower rates percell than observed during the exponential and transition phases(Fig. 1B; Table 1). Disruption of the genes for acetate kinase, lac-tate dehydrogenase, and pyruvate formate lyase were not respon-sible for growth arrest, because growth of the parental MG1655strain containing pJGG2 underwent a similar metabolically activegrowth arrest in ACSH (data not shown). Furthermore, deriva-tives of GLBRCE1 containing just the vector or lacking any plas-mid also stopped growing in ACSH prior to glucose depletion(data not shown). Growth arrest and the metabolically active sta-tionary phase were of particular interest because they direct car-bon to ethanol rather than to cell growth. To investigate thesestates and the multiphasic behavior of E. coli in ACSH generally,we used gene expression profiling coupled with substrate and endproduct measurements to examine how the physiology of E. colichanged in the different growth phases.
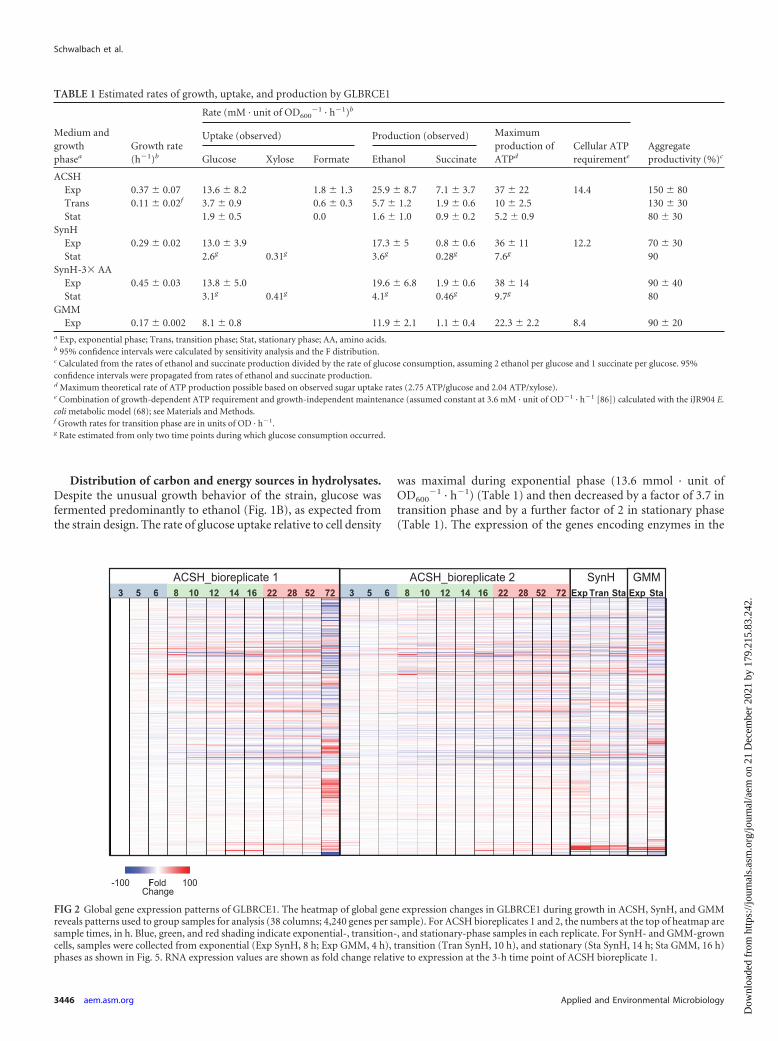
The global patterns of gene expression of GLBRCE1 in ACSHwere dynamic but highly reproducible during the initial 52 h of theexperiment (r2 � 0.95), as illustrated by expression heat maps ofthe individual replicates (Fig. 2). After �70 h, the replicate pat-terns diverged, with a dramatic change in expression pattern inreplicate 1 being evident at 70 h. This change corresponded tothe time of glucose depletion, which occurred earlier in repli-cate 1 than replicate 2 (�70 h versus �100 h). Thus, we re-stricted our analysis of gene expression changes to times before
70 h and used the growth rates and expression heat maps togroup samples into exponential, transition, and stationaryphases (Fig. 2). We describe key aspects of gene expression ineach growth phase below.
FIG 1 Genotype and growth of GLBRCE1 in ACSH. (A) Engineered geneticalterations in GLBRCE1 and pathways affected by those changes. A red X indicatesa deleted gene. The dashed line indicates the reactions catalyzed by the products ofthe Z. mobilis pdc and adhB genes. (B) Sugar utilization and metabolic end productaccumulation during growth of GLBRCE1 in AFEX-pretreated corn stover hydro-lysate (ACSH). GLBRCE1 was cultured in a bioreactor under anaerobic condi-tions at 37°C, and samples were analyzed for cell density, sugars (glucose andxylose), and metabolic end products (ethanol and succinate) at the time pointsindicated. (C) Expanded view of sugar utilization and end product accumulationduring the first 30 h of growth in ACSH. Blue, green, and red shading showsexponential, transition, and stationary phases, respectively. Error bars representthe ranges of the means of two or three biological replicates.
Hydrolysate Stress in an E. coli Ethanologen
May 2012 Volume 78 Number 9 aem.asm.org 3445
Dow
nloa
ded
from
http
s://j
ourn
als.
asm
.org
/jour
nal/a
em o
n 21
Dec
embe
r 20
21 b
y 17
9.21
5.83
.242
.
Distribution of carbon and energy sources in hydrolysates.Despite the unusual growth behavior of the strain, glucose wasfermented predominantly to ethanol (Fig. 1B), as expected fromthe strain design. The rate of glucose uptake relative to cell density
was maximal during exponential phase (13.6 mmol · unit ofOD600
�1 · h�1) (Table 1) and then decreased by a factor of 3.7 intransition phase and by a further factor of 2 in stationary phase(Table 1). The expression of the genes encoding enzymes in the
TABLE 1 Estimated rates of growth, uptake, and production by GLBRCE1
Medium andgrowthphasea
Growth rate(h�1)b
Rate (mM · unit of OD600�1 · h�1)b
Aggregateproductivity (%)c
Uptake (observed) Production (observed) Maximumproduction ofATPd
Cellular ATPrequirementeGlucose Xylose Formate Ethanol Succinate
ACSHExp 0.37 � 0.07 13.6 � 8.2 1.8 � 1.3 25.9 � 8.7 7.1 � 3.7 37 � 22 14.4 150 � 80Trans 0.11 � 0.02f 3.7 � 0.9 0.6 � 0.3 5.7 � 1.2 1.9 � 0.6 10 � 2.5 130 � 30Stat 1.9 � 0.5 0.0 1.6 � 1.0 0.9 � 0.2 5.2 � 0.9 80 � 30
SynHExp 0.29 � 0.02 13.0 � 3.9 17.3 � 5 0.8 � 0.6 36 � 11 12.2 70 � 30Stat 2.6g 0.31g 3.6g 0.28g 7.6g 90
SynH-3� AAExp 0.45 � 0.03 13.8 � 5.0 19.6 � 6.8 1.9 � 0.6 38 � 14 90 � 40Stat 3.1g 0.41g 4.1g 0.46g 9.7g 80
GMMExp 0.17 � 0.002 8.1 � 0.8 11.9 � 2.1 1.1 � 0.4 22.3 � 2.2 8.4 90 � 20
a Exp, exponential phase; Trans, transition phase; Stat, stationary phase; AA, amino acids.b 95% confidence intervals were calculated by sensitivity analysis and the F distribution.c Calculated from the rates of ethanol and succinate production divided by the rate of glucose consumption, assuming 2 ethanol per glucose and 1 succinate per glucose. 95%confidence intervals were propagated from rates of ethanol and succinate production.d Maximum theoretical rate of ATP production possible based on observed sugar uptake rates (2.75 ATP/glucose and 2.04 ATP/xylose).e Combination of growth-dependent ATP requirement and growth-independent maintenance (assumed constant at 3.6 mM · unit of OD�1 · h�1 [86]) calculated with the iJR904 E.coli metabolic model (68); see Materials and Methods.f Growth rates for transition phase are in units of OD · h�1.g Rate estimated from only two time points during which glucose consumption occurred.
F
FIG 2 Global gene expression patterns of GLBRCE1. The heatmap of global gene expression changes in GLBRCE1 during growth in ACSH, SynH, and GMMreveals patterns used to group samples for analysis (38 columns; 4,240 genes per sample). For ACSH bioreplicates 1 and 2, the numbers at the top of heatmap aresample times, in h. Blue, green, and red shading indicate exponential-, transition-, and stationary-phase samples in each replicate. For SynH- and GMM-growncells, samples were collected from exponential (Exp SynH, 8 h; Exp GMM, 4 h), transition (Tran SynH, 10 h), and stationary (Sta SynH, 14 h; Sta GMM, 16 h)phases as shown in Fig. 5. RNA expression values are shown as fold change relative to expression at the 3-h time point of ACSH bioreplicate 1.
Schwalbach et al.
3446 aem.asm.org Applied and Environmental Microbiology
Dow
nloa
ded
from
http
s://j
ourn
als.
asm
.org
/jour
nal/a
em o
n 21
Dec
embe
r 20
21 b
y 17
9.21
5.83
.242
.
glycolytic pathway and glucose transporters remained relativelyhigh through the transition and stationary phases (see Fig. S3A inthe supplemental material). The rate of ethanol production wasgenerally correlated with glucose consumption, showing a highrate of production during exponential phase and a reduced rateduring the transition and stationary phases even though transcriptprofiling indicated that expression of the PET cassette genes pdcand adhB remained high throughout (see Fig. S3A). Overall netethanol yield was 58 to 67% of the theoretical maximum, but thismeasure underestimated actual ethanol production, becausesome ethanol evaporated during fermentation. Ethanol evapora-tion at �2 mM h�1 was evident after glucose depletion (Fig. 1A);this estimate was verified by detection of similar ethanol evapora-tion from uninoculated, identically sparged bioreactors contain-ing 5% ethanol (data not shown).
Although glucose was ultimately consumed in its entirety, onlya small amount of xylose was consumed over the course of theexperiment (�10%) (Fig. 1B; also, see Tables S4 and S5 in thesupplemental material). This result is expected with the GLBRCE1design, which was not optimized for xylose utilization, and wasconsistent with the observed low expression of xylose utilizationgenes (xylE, xylFGH, and xylAB) (Table 2; also, see Fig S3B in thesupplemental material). Low expression of xylose genes likely re-flected repression by arabinose-bound AraC (24), since ACSHcontains 33 mM arabinose (see Table S1 in the supplemental ma-terial). Further, inducer exclusion by PtsG activated by glucosetransport may also limit xylose uptake. Lesser amounts of man-nose, fructose, galactose, and arabinose were also present in hy-drolysate and represented minor pathways of carbon utilization(see Tables S1 and S5 in the supplemental material). Other poten-tial substrates, such as acetate and glycerol, were not utilized ascarbon sources by the ethanologen (see Tables S4 and S5 in thesupplemental material).
Small amounts of the anaerobic respiratory substrate formate(11 mM) and the electron acceptor nitrate (�270 �M) were alsopresent in ACSH (see Tables S1 and S2 in the supplemental mate-rial) but were rapidly consumed in exponential phase; thesechanges suggested that some anaerobic respiration occurred dur-
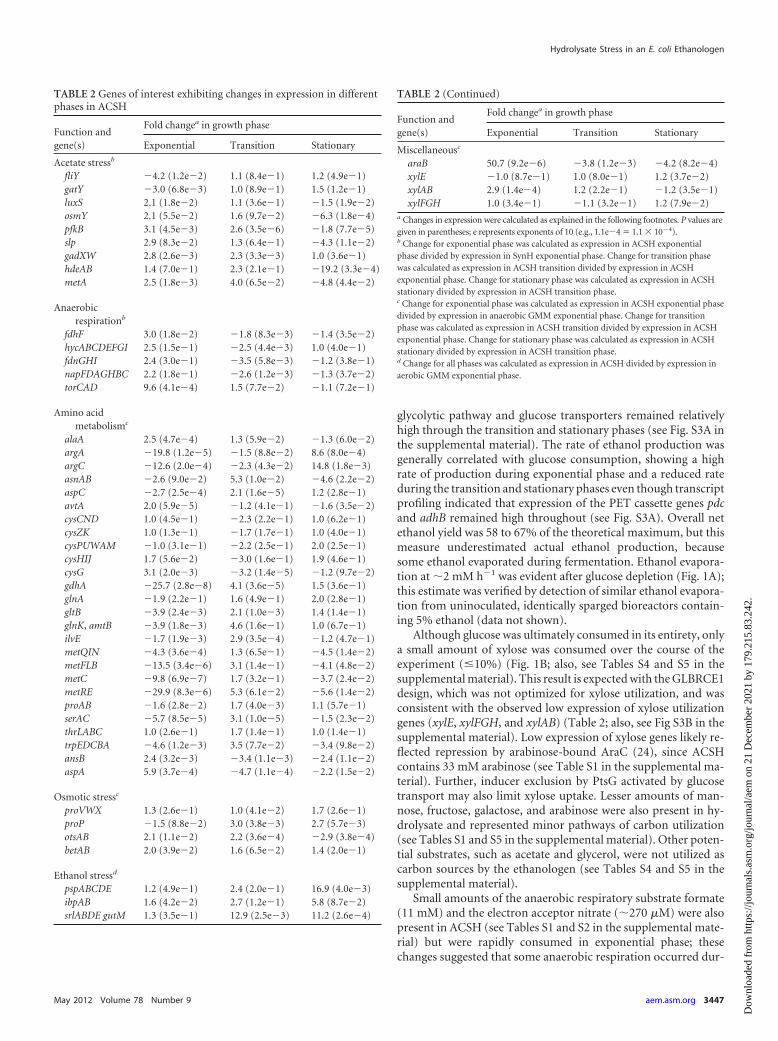
TABLE 2 Genes of interest exhibiting changes in expression in differentphases in ACSH
Function andgene(s)
Fold changea in growth phase
Exponential Transition Stationary
Acetate stressb
fliY �4.2 (1.2e�2) 1.1 (8.4e�1) 1.2 (4.9e�1)gatY �3.0 (6.8e�3) 1.0 (8.9e�1) 1.5 (1.2e�1)luxS 2.1 (1.8e�2) 1.1 (3.6e�1) �1.5 (1.9e�2)osmY 2.1 (5.5e�2) 1.6 (9.7e�2) �6.3 (1.8e�4)pfkB 3.1 (4.5e�3) 2.6 (3.5e�6) �1.8 (7.7e�5)slp 2.9 (8.3e�2) 1.3 (6.4e�1) �4.3 (1.1e�2)gadXW 2.8 (2.6e�3) 2.3 (3.3e�3) 1.0 (3.6e�1)hdeAB 1.4 (7.0e�1) 2.3 (2.1e�1) �19.2 (3.3e�4)metA 2.5 (1.8e�3) 4.0 (6.5e�2) �4.8 (4.4e�2)
Anaerobicrespirationb
fdhF 3.0 (1.8e�2) �1.8 (8.3e�3) �1.4 (3.5e�2)hycABCDEFGI 2.5 (1.5e�1) �2.5 (4.4e�3) 1.0 (4.0e�1)fdnGHI 2.4 (3.0e�1) �3.5 (5.8e�3) �1.2 (3.8e�1)napFDAGHBC 2.2 (1.8e�1) �2.6 (1.2e�3) �1.3 (3.7e�2)torCAD 9.6 (4.1e�4) 1.5 (7.7e�2) �1.1 (7.2e�1)
Amino acidmetabolismc
alaA 2.5 (4.7e�4) 1.3 (5.9e�2) �1.3 (6.0e�2)argA �19.8 (1.2e�5) �1.5 (8.8e�2) 8.6 (8.0e�4)argC �12.6 (2.0e�4) �2.3 (4.3e�2) 14.8 (1.8e�3)asnAB �2.6 (9.0e�2) 5.3 (1.0e�2) �4.6 (2.2e�2)aspC �2.7 (2.5e�4) 2.1 (1.6e�5) 1.2 (2.8e�1)avtA 2.0 (5.9e�5) �1.2 (4.1e�1) �1.6 (3.5e�2)cysCND 1.0 (4.5e�1) �2.3 (2.2e�1) 1.0 (6.2e�1)cysZK 1.0 (1.3e�1) �1.7 (1.7e�1) 1.0 (4.0e�1)cysPUWAM �1.0 (3.1e�1) �2.2 (2.5e�1) 2.0 (2.5e�1)cysHIJ 1.7 (5.6e�2) �3.0 (1.6e�1) 1.9 (4.6e�1)cysG 3.1 (2.0e�3) �3.2 (1.4e�5) �1.2 (9.7e�2)gdhA �25.7 (2.8e�8) 4.1 (3.6e�5) 1.5 (3.6e�1)glnA �1.9 (2.2e�1) 1.6 (4.9e�1) 2.0 (2.8e�1)gltB �3.9 (2.4e�3) 2.1 (1.0e�3) 1.4 (1.4e�1)glnK, amtB �3.9 (1.8e�3) 4.6 (1.6e�1) 1.0 (6.7e�1)ilvE �1.7 (1.9e�3) 2.9 (3.5e�4) �1.2 (4.7e�1)metQIN �4.3 (3.6e�4) 1.3 (6.5e�1) �4.5 (1.4e�2)metFLB �13.5 (3.4e�6) 3.1 (1.4e�1) �4.1 (4.8e�2)metC �9.8 (6.9e�7) 1.7 (3.2e�1) �3.7 (2.4e�2)metRE �29.9 (8.3e�6) 5.3 (6.1e�2) �5.6 (1.4e�2)proAB �1.6 (2.8e�2) 1.7 (4.0e�3) 1.1 (5.7e�1)serAC �5.7 (8.5e�5) 3.1 (1.0e�5) �1.5 (2.3e�2)thrLABC 1.0 (2.6e�1) 1.7 (1.4e�1) 1.0 (1.4e�1)trpEDCBA �4.6 (1.2e�3) 3.5 (7.7e�2) �3.4 (9.8e�2)ansB 2.4 (3.2e�3) �3.4 (1.1e�3) �2.4 (1.1e�2)aspA 5.9 (3.7e�4) �4.7 (1.1e�4) �2.2 (1.5e�2)
Osmotic stressc
proVWX 1.3 (2.6e�1) 1.0 (4.1e�2) 1.7 (2.6e�1)proP �1.5 (8.8e�2) 3.0 (3.8e�3) 2.7 (5.7e�3)otsAB 2.1 (1.1e�2) 2.2 (3.6e�4) �2.9 (3.8e�4)betAB 2.0 (3.9e�2) 1.6 (6.5e�2) 1.4 (2.0e�1)
Ethanol stressd
pspABCDE 1.2 (4.9e�1) 2.4 (2.0e�1) 16.9 (4.0e�3)ibpAB 1.6 (4.2e�2) 2.7 (1.2e�1) 5.8 (8.7e�2)srlABDE gutM 1.3 (3.5e�1) 12.9 (2.5e�3) 11.2 (2.6e�4)
TABLE 2 (Continued)
Function andgene(s)
Fold changea in growth phase
Exponential Transition Stationary
Miscellaneousc
araB 50.7 (9.2e�6) �3.8 (1.2e�3) �4.2 (8.2e�4)xylE �1.0 (8.7e�1) 1.0 (8.0e�1) 1.2 (3.7e�2)xylAB 2.9 (1.4e�4) 1.2 (2.2e�1) �1.2 (3.5e�1)xylFGH 1.0 (3.4e�1) �1.1 (3.2e�1) 1.2 (7.9e�2)
a Changes in expression were calculated as explained in the following footnotes. P values aregiven in parentheses; e represents exponents of 10 (e.g., 1.1e�4 � 1.1 � 10�4).b Change for exponential phase was calculated as expression in ACSH exponentialphase divided by expression in SynH exponential phase. Change for transition phasewas calculated as expression in ACSH transition divided by expression in ACSHexponential phase. Change for stationary phase was calculated as expression in ACSHstationary divided by expression in ACSH transition phase.c Change for exponential phase was calculated as expression in ACSH exponential phasedivided by expression in anaerobic GMM exponential phase. Change for transitionphase was calculated as expression in ACSH transition divided by expression in ACSHexponential phase. Change for stationary phase was calculated as expression in ACSHstationary divided by expression in ACSH transition phase.d Change for all phases was calculated as expression in ACSH divided by expression inaerobic GMM exponential phase.
Hydrolysate Stress in an E. coli Ethanologen
May 2012 Volume 78 Number 9 aem.asm.org 3447
Dow
nloa
ded
from
http
s://j
ourn
als.
asm
.org
/jour
nal/a
em o
n 21
Dec
embe
r 20
21 b
y 17
9.21
5.83
.242
.
ing initial cell growth. In accordance with the rapid loss of nitratefrom the medium and the known nitrate-dependent expression ofnapFDAGHBC and fdnGHI (encoding the Nap periplasmic ni-trate reductase and formate dehydrogenase-N, respectively), ex-pression of these operons decreased 2- to 4-fold as cells enteredtransition phase (Table 2). It is unlikely that this limited anaerobicrespiration contributed significantly to total ATP synthesis duringthe exponential phase, because glucose uptake rates were �7-foldgreater than formate uptake rates (Table 1), and there was insuf-ficient nitrate present to respire all of the formate. Rather, wehypothesize that most formate was likely oxidized to CO2 and H2
via formate hydrogenlyase, consistent with maximal expression ofthe genes (fdhF and hycABCDEFGI) encoding these enzymes earlyin exponential phase (Table 2; also, see Table S6 in the supplemen-tal material). Expression of genes encoding trimethylamine N-ox-ide reductase [torCAD; specifically inducible by trimethylamineN-oxide (8)] was highly upregulated compared to GMM-growncells throughout all growth phases (Table 2; also, see Table S6 inthe supplemental material), suggesting that the electron acceptortrimethylamine N-oxide is also present in ACSH.
In addition to ethanol, the other significant and expected endproduct of ACSH fermentation by GLBRCE1 was succinate (Fig.1), which accumulated to 62 to 76 mM (see Tables S4 and S5 in thesupplemental material). During anaerobic growth, succinate isproduced from oxaloacetate (OAA) by reversal of carbon fluxthrough the tricarboxylic acid (TCA) cycle (Fig. 1A) (37, 64).However, not all the succinate appeared to derive from glucose,because the aggregate rates of ethanol and succinate productionduring exponential and stationary phases exceeded what could betheoretically produced based only on the glucose uptake rate (Ta-ble 1). We investigated this question by testing specific gene dele-tions and found that, even though deletion of frdA eliminatedsuccinate production, deletion of ppc, which encodes the phos-phoenolpyruvate (PEP) carboxylase responsible for convertingPEP to oxaloacetate (Fig. 1A), eliminated only 50% of succinateproduction (data not shown). This result confirmed the idea thatcells must utilize another succinate precursor in ACSH. Althougha possible source would be aspartate or asparagine, which can bedeaminated to oxaloacetate or fumarate, neither was present at ahigh enough concentration to contribute significantly to succinateproduction (Fig. 3C; also, see Table S1 in the supplemental mate-rial). An alternative source of succinate could be malate, whichwas present at 9 mM in ACSH and consumed (see Table S5 in thesupplemental material). Additionally, citrate was a likely succinateprecursor, based on the exceptionally high expression of the cit-rate-inducible citCDEFXG operon, which encodes citrate lyase(Fig. 4A; Table 3). Although difficult to quantify, citrate was de-tectable in ACSH (data not shown). We conclude that succinatewas derived both from glucose and from alternate carbon sources,like malate and citrate, present in ACSH.
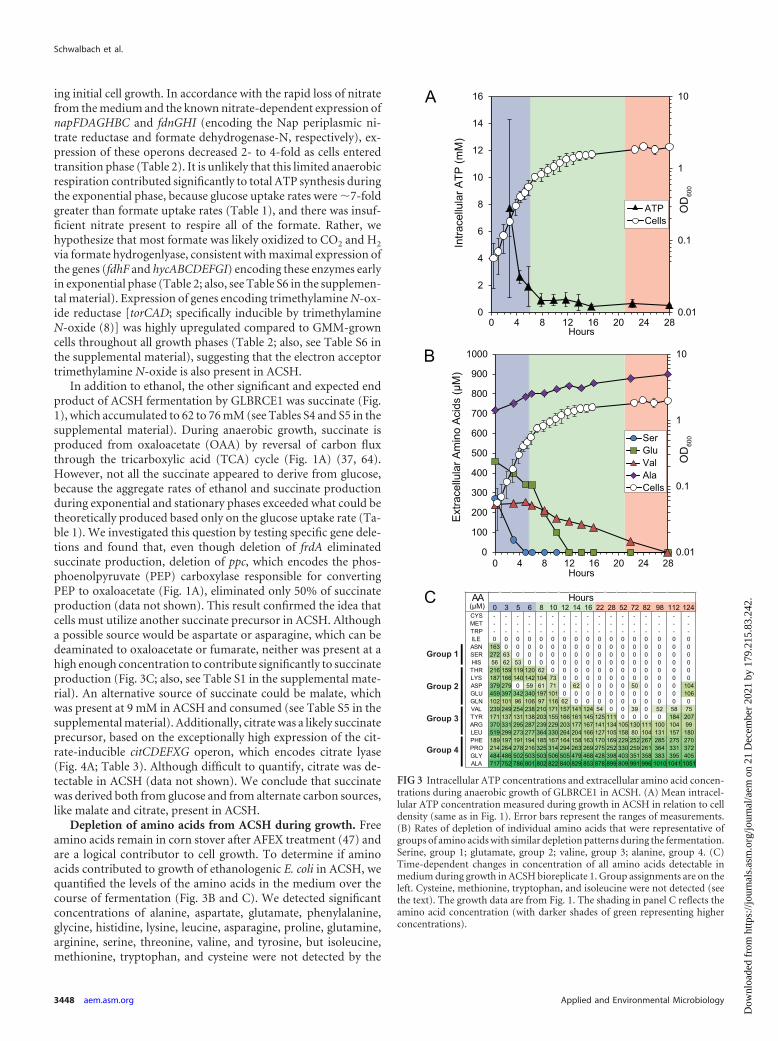
Depletion of amino acids from ACSH during growth. Freeamino acids remain in corn stover after AFEX treatment (47) andare a logical contributor to cell growth. To determine if aminoacids contributed to growth of ethanologenic E. coli in ACSH, wequantified the levels of the amino acids in the medium over thecourse of fermentation (Fig. 3B and C). We detected significantconcentrations of alanine, aspartate, glutamate, phenylalanine,glycine, histidine, lysine, leucine, asparagine, proline, glutamine,arginine, serine, threonine, valine, and tyrosine, but isoleucine,methionine, tryptophan, and cysteine were not detected by the
FIG 3 Intracellular ATP concentrations and extracellular amino acid concen-trations during anaerobic growth of GLBRCE1 in ACSH. (A) Mean intracel-lular ATP concentration measured during growth in ACSH in relation to celldensity (same as in Fig. 1). Error bars represent the ranges of measurements.(B) Rates of depletion of individual amino acids that were representative ofgroups of amino acids with similar depletion patterns during the fermentation.Serine, group 1; glutamate, group 2; valine, group 3; alanine, group 4. (C)Time-dependent changes in concentration of all amino acids detectable inmedium during growth in ACSH bioreplicate 1. Group assignments are on theleft. Cysteine, methionine, tryptophan, and isoleucine were not detected (seethe text). The growth data are from Fig. 1. The shading in panel C reflects theamino acid concentration (with darker shades of green representing higherconcentrations).
Schwalbach et al.
3448 aem.asm.org Applied and Environmental Microbiology
Dow
nloa
ded
from
http
s://j
ourn
als.
asm
.org
/jour
nal/a
em o
n 21
Dec
embe
r 20
21 b
y 17
9.21
5.83
.242
.
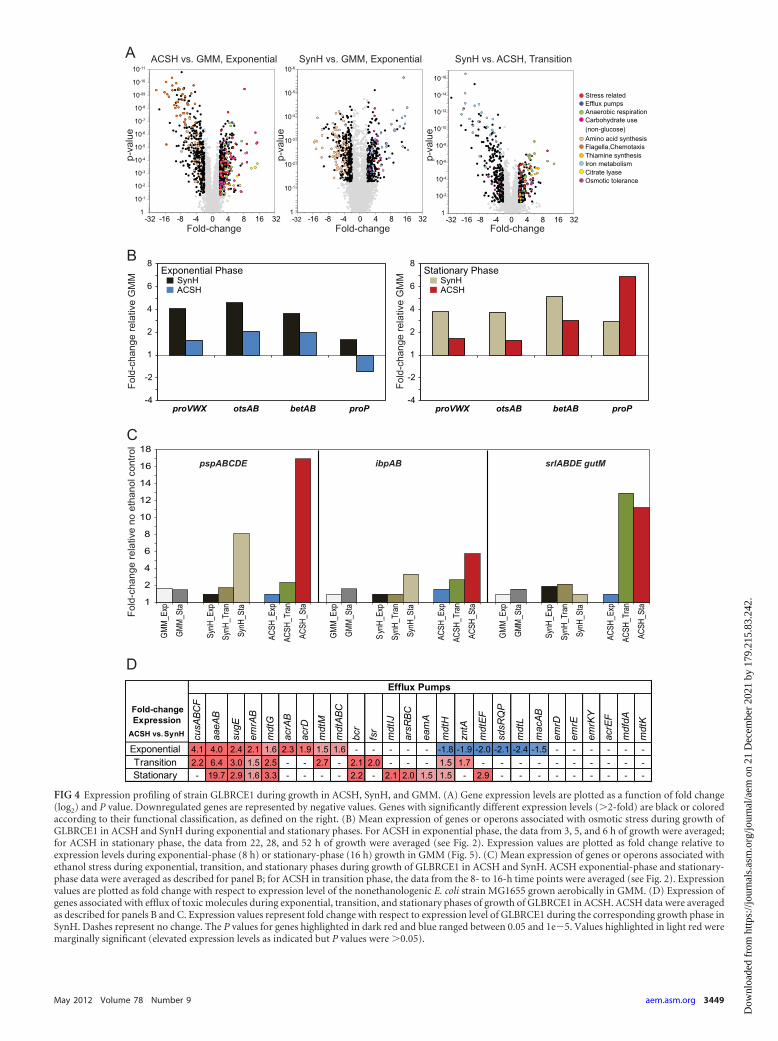
FIG 4 Expression profiling of strain GLBRCE1 during growth in ACSH, SynH, and GMM. (A) Gene expression levels are plotted as a function of fold change(log2) and P value. Downregulated genes are represented by negative values. Genes with significantly different expression levels (�2-fold) are black or coloredaccording to their functional classification, as defined on the right. (B) Mean expression of genes or operons associated with osmotic stress during growth ofGLBRCE1 in ACSH and SynH during exponential and stationary phases. For ACSH in exponential phase, the data from 3, 5, and 6 h of growth were averaged;for ACSH in stationary phase, the data from 22, 28, and 52 h of growth were averaged (see Fig. 2). Expression values are plotted as fold change relative toexpression levels during exponential-phase (8 h) or stationary-phase (16 h) growth in GMM (Fig. 5). (C) Mean expression of genes or operons associated withethanol stress during exponential, transition, and stationary phases during growth of GLBRCE1 in ACSH and SynH. ACSH exponential-phase and stationary-phase data were averaged as described for panel B; for ACSH in transition phase, the data from the 8- to 16-h time points were averaged (see Fig. 2). Expressionvalues are plotted as fold change with respect to expression level of the nonethanologenic E. coli strain MG1655 grown aerobically in GMM. (D) Expression ofgenes associated with efflux of toxic molecules during exponential, transition, and stationary phases of growth of GLBRCE1 in ACSH. ACSH data were averagedas described for panels B and C. Expression values represent fold change with respect to expression level of GLBRCE1 during the corresponding growth phase inSynH. Dashes represent no change. The P values for genes highlighted in dark red and blue ranged between 0.05 and 1e�5. Values highlighted in light red weremarginally significant (elevated expression levels as indicated but P values were �0.05).
May 2012 Volume 78 Number 9 aem.asm.org 3449
Dow
nloa
ded
from
http
s://j
ourn
als.
asm
.org
/jour
nal/a
em o
n 21
Dec
embe
r 20
21 b
y 17
9.21
5.83
.242
.
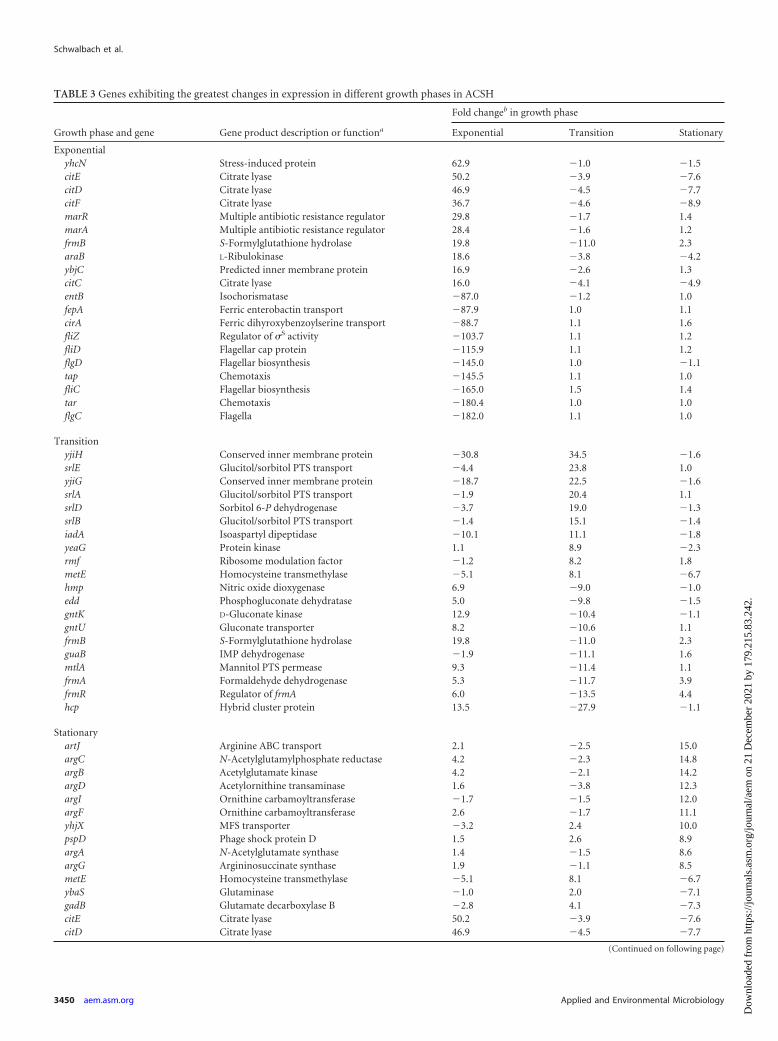
TABLE 3 Genes exhibiting the greatest changes in expression in different growth phases in ACSH
Growth phase and gene Gene product description or functiona
Fold changeb in growth phase
Exponential Transition Stationary
ExponentialyhcN Stress-induced protein 62.9 �1.0 �1.5citE Citrate lyase 50.2 �3.9 �7.6citD Citrate lyase 46.9 �4.5 �7.7citF Citrate lyase 36.7 �4.6 �8.9marR Multiple antibiotic resistance regulator 29.8 �1.7 1.4marA Multiple antibiotic resistance regulator 28.4 �1.6 1.2frmB S-Formylglutathione hydrolase 19.8 �11.0 2.3araB L-Ribulokinase 18.6 �3.8 �4.2ybjC Predicted inner membrane protein 16.9 �2.6 1.3citC Citrate lyase 16.0 �4.1 �4.9entB Isochorismatase �87.0 �1.2 1.0fepA Ferric enterobactin transport �87.9 1.0 1.1cirA Ferric dihyroxybenzoylserine transport �88.7 1.1 1.6fliZ Regulator of �S activity �103.7 1.1 1.2fliD Flagellar cap protein �115.9 1.1 1.2flgD Flagellar biosynthesis �145.0 1.0 �1.1tap Chemotaxis �145.5 1.1 1.0fliC Flagellar biosynthesis �165.0 1.5 1.4tar Chemotaxis �180.4 1.0 1.0flgC Flagella �182.0 1.1 1.0
TransitionyjiH Conserved inner membrane protein �30.8 34.5 �1.6srlE Glucitol/sorbitol PTS transport �4.4 23.8 1.0yjiG Conserved inner membrane protein �18.7 22.5 �1.6srlA Glucitol/sorbitol PTS transport �1.9 20.4 1.1srlD Sorbitol 6-P dehydrogenase �3.7 19.0 �1.3srlB Glucitol/sorbitol PTS transport �1.4 15.1 �1.4iadA Isoaspartyl dipeptidase �10.1 11.1 �1.8yeaG Protein kinase 1.1 8.9 �2.3rmf Ribosome modulation factor �1.2 8.2 1.8metE Homocysteine transmethylase �5.1 8.1 �6.7hmp Nitric oxide dioxygenase 6.9 �9.0 �1.0edd Phosphogluconate dehydratase 5.0 �9.8 �1.5gntK D-Gluconate kinase 12.9 �10.4 �1.1gntU Gluconate transporter 8.2 �10.6 1.1frmB S-Formylglutathione hydrolase 19.8 �11.0 2.3guaB IMP dehydrogenase �1.9 �11.1 1.6mtlA Mannitol PTS permease 9.3 �11.4 1.1frmA Formaldehyde dehydrogenase 5.3 �11.7 3.9frmR Regulator of frmA 6.0 �13.5 4.4hcp Hybrid cluster protein 13.5 �27.9 �1.1
StationaryartJ Arginine ABC transport 2.1 �2.5 15.0argC N-Acetylglutamylphosphate reductase 4.2 �2.3 14.8argB Acetylglutamate kinase 4.2 �2.1 14.2argD Acetylornithine transaminase 1.6 �3.8 12.3argI Ornithine carbamoyltransferase �1.7 �1.5 12.0argF Ornithine carbamoyltransferase 2.6 �1.7 11.1yhjX MFS transporter �3.2 2.4 10.0pspD Phage shock protein D 1.5 2.6 8.9argA N-Acetylglutamate synthase 1.4 �1.5 8.6argG Argininosuccinate synthase 1.9 �1.1 8.5metE Homocysteine transmethylase �5.1 8.1 �6.7ybaS Glutaminase �1.0 2.0 �7.1gadB Glutamate decarboxylase B �2.8 4.1 �7.3citE Citrate lyase 50.2 �3.9 �7.6citD Citrate lyase 46.9 �4.5 �7.7
(Continued on following page)
Schwalbach et al.
3450 aem.asm.org Applied and Environmental Microbiology
Dow
nloa
ded
from
http
s://j
ourn
als.
asm
.org
/jour
nal/a
em o
n 21
Dec
embe
r 20
21 b
y 17
9.21
5.83
.242
.
assay we used, possibly due to interfering compounds in ACSH.During growth of the ethanologen, the concentrations of mostamino acids decreased. However, the patterns of changes in aminoacid concentrations were disparate and fell roughly into fourgroups. The first group (serine, asparagine, and histidine) wasdepleted from the medium in the first 3 to 6 h of incubation. Asecond group (glutamate, threonine, lysine, aspartate, and glu-tamine) was depleted later in the fermentation, after 10 to 14 h ofincubation. The third group (valine, tyrosine, arginine, and leu-cine) remained detectable into stationary phase. Finally, a fourthgroup either remained nearly constant (glycine) or increased inconcentration (phenylalanine, proline and alanine) over thecourse of the fermentation, suggesting net synthesis of theseamino acids by the ethanologen.
Expression levels of amino acid biosynthetic genes werebroadly consistent with the patterns of amino acid depletion fromACSH. For example, expression of serAC and asnAB, thrAB, andaspC genes increased after approximately 8 to 12 h of growth,approximately the point at which these amino acids became un-detectable (Table 2). In addition, gltB, gdhA, and glnA, which en-code enzymes for glutamate and glutamine biosynthesis, were up-regulated when the cognate amino acids became depleted (early intransition phase; 8 to 14 h). Coincident with the upregulation ofgltB and gdhA, we observed increased expression of glnK andamtB. glnK encodes a PII protein that regulates Ntr gene expres-sion when nitrogen is limiting (13, 76). Upregulation of genesinvolved in nitrogen utilization likely represented a metabolicswitch that occurred when the cells transitioned from use of glu-tamate and glutamine as a nitrogen source to synthesis of gluta-mate and glutamine from inorganic nitrogen sources, such as am-monia.
Transcriptional profiling indicated the initial presence of mostacids in ACSH, including methionine, tryptophan, and isoleucinethat escaped detection by direct assay. However, cysteine appearedto be absent in ACSH, as cysZCANHGWUDIPJ, which encodeenzymes for cysteine biosynthesis, were expressed at levels similarto those observed in GMM even during exponential phase inACSH (Table 2; also, see Table S6 in the supplemental material).In contrast, the trp and met operons were initially repressed inACSH and reached GMM levels only in transition phase (Table 2;also, see Table S6); this pattern indicated that tryptophan andmethionine were present in ACSH but were rapidly consumed.Expression of the biosynthetic genes for two amino acids divergedfrom this overall trend. Genes for biosynthesis of alanine (alaA,ilvE, and avtA) and proline (proAB) were expressed at high levels
throughout the fermentation (Table 2; also, see Table S6), eventhough extracellular alanine and proline levels were high and in-creased over time (Fig. 3B).
E. coli K-12 encodes catabolic systems for L-serine, L-aspartate,L-tryptophan, L-glutamate, glycine, L-threonine, L-alanine,L-proline, L-arginine, L-glutamine, L-asparagine, L-cysteine, and L-lysine (72). With the exception of aspA, which encodes aspartatelyase, an enzyme that can degrade aspartate to fumarate, and ansB,which encodes asparaginase II and is involved in the degradation ofasparagine to aspartate, expression of genes associated with aminoacid degradation were expressed at low levels during growth in ACSH(Table 2; also, see Table S6). Thus, most amino acids present in ACSHwere likely used as precursors for protein synthesis, rather than beingcatabolized for use as carbon sources.
Effect of amino acids on growth of the ethanologen in hydro-lysate. Since the entry of the ethanologen into the transition andstationary phases correlated with the depletion of subsets ofamino acids (Fig. 3), we tested whether the slowing of E. coligrowth in ACSH resulted from decreases in amino acids. We firsttested supplementation of amino acids to three times the concen-trations measured in ACSH (see Fig. S1 in the supplemental ma-terial), along with methionine (300 �M), isoleucine (700 �M),tryptophan (150 �M), and cysteine (50 �M). Increasing aminoacid concentrations delayed entry into stationary phase, increasedfinal cell density, and increased growth rate during transitionphase (Fig. 5). We concluded that amino acids significantly im-pact E. coli growth dynamics in ACSH.
We hypothesized two possible ways amino acids could im-prove growth. First, amino acids could provide osmolytes or os-molyte precursors to mitigate the osmotic stress caused by theconcentrated hydrolysate medium. Second, amino acids could re-duce the energetic load of amino acid biosynthesis, which couldincrease the energy available to combat stresses associated withgrowth in ACSH. To test these hypotheses, we compared geneexpression in ACSH to that in synthetic, chemically defined me-dium.
Comparative transcriptomics suggests physiological roles ofamino acids during growth in hydrolysate. GLBRCE1 grew at auniform rate in GMM and entered stationary phase precipitouslywhen glucose was exhausted (data not shown), without the appar-ent transition phase that was evident in ACSH and SynH (Fig. 5).When grown in ACSH or SynH, GLBRCE1 exhibited similar ex-ponential, transition, and stationary phases and reached compa-rable final cell densities before growth arrest (Fig. 5). In addition,the strain produced similar amounts of ethanol (450 mM, SynH;
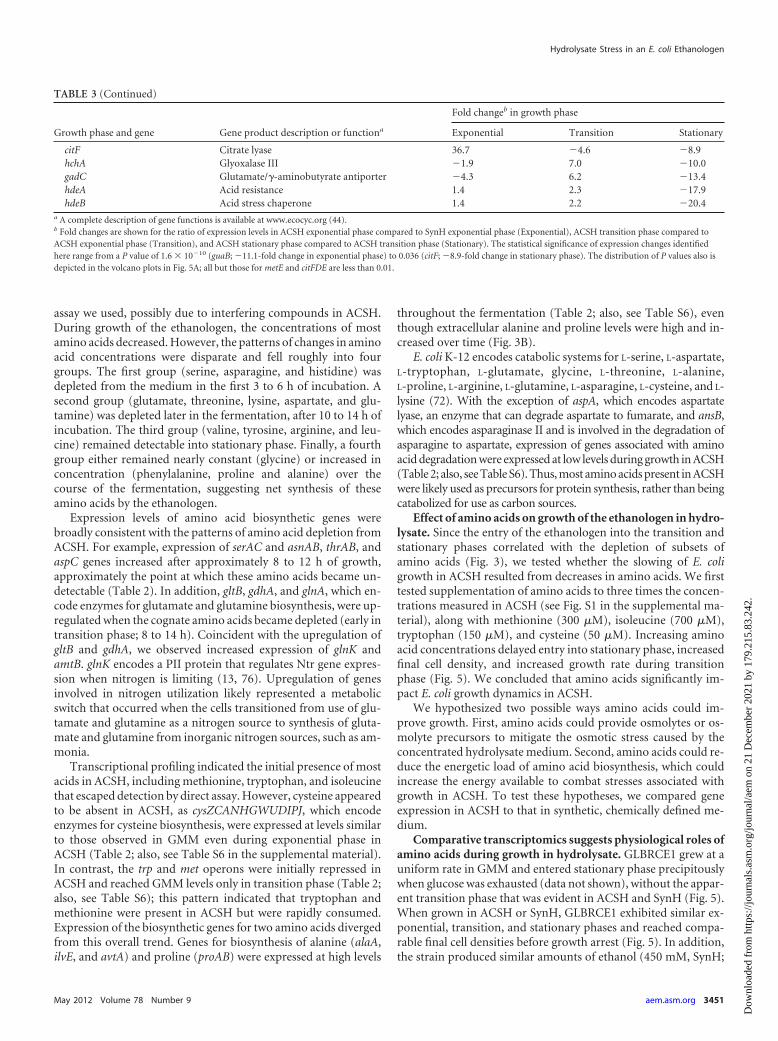
TABLE 3 (Continued)
Growth phase and gene Gene product description or functiona
Fold changeb in growth phase
Exponential Transition Stationary
citF Citrate lyase 36.7 �4.6 �8.9hchA Glyoxalase III �1.9 7.0 �10.0gadC Glutamate/�-aminobutyrate antiporter �4.3 6.2 �13.4hdeA Acid resistance 1.4 2.3 �17.9hdeB Acid stress chaperone 1.4 2.2 �20.4
a A complete description of gene functions is available at www.ecocyc.org (44).b Fold changes are shown for the ratio of expression levels in ACSH exponential phase compared to SynH exponential phase (Exponential), ACSH transition phase compared toACSH exponential phase (Transition), and ACSH stationary phase compared to ACSH transition phase (Stationary). The statistical significance of expression changes identifiedhere range from a P value of 1.6 � 10�10 (guaB; �11.1-fold change in exponential phase) to 0.036 (citF; �8.9-fold change in stationary phase). The distribution of P values also isdepicted in the volcano plots in Fig. 5A; all but those for metE and citFDE are less than 0.01.
Hydrolysate Stress in an E. coli Ethanologen
May 2012 Volume 78 Number 9 aem.asm.org 3451
Dow
nloa
ded
from
http
s://j
ourn
als.
asm
.org
/jour
nal/a
em o
n 21
Dec
embe
r 20
21 b
y 17
9.21
5.83
.242
.
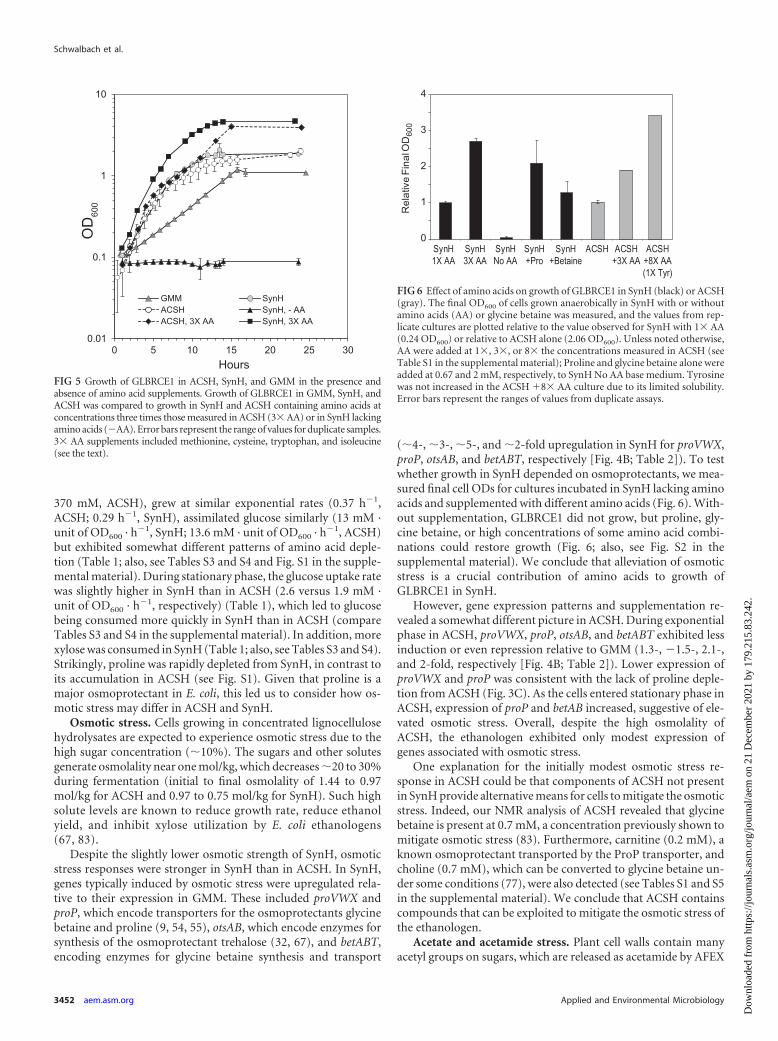
370 mM, ACSH), grew at similar exponential rates (0.37 h�1,ACSH; 0.29 h�1, SynH), assimilated glucose similarly (13 mM ·unit of OD600 · h�1, SynH; 13.6 mM · unit of OD600 · h�1, ACSH)but exhibited somewhat different patterns of amino acid deple-tion (Table 1; also, see Tables S3 and S4 and Fig. S1 in the supple-mental material). During stationary phase, the glucose uptake ratewas slightly higher in SynH than in ACSH (2.6 versus 1.9 mM ·unit of OD600 · h�1, respectively) (Table 1), which led to glucosebeing consumed more quickly in SynH than in ACSH (compareTables S3 and S4 in the supplemental material). In addition, morexylose was consumed in SynH (Table 1; also, see Tables S3 and S4).Strikingly, proline was rapidly depleted from SynH, in contrast toits accumulation in ACSH (see Fig. S1). Given that proline is amajor osmoprotectant in E. coli, this led us to consider how os-motic stress may differ in ACSH and SynH.
Osmotic stress. Cells growing in concentrated lignocellulosehydrolysates are expected to experience osmotic stress due to thehigh sugar concentration (�10%). The sugars and other solutesgenerate osmolality near one mol/kg, which decreases �20 to 30%during fermentation (initial to final osmolality of 1.44 to 0.97mol/kg for ACSH and 0.97 to 0.75 mol/kg for SynH). Such highsolute levels are known to reduce growth rate, reduce ethanolyield, and inhibit xylose utilization by E. coli ethanologens(67, 83).
Despite the slightly lower osmotic strength of SynH, osmoticstress responses were stronger in SynH than in ACSH. In SynH,genes typically induced by osmotic stress were upregulated rela-tive to their expression in GMM. These included proVWX andproP, which encode transporters for the osmoprotectants glycinebetaine and proline (9, 54, 55), otsAB, which encode enzymes forsynthesis of the osmoprotectant trehalose (32, 67), and betABT,encoding enzymes for glycine betaine synthesis and transport
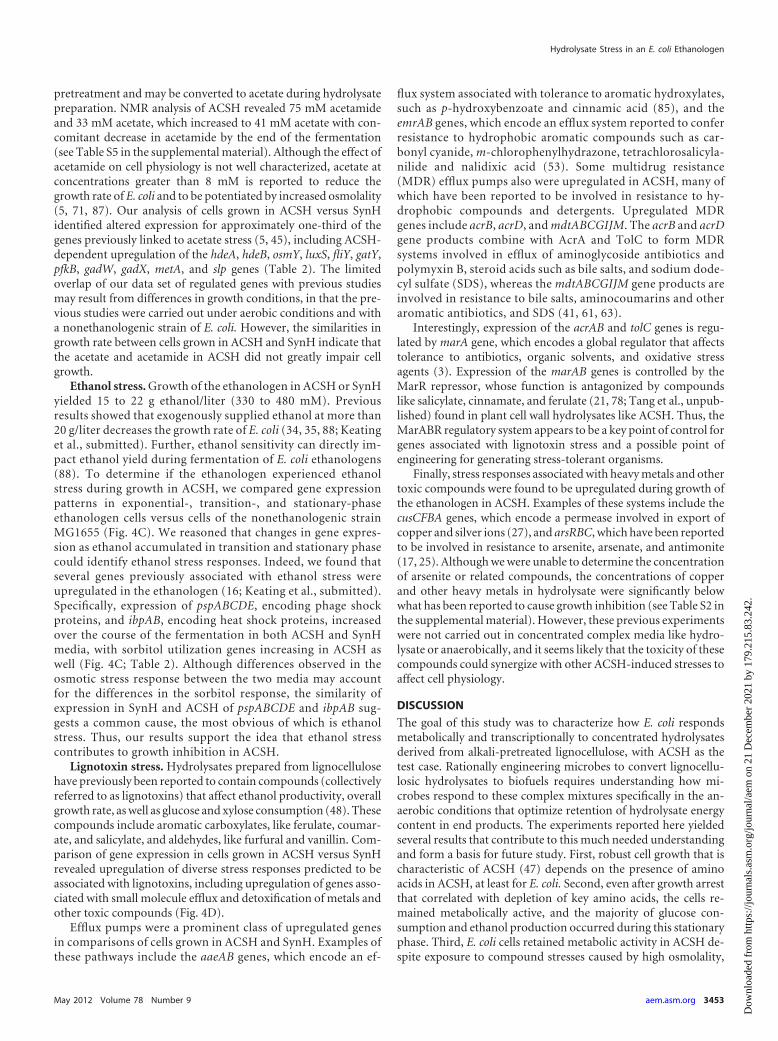
(�4-, �3-, �5-, and �2-fold upregulation in SynH for proVWX,proP, otsAB, and betABT, respectively [Fig. 4B; Table 2]). To testwhether growth in SynH depended on osmoprotectants, we mea-sured final cell ODs for cultures incubated in SynH lacking aminoacids and supplemented with different amino acids (Fig. 6). With-out supplementation, GLBRCE1 did not grow, but proline, gly-cine betaine, or high concentrations of some amino acid combi-nations could restore growth (Fig. 6; also, see Fig. S2 in thesupplemental material). We conclude that alleviation of osmoticstress is a crucial contribution of amino acids to growth ofGLBRCE1 in SynH.
However, gene expression patterns and supplementation re-vealed a somewhat different picture in ACSH. During exponentialphase in ACSH, proVWX, proP, otsAB, and betABT exhibited lessinduction or even repression relative to GMM (1.3-, �1.5-, 2.1-,and 2-fold, respectively [Fig. 4B; Table 2]). Lower expression ofproVWX and proP was consistent with the lack of proline deple-tion from ACSH (Fig. 3C). As the cells entered stationary phase inACSH, expression of proP and betAB increased, suggestive of ele-vated osmotic stress. Overall, despite the high osmolality ofACSH, the ethanologen exhibited only modest expression ofgenes associated with osmotic stress.
One explanation for the initially modest osmotic stress re-sponse in ACSH could be that components of ACSH not presentin SynH provide alternative means for cells to mitigate the osmoticstress. Indeed, our NMR analysis of ACSH revealed that glycinebetaine is present at 0.7 mM, a concentration previously shown tomitigate osmotic stress (83). Furthermore, carnitine (0.2 mM), aknown osmoprotectant transported by the ProP transporter, andcholine (0.7 mM), which can be converted to glycine betaine un-der some conditions (77), were also detected (see Tables S1 and S5in the supplemental material). We conclude that ACSH containscompounds that can be exploited to mitigate the osmotic stress ofthe ethanologen.
Acetate and acetamide stress. Plant cell walls contain manyacetyl groups on sugars, which are released as acetamide by AFEX
FIG 5 Growth of GLBRCE1 in ACSH, SynH, and GMM in the presence andabsence of amino acid supplements. Growth of GLBRCE1 in GMM, SynH, andACSH was compared to growth in SynH and ACSH containing amino acids atconcentrations three times those measured in ACSH (3� AA) or in SynH lackingamino acids (�AA). Error bars represent the range of values for duplicate samples.3� AA supplements included methionine, cysteine, tryptophan, and isoleucine(see the text).
FIG 6 Effect of amino acids on growth of GLBRCE1 in SynH (black) or ACSH(gray). The final OD600 of cells grown anaerobically in SynH with or withoutamino acids (AA) or glycine betaine was measured, and the values from rep-licate cultures are plotted relative to the value observed for SynH with 1� AA(0.24 OD600) or relative to ACSH alone (2.06 OD600). Unless noted otherwise,AA were added at 1�, 3�, or 8� the concentrations measured in ACSH (seeTable S1 in the supplemental material); Proline and glycine betaine alone wereadded at 0.67 and 2 mM, respectively, to SynH No AA base medium. Tyrosinewas not increased in the ACSH �8� AA culture due to its limited solubility.Error bars represent the ranges of values from duplicate assays.
Schwalbach et al.
3452 aem.asm.org Applied and Environmental Microbiology
Dow
nloa
ded
from
http
s://j
ourn
als.
asm
.org
/jour
nal/a
em o
n 21
Dec
embe
r 20
21 b
y 17
9.21
5.83
.242
.
pretreatment and may be converted to acetate during hydrolysatepreparation. NMR analysis of ACSH revealed 75 mM acetamideand 33 mM acetate, which increased to 41 mM acetate with con-comitant decrease in acetamide by the end of the fermentation(see Table S5 in the supplemental material). Although the effect ofacetamide on cell physiology is not well characterized, acetate atconcentrations greater than 8 mM is reported to reduce thegrowth rate of E. coli and to be potentiated by increased osmolality(5, 71, 87). Our analysis of cells grown in ACSH versus SynHidentified altered expression for approximately one-third of thegenes previously linked to acetate stress (5, 45), including ACSH-dependent upregulation of the hdeA, hdeB, osmY, luxS, fliY, gatY,pfkB, gadW, gadX, metA, and slp genes (Table 2). The limitedoverlap of our data set of regulated genes with previous studiesmay result from differences in growth conditions, in that the pre-vious studies were carried out under aerobic conditions and witha nonethanologenic strain of E. coli. However, the similarities ingrowth rate between cells grown in ACSH and SynH indicate thatthe acetate and acetamide in ACSH did not greatly impair cellgrowth.
Ethanol stress. Growth of the ethanologen in ACSH or SynHyielded 15 to 22 g ethanol/liter (330 to 480 mM). Previousresults showed that exogenously supplied ethanol at more than20 g/liter decreases the growth rate of E. coli (34, 35, 88; Keatinget al., submitted). Further, ethanol sensitivity can directly im-pact ethanol yield during fermentation of E. coli ethanologens(88). To determine if the ethanologen experienced ethanolstress during growth in ACSH, we compared gene expressionpatterns in exponential-, transition-, and stationary-phaseethanologen cells versus cells of the nonethanologenic strainMG1655 (Fig. 4C). We reasoned that changes in gene expres-sion as ethanol accumulated in transition and stationary phasecould identify ethanol stress responses. Indeed, we found thatseveral genes previously associated with ethanol stress wereupregulated in the ethanologen (16; Keating et al., submitted).Specifically, expression of pspABCDE, encoding phage shockproteins, and ibpAB, encoding heat shock proteins, increasedover the course of the fermentation in both ACSH and SynHmedia, with sorbitol utilization genes increasing in ACSH aswell (Fig. 4C; Table 2). Although differences observed in theosmotic stress response between the two media may accountfor the differences in the sorbitol response, the similarity ofexpression in SynH and ACSH of pspABCDE and ibpAB sug-gests a common cause, the most obvious of which is ethanolstress. Thus, our results support the idea that ethanol stresscontributes to growth inhibition in ACSH.
Lignotoxin stress. Hydrolysates prepared from lignocellulosehave previously been reported to contain compounds (collectivelyreferred to as lignotoxins) that affect ethanol productivity, overallgrowth rate, as well as glucose and xylose consumption (48). Thesecompounds include aromatic carboxylates, like ferulate, coumar-ate, and salicylate, and aldehydes, like furfural and vanillin. Com-parison of gene expression in cells grown in ACSH versus SynHrevealed upregulation of diverse stress responses predicted to beassociated with lignotoxins, including upregulation of genes asso-ciated with small molecule efflux and detoxification of metals andother toxic compounds (Fig. 4D).
Efflux pumps were a prominent class of upregulated genesin comparisons of cells grown in ACSH and SynH. Examples ofthese pathways include the aaeAB genes, which encode an ef-
flux system associated with tolerance to aromatic hydroxylates,such as p-hydroxybenzoate and cinnamic acid (85), and theemrAB genes, which encode an efflux system reported to conferresistance to hydrophobic aromatic compounds such as car-bonyl cyanide, m-chlorophenylhydrazone, tetrachlorosalicyla-nilide and nalidixic acid (53). Some multidrug resistance(MDR) efflux pumps also were upregulated in ACSH, many ofwhich have been reported to be involved in resistance to hy-drophobic compounds and detergents. Upregulated MDRgenes include acrB, acrD, and mdtABCGIJM. The acrB and acrDgene products combine with AcrA and TolC to form MDRsystems involved in efflux of aminoglycoside antibiotics andpolymyxin B, steroid acids such as bile salts, and sodium dode-cyl sulfate (SDS), whereas the mdtABCGIJM gene products areinvolved in resistance to bile salts, aminocoumarins and otheraromatic antibiotics, and SDS (41, 61, 63).
Interestingly, expression of the acrAB and tolC genes is regu-lated by marA gene, which encodes a global regulator that affectstolerance to antibiotics, organic solvents, and oxidative stressagents (3). Expression of the marAB genes is controlled by theMarR repressor, whose function is antagonized by compoundslike salicylate, cinnamate, and ferulate (21, 78; Tang et al., unpub-lished) found in plant cell wall hydrolysates like ACSH. Thus, theMarABR regulatory system appears to be a key point of control forgenes associated with lignotoxin stress and a possible point ofengineering for generating stress-tolerant organisms.
Finally, stress responses associated with heavy metals and othertoxic compounds were found to be upregulated during growth ofthe ethanologen in ACSH. Examples of these systems include thecusCFBA genes, which encode a permease involved in export ofcopper and silver ions (27), and arsRBC, which have been reportedto be involved in resistance to arsenite, arsenate, and antimonite(17, 25). Although we were unable to determine the concentrationof arsenite or related compounds, the concentrations of copperand other heavy metals in hydrolysate were significantly belowwhat has been reported to cause growth inhibition (see Table S2 inthe supplemental material). However, these previous experimentswere not carried out in concentrated complex media like hydro-lysate or anaerobically, and it seems likely that the toxicity of thesecompounds could synergize with other ACSH-induced stresses toaffect cell physiology.
DISCUSSION
The goal of this study was to characterize how E. coli respondsmetabolically and transcriptionally to concentrated hydrolysatesderived from alkali-pretreated lignocellulose, with ACSH as thetest case. Rationally engineering microbes to convert lignocellu-losic hydrolysates to biofuels requires understanding how mi-crobes respond to these complex mixtures specifically in the an-aerobic conditions that optimize retention of hydrolysate energycontent in end products. The experiments reported here yieldedseveral results that contribute to this much needed understandingand form a basis for future study. First, robust cell growth that ischaracteristic of ACSH (47) depends on the presence of aminoacids in ACSH, at least for E. coli. Second, even after growth arrestthat correlated with depletion of key amino acids, the cells re-mained metabolically active, and the majority of glucose con-sumption and ethanol production occurred during this stationaryphase. Third, E. coli cells retained metabolic activity in ACSH de-spite exposure to compound stresses caused by high osmolality,
Hydrolysate Stress in an E. coli Ethanologen
May 2012 Volume 78 Number 9 aem.asm.org 3453
Dow
nloa
ded
from
http
s://j
ourn
als.
asm
.org
/jour
nal/a
em o
n 21
Dec
embe
r 20
21 b
y 17
9.21
5.83
.242
.
ethanol accumulation, and lignotoxins. By combining knowledgeof how E. coli responded to changes in ACSH over exponential,transition, and stationary phases and to stresses caused by ACSHwith knowledge of the composition of ACSH over the course ofthe fermentation, we can propose design improvements to opti-mize E. coli for anaerobic biofuel synthesis in alkali-pretreatedbiomass hydrolysates.
Causes of growth arrest in ACSH. An important question iswhy cells cease growth in ACSH when ample supplies of glucoseremain. An ability to control the timing of this growth arrest is animportant goal for bioengineering optimal conversion of ACSH touseful products. Understanding the factors controlling growthcessation will allow optimization of the fraction of ACSH energycontent used to accumulate cell biomass versus the rate at whichthe growth-arrested culture converts ACSH components to de-sired products like ethanol (i.e., making less biomass consumesless sugar but converts remaining sugar to biofuel more slowly).Our results suggest that a combination of factors underlies growtharrest in ACSH.
First, and most certain, amino acid depletion contributes togrowth arrest. The passage of E. coli from exponential to transitionto stationary phase was mirrored by successive depletion of aminoacids from the growth medium (Fig. 3) and could be delayed byamino acid supplementation (Fig. 5). Cells grown in ACSH orSynH containing amino acids at concentrations three times thosemeasured in ACSH achieved a higher cell density before growtharrest than cells grown in the unsupplemented counterparts, andomission of amino acids from SynH precluded cell growth alto-gether (Fig. 5). Exactly which amino acids determine growth ar-rest is less clear, but it is notable that growth arrest in ACSH fol-lowed depletion of the major amino acid sources of organicnitrogen (glutamate, glutamine, and aspartate). Consistent with ashift to requiring nitrogen assimilation, we observed a spike inexpression of the Ntr regulon during the transition phase (seeTable S6 in the supplemental material). Additionally, as the supplyof amino acids from ACSH diminished, further growth wouldhave required cells to synthesize them de novo, at a cost rangingfrom �10 to �75 ATPs/amino acid (1) plus the cost of synthesiz-ing amino acid biosynthetic enzymes.
Consistent with the idea that increased demands for ATP con-tributed to growth arrest, we observed a dramatic decrease in in-tracellular ATP concentration in exponential- and stationary-phase cells: the intracellular ATP concentration in theethanologen declined from �8 mM early in exponential phase(matching values reported for E. coli growing with glucose as acarbon source [11]) to �1 mM upon entry into transition phaseand to �0.5 mM in stationary phase (Fig. 3A). These decreasesoccurred despite continued conversion of glucose to ethanol inthe growth-arrested state, which is predicted to generate 5.2 mMATP · unit of OD600
�1 · h�1 (Table 1). Assuming an intracellularvolume of 0.67 fl (79), this corresponds to production of ATP at130 mM min�1. Maintaining cell viability even in optimal growthmedium is thought to require significant ATP consumption, rang-ing from 20 to 90 mM min�1 (80, 86). Cell growth requires sig-nificantly more ATP; even a modest growth rate of 0.1 h�1 ispredicted to require about twice the maintenance flux of ATP (80,86). These ATP fluxes required for growth apparently cannot beachieved in ACSH once amino acids are depleted, despite abun-dant glucose. Given that comparable levels of glucose supportanaerobic growth of our strain in less complex media (e.g.,
GMM), it seems likely that other factors must limit growth eitherby consuming ATP or by limiting its production.
One possibility is the compounded effect of multiple stresseson E. coli, which could consume ATP, limit ATP production byinhibiting enzymes in the glucose-to-ethanol pathway, or both.Transcriptional profiling identified four possible stresses thatmight contribute to growth arrest: osmotic stress, acetate stress,ethanol stress, and stresses from components of ACSH, includingphenolic compounds derived from lignin and metal ions. Themechanisms by which E. coli responds to several of these stressesare likely to increase the energetic demands for cell maintenance.For instance, the most upregulated efflux pumps (e.g., AaeAB,CusABCF, and the multidrug resistance pumps SugE, EmrAB,and MdtG) are all proton antiporters that would consume ATP tomaintain the proton motive force via the F1Fo ATPase protonpump. Thus, these efflux systems may contribute to an ATP de-mand that limits cell growth in ACSH, as they help E. coli copewith inhibitory molecules present in the hydrolysate. It is alsopossible that inhibitors in ACSH directly slow growth by bindingto cellular targets such as key enzymes. In the case of metal ions,however, none appear to be present in ACSH at levels that, with-out other stresses, affect growth of E. coli (14, 69).
Another possibility that could contribute to growth arrest isredox imbalance, which is a frequent complication of anaerobicmetabolism in E. coli when mixed acid fermentation is blocked(42, 74). The introduction of the Z. mobilis pyruvate decarboxyl-ase pathway corrects the redox imbalance of ethanol synthesis viaacetyl coenzyme A in wild-type E. coli (42), but an increase inpyruvate in the growth medium as cell growth slowed (see TableS4 in the supplemental material) was consistent with accumula-tion of intracellular NADH (possibly limiting NAD� for glycoly-sis). Interference from the complex mixture of compounds pres-ent in ACSH has so far prevented us from measuring NADH/NAD� ratios in cells grown in ACSH, but this is an importantquestion for further study of anaerobic metabolism of ethanolo-genic E. coli in ACSH.
Osmotic stress and ethanol stress. Two stresses, osmotic andethanol induced, deserve special mention as potential sources ofgrowth inhibition. Osmotic stress, which is known to affect microbialmetabolism at multiple points (67, 83), is an unavoidable conse-quence of the high sugar concentrations desirable for lignocellulosicconversion. The accumulation of extracellular proline and of alanineduring growth in ACSH is likely a consequence of osmotic stress.Although proline accumulation likely reflected proline’s known os-moprotective function (56), to our knowledge the use of alanine as amicrobial osmoprotectant has not been reported. Alanine has beenreported to accumulate during osmotic stress in marine invertebratesand cyclostome fish (75). Furthermore, alanine has been observed toaccumulate in plant and mammalian cells under low-oxygen condi-tions (30, 73), where it has been suggested to function to preventacidification of the cytoplasm (26). Although additional studies areneeded, our results suggest that E. coli maintains high alanine levelsfor some protective function during growth in ACSH, possibly a di-rect osmoprotectant, like proline, or a precursor to an unknown pro-tective molecule.
Although we observed elevated expression of genes indicative ofosmotic stress in SynH (e.g., proVWY, proP, betABT, and otsAB), theirexpression levels were lower in ACSH. This finding suggests thatcompounds in ACSH may mitigate osmotic stress. Consistent withthis idea, glycine betaine, choline, and carnitine were all identified by
Schwalbach et al.
3454 aem.asm.org Applied and Environmental Microbiology
Dow
nloa
ded
from
http
s://j
ourn
als.
asm
.org
/jour
nal/a
em o
n 21
Dec
embe
r 20
21 b
y 17
9.21
5.83
.242
.
NMR in ACSH (see Table S5 in the supplemental material). Althoughbeneficial, import of these osmolytes would place additional ener-getic demands on the cell. The ProVWX transporter is an ABC trans-porter that hydrolyzes one ATP per osmolyte imported, whereasProP, whose gene is expressed at lower levels until stationary phase, isa proton symporter. Thus, engineering increased expression of proPin exponential phase, and possibly lower expression of proVWX, maybe a strategy to improve use of osmolytes in ACSH at lower energeticcost. In general, strategies to improve osmotic stress tolerance by E.coli are likely to improve conversion of ACSH to ethanol (57, 83).
An unexpected finding of our study was the elevated expres-sion of genes associated with ethanol stress at low ethanol concen-trations. Although expression of pspABCD, ibpB, srlABDE, andgutM was shown previously to be upregulated by ethanol (34, 35,88; Keating et al., submitted), their induction in ACSH duringearly stationary phase occurred at lower ethanol concentrationsthan was typical in the previous studies, which were carried out inlaboratory media. It is possible that high osmolality and lignotox-ins in ACSH may potentiate the effect of ethanol on E. coli physi-ology, resulting in stress at lower concentrations of ethanol. In-deed, the growth of the ethanologen in ACSH is slowed byconcentrations of ethanol as low as 5 g/liter (0.5%) (data notshown). Although ethanol stress may affect the ability of cells togenerate proton-motive force, as reported for Saccharomycescerevisiae (18), this effect might not be inhibitory at low ethanolconcentrations in optimal medium yet become inhibitory inACSH due to additional sinks for the proton gradient. Collec-tively, our results suggest that even relatively low concentrationsof ethanol may contribute to growth arrest of E. coli in ACSH.Further study will be needed to determine if ethanol also limits theglucose conversion rate after arrest or if the effect of accumulatingethanol can be exploited to help control the point of growth arrest.
Changes observed in E. coli gene expression in ACSH suggestdesign strategies for improved ethanologens. A key challenge inmetabolic engineering of E. coli for improved conversion of lignocel-lulosic hydrolysates like ACSH to useful products such as ethanol isthe lack of means to control gene expression by design. Conventionalstrategies for gene regulation in biotechnology use changes in tem-perature and the addition of compounds like isopropyl �-D-1-thio-galactopyranoside (IPTG), anhydrotetracycline, or arabinose, whichare cost-prohibitive in biofuel applications or whose effect will beconfounded by compounds present in hydrolysate. Our analysis ofgene expression in exponential, transition, and stationary phases of E.coli grown in ACSH suggests an alternative strategy relying on naturalchanges in gene regulation that occur during these growth phases. Inessence, well-characterized promoter/operator sequences for genesthat exhibit desired regulation could be used to drive phase-specificexpression of transgenes. For example, araB, under the control ofPBAD and the AraC regulator, is on in exponential phase but turns offin exponential and stationary phases. The trp operon genes, con-trolled by the trp promoter and TrpR repressor, are off in exponentialand stationary phase but upregulated �6-fold in transition phase.Expression of argA and argC, which is controlled by the ArgR repres-sor and �S, is off in exponential and transition phase but upregulated50- to 100-fold in stationary phase. These specific patterns of expres-sion will allow selective on- and off-regulation of “programmablegene cassettes” in E. coli cells at different phases of ACSH fermenta-tion without exogenous effectors simply by placing the appropriatepromoter regions at the 5= ends of the gene cassettes. This could, forexample allow expression of genes for osmolyte synthesis to be ex-
pressed during exponential phase, when energy supplies are moreabundant, and repressed in transition phase, stationary phase, orboth. Further study of the metabolic and gene-regulatory responsesof E. coli to the complex and changing composition of concentratedhydrolysates like ACSH will facilitate implementation of this native-signal gene regulation strategy, will help define the chemical compo-sition of these hydrolysates, and will provide a more complete under-standing of how anaerobic physiology adjusts to these importantcellular substrates.
ACKNOWLEDGMENTS
We thank R. Zinkel for assistance in transcriptomic sample processing,the Michigan Biotechnology Institute for allowing us to use their 5-gallonAFEX batch reactor to pretreat corn stover, T. Record for allowing use ofhis osmometer, and Genencor for supplying enzymes for hydrolysate pro-duction.
This work was funded by the U.S. Department of Energy (DOE) GreatLakes Bioenergy Research Center (DOE BER Office of Science DE-FC02-07ER64494). This study also made use of the National Magnetic Reso-nance Facility at Madison, which is supported by National Institutes ofHealth (NIH) grants P41RR02301 (Biomedical Research TechnologyProgram, National Center for Research Resources) and P41GM66326(National Institute of General Medical Sciences). Equipment in the facil-ity was purchased with funds from the University of Wisconsin, the NIH(P41GM66326, P41RR02301, RR02781, and RR08438), the National Sci-ence Foundation (DMB-8415048, OIA-9977486, and BIR-9214394), andthe U.S. Department of Agriculture. The work conducted by the U.S. DOEJoint Genome Institute is supported by the Office of Science of the U.S.DOE under contract no. DE-AC02-05CH11231.
REFERENCES1. Akashi H, Gojobori T. 2002. Metabolic efficiency and amino acid com-
position in the proteomes of Escherichia coli and Bacillus subtilis. Proc.Natl. Acad. Sci. U. S. A. 99:3695–3700.
2. Albersheim P, Nevins D, English P, Karr A. 1968. A method for theanalysis of sugars in plant cell-wall polysaccharides by gas-liquid chroma-tography. Carbohydr Res. 5:340 –345.
3. Alekshun MN, Levy SB. 1999. Alteration of the repressor activity ofMarR, the negative regulator of the Escherichia coli marRAB locus, bymultiple chemicals in vitro. J. Bacteriol. 181:4669 – 4672.
4. Amador-Noguez D, Brasg IA, Feng XJ, Roquet N, Rabinowitz JD. 2011.Metabolome remodeling during the acidogenic-solventogenic transitionin Clostridium acetobutylicum. Appl. Environ. Microbiol. 77:7984 –7997.
5. Arnold CN, McElhanon J, Lee A, Leonhart R, Siegele DA. 2001. Globalanalysis of Escherichia coli gene expression during the acetate-induced acidtolerance response. J. Bacteriol. 183:2178 –2186.
6. Baba T, et al. 2006. Construction of Escherichia coli K-12 in-frame, single-gene knockout mutants: the Keio collection. Mol. Syst. Biol. 2:2006.0008.
7. Balan V, Bals B, Chundawat SP, Marshall D, Dale BE. 2009. Lignocel-lulosic biomass pretreatment using AFEX. Methods Mol. Biol. 581:61–77.
8. Baraquet C, et al. 2006. TorT, a member of a new periplasmic bindingprotein family, triggers induction of the Tor respiratory system upontrimethylamine N-oxide electron-acceptor binding in Escherichia coli. J.Biol. Chem. 281:38189 –38199.
9. Barron A, Jung JU, Villarejo M. 1987. Purification and characterizationof a glycine betaine binding protein from Escherichia coli. J. Biol. Chem.262:11841–11846.
10. Baumler D, Peplinski R, Reen J, Glasner J, Perna, N. 2011. The evolu-tion of metabolic networks of E. coli. BMC Syst. Biol. 5:182.
11. Bennett BD, et al. 2009. Absolute metabolite concentrations and impliedenzyme active site occupancy in Escherichia coli. Nat. Chem. Biol. 5:593–599.
12. Blattner FR, et al. 1997. The complete genome sequence of Escherichiacoli K-12. Science 277:1453–1462.
13. Blauwkamp TA, Ninfa AJ. 2002. Physiological role of the GlnK signaltransduction protein of Escherichia coli: survival of nitrogen starvation.Mol. Microbiol. 46:203–214.
14. Bojic A, Purenovic M, Kocic B, Mihailovic D, Bojic D. 2002. The
Hydrolysate Stress in an E. coli Ethanologen
May 2012 Volume 78 Number 9 aem.asm.org 3455
Dow
nloa
ded
from
http
s://j
ourn
als.
asm
.org
/jour
nal/a
em o
n 21
Dec
embe
r 20
21 b
y 17
9.21
5.83
.242
.
comparison of aluminium effects and its uptake by Escherichia coli indifferent media. Cent. Eur. J. Public Health 10:66 –71.
15. Bolstad BM, Irizarry RA, Astrand M, Speed TP. 2003. A comparison ofnormalization methods for high density oligonucleotide array data basedon variance and bias. Bioinformatics 19:185–193.
16. Brynildsen MP, Liao JC. 2009. An integrated network approach identifiesthe isobutanol response network of Escherichia coli. Mol. Syst. Biol. 5:277.
17. Carlin A, Shi W, Dey S, Rosen BP. 1995. The ars operon of Escherichiacoli confers arsenical and antimonial resistance. J. Bacteriol. 177:981–986.
18. Cartwright C, et al. 1986. Ethanol dissipates the proton-motive forceacross the plasma membrane of Saccharomyces cerevisiae. J. Gen. Micro-biol. 132:369 –377.
19. Chundawat SP, et al. 2010. Multifaceted characterization of cell walldecomposition products formed during ammonia fiber expansion(AFEX) and dilute acid based pretreatments. Bioresour. Technol. 101:8429 – 8438.
20. Clomburg JM, Gonzalez R. 2010. Biofuel production in Escherichia coli:the role of metabolic engineering and synthetic biology. Appl. Microbiol.Biotechnol. 86:419 – 434.
21. Dalrymple BP, Swadling Y. 1997. Expression of a Butyrivibrio fibrisolvensE14 gene (cinB) encoding an enzyme with cinnamoyl ester hydrolase ac-tivity is negatively regulated by the product of an adjacent gene (cinR).Microbiology 143:1203–1210.
22. Delaglio F, et al. 1995. NMRPipe: a multidimensional spectral processingsystem based on UNIX pipes. J. Biomol. NMR 6:277–293.
23. den Dunnen JT, Antonarakis SE. 2001. Nomenclature for the descriptionof human sequence variations. Hum. Genet. 109:121–124.
24. Desai TA, Rao CV. 2010. Regulation of arabinose and xylose metabolismin Escherichia coli. Appl. Environ. Microbiol. 76:1524 –1532.
25. Diorio C, Cai J, Marmor J, Shinder R, DuBow MS. 1995. An Escherichiacoli chromosomal ars operon homolog is functional in arsenic detoxifica-tion and is conserved in gram-negative bacteria. J. Bacteriol. 177:2050 –2056.
26. Felle H. 1996. Control of cytoplasmic pH under anoxic conditions and itsimplication for plasma membrane proton transport in Medicago sativaroot hairs. J. Exp. Bot. 47:967–973.
27. Franke S, Grass G, Rensing C, Nies DH. 2003. Molecular analysis of thecopper-transporting efflux system CusCFBA of Escherichia coli. J. Bacte-riol. 185:3804 –3812.
28. Freddolino PL, Amini S, Tavazoie S. 2012. Newly identified geneticvariations in common Escherichia coli MG1655 stock cultures. J. Bacteriol.194:303–306.
29. Gardner JG, Keating DH. 2010. Requirement of the type II secretionsystem for utilization of cellulosic substrates by Cellvibrio japonicus. Appl.Environ. Microbiol. 76:5079 –5087.
30. Garza-Quintero R, Ortega-Lopez J, Stein JH, Venkatachalam MA. 1990.Alanine protects rabbit proximal tubules against anoxic injury in vitro.Am. J. Physiol. 258:F1075–F1083.
31. Geddes CC, et al. 2011. Simplified process for ethanol production fromsugarcane bagasse using hydrolysate-resistant Escherichia coli strainMM160. Bioresour. Technol. 102:2702–2711.
32. Giaever HM, Styrvold OB, Kaasen I, Strom AR. 1988. Biochemical andgenetic characterization of osmoregulatory trehalose synthesis in Esche-richia coli. J. Bacteriol. 170:2841–2849.
33. Gonzalez R, et al. 2003. Gene array-based identification of changes thatcontribute to ethanol tolerance in ethanologenic Escherichia coli: compar-ison of KO11 (parent) to LY01 (resistant mutant). Biotechnol. Prog. 19:612– 623.
34. Goodarzi H, et al. 2010. Regulatory and metabolic rewiring during lab-oratory evolution of ethanol tolerance in E. coli. Mol. Syst. Biol. 6:378.
35. Goodarzi H, Hottes AK, Tavazoie S. 2009. Global discovery of adaptivemutations. Nat. Methods 6:581–583.
36. Hasona A, Kim Y, Healy FG, Ingram LO, Shanmugam KT. 2004.Pyruvate formate lyase and acetate kinase are essential for anaerobicgrowth of Escherichia coli on xylose. J. Bacteriol. 186:7593–7600.
37. Ingledew WJ, Poole RK. 1984. The respiratory chains of Escherichia coli.Microbiol. Rev. 48:222–271.
38. Ingram LO, Buttke TM. 1984. Effects of alcohols on micro-organisms.Adv. Microb. Physiol. 25:253–300.
39. Ingram LO, Conway T, Clark DP, Sewell GW, Preston JF. 1987. Geneticengineering of ethanol production in Escherichia coli. Appl. Environ. Mi-crobiol. 53:2420 –2425.
40. Irizarry RA, et al. 2003. Exploration, normalization, and summaries of
high density oligonucleotide array probe level data. Biostatistics. 4:249 –264.
41. Jack DL, Storms ML, Tchieu JH, Paulsen IT, Saier MH, Jr. 2000. Abroad-specificity multidrug efflux pump requiring a pair of homologousSMR-type proteins. J. Bacteriol. 182:2311–2313.
42. Jarboe LR, Grabar TB, Yomano LP, Shanmugan KT, Ingram LO. 2007.Development of ethanologenic bacteria. Adv. Biochem. Eng. Biotechnol.108:237–261.
43. Jarboe LR, et al. 2010. Metabolic engineering for production of biore-newable fuels and chemicals: contributions of synthetic biology. J.Biomed. Biotechnol. 2010:761042.
44. Keseler IM, et al. 2011. EcoCyc: a comprehensive database of Escherichiacoli biology. Nucleic Acids Res. 39:D583–D590.
45. Kirkpatrick C, et al. 2001. Acetate and formate stress: opposite responsesin the proteome of Escherichia coli. J. Bacteriol. 183:6466 – 6477.
46. Knoshaug EP, Zhang M. 2009. Butanol tolerance in a selection of micro-organisms. Appl. Biochem. Biotechnol. 153:13–20.
47. Lau MW, Dale BE. 2009. Cellulosic ethanol production from AFEX-treated corn stover using Saccharomyces cerevisiae 424A(LNH-ST). Proc.Natl. Acad. Sci. U. S. A. 106:1368 –1373.
48. Lau MW, Dale BE. 2010. Effect of primary degradation-reaction productsfrom ammonia fiber expansion (AFEX)-treated corn stover on the growthand fermentation of Escherichia coli KO11. Bioresour. Technol. 101:7849 –7855.
49. Lau MW, Dale BE, Balan V. 2008. Ethanolic fermentation of hydroly-sates from ammonia fiber expansion (AFEX) treated corn stover and dis-tillers grain without detoxification and external nutrient supplementa-tion. Biotechnol. Bioeng. 99:529 –539.
50. Lau MW, Gunawan C, Balan V, Dale BE. 2010. Comparing the fermen-tation performance of Escherichia coli KO11, Saccharomyces cerevisiae424A(LNH-ST) and Zymomonas mobilis AX101 for cellulosic ethanol pro-duction. Biotechnol. Biofuels 3:11.
51. Lewis IA, Schommer SC, Markley JL. 2009. rNMR: open source softwarefor identifying and quantifying metabolites in NMR spectra. Magn. Reson.Chem. 47(Suppl. 1):S123–S126.
52. Lindsay SE, Bothast RJ, Ingram LO. 1995. Improved strains of recom-binant Escherichia coli for ethanol production from sugar mixtures. Appl.Microbiol. Biotechnol. 43:70 –75.
53. Lomovskaya O, Lewis K, Matin A. 1995. EmrR is a negative regulator ofthe Escherichia coli multidrug resistance pump EmrAB. J. Bacteriol. 177:2328 –2334.
54. Lucht JM, Bremer E. 1994. Adaptation of Escherichia coli to high osmo-larity environments: osmoregulation of the high-affinity glycine betainetransport system proU. FEMS Microbiol. Rev. 14:3–20.
55. MacMillan SV, et al. 1999. The ion coupling and organic substrate spec-ificities of osmoregulatory transporter ProP in Escherichia coli. Biochim.Biophys. Acta 1420:30 – 44.
56. Mahan MJ, Csonka LN. 1983. Genetic analysis of the proBA genes ofSalmonella typhimurium: physical and genetic analyses of the clonedproB�A� genes of Escherichia coli and of a mutant allele that confers pro-line overproduction and enhanced osmotolerance. J. Bacteriol. 156:1249 –1262.
57. Miller EN, Ingram LO. 2007. Combined effect of betaine and trehalose onosmotic tolerance of Escherichia coli in mineral salts medium. Biotechnol.Lett. 29:213–217.
58. Miller EN, et al. 2009. Furfural inhibits growth by limiting sulfur assim-ilation in ethanologenic Escherichia coli strain LY180. Appl. Environ. Mi-crobiol. 75:6132– 6141.
59. Mills TY, Sandoval NR, Gill RT. 2009. Cellulosic hydrolysate toxicity andtolerance mechanisms in Escherichia coli. Biotechnol. Biofuels 2:26.
60. Moniruzzaman M, et al. 1996. Ethanol production from AFEX pretreatedcorn fiber by recombinant bacteria. Biotechnol. Lett. 18:985–990.
61. Nagakubo S, Nishino K, Hirata T, Yamaguchi A. 2002. The putativeresponse regulator BaeR stimulates multidrug resistance of Escherichia colivia a novel multidrug exporter system, MdtABC. J. Bacteriol. 184:4161–4167.
62. Neidhardt FC, Bloch PL, Smith DF. 1974. Culture medium for entero-bacteria. J. Bacteriol. 119:736 –747.
63. Nishino K, Yamaguchi A. 2001. Analysis of a complete library of putativedrug transporter genes in Escherichia coli. J. Bacteriol. 183:5803–5812.
64. Ohta K, Beall DS, Mejia JP, Shanmugam KT, Ingram LO. 1991. Geneticimprovement of Escherichia coli for ethanol production: chromosomal
Schwalbach et al.
3456 aem.asm.org Applied and Environmental Microbiology
Dow
nloa
ded
from
http
s://j
ourn
als.
asm
.org
/jour
nal/a
em o
n 21
Dec
embe
r 20
21 b
y 17
9.21
5.83
.242
.
integration of Zymomonas mobilis genes encoding pyruvate decarboxylaseand alcohol dehydrogenase II. Appl. Environ. Microbiol. 57:893–900.
65. Oliva JM, et al. 2004. Effect of binary combinations of selected toxiccompounds on growth and fermentation of Kluyveromyces marxianus.Biotechnol. Prog. 20:715–720.
66. Peterson JD, Ingram LO. 2008. Anaerobic respiration in engineeredEscherichia coli with an internal electron acceptor to produce fuel ethanol.Ann. N. Y. Acad. Sci. 1125:363–372.
67. Purvis JE, Yomano LP, Ingram LO. 2005. Enhanced trehalose produc-tion improves growth of Escherichia coli under osmotic stress. Appl. Envi-ron. Microbiol. 71:3761–3769.
68. Reed JL, Vo TD, Schilling CH, Palsson BO. 2003. An expanded genome-scale model of Escherichia coli K-12 (iJR904 GSM/GPR). Genome Biol.4:R54.
69. Rensing C, Mitra B, Rosen BP. 1997. The zntA gene of Escherichia coliencodes a Zn(II)-translocating P-type ATPase. Proc. Natl. Acad. Sci.U. S. A. 94:14326 –14331.
70. Rhodius VA, Gross CA. 2011. Using DNA microarrays to assay partfunction. Methods Enzymol. 497:75–113.
71. Roe AJ, McLaggan D, Davidson I, O’Byrne C, Booth IR. 1998. Pertur-bation of anion balance during inhibition of growth of Escherichia coli byweak acids. J. Bacteriol. 180:767–772.
72. Sezonov G, Joseleau-Petit D, D’Ari R. 2007. Escherichia coli physiology inLuria-Bertani broth. J. Bacteriol. 189:8746 – 8749.
73. Shingaki-Wells RN, et al. 2011. Differential molecular responses of riceand wheat coleoptiles to anoxia reveal novel metabolic adaptations inamino acid metabolism for tissue tolerance. Plant Physiol. 156:1706 –1724.
74. Singh A, Lynch MD, Gill RT. 2009. Genes restoring redox balance infermentation-deficient E. coli NZN111. Metab. Eng. 11:347–354.
75. Somero GN. 1986. Protons, osmolytes, and fitness of internal milieu forprotein function. Am. J. Physiol. 251:R197–213.
76. Soupene E, He L, Yan D, Kustu S. 1998. Ammonia acquisition in entericbacteria: physiological role of the ammonium/methylammonium trans-port B (AmtB) protein. Proc. Natl. Acad. Sci. U. S. A. 95:7030 –7034.
77. Styrvold OB, et al. 1986. Selection, mapping, and characterization ofosmoregulatory mutants of Escherichia coli blocked in the choline-glycinebetaine pathway. J. Bacteriol. 165:856 – 863.
78. Sulavik MC, Gambino LF, Miller PF. 1995. The MarR repressor of themultiple antibiotic resistance (mar) operon in Escherichia coli: prototypicmember of a family of bacterial regulatory proteins involved in sensingphenolic compounds. Mol. Med. 1:436 – 446.
79. Sundararaj S, et al. 2004. The CyberCell Database (CCDB): a compre-hensive, self-updating, relational database to coordinate and facilitate insilico modeling of Escherichia coli. Nucleic Acids Res. 32:D293–D295.
80. Taymaz-Nikerel H, Borujeni AE, Verheijen PJ, Heijnen JJ, van GulikWM. 2010. Genome-derived minimal metabolic models for Escherichiacoli MG1655 with estimated in vivo respiratory ATP stoichiometry. Bio-technol. Bioeng. 107:369 –381.
81. Teymouri F, Laureano-Perez L, Alizadeh H, Dale BE. 2004. Ammoniafiber explosion treatment of corn stover. Appl. Biochem. Biotechnol. 113-116:951–963.
82. Teymouri F, Laureano-Perez L, Alizadeh H, Dale BE. 2005. Optimiza-tion of the ammonia fiber explosion (AFEX) treatment parameters forenzymatic hydrolysis of corn stover. Bioresour. Technol. 96:2014 –2018.
83. Underwood SA, Buszko ML, Shanmugam KT, Ingram LO. 2004. Lack ofprotective osmolytes limits final cell density and volumetric productivityof ethanologenic Escherichia coli KO11 during xylose fermentation. Appl.Environ. Microbiol. 70:2734 –2740.
84. van Dam J, et al. 2002. Analysis of glycolytic intermediates in Saccharo-myces cerevisiae using anion exchange chromatography and electrosprayionization with tandem mass spectrometric detection. Anal. Chim. Acta460:209 –218.
85. Van Dyk TK, Templeton LJ, Cantera KA, Sharpe PL, Sariaslani FS.2004. Characterization of the Escherichia coli AaeAB efflux pump: a met-abolic relief valve? J. Bacteriol. 186:7196 –7204.
86. Varma A, Palsson BO. 1994. Stoichiometric flux balance models quan-titatively predict growth and metabolic by-product secretion in wild-typeEscherichia coli W3110. Appl. Environ. Microbiol. 60:3724 –3731.
87. Yang S, et al. 2010. Paradigm for industrial strain improvement identifiessodium acetate tolerance loci in Zymomonas mobilis and Saccharomycescerevisiae. Proc. Natl. Acad. Sci. U. S. A. 107:10395–10400.
88. Yomano LP, York SW, Ingram LO. 1998. Isolation and characterizationof ethanol-tolerant mutants of Escherichia coli KO11 for fuel ethanol pro-duction. J. Ind. Microbiol. Biotechnol. 20:132–138.
89. Yomano LP, York SW, Shanmugam KT, Ingram LO. 2009. Deletion ofmethylglyoxal synthase gene (mgsA) increased sugar co-metabolism inethanol-producing Escherichia coli. Biotechnol. Lett. 31:1389 –1398.
90. Yomano LP, York SW, Zhou S, Shanmugam KT, Ingram LO. 2008.Re-engineering Escherichia coli for ethanol production. Biotechnol. Lett.30:2097–2103.
91. Yu D, et al. 2000. An efficient recombination system for chromosomeengineering in Escherichia coli. Proc. Natl. Acad. Sci. U. S. A. 97:5978 –5983.
92. Zaldivar J, Martinez A, Ingram LO. 2000. Effect of alcohol compoundsfound in hemicellulose hydrolysate on the growth and fermentation ofethanologenic Escherichia coli. Biotechnol. Bioeng. 68:524 –530.
93. Zaldivar J, Martinez A, Ingram LO. 1999. Effect of selected aldehydes onthe growth and fermentation of ethanologenic Escherichia coli. Biotech-nol. Bioeng. 65:24 –33.
Hydrolysate Stress in an E. coli Ethanologen
May 2012 Volume 78 Number 9 aem.asm.org 3457
Dow
nloa
ded
from
http
s://j
ourn
als.
asm
.org
/jour
nal/a
em o
n 21
Dec
embe
r 20
21 b
y 17
9.21
5.83
.242
.