Embed Size (px)
Citation preview
ASHG Staff
Learning Cycle Stage(s): Engage/Explore/Explain/Elaborate
ASHG Concept(s) Addressed: Transmission/pa erns of inheritance #3, #4, #6, #7; Gene regula on and expression #11
Time Required: 55‐65 minutes
Engage Lead a class discussion using the following prompt. Allow students to express and discuss their ideas without comment. All people share many characteris cs, yet they look and behave differently. Why? Can you name
some traits that are influenced by genes? Can you name some traits that are not? Explore/Explain 1) Draw an x‐axis and y‐axis on the board. Label the y‐axis “Number of Students” and the x‐axis with
two categories, “Female” and “Male.” Distribute two Post‐it notes (pink for females, blue for males) per student. Direct students to posi on one of their Post‐its above the appropriate label to generate a histogram with two bars. If they do not understand the concept of a histogram, explain it to them. Each Post‐it should be placed above the one below it, so the number of students of each sex will determine the height of each bar. Sex is a reasonable (albeit simplified) model for a discrete (either‐or) trait, and it provides a convenient and obvious contrast to height, which the students examine next.
2) Draw a second graph template on the board next to the first and tle it “Measured Height”. (Leave room for a third, which you’ll add later.) Label the y‐axis “Number of Students” and the x‐axis “Height,” with designa ons in 5‐cm increments from 125 cm to 190 cm. This range will accommodate students from 4’1” to 6’3”. The en re range can be adjusted
higher or lower as necessary to accommodate students’ heights. 3) Direct students to write their heights, in cen meters (cm), in the boxes on their “Student Work‐
sheet” (Appendix I). Tape a tape measure against one wall so that students can measure them‐selves if they do not know their heights. Students may keep their shoes on, to save me.
4) Direct students to round the number they wrote in the box to the nearest 5‐cm increment, and help them as necessary. They should write this new number in the second box and on their second Post‐it notes, again, pink for girls and blue for boys.
5) Ask the students to place their Post‐it note above the numbers that represent their heights, begin‐ning at the bo om of the graph. If there is already a Post‐it note with a student’s height above a par cular number, then the next student with that same height should place his or her Post‐it im‐mediately above the first one, and so on.
6) Stop the students here and lead them in a class discussion before con nuing. a. Describe the similari es and differences of these two graphical representa ons of data. [The most drama c difference is the discrete (sex) versus con nuous or bell‐shaped pa ern
(height). However, within the con nuous height distribu on, another pa ern is usually visible: the bimodal separa on of heights of males and females, with males shi ing to the taller side of the distribu on. The overall height pa ern may resemble a bell curve if there are a sufficiently large number of students, and smaller bell curves may also be apparent for the male and fe‐male distribu ons, embedded within the larger distribu on.]
b. How many versions of sex are there in humans? [The biological and/or gene c basis of sex is complicated by rare developmental and gene c
10 min
5‐8 min
● www.ashg.org/educa on/gena.shtml ●
Complex Trait Gene cs
ASHG Staff
anomalies, but for our purposes here, we are interested in the simplest and most common—male and female.]
c. How many versions of height? [Although it may appear that there are only nine or 10 different “heights” in the class, remem‐
ber that students rounded to the nearest 5 cm. Also, help students recognize that they weren’t measuring in the most accurate ways possible. In a large popula on precisely measured, there would be a vast number of heights between shortest and tallest.]
d. How would you describe the biological influences on sex? On height? Are both of these traits influenced by genes? What explains the difference in the appearance of the two graphs?
[Tall parents tend to have tall children, and short parents tend to have short children, so it ap‐pears that gene cs are important. Most students will recognize this, and all should know that sex is gene cally determined. The difference in the two graphs might be explainable by the fact that a single factor, the Y chromosome, is the primary determinant of maleness. Perhaps the bell curve seen with height means that one factor is not responsible for height. Some students may think that height is en rely environmental. Or perhaps it’s even more complicated.]
7) Distribute to each student a plas c bag containing five pom‐poms each of the six colors below. Dark‐colored (primary) poms will be "contribu ng factors" to height, and lighter‐colored poms will be factors that contribute nothing. a. RED = 10 cm: a red‐colored pom adds 10 cm to height (pink adds nothing) b. BLUE = 7 cm: blue adds 7 cm (light blue adds nothing) c. BROWN = 3 cm: brown adds 3 cm (beige adds nothing)
8) Have students select a combina on of poms that would produce a height of 60 cm and record their combina on on the student sheet (Part C, #1, Appendix I). Use the following ques ons to lead a class discussion. a. Is there more than one way to get the same height? [Yes, 5 red, 1 blue, and 1 brown; or 4 red, 2 blue, and 2 brown; or 3 red, 3 blue, and 3 brown,
etc.] b. Do they have any lighter poms in their combina on? Would it ma er if they did? Why or why
not? [No, because the lighter poms don’t add any height, most students will probably have ignored
them.] c. What physical structures are the poms meant to represent? [Some students may understand that the poms are represen ng genes in this model, even if
they don’t fully understand what genes are or how they work. Those details are not crucial to understanding that complex traits can result from genes.]
9) Tell the students to divide up their poms so that each student has one of each color (red, pink, blue, light blue, and brown, beige; Part C, #3, Appendix I). The extra poms can be put back in the plas c bag and set aside. With the collec on of genes they have now, ask whether they are tall, short, or average height. (A er they get done laughing that they’re only 20 cm tall, prompt them to realize that everyone is the same height under these star ng condi ons.) a. Does inheritance of height work this way? [No, you don’t pick genes from a bag, you get them from parents.] b. What would be a be er model of inheritance? With a series of leading ques ons, get the stu‐
dents to ar culate that two people (parents) should contribute genes, each parent should con‐tribute an equal amount of gene c material (i.e., number of genes), and neither parent should know what genes they are contribu ng.
c. Can an inheritance model that begins with everyone having average height lead to a full range
5‐7 min
5 min
● www.ashg.org/educa on/gena.shtml ●
ASHG Staff
of heights, similar to what you saw at the start of this ac vity, or will it produce just one or a limited number of heights?
[Some students may think that this uniform star ng popula on will yield a next genera on where all offspring are the same height. This is the hypothesis they will test using a model of reproduc on that assumes three‐genes, with two‐alleles each, influence height.]
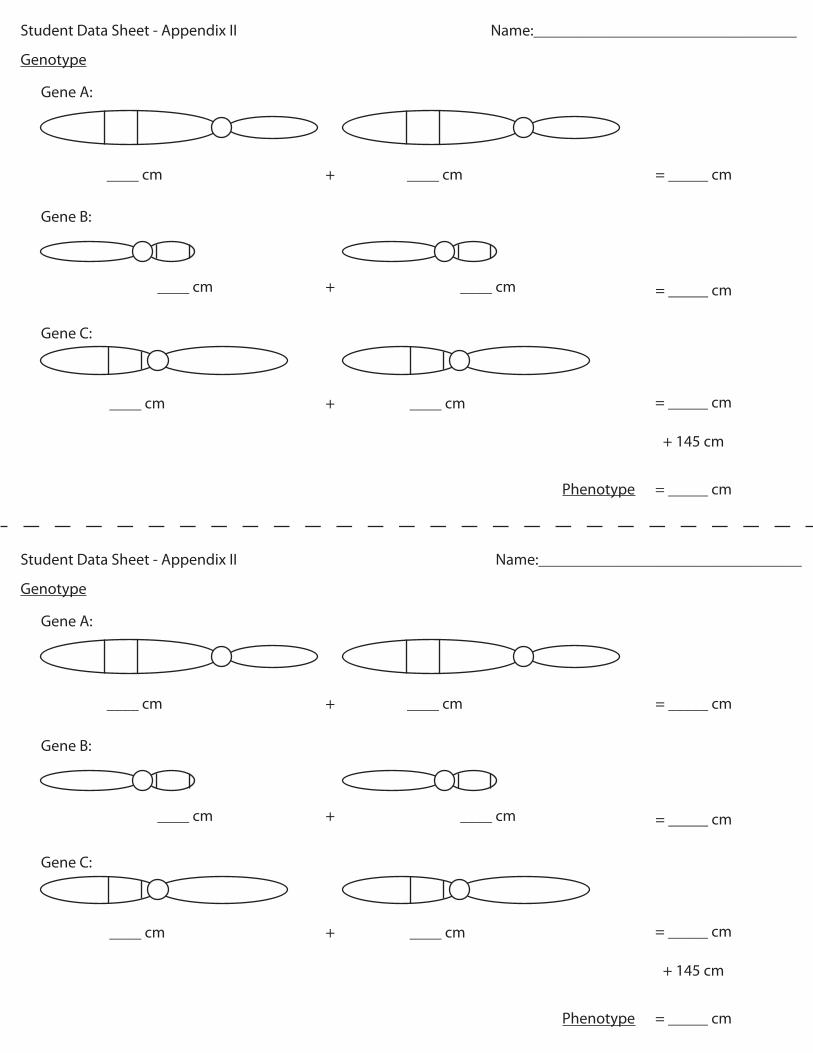
10) Have students use the "Student Data Sheet" (Appendix II) as a more concrete visualiza on of the rela onship between genes and chromosomes (where genes reside) and genes and alleles (alleles are different versions of the same gene and thus occupy the same posi on on matched chromo‐some pairs, one being paternal and the other maternal). Make sure students are placing their poms correctly. All students should now have 165 cm of total height. a. Gene A: Red and pink poms. b. Gene B: Blue and light‐blue poms. c. Gene C: Brown and beige poms.
11) Ask, what do the two poms of complementary colors represent (e.g., red/pink) and does their or‐der ma er? [Some students may realize that each of the two similarly colored poms represents one allele of a par cular gene. It is not necessary to focus on the terminology, such as allele and diploid. The con‐cept that there are two versions of most genes, one donated from the father and the other from the mother, is the important idea. The order‐‐red/le and pink/right, or vice versa‐‐makes no difference.]
12) Ask students to complete steps 5‐7 of Part C of their “Student Worksheet” (Appendix I), which asks students to model meiosis by randomly discarding one allele for each gene and placing each re‐maining allele on the appropriate chromosome on the "New Person" worksheet (Appendix III), un‐der Partner 1. Rather than explicitly iden fying the process as meiosis, it's be er to allow students to come to this realiza on through a series of leading ques ons (assuming they have already learned about meiosis). a. Does everyone have the same combina on now? [No, the process of randomly segrega ng alleles from one another has resulted in different
combina ons.] b. If appropriate for the class, ask: Is there a way to predict the number of unique combina ons
possible given the known number of star ng genes (n=3) and versions of each gene (p=2)? [Yes, pn, or 23 = 8.] c. Why is it important to discard the matches of each color? Do you know what process this step
represents? [If students recognize this as segrega on of alleles, then that's fine, but don’t get side‐tracked
onto meiosis. It may be helpful to point out that having precise amounts of gene c informa on is important, and that halving the gene c informa on is an important step when producing sperm and eggs. This prevents a doubling of gene c informa on each genera on.]
d. Did the random selec on of one of your red/pink factors (or alleles) affect which blue or brown factor was selected?
[This models the independent assortment of genes. However, explicit mapping of these con‐cepts is not essen al to the students' understanding that quan ta ve varia on can be generat‐ed from a uniform star ng popula on with mul ple genes that contribute to the trait.]
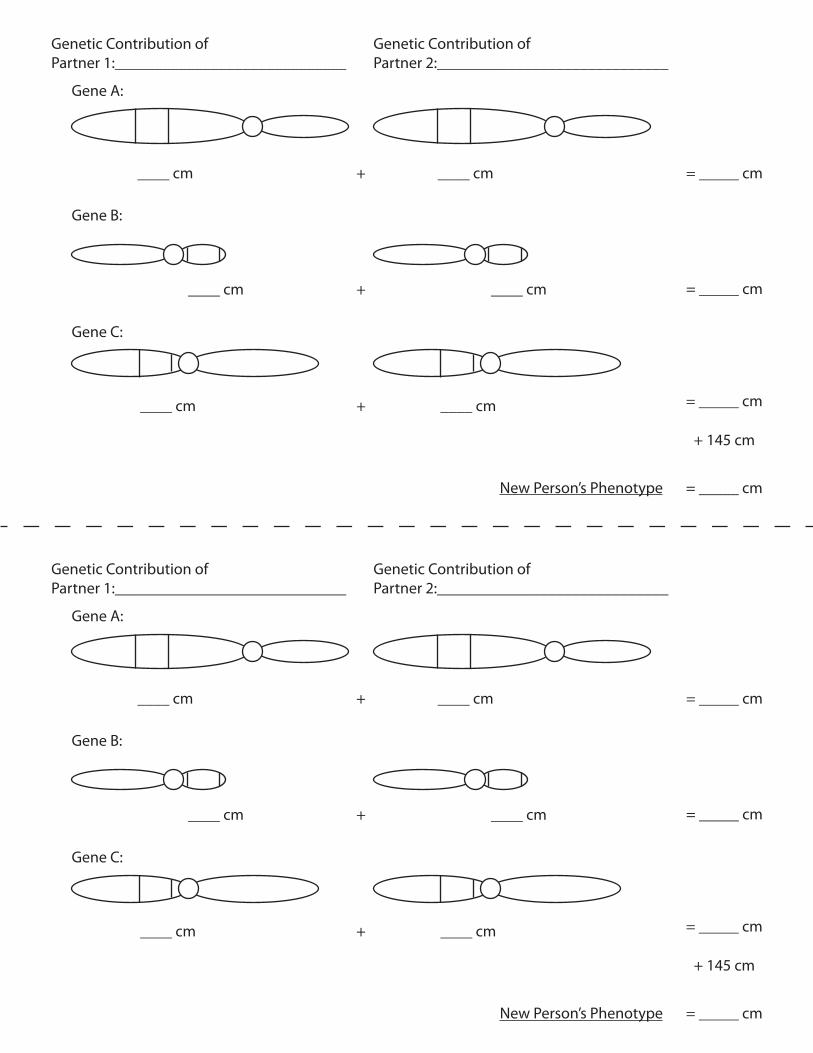
13) To model sexual reproduc on (steps 8 and 9 of Part C of the “Student Worksheet” (Appendix I)), students now pair up, and one student in each pair should transfer his/her alleles to the appropri‐ate chromosomes on his or her partner's worksheet, under Partner 2. They should then calculate their new, rounded height.
10 min
● www.ashg.org/educa on/gena.shtml ●
ASHG Staff
a. What does this step represent? [Even if they didn’t get “producing gametes” earlier, they will probably understand that this
step represents sexual reproduc on.] b. What height does your new combina on produce? c. Going Further (as appropriate): How many combina ons (heights) are represented in the class? [Students can construct a large Punne square if they desire. With two fully heterozygous par‐
ents, the maximum possible is 19 unique heights, but students need only realize that there are many: e.g., six lighter‐colored poms add nothing and yield 145 cm height, five lighter‐colored poms and red yield 155 cm (or blue, 152 cm, or brown, 148 cm), etc., up through six primary colors, 185 cm. There are 64 possible genotype combina ons, 52 account for between 10 and 30 cm; thus, most combina ons should yield average heights, with smaller numbers adding less (as low as zero) or more (up to 40 cm). If the class is small, have the students record the results of their first trial and then repeat it once or twice from step 4 of the student worksheet. This will double or triple the number of “progeny” produced.]
14) Give each pair a new Post‐It note (color does not ma er for this graph). Have students write their ini als as well as their rounded “New Person” height on the Post‐It and have them place it on a “Modeled Height” graph set up next to the “Measured Height” from step 2 (“Number of Progeny” as the x‐axis and “Height” in 5 cm increments from 145‐190 cm on the y‐axis). a. How does this graph, which resulted en rely from a gene c model, compare with the graph of
students' actual heights? [Although there will be differences, the crucial feature will be the similarity in the con nuous
nature of the distribu ons. Like the graph of actual heights (and unlike the sex histogram), this graph does not have just two or a few discrete heights; it displays many. Also, many heights resulted from meiosis and reproduc on even though all students started with the same alleles. Note that this final graph will have only half the number of Post‐Its as the original because the students paired up to produce just one offspring per pair. This is another reason to consider repea ng the segrega on and reproduc on steps from 4 onward.]
b. What biological func ons do you think might be controlled by genes to influence height? [Students might suggest that hormones that affect growth may be encoded by genes, or
growth factors that affect bone development. They may suggest that genes are involved in general metabolism, which might have an impact on growth. Recent research indicates that hundreds of regions of the genome are associated with height (not just three), but height is surprisingly complicated. We s ll do not understand most of the biology underlying it.]
c. Is this an accurate gene c model for height? Why or why not? [Students should recognize some obvious differences, such as the fact that pom poms are not
DNA, genes do not move around by themselves but are connected to chromosomes, and three may seem like an arbitrary number. The model assumes that the effects of genes simply add together, which is a simplifica on that ignores other possible gene c phenomena. The model also assumes simple dominance, where the light‐colored poms are essen ally 'null' alleles that contribute nothing to the trait. It also ignores gene‐gene interac ons. In many cases, different genes may interact with one another, affect each other's expression, and influence the same trait. In other cases, the same genes contribute to different traits. The model also assumes that the three genes are unlinked (i.e., on separate chromosomes). Of the many genes involved in height, some are closely linked to others. Finally, students should note that height may not be en rely gene c, as this model implied. Environment might be important too. They also may suggest that people are not randomly paired for ma ng. In fact, people choose their partners, and height may be one of the characteris cs that is important in mate selec on.]
5‐10 min
● www.ashg.org/educa on/gena.shtml ●
ASHG Staff
d. Is there a way this model could be improved? [The model could be made more complex in several ways, including the addi on of more
"genes," but the simplest and perhaps most important improvement would be to add some effect for environmental influence.]
Elaborate 1) You need at least two addi onal colors of Post‐it notes for this extension. The student pages sug‐
gest green and yellow. To distribute the Post‐its without students being able to see them you might place an appropriate number for the class on a piece of cardboard (equal numbers of green and yellow) and place a dark‐colored piece of fabric (e.g., a scarf) over the top. Have one student from each pair blindly reach under the fabric and peel off one Post‐it. Now reveal that green adds 3 cm to height and yellow subtracts 3 cm. This new Post‐it represents one environmental variable. Students should add or subtract the effect of their environmental variable from the rounded height determined (and graphed) in Part C, and then they should round off this new number. This will en‐sure that each pair's original height will change and their Post‐It note will need to be moved to a taller or shorter posi on. Students should find their original Post‐it and reposi on it to their new (rounded) heights.
2) Use the following ques ons to discuss the influence of environmental factors on height. a. Does the environment affect height? [In developed countries with good nutri on, the environment actually contributes rather li le
to height. In fact, the heritability of height is generally es mated at 80‐90 percent, which means that 80‐90 percent of the variance in height is a ributable to gene c varia on. In other words, people are likely to achieve their gene c poten al for height. However, poor nutri on, especially inadequate protein, is known to contribute to stunted growth. Within one genera‐on of the end of the World War II, the average height of the Japanese popula on increased
almost 5 cm. This was not the result of changes in the popula on's gene cs but in the quality of their diet. Because the environmental influences on height appear to be rela vely minor, the environmentally affected height increments in this model are kept small. However, a 3 cm adjustment, although small, will shi students’ heights when rounding to the nearest 5 cm. This means all students will need to move their heights one histogram bar taller or shorter, so all will see an effect of the environment on their gene c model for height.]
b. Do we have control over our environment, or is environment like genes—mostly just luck of the draw?
[Students' responses to this ques on may be interes ng and may depend on their own person‐al circumstances. It is certainly true that each of us has no control over where we are born, which can be thought of as either chance or determined (in the sense that you are born where your parents are). Regardless of perspec ve, one's environment has a drama c influence on his or her physical, social, and even psychological development, and much of that influence may be difficult to control, such as a violent home life or exposure to pollutants. However, en‐vironment is at least theore cally modifiable, and, to a large extent, we gain greater control over our environments as we become older and more independent.]
c. What are the limita ons of the environment piece of this model? [The model considered only two possible influences on height, and it factored in the effect of
environment a er the genes exerted their effect. In reality, there may be many environmental influences, and genes likely work in concert with those environmental factors to influence traits. It is conceptually simpler to model the environment’s effect on height a er modeling the gene c effects, but it is more accurate to model the combined effects as an interac on at the same me.]
15 min
● www.ashg.org/educa on/gena.shtml ●
ASHG Staff
Appendix I—Student Worksheet Learning Objec ves By the end of this ac vity, you will have a) generated graphs that display distribu ons of discrete and con nuous traits; b) modeled polygenic inheritance, using a three‐gene system, to generate a con nuous distribu on; c) iden fied the limita ons of a genes‐only model; and d) improved your model by including the effects of environmental influences. Part A Listen to the instructor’s direc ons to generate a histogram for sex for the males and females in the class. Part B 1. Write your height, in cen meters (cm), in the box to the right. If you do not know your height, then
use the tape measure against the wall to find it (keep your shoes on). 2. Take the number you wrote down in the box above and round it to a number divisible by 5 (151‐152
rounds down to 150 while 153‐154 rounds up to 155; 156‐157 rounds down to 155; 158‐159 rounds up to 160). Write this number in the box to the right and also on a Post‐it note, pink for girls and blue for boys.
3. On the wall is a graph for height, which is divided by 5‐cm increments along the x‐axis, and number of students,
which is on the y‐axis. Place your Post‐it note above the number that represents your height. If there is already a Post‐it note with your height there, then place yours above the lower Post‐it note.
Stop here and await Instructor’s discussion with the class before con nuing. Part C You have received a plas c bag with pom‐poms of various colors. Imagine that dark‐colored (primary) poms are "contribu ng factors" to height, and lighter‐colored poms are factors that do not contribute to height. For example, assume that:
RED = 10 cm: a red‐colored pom adds 10 cm to height (pink adds nothing) BLUE = 7 cm: blue adds 7 cm (light blue adds nothing) BROWN = 3 cm: brown adds 3 cm (beige adds nothing)
1. What combina on(s) would produce a height of 60 cm? Gather the poms you need to represent this height and
write the combina on(s) here:
____________________________________________________________________________________________ 2. Join the class discussion of the limita ons of this model.
3. Divide up your poms so that you have one of each color (red, pink, blue, light blue, brown, and beige). Place the
● www.ashg.org/educa on/gena.shtml ●
ASHG Staff
extra poms back in the plas c bag. With the collec on of genes you have now, how tall are you? How tall is everyone else in the class?
4. Worksheet "Student Data Sheet" shows pairs of three chromosomes. Place your genes on the rectangular areas of
each chromosome in the pa ern below and then fill in the blank spaces with the appropriate height contribu ons:
Gene A: Red and pink poms. Gene B: Blue and light‐blue poms. Gene C: Brown and beige poms.
5. Place your red and pink poms in one hand and shake them around. Without looking, select one pom and put it aside. Place the remaining pom on the rectangular area of the appropriate chromosome on the “New Person” worksheet under Partner 1.
6. Repeat step 5 with the two dark‐blue/light‐blue poms. 7. Repeat step 5 with the brown/beige poms. 8. Pair up with a second student. One of you should transfer your three genes to the appropriate chro‐
mosomes under Partner 2 so that both sets of genes are on a single worksheet. What height does your new combina on produce? To make the heights more realis c, you will add the amount of height contributed by the two sets of poms to 145 cm, which will give you a final height. Round off to the nearest 5 cm and write this final height in the box.
9. Write your ini als on a Post‐it note along with the final height from the box, and place the Post‐it on the second
height graph. Stop here and await Instructor’s discussion with the class before con nuing.
Part D 1. Select one addi onal Post‐it from the instructor.
a. If you selected a yellow Post‐it, follow the direc ons of the instructor and adjust the rounded height you determined in Part C. Write that new height in the box to the right.
b. If you selected a green Post‐it, follow the direc ons of the instructor and adjust the rounded height you determined in Part C, and write that new height in the box.
2. Now, round off your height to its new, nearest 5 cm, and move the Post‐it note you already placed on the histogram to its new posi on.
● www.ashg.org/educa on/gena.shtml ●
____ cm
Gene A:
____ cm+ = _____ cm
Gene B:
Gene C:
= _____ cm
____ cm + ____ cm
____ cm ____ cm+
= _____ cm
Student Data Sheet - Appendix II Name:_________________________________
Genotype
+ 145 cm
Phenotype = _____ cm
____ cm
Gene A:
____ cm+ = _____ cm
Gene B:
Gene C:
= _____ cm
____ cm + ____ cm
____ cm ____ cm+
= _____ cm
Student Data Sheet - Appendix II Name:_________________________________
Genotype
+ 145 cm
Phenotype = _____ cm
Gene A:
____ cm ____ cm+ = _____ cm
Gene B:
= _____ cm
Gene C:
____ cm + ____ cm
____ cm ____ cm+
= _____ cm
+ 145 cm
New Person’s Phenotype = _____ cm
Genetic Contribution ofPartner 1:_____________________________
Genetic Contribution of Partner 2:_____________________________
Gene A:
____ cm ____ cm+ = _____ cm
Gene B:
= _____ cm
Gene C:
____ cm + ____ cm
____ cm ____ cm+
= _____ cm
+ 145 cm
New Person’s Phenotype = _____ cm
Genetic Contribution ofPartner 1:_____________________________
Genetic Contribution of Partner 2:_____________________________