Embed Size (px)
Citation preview
Data and Information
Compliance and Risk Management Personnel and Labor (FUJIFILM Corporation)
Executive officer* 11 Male: 11, Female: 0
Regular employees 5,006
General employees: 3,682 (Male: 2,898, Female: 784) Managerial personnel: 1,165 (Male: 1,134, Female: 31) Senior expert: 159 (Male: 159 , Female: 0)
Non-regular employees 207
Temporary employees: 139, Part-timers: 7, Employees re-employed after retirement: 19, Other (Contract employees, etc.): 42
*Executive officer = All executive officer – Directors
■ Composition of the Fujifilm workforce As of March 31, 2016
■ Occupational Health and Safety CommitteeThe Occupational Health and Safety Committee convenes with same number of labor and management representatives, in compliance with laws and regulations.
Intended audience (Fuji Xerox and its affiliated companies) Details 2015 results
All managerial staffImportance of Labor Management for business (Web-based training to disseminate the importance of Labor Management that is the foundation of business management)
Once, 5,400 participants/5,000 participants completed the program
All executive officers and employees Training on general legal knowledge (Web-based training for fraud/harassment as well as basic legal knowledge ) Once, 23,592 participants
All employees (including contract/temporary employees)
Risk Management Training (Web-based training on risk management including information security) Once, 30,000 participants
New executive officersNew executive officer training (Group training on general risk management for executives including directors’ management duties and responsibilities, corporate laws, and risk concerning general affairs, human resources, etc.)
Once, 15 participants
New managerial staffNew managerial staff program (Group training such as lectures about disciplinary action and group discussions using examples to obtain general compliance knowledge that managerial staff should know)
5 times, 399 participants
New employees New employee training (Group training for legal compliance that maintain the Basic Corporate Quality by understanding the basic CSR policies and activities) Once, 396 participants
■ Compliance education (Fuji Xerox in Japan)
Compliance
Intended audience Details 2015 results
Executive officers (Fujifilm and its affiliates) Overall compliance (by CP & RM*) Once, 80 participants
Managerial personnel (Fujifilm and its affiliates)
Examples of corporate misconduct, punitive actions, consulting facility, risk reporting system, etc. (by CP & RM*) 55 times, 2,900 participants
New managerial personnel (Fujifilm and its affiliates) Overall compliance (by CP & RM*) 2 times, 154 participants
All employees (Fujifilm and its affiliates, including agency contracted employees)
Discussions based on compliance case studies (by managerial personnel) All divisions
New employees (Fujifilm) Basic knowledge of compliance, employee code of conduct, corporate rule, consulting facility, etc. (by CP & RM*) Once, 183 participants
*CP & RM: Compliance & Risk Management Division of FUJIFILM Corporation
■ Compliance education (Fujifilm in Japan)
Risk Management
Certification Certified affiliates
P-Mark*1 FUJIFILM Medical Co., Ltd.
FUJIFILM Imaging Systems Co., Ltd.
FUJIFILM Techno Service Co., Ltd.
Fuji Xerox System Service Co., Ltd.
Fuji Xerox Learning Institute Inc.
FUJIFILM Imaging Protec Co., Ltd.
FUJIFILM Media Crest Co., Ltd.
Certification Certified affiliates
ISMS*2 FUJIFILM Global Graphic Systems Co., Ltd.
FUJIFILM Software Co., Ltd.FUJIFILM Imaging Systems Co., Ltd.FUJIFILM Imaging Protec Co., Ltd.FUJIFILM Business Expert CorporationFuji Xerox Co., Ltd.
(Global Service Sales)Fuji Xerox domestic sales representative
and sales companiesFuji Xerox InterField Co., Ltd.Fuji Xerox System Service Co., Ltd.Fuji Xerox Prefectural Dealers
11 companies (12 offices)
Fuji Xerox of Shanghai LimitedFuji Xerox Korea Company LimitedFuji Xerox of Shenzhen Ltd.Fuji Xerox Service Creative Co., Ltd.Fuji Xerox Eco-Manufacturing (Suzhou)
Co., Ltd.Fuji Xerox (Thailand) Co., Ltd.Fuji Xerox Advanced Technology Co.,
Ltd.Fuji Xerox Manufacturing Co., Ltd.Fuji Xerox Service Link Co., Ltd.
■ Acquisition of P-Mark and ISMS (As of May, 2016)
*1 Privacy Mark (P-Mark): A mark granted by the Japan Information Processing Development Corporation (JIPDEC) to companies in which personal information is handled appropriately.
*2 ISMS: Certification regarding the overall management framework for information including personal information (Information Security Management System).
Employment
Labor
FY2011 FY2012 FY2013 FY2014 FY2015
Leave of absence for nursing care
2 (Male 1, Female 1)
2 (Male 2, Female 0)
5 (Male 1, Female 4)
3 (Male 1, Female 2)
2 (Male 0, Female 2)
Leave of absence for childcare
34 (Male 2, Female 32)
52 (Male 5, Female 47)
42 (Male 1, Female 41)
43 (Male 1, Female 42)
53 (Male 5, Female 48)
Leave of absence for volunteer work
0 (Male 0, Female 0)
0 (Male 0, Female 0)
0 (Male 0, Female 0)
0 (Male 0, Female 0)
0 (Male 0, Female 0)
*Number of employees who began a leave of absence during the relevant fiscal year.
■ Number of employees taking a leave of absence*
FY2011 FY2012 FY2013 FY2013 FY2015
Nursing care leave
5 (Male 3, Female 2)
13 (Male 6, Female 7)
16 (Male 9, Female 7)
13 (Male 9, Female 4)
15 (Male 10, Female 5)
Childcare leave 2 (Male 1, Female 1)
2 (Male 0, Female 2)
9 (Male 6, Female 3)
6 (Male 4, Female 2)
7 (Male 5, Female 2)
Child medical care
55 (Male 5, Female 50)
71 (Male 11, Female 60)
108 (Male 27, Female 81)
48 (Male 9, Female 39)
59 (Male 16, Female 43)
Volunteer work leave (total number of days)
35 (Male 26, Female 9)
—
1 (Male 1, Female 0)
—
0 (Male 0, Female 0)
—
0 (Male 0, Female 0)
(0)
1 (Male 1, Female 0)
(1)
*Number of employees who began a leave during the relevant fiscal year.
■ �Number of employees taking a care leave and volunteer work leave*
FY2011 FY2012 FY2013 FY2014 FY2015
Employment of the challenged*1 1.81% 1.96% 2.01% 2.12% 2.10%
Re-employment*2 33 29 10 13 19
*1 Data up to April 30, 2016.*2 Re-employment refers to employees re-employed after retirement during the relevant
fiscal year (April 1 to March 31).
■ �Employment of the challenged and re-employment
Union members Proportion of union membership Average age of union members
3,560 71.1% 39.4
*Based on the number of regular employees (5,524)
■ Composition of labor union membership As of March 31, 2016
FY Item
2011 • Revision of employees systems
2012• Revision of travel expenses • Revision of employees systems • Revision of overseas working conditions • Revision of re-employment after retirement
2013 • Revision of work regulations, wage rules and other labor-related regulations
2014
• Extension of the period of nursing care leave • Flexible application for the flextime (for pregnant, childcare, and nursing care) • Expansion of the domestic affiliates for secondment • Revision of work regulations, wage rules and other labor-related regulations partly
2015
• Partial revision of work regulations, wage rules, retirement allowance regulations and overseas travel regulations• Expansion of job assignment destinations within the Fujifilm Group in Japan• Introduction of Home Working System• Introduction of Paid Leave by the Hour System
■ �Revisions to systems operating in accordance with agreements between the labor union and the company (in the last five years) As of March 31, 2016
■ Recruitment
New graduate recruitment (FY2016) 79*1
<Technical positions> Male 31, Female 7 <Administrative positions> Male 25, Female 13<On-site recruitment> Female: 3
Mid-career recruitment 11*2 Male 10, Female 1
*1 As the number of new graduates recruited for the fiscal year is confirmed at the beginning of April, 2016.
*2 Number of mid-career recruitment represents those from April 2015 to March 2016.
Average age Average length of employment (years)
Average number of dependents Average annual salary*1
Total: 41.9Male: 42.2
Female: 40.3
Total: 17.5Male: 17.4
Female: 18.11.41 8.7 million yen
Utilization of paid leave*2 Turnover rate*3 Returning rate from childcare leave*4
Retention rate after 3 years from reinstatement*5
64.6%Total: 2.93%Male: 2.74%
Female: 3.89%
Total: 97.7%Male: 100.0%Female: 97.5%
Total: 80.0%Male: 50.0%
Female: 82.1%
*1 Average annual salary is calculated for the period from January 1, 2015 to December 31, 2015.
*2 Data on utilization of paid leave is calculated based on data for the period from October 1, 2014 to September 30, 2015.
*3 Turnover rate =Attrition + Retirement + Voluntary + New start for senior employees program
Annual average number of employees at FUJIFILM Corporation (non-consolidated)*4 Returning rate from childcare leave is calculated with the expiration date falls on April
1, 2014 to March 31, 2015.*5 Retention rate after 3 years from reinstatement =
Number of employees as of the end of FY2015 among those returning to work after childcare leave in FY2013Number of employees reinstated after childcare leave in FY2013
■ Status of regular employees As of March 31, 2016
Giving birth and childcare
• Systems catering for pre- and post-birth requirements
• Leave of absence for childcare • Use of stock leave for childcare • Systems for employment while raising children
• Three-person interview at the time of returning to work from childcare leave
• Child medical care leave program (1 relevant child: 6 days per year; 2 or more children: 11 days per year)
• Reduced work hour program (child in the third grade or lower)
• Use of stock leave for fertility treatment • Leave of absence for fertility treatment • Exemption from restrictions on non-scheduled hours worked and from work on holidays
• Reinstatement to same workplace after leave of absence for childcare
Nursing care
• Leave of absence for nursing care program • Nursing care leave program (1 care recipient: 12 days per year; 2 or more care recipients: 24 days per year)
• Use of stock leave for nursing care • Systems for employment while caring for a family member
• Expansion of nursing care counseling office
Other
• Leave of absence for volunteer work, Using of stock leave for volunteer work
• Use of stock leave for self-development • Active Life Leave • Flextime
• Discretionary labor system • Leaving the office on time (2 days per week) • Re-employment Program • Female Mentor Program • Home Working System • Paid Leave by the Hour System
■ System for a good work-life balance● �In response to the 2010 amendment to Child Care and Family Care Leave Law, programs
for supporting a balance between work and childcare or family care have been improved, and programs that exceed legal requirements are now in place, such as the improved child medical care leave program and the newly introduced family care leave program.
● �Stock leave is a system enabling employees to accumulate unused leave time up to 60 days. Accumulated leave days may be used for treatment needed for personal health problems, rehabilitation, childcare, nursing care, and volunteer activities.
Industry average in parenthesis
FY2011 FY2012 FY2013 FY2014 FY2015
Work accident rate*1 0.00 (0.25) 0.09 (0.43) 0.11 (0.20) 0.00 (0.40) 0.20 (0.24)
Work accident severity*2 0.00 (0.13) 0.01 (0.12) 0.00 (0.01) 0.00 (0.13) 0.00 (0.00)
* Source for industry average: FY2015 Survey on Industrial Accidents, Ministry of Health, Labour and Welfare
■Work accident rate and work accident severity
Target: 0
60 61FUJIFILM Holdings Corporation Sustainability Report 2016 FUJIFILM Holdings Corporation Sustainability Report 2016
Data and Information
FY2013 FY2014 FY2015
Employees 0 0 0Contracted employees 0 0 0
■ Number of fatal work accidents9,659
■ Number of employees taking occupational health and safety training
■ Composition of the Fuji Xerox workforce As of March 31, 2016
Executive officers* 23 Male: 23, Female: 0
Regular employees 8,703
General employees: 6,260 (Male: 5,104, Female: 1,156)Managerial personnel: 2,375 (Male: 2,237, Female: 138)Contract employees: 68 (Male: 44, Female: 24)
Non-regular employees 766 Temporary employees: 206, Part-timers: 6,
Employees re-employed after retirement: 554
■ Occupational Health and Safety CommitteeThe Occupational Health and Safety Committee convenes with same number of labor and management representatives, in compliance with laws and regulations.
Personnel and Labor (Fuji Xerox)
Employment
Labor
New graduate recruitment (FY2016) 110*1 <Technical positions> Male 51, Female 9
<Administrative positions> Male 25, Female 25Mid-career recruitment 50*2 Male 38, Female 12
*1 As the number of new graduates recruited for the fiscal year is confirmed at the beginning of April, the number in the chart above represents new institute of technology graduate recruitment (Male 1) at the beginning of April 2016.
*2 Number of mid-career recruitment represents those from April 2015 to March 2016.
■ Recruitment
FY2011 FY2012 FY2013 FY2014 FY2015
Employment of persons with disabilities*1 2.19% 2.08% 2.07% 2.06% 2.09%
Re-employment*2 508 485 524 506 554
*1 Data up to March 31, 2016*2 Re-employment refers to the number of employees re-employed as of March 31,
2016.
■ Employment and re-employment of persons with disabilities
Union members Proportion of union membership Average age of union members
6,223 71.5% 41.9
*Based on the number of full-time worker
■ Composition of labor union membership As of March 1, 2016
FY2011 FY2012 FY2013 FY2014 FY2015
Leave of absence for nursing care
2 (Male 0 Female 2)
7 (Male 4, Female 3)
4 (Male 1, Female 3)
3 (Male 1, Female 2)
4 (Male 2, Female 2)
Leave of absence for childcare
62 (Male 8, Female 54)
52 (Male 4, Female 48)
46 (Male 8, Female 38)
56 (Male 9, Female 47)
60 (Male 10, Female 50)
Leave of absence for volunteer work*2
0 (Male 0, Female 0)
0 (Male 0, Female 0)
0 (Male 0, Female 0)
3 (Male 2, Female 1)
0 (Male 0, Female 0)
*1 Number of regular employees who took a new leave during the relevant fiscal year (April 1, 2015 to March 31, 2016).
*2 Number of employees who used the social service program.
■ Number of employees taking a leave of absence*1
* Data only for regular employees (non-regular employees are to be added actually)
Giving birth and childcare
• Maternity leave (paid) • Leave of absence for childcare program (until two years old, including the housing cost support)
• Program for rehiring former employees who left the company for reasons such as spouse’s transfer or childcare
• Accumulated paid leave*1 for healthcare of employees’ family
• Shortened working hours in pregnant and for childcare (from pregnancy to third grade of elementary school)
• Limited off-hours work for childcare (until sixth grade of elementary school)
• Limited late-night work for childcare (until six grade of elementary school)
• Special leave for supporting the wife during her childbirth period (first child’s birth: 2 days; second child’s birth and thereafter: 5 days)
• Leave of absence for birth support (one year leave system for fertility treatment)
Nursing care
• Leave of absence for caring for a family member (maximum 2 years)
• Shortened working hours for caring for a family member
• Limited off-hours work for caring for a family member
• Limited late-night work for caring for a family member
• One-day nursing care leave • Accumulated paid leave*1 for caring for a family member
Other
• Flextime • Homeworking system • Continuous service award special vacation; “refresh vacation”
• Social service system (leave of absence program for employees participating in socially beneficial activities)
• Accumulated paid leave*1 for volunteer activities
• Leave of absence for education • Leave of absence for senior theme (support for senior employees’ second career)
• Flexible work schedules (support for senior employees’ second career)
• Double job program*2 (support for senior employees’ second career)
*1 Accumulated paid leave: A system enabling employees to accumulate unused leave up to 60 days. Accumulated leave may be used for healthcare, childcare, nursing care, and volunteer activities.
*2 Double job program: This is not double duties by order, rather it is program, they are allowed engage in both their current work and work in another division through a system that matches the needs of divisions wanting to utilize senior workers’ skills and experience with the will of senior workers who wish to use their special skills or to take on new challenges.
■ System for a good work-life balance
All those systems provide for generous leave beyond that required by law.
■ �Revisions to systems operating in accordance with agreements between the labor union and the company (in the last five years) As of March, 2016
FY Item
2011 • Revisions to work system on April 1, 2012 in accordance with agreements between the labor union and the company
2012
• Introduction of irregular working hours support system for developers and SEs
• Revision of the employment and evaluation criteria for post-retirement re-employees
2013 • Introduction of on-site irregular working hours support system for SEs
2014 • Introduction of new work style (co-working hour system, homeworking system, remote working system for domestic sales)
2015 • Revision of working conditions, work support and employee welfare with consolidation of various programs at Group companies in Japan
■ �Number of employees taking a care leave*1, and total number of volunteer work leave
* Data only for regular employees (non-regular employees are to be added actually)
FY2011 FY2012 FY2013 FY2014 FY2015
Nursing care leave*2
26 (Male 17, Female 9)
27 (Male 15, Female 12)
26 (Male 16, Female 10)
26 (Male 17, Female 9)
44 (Male 27, Female 17)
Childcare leave*3 237 (Male 86, Female 151)
197 (Male 72, Female 125)
284 (Male 97, Female 187)
298 (Male 86, Female 212)
314 (Male 147, Female 167)
Volunteer work leave*4
(total number of days)
118 (Male 94, Female 24)(530 days)
50 (Male 38, Female 12)(135 days)
15 (Male 11, Female 4)(54 days)
18 (Male 12, Female 6)(47 days)
20 (Male 16, Female 4)(62 days)
*1 Number of regular employees who took a new leave during the relevant fiscal year (April 1, 2015 to March 31, 2016).
*2 Number of employees taking leave of nursing care leave under the “accumulated paid leave (nursing care for family members),” “nursing care for family members” and “one-day nursing care leave” programs
*3 Number of employees taking childcare leave under the “accumulated paid leave (child healthcare)” and “child medical care” programs
As a program equivalent to childcare leave, special leave (of 5 days at most) is granted for care of the eldest child at the time of birth of the second child.
*4 Volunteer work leave shows the number of employees who took “accumulated paid leave (volunteer activity)” and the number of days spent for such activities.
Average age Average length of employment (years)
Average number of dependents Average annual salary*1
Total: 45.3Male: 46.2
Female: 40.3
Total: 20.2Male: 20.9
Female: 16.51.22 9.0 million yen
Utilization of paid leave Turnover rate*2 Returning rate from childcare leave*3
Retention rate after 3 years from reinstatement*4
66.4%Total: 4.1%Male: 4.2%
Female: 3.2%
Total: 97.8%Male: 100.0%Female: 97.3%
Total: 87.9%Male: 100.0% Female: 86.3%
*1 Average annual salary is calculated for the period from January 1, 2015 to December 31, 2015.*2 Turnover rate =
Attrition + Retirement + Transfer + New start for senior employees programNumber of employees in Fuji Xerox at the end of preceding fiscal year (non-consolidated)
+ number of assigned employees*3 Returning rate from childcare leave is calculated with the expiration date falls on April
1, 2015 to March 31, 2016.*4 Retention rate after 3 years from reinstatement =
Number of employees as of the end of current fiscal year among those returning to work after childcare leave in the second preceding fiscal year
Number of employees reinstated after childcare leave in the second preceding fiscal year
■ Status of regular employees As of March 31, 2016
■Work accident rate and work accident severity Industry average in parenthesis
Target: 0
FY2011 FY2012 FY2013 FY2014 FY2015
Work accident rate 0.55 (0.20) 0.31 (0.25) 0.11 (0.18) 0.00 (0.16) 0.00 (0.11)Work accident severity 0.01 (0.01) 0.00 (0.01) 0.00 (0.00) 0.00 (0.13) 0.00 (0.10)
* Source for industry average: FY2015 Survey on Industrial Accidents, Ministry of Health, Labour and Welfare
Environmental Aspects * Organizations covered in the environmental performance data are, as a general rule, those that are shown in the consolidated financial statements, and are significant in terms of environmental burden.However, certain sales and manufacturing (assembly) subsidiaries are excluded.Those not shown specifically are included in the tabulation figures above. Moreover, figures for the Group total may not reflect the sum of each subtotal.
Priority Targets
■ Fujifilm FY2016 Priority Issues
Priority Issues Strategies
1. Contributing to resolving environmental issues through products and services•Measures against global
warming*1
•Water resource conservation• Energy*1 Target: Reducing CO2 emissions
by 20 million tons by FY2020
Develop and disseminate products and services that contribute to resolving environmental issues. (CO2 emission reduction, water issues, energy issues)1) Quantifying Fujifilm’s contribution to CO2 emissions reduction based on the Environmental Contribution
Effectiveness Guidelines to convey our efforts to customers. 2) Quantifying the effects of Fujifilm’s contribution to resolving water resource issues based on the Water Footprint
Guidelines to convey our efforts to customers.
2. Promoting the reduction of energy costs through measures against global warming*2 and efficient energy use*2 Target: By FY 2020, reduce CO2
emissions throughout the life cycle of products by 30% based on the standards set in FY 2005
1) Continually promote CO2 emission reduction at each of the stages of product lifecycle. (procurement, manufacturing, transportation, use, disposal)
2) Conserve energy so as to contribute to resolving energy issues and promote the reduction of energy costs.3) Draw up Fujifilm’s policy on the promotion of measures against global warming from 2020 and beyond.
3. Promoting the efficient use of resources
1) Use resource efficiently by promoting the 3Rs: Reduce-Reuse-Recycle.2) Reduce waste. (by yield increase, reuse of manufacturing waste, conversion of waste into valuables, etc.) 3) Promote the concept of Zero Waste Disposal at main production sites both inside and outside of Japan.4) Promote the effective use of water resources. (saving water to reduce the amount of water use per unit of
production) 5) Determine main products’ indices per unit, and verify their validity.
4. Ensuring product and chemical safety
1) Continue dissemination of approaches and systems to the supply chain concerning management of chemicals in products.
2) Continue to improve the systems for ensuring product compliance.3) Implement safety management based on risk assessment of all chemical substances used.4) Monitor, communicate, and assess product safety information thoroughly.
5. Value chain management from the view point of corporate social responsibility
1) Reinforce Ethical Sourcing investigation for suppliers. 2) Have FF and each of the group companies carry out self CSR assessment and improve their CSR performance.
6. Environment and safety risk management
1) Maintain systems that abide by laws and regulations and adheres to voluntary management targets.2) Improve and promote industrial safety and health.3) Continue to control and maintain the level of VOC emissions generated from the production process.
7. Information disclosure and communication of relevant information
1) Enhance information disclosure through various methods. (e.g., Sustainability Reports, websites) 2) Expand and enhance global management for information regarding environmental performance.
8. Employee education 1) Educate and train employees in the areas of environment, chemicals, product safety, occupational safety, etc.2) Continue implementing employee awareness campaigns on the need to reduce environmental burdens.
■ Fuji Xerox FY2016 Priority Issues
Priority Issues Strategies
1. Controlling global warming*Greenhouse gas reduction target by 2020(1) By FY2020, 30% reduction
in CO2 emissions during the company’s overall lifecycle stage from the level in FY2005
(2) Reduce CO2 emissions at customers by seven million tons by FY2020
1) Contribute to help reduce CO2 emissions from customers’ office and factory by providing energy saving products & solutions
2) Reduce CO2 emissions by installing the new energy-efficient equipment and improving productivity in production process at the development and production sites
3) Reduce CO2 emissions in office by reforming employees’ work style4) Reduce CO2 emissions by improving efficiency in the product logistics
2. Preservation of natural resources
1) Establish the next generation eco-friendly material technologies, such as biomass 2) Reduction of resource input with lighter equipment 3) Curb use of new resources by recycling used parts 4) Reduction of waste output and recovery of valuable substances at production and product development sites5) Reduce water usage in production and product development sites
3. Reduction in environmental risk from chemical substances
1) Reinforce measures against laws and regulations to reduce chemical substance risks from products (observing RoHS, REACH, etc.)
2) Expansion for risk assessment method for chemical substances into sales and service divisions (domestic) 3) Establishment of company-wide explosion prevention standards and project
4. Preservation of ecosystems and biodiversity
1) Promote sustainable paper procurement concerning for forest ecosystems2) Participate in Japan Business Initiative for Biodiversity (JBIB)
5. Improvement of the infrastructure for promoting environmental targets
1) Reinforce systems to grasp environmental performance data2) Reinforce measures to respond proactively to environmental regulation
62 63FUJIFILM Holdings Corporation Sustainability Report 2016 FUJIFILM Holdings Corporation Sustainability Report 2016
20152005(Base year)
0
5,000
10,000
15,000
20,000
25,000
30,000(TJ)
(FY)
2,273235
5,130
3,928
8,081
8,177
24
27,824
20122011 2013
2,132
5,220
9,509
2,587
6,353
25,825
26
2014
2,176
5,525
8,978
2,553
6,475
25,733
39 3338
1,758
5,583
8,334
2,232
6,389
23,35724,02624,333
1,730
5,584
8,391
2,059
6,223
5,280
1,696
8,449
1,931
5,968
Overseas, gas*3
Overseas, heavy oil, etc.*2
Overseas, electric power
Japan, gas*3
Japan, heavy oil, etc.*2
Japan, electric power
Data and Information
Environment Conscious in Logistics
(thousand kiloliters)
■ �Breakdown of consumption of heavy oil, etc. (Fiscal 2015)*
Heavy oil Kerosene Light oil Gasoline
Japan 45.8 1.1 0.1 0.0
Overseas 0.0 0.0 0.7 0.2
Group total 45.8 1.1 0.8 0.2
*Consumption in manufacturing only
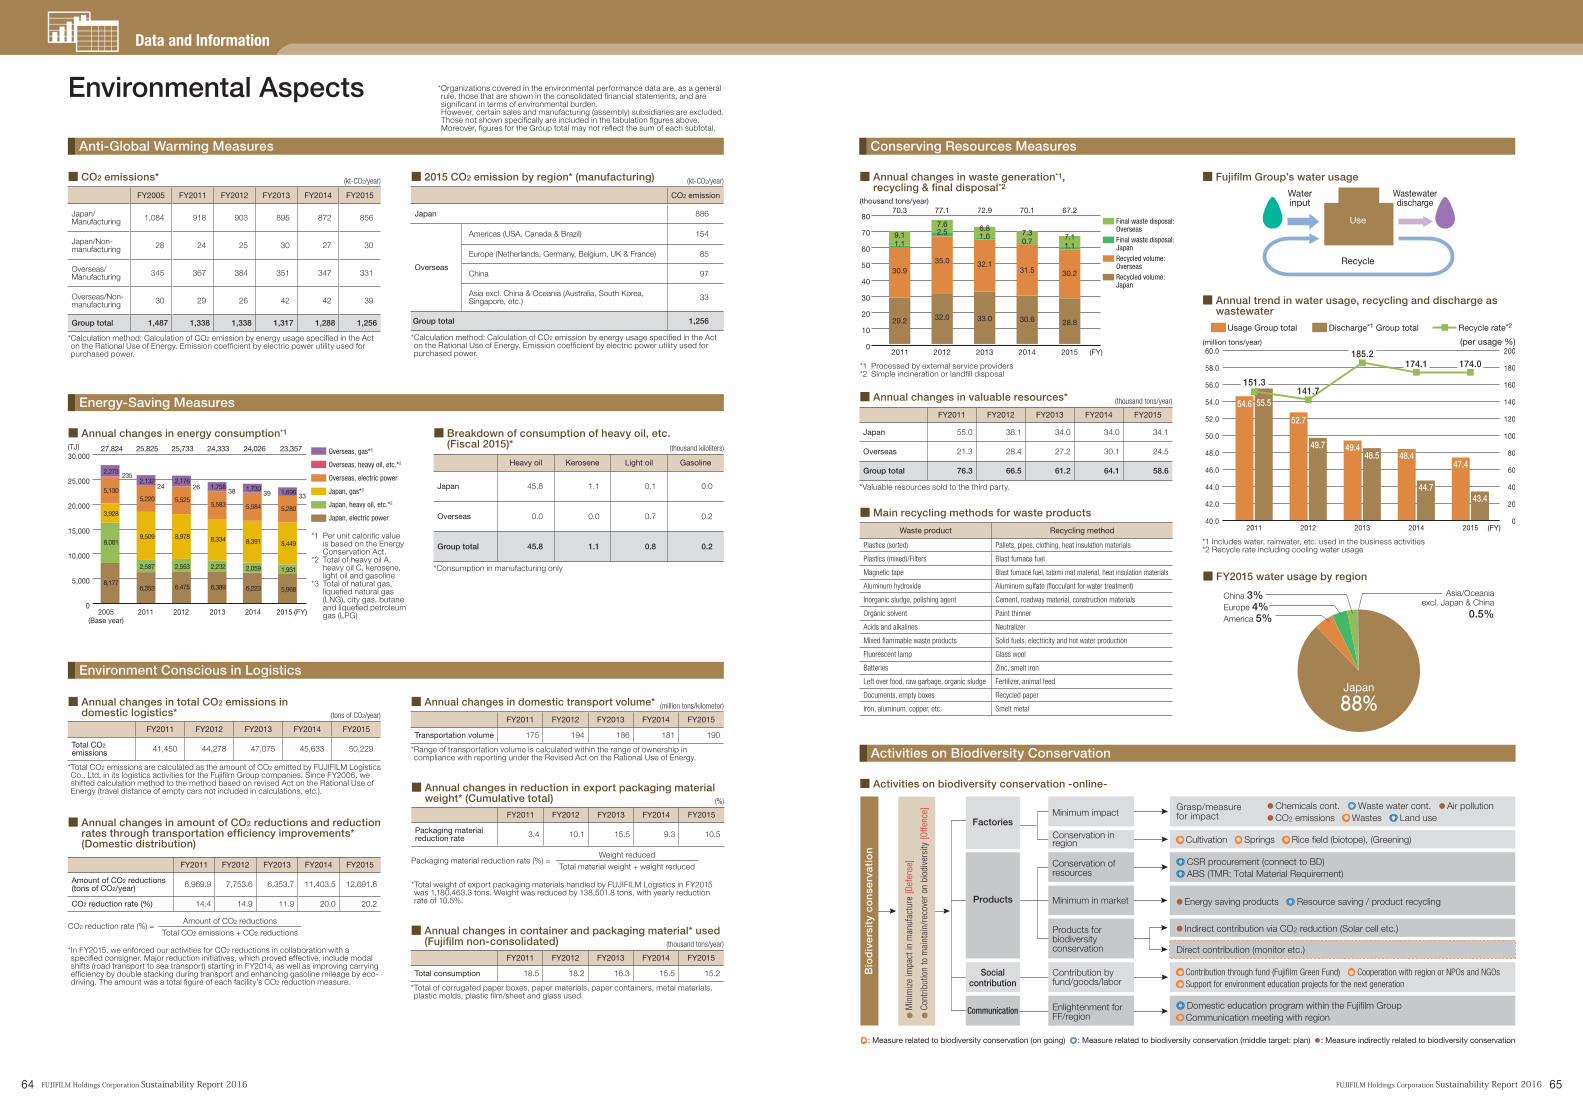
■ Annual changes in energy consumption*1
*1 Per unit calorific value is based on the Energy Conservation Act.
*2 Total of heavy oil A, heavy oil C, kerosene, light oil and gasoline
*3 Total of natural gas, liquefied natural gas (LNG), city gas, butane and liquefied petroleum gas (LPG)
Environmental Aspects
■ CO2 emissions*
FY2005 FY2011 FY2012 FY2013 FY2014 FY2015
Japan/Manufacturing 1,084 918 903 895 872 856
Japan/Non-manufacturing 28 24 25 30 27 30
Overseas/Manufacturing 345 367 384 351 347 331
Overseas/Non-manufacturing 30 29 26 42 42 39
Group total 1,487 1,338 1,338 1,317 1,288 1,256
* Calculation method: Calculation of CO2 emission by energy usage specified in the Act on the Rational Use of Energy. Emission coefficient by electric power utility used for purchased power.
(kt-CO2/year)
* Organizations covered in the environmental performance data are, as a general rule, those that are shown in the consolidated financial statements, and are significant in terms of environmental burden.However, certain sales and manufacturing (assembly) subsidiaries are excluded.Those not shown specifically are included in the tabulation figures above. Moreover, figures for the Group total may not reflect the sum of each subtotal.
Anti-Global Warming Measures
■ 2015 CO2 emission by region* (manufacturing) (kt-CO2/year)
CO2 emission
Japan 886
Overseas
Americas (USA, Canada & Brazil) 154
Europe (Netherlands, Germany, Belgium, UK & France) 85
China 97
Asia excl. China & Oceania (Australia, South Korea, Singapore, etc.) 33
Group total 1,256
* Calculation method: Calculation of CO2 emission by energy usage specified in the Act on the Rational Use of Energy. Emission coefficient by electric power utility used for purchased power.
Energy-Saving Measures
■ �Annual changes in total CO2 emissions in domestic logistics*
FY2011 FY2012 FY2013 FY2014 FY2015
Total CO2 emissions 41,450 44,278 47,075 45,633 50,229
* Total CO2 emissions are calculated as the amount of CO2 emitted by FUJIFILM Logistics Co., Ltd. in its logistics activities for the Fujifilm Group companies. Since FY2006, we shifted calculation method to the method based on revised Act on the Rational Use of Energy (travel distance of empty cars not included in calculations, etc.).
(tons of CO2/year)
■ Annual changes in domestic transport volume*
FY2011 FY2012 FY2013 FY2014 FY2015
Transportation volume 175 194 186 181 190
* Range of transportation volume is calculated within the range of ownership in compliance with reporting under the Revised Act on the Rational Use of Energy.
(million tons/kilometer)
■ �Annual changes in container and packaging material* used (Fujifilm non-consolidated)
FY2011 FY2012 FY2013 FY2014 FY2015
Total consumption 18.5 18.2 16.3 15.5 15.2
* Total of corrugated paper boxes, paper materials, paper containers, metal materials, plastic molds, plastic film/sheet and glass used.
(thousand tons/year)
■ �Annual changes in amount of CO2 reductions and reduction rates through transportation efficiency improvements* (Domestic distribution)
FY2011 FY2012 FY2013 FY2014 FY2015
Amount of CO2 reductions (tons of CO2/year) 6,969.9 7,753.6 6,353.7 11,403.5 12,691.6
CO2 reduction rate (%) 14.4 14.9 11.9 20.0 20.2
CO2 reduction rate (%) =
* In FY2015, we enforced our activities for CO2 reductions in collaboration with a specified consigner. Major reduction initiatives, which proved effective, include modal shifts (road transport to sea transport) starting in FY2014, as well as improving carrying efficiency by double stacking during transport and enhancing gasoline mileage by eco-driving. The amount was a total figure of each facility’s CO2 reduction measure.
Amount of CO2 reductionsTotal CO2 emissions + CO2 reductions
■ �Annual changes in reduction in export packaging material weight* (Cumulative total)
FY2011 FY2012 FY2013 FY2014 FY2015
Packaging material reduction rate 3.4 10.1 15.5 9.3 10.5
Packaging material reduction rate (%) =
* Total weight of export packaging materials handled by FUJIFILM Logistics in FY2015 was 1,180,463.3 tons. Weight was reduced by 138,501.8 tons, with yearly reduction rate of 10.5%.
(%)
Weight reducedTotal material weight + weight reduced
Conserving Resources Measures
Activities on Biodiversity Conservation
Japan
88%
Asia/Oceaniaexcl. Japan & China
China 3%Europe 4%America 5% 0.5%
■ FY2015 water usage by region
Waterinput
Wastewaterdischarge
Recycle
Use
■ Fujifilm Group’s water usage
Factories
Products
Socialcontribution
Communication
Bio
div
ersi
ty c
on
serv
atio
n
Enlightenment for FF/region
Contribution by fund/goods/labor
Products for biodiversity conservation
Minimum in market
Conservation of resources
Conservation in region
Minimum impact
◎ Domestic education program within the Fujifilm Group ○Communication meeting with region
○ Contribution through fund (Fujifilm Green Fund) ○ Cooperation with region or NPOs and NGOs○ Support for environment education projects for the next generation
○ : Measure related to biodiversity conservation (on going) ◎ : Measure related to biodiversity conservation (middle target: plan) ● : Measure indirectly related to biodiversity conservation
Direct contribution (monitor etc.)
● Indirect contribution via CO2 reduction (Solar cell etc.)
●Energy saving products ◎ Resource saving / product recycling
◎ CSR procurement (connect to BD)◎ ABS (TMR: Total Material Requirement)
○Cultivation ○ Springs ○Rice field (biotope), (Greening)
●Chemicals cont. ◎Waste water cont. ●Air pollution ●CO2 emissions ○Wastes ◎ Land use
Grasp/measure for impact
● M
inim
ize
impa
ct in
man
ufac
ture
[Def
ense
]
● C
ontr
ibut
ion
to m
aint
ain/
reco
ver
on b
iodi
vers
ity [O
ffenc
e]
■ Activities on biodiversity conservation -online-
0
10
20
30
40
50
60
70
80
2015 (FY)2014201320122011
(thousand tons/year)67.2
9.11.1
30.9
29.2
70.3 77.1
6.81.0
32.1
33.0
72.9
7.62.5
35.0
32.0
7.30.7
31.5
30.6
70.1
1.17.1
30.2
28.8
Final waste disposal: OverseasFinal waste disposal: JapanRecycled volume: OverseasRecycled volume: Japan
■ �Annual changes in waste generation*1, recycling & final disposal*2
*1 Processed by external service providers*2 Simple incineration or landfill disposal
■Main recycling methods for waste products
Waste product Recycling method
Plastics (sorted) Pallets, pipes, clothing, heat insulation materials
Plastics (mixed)/Filters Blast furnace fuel
Magnetic tape Blast furnace fuel, tatami mat material, heat insulation materials
Aluminum hydroxide Aluminum sulfate (flocculant for water treatment)
Inorganic sludge, polishing agent Cement, roadway material, construction materials
Organic solvent Paint thinner
Acids and alkalines Neutralizer
Mixed flammable waste products Solid fuels, electricity and hot water production
Fluorescent lamp Glass wool
Batteries Zinc, smelt iron
Left over food, raw garbage, organic sludge Fertilizer, animal feed
Documents, empty boxes Recycled paper
Iron, aluminum, copper, etc. Smelt metal
■ Annual changes in valuable resources* (thousand tons/year)
FY2011 FY2012 FY2013 FY2014 FY2015
Japan 55.0 38.1 34.0 34.0 34.1
Overseas 21.3 28.4 27.2 30.1 24.5
Group total 76.3 66.5 61.2 64.1 58.6
* Valuable resources sold to the third party.
60.0
58.0
56.0
54.0
52.0
50.0
48.0
46.0
44.0
42.0
40.0
200
180
160
140
120
100
80
60
40
20
0
(million tons/year) (per usage %)
2011 2012 2013 2014 2015 (FY)
54.6
52.7
49.7 49.448.5 48.4
44.7
55.5
151.3
185.2174.1 174.0
141.7
47.4
43.4
Usage Group total Discharge*1 Group total Recycle rate*2
■ �Annual trend in water usage, recycling and discharge as wastewater
*1 Includes water, rainwater, etc. used in the business activities*2 Recycle rate including cooling water usage
64 65FUJIFILM Holdings Corporation Sustainability Report 2016 FUJIFILM Holdings Corporation Sustainability Report 2016
Data and Information
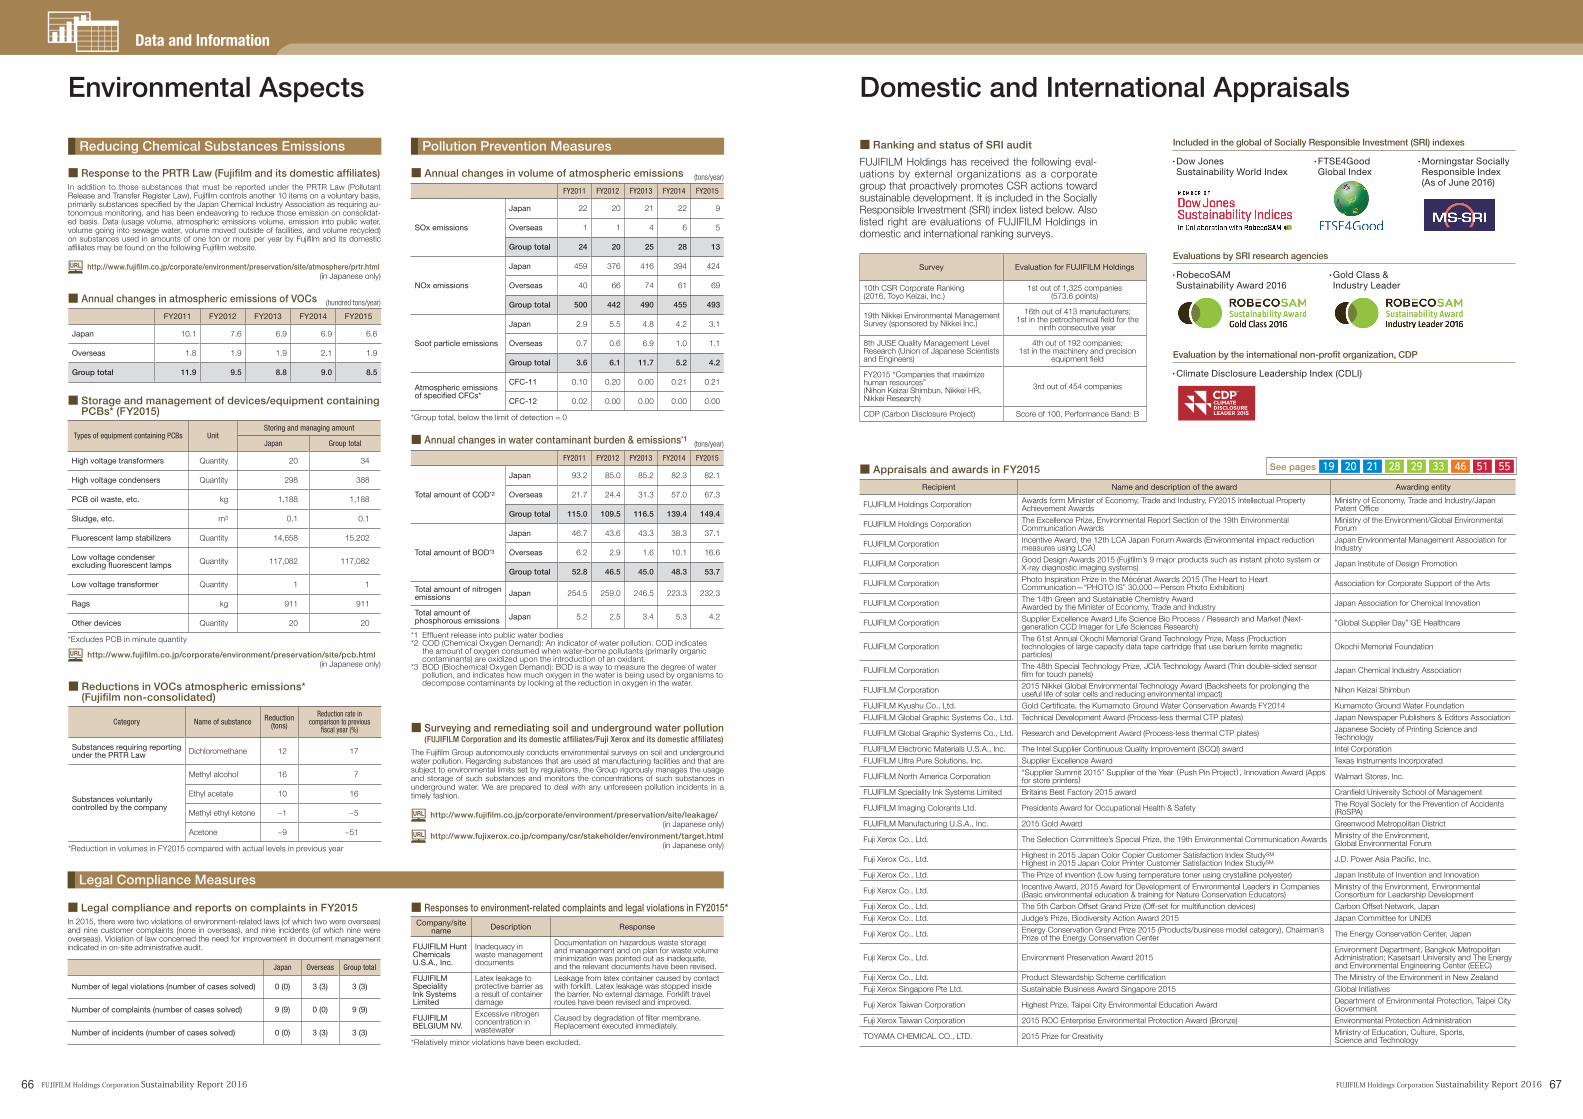
Survey Evaluation for FUJIFILM Holdings
10th CSR Corporate Ranking (2016, Toyo Keizai, Inc.)
1st out of 1,325 companies (573.6 points)
19th Nikkei Environmental Management Survey (sponsored by Nikkei Inc.)
16th out of 413 manufacturers; 1st in the petrochemical field for the
ninth consecutive year
8th JUSE Quality Management Level Research (Union of Japanese Scientists and Engineers)
4th out of 192 companies; 1st in the machinery and precision
equipment field
FY2015 “Companies that maximize human resources” (Nihon Keizai Shimbun, Nikkei HR, Nikkei Research)
3rd out of 454 companies
CDP (Carbon Disclosure Project) Score of 100, Performance Band: B
•Dow Jones Sustainability World Index
•FTSE4Good Global Index
•Morningstar Socially Responsible Index (As of June 2016)
Included in the global of Socially Responsible Investment (SRI) indexes
•RobecoSAM Sustainability Award 2016
•Gold Class & Industry Leader
Evaluations by SRI research agencies
Environmental Aspects
Reducing Chemical Substances Emissions Pollution Prevention Measures
Legal Compliance Measures
■ �Reductions in VOCs atmospheric emissions* (Fujifilm non-consolidated)
Category Name of substance Reduction (tons)
Reduction rate in comparison to previous
fiscal year (%)
Substances requiring reporting under the PRTR Law Dichloromethane 12 17
Substances voluntarily controlled by the company
Methyl alcohol 16 7
Ethyl acetate 10 16
Methyl ethyl ketone −1 −5
Acetone −9 −51
*Reduction in volumes in FY2015 compared with actual levels in previous year
■ Annual changes in atmospheric emissions of VOCs
FY2011 FY2012 FY2013 FY2014 FY2015
Japan 10.1 7.6 6.9 6.9 6.6
Overseas 1.8 1.9 1.9 2.1 1.9
Group total 11.9 9.5 8.8 9.0 8.5
(hundred tons/year)
■ �Storage and management of devices/equipment containing PCBs* (FY2015)
Types of equipment containing PCBs UnitStoring and managing amount
Japan Group total
High voltage transformers Quantity 20 34
High voltage condensers Quantity 298 388
PCB oil waste, etc. kg 1,188 1,188
Sludge, etc. m3 0.1 0.1
Fluorescent lamp stabilizers Quantity 14,658 15,202
Low voltage condenser excluding fluorescent lamps Quantity 117,082 117,082
Low voltage transformer Quantity 1 1
Rags kg 911 911
Other devices Quantity 20 20
*Excludes PCB in minute quantity
http://www.fujifilm.co.jp/corporate/environment/preservation/site/pcb.html(in Japanese only)
■ �Response to the PRTR Law (Fujifilm and its domestic affiliates)In addition to those substances that must be reported under the PRTR Law (Pollutant Release and Transfer Register Law), Fujifilm controls another 10 items on a voluntary basis, primarily substances specified by the Japan Chemical Industry Association as requiring au-tonomous monitoring, and has been endeavoring to reduce those emission on consolidat-ed basis. Data (usage volume, atmospheric emissions volume, emission into public water, volume going into sewage water, volume moved outside of facilities, and volume recycled) on substances used in amounts of one ton or more per year by Fujifilm and its domestic affiliates may be found on the following Fujifilm website.
http://www.fujifilm.co.jp/corporate/environment/preservation/site/atmosphere/prtr.html (in Japanese only)
■ Annual changes in volume of atmospheric emissions
FY2011 FY2012 FY2013 FY2014 FY2015
SOx emissions
Japan 22 20 21 22 9
Overseas 1 1 4 6 5
Group total 24 20 25 28 13
NOx emissions
Japan 459 376 416 394 424
Overseas 40 66 74 61 69
Group total 500 442 490 455 493
Soot particle emissions
Japan 2.9 5.5 4.8 4.2 3.1
Overseas 0.7 0.6 6.9 1.0 1.1
Group total 3.6 6.1 11.7 5.2 4.2
Atmospheric emissions of specified CFCs*
CFC-11 0.10 0.20 0.00 0.21 0.21
CFC-12 0.02 0.00 0.00 0.00 0.00
*Group total, below the limit of detection = 0
(tons/year)
■ �Annual changes in water contaminant burden & emissions*1
FY2011 FY2012 FY2013 FY2014 FY2015
Total amount of COD*2
Japan 93.2 85.0 85.2 82.3 82.1
Overseas 21.7 24.4 31.3 57.0 67.3
Group total 115.0 109.5 116.5 139.4 149.4
Total amount of BOD*3
Japan 46.7 43.6 43.3 38.3 37.1
Overseas 6.2 2.9 1.6 10.1 16.6
Group total 52.8 46.5 45.0 48.3 53.7
Total amount of nitrogen emissions Japan 254.5 259.0 246.5 223.3 232.3
Total amount of phosphorous emissions Japan 5.2 2.5 3.4 5.3 4.2
*1 Effluent release into public water bodies*2 COD (Chemical Oxygen Demand): An indicator of water pollution. COD indicates
the amount of oxygen consumed when water-borne pollutants (primarily organic contaminants) are oxidized upon the introduction of an oxidant.
*3 BOD (Biochemical Oxygen Demand): BOD is a way to measure the degree of water pollution, and indicates how much oxygen in the water is being used by organisms to decompose contaminants by looking at the reduction in oxygen in the water.
(tons/year)
■ �Surveying and remediating soil and underground water pollution (FUJIFILM Corporation and its domestic affiliates/Fuji Xerox and its domestic affiliates)
The Fujifilm Group autonomously conducts environmental surveys on soil and underground water pollution. Regarding substances that are used at manufacturing facilities and that are subject to environmental limits set by regulations, the Group rigorously manages the usage and storage of such substances and monitors the concentrations of such substances in underground water. We are prepared to deal with any unforeseen pollution incidents in a timely fashion.
http://www.fujifilm.co.jp/corporate/environment/preservation/site/leakage/(in Japanese only)
http://www.fujixerox.co.jp/company/csr/stakeholder/environment/target.html(in Japanese only)
Company/site name Description Response
FUJIFILM Hunt Chemicals U.S.A., Inc.
Inadequacy in waste management documents
Documentation on hazardous waste storage and management and on plan for waste volume minimization was pointed out as inadequate, and the relevant documents have been revised.
FUJIFILM Speciality Ink Systems Limited
Latex leakage to protective barrier as a result of container damage
Leakage from latex container caused by contact with forklift. Latex leakage was stopped inside the barrier. No external damage. Forklift travel routes have been revised and improved.
FUJIFILM BELGIUM NV.
Excessive nitrogen concentration in wastewater
Caused by degradation of filter membrane. Replacement executed immediately.
*Relatively minor violations have been excluded.
■ �Responses to environment-related complaints and legal violations in FY2015*■ Legal compliance and reports on complaints in FY2015In 2015, there were two violations of environment-related laws (of which two were overseas) and nine customer complaints (none in overseas), and nine incidents (of which nine were overseas). Violation of law concerned the need for improvement in document management indicated in on-site administrative audit.
Japan Overseas Group total
Number of legal violations (number of cases solved) 0 (0) 3 (3) 3 (3)
Number of complaints (number of cases solved) 9 (9) 0 (0) 9 (9)
Number of incidents (number of cases solved) 0 (0) 3 (3) 3 (3)
Domestic and International Appraisals
■ Ranking and status of SRI audit
FUJIFILM Holdings has received the following eval-uations by external organizations as a corporate group that proactively promotes CSR actions toward sustainable development. It is included in the Socially Responsible Investment (SRI) index listed below. Also listed right are evaluations of FUJIFILM Holdings in domestic and international ranking surveys.
Recipient Name and description of the award Awarding entity
FUJIFILM Holdings Corporation Awards form Minister of Economy, Trade and Industry, FY2015 Intellectual Property Achievement Awards
Ministry of Economy, Trade and Industry/Japan Patent Office
FUJIFILM Holdings Corporation The Excellence Prize, Environmental Report Section of the 19th Environmental Communication Awards
Ministry of the Environment/Global Environmental Forum
FUJIFILM Corporation Incentive Award, the 12th LCA Japan Forum Awards (Environmental impact reduction measures using LCA)
Japan Environmental Management Association for Industry
FUJIFILM Corporation Good Design Awards 2015 (Fujifilm’s 9 major products such as instant photo system or X-ray diagnostic imaging systems) Japan Institute of Design Promotion
FUJIFILM Corporation Photo Inspiration Prize in the Mécénat Awards 2015 (The Heart to Heart Communication—“PHOTO IS” 30,000—Person Photo Exhibition) Association for Corporate Support of the Arts
FUJIFILM Corporation The 14th Green and Sustainable Chemistry AwardAwarded by the Minister of Economy, Trade and Industry Japan Association for Chemical Innovation
FUJIFILM Corporation Supplier Excellence Award Life Science Bio Process / Research and Market (Next-generation CCD Imager for Life Sciences Research) ”Global Supplier Day” GE Healthcare
FUJIFILM CorporationThe 61st Annual Okochi Memorial Grand Technology Prize, Mass (Production technologies of large capacity data tape cartridge that use barium ferrite magnetic particles)
Okochi Memorial Foundation
FUJIFILM Corporation The 48th Special Technology Prize, JCIA Technology Award (Thin double-sided sensor film for touch panels) Japan Chemical Industry Association
FUJIFILM Corporation 2015 Nikkei Global Environmental Technology Award (Backsheets for prolonging the useful life of solar cells and reducing environmental impact) Nihon Keizai Shimbun
FUJIFILM Kyushu Co., Ltd. Gold Certificate, the Kumamoto Ground Water Conservation Awards FY2014 Kumamoto Ground Water FoundationFUJIFILM Global Graphic Systems Co., Ltd. Technical Development Award (Process-less thermal CTP plates) Japan Newspaper Publishers & Editors Association
FUJIFILM Global Graphic Systems Co., Ltd. Research and Development Award (Process-less thermal CTP plates) Japanese Society of Printing Science and Technology
FUJIFILM Electronic Materials U.S.A., Inc. The Intel Supplier Continuous Quality Improvement (SCQI) award Intel CorporationFUJIFILM Ultra Pure Solutions, Inc. Supplier Excellence Award Texas Instruments Incorporated
FUJIFILM North America Corporation “Supplier Summit 2015” Supplier of the Year (Push Pin Project), Innovation Award (Apps for store printers) Walmart Stores, Inc.
FUJIFILM Speciality Ink Systems Limited Britains Best Factory 2015 award Cranfield University School of Management
FUJIFILM Imaging Colorants Ltd. Presidents Award for Occupational Health & Safety The Royal Society for the Prevention of Accidents (RoSPA)
FUJIFILM Manufacturing U.S.A., Inc. 2015 Gold Award Greenwood Metropolitan District
Fuji Xerox Co., Ltd. The Selection Committee’s Special Prize, the 19th Environmental Communication Awards Ministry of the Environment,Global Environmental Forum
Fuji Xerox Co., Ltd. Highest in 2015 Japan Color Copier Customer Satisfaction Index StudySM
Highest in 2015 Japan Color Printer Customer Satisfaction Index StudySM J.D. Power Asia Pacific, Inc.
Fuji Xerox Co., Ltd. The Prize of invention (Low fusing temperature toner using crystalline polyester) Japan Institute of Invention and Innovation
Fuji Xerox Co., Ltd. Incentive Award, 2015 Award for Development of Environmental Leaders in Companies (Basic environmental education & training for Nature Conservation Educators)
Ministry of the Environment, Environmental Consortium for Leadership Development
Fuji Xerox Co., Ltd. The 5th Carbon Offset Grand Prize (Off-set for multifunction devices) Carbon Offset Network, JapanFuji Xerox Co., Ltd. Judge’s Prize, Biodiversity Action Award 2015 Japan Committee for UNDB
Fuji Xerox Co., Ltd. Energy Conservation Grand Prize 2015 (Products/business model category), Chairman’s Prize of the Energy Conservation Center The Energy Conservation Center, Japan
Fuji Xerox Co., Ltd. Environment Preservation Award 2015Environment Department, Bangkok Metropolitan Administration; Kasetsart University and The Energy and Environmental Engineering Center (EEEC)
Fuji Xerox Co., Ltd. Product Stewardship Scheme certification The Ministry of the Environment in New ZealandFuji Xerox Singapore Pte Ltd. Sustainable Business Award Singapore 2015 Global Initiatives
Fuji Xerox Taiwan Corporation Highest Prize, Taipei City Environmental Education Award Department of Environmental Protection, Taipei City Government
Fuji Xerox Taiwan Corporation 2015 ROC Enterprise Environmental Protection Award (Bronze) Environmental Protection Administration
TOYAMA CHEMICAL CO., LTD. 2015 Prize for Creativity Ministry of Education, Culture, Sports, Science and Technology
See pages 19 20 21 28 29 33 46 51 55■ Appraisals and awards in FY2015
•Climate Disclosure Leadership Index (CDLI)
Evaluation by the international non-profit organization, CDP
66 67FUJIFILM Holdings Corporation Sustainability Report 2016 FUJIFILM Holdings Corporation Sustainability Report 2016
Data and Information
Sustainability Accounting (Labor Environment and Social Benefit Accounting, Environmental Accounting)
Labor Environment and Social Benefit Accounting
Environmental Accounting
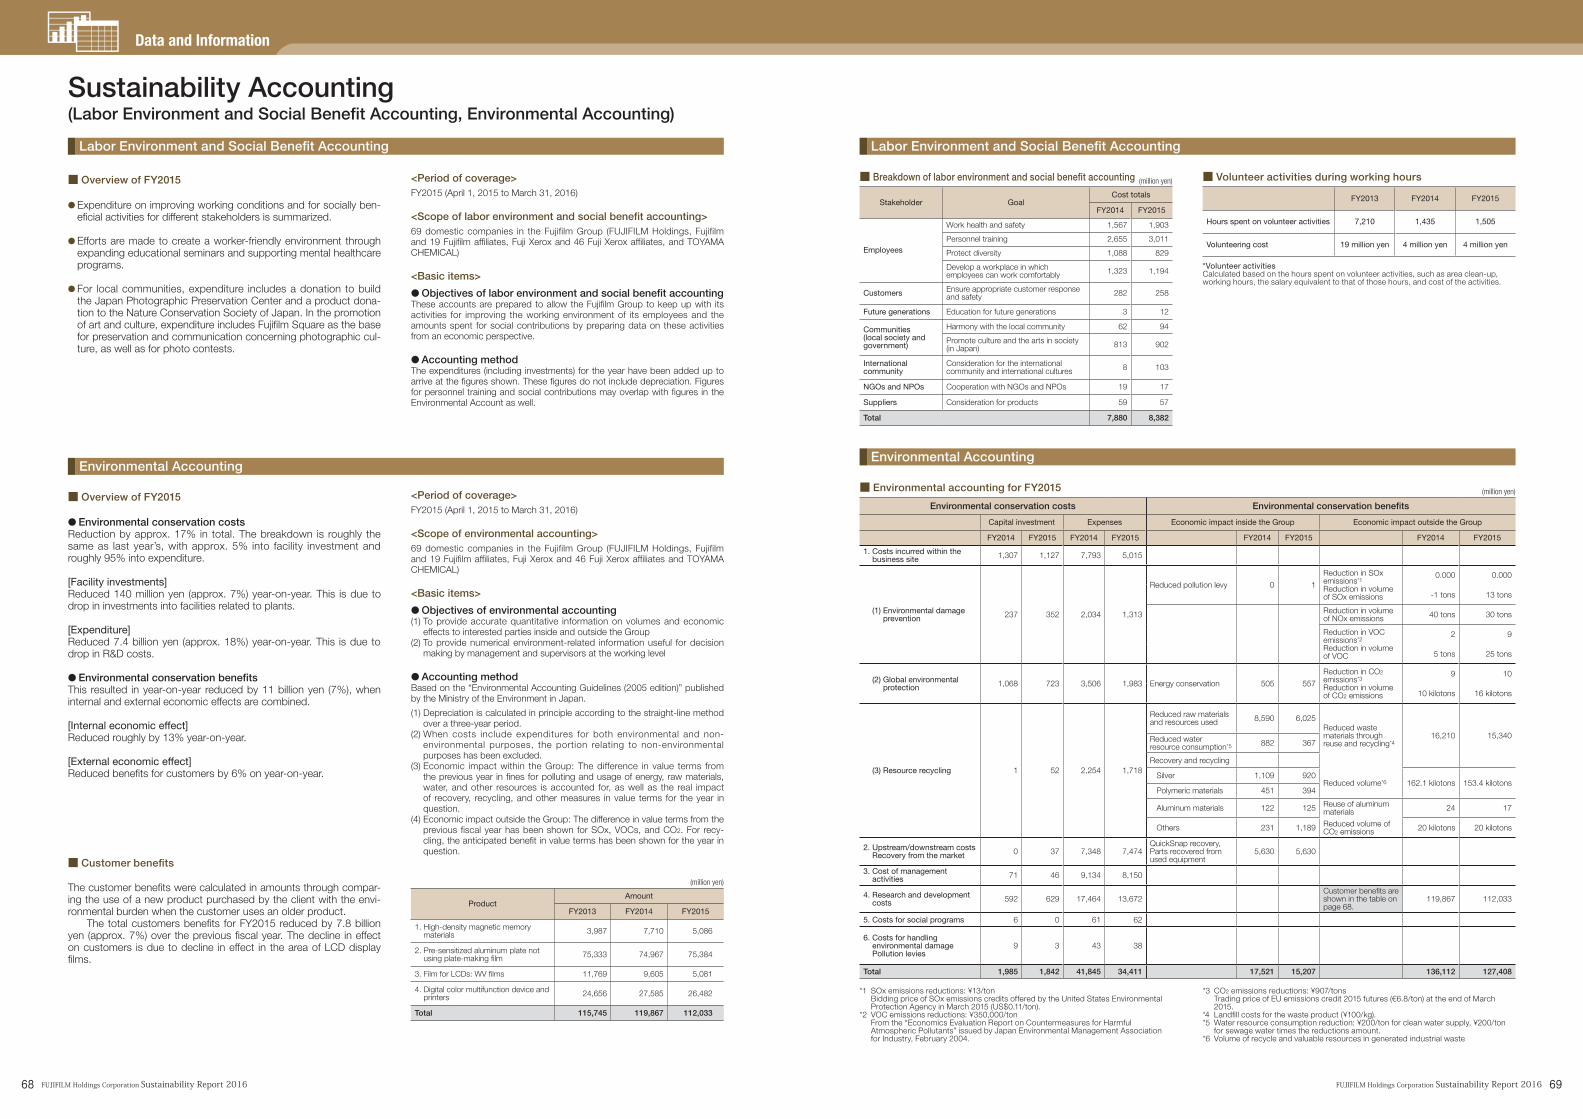
■ Overview of FY2015
● �Expenditure on improving working conditions and for socially ben-eficial activities for different stakeholders is summarized.
● �Efforts are made to create a worker-friendly environment through expanding educational seminars and supporting mental healthcare programs.
● �For local communities, expenditure includes a donation to build the Japan Photographic Preservation Center and a product dona-tion to the Nature Conservation Society of Japan. In the promotion of art and culture, expenditure includes Fujifilm Square as the base for preservation and communication concerning photographic cul-ture, as well as for photo contests.
<Period of coverage>FY2015 (April 1, 2015 to March 31, 2016)
<Scope of labor environment and social benefit accounting>69 domestic companies in the Fujifilm Group (FUJIFILM Holdings, Fujifilm and 19 Fujifilm affiliates, Fuji Xerox and 46 Fuji Xerox affiliates, and TOYAMA CHEMICAL)
<Basic items>
●Objectives of labor environment and social benefit accountingThese accounts are prepared to allow the Fujifilm Group to keep up with its activities for improving the working environment of its employees and the amounts spent for social contributions by preparing data on these activities from an economic perspective.
●Accounting methodThe expenditures (including investments) for the year have been added up to arrive at the figures shown. These figures do not include depreciation. Figures for personnel training and social contributions may overlap with figures in the Environmental Account as well.
■ Overview of FY2015
● Environmental conservation costsReduction by approx. 17% in total. The breakdown is roughly the same as last year’s, with approx. 5% into facility investment and roughly 95% into expenditure.
[Facility investments]Reduced 140 million yen (approx. 7%) year-on-year. This is due to drop in investments into facilities related to plants.
[Expenditure]Reduced 7.4 billion yen (approx. 18%) year-on-year. This is due to drop in R&D costs.
● Environmental conservation benefitsThis resulted in year-on-year reduced by 11 billion yen (7%), when internal and external economic effects are combined.
[Internal economic effect]Reduced roughly by 13% year-on-year.
[External economic effect]Reduced benefits for customers by 6% on year-on-year.
<Period of coverage>FY2015 (April 1, 2015 to March 31, 2016)
<Scope of environmental accounting>69 domestic companies in the Fujifilm Group (FUJIFILM Holdings, Fujifilm and 19 Fujifilm affiliates, Fuji Xerox and 46 Fuji Xerox affiliates and TOYAMA CHEMICAL)
<Basic items>
●Objectives of environmental accounting(1) To provide accurate quantitative information on volumes and economic
effects to interested parties inside and outside the Group(2) To provide numerical environment-related information useful for decision
making by management and supervisors at the working level
●Accounting methodBased on the “Environmental Accounting Guidelines (2005 edition)” published by the Ministry of the Environment in Japan.
(1) Depreciation is calculated in principle according to the straight-line method over a three-year period.
(2) When costs include expenditures for both environmental and non-environmental purposes, the portion relating to non-environmental purposes has been excluded.
(3) Economic impact within the Group: The difference in value terms from the previous year in fines for polluting and usage of energy, raw materials, water, and other resources is accounted for, as well as the real impact of recovery, recycling, and other measures in value terms for the year in question.
(4) Economic impact outside the Group: The difference in value terms from the previous fiscal year has been shown for SOx, VOCs, and CO2. For recy-cling, the anticipated benefit in value terms has been shown for the year in question.
■ Customer benefits
The customer benefits were calculated in amounts through compar-ing the use of a new product purchased by the client with the envi-ronmental burden when the customer uses an older product.
The total customers benefits for FY2015 reduced by 7.8 billion yen (approx. 7%) over the previous fiscal year. The decline in effect on customers is due to decline in effect in the area of LCD display films.
ProductAmount
FY2013 FY2014 FY2015
1. High-density magnetic memory materials 3,987 7,710 5,086
2. Pre-sensitized aluminum plate not using plate-making film 75,333 74,967 75,384
3. Film for LCDs: WV films 11,769 9,605 5,081
4. Digital color multifunction device and printers 24,656 27,585 26,482
Total 115,745 119,867 112,033
(million yen)
Labor Environment and Social Benefit Accounting
Environmental Accounting
■ �Breakdown of labor environment and social benefit accounting (million yen)
Stakeholder GoalCost totals
FY2014 FY2015
Employees
Work health and safety 1,567 1,903
Personnel training 2,655 3,011
Protect diversity 1,088 829
Develop a workplace in which employees can work comfortably 1,323 1,194
Customers Ensure appropriate customer response and safety 282 258
Future generations Education for future generations 3 12
Communities (local society and government)
Harmony with the local community 62 94
Promote culture and the arts in society (in Japan) 813 902
International community
Consideration for the international community and international cultures 8 103
NGOs and NPOs Cooperation with NGOs and NPOs 19 17
Suppliers Consideration for products 59 57
Total 7,880 8,382
■ Volunteer activities during working hours
*Volunteer activitiesCalculated based on the hours spent on volunteer activities, such as area clean-up, working hours, the salary equivalent to that of those hours, and cost of the activities.
FY2013 FY2014 FY2015
Hours spent on volunteer activities 7,210 1,435 1,505
Volunteering cost 19 million yen 4 million yen 4 million yen
(million yen)■ Environmental accounting for FY2015
Environmental conservation costs Environmental conservation benefits
Capital investment Expenses Economic impact inside the Group Economic impact outside the Group
FY2014 FY2015 FY2014 FY2015 FY2014 FY2015 FY2014 FY2015
1. Costs incurred within the business site 1,307 1,127 7,793 5,015
(1) Environmental damage prevention 237 352 2,034 1,313
Reduced pollution levy 0 1
Reduction in SOx emissions*1
0.000 0.000
Reduction in volume of SOx emissions -1 tons 13 tons
Reduction in volume of NOx emissions 40 tons 30 tons
Reduction in VOC emissions*2
2 9
Reduction in volume of VOC 5 tons 25 tons
(2) Global environmental protection 1,068 723 3,506 1,983 Energy conservation 505 557
Reduction in CO2 emissions*3
9 10
Reduction in volume of CO2 emissions 10 kilotons 16 kilotons
(3) Resource recycling 1 52 2,254 1,718
Reduced raw materials and resources used 8,590 6,025
Reduced waste materials through reuse and recycling*4
16,210 15,340Reduced water resource consumption*5 882 367
Recovery and recycling
Silver 1,109 920Reduced volume*6 162.1 kilotons 153.4 kilotons
Polymeric materials 451 394
Aluminum materials 122 125 Reuse of aluminum materials 24 17
Others 231 1,189 Reduced volume of CO2 emissions 20 kilotons 20 kilotons
2. Upstream/downstream costs Recovery from the market 0 37 7,348 7,474
QuickSnap recovery, Parts recovered from used equipment
5,630 5,630
3. Cost of management activities 71 46 9,134 8,150
4. Research and development costs 592 629 17,464 13,672
Customer benefits are shown in the table on page 68.
119,867 112,033
5. Costs for social programs 6 0 61 62
6. Costs for handling environmental damage
Pollution levies9 3 43 38
Total 1,985 1,842 41,845 34,411 17,521 15,207 136,112 127,408
*1 SOx emissions reductions: ¥13/ton Bidding price of SOx emissions credits offered by the United States Environmental
Protection Agency in March 2015 (US$0.11/ton).*2 VOC emissions reductions: ¥350,000/ton From the “Economics Evaluation Report on Countermeasures for Harmful
Atmospheric Pollutants” issued by Japan Environmental Management Association for Industry, February 2004.
*3 CO2 emissions reductions: ¥907/tons Trading price of EU emissions credit 2015 futures (€6.8/ton) at the end of March
2015.*4 Landfill costs for the waste product (¥100/kg).*5 Water resource consumption reduction: ¥200/ton for clean water supply, ¥200/ton
for sewage water times the reductions amount.*6 Volume of recycle and valuable resources in generated industrial waste
68 69FUJIFILM Holdings Corporation Sustainability Report 2016 FUJIFILM Holdings Corporation Sustainability Report 2016