Embed Size (px)
Citation preview
January 2002
NASA/TP2002–210769
Composite Overwrapped Pressure Vessels Harold D. Beeson Lyndon B. Johnson Space Center White Sands Test Facility Dennis D. Davis Honeywell Technology Solutions, Inc. White Sands Test Facility William L. Ross, Sr. Honeywell Technology Solutions, Inc. White Sands Test Facility Ralph M. Tapphorn Honeywell Technology Solutions, Inc. White Sands Test Facility
THE NASA STI PROGRAM OFFICE . . . IN PROFILE
Since its founding, NASA has been dedicated to the advancement of aeronautics and space science. The NASA Scientific and Technical Information (STI) Program Office plays a key part in helping NASA maintain this important role. The NASA STI Program Office is operated by Langley Research Center, the lead center for NASA’s scientific and technical information. The NASA STI Program Office provides access to the NASA STI Database, the largest collec-tion of aeronautical and space science STI in the world. The Program Office is also NASA’s institutional mechanism for disseminating the results of its research and development activi-ties. These results are published by NASA in the NASA STI Report Series, which includes the following report types: • TECHNICAL PUBLICATION. Reports of
completed research or a major significant phase of research that present the results of NASA programs and include extensive data or theoretical analysis. Includes compilations of significant scientific and technical data and information deemed to be of continuing reference value. NASA’s counterpart of peer-reviewed formal professional papers but has less stringent limitations on manu-script length and extent of graphic presenta-tions.
• TECHNICAL MEMORANDUM. Scientific
and technical findings that are preliminary or of specialized interest, e.g., quick release reports, working papers, and bibliographies that contain minimal annotation. Does not contain extensive analysis.
• CONTRACTOR REPORT. Scientific and
technical findings by NASA-sponsored con-tractors and grantees.
• CONFERENCE PUBLICATION. Collected
papers from scientific and technical confer-
ences, symposia, seminars, or other meet-ings sponsored or cosponsored by NASA.
• SPECIAL PUBLICATION. Scientific,
technical, or historical information from NASA programs, projects, and mission, of-ten concerned with subjects having substan-tial public interest.
• TECHNICAL TRANSLATION. English-
language translations of foreign scientific and technical material pertinent to NASA’s mission.
Specialized services that complement the STI Program Office’s diverse offerings include creating custom thesauri, building customized databases, organizing and publishing research results . . . even providing videos. For more information about the NASA STI Program Office, see the following: • Access the NASA STI Program Home Page
at http://www.sti.nasa.gov • E-mail your question via the Internet to
[email protected] • Fax your question to the NASA Access
Help Desk at (301) 621-0134 • Telephone the NASA Access Help Desk at
(301) 621-0390 • Write to: NASA Access Help Desk NASA Center for AeroSpace Information 7121 Standard Hanover, MD 21076-1320

January 2002
NASA/TP2002–210769
Composite Overwrapped Pressure Vessels Harold D. Beeson Lyndon B. Johnson Space Center White Sands Test Facility Dennis D. Davis Honeywell Technology Solutions, Inc. White Sands Test Facility William L. Ross, Sr. Honeywell Technology Solutions, Inc. White Sands Test Facility Ralph M. Tapphorn Honeywell Technology Solutions, Inc. White Sands Test Facility National Aeronautics and Space Administration Johnson Space Center Houston, Texas 77058-3696

Acknowledgments
The authors gratefully acknowledge the many valuable contributions made by members of the WSTF community, including Tommy Yoder, Chris Hare, Rafael Delgado, Chris Keddy, and Paul Spencer. Also, we gratefully acknowledge Col. W. A. Beauchamp (USAF), Wayne Frazier (NASA HQ), Bobby Webb (45th Space Wing), James B. Chang (Aerospace Corp.), Louis Huang (SMC/AXZ), Glen Ecord (NASA JSC), and Saul Ortigoza (SMC/AXEN) for their support of this program and technical guidance.
Available from:
NASA Center for AeroSpace Information National Technical Information Service 7121 Standard 5285 Port Royal Road Hanover, MD 21076-1320 Springfield, VA 22161
This report is also available in electronic form at http://techreports.larc.nasa.gov/cgi-bin/NTRS

iii
Preface This document represents efforts accomplished at the NASA Johnson Space Center White Sands Test Facility (WSTF) in support of the Enhanced Technology for Composite Overwrapped Pressure Vessels Program, a joint research and technology effort among the United States Air Force, NASA, and the Aerospace Corporation. It was originally published as a White Sands document, WSTF-TR-0957, in 1999.
WSTF performed testing for several facets of the program. Testing that contributed to the Task 3.0 COPV database extension objective included baseline structural strength, failure mode and safe-life, impact damage tolerance, sustained load/impact effect, and materials compatibility. WSTF was also responsible for establishing impact protection and control requirements under Task 8.0 of the program. This included developing a methodology for establishing an impact control plan.
The Executive Summary gives an overview of WSTF’s contribution to the program and provides recom-mendations to be considered. Seven test reports follow the Executive Summary and detail the work done at WSTF. As such, this document contributes to the database of information regarding COPV behavior that will ensure performance benefits and safety are maintained throughout vessel service life.

iv

Contents Page
Chapter 1 Test Report for USAF/COPV Program Subtask 3.2: Failure Mode and Safe-Life Testing of Graphite/Epoxy Composite Overwrapped Pressure Vessels.. 1-1
1.1 Introduction .............................................................................................................. 1-1 1.2 Objective .................................................................................................................. 1-2 1.3 Approach .................................................................................................................. 1-2 1.4 Results and Discussion............................................................................................. 1-4 1.4.1 Pretest Inspections.................................................................................................... 1-4 1.4.2 Pressure Cycling....................................................................................................... 1-4 1.4.3 Failure Analysis and Fractography .......................................................................... 1-5 1.4.3.1 Flawed Small Cylindrical COPVs............................................................................ 1-5 1.4.3.2 Unflawed Small Cylindrical COPVs........................................................................ 1-7 1.4.3.3 Flawed Large Spherical COPV................................................................................ 1-7 1.5 General Observations ............................................................................................... 1-8
Chapter 2 Test Report: Enhanced Technology for Composite Overwrapped Pressure Vessels Subtask 3.6: Material Compatibility Testing; Compatibility of Graphite/Epoxy Composite With Space Vehicle Fluids .................................................................... 2-1
2.1 Introduction .............................................................................................................. 2-1 2.2 Objectives................................................................................................................. 2-1 2.3 Approach .................................................................................................................. 2-1 2.4 Experimental ............................................................................................................ 2-2 2.4.1 Materials................................................................................................................... 2-2 2.4.2 Test System .............................................................................................................. 2-3 2.4.3 Procedures ................................................................................................................ 2-3 2.4.3.1 Immersion Procedure ............................................................................................... 2-3 2.4.3.2 Drip Procedure ......................................................................................................... 2-3 2.4.3.3 N2O4 Vapor Exposure Procedure............................................................................ 2-4 2.4.3.4 Post-Exposure Procedures........................................................................................ 2-4 2.4.3.5 Mechanical Impact Procedure.................................................................................. 2-4 2.5 Results ...................................................................................................................... 2-4 2.5.1 Material Reactivity Immersion Tests ....................................................................... 2-4 2.5.2 Materials Reactivity Drip Tests ............................................................................... 2-6 2.5.3 Mechanical Strength Tests ....................................................................................... 2-6 2.5.4 Mechanical Impact Tests.......................................................................................... 2-7 2.6 Discussion ................................................................................................................ 2-7 2.7 Conclusions .............................................................................................................. 2-8
Chapter 3 Test Report: Enhanced Technology for Composite Overwrapped Pressure Vessels Subtask 3.6: Material Compatibility Testing: Exposure/Burst Tests of Lincoln Composites Vessels Summary Report ...................................................................... 3-1
3.1 Introduction .............................................................................................................. 3-1 3.2 Objective .................................................................................................................. 3-1 3.3 Approach .................................................................................................................. 3-1
Contents (cont.) Page
iv
3.4 Experimental ............................................................................................................ 3-2 3.4.1 Test Article............................................................................................................... 3-2 3.4.2 Procedures ................................................................................................................ 3-2 3.4.2.1 Exposure Procedures ................................................................................................ 3-2 3.5 Results ...................................................................................................................... 3-3 3.6 Discussion ................................................................................................................ 3-4 3.7 Conclusions .............................................................................................................. 3-4
Chapter 4 Test Report: Enhanced Technology for Composite Overwrapped Pressure Vessels Subtask 3.6: Material Compatibility Testing Exposure/Burst Tests of Structural Composites Vessels Summary Report ..................................................................... 4-1
4.1 Introduction .............................................................................................................. 4-1 4.2 Objective .................................................................................................................. 4-1 4.3 Approach .................................................................................................................. 4-1 4.4 Experimental ............................................................................................................ 4-2 4.4.1 Test Article............................................................................................................... 4-2 4.4.2 Procedures ................................................................................................................ 4-2 4.4.2.1 Exposure Procedures ................................................................................................ 4-3 4.4.2.2 Burst Procedures ...................................................................................................... 4-3 4.5 Results ...................................................................................................................... 4-3 4.6 Discussion ................................................................................................................ 4-3 4.7 Conclusions .............................................................................................................. 4-4
Chapter 5 Test Report: Impact Damage Effects and Control Applied to Composite Overwrapped Pressure Vessels ................................................................................ 5-1
5.1 Introduction .............................................................................................................. 5-1 5.2 Objective .................................................................................................................. 5-2 5.2.1 Subtask 8.1 Objective............................................................................................... 5-2 5.2.2 Subtask 8.2 Objective............................................................................................... 5-2 5.2.3 Subtask 8.3 Objective............................................................................................... 5-2 5.3 Background .............................................................................................................. 5-2 5.3.1 Historical NDE Inspection Techniques for Gr/Ep Composites ............................... 5-3 5.3.2 Impact Damage Indicators, Protectors, and Control Plans....................................... 5-4 5.4 Approach .................................................................................................................. 5-4 5.4.1 Approach for Subtask 8.1......................................................................................... 5-5 5.4.2 Approach for Subtask 8.2......................................................................................... 5-5 5.4.3 Approach for Subtask 8.3......................................................................................... 5-5 5.5 Experimental and Test Descriptions ........................................................................ 5-6 5.5.1 Subtask 8.1 Experimental and Test Descriptions..................................................... 5-6 5.5.2 Subtask 8.2 Experimental and Test Descriptions..................................................... 5-6 5.5.2.1 Impact Protector Test Apparatus.............................................................................. 5-6 5.5.2.2 Impact Indicator Test Apparatus .............................................................................. 5-7 5.5.2.3 Shipping Container Descriptions ............................................................................. 5-7 5.5.2.4 Shipping Container Handling and Drop Test Descriptions ..................................... 5-8

Contents (cont.) Page
v
5.5.2.5 Handling Drop Test Descriptions............................................................................. 5-8 5.5.3 Subtask 8.3 Experimental and Test Descriptions..................................................... 5-9 5.6 Results and Discussion............................................................................................. 5-9 5.6.1 Subtask 8.1 Results .................................................................................................. 5-9 5.6.1.1 Literature Search Results ......................................................................................... 5-9 5.6.1.2 Industry Survey Results............................................................................................ 5-9 5.6.1.3 Field–Applicable NDE Results ................................................................................ 5-10 5.6.2 Search for Accept or Reject Criteria ........................................................................ 5-12 5.6.3 Subtask 8.2 Results .................................................................................................. 5-14 5.6.3.1 Impact Protector Test Results .................................................................................. 5-14 5.6.3.2 Impact Indicator Test Results................................................................................... 5-16 5.6.3.3 Shipping Container Drop–Test Results.................................................................... 5-17 5.6.3.4 Handling Drop Test Results ..................................................................................... 5-17 5.6.4 Subtask 8.3 Results .................................................................................................. 5-18 5.6.4.1 Impact Control Plan ................................................................................................. 5-18 5.7 Summary and Conclusions....................................................................................... 5-19 5.8 Recommendations .................................................................................................... 5-20
Chapter 6 Test Report, USAF/COPV Program Subtask 3.4: Sustained Load/Impact Effect Testing of Graphite/Epoxy Composite Overwrapped Pressure Vessels ....... 6-1
6.1 Introduction .............................................................................................................. 6-1 6.2 Objective .................................................................................................................. 6-2 6.3 Approach .................................................................................................................. 6-2 6.4 Long-Term Storage Facilities................................................................................... 6-5 6.5 Results and Discussion............................................................................................. 6-7 6.6 Conclusions and Recommendations......................................................................... 6-10
Chapter 7 Test Report: Enhanced Technology for Composite Overwrapped Pressure Vessels Program Subtask 3.3: Graphite/Epoxy COPV Impact Damage Testing Database Extension.................................................................................................................. 7-1
7.1 Introduction .............................................................................................................. 7-1 7.2 Background .............................................................................................................. 7-2 7.2.1 Current Use of COPVs in Aerospace Applications ................................................. 7-2 7.2.2 Future Use of COPVs in Aerospace Applications ................................................... 7-2 7.2.3 Historical Impact Damage Investigations ................................................................ 7-3 7.2.3.1 General Impact Damage Studies of Gr/Ep Composite Laminates ........................... 7-3 7.2.3.2 Impact Damage Studies of Gr/Ep Filament Wound Pressure Vessels..................... 7-4 7.2.4 Historical NDE Inspection Techniques for Gr/Ep Composites ............................... 7-5 7.3 Objectives................................................................................................................. 7-7 7.4 Approach .................................................................................................................. 7-7 7.4.1 Test Program Overview............................................................................................ 7-7 7.4.2 Test Articles ............................................................................................................. 7-8 7.4.3 Test Properties and Influence Parameters ................................................................ 7-8 7.4.3.1 Test Variables .......................................................................................................... 7-8
Contents (cont.) Page
vi
7.4.3.2 Influence Parameters ................................................................................................ 7-9 7.4.4 Test Facilities, Equipment, and Procedures ............................................................. 7-11 7.4.4.1 IMIT System............................................................................................................. 7-11 7.4.4.2 Burst Test System..................................................................................................... 7-12 7.4.4.3 NDE Techniques ...................................................................................................... 7-13 7.4.5 Test Accuracy........................................................................................................... 7-15 7.5 Results and Discussion............................................................................................. 7-16 7.5.1 Baseline Burst Testing ............................................................................................. 7-16 7.5.2 VDT Testing............................................................................................................. 7-17 7.5.3 Typical Impact and Burst Testing ............................................................................ 7-18 7.5.3.1 Typical Impact Test Results..................................................................................... 7-18 7.5.3.2 Typical Burst Test Results ....................................................................................... 7-18 7.5.3.3 Average Burst Strength after Impact........................................................................ 7-18 7.5.3.4 Atypical Impact Test Results ................................................................................... 7-19 7.5.4 NDE Inspection ........................................................................................................ 7-19 7.5.4.1 IR Thermography ..................................................................................................... 7-19 7.5.4.2 Ultrasonic A-scan..................................................................................................... 7-19 7.5.4.3 Eddy Current ............................................................................................................ 7-20 7.5.4.4 Acoustic Emission.................................................................................................... 7-20 7.5.4.5 X-ray Radiography................................................................................................... 7-21 7.5.5 Trend Analysis ......................................................................................................... 7-21 7.5.5.1 Impact Energy Effects .............................................................................................. 7-21 7.5.5.2 Impact Energy Dependence: Critical Impact Energy and Impact Damage Threshold 7-21 7.5.5.3 Impact Location Effects ........................................................................................... 7-22 7.5.5.4 Impact Geometry Effects.......................................................................................... 7-22 7.5.5.5 Pressurization and Pressurization Media Effects ..................................................... 7-23 7.5.5.6 Multiple Impact Effects............................................................................................ 7-24 7.5.5.7 Oblique Impact Effects............................................................................................. 7-24 7.5.5.8 Pressure and Thermal Cycling Effects ..................................................................... 7-24 7.5.5.9 Performance Factor .................................................................................................. 7-24 7.5.6 Summary Comparison With Other COPV Studies .................................................. 7-25 7.6 Conclusions .............................................................................................................. 7-26 7.6.1 Baseline Strength Testing ........................................................................................ 7-26 7.6.2 Impact and Burst Testing ......................................................................................... 7-26 7.6.3 NDE Inspection ........................................................................................................ 7-27 7.6.4 Pressure and Thermal Cycling ................................................................................. 7-28 7.7 Recommendations .................................................................................................... 7-28

Contents (cont.) Page
vii
Tables Table 1. Gr/Ep COPV Test Articles - Physical Parameter Summary ............................................... xvi Table 1-1. COPV Test Article Information....................................................................................... 1-2 Table 1-2. Subtask 3.2 Test Matrix ................................................................................................... 1-3 Table 1-3. Summary of Results ......................................................................................................... 1-5 Table 1-4. Detectability of 6.10-mm (0.240-in.)-Long EDM Notches and Associated Cracking
in Flawed Small Cylindrical COPVs After Cycle-to-Leak Testing ............................ 1-6 Table 1-5 Detectability of EDM Notches and Associated Cracking of Flawed Large Spherical
COPVs, S/N 026 (Water Pressurant), After Cycle-to-Leak Testing ........................... 1-8
Table 2-1. Test Fluid Specifications ................................................................................................. 2-3 Table 2-2. Results for 2-hr Immersions............................................................................................. 2-5 Table 2-3. Results for 8-hr Immersions............................................................................................. 2-5 Table 2-4. Results for Drip Tests ....................................................................................................... 2-6 Table 2-5. Mechanical Strength Test Results ................................................................................... 2-6 Table 2-6. Results for Mechanical Impact Tests............................................................................... 2-7
Table 3-1. Test Fluid Specifications.................................................................................................. 3-2 Table 3-2. Burst Test Results for Lincoln Composites Model 220088-1 COPVs ............................ 3-3
Table 4-1. Test Fluid Specifications.................................................................................................. 4-2 Table 4-2. Burst Test Results for SCI Model AC 5229 COPVs ....................................................... 4-4
Table 5-1. COPV Table Height Drop Tests ...................................................................................... 5-8 Table 5-2. Pro–Cite Search Categories ............................................................................................. 5-10 Table 5-3. Typical COPV Impact Scenarios Encountered During Manufacturing and Service Life 5-11 Table 5-4. Performance Results of Impact Protectors....................................................................... 5-15 Table 5-5. Average Shock Strengths for 10.25–in. Spherical COPV Shipping Container Drop Tests 5-17
Table 6-1. COPV Test Article Information....................................................................................... 6-2 Table 6-2. Impact Test Matrix........................................................................................................... 6-4 Table 6-3 Burst Test Results .............................................................................................................. 6-8
Table 7-1. Gr/Ep COPV Test Articles - Physical Parameter Summary............................................ 7-29 Table 7-2. Baseline COPV Burst Test Results.................................................................................. 7-29 Table 7-3. VDT Results for Subtask 3.3 COPVs.............................................................................. 7-30 Table 7-4. Statistical Burst Strength Results..................................................................................... 7-30 Table 7-5. Assessment Impact Control Requirements for COPV..................................................... 7-31 Table 7-6. Comparison of USAF/NASA Test Results with other COPV Studies............................ 7-31 Figures Figure 1-1. Manufacturer's sketch of flaw dimensions and placement for 19 in. dia spherical COPV. 1-4 Figure 1B-1. Graphite composite overwrapped pressure vessel (GCOPV). ................................... 1B-7 Figure 1B-2. (a) GCOPV cylindrical section. (b) GCOPV hemispherical boss section.................. 1B-8 Figure 1B-3. Through-transmission ultrasonic C-scan of cylindrical GCOPV segment. ................. 1B-8

Contents (cont.) Page
viii
Figure 1B-4. Cross section view of cylindrical segment construction.............................................. 1B-9 Figure 1B-5. Shear-wave, pulse-echo immersion ultrasonic arrangement for interrogation of
the liner wall inner surface. ......................................................................................... 1B-9 Figure 1B-6. Pulse-echo, time-of-flight, ultrasonic C-scan of cylindrical GCOPV segment. .......... 1B-10 Figure 1B-7. X-ray images. ............................................................................................................... 1B-11 Figure 1B-8. X-ray radiographs of EDM slots.................................................................................. 1B-12
Figure 2-1. Test fixture for liquid exposure of composite coupons without edge exposure............. 2-8 Figure 2-2. Results of 2-hr liquid exposure to N2H4. ........................................................................ 2-9 Figure 2-3. Results of 2-hr liquid exposure to MMH. ...................................................................... 2-9 Figure 2-4. Results of 2-hr liquid exposure to UDMH. .................................................................... 2-10 Figure 2-5. Results of 2-hr liquid exposure to IPA. .......................................................................... 2-10 Figure 2-6. Results of 2-hr liquid exposure to RP-1. ........................................................................ 2-11 Figure 2-7. Results of 2-hr liquid exposure to LN2. .......................................................................... 2-11 Figure 2-8. Results of 2-hr liquid exposure to N2O4. ........................................................................ 2-12 Figure 2-9. Results of 2-hr liquid exposure to N2O4 magnified 250 times. ...................................... 2-12 Figure 2-10. Results of 2-hr vapor exposure to N2O4........................................................................ 2-13 Figure 2-11. Results of 8-hr liquid exposure to MMH and UDMH.................................................. 2-13 Figure 2-12. Results of 8-hr liquid exposure to RP-1 and N2H4. ...................................................... 2-14 Figure 2-13. Results of 8-hr liquid exposure to IPA and N2O4. ........................................................ 2-14 Figure 2-14. FTIR spectrum of unexposed Gr/Ep coupon surface. .................................................. 2-15 Figure 2-15. FTIR spectrum of N2O4-exposed Gr/Ep coupon surface.............................................. 2-15 Figure 2-16. Results of drip-test exposure to N2H4. .......................................................................... 2-16 Figure 2-17. Results of drip-test exposure to MMH. ........................................................................ 2-16 Figure 2-18. Results of drip-test exposure to UDMH....................................................................... 2-17 Figure 2-19. Results of drip-test 2-hr exposure to N2O4. .................................................................. 2-17 Figure 2-20. Results of N2H4-immersed flex samples....................................................................... 2-18 Figure 2-21. Results of MMH-immersed flex Samples. ................................................................... 2-19 Figure 2-22. Results of N2O4-immersed flex samples....................................................................... 2-19 Figure 2-23. Results of N2O4 vapor-exposed flex samples. .............................................................. 2-20
Figure 3-1. Typical post-exposure COPV......................................................................................... 3-4 Figure 3-2. Typical post-burst COPV. .............................................................................................. 3-5 Figure 3-3. Burst test results for Lincoln Composites Model 220088-1 COPVs............................... 3-5
Figure 4-1. Typical post-burst and pretest COPVs. .......................................................................... 4-5 Figure 4-2. COPV after exposure to NTO. ........................................................................................ 4-5 Figure 4-3. Burst test results for SCI Model AC 5229 COPVs. ........................................................ 4-6
Figure 5-1. Impact fixture for testing the performance of impact protectors.................................... 5-21 Figure 5-2. COPV wood crate shipping containers........................................................................... 5-21 Figure 5-3. AMP–Shockwriter 3000 mounted on wood crate shipping container lid. ..................... 5-22 Figure 5-4. Correlation plot of normalized BAI to IR–thermographic–NDE area (dimensionless)
for spherical COPVs.................................................................................................... 5-22

Contents (cont.) Page
ix
Figure 5-5. Correlation plot of normalized BAI to IR–thermographic–NDE area (dimensionless) for cylindrical COPVs....................................................................................................... 5-23
Figure 5-6. Deflection geometry of a collapsing spherical cap on a spherical COPV....................... 5-23 Figure 5-7. Correlation plot of normalized BAI to ultrasonic–NDE area (dimensionless) for
spherical COPVs. ........................................................................................................ 5-24 Figure 5-8. Correlation plot of normalized BAI to ultrasonic–NDE area (dimensionless)
for cylindrical COPVs. ................................................................................................ 5-24 Figure 5-9. Correlation plot of normalized BAI to acoustic emission felicity ratio for a
select set of COPVs. .................................................................................................... 5-25 Figure 5-10. Cross–section of composite laminate protector design for COPVs. ............................ 5-25 Figure 5-11. Design sketch of a composite laminate cover for spherical COPV.............................. 5-26 Figure 5-12. Design sketch of a segmented composite laminate cover for cylindrical COPV......... 5-26 Figure 5-13. Acceleration profile resulting from a 107.7–cm (42–in.) drop test of a
10.25–in. spherical COPV mounted within a wood box shipping container. ............. 5-27 Figure 5-14. Impact control plan overview. ...................................................................................... 5-27 Figure 5-15. Impact control requirements suggested for COPVs. .................................................... 5-28 Chart 5B1. Impact Control Plan Overview ....................................................................................... 5B-3 Chart 5B2. Assess BAI of COPV...................................................................................................... 5B-5 Chart 5B3. NDE methods and application procedures for COPV. ................................................... 5B-8 Chart 5B4. Manufacturer’s impact control requirements. ................................................................ 5B-9 Chart 5B5. Shipping ICP requirements. ............................................................................................ 5B-10 Chart 5B6. Receiving inspection ICP requirements.......................................................................... 5B-12 Chart 5B7. Installation and system-level pProcedures for Procedural Only ICP............................. 5B-14 Chart 5B8. Installation and system–level procedure for using Impact Indicators ICP..................... 5B-15 Chart 5B9. Installation and system–level procedures for using Impact Protector ICP. ................... 5B-17 Figure 5B1. Cross–section of COPV impact protector. .................................................................... 5B-18
Figure 6-1. COPV types used for Subtask 3.4 testing....................................................................... 6-3 Figure 6-2. Typical blast enclosure for Subtask 3.4 testing with 19-in. spherical COPV installed.. 6-6 Figure 6-3. (a) Hand pump and associated plumbing (b) vessel plumbing subsystem. .................... 6-7 Figure 6-4. Effect of sustained loading on burst strength of impact-damaged COPVs. ................... 6-9 Figure 6-5. Impacted region of 19-in. spherical COPV (S/N 015), before sustained loading
(approximately 3X magnification). ............................................................................. 6-10 Figure 6-6. Impacted region of 19-in. spherical COPV (S/N 015), after sustained loading,
showing crack growth (approximately 3X magnification).......................................... 6-11 Figure 6-7. Impacted region of 6.6-in.-dia × 20-in.-long cylindrical COPV (S/N 042), before
sustained loading (approximately 3X magnification). ................................................ 6-11 Figure 6-8. Impacted region of 6.6-in.-dia × 20-in.-long cylindrical COPV (S/N 042), after sustained
loading, showing liftoff of delaminated band (approximately 3X magnification)...... 6-12 Figure 6-9. Effects of six-month sustained internal pressure on IR thermographic images of
impacted regions.......................................................................................................... 6-13
Figure 7-1. COPV testing: process flow and data acquisition path. ................................................ 7-35 Figure 7-2. Four representative Gr/Ep COPV test articles. .............................................................. 7-36

Contents (cont.) Page
x
Figure 7-3. The IMIT system. ........................................................................................................... 7-36 Figure 7-4. Oblique impact test setup. .............................................................................................. 7-37 Figure 7-5. Special I-beam frame. ..................................................................................................... 7-37 Figure 7-6. Close-up view of mounted COPV and tup assembly. .................................................... 7-38 Figure 7-7. Blast enclosure. ............................................................................................................... 7-38 Figure 7-8. Typical time-based data output....................................................................................... 7-39 Figure 7-9. Lexan enclosure designed to isolate the test article, with 4 in. dia x 9 in. long COPV installed. 7-40 Figure 7-10. Close-up view of Lexan blast enclosure with mounted 6.6 in. dia x 20 in. long COPV. 7-40 Figure 7-11. Underground control bunker instrumentation. ............................................................. 7-41 Figure 7-12. IR thermography NDE setup. ....................................................................................... 7-41 Figure 7-13. Three-dimensional temperature distribution map of COPV impact damage zone....... 7-42 Figure 7-14. Ultrasonic A-scan NDE setup....................................................................................... 7-43 Figure 7-15. Eddy current NDE setup. .............................................................................................. 7-43 Figure 7-16. Acoustic emission NDE setup. ..................................................................................... 7-43 Figure 7-17. Baseline burst: small spherical COPV. ....................................................................... 7-44 Figure 7-18. Baseline burst: large cylindrical COPV. ..................................................................... 7-44 Figure 7-19. Baseline burst: small cylindrical COPV...................................................................... 7-46 Figure 7-20. Typical fiber cuts. ......................................................................................................... 7-46 Figure 7-21. Typical matrix cracks. .................................................................................................. 7-47 Figure 7-22. Typical crushed fibers. ................................................................................................. 7-48 Figure 7-23. Typical delaminations................................................................................................... 7-50 Figure 7-24. Load-energy response of unpressurized 10.25-in.-dia spherical COPV
impacted at 35 ft-lb...................................................................................................... 7-50 Figure 7-25. Load-energy response of pressurized 10.25-in.-dia spherical COPV
impacted at 35 ft-lb...................................................................................................... 7-51 Figure 7-26. Typical burst after impact of a small spherical COPV................................................. 7-51 Figure 7-27. Typical burst after impact of a large spherical COPV. ................................................ 7-52 Figure 7-28. Typical burst after impact of a small cylindrical COPV. ............................................. 7-52 Figure 7-29. Typical burst after impact of a large cylindrical COPV............................................... 7-53 Figure 7-30. Lexan enclosure with burst COPV. .............................................................................. 7-53 Figure 7-31. Aftermath of pneumatic burst....................................................................................... 7-54 Figure 7-32. IR thermograph of nonvisible damage........................................................................... 7-54 Figure 7-33. Typical thermographs at VDT levels............................................................................ 7-55 Figure 7-34. Ultrasonic A-scan of undamaged COPV...................................................................... 7-56 Figure 7-35. Ultrasonic A-scan of damaged COPV.......................................................................... 7-56 Figure 7-36. Acoustic emission spectra of an undamaged COPV. ................................................... 7-57 Figure 7-37. Acoustic emission spectra of an impact-damaged COPV. ........................................... 7-58 Figure 7-38. Critical impact energy and impact damage threshold for an unpressurized 10.25-in.
spherical COPV........................................................................................................... 7-59 Figure 7-39. Critical impact energy and impact damage threshold for an unpressurized 6.6-in.-dia
× 20-in.-long cylindrical COPV. ................................................................................. 7-59 Figure 7-40. Critical impact energy and impact damage threshold for an unpressurized 13-in.-dia
× 25-in.-long cylindrical COPV. ................................................................................. 7-60

Contents (cont.) Page
xi
Figure 7-41. Critical impact energy and impact damage threshold for an unpressurized 19-in. spherical COPV........................................................................................................... 7-60
Figure 7-42. Data trend for 10.25-in. spherical COPVs.................................................................... 7-61 Figure 7-43. Data trends for 6.6-in.-dia × 20-in.-long cylindrical COPVs. ...................................... 7-61 Figure 7-44. Data trend for 13-in.-dia × 25-in.-long cylindrical COPVs.......................................... 7-61 Figure 7-45. Data trend for 19-in. spherical COPVs......................................................................... 7-61 Figure 7-46. Catastrophic pneumatic burst of a small cylindrical COPV......................................... 7-62

xiii
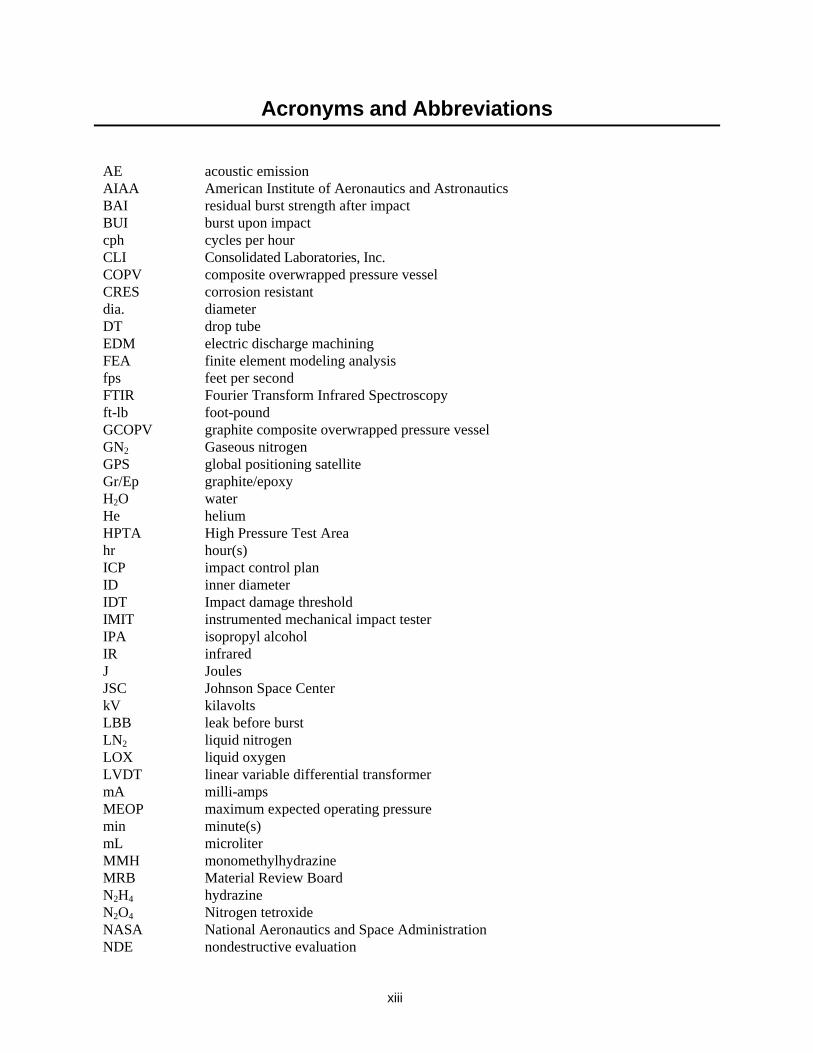
Acronyms and Abbreviations AE acoustic emission AIAA American Institute of Aeronautics and Astronautics BAI residual burst strength after impact BUI burst upon impact cph cycles per hour CLI Consolidated Laboratories, Inc. COPV composite overwrapped pressure vessel CRES corrosion resistant dia. diameter DT drop tube EDM electric discharge machining FEA finite element modeling analysis fps feet per second FTIR Fourier Transform Infrared Spectroscopy ft-lb foot-pound GCOPV graphite composite overwrapped pressure vessel GN2 Gaseous nitrogen GPS global positioning satellite Gr/Ep graphite/epoxy H2O water He helium HPTA High Pressure Test Area hr hour(s) ICP impact control plan ID inner diameter IDT Impact damage threshold IMIT instrumented mechanical impact tester IPA isopropyl alcohol IR infrared J Joules JSC Johnson Space Center kV kilavolts LBB leak before burst LN2 liquid nitrogen LOX liquid oxygen LVDT linear variable differential transformer mA milli-amps MEOP maximum expected operating pressure min minute(s) mL microliter MMH monomethylhydrazine MRB Material Review Board N2H4 hydrazine N2O4 Nitrogen tetroxide NASA National Aeronautics and Space Administration NDE nondestructive evaluation
xiv
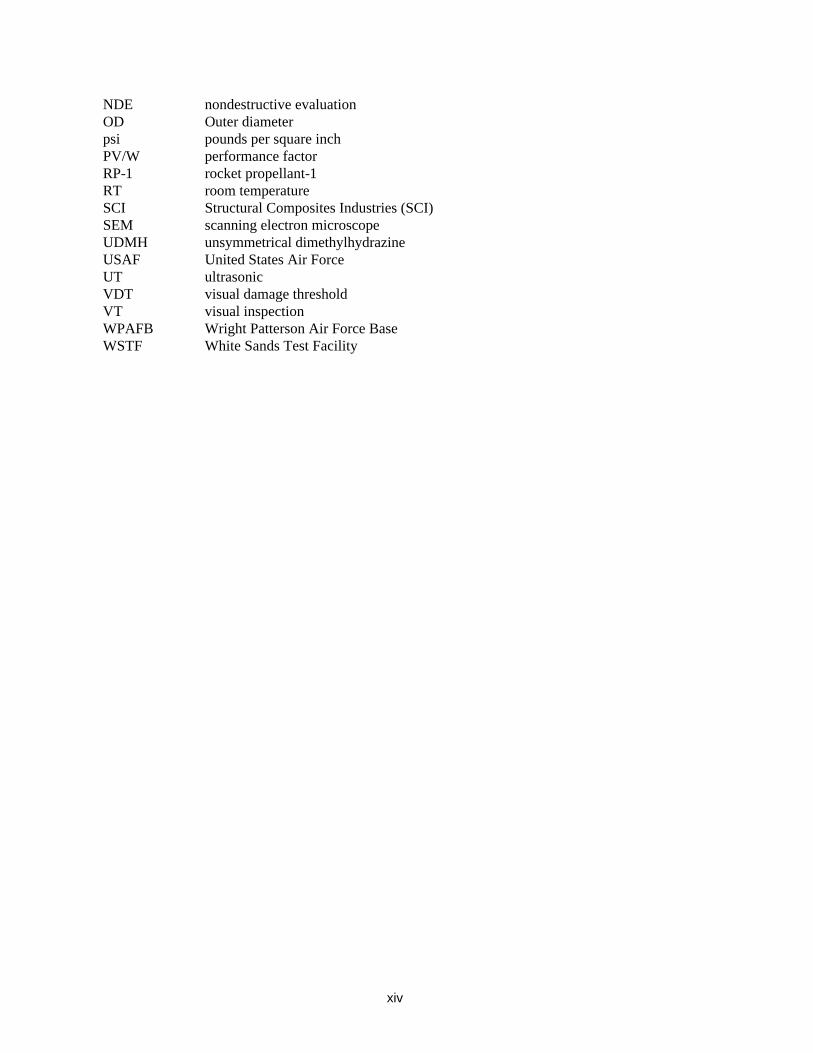
NDE nondestructive evaluation OD Outer diameter psi pounds per square inch PV/W performance factor RP-1 rocket propellant-1 RT room temperature SCI Structural Composites Industries (SCI) SEM scanning electron microscope UDMH unsymmetrical dimethylhydrazine USAF United States Air Force UT ultrasonic VDT visual damage threshold VT visual inspection WPAFB Wright Patterson Air Force Base WSTF White Sands Test Facility

xv
EXECUTIVE SUMMARY FOR DATABASE EXTENSION TASK 3.0
AND IMPACT DAMAGE EFFECTS CONTROL TASK 8.0
Efforts Accomplished at the NASA Johnson Space Center White Sands Test Facility
In Support of the
Enhanced Technology for Composite Overwrapped Pressure Vessels Program
Introduction Pressure vessels fabricated by overwrapping thin metal liners with graphite/epoxy (Gr/Ep) composite materials are increasingly used by industry and government in applications where high strength and low overall system weight are critical factors. As the use of these composite overwrapped pressure vessels (COPVs) increases, the need for information regarding COPV behavior under various conditions be-comes evident to ensure that performance benefits and safety are maintained throughout vessel service life. One way to increase the accuracy of predicting COPV behavior is to conduct empirical studies that expand the available database.
A joint effort by the United States Air Force (USAF), the National Aeronautics and Space Administra-tion (NASA), and the Aerospace Corporation was initiated in 1993 and is detailed in the COPV program plan, Enhanced Technologies for Composite Overwrapped Pressure Vessels (Chang 1993). Nine tasks were identified by the COPV program plan to accomplish the overall program objectives, which were to
• Identify and evaluate critical parameters and procedures of current industry practice in the design, analysis, testing, and operation of spaceflight COPVs to formulate safety requirements for already-built COPVs
• Establish detailed material requirements, key manufacturing parameters, and quality assurance pro-cedures, including non-destructive evaluation (NDE), to enhance safety and reliability of COPVs manufactured in the future
• Investigate practical approaches to improve performance and cost effectiveness of COPVs in space systems
• Provide input into industry and government standards related to the use of COPVs
The NASA Johnson Space Center White Sands Test Facility (WSTF) performed testing for several facets of the Enhanced Technology for Composite Overwrapped Pressure Vessels (COPVs) Program, including baseline structural strength, failure mode and safe-life, impact damage tolerance, sustained load/impact effect, and materials compatibility (Subtasks 3.1, 3.2, 3.3, 3.4, and 3.6, respectively) to contribute to the COPV database extension objective of Task 3.0. Testing was supplemented by an ongoing exploration of NDE techniques and analytical methods. WSTF was also responsible for conducting Task 8.0 of the COPV program plan to establish impact damage control requirements and to develop an impact control plan (ICP) for the COPV manufacturer and user communities. Task 8.0 was prompted by the fact that COPV impact sensitivity had been identified as a major threat to their safe use.

xvi
Test Article Description The four types of test articles examined during this test program are briefly described in Table 1.
Table 1. Gr/Ep COPV Test Articles - Physical Parameter Summary
Thickness
Shape Liner Material Size in.
(cm)
Composite in.
(cm)
Liner in.
(cm)
MEOP* psig
(MPa) Small Spherical Aluminum Alloy
(5086) 10.25 dia
(26.04 dia)
0.162
(0.411)
0.050
(0.127)
6000
(4.22)
Large Spherical Stainless Steel (301 CRES)
19 dia
(48.26 dia)
0.168
(0.427)
0.033
(0.084)
4500
(3.16)
Small Cylindrical Aluminum Alloy (6061-T62)
6.6 dia x 20 long
(16.76 dia x 50.80 long)
0.104
(0.356)
0.040
(0.102)
6000
(4.22)
Large Cylindrical Aluminum Alloy (6061-T62)
13 dia x 25 long
(33.02 dia x 63.50 long)
0.147
(0.373)
0.040
(0.102)
4500
(3.16)
*MEOP - maximum expected operating pressure MEOP for the small spherical COPV was 5000 psi when it was qualified for the Deep Space Program; it was requalified for an MEOP of 6000 psi. The large spherical COPV was flight-qualified for a military space program; it was requalified because of a change of the winding contractor. The small cylindrical COPV was originally qualified for a Pegasus flight and was requalified for a MEOP of 6000 psi. The large cylindrical COPV design was flown in a communications satellite with a MEOP of 4200 psi; it was requalified to a MEOP of 4500 psi.
Objective and Approach for Database Extension Task 3.0
Subtask 3.1: Structural Strength Testing
The objective of Subtask 3.1 was to establish the baseline structural strength of the four types of COPVs used in this test program. This was accomplished by conducting burst tests on undamaged vessels using test parameters similar to the vessel manufacturer. We then compared these data were to those from the manufacturer, and averaged the results to establish undamaged burst strength for future comparison. The effects of vessel cycling before burst were also investigated.
Subtask 3.2: Failure Mode and Safe-Life Testing
The objective of Subtask 3.2 was to address reliability concerns by generating data to evaluate present failure mode and safe-life prediction methodologies. This was accomplished through failure analyses and fractography of vessels, both pristine and with controlled liner flaws, which had been pressure-cycled to the point of insurmountable leakage.

xvii
Subtask 3.3: Impact Damage Testing
The objective of Subtask 3.3 was to assess the effect of impact damage on the burst strength of Gr/Ep COPVs. Specifically, this testing determined what the critical impact variables were, the degree to which impacts could be detected using visible inspection and other NDE methods, and the effects of post-impact pressure cycling on the resultant burst strength after impact (BAI). Influence variables investi-gated during this test program included:
• Impact Energy
• Impact Location
• Impactor Geometry
• Internal Pressurization
• Pressurization Media
• Single, Multiple, and Oblique Impacts
• Pressure and Thermal Cycling
We chose two parameters to test variable effects. The first was the visible damage threshold (VDT), the impact energy that would cause nearly invisible impact damage as determined by visual inspection by three trained inspectors. The second parameter involved impact damage threshold (IDT). The proof pressure specification for the COPVs tested in this program was set at 1.25* MEOP. Therefore, any impact damage that degraded the burst strength of the vessel by 20% or more implied that the vessel might not pass a subsequent proof pressure test. Thus, the 20% degradation level was established as the IDT for these COPVs. We determined both the VDT and IDT for each of the vessel types tested using an unpressurized vessel and a 0.5 in. spherical impactor, and then determined impact variable effects.
After each impact, vessels were inspected visually and with other NDE techniques, including infrared (IR) thermography, coin tapping, eddy current, ultrasonic A-scan, and acoustic emission spectroscopy, to determine how well the impact could be detected with a particular technique. When possible, NDE was correlated to BAI.
Subtask 3.4: Sustained Load Impact Effect Testing
The objective of Subtask 3.4 was to address safety concerns regarding COPVs already built and in use by investigating the effects of continued service, simulated by long-term pressurized storage, on impact-damaged vessels. To accomplish this task, the four vessel types were impact damaged and held under hydrostatic pressure at MEOP for 6 mo. We documented subsequent changes in the impact damage growth and compared the BAI determined from the burst test to the average BAI for data collected in Subtask 3.3 to determine if the sustained pressurization induced additional damage to the vessel beyond the BAI statistical variance for each COPV type under similar impact conditions.
Subtask 3.6: Material Compatibility Testing
The objectives of Subtask 3.6 were to determine the effect that exposure to typical space vehicle fluids under launch processing environments had on the strength of Gr/Ep COPVs and to identify whether a correlation existed between coupon test results and COPV failures. In this investigation, we exposed coupons of overwrap materials to space vehicle fluids of interest, including hydrazine (N2H4),
xviii
monomethylhydrazine (MMH), unsymmetrical dimethylhydrazine (UDMH), dinitrogen tetroxide (N2O4), liquid oxygen (LOX), liquid nitrogen (LN2), isopropyl alcohol (IPA), and rocket propellant-1 (RP-1). If we observed visible or strength degradation in coupons, we then exposed pressurized COPVs to the fluids in question, monitored for up to 8 h, and determined the resulting burst strength.
Objectives and Approach for Impact Damage Effects/Control Task 8.0
COPV impact sensitivity was identified through the testing performed under Subtask 3.3. Results indi-cated the need to establish impact damage control requirements and to develop an ICP for the COPV manufacturer and user communities. The objective of Task 8.0 was to establish these requirements and to develop an ICP that employed state-of-the-art COPV impact damage protection measures. We identi-fied three subtasks:
The objectives of Subtask 8.1 were to
• Develop and maintain a database of information including literature search data, COPV manufactur-ers’ data, COPV spacecraft contractors’ handling and integration data, and the test results of Task 3.0.
• Evaluate NDE techniques for applicability to launch site locations and for use within restricted spatial envelopes associated with COPVs installed in spacecraft or vehicle structures.
• Search for accept/reject criteria for application to COPV impact damage assessment.
The objectives for Subtask 8.2 were to
• Develop and evaluate impact damage indicator and protection schemes for COPVs.
• Perform handling and drop testing of COPVs in shipping containers to evaluate and validate shipping container protection methods.
• Perform handling testing of COPVs to determine any degradation in burst strength resulting from drop impacts that could potentially occur during the manufacturing and installation processes.
The objectives for Subtask 8.3 were to
• Write and validate an ICP.
• Assist industry with the development of guidelines for safe and reliable use of COPVs.
Through examination of Subtask 3.3 test results, literature searches, a COPV impact damage workshop, industry surveys, and site visits, the database information on COPV impact sensitivity was extended and used to determine impact damage control requirements. Additional drop testing that evaluated COPV impact damage sensitivity to potential handling scenarios complemented this database.
Attempts to use NDE data in a quantitative manner to predict the burst strength of impact-damaged COPVs were not successful, primarily because of the large BAI variance associated for a COPV. Future work in this area requires finite element modeling analysis (FEA) that incorporates progressive damage mechanisms as a fundamental method of altering composite material properties during the impact process.
We analyzed typical impact energy levels to evaluate credible threat environments, and tested and evalu-ated impact damage indicator and protection schemes for COPVs. An ICP was written and validated

xix
through performing Subtask 3.3 and Task 8.0 for the joint USAF/NASA COPV program. Elements of this plan are being incorporated into an American Institute of Aeronautics and Astronautics (AIAA) industry standard on the safe use of COPVs.
Conclusions for Database Extension Task 3.0
Subtask 3.1: Structural Strength Testing
Baseline burst tests for all vessels tested in this program were within ±5% agreement with previous levels established by the manufacturers. Standard deviation of the average burst strength for undamaged COPVs was typically less than ±3%, and the average burst strength for all COPVs tested was typically greater than three standard deviations above the safety design factor of 1.5* MEOP.
Burst or failure modes for undamaged COPVs depend on the vessel geometry. Cylindrical vessels typi-cally burst in the transition zone between the dome and the hoop cylindrical section, while spherical vessels with a welded boss design generally fail by blowing out the boss structure.
Pressure cycling of undamaged COPVs up to 50 cycles each caused no degradation of their burst strength when compared to average baseline data.
Subtask 3.2: Failure Mode and Safe-Life Testing
All vessels tested failed in a leak before burst failure mode.
For the 6.6 in. dia by 20 in. long cylindrical COPVs, hydraulically cycled vessels began to leak roughly twice as quickly as pneumatically cycled vessels (~50 vs. ~120 cycles) with no discernable difference in failure mode.
Cylindrical COPVs cycled hydraulically in the unflawed condition demonstrated a cycle life of between 1200 and 1800 cycles before failure.
The 19 in. dia spherical COPV that was flawed on the interior surface of its cryostretched 301 CRES stainless steel metal liner and cycled hydraulically with water subsequently failed at 400 cycles.
Subtask 3.3: Impact Damage Testing
For the small spherical and large cylindrical COPVs, the VDT level for impacts to unpressurized vessels was determined to be 35 ft-lbf (47.4 J), which was comparable to the IDT level (35 ft-lbf, 47.4 J) re-quired to promote an average degradation of 20% in the BAI of the large cylindrical COPV. For the small spherical COPV, the IDT level at the 20% degradation was determined to be 28 ft-lbf (38 J), which is below the VDT level for this vessel.
The IDT at an average 20% degradation for the small cylindrical COPV was determined to be as low as 18 ft-lbf (24.4 J) for impacts to an unpressurized vessel, which is only slightly above the VDT level of 15 ft-lbf (20.3 J) for this vessel.

xx
For the two cylindrical and the small spherical COPVs tested, the impact sensitivity is pertinent for many tool drop scenarios, as it is possible to encounter impacts from these threat environments that potentially degrade the BAI to unacceptable levels below proof pressure.
Only the large spherical COPV had a favorable IDT margin, at 100 ft-lbf (135.6 J) with only a 15% degradation, that was significantly greater that the VDT of 35 ft-lbf (47.4 J) determined for this vessel. The IDT for the large spherical COPV was independent of internal pressure during the impact event.
The cylindrical vessels were found to be more sensitive to impacts in the pressurized conditions. The percent of degradation tended to increase for comparable impact conditions to pressurized cylindrical vessels. The spherical COPVs tended to be more tolerant to impact damage because of its geometry and the cross-ply layup. No significant difference was observed in the degradation of similar pressurized COPVs that would indicate a differentiating influence for hydrostatic vs. pneumatic pressurization methods.
A pneumatic burst during impact of a small cylindrical COPV, pressurized pneumatically to MEOP, occurred within 0.7 s after a 15 ft-lbf (20.3 J) impact and caused a catastrophic event with the potential to injure or kill personnel from blast overpressure and fragment debris.
The effects of dynamically or thermally cycling the COPV 50 times after impact did not decrease the BAI.
Impactor geometry was determined to have a significant influence on COPV degradation for extreme deviations from a nominal 0.5 to 1.0 in. (1.27 to 2.54 cm) hemispherical impactor tup used for most of the impact testing. For example, a screwdriver blade tended to penetrate and cut fibers at impact energies less than 25 ft-lbf (33.9 J) for tests conducted on small spherical COPVs, while a flat tup (2.75 in. dia) did not inflict measurable degradation at 15 ft-lbf (20.3 J).
We conducted limited tests on the small cylindrical COPV to confirm that a normal impact angle is the worst-case impact condition compared to an unconstrained oblique impact angle. The results showed no measurable degradation for a 15 ft lbf (20.3 J) impact in the hoop region of a small cylindrical COPV when impacted at a 45-deg glancing blow relative to the normal angle of incidence using a 0.5-in. (1.27-cm) hemispherical tup.
The effect of impact location was most discernable for the cylindrical COPVs. For the small cylindrical COPV, impacts in the center of the hoop region were more benign compared to impacts near the transi-tion zone because more of the energy was absorbed in global deflection for a vessel of large length-to-diameter ratio. The large cylindrical COPVs exhibited enhanced degradation (34%) for 35 ft-lbf (47.4 J) impacts to the weakest, mid-dome region compared to 20% degradation in the hoop region.
Multiple coincident and adjacent impacts to the small spherical COPV degraded the BAI significantly more than one standard deviation from the average BAI for single impacts under similar impact condi-tions. However, the BAI for multiple impacts to small cylindrical COPVs was not appreciably decreased from that of a single impact value.
The statistical spread in the BAI standard deviation was relatively large (±6% of the average degraded burst pressure) for all but the large spherical COPV. This made it difficult to determine distinct variable effects or to predict with any degree of confidence the burst pressure based on visual or NDE analysis of the impact-damaged region.

xxi
The results of NDE inspections of impact-damaged COPV demonstrated that visual, IR thermography, ultrasonic A-scan, coin tapping, and acoustic emission are the most useful for qualitative identification of impact damage. Although several methods were useful for quantitatively identifying the impact damage area, the correlation between a measured area and the BAI value was so poor that the process cannot be used to predict the burst strength of the vessel with any degree of certainty.
In general, more than one NDE technique should be employed to assess the likelihood that an observed discontinuity is related to impact damage. We used visual and IR thermography NDE in a complemen-tary manner to perform global inspections of large areas on the COPV. Both techniques can be per-formed in situ with some limitations once the COPV is enclosed within a spacecraft structure. Ultrasonic and coin tapping NDE techniques were routinely used to perform localized diagnostic inspections of discontinuities identified through visual or IR thermography. Finally, the acoustic emission Felicity ratio was a useful indicator of potential impact damage to a COPV, provided the measurement could be made without noise interference from orifice flow in a pneumatic pressurization system.
None of the NDE methods were useful for detecting or determining the percentage of fractured fibers associated with an impact event. As a result, predicting the residual burst strength after impact was virtually impossible based solely on NDE analysis.
X-ray testing was used only for COPV metal liners during their initial receipt. This NDE technique allowed for verification of liner integrity and mapping of any defects normally invisible to visual inspection techniques.
Subtask 3.4: Sustained Load Impact Effect Testing
No additional degradation of residual strength in the impact-damaged COPVs tested was produced by six months of sustained internal pressure. During the six-month sustained load, impact damage sites showed a detectable propagation indicated visually and through IR thermography. For the large spherical COPV, there appeared to be no difference whether the vessel had been impacted in the pressurized or unpressurized condition.
Subtask 3.6: Materials Compatibility Testing
No significant physical changes were observed or measured after exposure of Structural Composites Industries (SCI) Gr/Ep material to the space vehicle fluids MMH, UDMH, RP-1, N2H4, IPA, and N2O4 under simulated launch pad leak scenarios. Exposure to LOX caused the SCI Gr/Ep material to become sensitized to shock.
No significant effect on burst strength was measured after exposure of the 10.25-in. spherical Lincoln Composites Gr/Ep COPVs to the space vehicle fluids N2H4, N2O4 , or LOX under simulated launch pad leak scenarios.
No significant effect on burst strength was measured after exposure of cylindrical SCI Gr/Ep COPVs to the space vehicle fluids N2H4, MMH, UDMH, N2O4, LN2, or LOX under simulated launch pad leak scenarios.

xxii
Conclusions for Impact Damage Effects/Control Task 8.0 The results of Subtask 8.1 established impact damage control requirements for safe use of COPVs on spacecraft and launch vehicles. Through literature research, industry surveys, and visits to manufactur-ing plants and spacecraft contractor facilities, the program collected information on credible impact scenarios and threat environments throughout all stages of COPV service life, from manufacturing to end use. This information was used to define the impact control requirements for the AIAA Industry Standards on COPV (AIAA S–081) and to support the development of this document.
All NDE methods selected for Subtask 3.3 were applicable to field test environments. Thus, no addi-tional testing was required to evaluate NDE techniques for applicability to launch site locations or for use within restricted spatial envelopes associated with COPVs installed in spacecraft or vehicle structures.
We performed limited work as part of Subtask 8.1 to assess the prospect of correlating NDE measure-ments with BAI. Data trends generally indicated that a larger bruise area measured on the COPV using IR thermography, ultrasonic A-scans, or eddy current probes correlated with a lower BAI. However, statistical variation in burst strength makes it difficult to predict the effect with any accuracy. Attempts to formulate accept/reject criteria using the NDE data coupled with impact damage modeling were not productive. It was apparent that the modeling approach required an explicit accounting of progressive damage mechanisms within the Gr/Ep structure in order to predict its residual strength after impact. Methods of modeling composites with progressive damage did not exist during the program and are only now being developed and matured.
Impact protection devices were evaluated as part of Subtask 8.2 activities associated with the COPV program plan. This work demonstrated that the high–density foam (i.e., elephant hide) provided virtually no protection against impacts that could potentially degrade COPV burst strength. A COPV protective laminate structure was designed that demonstrated adequate protection based on impacts to Gr/Ep plaques. The laminate structure consisted of a hard shell cover (i.e., fiberglass/Ep) with a deformable aluminum mesh foam to absorb indentation and deflection damage associated with impact events. High–density foam is still recommended as a scuff protector when used as an inner liner for the laminated protective cover. Although no configurational covers were fabricated and tested during the program, computer-generated renderings of potential laminate cover designs were drawn up for small spherical and cylindrical COPVs.
Other methods of protecting a COPV involved using glass or Plexiglas covers to provide limited protec-tion against very small tool drops; however, these methods indicated a detrimental impact by cover surface fracture resulting from a large tool drop. Deformable metal liners with high-density foam pads could also be used as indicator covers, provided the edges of the metal liners were shielded to prevent fiber–cut damage.
Indicating covers using pressure–sensitive paints and dye bubbles were considered part of the COPV program survey, but these types of covers tend to be unacceptable for spacecraft environments. Crazing–sensitive conformal coatings with ultraviolet fluorescent emitters were tested on the large spherical COPVs and did not significantly enhance the VDT for detection of impact events over that observed for the uncoated vessel. Use of fiberglass overwraps on Gr/Ep represents possible indicating covers, but this approach becomes a hybrid design when the filament winding includes fiberglass fibers.
xxiii
Shipping container and handling drop testing of small diameter COPVs was conducted as part of Subtask 8.2. These tests generally showed that the vessels did not sustain damage, provided the shipping con-tainer remained intact as a result of the drop and the container had an adequate foam liner between the vessel wall and shipping container. Handling drop tests from heights of 0.9 m (3 ft) did not impart any measurable damage to the small spherical COPV tested.
Finally, the impact damage control requirements were formulated in Subtask 8.3 and used to develop the ICP as a guideline for industry to follow for implementing methods of COPV impact damage prevention during manufacturing and service life on a spacecraft or launch vehicle.
Recommendations The following recommendations have resulted from the COPV program plan investigation:
• During this program, we developed a new performance factor for assessing COPV impact control requirements based on the relative comparison of VDT and IDT levels [((IDT-VDT)/IDT)*100] for a specific COPV type. We recommend that a value of +50% be used as the threshold criterion for ves-sels that can be used without protective covers when operating in a hostile environment with impact threats below the IDT level.
• The effects of longer-term sustained load and post-sustained load cycling need to be addressed. Longer-term (3-year) and cycling effects are being addressed in a current ongoing COPV program phase.
• Research and development to improve the FEA modeling of progressive impact damage mechanisms should continue. It is essential to understand how the residual composite strength can be predicted from NDE measurements and used to formulate accept/reject criteria.
• The ICP should be refined so that it is consistent with AIAA S–081 and should subsequently be released as an updated guideline that can be incorporated into an industry or government handbook.
• Periodic reviews of the ICP must be performed to ensure that the procedures are adequate, and user feedback must be solicited to incrementally improve the plan.
• Impact damage thresholds should be established for other designs and fiber systems that differ sig-nificantly from those tested before or as part of qualification for use in spacecraft and launch vehicles.

1-1
Chapter 1 Test Report for USAF/COPV Program Subtask 3.2: Failure Mode and Safe-Life Testing of Graphite/Epoxy
Composite Overwrapped Pressure Vessels
(originally published as TR-801-001)
Abstract The NASA Johnson Space Center (JSC) White Sands Test Facility performed several subtasks of the Enhanced Technology for Composite Overwrapped Pressure Vessels (COPVs) Program, including that of baseline structural strength, impact damage tolerance, sustained load/impact effect, and materials compatibility (Subtasks 3.1, 3.3, 3.4, and 3.6, respectively) to contribute to the COPV database extension objective of Task 3.0. Testing was supplemented by an ongoing exploration of nondestructive evaluation techniques and analytical methods. Failure mode and safe-life testing, Subtask 3.2 of the program, addresses reliability concerns by generating data for the evaluation of present failure mode and safe-life prediction methodologies. This was accomplished through failure analyses and fractography of vessels with controlled liner flaws and in the unflawed condition that had been pressure cycled to the onset of insurmountable leakage.
1.1 Introduction
Graphite/epoxy (Gr/Ep) COPVs offer high strength-to-weight ratios relative to conventional vessels and are increasingly employed for pressurant and propellant containment. However, the inherent analytical complexity of anisotropic materials in general, coupled with the demonstrated structural sensitivity of Gr/Ep structures to low-velocity impact-induced damage, create a very real potential for loss of mission, facility, and life from the potential consequences of catastrophic vessel failure at pressure.
The Enhanced Technology for Composite Overwrapped Pressure Vessels Program funded by the United States Air Force (USAF) and NASA and technically managed by the Aerospace Corporation was established to:
• Identify and evaluate critical parameters in the design, analysis, testing, and operation of spaceflight COPVs to formulate safety requirements for already-built COPVs.
• Establish material requirements, manufacturing parameters, and nondestructive evaluation (NDE) techniques to enhance the safety and reliability of future COPVs.
• Investigate practical approaches to improve performance and cost-effectiveness of COPVs in space systems.
• Provide inputs for the revision of MIL-STD-1522 (1986) into an industry-acceptable document.
The NASA Johnson Space Center White Sands Test Facility (WSTF) has performed several phases of this program, including testing of baseline structural strength, impact effects, and materials compatibility, during which the utility of various NDE techniques was assessed and trend analyses were performed.
This report focuses on failure mode and safe-life testing, Subtask 3.2 of the Enhanced Technology for Composite Overwrapped Pressure Vessels Program Plan, Rev. D (Chang et al. 1993). It addresses reliability issues regarding COPVs in use by generating data for the evaluation of present prediction

1-2
methodologies for failure mode and safe-life. Data generated by this testing will be integrated with that from Subtask 3.1 Structural Strength Testing and Subtask 3.3 Impact Effect Testing to contribute to the overall empirical COPV information database extension objective of Task 3.0. The reader is referred to the Subtask 3.3 Impact Damage Testing Database Extension1 for additional details.
1.2 Objective
Subtask 3.2 sought to generate data for the evaluation of present prediction methodologies regarding COPV failure modes and determination of safe life. We accomplished this through failure analyses and fractographic evaluations of vessels with controlled, machined-in liner flaws and in the unflawed condition that had been pressure cycled until the onset of insurmountable leakage.
1.3 Approach
Table 1-1 lists general characteristics of the two COPV types tested. A component pedigree for each vessel was supplied by its manufacturer that included traceability documentation for all overwrap and liner materials and fabrication processes. This information is included in the data file for each vessel and is archived at WSTF.
Table 1-1. COPV Test Article Information
6.6 in. dia x 20 in. long Cylindrical 19 in. dia Spherical
Manufacturer SCIa Arde, Inc.
Model/Part Number AC-5128A SKD-12642
Liner Material 6061-T62 aluminum alloy Cryostretched 301 stainless steel
Liner Thickness 0.040 in. (0.10 cm) 0.033 in. (0.084 cm)
Overwrap Fiber T-1000 graphite IM-7 graphite
Overwrap Thickness 0.104 in. (0.26 cm) 0.168 in. (0.43 cm)
MEOPb 6000 psi (41.4 MPa) 4500 psi (31.0 MPa)
Baseline Burst Pressure 10,700c psi (73.8 MPa) 7280d psi (50.2 MPa) a Structural Composites Industries, Inc. b maximum expected operating pressure c average of two WSTF and one manufacturer’s burst tests d manufacturer’s data
We performed pretest nondestructive visual and radiographic inspections to verify test article integrity and to assess detectability of machined-in liner flaws, where applicable.
Table 1-2 presents the Subtask 3.2 test matrix. In the case of the small cylindrical vessels, the "flawed" designation signifies the presence of four notches, each nominally 6.10 mm (0.240 in.) long and 0.30 mm 1 Keddy, C. P., H. D. Beeson, W. L. Ross, and R M. Tapphorn. USAF/COPV Program Subtask 3.3: Graphite/Epoxy COPV Impact Damage Testing Database Extension. TR-936-001. NASA Johnson Space Center White Sands Test Facility, Las Cruces, NM, Publication in Process.

1-3
(0.012 in.) deep and placed upon the outer surface of the aluminum liner by electric discharge machining (EDM) before overwrap application. Their typical relative positions are shown in Appendix A.
Table 1-2. Subtask 3.2 Test Matrix
COPV Geometry S/N Liner
Condition Pressurization Media Pressure Cycle Range
Cycle Rate (per hour)
6.6 in. dia x 20 in. long Cylindrical
024 028
Flawed Gaseous Nitrogen (GN2)
11.7 Mpa to 43.4 Mpa (1700 psi to 6300 psi)
4
6.6 in. dia x 20 in. long Cylindrical
023 025
Flawed Water (H2O) 11.7 Mpa to 41.4 Mpa (1700 psi to 6000 psi)
20
6.6 in. dia x 20 in. long Cylindrical
140 169
Unflawed 11.7 Mpa to 41.4 Mpa (1700 psi to 6000 psi)
600
19 in. dia Spherical
026 Flawed 13.7 Mpa to 31.0 Mpa (1980 psi to 4500 psi)
20
The inner liner surface of the "flawed" 19-in.-dia spherical COPV bore four EDM notches in the hemisphere opposite its inlet. Major axes of two of the EDM notches were perpendicular to the blind boss insert weld seam; two were parallel. Figure 1-1, a manufacturer's sketch, shows nominal notch dimensions and place-ment. Relative flaw orientation is shown in the applicable supplementary information section in Appendix A. For this testing, a pressure cycle entailed the progression of internal pressure from a vessel's MEOP to the pressure corresponding to zero liner strain, as reported by the vessel's manufacturer, and back.
We performed pressure cycling of flawed COPVs at WSTF. We performed pneumatic cycling with the test article mounted within a blast enclosure capable of withstanding a catastrophic pneumatic failure. We allowed occasional cool-down breaks during pressure ramp-up periods to keep pressurant temperature under 54.4°C (130°F). Hydrostatic pressure cycling was performed at the program burst facility. The reader is referred to the Subtask 3.3 Technical Memorandum for additional information regarding program facilities and systems.
In the interest of both temporal and economic constraints, cycling of unflawed cylindrical COPVs was subcontracted to Consolidated Laboratories, Inc. (CLI), which serves the COPV industry routinely in this very specialized capacity. WSTF program personnel witnessed the initial testing.
We performed post-cycling failure analyses and fractography at WSTF's Metallurgy Laboratory to char-acterize cracking through investigation of initiation site(s), propagation, magnitude, type, and effects particular to EDM notching. We performed both macro- and microphoto analyses, as required. Vessels were dissected and fracture surfaces exposed using conventional fractographic techniques.

1-4
Figure 1-1. Manufacturer's sketch of flaw dimensions and placement for 19 in. dia spherical COPV.
1.4 Results and Discussion
1.4.1 Pretest Inspections
We found no anomalous indications by visual inspections. Liner flaws were readily detectable by radiographic inspections.
1.4.2 Pressure Cycling
Table 1-3 summarizes results of pressure cycling testing. A typical set of cycles for each of the four distinct sets of test conditions is included with related information in Appendix 1A.

1-5
Table 1-3. Summary of Results
COPV Type S/N Test Media
Pump Type
Cycle Rate (per
hour)
Cycles to Leaka
Cycles to
LBBb
Typical Crack
Length (in.) Comments
6.6 in. dia x 20 in. long cylindrical (flawed)
024 028
GN2 Diaphragm 4 85 115
104 141
0.63 Compressible media, progressive-type failure
6.6 in. dia x 20 in. long cylindrical (flawed)
023 025
H2O Piston 20 39 56
39 61
0.31 Incompressible media, less pro-gressive failure. Pump capacity exceeded with smaller leak path.
6.6 in. dia x 20 in. long cylindrical (unflawed)
140 169
Oil Pistonc 700 1750 n/ad
1812 1279
4.75 Incompressible media, progresssive-type failure; higher pump capacity exceeded with massive leak path.
19 in. dia spherical (flawed)
026 H2O Piston 20 389 412 0.30 Incompressible media, progressive-type failure.
a Point of leak initiation, as ascertained visually or from cycle plots b Leak-before-burst (LBB) defined as point at which rate of leakage exceeds pump capacity c High-capacity (10 gallons per minute) pump at CLI d Data not available
1.4.3 Failure Analysis and Fractography
Data specific to the four sets of test conditions are included in Appendix 1A.
1.4.3.1 Flawed Small Cylindrical COPVs
Per customer request, one cylindrical vessel, S/N 025, was shipped to the Materials Directorate of Wright-Patterson Air Force Base for NDE after being hydrostatically cycled. Poor acoustic qualities of the overwrap were found to impede characterization of liner features by ultrasonic and eddy current inspection methods (Brausch 1997). The entire Wright Patterson report is included in Appendix 1B.
Detectability observations based on WSTF destructive inspections are summarized in Table 1-4.
When cycled pneumatically, small flawed cylindrical COPVs exhibited a longer cycle life than those cycled hydraulically (Table 1-3). However, the pneumatically cycled COPVs require slower cycles because of the need to dissipate heat generated by the gaseous compression. The amount of heat gener-ated by this pneumatic pressurization is of no significance relative to the mechanical properties of vessel materials. From this, one can surmise that cycling hydraulically with an incompressible fluid is probably more drastic than cycling with a compressible gas and would probably have more influence over fracture initiation and propagation.
A cylindrical vessel exhibits maximum unrestrained expansion at its mid-shell location. As expected, all vessels failed at EDM notches located at the mid-shell, although similar notches were also introduced at the highly reinforced head-to-shell transition region. Partial-penetration fractures were detected at the base of these transition region notches.

1-6
Table 1-4. Detectability of 6.10-mm (0.240-in.)-Long EDM Notches and Associated Cracking in Flawed Small Cylindrical COPVs After Cycle-to-Leak Testing
(NOTE: Flaws were machined into the outer surface of the liner.)
Visible Cracking
S/N (Pressurant)
EDM Notch Location Width Depth On IDa
(Length, if yes) On ID, With Dye
Penetrant In Base of Notch
023 (H2O) C1 (Inlet Dome)
0.25 mm (0.010 in.)
0.25 to 0.33 mm (0.011 to 0.013 in.)
No No Nob
C2 (Inlet Dome)
0.25 mm (0.010 in.)
0.25 to 0.36 mm (0.011 to 0.014 in.)
No No Nob
C3 (Mid-hoop)
0.28 mm (0.011 in.)
0.36 mm (0.014 in.)
Yes 7.92 mm (0.312 in.)
Yes (linear indication)
Yes
C4 (Mid-hoop)
0.25 mm (0.010 in.)
0.25 mm (0.010 in.)
No No Yes
C1 (Inlet Dome)
0.28 mm (0.011 in.)
0.25 to 0.30 mm (0.011 to 0.012 in.)
No No Nob
C2 (Inlet Dome)
0.28 mm (0.011 in.)
0.25 to 0.28 mm (0.010 to 0.011 in.)
No No Nob
C3 (Mid-hoop)
0.28 mm (0.011 in.)
0.33 mm (0.013 in.)
Yes 16.7 mm (0.658 in.)
Yes (linear indication)
Yes
C4 (Mid-hoop)
0.25 mm (0.010 in.)
0.33 mm (0.013 in.)
Yes 17.4 mm (0.686 in.)
Yes (linear indication)
Yes
C1 (Inlet Dome)
0.25 mm (0.010 in.)
0.15 to 0.28 mm (0.006 to 0.011 in.)
No No Nob
C2 (Inlet Dome)
0.25 mm (0.010 in.)
0.20 to 0.28 mm (0.008 to 0.011 in.)
No No Nob
C3 (Mid-hoop)
0.30 mm (0.012 in.)
0.33 mm (0.013 in.)
Yes 16.0 mm (0.628 in.)
Yes (linear indication)
Yes
C4 (Mid-hoop)
0.30 mm (0.012 in.)
14.2 mm (0.013 in.)
Yes 14.2 mm (0.559 in.)
Yes (linear indication)
Yes
a inner diameter b crack initiation detected by high-magnification electron microscopy
In all cases, through-thickness liner failure was associated with flaws and showed no visible fatigue component upon fracture analysis. The overall fracture mode for both the pneumatic and hydraulic case was simple ductile type overload fracture as shown in Appendix 1A.
Electron microscopy revealed multiple fracture initiation sites at the base of an EDM notch on the liner outer diameter (OD) surface. Optical microscopic examination of a transverse metallographic section through this EDM notch confirmed multiple fracture initiation sites at the base of the EDM notch. Crack branching was observed, and the crack growth direction was identified as OD to inner diameter (ID).
Of note is the fact that the pneumatic fracture length was on the order of 2.5 to 3 times the flaw length. The hydraulic fracture length was limited to slightly greater than the actual flaw length and was mostly entrained in the flaw, except for some slight propagation at the notch tips. This difference is documented in Table 1-4.

1-7
1.4.3.2 Unflawed Small Cylindrical COPVs
CLI hydrostatically cycled two unflawed small cylindrical COPVs (S/Ns 140 and 169) using hydraulic oil as pressurant. The COPVs ultimately exhibited multiple visible spray-type leaks in their inlet end head-to-shell transition regions. These areas were marked for later investigation by WSTF.
Following their return to WSTF, we performed destructive analysis. No crack was visible on the ID with a borescope for either COPV tested. We observed indications on the ID using dye penetrant for S/N 140, but observed no indication for S/N 169.
Both unflawed small cylindrical COPVs exhibited leaking at their inlet end head-to-shell transition regions. This is the normal point-of-failure for undamaged COPV burst tests for this type of COPV.2 These test articles were hydrostatically cycled with oil at a rate of 600 cycles per hour. Failure occurred in the 1200 to 1800 cycle range. Note that CLI’s pump capacity far exceeds WSTF’s capability.
We observed a circumferential fracture in the head-to-shell transition region of COPV S/N 140. The fracture penetrated the liner wall thickness over a length of approximately 4.75 in. Fractographic exami-nation revealed that this fatigue fracture propagated from multiple initiation sites on the liner ID and terminated by ductile fracture of the remaining cross section. Photomicrographs of representative fracture surface features are included in Appendix 1A.
1.4.3.3 Flawed Large Spherical COPV
Detectability observations are summarized in Table 1-5.
The large 19-in.-dia spherical COPV was cycled hydraulically to failure at approximately 400 cycles. Posttest failure analysis revealed through-thickness fractures at two adjacent EDM notches. Because the EDM flaws were located on the interior liner surface in close proximity to the aft boss circumferential insert weld and were all parallel to each other, this configuration formed two pairs of opposed flaws parallel and perpendicular to the weld seam located at 0, 90, 180, and 270 deg. Adjacent failures consti-tuted one flaw perpendicular and one flaw parallel to the circumferential hoop stresses at that location.
Fractographic examination revealed the lengths of the two through-thickness fractures to be approxi-mately equal to those of the EDM notches. Both fractures were identified as fatigue failures. Electron microscopy revealed fatigue striations emanating from initiation sites at the tips of both active EDM notches, which was evidence of incremental crack propagation. The striations were oriented parallel to the axes of the EDM notches, indicating crack propagation toward the liner OD. These regions of stable fatigue crack propagation only partially penetrated the liner wall.
The latter stages of cracking occurred as the remaining cross sections were reduced to the point where they could no longer bear the applied loads. Predominant fracture surface features consisted of intergranular rupture and transgranular cleavage facets. These fracture face features are typically associ-ated with low-ductility brittle-type fractures. Several instances of secondary cracking were also noted. Microvoid (dimple) formation was occasionally observed in this final fracture surface, which was micro-scopic evidence of ductile behavior.
2 Keddy, C. P., H. D. Beeson, W. L. Ross, and R M. Tapphorn. USAF/COPV Program Subtask 3.3: Graphite/Epoxy COPV Impact Damage Testing Database Extension. TR-936-001. NASA Johnson Space Center White Sands Test Facility, Las Cruces, NM, Publication in Process..

1-8
Intermingled fracture surface features suggest a mixed mode mechanism, likely resulting from the duplex austenitic/martensitic microstructure of the AISI 301 stainless steel liner. Extensive martensitic transformation is expected in cryoformed material of this type.
Table 1-5 Detectability of EDM Notches and Associated Cracking of Flawed Large Spherical COPVs, S/N 026 (Water Pressurant), After Cycle-to-Leak Testing
(NOTE: Flaws were machined into the inner surface of the liner.)
Visible Cracking?
EDM Notch (orientation with
respect to weld seam) Length Width Depth On OD In Base of Notch
1 (⊥) 7.24 mm (0.285 in.)
0.33 mm (0.013 in.)
0.427 mm (0.0168 in.)
Yes Yes (for total length of notch)
2 (//) 7.49 mm (0.295 in.)
0.38 mm (0.015 in.)
0.358 mm (0.0141 in.)
No No
3 (⊥) 6.86 mm (0.270 in.)
0.33 mm (0.013 in.)
0.391 mm (0.0154 in.)
No No
4 (//) 7.37 mm (0.290 in.)
0.38 mm (0.015 in.)
0.371 mm (0.0146 in.0
Yes Yes (for total length of notch)
1.5 General Observations
For the 6.6-in.-dia x 20-in.-long cylindrical COPVs, note that cycle-to-leak hydraulically occurred roughly twice as quickly as pneumatically (∼50 vs. ∼120 cycles). The effects of cycle rate are probably less important than the effects of cycling with a compressible media (GN2) versus cycling with an incom-pressible media (H2O) upon both crack initiation and propagation in the flawed condition. Note, how-ever, that fracture induced by pneumatic cycling propagated further before failure. Vessels cycled pneumatically were also afforded relaxation during required cool-down periods.
Although all small cylindrical flawed COPVs tested were flawed in both the head-to-shell transition area and the mid-shell location(s) on the liner outer surface, all COPVs tested to LBB failed at mid-shell flaw locations. This is expected because of the maximum available expansion at this location and its effect on flaw-associated crack initiation. All fracture faces showed a ductile mode of failure with no evidence of fatigue.
The same test article, when tested hydraulically with oil in the unflawed condition, failed both times at the inlet head-to-shell transition location after 1200 to 1800 cycles. This failure site is normally seen in baseline burst testing of undamaged COPVs of the same type. Fractographic examination revealed that this fatigue fracture propagated from multiple initiation sites on the liner ID and terminated by ductile fracture of the remaining cross section.
The 19-in.-dia spherical COPV that was flawed on the interior surface of its cryostretched 301 stainless steel metal liner was cycled hydraulically with H2O at the same WSTF hydraulic cycle rate of 20 cph. It
1-9
failed at 400 cycles partly because of both a stronger liner material (while not as thick) with a much stronger overwrap section. The role of overwrap winding tension is unknown.
Of specific interest is the correlation between EDM notch orientation and crack propagation in the spherical vessel. Through-thickness fractures were observed at two adjacent EDM notches despite the difference in flaw orientation. Recall the isotropic nature of hoop stresses in a pressurized spherical vessel. These observations suggest notch orientation at a given location in a spherical liner does not significantly affect susceptibility to failure.
The fatigue fractures in the spherical vessel were initiated at the EDM notch tips. The final through-thickness fractures exhibited mixed mode (ductile and brittle) characteristics.
All COPVs tested failed in a ductile manner except the 19-in.-dia COPV that failed in a mixed duc-tile/brittle mode. Fatigue-type fracture was limited to the unflawed small cylindrical COPVs and flawed large spherical COPV.
References Brausch, J. C. Graphite Composite Overwrapped Pressure Vessel Nondestructive Characterization
(Structural Failure). Evaluation Report 4349LABR/32LB, Report No. WL/MLS 97-028. Wright-Patterson Air Force Base, OH. Materials Integrity Branch, 1997.
Chang, J. B., L. A. Bailey, H. D. Beeson, M. R. Cain, S. T. Chiu, E. C. Johnson, D. R. Langley, W.L. Ross,
G. L. Steckel, and W. M. Zelinsky. Enhanced Technology for Composite Overwrapped Pressure Vessels Program Plan. Los Angeles, CA: Space and Missile Systems Center, 1993.
MIL-STD-1522A. Standard General Requirements for Safe Design and Operation of Pressurized Mis-
siles and Space Systems. USAF, 1986.


Contents Page
Appendix 1A
Supplementary Information

Contents Page
1A-3
SUBTASK 3.2 FINAL REPORT: SUPPLEMENTARY INFORMATION COPV configuration: Flawed 6.6 in. dia x 20 in. cylindrical S/Ns: 024,028 Failure type: Ductile, non-fatigue Cycles applied: 104 and 141, respectively Pressurant: Gaseous nitrogen Cycle rate: 4 per hour Cycle pressure range: 11.7 to 43.4 MPa (1700 to 6300 psi) Cycle test location: WSTF
FLAW LOCATIONS:
SEM PHOTOMICROGRAPH OF TYPICAL LINER FRACTURE FACE: (1200X MAGNIFICATION)
C4 (180°)
C1 (90°)
C2 (270°)
C3 (0°)
INLET

1A-4
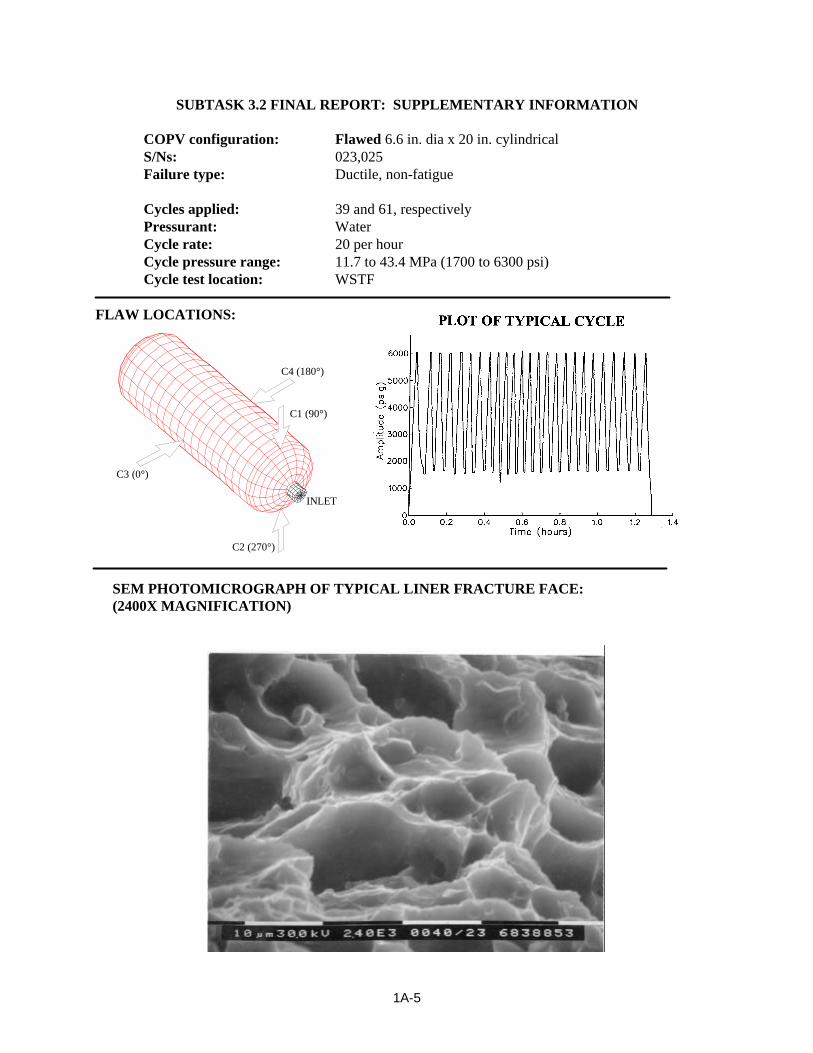
1A-5
SUBTASK 3.2 FINAL REPORT: SUPPLEMENTARY INFORMATION COPV configuration: Flawed 6.6 in. dia x 20 in. cylindrical S/Ns: 023,025 Failure type: Ductile, non-fatigue Cycles applied: 39 and 61, respectively Pressurant: Water Cycle rate: 20 per hour Cycle pressure range: 11.7 to 43.4 MPa (1700 to 6300 psi) Cycle test location: WSTF
FLAW LOCATIONS:
SEM PHOTOMICROGRAPH OF TYPICAL LINER FRACTURE FACE: (2400X MAGNIFICATION)
C4 (180°)
C1 (90°)
C2 (270°)
C3 (0°)
INLET

1A-6
SUBTASK 3.2 FINAL REPORT: SUPPLEMENTARY INFORMATION COPV configuration: Unflawed 6.6 in. dia x 20 in. cylindrical S/Ns: 140,169 Failure type: Fatigue Cycles applied: 1812 and 1279, respectively Pressurant: Water Cycle rate: 600 per hour Cycle pressure range: 11.7 to 41.4 MPa (1700 to 6000 psi) Cycle test location: Consolidated Laboratories, Inc.
DUCTILE MODE FRACTURE FACE (1250X MAGNIFICATION)
TYPICAL SEM PHOTOMICROGRAPHS:
FATIGUE STRIATIONS NEAR FRACTURE INITIATION POINT (655X MAGNIFICATION)
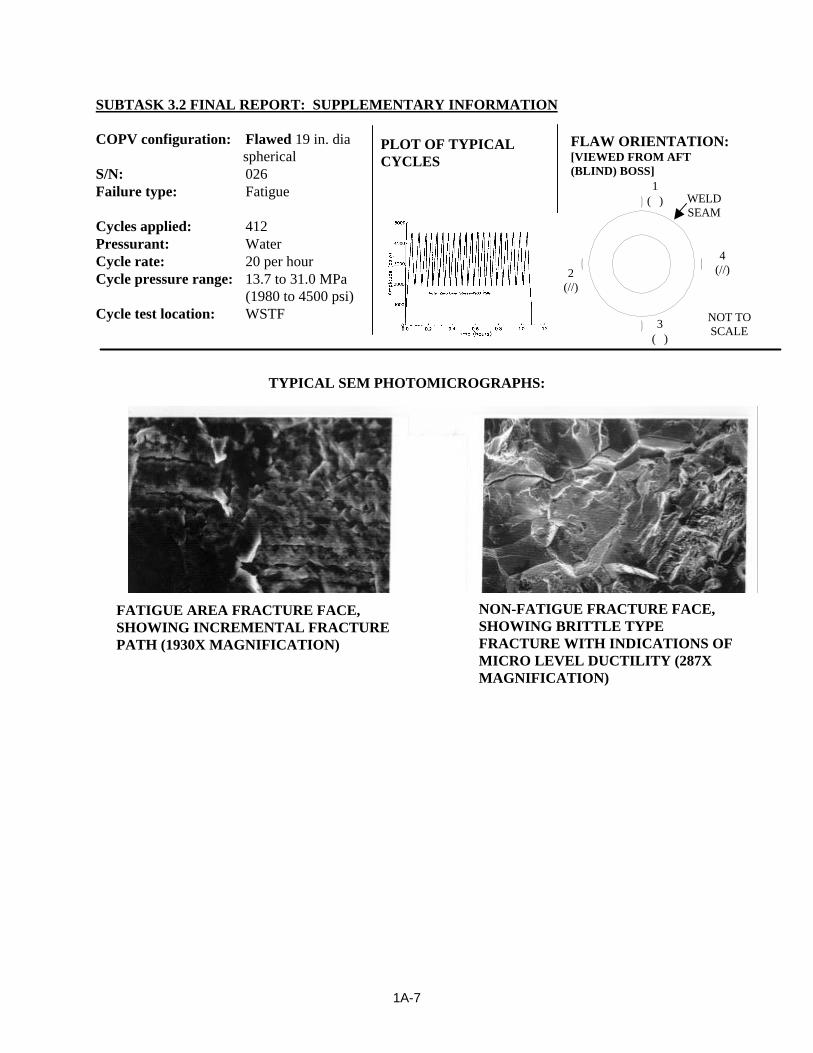
1A-7
SUBTASK 3.2 FINAL REPORT: SUPPLEMENTARY INFORMATION
COPV configuration: Flawed 19 in. dia spherical
S/N: 026 Failure type: Fatigue Cycles applied: 412 Pressurant: Water Cycle rate: 20 per hour Cycle pressure range: 13.7 to 31.0 MPa (1980 to 4500 psi) Cycle test location: WSTF
TYPICAL SEM PHOTOMICROGRAPHS:
NON-FATIGUE FRACTURE FACE, SHOWING BRITTLE TYPE FRACTURE WITH INDICATIONS OF MICRO LEVEL DUCTILITY (287X MAGNIFICATION)
FATIGUE AREA FRACTURE FACE, SHOWING INCREMENTAL FRACTURE PATH (1930X MAGNIFICATION)
PLOT OF TYPICAL CYCLES
FLAW ORIENTATION: [VIEWED FROM AFT (BLIND) BOSS]
2 (//)
1 (⊥)
4 (//)
WELD SEAM
(//)
NOT TO SCALE
3 (⊥)
Contents Page
Appendix 1B
Wright-Patterson Air Force Base Report
Graphite Composite Overwrapped Pressure Vessel Nondestructive Characteriza-
tion (Structural Failure)
Acknowledgments Dr. Harold Beeson, of White Sands Test Facility, requested this document of John C. Brausch, Materials Integrity Branch, Wright-Patterson Air Force Base, Ohio.
We gratefully acknowledge Messrs. Dan Laufersweiler and Edward Porter, Universal Technology Corpo-ration, and Ms. Marianne Ramsey, WL/MLSA, for their assistance and expertise in the completion of this evaluation.
PURPOSE
Our purpose was to evaluate potential nondestructive evaluation (NDE) techniques for the detection of pitting and cracks in graphite composite overwrapped pressure vessel (GCOPV) metallic liners.

1B-4
BACKGROUND
Composite overwrapped pressure vessels (COPVs) have been used extensively for the storage of inert pneumatic gases on missile/spacecraft systems. Such vessels are designed for operating pressures up to 10,000 psi.
Vessel manufacturers and missile/spacecraft vendors have proposed GCOPVs with thin-walled liners to store hypergolic propellants. GCOPVs for hypergolic storage would see operating pressures on the order of 500 psi. Liner wall thicknesses less than 0.010 inch are under consideration.
Recently, leaks have been discovered in pneumatic COPVs filled with nonhazardous gaseous fluids. The reported cause of leakage was corrosion pitting on the inside diameter liner, which propagated to small through-cracks during tank pressurization. The manifestation of this failure mode has heightened con-cerns about the use of GCOPVs for hypergol storage. The leak of such a vessel would pose an extremely hazardous condition for personnel as well as jeopardize the mission.
NASA-WSTF has requested WL/MLSA characterize the inspectability of a typical pneumatic GCOPV configuration. Based on preliminary analysis, detection of a 0.010-inch-deep crack, or corrosion pit, in a 0.040-inch-thick 6061-T6 aluminum liner is desired.
One intact GCOPV was provided for analysis (Figure 1B-1). The vessel, 6 inches in diameter × 19 inches in length, was constructed of a 0.040-inch-thick 6061-T62 aluminum liner with a 0.125-inch-thick filament-wound T-1000 graphite overwrap. Four electrodischarge machine slots were introduced into the vessel liner during manufacture; two in the cylinder walls and two in the cylinder/hemisphere transition. The slot dimensions are approximately 0.240 inch in length × 0.012 inch in depth. The vessel was cycli-cally pressurized, resulting in a liner breach reportedly at one of the electrodischarge machine (EDM) notch locations. The liner breach was detected by helium (He) leak testing. Two GCOPV segments of similar construction were also provided for analysis; a four-inch cylindrical section and a five-inch hemispherical boss section (Figure 1B-2).
The method of inspection shall not in any way contaminate the vessel's interior.
FACTUAL DATA
The acoustic properties of the GCOPV construction were characterized using through-transmission immersion ultrasonics. We performed a turntable C-scan in water using a SRL Model 1750 pulser/receiver. The inspection frequency and gain were 5 MHz and 20 dB, respectively. The C-scan of the cylinder section (Figure 1B-3) demonstrates the composite overwrap to be highly attenuative.
Using a jeweler's saw, we introduced gross flaws into the liner's inside diameter of the cylindrical seg-ment; two lengthwise slots at approximately 0.020 and 0.030 inches in depth (Figures 1B-4(a) and 1B-4(b), respectively). Turntable ultrasonic Cscan inspection was again performed in water using an SRL Model 1750 pulser/receiver. We evaluated a 45-deg shear wave pulse-echo technique at 5 MHz inspec-tion frequency and 47 dB gain (Figure 1B-5). The results demonstrate the 0.030-inch slot to be readily detectable (Figure 1B-6). Only a small segment of the 0.020-inch slot was detected. The C-scan exhibits significant noise due to spectral reflection from the composite overwrap.
The GCOPV vessel was examined by microfocus real-time X-ray imaging, using a V. J. Industries X-ray image intensifier and Feinfocus microfocus X-ray tube. The resolution of the image intensifier is consid-
1B-5
ered poor at approximately 3 line pairs/mm. The two EDM slots located in the cylinder wall, and the two EDM slots located at the cylinder/hemisphere transition, were detected with great difficulty. Figure 1B-7(a) illustrates one poorly resolved EDM slot. We applied a Laplacian filter and contrast expansion to enhance slot detail (Figure 1B-7(b)). No cracks were resolved propagating through the remaining wall thickness in the EDM slots. The slots mask any potential crack indications.
We evaluated film radiography for detectability of the induced flaws in the intact GCOPV, producing a double-wall exposure by wrapping Kodak type M film around the cylinder's exterior on the side opposite the source. Source-to-film distance was 30 inches. The exposure parameters were 80KV and 1mA at 90 seconds. All four EDM slots were detected (Figures 1B-8(a) and 1B-8(b)). No cracks were resolved propagating through the remaining wall thickness within the EDM slots. The slots themselves would effectively mask any potential crack indications still contained within the slot.
We attempted eddy current inspection from the outside surface of the GCOPV cylindrical segment, using a NORTEC 19eII impedance plane instrument. Various probe configurations and excitation frequencies between 5Khz and 50Khz were attempted. Neither the EDM flaws in the intact cylinder nor the slots in the cylinder segments were detectable through the composite overwrap.
DISCUSSION(S)
The construction of the GCOPVs provided for this investigation poses considerable challenges for in-spection of the metallic liner integrity from the external surface. The fiber-wound construction serves to dampen acoustic energy and produce considerable acoustic noise (spectral reflection) when attempting ultrasonic interrogation of the internal metallic liner. In addition, the overwrap causes significant "lift-off" from the metallic liner, preventing sufficient production of eddy currents at the internal surface of the metallic liner.
The successful interrogation of materials by ultrasonic inspection is dependent on the size and orientation of the defect of interest, as well as the acoustic quality of the material to be interrogated. In the case of GCOPVs, poor acoustic properties of the composite overwrap hinder ultrasonic interrogation from the external surface. Immersion inspection at 5 MHz demonstrated the detectability of large (0.030-inch-deep) flaws oriented perpendicular to the sound path. One can increase sensitivity to smaller defects by increasing the inspection frequency. However, increasing the inspection frequency also serves to in-crease the sensitivity to the overwrap inhomogeneities, producing even greater sound beam attenuation. At higher frequencies, spectral reflections from the composite overwrap will effectively mask defects occurring in the liner. For this reason, ultrasonic inspection of the GCOPV's external surface is consid-ered unsuitable for detection of 0.010 inch deep liner defects with the current overwrap configuration.
Of the three inspection methods evaluated, X-ray inspection typically provides the poorest detection sensitivity to small, low-volume defects such as intergranular cracking. Detection of such small defects, using either digital or film radiography techniques, is limited by the poor spatial resolution of the imag-ing media and is highly dependent on the orientation of the flaw to be detected. Depending on the equipment and film used, real-time image intensifiers and film methods are limited to 2 to 5 line pairs/mm (line pairs per millimeter) and 20 line pairs/mm, respectively. Detection of very shallow inter-granular microcracks is well beyond the detectability of current X-ray technologies. However, larger defects, i.e., corrosion pitting of 0.005 inch to 0.010 inch in depth and 0.010 inch width, may be resolved by high-quality film and digital imaging systems possessing a spatial resolution of 10 line pairs/mm or

1B-6
better and a contrast resolution of 2% or better. Considerable improvement in spatial resolution can be gained through the use of geometric magnification. By fixing in place the X-ray tube and the imaging media and moving the inspection article close to the X-ray tube target, the image of the inspection region is effectively magnified. This was demonstrated through the image intensifier X-ray images exhibited in Figures 1B-7(a) and 7(b). Consequently, using geometric magnification significantly decreases the effective area of inspection, resulting in a significant increase in the number of exposures required to obtain full coverage.
Although not demonstrated in this evaluation, some improvement in resolution may also be gained through single-wall exposure techniques. Inserting a radiation source into the vessel and placing film on the external cylinder wall halves the total material thickness in which the ionizing radiation must pass. This technique will effectively double the sensitivity to low contrast defects, such as shallow pitting.
Eddy current inspection from the external surface is limited due to "lift-off" imposed by the composite overwrap. The overwrap effectively increases the spacing between the exciting coil and the surface of the test material. This serves to reduce the magnitude of induced eddy currents and reduces the sensitiv-ity of the eddy current test to material property variations or discontinuities.
We can increase the strength of the projected excitation field in two ways: (1) increase the excitation coil size or increase the power to the coil. However, increasing the excitation coil size increases the effective inspection area of the test material, effectively reducing the sensitivity to small discontinuities. The ability to increase coil power is limited by the capacity of the coil to function at higher amperage and the capability of the inspection instrument to increase power to the inspection coil. The Nortec 19eII used in this investigation was set at the maximum probe power setting for this evaluation.
Using the formula for standard depth of penetration, the required coil excitation frequency to penetrate 3mm of graphite (0.25% IACS) and 1mm of 6061-T6 aluminum (44% IACS) is calculated to be approximately 7 kHz.
2)50/(41172
σδ
.f =
f = frequency δ = standard depth of penetration (depth at which the eddy current density has
decayed to 1/e (37%) of the surface value s = material conductivity (% IACS)
This probe frequency is far too low to be sensitive to 0.010-inch-deep defects initiating on the liner's interior surface.
CONCLUSION(S)
The poor acoustic properties of the fiber-wound composite overwrap prevented the external ultrasonic detection of liner defects smaller than 0.030 inch in depth.
Real-time radiography, using an image intensifier and geometric magnification, resolved the 0.240-inch × 0.012-inch EDM slots in the GCOPV. We detected no cracks.
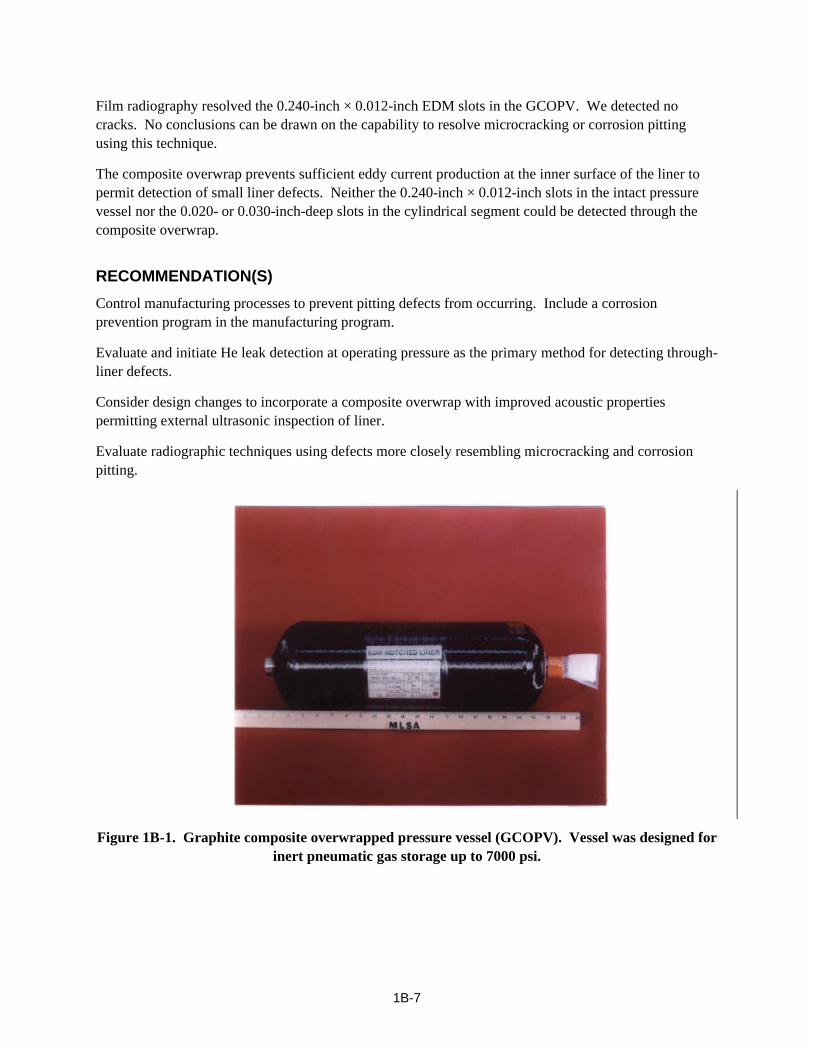
1B-7
Film radiography resolved the 0.240-inch × 0.012-inch EDM slots in the GCOPV. We detected no cracks. No conclusions can be drawn on the capability to resolve microcracking or corrosion pitting using this technique.
The composite overwrap prevents sufficient eddy current production at the inner surface of the liner to permit detection of small liner defects. Neither the 0.240-inch × 0.012-inch slots in the intact pressure vessel nor the 0.020- or 0.030-inch-deep slots in the cylindrical segment could be detected through the composite overwrap.
RECOMMENDATION(S)
Control manufacturing processes to prevent pitting defects from occurring. Include a corrosion prevention program in the manufacturing program.
Evaluate and initiate He leak detection at operating pressure as the primary method for detecting through-liner defects.
Consider design changes to incorporate a composite overwrap with improved acoustic properties permitting external ultrasonic inspection of liner.
Evaluate radiographic techniques using defects more closely resembling microcracking and corrosion pitting.
Figure 1B-1. Graphite composite overwrapped pressure vessel (GCOPV). Vessel was designed for
inert pneumatic gas storage up to 7000 psi.

1B-8
Figure 1B-2. (a) GCOPV cylindrical section. (b) GCOPV hemispherical boss section.
Figure 1B-3. Through-transmission ultrasonic C-scan of cylindrical GCOPV segment.
Demonstrates the high acoustic attenuation of the composite overwrap.
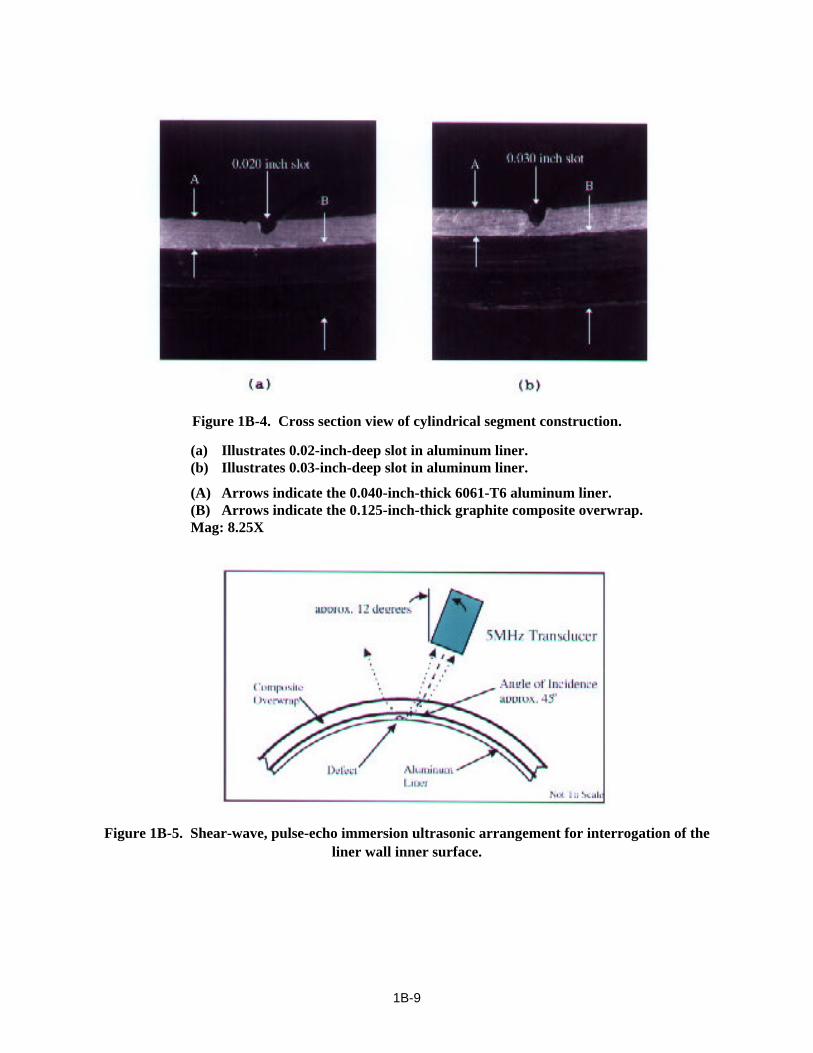
1B-9
Figure 1B-4. Cross section view of cylindrical segment construction.
(a) Illustrates 0.02-inch-deep slot in aluminum liner. (b) Illustrates 0.03-inch-deep slot in aluminum liner.
(A) Arrows indicate the 0.040-inch-thick 6061-T6 aluminum liner. (B) Arrows indicate the 0.125-inch-thick graphite composite overwrap. Mag: 8.25X
Figure 1B-5. Shear-wave, pulse-echo immersion ultrasonic arrangement for interrogation of the
liner wall inner surface.
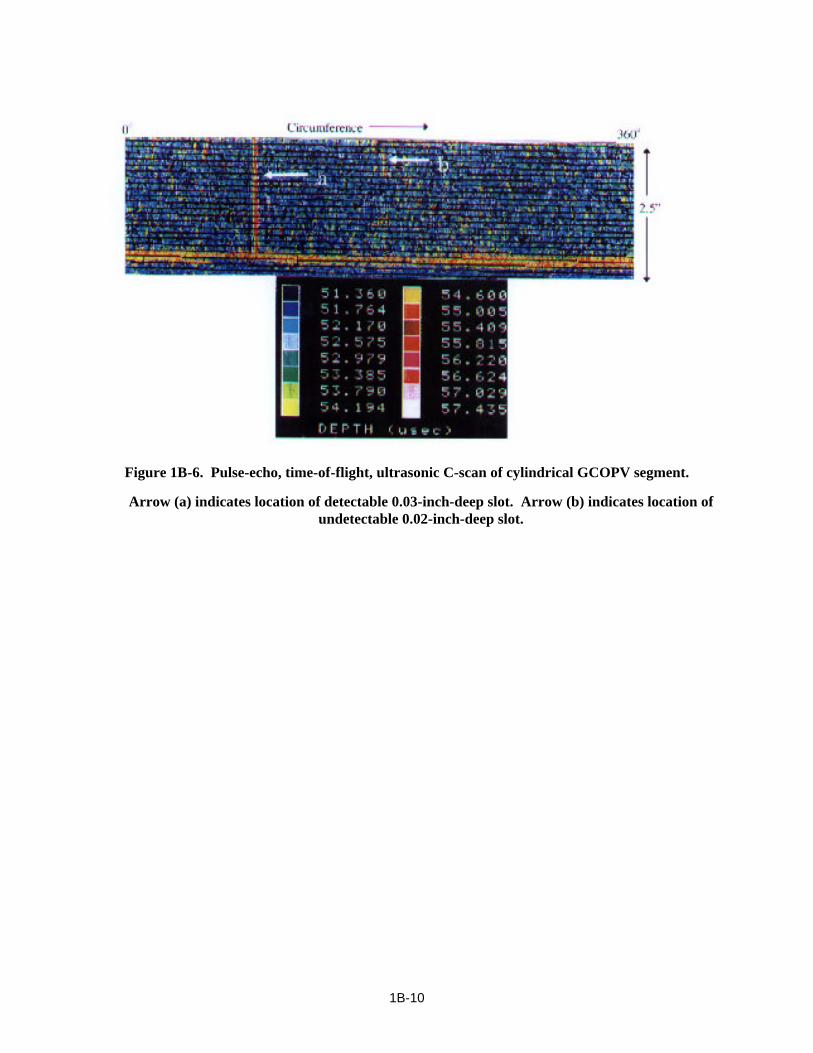
1B-10
Figure 1B-6. Pulse-echo, time-of-flight, ultrasonic C-scan of cylindrical GCOPV segment.
Arrow (a) indicates location of detectable 0.03-inch-deep slot. Arrow (b) indicates location of undetectable 0.02-inch-deep slot.

1B-11
Figure 1B-7. X-ray images.
(a) Digitized real-time X-ray image of EDM slot in GCOPV intact cylinder.
(b) Enhanced digitized real-time X-ray image of the same EDM slot.

1B-12
Figure 1B-8. X-ray radiographs of EDM slots.
(a) X-ray radiograph of EDM slots in intact GCOPV sidewall. (b) X-ray radiograph of EDM slots in intact GCOPV sidewall-to-hemisphere
transition. Scale is in inches.

2-1
Chapter 2 Test Report: Enhanced Technology for Composite Over-wrapped Pressure Vessels
Subtask 3.6: Material Compatibility Testing; Compatibility of Graph-ite/Epoxy Composite With Space Vehicle Fluids
(originally published as TR-804-001)
2.1 Introduction
COPVs are used as pressurant- and space vehicle fluid-containment systems on aerospace vehicles includ-ing launch vehicles, upper stages, satellites, space probes, the Shuttle, and the Space Station. Composed of high-strength fibers embedded in a matrix material wrapped over a thin metal liner, a COPV offers the advantage of a high strength-to-weight ratio. The overwrap, however, is subject to damage by impact or exposure to reactive chemicals, such as propellants (Chang et al. 1994). Range safety and mission reliabil-ity issues have been raised concerning the loss of strength in the overwrap and possible tank failure because of exposure to space vehicle fluid leaks.
Previous test results (NASA 1992) have shown that the Gr/Ep laminate material used in the He pressure tank aboard the Mars Observer was visibly changed by exposure to vapor or liquid hypergols, particu-larly to N2O4.
Space vehicle fluids of interest in this study are hydrazine (N2H4), monomethylhydrazine (MMH), un-symmetrical dimethylhydrazine (UDMH), N2O4, liquid oxygen (LOX), liquid nitrogen (LN2), isopropyl alcohol (IPA), and rocket propellant-1 (RP-1).
This interim report presents the results of material compatibility tests of Gr/Ep coupons with space vehicle fluids. A subsequent report will document exposure and failure testing of COPVs and any corre-lation of results.
2.2 Objectives
The objectives of Subtask 3.6 were to determine the effect that exposure to typical space vehicle fluids under launch processing environments has on the strength of Gr/Ep COPVs and to identify whether a correlation exists between coupon test results and COPV failures.
2.3 Approach
The overall approach for Subtask 3.6 was to expose Gr/Ep coupons and COPVs to test fluids under a simulated launch processing scenario. The scenario included a leak in a space vehicle propellant line causing propellant to drip or pool on the Gr/Ep surface of a COPV for a short time, followed by soaking and drying periods simulating the time necessary for repairs to be conducted. We also examined expo-sure to N2O4 vapor in a similar scenario.
The launch pad safety concern is that the COPV retains its integrity during these events. The time between the development and detection of the leak has been estimated to be 10 min. Allowing for a worst-case situation, the time of exposure of coupons and COPVs to the test fluid was chosen as 2 hr for this test series.
2-2
If only minor effects of exposure were noted, the test was repeated with an 8-hr exposure. In the simulated scenario, repairs could be made immediately after the leak is stopped, or up to 24 hr later.
When a space vehicle is in use, only the outside surface of a COPV can be exposed to a space vehicle fluid leak. For Subtask 3.6, we used a special fixture that prevents exposure of the coupon edges and allows only one surface of a Gr/Ep coupon to be exposed to the test fluid.
During the COPV test phase, burst strengths of COPVs will be measured both immediately and 24 hr after the exposure period. Retained integrity of a pressurized and exposed vessel for this period would alleviate concerns of premature strength degradation.
We screened for material reactivity by exposing coupons to the test fluids at room temperature (RT) for 2- and 8-hr periods to determine if any gross material or fluid incompatibility exists. This type of test is similar to the Level 1 Screening Test of NHB 8060.1C Test 15 (NASA 1991) required of all material and fluid combinations proposed for testing at WSTF. We used the Test 15 Screening Test procedure, with minor modification, to determine sample weight gain or loss; changes in sample hardness; fiber loosen-ing; and discoloration, swelling, or erosion of the sample.
We determined the mechanical strength of test-fluid-exposed Gr/Ep in a separate series of exposures on samples configured for flexural strength measurements.
To determine the effects of LOX exposure, we performed the Mechanical Impact Test specified in NHB 8060.1C as Test 13 (NASA 1991), and reported the results of posttest examination of the Test 13 coupons.
2.4 Experimental
2.4.1 Materials
Both the Gr/Ep test panels used to fabricate the material-reactivity coupons and flexural-strength test bars, and the COPV vessels to be used in later testing, were composed of SCI REZ 100 matrix with Toray T-10006B carbon fibers. The matrix, fiber, layup process, and cure cycle were those used by the manufacturer, SCI, in Pomona, CA. The test panels were laid up in a 0, -45, +45, 90, 90, +45, -45, 0 pattern with a fiber volume of approximately 65% and a cured thickness of approximately 0.63 cm. The manufacturer cured the panels in a press and trimmed them to size. Test specimens were cut from the 30.0- × 30.0- × 0.63-cm test panels using a diamond saw. The material reactivity screening coupons were 2.5 × 2.5 × 0.63 cm in size. The mechanical strength test bars were 12.7 × 1.27 × 0.63 cm in size. The fiber direction of the upper lamina was oriented parallel to the longitudinal axis of the test bar. We cut four-point flexural test specimens from two different test panels to negate possible differences caused by layup and cure of the test panels. All test fluids met the specifications shown in Table 2-1.

2-3
Table 2-1. Test Fluid Specifications
Fluid Specification
Hydrazine MIL-P-26536, Amend 2 Monomethylhydrazine MIL-P-27404B 1, 1-dimethylhydrazine MIL-P-25604D Dinitrogen tetroxide MIL-P-26539D Isopropyl alcohol Aldrich Reagent Grade Rocket propellant-1 MIL-P-25576C Liquid Oxygen MIL-O-27210E, Amend 1 Liquid nitrogen MIL-P-27401C
2.4.2 Test System
Figure 2-1 shows the coupon exposure test fixture. The base plate, fabricated from 304 stainless steel, has a threaded stud located at each corner. The 2.5- × 2.5-cm test coupon is sandwiched between a 2.5-cm-dia EPR O-ring and a 1.9-cm-dia Kalrez (1045 or 1050LF) O-ring. The Kalrez O-ring was positioned in a groove in the base of a 2.5-cm-OD × 1.25-cm-ID × 1.9-cm-deep polytetrafluoroethylene (PTFE) cylindrical bushing, which serves as a liquid reservoir. We machined the PTFE cylinder to accept the O-ring at 1/3 to 1/2 of its depth, and aligned a 304 stainless steel top plate with holes at each corner with the studs of the bottom plate and held in place with wing nuts. Only the Kalrez O-ring, PTFE bushing, and the top surface of the Gr/Ep coupon came into contact with the test fluid. A similar fixture was fabri-cated with a 2.5-cm-od × 0.63-cm-id × 1.9-cm-high PTFE cylindrical bushing for exposure of the me-chanical strength test coupons.
2.4.3 Procedures
We labeled duplicate test coupons on the unexposed side, and photographed and weighed them. We assembled the coupon exposure test system with the test coupon and placed it in a chemical fume hood.
2.4.3.1 Immersion Procedure
We added 1 to 3 mL of test fluid to the test fixture reservoirs. If the fluid and material did not indicate gross incompatibility within the first 2 min, the samples were observed at 15-min, 30-min, 1-hr, and 2-hr intervals. If only minor effects of exposure were noted, we repeated the test with an 8-hr immersion. We adjusted the fluid level in the reservoir to maintain surface coverage as necessary.
2.4.3.2 Drip Procedure
The exposure test fixture was located under a drip tube connected to a supply of test fluid. We started and adjusted the drip as necessary to prevent a pool of test fluid from covering the sample surface. The drip was controlled manually for N2O4 and with a syringe pump for the other test fluids during the expo-sure period.

2-4
2.4.3.3 N2O4 Vapor Exposure Procedure
We placed an inverted test fixture over a 30-mL beaker containing 10 to 15 mL of N2O4 so that the edges of the coupon were not exposed to the vapor. Additional N2O4 was added as required.
2.4.3.4 Post-Exposure Procedures
After the exposure period, excess propellant was poured off, the test fixture was disassembled, and the sample was carefully blotted of any excess droplets of test fluid. The exposed coupon surface was then purged with dry gaseous nitrogen for at least 15 min. After the purge time, visual observations were recorded, the coupon was weighed, and hardness was measured. The mechanical strength coupons required a 24-hr air-drying period after test fluid exposure before performing the 4-point flexural strength tests.
We obtained photographic records of pretest and posttest samples, and photomicrographs of material reaction, such as blistering or fiber exposure, as appropriate. Coupon surfaces that showed significant changes were also characterized by Fourier Transform Infrared Spectroscopy (FTIR), using a Nicolet 750 spectrometer with a Spectra-Tech IR microscope.
For the mechanical strength tests, we used procedures outlined in ASTM D-790 (90) to determine flex-ural strength and elastic modulus after coupons were exposed to test fluids. We performed four-point flexural strength tests using an Instron bending jig in a 10,000-lb capacity electromechanical Instron TT-C Universal test machine. The test bars were oriented downward so that the exposed coupon surface was placed in tension. Samples of unexposed coupons were used as controls.
2.4.3.5 Mechanical Impact Procedure
The NASA Handbook 8060.1C Test 13, Part A: Mechanical Impact, Non-Standard Test used 1.2- × 1.2- × 0.65-cm Gr/Ep configurational samples tested in 100% LOX at 90 K (-297°F) at a pressure of 85 kPa (12.4 psia). We tested the samples per the "Up and Down" logic for the 50% height determination (NASA 1991). The top surface of the samples was impacted.
2.5 Results
2.5.1 Material Reactivity Immersion Tests
No noticeable events or responses occurred during the 2-hr immersions of Gr/Ep coupons in N2H4, UDMH, IPA, RP-1, and LN2. Because of the lack of response, no other tests were performed with LN2. We noted a slight amount of bubbling in the liquid during Gr/Ep coupon exposure to MMH during the first few minutes of testing. Figures 2-2 through 2-7 show photographs of the exposed coupons.
During exposure to N2O4 liquid, a bubbling effect was noted during the first 10 min, but no other sign of reactivity was observed. The liquid in the column was dark green, which hindered observation of surface effects during the exposure. After 2 hr of N2O4 vapor exposure, there was a bright yellow material on the surface of the coupon. Close examination showed significant surface reaction, with the formation of brittle, yellow tendrils. A photograph and a photomicrograph of the N2O4 liquid-exposed surfaces are shown in Figures 2-8 and 2-9. We observed no obvious response after a 15-min exposure to N2O4 vapor.

2-5
After 50 min of exposure, a slight surface discoloration was observed, and the surface texture appeared more pronounced (Figure 2-10). The overall effects of a 2-hr exposure to N2O4 vapor were less severe than those observed for liquid N2O4 exposure.
Visual observations from the 8-hr immersions were not significantly different from those for the 2-hr immersion except for the coupon exposed to N2O4 liquid, which exhibited swelling of the exposed area and a significant amount of yellow-colored residue (Figure 2-13). The yellow-colored residue did not adhere to the surface but was partly decanted with the liquid N2O4 at the end of the test. Figures 2-11 through 2-13 show photographs of the coupons exposed to MMH, UDMH, RP-1, N2H4, IPA, and N2O4.
Tables 2-2 and 2-3 show weight change and hardness data for the 2- and 8-hr immersions.
The FTIR spectrum of an unexposed coupon surface shows features characteristic of an epoxy polymer, including absorptions from the aromatic ether function at 1600, 1500, and 820 cm-1 and aliphatic alcohols and amines at 1450 to 1000 cm-1 (Figure 2-14). We examined coupons exposed to N2O4 liquid or vapor after exposure. The FTIR spectrum indicates that the yellow tendrils were oxidized and nitrated matrix materials as shown by characteristic absorptions of ketones at 1720 cm-1 and nitrated aromatic ethers at 1620, 1510, and 830 cm-1 (Figure 2-15).
Table 2-2. Results for 2-hr Immersions
Fluid Weight Change (mg/cm2)
Hardness Change Pre-/Post-Exposure (Shore D) Comments
N2H4 < 0.1 83/83 Slight change of coupon surface
MMH + 0.3 83/83 Bubbling during immersion; visual change indicating surface roughening
UDMH + 0.1 82/84 Visual change indicating surface roughening
N2O4
Liquid + 1.6 82/74 Surface reacted with formation of yellow tendrils of de-
graded matrix
N2O4
Vapor + 1.9 84/84 Surface was more discolored than during liquid exposure;
yellow tendrils, with somewhat less surface reaction
IPA - 0.4 82/83 No significant visual change
RP-1 - 0.3 85/85 No significant visual change
Table 2-3. Results for 8-hr Immersions
Fluid Weight Change (mg/cm2)
Hardness Change Pre-/Post-Exposure
(Shore D)
N2H4 <0.1 82/82 MMH +0.2 81/82 UDMH +0.2 82/82 N2O4 +59 82/soft IPA -0.1 84/86 RP-1 -0.2 80/82
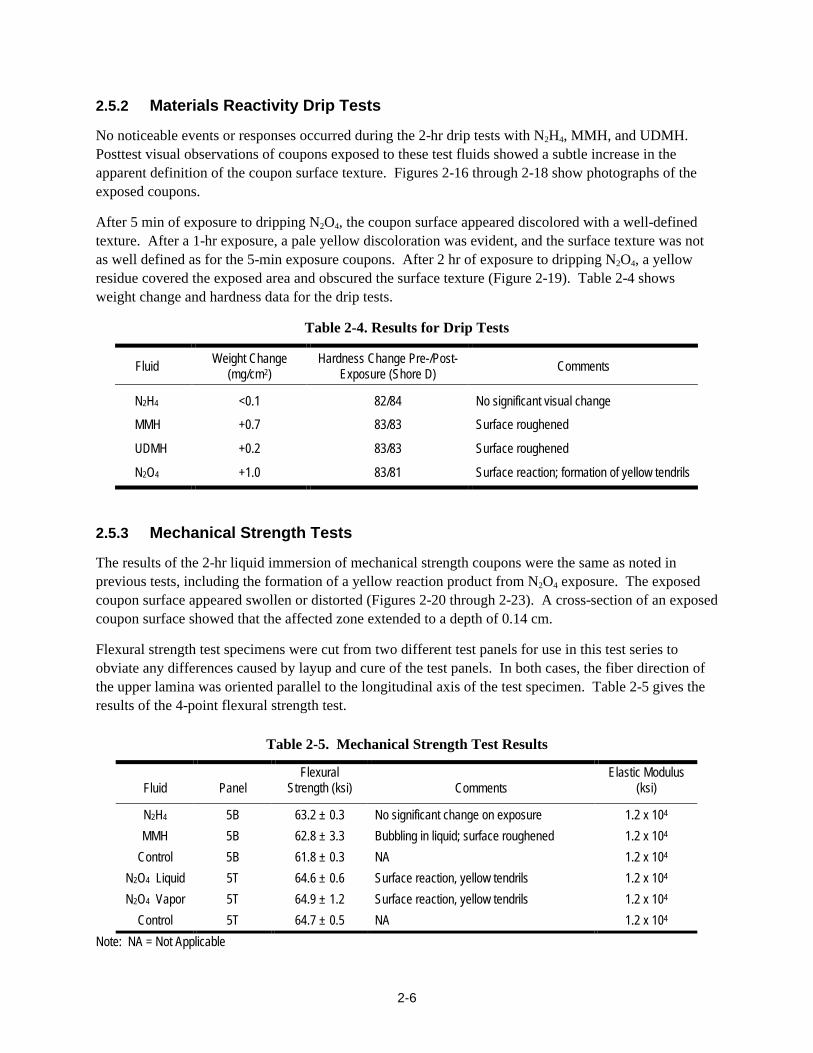
2-6
2.5.2 Materials Reactivity Drip Tests
No noticeable events or responses occurred during the 2-hr drip tests with N2H4, MMH, and UDMH. Posttest visual observations of coupons exposed to these test fluids showed a subtle increase in the apparent definition of the coupon surface texture. Figures 2-16 through 2-18 show photographs of the exposed coupons.
After 5 min of exposure to dripping N2O4, the coupon surface appeared discolored with a well-defined texture. After a 1-hr exposure, a pale yellow discoloration was evident, and the surface texture was not as well defined as for the 5-min exposure coupons. After 2 hr of exposure to dripping N2O4, a yellow residue covered the exposed area and obscured the surface texture (Figure 2-19). Table 2-4 shows weight change and hardness data for the drip tests.
Table 2-4. Results for Drip Tests
Fluid Weight Change (mg/cm2)
Hardness Change Pre-/Post-Exposure (Shore D) Comments
N2H4 <0.1 82/84 No significant visual change
MMH +0.7 83/83 Surface roughened
UDMH +0.2 83/83 Surface roughened
N2O4 +1.0 83/81 Surface reaction; formation of yellow tendrils
2.5.3 Mechanical Strength Tests
The results of the 2-hr liquid immersion of mechanical strength coupons were the same as noted in previous tests, including the formation of a yellow reaction product from N2O4 exposure. The exposed coupon surface appeared swollen or distorted (Figures 2-20 through 2-23). A cross-section of an exposed coupon surface showed that the affected zone extended to a depth of 0.14 cm.
Flexural strength test specimens were cut from two different test panels for use in this test series to obviate any differences caused by layup and cure of the test panels. In both cases, the fiber direction of the upper lamina was oriented parallel to the longitudinal axis of the test specimen. Table 2-5 gives the results of the 4-point flexural strength test.
Table 2-5. Mechanical Strength Test Results
Fluid Panel Flexural
Strength (ksi) Comments Elastic Modulus
(ksi)
N2H4 5B 63.2 ± 0.3 No significant change on exposure 1.2 x 10⁴
MMH 5B 62.8 ± 3.3 Bubbling in liquid; surface roughened 1.2 x 10⁴
Control 5B 61.8 ± 0.3 NA 1.2 x 10⁴
N2O4 Liquid 5T 64.6 ± 0.6 Surface reaction, yellow tendrils 1.2 x 10⁴
N2O4 Vapor 5T 64.9 ± 1.2 Surface reaction, yellow tendrils 1.2 x 10⁴
Control 5T 64.7 ± 0.5 NA 1.2 x 10⁴
Note: NA = Not Applicable

2-7
To test whether an affected zone of the same diameter and depth would show measurable deviation in the 4-point flexural strength test, we prepared specimens with a 0.95-cm-dia by 0.14-cm-deep hole end-milled into the 0.635-cm-thick test bars. The milling process removes both matrix and fiber material. The observed strength of the samples decreased to 48.5 ksi as compared to a control value of 64.7 ksi. Loss of this amount of matrix and fiber results in an easily detected 25% change. After correcting for the reduced thickness of the sample bar, we found the strength of the Gr/Ep composite material unaltered, as expected.
2.5.4 Mechanical Impact Tests
Mechanical impact of SCI Gr/Ep coupons in LOX at 90 K (-297°F) resulted in reactions at several im-pact energy levels. A positive indication of reaction is a visually detected flash or an audible noise. Table 2-6 gives results of mechanical impact tests.
Table 2-6. Results for Mechanical Impact Tests
Impact Energy, J (ft-lb) No. of Reactions No. of Samples Impacted
98 (72) 2 2
47 (35) 1 1
34 (25) 2 2
27 (20) 1 3
20 (15) 3 4
14 (10) 1 8
2.6 Discussion
Materials reactivity screening test results indicate that most test fluids had little or no effect on the Gr/Ep coupons.
Liquid immersion for 2 or 8 hr in IPA, RP-1, or LN2 resulted in no visible effects on the exposed coupon surface and showed no significant weight or hardness changes. Coupons exposed to N2H4, MMH, and UDMH displayed a slight surface roughening. We noted very small weight increases for MMH and UDMH, but hardness was unaffected.
Exposure to either N2O4 liquid or vapor resulted in weight increases on the order of 2 mg cm-2 of exposed surface, accompanied by a surface reaction. Bright yellow tendrils of a soft, waxy material covered the exposed surface. The yellow material was characterized by FTIR microscopy and shown to consist of nitrated phenols and ketonic compounds. These compounds result from nitration and oxidation of the epoxy matrix material. Photomicrographs showed no fiber damage.
Drip tests that allowed a slow stream of test fluid to spill onto the coupon surface for 2 hr gave similar but slightly less severe effects than coupons immersed in test fluid.

2-8
The mechanical strength of exposed coupons was not affected by exposure to N2H4, MMH, or N2O4. Even though exposure to N2O4 caused a reaction of the Gr/Ep coupons to a depth of 0.14 cm, there was no measurable change in the flexural strength of the coupon. The N2O4 exposure affected only the matrix material, which carries only a small fraction of the stress.
Mechanical impact testing in LOX showed the SCI Gr/Ep composite material to be shock-sensitive, with visual and auditory responses being noted at 14 J (10 ft-lb), the lowest impact level attainable in this test.
2.7 Conclusions
We observed or measured no significant physical changes after exposing the SCI Gr/Ep material to the space vehicle fluids MMH, UDMH, RP-1, N2H4, IPA, and N2O4 under simulated launch pad leak scenar-ios. Exposure to LOX caused the SCI Gr/Ep material to become sensitized to shock.
Because of the minimal effects noted in the coupon test series, it is recommended that further exposure tests of COPVs be limited to MMH, UDMH, N2H4, and N2O4 fluids.
Further work to determine the effect of exposure on the burst strength of non-flight-weight COPVs is in progress, and a correlation to these coupons test results is pending.
Figure 2-1. Test fixture for liquid exposure of composite coupons without edge exposure.

2-9
Figure 2-2. Results of 2-hr liquid exposure to N2H4.
Figure 2-3. Results of 2-hr liquid exposure to MMH.

2-10
Figure 2-4. Results of 2-hr liquid exposure to UDMH.
Figure 2-5. Results of 2-hr liquid exposure to IPA.

2-11
Figure 2-6. Results of 2-hr liquid exposure to RP-1.
Figure 2-7. Results of 2-hr liquid exposure to LN2.

2-12
Figure 2-8. Results of 2-hr liquid exposure to N2O4.
Figure 2-9. Results of 2-hr liquid exposure to N2O4 magnified 250 times.

2-13
Figure 2-10. Results of 2-hr vapor exposure to N2O4.
Figure 2-11. Results of 8-hr liquid exposure to MMH and UDMH.

2-14
Figure 2-12. Results of 8-hr liquid exposure to RP-1 and N2H4.
Figure 2-13. Results of 8-hr liquid exposure to IPA and N2O4.

2-15
Figure 2-14. FTIR spectrum of unexposed Gr/Ep coupon surface.
Figure 2-15. FTIR spectrum of N2O4-exposed Gr/Ep coupon surface.
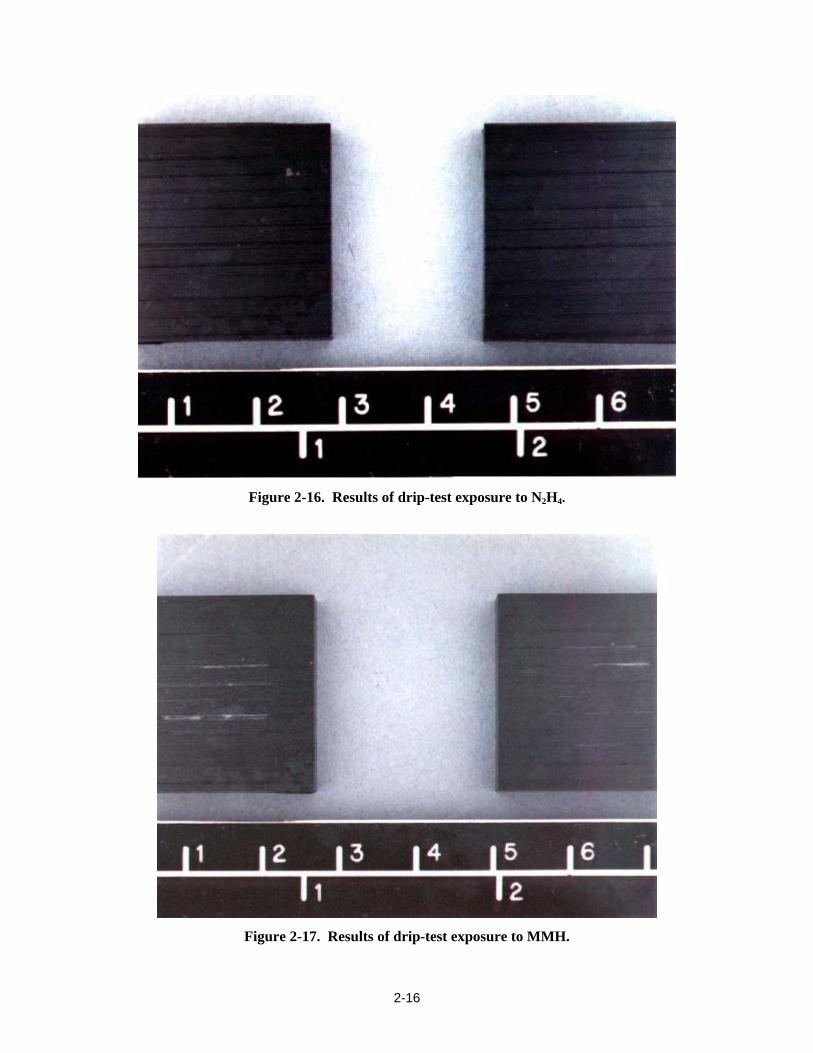
2-16
Figure 2-16. Results of drip-test exposure to N2H4.
Figure 2-17. Results of drip-test exposure to MMH.

2-17
Figure 2-18. Results of drip-test exposure to UDMH.
Figure 2-19. Results of drip-test 2-hr exposure to N2O4.

2-18
Figure 2-20. Results of N2H4-immersed flex samples.

2-19
Figure 2-21. Results of MMH-immersed flex Samples.
Figure 2-22. Results of N2O4-immersed flex samples.

2-20
Figure 2-23. Results of N2O4 vapor-exposed flex samples.
References ASTM D 790 (90). Standard Test Methods for Flexural Properties of Unreinforced and Reinforced
Plastics and Electrical Insulating Materials. Annual Book of ASTM Standards, Vol. 8.01, American Society for Testing and Materials, Philadelphia, PA, 1992.
Chang, J. B., H. D. Beeson, M. R. Cain, W. L. Ross, and D. D. Davis. "Experimental Evaluation of
Space Flight Composite Overwrapped Pressure Vessels." Paper at the Joint JANNAF Structures and Mechanical Behavior Subcommittee and NDE Subcommittee. Hill AFB, UT, October 24-28, 1994.
NASA. Flammability, Odor, Offgassing, and Compatibility Requirements and Test Procedures for
Materials in Environments that Support Combustion; NHB 8060.1C. NASA Office of Safety and Mission Quality, Washington, D.C., 1991.
NASA. An Evaluation of the N2O4, N2H4, and MMH (Monomethylhydrazine) Compatibility of the
Graphite/Epoxy Laminate Used on the Helium Tank on the Mars Observer. 92-2083, NASA Kennedy Space Center, FL, 1992.

3-1
Chapter 3 Test Report: Enhanced Technology for Composite Over-wrapped Pressure Vessels
Subtask 3.6: Material Compatibility Testing: Exposure/Burst Tests of Lincoln Composites Vessels Summary Report
(originally published as TR-804-002)
3.1 Introduction
COPVs are used as pressurant- and propellant-containment systems on aerospace vehicles including launch vehicles, upper stages, satellites, space probes, the Shuttle, and the Space Station. Composed of high-strength fibers embedded in a matrix material wrapped over a thin metal liner, a COPV offers the advantage of a high strength-to-weight ratio. The overwrap, however, is subject to damage by impact or exposure to reactive chemicals such as propellants (Chang et al. 1994). Range safety and mission reli-ability issues have been raised concerning the loss of strength in the overwrap and possible tank failure because of exposure to propellant leaks.
Previous test results (NASA 1992) have shown that the graphite/epoxy (Gr/Ep) laminate material used in the He pressure tank aboard the Mars Observer was visibly changed by exposure to vapor or liquid hypergols, particularly to N2O4.
Propellant fluids of interest in this study are N2H4, N2O4, and LOX.
This summary report presents the results of exposure/burst tests of Lincoln Composites Model 220088-1 Gr/Ep COPVs with typical propellant fluids.
Note: Subtask 3.6: Material Compatibility Testing of Graphite/Epoxy Composite Overwrapped Pres-sure Vessels (COPV) is a subtask of Task 3.0 of the Enhanced Technology for Composite Over-wrapped Pressure Vessels (COPV) Program Plan, Rev. C (Chang et al. 1993).
3.2 Objective
The objective of Subtask 3.6 was to determine the effect that exposure to typical propellant fluids has on the burst strength of Gr/Ep COPVs.
3.3 Approach
The overall approach for Subtask 3.6 was to expose Gr/Ep COPVs to propellants under a simulated launch processing scenario. The scenario included a leak in a space vehicle propellant line causing propellant to drip or pool on the Gr/Ep surface of a COPV for a short time, followed by soaking and drying periods simulating the time necessary for repairs to be conducted.
The launch pad safety concern is for the COPV to retain its integrity during these events. The time between the development and detection of the leak has been estimated to be 10 min. Allowing for a worst-case situation, we chose 2 hr for time to expose COPVs to the propellant for this test series. In the simulated scenario, repairs could begin immediately after the leak is stopped, or up to 24 hr later. We

3-2
measured the burst strengths of COPVs both immediately and 24 hr after the exposure period. Integrity of a pressurized and exposed vessel for this period would alleviate concerns of premature stress rupture.
In the scenario used, only the outside surface of a COPV can be exposed to the fluid. We simulated this scenario by partially immersing the COPVs in the test fluid.
3.4 Experimental
3.4.1 Test Article
Lincoln Composites Model 220088-1 is a spherical COPV with a 5086 aluminum alloy liner over-wrapped with T-40 graphite fiber and epoxy resin of:
Diameter: 26 cm (10.25 in.)
Volume: 8030 cm3 (490 in.3)
Maximum Expected Operating Pressure: 41,369 kPa (6000 psi)
Proof Pressure: 51,711 kPa (7500 psi)
Minimum Design Burst Pressure: 62,053 kPa (9000 psi)
Table 3-1 shows specifications for the test fluids.
Table 3-1. Test Fluid Specifications
Fluid Specification
Hydrazine MIL-P-26536C, Amend 2
Dinitrogen tetroxide MIL-P-26539D
Liquid oxygen MIL-O-27210E, Amend 1
3.4.2 Procedures
We tested COPVs in triplicate for each test sequence and fluid. For a baseline comparison, we per-formed a set of burst tests on COPVs not exposed to test fluids. Based on the data from the SCI tests,3 the Lincoln Composites COPVs were tested only by the immersion/wet burst test sequence procedure with HZ, NTO, and LOX.
3.4.2.1 Exposure Procedures
In the immersion/wet burst-test sequence (2 hr/wet) for the propellant fluids, the vessels were hydrauli-cally pressurized to 95% of MEOP and partially immersed in test fluid for 2 hr. The immersion system
1 Delgado, R. and D. D. Davis. Enhanced Technology for Composite Overwrapped Pressure Vessels Subtask 3.6: Material Compatibility Testing Exposure/Burst Tests of Structural Composite Vessels Summary Report. TR-804-003, NASA Johnson Space Center White Sands Test Facility, Las Cruces, NM, publication in progress.

3-3
was designed to expose approximately one-third of the longitudinal surface of the COPV and avoid exposure of the forward and aft bosses and ancillary pressure fittings. After the immersion period, we depressurized and then burst-tested the COPV. The time delay between removal from the test fluid and burst test was normally less than 1 hr.
In the immersion/wet burst-test sequence (2 hr/wet) for LOX, we pressurized the vessels with He to 105% of MEOP and partially immersed them in cryogen for 2 hr. The immersion system was designed to expose approximately one-third of the surface of the COPV. After the immersion period, we removed the cryogen from contact with the COPV and, after 1 hr, depressurized and then burst-tested the COPV.
3.6.4.2.2 Burst Procedures
After the exposure procedures, we filled the vessel with deionized water, installed it in the burst system, and pressurized it to 2100 kPa (300 psi). We purged the air from the system, and increased the pressure in the vessel hydraulically at a nominal rate of 344 kPa/s (50 psi/s). At the vessel MEOP, the pressure in the system was held constant for 60 s. We then ramped the pressure in the vessel at 344 kPa/s (50 psi/s) until vessel failure. The burst test was recorded on 200-frames-per-second (fps) videotape.4 Vessels exposed to NTO are shown before and after burst failure in Figures 3-1 and 3-2, respectively.
3.5 Results
Table 3-2 and Figure 3-3 give the mean burst pressure and standard deviation for baseline and exposed vessels. Student t-test statistical analysis showed no significant difference between the mean burst pressure of the baseline vessels compared to the mean of the exposed vessels at the 95% confidence level.
Table 3-2. Burst Test Results for Lincoln Composites Model 220088-1 COPVs
Propellant Sequence Burst Pressure (Mean ± Standard Deviation)
(kPa) (psi)
None Baseline 73,739 ± 972 10,695 ± 141
Hydrazine 2 h/wet 75,194 ± 4709 10,906 ± 683
Dinitrogen tetroxide 2 h/wet 72,195 ± 972 10,471 ± 141
Liquid oxygena 2 h/wet 72,778 ± 204 10,557 ± 30
a Per customer request, only two vessels were tested with liquid oxygen; therefore, only the average deviation could be calculated from this test sequence.
4 All data, video, and photos are on file at White Sands Test Facility under WSTF # 96-30013, 96-30057, and 97-30556.

3-4
3.6 Discussion
The mean burst pressure from each test sequence of the Lincoln Composites Model 220088-1 COPVs exposed to N2H4 and N2O4 showed no significant difference from the mean burst pressure of the unex-posed vessels. The COPVs exposed to N2O4 developed a yellow residue on the exposed surface (Figure 3-1) but this did not significantly affect the burst strength. The mean burst pressure from the 2 hr/wet test sequence of the COPVs exposed to LOX also showed no significant difference from the mean burst pressure of the unexposed vessels. At the customer’s request, only two vessels were tested with LOX; therefore, only the mean burst pressure could be calculated from this test sequence.
3.7 Conclusions
We measured no significant effect on burst strength after exposing Lincoln Composites Model 220088-1 Gr/Ep COPVs to the space vehicle fluids N2H4, N2O4, or LOX under simulated launch pad leak scenarios.
Figure 3-1. Typical post-exposure COPV.

3-5
Figure 3-2. Typical post-burst COPV.
0
1,000
2,000
3,000
4,000
5,000
6,000
7,000
8,000
9,000
10,000
11,000
PSI
HZ-Wet Baseline NTO-Wet LOX-Wet
BURST PRESSURES
Figure 3-3. Burst test results for Lincoln Composites Model 220088-1 COPVs.

3-6
References
Chang, J. B., H. D. Beeson, M. R. Cain, W. L. Ross, and D. D. Davis. “Experimental Evaluation of Space Flight Composite Overwrapped Pressure Vessels.” Paper at the Joint JANNAF Structures and Mechanical Behavior Subcommittee and NDE Subcommittee. Hill AFB, UT, October 24-28, 1994.
NASA. An Evaluation of the N2O4, N2H4, and MMH (Monomethylhydrazine) Compatibility of the
Graphite/Epoxy Laminate Used on the Helium Tank on the Mars Observer. 92-2083, NASA Kennedy Space Center, FL, 1992.

4-1
Chapter 4 Test Report: Enhanced Technology for Composite Over-wrapped Pressure Vessels
Subtask 3.6: Material Compatibility Testing Exposure/Burst Tests of Structural Composites Vessels Summary
Report
(originally published as TR-804-003)
4.1 Introduction
COPVs are used as pressurant- and propellant-containment systems on aerospace vehicles including launch vehicles, upper stages, satellites, space probes, the Shuttle, and the Space Station. Composed of high-strength fibers embedded in a matrix material wrapped over a thin metal liner, a COPV offers the advantage of a high strength-to-weight ratio. The overwrap, however, is subject to damage by impact or exposure to reactive chemicals such as propellants (Chang et al. 1994). Range safety and mission reli-ability issues have been raised concerning the loss of strength in the overwrap and possible tank failure because of exposure to propellant leaks.
Previous test results (NASA 1992) have shown that the Gr/Ep laminate material used in the He pressure tank aboard the Mars Observer was visibly changed by exposure to vapor or liquid hypergols, particu-larly to N2O4.
Propellant fluids of interest in this study are N2H4, MMH, UDMH, N2O4, LOX, and LN2.
This summary report presents the results of exposure/burst tests of SCI Model AC 5229 Gr/Ep COPVs with typical propellant fluids.
Subtask 3.6: Material Compatibility Testing of Graphite/Epoxy Composite Overwrapped Pressure Vessels (COPV) is a subtask of Task 3.0 of the Enhanced Technology for Composite Overwrapped Pressure Vessels (COPV) Program Plan, Rev. C (Chang et al. 1993).
4.2 Objective
The objective of Subtask 3.6 was to determine the effect that exposure to typical propellant fluids has on the burst strength of Gr/Ep COPVs.
4.3 Approach
The overall approach for Subtask 3.6 was to expose Gr/Ep COPVs to propellants under a simulated launch processing scenario. The scenario included a leak in a space vehicle propellant line causing propellant to drip or pool on the Gr/Ep surface of a COPV for a short time, followed by soaking and drying periods simulating the time necessary for repairs to be conducted.

4-2
The launch pad safety concern is that the COPV retains its integrity during these events. The time be-tween the development and detection of the leak has been estimated to be 10 min. Allowing for a worst-case situation, the time of exposure of COPVs to the propellant was chosen as 2 hr for this test series. In the simulated scenario, repairs could be effected immediately after the leak is stopped, or up to 24 hr later. The burst strengths of COPVs were measured both immediately and 24 hr after the exposure period. Integrity of a pressurized and exposed vessel for this period would alleviate concerns of prema-ture stress rupture.
In the scenario used, only the outside surface of a COPV can be exposed to the fluid. This scenario was simulated by partially immersing the COPVs in the test fluid.
4.4 Experimental
4.4.1 Test Article
SCI Model AC 5229 is a subscale cylindrical COPV with a seamless aluminum liner and graphite epoxy overwrap.
Length: 24.9 cm (9.7 in.)
Diameter: 9.7 cm (3.8 in.)
Volume: 1114 cm3 (68 in3)
Maximum Expected Operating Pressure: 24,132 kPa (3500 psi)
Proof Pressure: 36,197 kPa (5250 psi)
Minimum Design Burst Pressure: 48,263 kPa (7000 psi)
Specifications for the test fluids are shown in Table 4-1.
Table 4-1. Test Fluid Specifications
Fluid Specification
Hydrazine MIL-P-26536C, Amend 2
Monomethylhydrazine MIL-P-27404B
Unsymmetrical dimethylhydrazine MIL-P-25604D
Dinitrogen tetroxide MIL-P-26539D
Liquid oxygen MIL-O-27210E, Amend 1
Liquid nitrogen MIL-P-27401C
4.4.2 Procedures
We tested COPVs in triplicate for each test sequence and fluid. For a baseline comparison, we per-formed a set of burst tests on COPVs not exposed to test fluids at the beginning and the end of the test program.

4-3
4.4.2.1 Exposure Procedures
In the immersion/wet burst-test sequence (2 hr/wet), we pressurized the vessels to 95% of MEOP and partially immersed in test fluid for 2 hr. The immersion system was designed to expose approximately one-third of the longitudinal surface of the COPV and avoid exposure of the forward and aft bosses and ancillary pressure fittings. After the immersion period, we depressurized and then burst-tested the COPV. The time delay between removal from the test fluid and burst test was normally less than 1 hr.
In the immersion/wet burst test sequence (2 hr/wet) for the cryogenics, we pressurized the vessels to 105% of MEOP with He and partially immersed in cryogen for 2 hr. The immersion system was de-signed to expose approximately one-third of the surface of the COPV. After the immersion period, we removed the cryogen from contact with the COPV and, after 1 hr, depressurized and then burst-tested the COPV.
The immersion dry/burst (2 hr/24 dry) sequence used the same 2-hr partial immersion in the test fluid and depressurization, but the COPV was allowed to air dry at ambient temperature for 24 hr before burst-testing.
4.4.2.2 Burst Procedures
After the exposure procedures, we filled the vessel with deionized water, installed it in the burst system, and pressurized it to 2,100 kPa (300 psi). We purged the air from the system, and increased the pressure in the vessel hydraulically at a nominal rate of 344 kPa/s (50 psi/s). At the vessel MEOP, the pressure in the system was held constant for 60 s. We then ramped the pressure in the vessel at 344 kPa/s (50 psi/s) until vessel failure. The burst test was recorded on 200-fps videotape.5 Figure 4-1 shows typical vessels before and after burst failure.
4.5 Results
There were no significant visual or structural changes to the overwrap caused by exposure to N2H4, MMH, UDMH, LOX, or LN2. The matrix material reacted with the N2O4 to form a thin layer of yellow reaction product as shown in Figure 4-2. The yellow material has been identified as nitrated epoxy matrix (Chang et al. 1994). There was no detectable damage to the graphite fibers.
Table 4-2 and Figure 4-3 give the mean burst pressure and standard deviation for baseline and exposed vessels. Student t-test statistical analysis showed no significant difference between the mean burst pressure of the baseline vessels compared to the mean of the exposed vessels at the 95% confidence level.
4.6 Discussion
The mean burst pressure from each test sequence of the SCI Model AC 5229 COPVs exposed to the hydrazines and N2O4 showed no significant difference from the mean burst pressure of the unexposed
5 All data, video, and photos are on file at White Sands Test Facility under WSTF # 96-29786, 96-30058, 96-30328, and 96-30329.

4-4
vessels. The mean burst pressure from the 2-hr/wet test sequence of the COPVs exposed to LOX and LN2 also showed no significant difference from the mean burst pressure of the unexposed vessels.
4.7 Conclusions
No significant effect on burst strength was measured after exposure of SCI Model AC 5229 Gr/Ep COPVs to the space vehicle fluids N2H4, MMH, UDMH, N2O4, LN2 or LOX under simulated launch pad leak scenarios.
Table 4-2. Burst Test Results for SCI Model AC 5229 COPVs
Propellant Sequence Burst Pressure
(Mean ± Standard Deviation)
(kPa) (psi)
None Baseline 52,573 ± 1708 7625 ± 248
Hydrazine 2 h/wet 50,684 ± 2100 7351 ± 304
Hydrazine 2 h/24 h dry 50,414 ± 1834 7312 ± 266
Monomethylhydrazine 2 h/wet 52,338 ± 1847 7591 ± 268
Monomethylhydrazine 2 h/24 h dry 51,883 ± 510 7525 ± 74
Unsymmetrical dimethylhydrazine 2 h/wet 51,718 ± 2889 7501 ± 419
Unsymmetrical dimethylhydrazine 2 h/24 h dry 52,621 ± 2668 7632 ± 387
None Baseline 49,663 ± 2310 7203 ± 335
Dinitrogen tetroxide 2 h/wet 52,518 ± 4482 7617 ± 650
Dinitrogen tetroxide 2 h/24 h dry 52,001 ± 4819 7542 ± 699
Liquid oxygen 2 h/wet 48,009 ± 834 6963 ± 121
Liquid nitrogen 2 h/wet 48,395 ± 1669 7019 ± 242

4-5
Figure 4-1. Typical post-burst and pretest COPVs.
Figure 4-2. COPV after exposure to NTO.

4-6
HZ
-Wet
HZ
-Dry
MM
H-W
et
Bas
elin
e
MM
H-D
ry
UD
MH
-Wet
UD
MH
-Dry
NT
O-W
et
NT
O-D
ry
Bas
elin
e
LN
2-W
et
LO
X-W
et
0
1,000
2,000
3,000
4,000
5,000
6,000
7,000
8,000
PSI
BURST PRESSURES
Figure 4-3. Burst test results for SCI Model AC 5229 COPVs.
References Chang, J. B., H. D. Beeson, M. R. Cain, W. L. Ross, and D. D. Davis. “Experimental Evaluation of Space
Flight Composite Overwrapped Pressure Vessels.” Paper at the Joint JANNAF Structures and Mechanical Behavior Subcommittee and NDE Subcommittee. Hill AFB, UT, October 24-28, 1994.
NASA. An Evaluation of the N2O4, N2H4, and MMH (Monomethylhydrazine) Compatibility of the
Graphite/Epoxy Laminate Used on the Helium Tank on the Mars Observer. 92-2083, NASA Kennedy Space Center, FL, 1992.
5-1
Chapter 5 Test Report: Impact Damage Effects and Control Applied to Composite Overwrapped Pressure Vessels
(originally published as TR-806-001)
Abstract The impact sensitivity of COPVs was identified through the testing performed under Task 3.3 of the joint USAF/NASA Program Plan. As a result of this finding, it was necessary to establish impact damage control requirements and to develop an impact control plan for the COPV manufacturer and user com-munity. The object of Task 8 was to establish these requirements and to develop an impact damage control plan that employs state-of-the-art impact damage protection measures for the COPV. Through Task 3.3 test results, literature searches, a COPV impact damage workshop, industry surveys, and site visits, the database information on impact sensitivity of COPVs was extended and used to determine the impact damage control requirements. Additional drop testing to evaluate the impact damage sensitivity of COPVs to potential handling scenarios complemented this database. Attempts to use NDE data in a quantitative manner to predict the burst strength of impact–damaged COPVs were not successful primar-ily because of the large variance associated with the residual burst strength after impact for a COPV. Future work in this area will require finite element modeling analysis that incorporates progressive damage mechanisms as a fundamental method of altering composite material properties during the im-pact process. We analyzed typical impact energy levels to evaluate credible threat environments. We tested and evaluated impact damage indicator and protection schemes for COPVs. An impact control plan was written and validated through the experience of performing Task 3.3 and Task 8 for the joint USAF/NASA Program. Elements of this plan are being incorporated into an American Institute of Aero-nautics and Astronautics industry standard on the safe use of COPVs.
5.1 Introduction
JSC WSTF participated in the joint USAF and NASA research test and evaluation program for the En-hanced Technology for Composite Overwrapped Pressure Vessels (COPVs). The focus of the work was on the Gr/Ep overwrapped pressure vessels with several organizations contributing to the various tasks defined in the program plan.
The impact sensitivity of the COPV was identified through the testing performed under Subtask 3.3 of the USAF Program Plan (Chang, Beeson, and Bailey 1993). As a result of this finding, it was necessary to establish impact damage control requirements and to develop an impact control plan for the aerospace community using the COPV. This document reports on the Task 8 Impact Damage Effects/Control results of the USAF Program Plan.

5-2
5.2 Objective
The overall objective of Task 8 is to establish impact damage control requirements and to develop the impact damage control plan that implements state–of–the–art impact damage protection measures for the COPV. The specific objectives for the three subtasks of Task 8, as modified based on reduction of scope, are listed below:
5.2.1 Subtask 8.1 Objective
• To develop and maintain a database of information including literature search data, COPV manufac-turer’s data, COPV spacecraft contractor’s handling and integration data, and the test results of Task 3.
• To evaluate NDE techniques for applicability to launch site locations and for use within restricted spatial envelopes associated with COPVs installed in spacecraft or vehicle structures.
• To search for accept or reject criteria for application to COPV impact damage assessment.
5.2.2 Subtask 8.2 Objective
• To develop and evaluate impact damage indicator and protection schemes for COPVs.
• To perform handling and drop testing of COPVs in shipping containers to evaluate and validate the shipping container protection methods.
• To perform handling testing of COPVs to determine any degradation in burst strength resulting from drop impacts that potentially could occur during the manufacturing and installation processes.
5.2.3 Subtask 8.3 Objective
• Write and validate an impact control plan.
• Assist industry with the development of guidelines for safe and reliable use of COPVs.
5.3 Background
Heretofore, impact damage to fiber–reinforced composite pressure vessels has not received much atten-tion because fibers such as Kevlar are more impact–damage–tolerant than the graphite fibers used in filament–wound Gr/Ep vessels. Recent applications in the aerospace industry that rely on lightweight structures and pressure vessels have driven the technology toward the use of lightweight high–strength fibers such as graphite. The performance of COPVs is typically measured by a PV/W parameter where P is the MEOP, V is the volume of the vessel, and W is the weight. Unfortunately, Gr/Ep composites are more susceptible to low-velocity impact damage such as that encountered from tool drops or impacts. Thus, the performance factor for a Gr/Ep vessel can be rapidly degraded by impact damage to the point that the vessel will no longer pass a proof test.
Visual and other NDE inspections historically have been used to determine if impact damage has oc-curred to metallic pressure vessels. With Gr/Ep COPVs, a significant impact is frequently invisible. Thus, a combination of inspection techniques is required to qualitatively identify impact damage. This background section reviews the types of NDE techniques historically used to inspect Gr/Ep composites.

5-3
5.3.1 Historical NDE Inspection Techniques for Gr/Ep Composites
Sierakowki and Newaz (1995) give a general summary of the types of NDE methods historically used to detect defects in advanced composites, such as ultrasonic, X–ray radiography, dye penetrant enhanced radiography, eddy current, and optical aided (10X) visual examination of surface discontinuities. The types of composite defects cited include translaminer surface and subsurface fractures, core cell damage and fluid ingestion, porosity, disbonds, impact damage, fastener hole damage, lightning damage, and heat or fire damage.
More specific to impact damage, Gros (1995) identifies several types of NDE techniques that have been applied to detect low-energy impacts (0.5 to 10 J) in carbon-reinforced composites. These techniques include visual, coin tapping, ultrasonic, eddy current, IR thermography, X–ray radiography, laser holo-graphy, shearography, and air coupled ultrasonics. He concludes that more than one type of NDE method is usually required to inspect composite materials.
Zalameda, Farley, and Smith (1994) compares IR thermography to ultrasonic C–scan techniques for the inspection of impact damage to Kevlar and carbon composite panels (e.g., flat and Y–stiffened). The study used IR thermography as a rapid in–service detection method with ultrasonic C–scans performing more detailed quantitative diagnostic inspections of suspect regions. Although the ultrasonic work focused on implementing C–scan measurements within immersion tanks, the author claims (without providing test data) that dry contract transducers are available for field use.
Task 4.0 of the USAF Program Plan (Chang, Beeson, and Bailey 1993) was conducted at Aerospace Corp. as a pathfinder project to the COPV program in 1994. This work (Nokes et al. 1994 and Beeson et al. 1995) reviewed the relative merits of IR thermography, ultrasonic C–scan, shearography, and acoustic emission for the detection of essentially nonvisible impact damage to COPVs. All methods were recom-mended for qualitative detection of low-energy impacts to COPVs; however, ultrasonic C–scan was restricted to field cases that permitted COPV immersion in a coupling fluid and shearography required a spray–on dye penetrant developer to obtain reliable fringes. This work did not attempt to correlate the NDE indications with the residual burst strength of the COPV after impact.
Acoustic emission methods of detecting manufacturing flaws were investigated as part of the USAF Program Task 6.0 activity (Chang, Beeson, and Bailey 1993). This work was performed by Hamstad and Downs and reported in several publications (Hamstad and Downs 1995; Downs and Hamstad 1995a; Downs and Hamstad 1995b; and Downs and Loechel 1996). In addition to the acoustic emission method, this work also explored the sensitivity of X–ray radiography, shearography, and IR thermography to detect defects in the metal liner and composite overwrap. Only acoustic emission activity measured during an initial pressurization ramp to the proof pressure testing provided any degree of correlation to variations in the manufacturing parameters. Acoustic emission, measured in terms of the Felicity ratio, during a second pressurization ramp to proof–pressure level correlated reasonably well with the burst strength of spherical COPV; however, similar measurements performed on small cylindrical COPVs yielded no definitive trend. These tests, performed with up to 16 transducers installed on the COPV with special fixtures, substantiated the degree of attenuation characteristic of acoustic emission signatures propagating in Gr/Ep composites.
Other investigators have searched for correlations between the burst strength or impact location of fila-ment–wound Gr/Ep pressure vessels and acoustic emission signatures. Hill, Walker, and Rowell (1996) demonstrated that the burst pressure of undamaged vessels can be predicted to ± 5% using a back–
5-4
propagation neural network analysis of the acoustic emission signatures measured during pressurization to 25% of expected burst pressure. Connolly (1995) has shown that waveform analysis of acoustic emission signatures can be used to accurately locate an impact damage site using triangulation from an array of transducers. In addition, the event density of the acoustic emission signatures at the impact zone correlates reasonably well with impact energy.
More recently, Downs and Hamstad (1998) reported using acoustic emission during the depressurization cycle of impact–damaged COPVs. They introduced the Shelby ratio as a means of quantitatively assess-ing the unload acoustic emission. Linear correlations between the Shelby ratios and the residual vessel strength were obtained for hydrostatic pressurization of the impact–damaged COPV.
Prior art associated with using acoustic emission analysis to inspect filament–wound vessels has focused on using hydrostatic means of pressurizing the filament–wound vessel or COPV. It is still unknown if the acoustic emission NDE techniques can be reliably used for in situ monitoring of pneumatically pres-surized COPVs. Also, none of the previous NDE work has evaluated sensitivity to COPV impact dam-age when the vessel is pressurized hydrostatically or pneumatically during the impact event.
Various NDE techniques have been applied to the inspection of filament–wound rocket motor cases. Ultrasonic A–scan techniques were recommended as effective inspection methods for detecting signifi-cant impact damage to rocket motor cases.6 In addition, this study also found that a mechanical imped-ance analyzer (instrumented coin tapping) was effective in detecting impact flaws in composite motor cases even through a cork liner. Other investigators (Raju, Patel, and Vaidya 1993) have successfully used an instrument form of coin tapping to detect delamination defects in fiber–reinforced Gr/Ep com-posites. Poe (1990) used penetrant–enhanced radiography (X–ray) to inspect impact damage to 36–mm (1.4–in.)-thick walled solid rocket motors for the Space Shuttle. These rocket motor cases generally do not have a metal liner, so penetrant–enhanced radiography is the NDE method of choice for these appli-cations.
5.3.2 Impact Damage Indicators, Protectors, and Control Plans
In the aerospace industry, high–density foam Ensolite and fiberglass epoxy hardshell covers have been used as a type of impact protection for flight hardware. The high–density foam Ensolite will be shown in this work to be inadequate for impact protection. Before the use of Gr/Ep COPVs, impact indicators or impact control plans were not mandatory; therefore, precedence in the technology is limited to general care and protection of spacecraft hardware.
5.4 Approach
The basic approach for Task 8 was to conduct a literature and industry survey to review the prior art associated with impact control for COPVs. We planned special tests, in addition to database extension tests proposed for Task 3, to assess the impact sensitivity of COPV impacts likely to occur during the shipping and handling process and to evaluate impact damage protection schemes for COPVs. Finally, we proposed an impact control plan as a means of providing the industry with guidelines to ensure safe use of COPVs.
6 Private discussions with J. B. Chang, The Aerospace Corp. on DELTA II failure investigation. June 18, 1997.

5-5
5.4.1 Approach for Subtask 8.1
General Physics, Inc., (GPS) and The Aerospace Corporation initially conducted the literature search for the COPV program. GPS established a COPV literature database, using the Pro–Cite software system. This database was transferred to WSTF and maintained throughout the duration of the program with new literature updates.
We surveyed the COPV industry by visiting manufacturing plants, spacecraft contractor facilities, and launch facilities. In addition, we conducted a COPV impact damage workshop at WSTF with a follow–up questionnaire to industry. We used ACCESS software to establish the database for the industry survey and the test data (Tasks 3 and 8).
We integrated field–applicable NDE techniques based on the pathfinder results of Task 4 directly into the Task 3 tests so that no additional COPV assets were required to meet this objective. We gained addi-tional experience in performing NDE on COPVs mounted within spacecraft hardware by performing in situ visual inspections at a spacecraft contractor facility during the program.
The approach to search for accept or reject criteria for application to COPV impact damage assessment was to evaluate the correlation and data trends of the normalized burst–strength after–impact (BAI) with the NDE data. We initially planned to model using finite element analysis (FEA), incorporating progres-sive damage mechanisms and NDE data, to predict the normalize BAI for an impact–damaged COPV.
5.4.2 Approach for Subtask 8.2
We used the industry survey and literature search to assess the prior art in impact protection for compos-ite structures and developed designs for COPVs that provided indication, indentation protection, and deflection protection within a single laminate cover. We performed screening tests on Gr/Ep plaques to qualify the design, and generated application drawings to assess the cost and feasibility of using protec-tive covers. Additionally, we performed visual damage threshold (VDT) testing on a 19–in. diameter spherical COPV that was partially coated with a polyurethane over one–half of the vessel surface area. This VDT testing provided a direct comparison of a coating indicator compared to an uncoated vessel surface.
We evaluated the prior art in shipping container designs for the COPV as part of the industry survey completed in Subtask 8.1. Based on this information, we designed and fabricated shipping containers to test the degree of COPV protection afforded by these impact control devices during shipping and deliv-ery handling. We tested by dropping the shipping containers from loading dock heights for both the small spherical and cylindrical COPVs.
We also performed handling tests of COPVs to determine the degradation in burst strength resulting from potential floor drop impacts that could occur during the manufacturing and installation processes.
5.4.3 Approach for Subtask 8.3
The approach for this subtask was to write an Impact Control Plan (ICP) based on the research data collected from Tasks 3 and 8. We originally planned to validate the ICP with a set of COPVs (six units). We also defined the subtask to help industry develop guidelines for safe and reliable use of COPVs.

5-6
5.5 Experimental and Test Descriptions
5.5.1 Subtask 8.1 Experimental and Test Descriptions
No experimental apparatus was required for Subtask 8.1 once it became clear that the assessment of the field–applicable NDE techniques identified by the pathfinder research of Task 4 could be achieved within Task 3.
The COPV databases were implemented on PC platforms by using the Pro–Cite software for PC and by using ACCESS. We used a server on the WSTF local area network to archive the database information.
Following a reduction in program scope, no computer equipment was required for performing FEA modeling calculations. Preliminary modeling of impact damage performed by Aerospace Corp. (before 1997) on representative vessels indicated this task was beyond the scope of the program, and subse-quently this specific task was terminated. We also corroborated this programmatic action by literature research indicating that impact damage modeling is highly dependent on the successful integration of progressive damage mechanisms into the model.
5.5.2 Subtask 8.2 Experimental and Test Descriptions
5.5.2.1 Impact Protector Test Apparatus
Figure 5-1 shows the experimental apparatus used to screen the various impact protector designs. We clamped Gr/Ep plaques (10.2 × 10.2 × 0.63 cm) in the fixture and subjected them to 47.4-J (35-ft–lbf) impacts delivered by the DynaTup instrumented mechanical impact tester (IMIT). The IMIT used either the 1.27–cm (0.5–in.)-dia or the 2.54–cm (1.0–in.)-dia hemispherical tup. We measured the deflection of the Gr/Ep plaque using the linear variable differential transformer (LVDT) depicted in Figure 5-1. Lucas Schaevitz manufactured the LVDT (Model 250–MHR) with a 0.635–cm (0.25–in.) displacement range.
We tested various impact protector designs consisting of composite laminates by placing the specimen on top of the Gr/Ep plaque and subjecting the protector to the 47.4 J (35 ft–lbf) impact. We taped a force sensor film (obtained from a force sensing resistor design kit manufactured by Cherry Interlinks Elec-tronics) to an Ensolite foam layer to record the amplitude of the impact force transmitted through the impact protector specimen. The force sensor resister film was driven by a 5–V supply connected in series with 10k–ohm resister to form a resistive divider network. The transient signal was coupled to a Philips PM (3323) oscilloscope via a 0.1–µF capacitor and was used to trigger the scope during the test to record the LVDT signature.
Using an electronic comparator on the output of the force sensor, it is possible to discriminate between impact forces that could potentially cause damage and low-energy benign impacts. The comparator can also be used to drive alarms or illuminate a hazard warning light system, should the structural integrity of the Gr/Ep COPV be compromised as a result of a potential impact. These force sensors use special resistive films mounted on polymer sheets and are available in a variety of shapes and sizes. They can also be used as linear potentiometers within array designs to pinpoint the location of a potential impact. The electronic comparator circuit was not tested in this work.
The Gr/Ep plaques used in these tests were fabricated using Toray T–10006B carbon fibers and a SCI–REZ epoxy matrix. The matrix, fiber, lay–up process, and cure cycle were those SCI used. The plaques

5-7
were laid up in a 0, –45, +45, 90, 90, +45, –45, 0 pattern with a fiber volume of approximately 65% and a cured thickness of approximately 0.63 cm (0.25 in.). The manufacturer cured the plaques in a press and trimmed them to size. Test specimens for the impact protector screening tests were cut to dimensions of 10.2 × 10.2 × 0.63 cm from the larger manufactured plaques (30 × 30 × 0.63 cm) using a diamond saw.
The various impact protector designs consisting of combinations of Ensolite foam, fiberglass epoxy hardshells, and aluminum mesh foam (manufactured by ERG Materials and Aerospace Corp.) were tested to determine a relative performance ranking with respect to mitigation of the indentation and deflection damage resulting from a 47.4-J (35-ft–lbf) impact.
5.5.2.2 Impact Indicator Test Apparatus
Impact indicators are defined as any physical or chemical means of detecting an impact by an observed visual imprint. Examples of impact indicators include pressure–sensitive tapes or covers, bubble dye coatings or covers, polyurethane or acrylic coatings that craze, plexiglass or glass covers that fracture, and deformable metal covers. The covers can be used with scuff–protective foam liners or as standoff housings that do not have direct contact with the COPV.
We impact-tested a polyurethane conformal coating to determine the VDT for a 19–in. spherical COPV supplied from ARDE, Inc. This vessel was coated on half of the surface and uncoated on the other half. Uncoating in this particular case implies no excess resin on the surface of the graphite overwrap. We tested using the IMIT starting at an impact energy of 47.4 J (35 ft-lbf) with a 1.27–cm (0.5–in.) hemi-spherical tup. The energy level was incrementally modified in steps of 10 ft–lbf until three inspectors trained in spotting impact damage on COPVs could no longer visually detect the impact locations. This test was repeated for both the coated and uncoated portions of the COPV.
We conducted visual damage threshold tests on all types of uncoated COPVs tested in the project by inspecting each vessel after an IMIT test. This process permitted the VDT to be established within a 95% confidence level for both the 10.25–in. spherical and 6.6– × 20–in. cylindrical COPV.
5.5.2.3 Shipping Container Descriptions
A survey of the COPV manufacturers indicated the foam–lined cardboard box and wood crates were typically used to ship the COPVs. Large COPVs were typically shipped in a wood crate with foam–lined saddles and chocks to support the vessel. The containers are foam lined per MIL–PRF–26514 and the shock case specified by FED–STD 101, Method 5007.1, Level B. The manufacturer typically performs and records inspections of the COPV, just before shipment, on the pedigree data sheet.
Figure 5-2 shows a photo of the wood crate design for shipping the small spherical (10.25–in.-dia) and the small cylindrical (6.6– × 20–in.) COPV. For the small spherical COPV, both the cardboard box and the wood crate were lined with a high–density foam of 2.54-cm (1.0-in.) minimum thickness. The ship-ping containers for the small cylindrical vessels used styrofoam saddles and chocks to suspend the COPV from the inner walls of the container. The small spherical and cylindrical COPVs were shipped to WSTF in cardboard containers so these same shipping containers were used for drop testing. The wood crates were fabricated at WSTF based on a combination of basic designs associated with cardboard boxes and wood crates, as supplied by the various manufacturers. Drawings of the wood crate shipping container designs are available at WSTF as part of the program documentation.
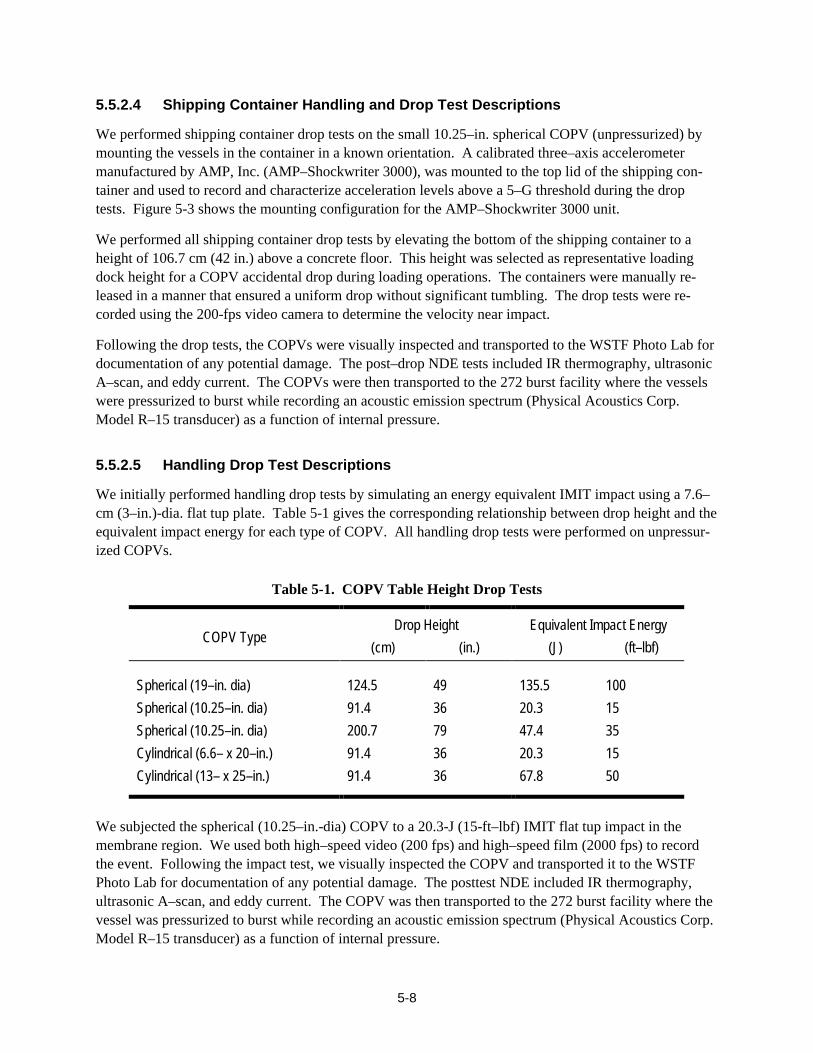
5-8
5.5.2.4 Shipping Container Handling and Drop Test Descriptions
We performed shipping container drop tests on the small 10.25–in. spherical COPV (unpressurized) by mounting the vessels in the container in a known orientation. A calibrated three–axis accelerometer manufactured by AMP, Inc. (AMP–Shockwriter 3000), was mounted to the top lid of the shipping con-tainer and used to record and characterize acceleration levels above a 5–G threshold during the drop tests. Figure 5-3 shows the mounting configuration for the AMP–Shockwriter 3000 unit.
We performed all shipping container drop tests by elevating the bottom of the shipping container to a height of 106.7 cm (42 in.) above a concrete floor. This height was selected as representative loading dock height for a COPV accidental drop during loading operations. The containers were manually re-leased in a manner that ensured a uniform drop without significant tumbling. The drop tests were re-corded using the 200-fps video camera to determine the velocity near impact.
Following the drop tests, the COPVs were visually inspected and transported to the WSTF Photo Lab for documentation of any potential damage. The post–drop NDE tests included IR thermography, ultrasonic A–scan, and eddy current. The COPVs were then transported to the 272 burst facility where the vessels were pressurized to burst while recording an acoustic emission spectrum (Physical Acoustics Corp. Model R–15 transducer) as a function of internal pressure.
5.5.2.5 Handling Drop Test Descriptions
We initially performed handling drop tests by simulating an energy equivalent IMIT impact using a 7.6–cm (3–in.)-dia. flat tup plate. Table 5-1 gives the corresponding relationship between drop height and the equivalent impact energy for each type of COPV. All handling drop tests were performed on unpressur-ized COPVs.
Table 5-1. COPV Table Height Drop Tests
Drop Height Equivalent Impact Energy COPV Type
(cm) (in.) (J) (ft–lbf)
Spherical (19–in. dia) 124.5 49 135.5 100
Spherical (10.25–in. dia) 91.4 36 20.3 15
Spherical (10.25–in. dia) 200.7 79 47.4 35
Cylindrical (6.6– x 20–in.) 91.4 36 20.3 15
Cylindrical (13– x 25–in.) 91.4 36 67.8 50
We subjected the spherical (10.25–in.-dia) COPV to a 20.3-J (15-ft–lbf) IMIT flat tup impact in the membrane region. We used both high–speed video (200 fps) and high–speed film (2000 fps) to record the event. Following the impact test, we visually inspected the COPV and transported it to the WSTF Photo Lab for documentation of any potential damage. The posttest NDE included IR thermography, ultrasonic A–scan, and eddy current. The COPV was then transported to the 272 burst facility where the vessel was pressurized to burst while recording an acoustic emission spectrum (Physical Acoustics Corp. Model R–15 transducer) as a function of internal pressure.

5-9
After the IMIT flat tup impact test, we conducted a handling drop test on a second 10.25–in. spherical COPV by dropping the vessel from a table height of 91.4 cm (36 in.) onto a concrete floor in the WSTF 272 area. Again, we used both high–speed video (200 fps) and high–speed film (2000 fps) to record the impact deflection by viewing the event tangential to the floor. This was accomplished by recessing the cameras on the upper steps of the 272 area stairwell leading down to the lower control room.
Following the floor drop test, the COPV was visually inspected and transported to the WSTF Photo Lab for documentation of any potential damage. The posttest NDE included IR thermography, ultrasonic A-scan, and eddy current. The COPV was then transported to the 272 burst facility where the vessel was pressurized to burst while recording an acoustic emission spectrum (Physical Acoustics Corp. Model R–15 transducer) as a function of internal pressure.
5.5.3 Subtask 8.3 Experimental and Test Descriptions
No experimental tests were required for Subtask 8.3. Validation testing of the ICP using COPV assets was not necessary as sufficient experience was gained during the program with respect to proper han-dling during manufacturing operations, shipping, installation, and test.
5.6 Results and Discussion
5.6.1 Subtask 8.1 Results
5.6.1.1 Literature Search Results
Table 5-2 shows the various categories established for the COPV literature database. Most of the litera-ture in the database was associated with impact damage tolerance studies and NDE testing of Gr/Ep reinforced composite structures. The Pro–Cite database contains 874 records that can be accessed with any current version of the Pro–Cite software operating in an MS–DOS environment. The database file is available upon request at WSTF; however, a user must have a license to use Pro–Cite at their location.
5.6.1.2 Industry Survey Results
The results of the industry survey were compiled from launch site visits, a COPV impact damage work-shop, and the response to an industry survey questionnaire (Tapphorn and Beeson 1993). Appendix 5-A shows samples of the information compiled in the ACCESS database, broken down by categories associ-ated with manufacturing, spacecraft contractor facilities, and launch facilities. Each category summa-rizes information related to COPV design, qualification testing, shipping and receiving, NDE methods, impact control, handling procedures, installation testing, quality assurance, and testing. Many details associated with the COPV design and qualification testing are confidential and proprietary to each of the COPV manufacturers. Therefore, this information is only generally summarized in Appendix 5-A, with the details available at WSTF for government use only.
In general, the survey identified an industry awareness to the potential impact sensitivity of COPVs; however, the impact control plans were less than adequate. The industry generally used tethered and inventoried tools, but we observed and noted exceptions during the site observations. Impact protection measures consisted primarily of using Ensolite foam, with limited use of hardshell composite covers.

5-10
Table 5-2. Pro–Cite Search Categories
WSTF Search Category GPS Search Category
Materials data
Materials
Damage tolerance
Impact damage tolerance
Design analysis
Stress analysis
Structural design
General application
Nondestructive examination
Nondestructive evaluation
Test verification
Application
Fracture mechanics
Manufacturing process
Bulk composites
Residual strength–impact damage
Damage tolerance
Manufacturing process
Analysis II
Material system
Nondestructive examination
Testing
Design
Analysis
Material characterization
Quality control
Quality assurance
None of the quality assurance inspectors were trained in the recognition of barely visible impact damage to a COPV. This resulted in confusion with respect to differentiating surface discontinuities frequently encountered during visual inspections of a COPV from actual impact events. In addition, the barely visible character of typical COPV impacts (VDT) implies that untrained inspectors easily disregard impact events.
Table 5-3 shows typical impact scenarios that may be encountered during the manufacture and service life of a COPV. Appendix 5-A shows a detailed list of impact scenarios unique to a particular site. The most likely types of impact events that may not be reported are tool drops (hand and power tools), torque wrench slips, and component collisions during installation. High–energy impacts from forklift impacts, stepladder tip–over, or crane hooks are less likely to go undetected or unreported.
5.6.1.3 Field–Applicable NDE Results
Initially, the program plan anticipated the need to develop NDE techniques and processes applicable to in situ field inspections. We knew from the pathfinder work performed in Task 4 that techniques such as immersion ultrasonics, shearography, and dye–enhanced X–ray radiography would not be applicable for field inspections of COPVs. Thus, we originally allocated 10 COPV assets to develop in situ NDE techniques that could be used within the environmental and physical constraints of COPVs mounted on spacecraft structures.

5-11
The NDE techniques developed for laboratory inspections of impact–damaged COPVs used in Task 3 were all applicable to in situ NDE inspections. These included visual inspection, IR thermography, ultrasonic A–scan probes, coin tapping, eddy current probes, and acoustic emission.
Table 5-3. Typical COPV Impact Scenarios Encountered During Manufacturing and Service Life
Service Stage Impact Damage Scenario
Object Weight
(lb)
Impactor Description
(ft)
Max. Height
(ft)
Max. Velocity
(ft/s)
Max. Impact
Damage Energy (ft–lbf)
Pressurized COPV
All shipping stages Forklift impact of
shipping container 6000 Breach of shipping
container 3 850 No
All stages Wrench swing impact
5 to 10 >¼ in. hemispherical 5 4 Yes or No
All stages COPV swing in sling >25 Edge or corner of equipment
3 4 No
All stages Crane hook impact 50 to 200
Crane hook 3 30 Yes or No
All stages Hand tool drop 0 to 10 >¼ in. hemispherical and/or fiber cuts
10 100 Yes or No
All stages Power tool drop 3 to 25 >¼ in. hemispherical 10 250 Yes or No
All stages 45 deg stepladder tip–over
80 Edge or corner of ladder impact
6 480 Yes or No
All stages Rolling impact of forklift
6000 Fork tongs, edge, or corner
3 850 Yes or No
All stages– post–installation
Component installa-tion
25 to 150
Edge or corner of component
2 10 Yes or No
All stages– post–integration
Torque wrench slip 5 to 10 >¼ in. hemispherical 15 35 Yes or No
All stages– post–integration
Scaffolding installa-tion
100 Edge or corner 5 40 Yes or No
All stages– post–integration
Objects & tool drops by spacecraft personnel
25 to 50 Tool box – corner or edge
10 500 Yes or No
All stages– pre–installation
Table height drop 5 to 25 Concrete floor 3 75 No
Whereas all of the hand probe methods require some procedural fine-tuning with respect to unique field applications, there was no fundamental barrier to in situ implementation. IR thermography requires a line–of–sight view for both the heat lamp and the IR camera in order to perform the inspection. Acoustic emission can only be reliably used during hydrostatic pressurization of the COPV and, therefore, back-ground associated with pneumatic pressurization restricts the application to incremental dwell–mode

5-12
interrogation. Visual inspection procedures were validated during the program by performing inspec-tions of COPVs installed on spacecraft. This task was performed for the NASA AXAF mission at TRW, Inc. Some lessons learned on this project include the fact that some of the COPV surface may not be visible after installation of heaters, temperature sensors, fluid lines, tubes, or electrical harnesses.
5.6.2 Search for Accept or Reject Criteria
Before starting the COPV impact damage testing in Task 3, the program plan called for developing accept or reject criteria for potential impact damage conditions. The goal of the program was to perform FEA modeling of impacts to derive accept or reject criteria based on the extent of impact damage as determined from NDE data. We anticipated that the NDE data could also be used to predict a normalized BAI.
Correlation plots between the normalized BAI and the NDE data were presented in a previous paper (Tapphorn 1996). We analyzed this data to determine if a functional relationship existed between the burst pressure of a damaged vessel and the measured NDE data.
Figures 5-4 and 5-5 show the correlation plot between the normalized BAI and the normalized NDE area (dimensionless parameter) extracted from IR thermographic images of the impact damage for a selected set of the spherical and cylindrical COPVs tested in Task 3. The impact variables represented in these plots include various impact energies, pressurization conditions, and vessel geometries for a 1.2–cm (0.5–in.) tup. Each marker represents the results of one single test.
Although impact energy variation is not apparent in the correlation plot, in general a larger normalized area is produced by a higher-energy impact to an unpressurized COPV. The data clearly show a marked distinction between the impacts to pressurized vs. unpressurized Gr/Ep COPVs. Specifically, the pres-surized impacts have a much-reduced NDE image area. The normalized BAI for impacts to pressurized vessels depend on the impact energy, the filament winding pattern, the internal pressure, the impact location, and the specific geometry of the COPV.
Variation in the BAI of the COPV after impact contributes to a large data scatter. This variation in residual strength for Gr/Ep composites is expected, based on previous impact damage work performed by another investigator. Carins (1987) observed considerable scatter in the residual strength of impact–damaged Gr/Ep plaques compared to Kevlar composite plaques. In general, others have also observed scatter in the residual strength of composites as a result of damage. Beeson et al. (1990) reported a large variance in the residual strength of composite panels as a result of heat and fire damage. This scatter makes it difficult to derive a good functional correlation between the normalized BAI and the normalized damage area. The correlation coefficient for the entire data is only –0.34. For certain groups of COPVs (i.e., the 10.25–in.-dia spherical COPV), the correlation coefficient improves to a value of –0.86, but this is still a very poor correlation.
The trend in the correlation plot of the unpressurized COPV impact data exhibits a subtle slope that suggests a larger NDE normalized area predicts a lower normalized BAI for the COPV. Clearly, the highly clustered impact data associated with pressurized COPVs do not fit the same trend.
The IR thermographic technique is sensitive primarily to the permanent deformation of the metal liner below the Gr/Ep overwrapped composite. Therefore, this case readily yields discernible NDE impact

5-13
damage areas for unpressurized COPV impacts. However, for impacts to pressurized COPVs, the meas-urable area is significantly reduced because the liner is no longer permanently deformed after the impact.
The COPV impact damage area was highly dependent on the impact energy, the impactor geometry, the geometrical size and configuration of the COPV, the filament winding pattern, and the pressurization conditions of the vessel during impact. We used the normalized area to characterize the damage inde-pendent of the vessel geometry and size in terms of a dimensionless area parameter. We was hypothe-sized, at least for impacts to unpressurized Gr/Ep COPVs, that the magnitude of the impact deflection associated with the collapse of a shallow spherical cap on a spherical vessel is approximately related to the chord area of the cap in a relationship described by Equation 1, where D is the diameter of the spheri-cal vessel and δ is the maximum deflection of the shallow cap from its nominal curvature. Figure 5-6 shows the geometrical deflection relationship of a collapsing spherical cap on a spherical COPV.
Acap ≅ π Dδ (1) The collapse of a shallow spherical cap assumes that the sidewalls of the vessel (i.e., region extending beyond the perimeter of the cap) are sufficiently stiff to preclude significant global flexure during the impact. For the collapse of a shallow cylindrical cap on a cylindrical vessel in the hoop region, Equation 1 is no longer axially symmetric with respect to the centroid of the cap. However, to a first-order ap-proximation, the same approximate relationship holds by using the diameter of the cylindrical vessel in the hoop region.
Equation 1 illustrates the dependence of the impact deflection collapse on the diameter of the vessel. Because the observed NDE area was associated with liner deformation and composite delaminations, it is further hypothesized that the measured NDE area explicitly describes the collapsed region of a shallow cap. Therefore, if the NDE area (impact damage area) was normalized to the diameter of the vessel and the thickness of the composite, then this dimensionless parameter was expected to exhibit a correlation with the normalized BAI that was independent of the vessel geometry.
Figures 5-7 and 5-8 show correlation plots of selected ultrasonic A–scans collected for Task 3 for the spherical and cylindrical COPVs, respectively. We used the dimensionless area as described above for the ultrasonic A–scan data. The ultrasonic data show fewer data points compared to the IR thermography because this particular NDE method was not implemented as early in the test. Some pressurized tests associated with the small cylindrical COPV (6.6– × 20–in.) are not shown in Figure 5-8 because the impact cut fiber bands near the indentation zone. The cut fiber bands on the outer hoop layers of these COPVs resulted in band lifting and delaminations extending from one–third to one–half of the vessel circumference. As a result, the NDE ultrasonic area could not be measured in a consistent manner com-pared to the other impact damage exhibiting an average circular area of damage.
The correlation coefficient for the ultrasonic NDE data was –0.71 and –0.41 for the small spherical and cylindrical COPVs, respectively. This was comparable to the IR thermography results and too low to consider fitting the data to a correlation function.
Figure 5-9 shows the acoustic emission data (very strong signals detected by a single acoustic emission [AE] sensor on inlet tube) collected during pressurization to burst for a select set of COPVs as a Felicity ratio. The Felicity ratio is defined as the ratio of pressure for onset of significant and continuous acoustic emission compared to the previous proof pressure for the particular type of COPV. For pristine or un-damaged COPVs, the Felicity ratio has a value consistent with Equation 1. The data point labeled

5-14
Undamaged AVERAGE of 5 COPV represents the average Felicity ratio for five vessels tested with no damage. These data show no discernible differences between impacts to pressurized vs. unpressurized COPVs.
The poor correlation coefficients coupled with the large variation in the normalized BAI for identical impact conditions gave poor prospects of being able to use the NDE data for the development of quantita-tive accept or reject criteria.
We evaluated an energy balance model suggested by Shivakumar, Elber, and Illg (1985) for low-velocity impacts on plates to determine if such a simple model could predict the experimental (Task 3) force and deflection characteristics of the COPV impacts. These results usually required substantial modification to the material properties of the Gr/Ep overwrap to reach agreement between the experimental data and the model prediction of force and deflection. In general, the progressive damage of COPV composites modifies the localized material properties so the pristine properties are no longer applicable to dynamic damage conditions. The results were not sufficiently encouraging to merit further modeling work.
Other FEA modeling work reported in Task 5 before 1997 also confirmed the difficulty of predicting accept or reject criteria. A literature search identified three academic centers involved with FEA model-ing of Gr/Ep materials and structures. These include Dr. Paul Lagace of MIT, Dr. F. K. Chang of Stan-ford University, and Dr. Stephen Swanson of the University of Utah. The NASA Lewis Research Center Mechanical Structures Division has also been working on the development of models to forecast impact damage to composite structures since 1978 (Chamis et al. 1997). The academic interest to collaborate on a research and development project was overwhelming, but none of these centers had viable solutions to apply immediately toward the modeling of COPV impact damage. Since program funding was not able to support this type of modeling development work for the COPV project, the task was terminated at WSTF.
5.6.3 Subtask 8.2 Results
5.6.3.1 Impact Protector Test Results
Table 5-4 shows the results of tests conducted to screen various types of impact protectors and indicators. The performance of a specific type of protector was measured in terms of indentation to the hard shell and deflection of the Gr/Ep plaque mounted in a special test fixture of the IMIT. The indentation protec-tion was assessed by visually observing the degree of impactor tup penetration. The deflection was measured by an LVDT mounted on the lower surface of the Gr/Ep plaque.
These results confirmed that Ensolite foam provided almost no protection against impacts with energies in the 47.4-J (35-ft–lbf) range (visual damage threshold for small spherical COPV). For this case, the Gr/Ep plaques suffered both significant indentation and deflection damage (Table 5-3) that was easily detected by several NDE techniques including visual, IR thermography, and ultrasonic A–scan.
The composite laminate tests with a fiberglass/epoxy (FG/Ep) hardshell and Ensolite foam protected the Gr/Ep plaques from indentation damage; however, the plaque deflection was still unacceptably high. Finally, a composite laminate comprised of a FG/Ep hardshell, a 1.2–cm (0.5–in.)-thick aluminum mesh foam, and the Ensolite foam (Figure 5-10) provided the best protection performance that eliminated the indentation damage and reduced deflections down to 0.005 in. (127 µm) for the plaques.

5-15
Table 5-4. Performance Results of Impact Protectors
Carbon Plaque LVDT Damage Area
Laminate Description Impact Energy Tup Deflection Deformation IR NDE UT–
NDE
(J) (ft–lbf) (cm) (in.) (cm) (in.) (cm) (in.) (in2) (in2)
½ in. Ensolite foam (KSC)
Carbon plaque (6T–4) (¼ in.)
47.4 35 1.2 ½ 0.483 0.190 0.048 0.019 3.7 5.9
½ in. Ensolite foam (KSC)
Carbon plaque (6T–5) (¼ in.)
47.4 35 2.5 1 0.396 0.156 0.038 0.015 1.9 5.9
FG/Ep (0.344 in. thick)
½ in. Ensolite foam
Carbon plaque (6T–1) (¼ in.)
47.4 35 1.2 ½ 0.048 0.019 NM ND ND
FG/Ep (0.344 in. thick)
½ in. Ensolite foam
Carbon plaque (6T–2) (¼ in.)
47.4 35 1.2 ½ 0.137 0.054 0.013 0.005 ND 2.8
FG/Ep (0.344 in. thick)
1/8 in. Packing foam
Carbon plaque (6T–3) (¼ in.)
47.4 35 2.5 1 0.277 0.109 NM ND 3.3
FG/Ep (0.344 in. thick)
½ in. Al mesh foam (20 ppi)
1/16 in. PC board
½ in. Ensolite foam
Carbon Plaque (6T–6) (¼ in.)
47.4 35 2.5 1 0.013 0.005 None NM ND
NOTES: ND = Not detected
NM = Not measured
FG/Ep = Fiberglass/Epoxy
All of the composite laminate tests were conducted with a piezoresistive force sensor sandwiched be-tween the Ensolite foam and a hard fiberglass epoxy material to measure a signal related to the magni-tude of the impact and to trigger the LVDT recorder. The results of these tests indicate that a force sensor can be used to measure potentially damaging impacts to the Gr/Ep COPV.
By using an electronic comparator circuit on the output of the force sensor, a discriminator can sound an alarm or illuminate a hazard warning light should the structural integrity of the Gr/Ep COPV be com-promised by an impact with an energy or force in excess of the protective cover capability. Furthermore, a smart force sensor with data acquisition and recording capability could be used to monitor all signifi-cant impacts to a Gr/Ep COPV and generate a quality record during operations associated with spacecraft or vehicle integration and test.

5-16
Potential cover designs using the high–performance composite laminates are depicted in Figure 5-11 and 5-12 for a spherical and a cylindrical COPV, respectively. These composite laminates could be designed as hemispherical, hemicylindrical, or segmented covers.
5.6.3.2 Impact Indicator Test Results
The VDT for the 10.25–in. spherical COPV impacted by a 1.27–cm (0.5–in.) tup was determined to be 47.4 J (35 ft–lbf), while the 6.6– × 20–in. cylindrical COPV had a VDT of 20.3 J (15 ft–lbf). Both of these vessels were uncoated, and the VDT established by visually inspecting many COPVs over the duration of the project. We established the VDT variance of ± 5 ft–lbf for these vessels to a 95% confi-dence level based on the statistical variations observed for various impact conditions.
We determined the VDT for a 19–in. spherical COPV for both a polyurethane coated and uncoated region of the vessel. These results yielded a VDT of 47.4 J (35 ft–lbf) for the uncoated region for im-pacts on the unpressurized vessel. Although the coated region of the 19–in. spherical COPV was ex-pected to have a lower VDT under ultraviolet lighting compared to standard room lighting, the tests results indicated no significant difference in sensitivity.
The VDT for the 13– × 25–in. cylindrical COPV had a measured VDT of 47.4 J (35 ft–lbf) for impacts to an unpressurized vessel. VDT values determined for the large spherical and cylindrical COPVs were not estimated to a 95% confidence level because of limited assets available to the program. However, we validated the process of using a single vessel and subjecting it to a sequence of impacts to determine the VDT for both vessels.
It should be pointed out that, in general, the VDT level for impacts to pressurized vessels was signifi-cantly lower than the values determined for impacts to unpressurized COPVs because these impacts tend to impart more energy into indentation damage at the tip of the indentor. In some cases, the cylindrical COPV produced delamination bands that were readily visible as a result of crushing and cutting fibers in the indentation region of an impact zone having hoop wraps.
In addition to using visual inspections as an impact damage indicator, we identified several other tech-niques in this study. The force sensor film (Section 5.2.1) evaluated during the impact protector tests provided an excellent method of combining an electrical indicator with a laminate protector. This method could also be implemented as a removable indicator by using a force sensor film bonded between two sheets of high–density Ensolite foam. A threshold comparator circuit connected to alarm or recorder systems could be used to indicate when a damaging impact occurs.
Pressure–sensitive tapes or covers and bubble dye coatings or covers were not tested in this task because these materials are usually not acceptable around spacecraft hardware. Also, these materials tend to give false indications if the contact pressure threshold is low.
Finally, contractors were using thin–walled Plexiglas or glass covers near the end of the program as an effective indicator system. These covers shield the COPV from very light tool impacts (< 1.3 J (< 1 ft–lbf)) and provide a direct indication should a high–energy impact fracture and penetrate the cover.
Contractors were also using deformable metal covers with foam standoffs during more recent industry surveys. These types of removable indicators also shield against light tool impacts (< 1.3 J (< 1 ft–lbf)), and provide visual indication by indentation or collapse of the metal cover. Care must be exercised when

5-17
installing and removing these types of covers so that fiber cuts resulting from contact with the metal edges or corners do not occur.
5.6.3.3 Shipping Container Drop–Test Results
We first conducted shipping container drops tests with COPV remnants installed in the containers to simulate the weight of a COPV. These drop tests used the AMP Shockwriter 3000 three–axis acceler-ometer to characterize both the internal and external the shock levels occurring from a 107.7–cm (42–in.) drop height. Figure 5-13 shows a typical acceleration profile measured during drop testing of a 10.25–in. spherical COPV mounted within a wood box shipping container. Table 5-5 lists the average magnitude of these shocks.
Table 5-5. Average Shock Strengths for 10.25–in. Spherical COPV Shipping Container Drop Tests
Shipping Container
Description
Internal Shock Level
(G)
External Shock Level
(G)
Wood box 69 ± 11 107 ± 20
Cardboard box 45 ± 9 62 ± 21
We conducted two shipping container drop tests with the 10.25–in. spherical COPV mounted within a foam liner. One test used the cardboard box configuration, and the second test used a wood box. The test results are reported in detail in Standard Test Data Reports (STDRs) WSTF # 93–275627 and 93–275688 for the cardboard box and the wood box, respectively. We observed no degradation in the burst strengths of the COPV for either shipping container configuration. Both vessels failed by blowing out the boss inserts, which is the typical failure mode for undamaged COPVs of this type.
On the basis of these results, the program elected to terminate further shipping container drop testing. The designs for other types of vessels were similar with no anticipated problems resulting from equiva-lent height drop tests. It should be pointed out that if the shipping container sustains damage to the extent of buckling or crushing the side wall and support structures, the COPV would have to be inspected and analyzed in more detail to determine the degree of transmitted damage.
5.6.3.4 Handling Drop Test Results
The results of a single flat–tup impact test (20.3 J (15 ft–lbf) IMIT) to the membrane region of a 10.25–in. spherical COPV were reported in detail in STDR WSTF # 93–27575.9 No degradation in the nominal burst strength for this COPV was observed for a simulated floor drop test at this energy. The vessel burst
7 Standard Test Data Report WSTF # 93-27562. NASA Johnson Space Center White Sands Test Facility, Las Cruces, NM,
September 23, 1996. 8 Standard Test Data Report WSTF # 93-27568. NASA Johnson Space Center White Sands Test Facility, Las Cruces, NM,
September 23, 1996. 9 Standard Test Data Report WSTF # 93-27575. NASA Johnson Space Center White Sands Test Facility, Las Cruces, NM,
September 12, 1996.

5-18
by blowing out the inlet boss insert, which is the typical failure mode for an undamaged COPV of this type.
The results of a handling (91.4 cm (36 in.)) floor–drop test conducted on a second 10.25–in. spherical COPV was reported in STDR WSTF # 93–27574.10 This test also gave no degradation in the nominal burst strength for this type of COPV. The failure mode was typical for an undamaged spherical COPV of this type. A similar test conducted on a 6.6– × 20–in. cylindrical COPV also gave no degradation in the nominal burst strength for the undamaged vessel.
On the basis of these results, the program elected to terminate further handling drop testing. Generally, for a height of 91.4 cm (36 in.), the equivalent impact energy is below the 20% degradation threshold for each type of COPV. When this is coupled with the benign impact geometry of striking a flat concrete floor, no degradation in burst strength is expected to result from such events.
The results of these handling drop tests suggest that if the fiber in the Gr/Ep overwrap is not crushed at the impact location and if the impact event does not induce significant deflection damage, then the COPV will not likely suffer a reduction in burst strength. Obviously, a height exists above which a particular COPV will be damaged if dropped. Quantifying the damage threshold induced from accidentally drop-ping a COPV must be consistent with the threat environment and impact control plan imposed to prevent such impact damage events.
5.6.4 Subtask 8.3 Results
WSTF provided technical support and updates to the manufacturer and user communities throughout the COPV program. A major portion of this task included developing and reviewing two volumes of the American Institute of Aeronautics and Astronautics (AIAA) Standards for Aerospace Pressurized Sys-tems. A critical step was developing the impact control requirements and writing the ICP.
The AIAA standards documents (AIAA S–080 and S–081) adequately establish the baseline criteria for designing and qualifying metal–lined COPVs on spacecraft or space systems, including impact control requirements.
This section of the report gives a summary of the ICP that has been written as detailed guidelines control-ling the procedures required in the work environment to prevent impacts to COPVs that may jeopardize the safe use of the COPV.
5.6.4.1 Impact Control Plan
The purpose of the ICP is to establish procedures that
1. prevent impact damage to COPVs during manufacturing, shipping, handling, installation, and system–level test operations.
2. define methods for detecting, evaluating, and dispositioning potential impact damage incidences.
10 Standard Test Data Report WSTF # 93-27574. NASA Johnson Space Center White Sands Test Facility, Las Cruces, NM,
September 23, 1996.

5-19
3. identify the approach for assessing the safe life of a COPV following an impact damage inci-dence.
Figure 5-14 shows an overview of the ICP requirements, and Appendix 5-B includes a copy of the ICP. This ICP is implemented at every stage throughout the life of the COPV, beginning at the manufacturing plant and through the various test and integration stages leading up to launch.
Figure 5-14 identifies an evaluation stage (damage assessment) to determine if any potential impact damage to the COPV may have occurred before pressurization to MEOP. The jurisdictional authority (e.g., range safety or flight readiness review board) must grant approval before the physical pressuriza-tion process.
The ICP shall be implemented using at least one of three basic methodologies. The first method, by procedure only, requires 100% quality assurance (QA) surveillance to ensure that no detrimental impacts to the COPV occurred during handling or service life. The QA personnel must be trained and certified in the damage susceptibility of COPVs and in the methods of performing visual inspections and other NDE inspections pertinent to COPVs.
The second method uses impact indicators to identify any impact conditions and reduces the level of required QA surveillance to periodic inspections.
Finally, the third method uses impact protectors capable of absorbing the indentation and deflection damage from potential tool drops or tool impacts resulting from close proximity work conditions. This method of ICP requires only QA surveillance during the installation and removal of the COPV protective covers, provided the cover is designed to withstand impacts consistent with the threat environment.
Figure 5-15 shows a method or guideline for determining impact control requirements. This technique was developed and integrated into the AIAA S–081 document as the industry standard for safe use of a COPV on spacecraft and launch vehicles.
5.7 Summary and Conclusions
The results of Subtask 8.1 were able to establish the impact damage control requirements and identify protection devices required for safe use of COPVs on spacecraft and launch vehicles. Through literature research, industry surveys, and visits to manufacturing plants and spacecraft contractor facilities, the project was able to collect information on credible impact scenarios and threat environments throughout all stages of the COPV service life, from manufacturing to end use. We used this information to define the impact control requirements for the AIAA industry standards on COPV (AIAA S–081) and to support the development of this document.
We evaluated impact protection devices as part of the Subtask 8.2 activities associated with the project. This work demonstrated that the high–density foam (i.e., elephant hide) provides virtually no protection against impacts that can potentially degrade the burst strength of the COPV. A COPV protective lami-nate structure was designed and demonstrated to provide adequate protection based on impacts to Gr/Ep plaques. The laminate structure comprises a hard shell cover (i.e., FG/Ep) in combination with a deform-able aluminum mesh foam to absorb both the indentation damage and deflection damage associated with impact events. High–density foam is still recommended as a scuff protector when used as an inner liner for the laminated protective cover. Although we fabricated and tested no configurational covers during

5-20
the project, computer–generated renderings of potential laminate cover designs were drawn up for both the small spherical and cylindrical COPV.
Other methods of protecting a COPV use glass or Plexiglas covers that provide limited protection against very small tool drops while indicating a detrimental impact by fracture of the cover surface resulting from a large tool drop. Deformable metallic liners with high–density foam pads can also be used as indicator covers, provided the edges of the metallic liners are shielded to prevent fiber–cut damage.
We considered indicating covers using pressure–sensitive paints and dye bubbles as part of the project survey, but these types of covers tend to be unacceptable for spacecraft environments. We tested craze–sensitive conformal coatings with ultraviolet fluorescent emitters on the large spherical COPVs; they did not significantly enhance the visual damage threshold for detection of impact events over that observed on the uncoated vessel. Use of fiberglass overwraps on Gr/Ep represent possible indicating covers, but this approach becomes a hybrid design when the filament winding includes fiberglass fibers.
We conducted shipping container and handling drop testing of the small diameter COPVs as part of Subtask 8.2. These tests generally showed that the vessels did not sustain damage, provided the shipping container remained intact as a result of the drop and the container has an adequate foam liner between the vessel wall and shipping container. Handling drop tests from heights of 0.9 m (3 ft) did not impart any measurable damage to the small spherical COPV tested in the project.
We performed limited work as part of Task 8.0 to assess the prospects of correlating the NDE measure-ments with the burst strength after COPV impact. Although the trends of the data generally indicate that a larger bruise area measured on the COPV using IR thermography, ultrasonic A-scans, or eddy current probes correlates with a lower burst strength after impact, the statistical variation in the burst strength makes it difficult to predict the effect with any accuracy. Attempts to formulate accept or reject criteria using the NDE data coupled with modeling of the impact damage were not productive mainly because it became clear that the modeling approach needed to explicitly account for progressive damage mecha-nisms within the Gr/Ep structure in order to predict its residual strength after impact. Methods of model-ing composites with progressive damage did not exist during the program and are only beginning to be developed and matured at the academic level at the present time.
Finally, we formulated the impact damage control requirements in Subtask 8.3 and used them to develop the ICP as a guideline for industry to follow in terms of implementing methods of preventing impact damage to a COPV during manufacturing and service life on a spacecraft or launch vehicle. Methods of modeling composites with progressive damage did not exist during the program and are only beginning to be developed and matured at the academic level at the present time.
5.8 Recommendations
The following recommendations have resulted from this research investigation:
• Continue research and development to improve the FEA modeling of progressive impact damage mechanisms so that the residual strength of the composite can be predicted from NDE measurements and used to formulate accept or reject criteria.
• Refine the ICP for consistency with AIAA S–081 and release as an updated guideline that can be incorporated into an industry or government handbook.

5-21
• Perform periodic reviews of the ICP to ensure that the procedures are adequate, and enlist feedback from users to incrementally improve the plan.
Composite Hard Shell
AL Mesh Foam
Tup
CompositeInner Shell
Ensolite Foam
Gr/Ep Plaque
Dyna-TupFixture
LVDT Deflection
Force Sensor Film
Clamp
Figure 5-1. Impact fixture for testing the performance of impact protectors.
Figure 5-2. COPV wood crate shipping containers.

5-22
Figure 5-3. AMP–Shockwriter 3000 mounted on wood crate shipping container lid.
0
10
20
30
40
50
60
70
80
90
100
110
120
0 1 2 3 4 5
IR Damage Area/(t*D)
No
rmal
ized
BA
I (%
)
10.25" Sphere -- Unpressurized
10.25" Sphere - Pressurized
19" Sphere - Unpressurized
19" Sphere - Pressurized
Pressurized During Impact
Figure 5-4. Correlation plot of normalized BAI to IR–thermographic–NDE area (dimensionless) for spherical COPVs.

5-23
0
10
20
30
40
50
60
70
80
90
100
110
120
0 1 2 3 4 5
IR Damage Area/(t*D)
No
rmal
ized
BA
I (%
)
6.6x20" Cylinder - Unpressurized
6.6x20" Cylinder - Pressurized
13x25" Cylinder - Unpressurized
13x25" Cylinder - Pressurized
Pressurized During Impact
Figure 5-5. Correlation plot of normalized BAI to IR–thermographic–NDE area (dimensionless) for cylindrical COPVs.
Collapsing Hemispherical Cap ( Damage Area)
Gr/Ep COPV
Tup
Diameter = D
Deflection =δ
Damage Area = π ao2 ≅ π D δ
2ao = Chord Length
Figure 5-6. Deflection geometry of a collapsing spherical cap on a spherical COPV.

5-24
0
10
20
30
40
50
60
70
80
90
100
110
120
0.00 1.00 2.00 3.00 4.00 5.00 6.00 7.00 8.00
UT Damage Area/(t*D)
No
rmal
ized
BA
I (%
)
10.25" Sphere -- Unpressurized
10.25" Sphere - Pressurized
19" Sphere - Unpressurized
19" Sphere - PressurizedPressurized During Impact
Figure 5-7. Correlation plot of normalized BAI to ultrasonic–NDE area (dimensionless) for spherical COPVs.
0
10
20
30
40
50
60
70
80
90
100
110
120
0 1 2 3 4 5 6 7 8 9 10
UT Damage Area/(t*D)
No
rmal
ized
BA
I (%
)
6.6x20" Cylinder - Unpressurized
6.6x20" Cylinder - Pressurized
13x25" Cylinder - Unpressurized
Pressurized During Impact
Figure 5-8. Correlation plot of normalized BAI to ultrasonic–NDE area (dimensionless) for cylin-drical COPVs.

5-25
0
20
40
60
80
100
120
0 0.2 0.4 0.6 0.8 1 1.2Acoustic Emission Felicity Ratio
No
rmal
ized
BA
I (%
)
10.25" Sphere - Unpressurized 10.25" Sphere - Pressurized19" Sphere - Unpressurized 19" Sphere - Pressurized6.6x20" Cylinder - Unpressurized 6.6x20" Cylinder - Pressurized13x25" Cylinder - Unpressurized 13x25" Cylinder - PressurizedUndamaged AVERAGE of 5 COPV
Figure 5-9. Correlation plot of normalized BAI to acoustic emission felicity ratio for a select set of COPVs.
Fiberglass/EpoxyCompositeHardshell
Aluminum Mesh Foam
Resistive Force SensorMounted on ThinFiberglass Board
Ensolite High DensityFoam
Figure 5-10. Cross–section of composite laminate protector design for COPVs.

5-26
Figure 5-11. Design sketch of a composite laminate cover for spherical COPV.
Figure 5-12. Design sketch of a segmented composite laminate cover for cylindrical COPV.
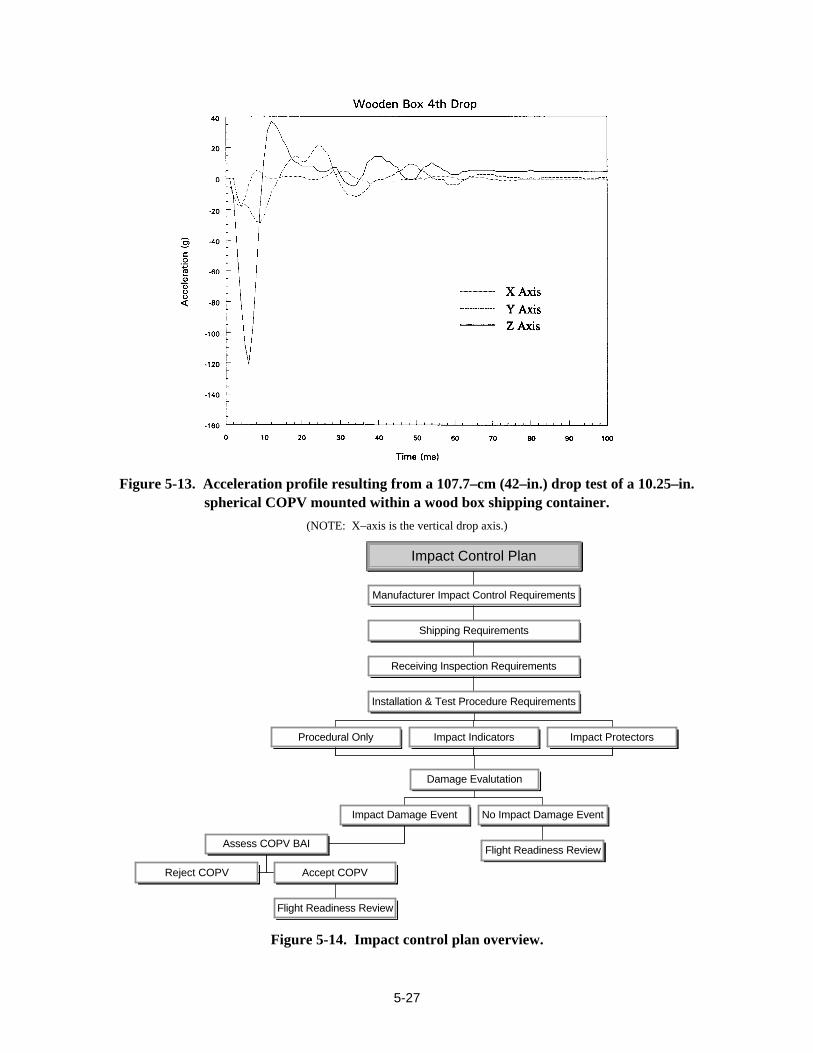
5-27
Figure 5-13. Acceleration profile resulting from a 107.7–cm (42–in.) drop test of a 10.25–in. spherical COPV mounted within a wood box shipping container.
(NOTE: X–axis is the vertical drop axis.)
Installation & Test Procedure Requirements
Procedural Only Impact Indicators Impact Protectors
Reject COPV
Flight Readiness Review
Accept COPV
Assess COPV BAI
Impact Damage Event
Flight Readiness Review
No Impact Damage Event
Damage Evalutation
Receiving Inspection Requirements
Shipping Requirements
Manufacturer Impact Control Requirements
Impact Control Plan
Figure 5-14. Impact control plan overview.

5-28
Is ID T >V D T ?
W ill O ther N D EM ethods Be
Used?
Is ID T >N D E S ensitivity?
D evelop Impac t DamageProtection D evice
Select Adequate ImpactControl Plan
Y es
Y es
N o
N o
N o
Y es
Y es
Perform N D E sensitivity testing of C O P Vconsistent with threat & operat ional
conditions
Untested
W ill PersonnelBe Exposed T o
PressurizedC O P V D u ring
Threat?
COPV Impact Control Requirements
Perform T hreat Analysis [1]
PerformVDT and IDT Tes t ing
N o
Yes
Is C O P V I D T
Adequate for AllT h reats?
N o
W ill VD T &IDT Tes t ing Be
Performed ?
D emonstrate M inimum Impac tTolerance by Impacting
Q u a lification COPV at UnprotectedThreat Level
Yes
N o
Figure 5-15. Impact control requirements suggested for COPVs.

5-29
References American Institute of Aeronautics and Astronautics. AIAA Standard Aerospace Pressurized Systems–
Metallic Pressure Vessels, Pressurized Structures, and Pressure Components. Vol. I, S–080, Draft. March 1998.
American Institute of Aeronautics and Astronautics. AIAA Standard Aerospace Pressurized Systems–Composite Overwrapped Pressure Vessels. Vol. II, S–081, Draft. January 1998.
Beeson, H. D., K. S. Payne, J. B. Chang, J. P. Nokes, R. M. Tapphorn, and W. L. Ross. “Impact Damage Characterization and Effects for Space Flight Graphite/Epoxy Composite Overwrapped Pressure Vessels.” In Proceedings of the 31st AIAA/ASME/SAE/ASSEE Joint Propulsion Conference and Exhibit, American Institute of Aeronautics and Astronautics. San Diego, CA, July 10–12, 1995.
Beeson, H. D., E. W. Heinonen, C. Leuhr, R. E. Allred, L. A. Kent, and W. Gill. “Aircraft Composite Material Fire Damage Assessment, Volume I: Discussion.” Paper presented at Engineering and Ser-vices Program Office. Air Force Engineering and Services Center. Tendell Air Force Base, FL, Sep-tember 1990.
Bouche, R. R. Accelerometers for Shock and Vibration Measurements. Technical Paper TP–243. Endevco Corporation, San Juan Capistrano, CA. March 1967.
Carins, D. S. Impact and Post–Impact Response of Graphite/Epoxy and Kevlar/Epoxy Structures. Ph.D. Dissertation, Massachusetts Institute of Technology, Boston, MA. August 1987.
Chang, J. B., H. D. Beeson, and L. A. Bailey. Enhanced Technology for Composite Overwrapped Pres-sure Vessels. Program Plan prepared by The Aerospace Corporation. Rev. D., August 9, 1993.
Chamis, C. C., P. L. N. Murthy, and L. Minnetyan. “Progressive Fracture in Composite Structures.” Composite Materials: Fatigue and Fracture (Sixth Volume), ASTM STP 1285. E. A. Armanios, Ed., pp. 70–84. American Society for Testing Materials, 1997.
Connolly, M. P. “The Detection of Impact Damage in Composite Pressure Vessels using Source Loca-tion Acoustic Monitoring.” In Proceedings of the 31st AIAA/ASME/SAE/ASEE Joint Propulsion Conference and Exhibit, Report No. AIAA 95–2911. American Institute of Aeronautics and Astro-nautics. San Diego, CA, July 10–12, 1995.
Downs, K. S. and M. A Hamstad. “Relationships of Composite Manufacturing Parameters of Filament Wound Graphite/Epoxy Vessels to their Acoustic Emission Characteristics.” In Proceedings of the 40th International SAMPE Symposium/Exhibition. Anaheim, CA, 1–14, May 8–11, 1995a.
Downs, K. S. and M. A. Hamstad. “High Sensor Density Acoustic Emission Monitoring of Graph-ite/Epoxy Pressure Vessels.” In Proceedings of the Fifth International Symposium on Acoustic Emission from Composite Material. Sponsored by Committee on Acoustic Emission from Rein-forced Plastics (CARP) and The American Society for Nondestructive Testing. Sundsvall, Sweden, July 10–14, 1995b.
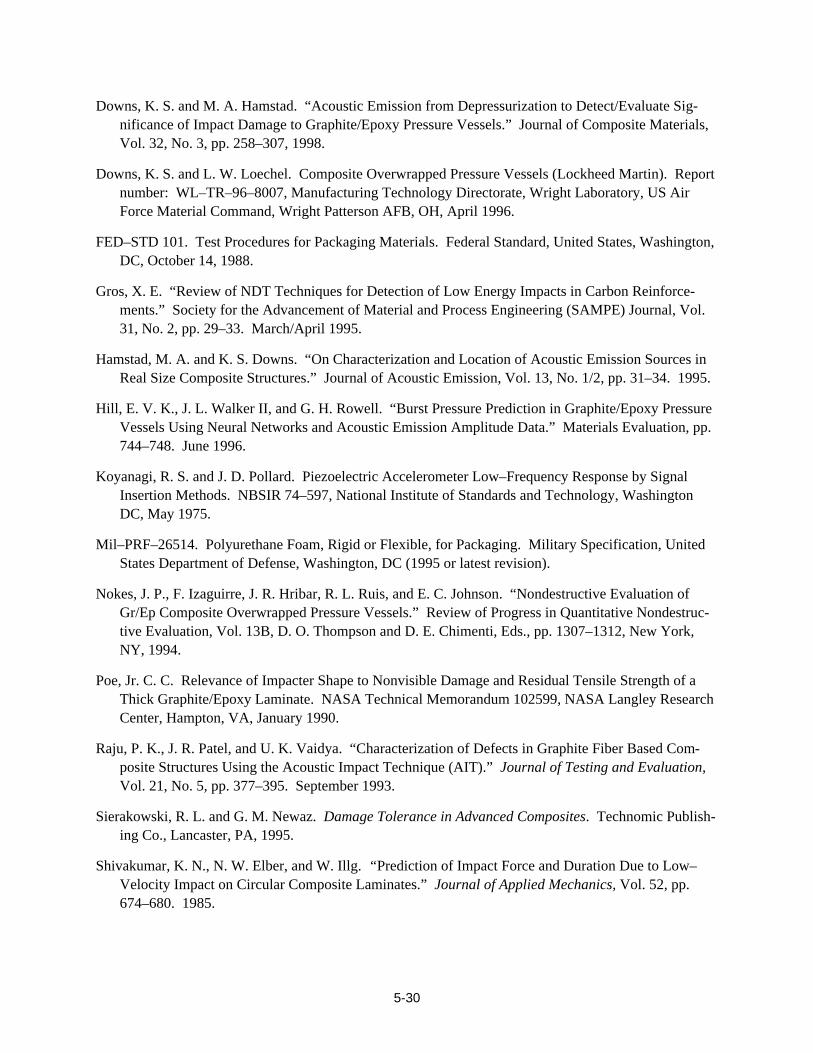
5-30
Downs, K. S. and M. A. Hamstad. “Acoustic Emission from Depressurization to Detect/Evaluate Sig-nificance of Impact Damage to Graphite/Epoxy Pressure Vessels.” Journal of Composite Materials, Vol. 32, No. 3, pp. 258–307, 1998.
Downs, K. S. and L. W. Loechel. Composite Overwrapped Pressure Vessels (Lockheed Martin). Report number: WL–TR–96–8007, Manufacturing Technology Directorate, Wright Laboratory, US Air Force Material Command, Wright Patterson AFB, OH, April 1996.
FED–STD 101. Test Procedures for Packaging Materials. Federal Standard, United States, Washington, DC, October 14, 1988.
Gros, X. E. “Review of NDT Techniques for Detection of Low Energy Impacts in Carbon Reinforce-ments.” Society for the Advancement of Material and Process Engineering (SAMPE) Journal, Vol. 31, No. 2, pp. 29–33. March/April 1995.
Hamstad, M. A. and K. S. Downs. “On Characterization and Location of Acoustic Emission Sources in Real Size Composite Structures.” Journal of Acoustic Emission, Vol. 13, No. 1/2, pp. 31–34. 1995.
Hill, E. V. K., J. L. Walker II, and G. H. Rowell. “Burst Pressure Prediction in Graphite/Epoxy Pressure Vessels Using Neural Networks and Acoustic Emission Amplitude Data.” Materials Evaluation, pp. 744–748. June 1996.
Koyanagi, R. S. and J. D. Pollard. Piezoelectric Accelerometer Low–Frequency Response by Signal Insertion Methods. NBSIR 74–597, National Institute of Standards and Technology, Washington DC, May 1975.
Mil–PRF–26514. Polyurethane Foam, Rigid or Flexible, for Packaging. Military Specification, United States Department of Defense, Washington, DC (1995 or latest revision).
Nokes, J. P., F. Izaguirre, J. R. Hribar, R. L. Ruis, and E. C. Johnson. “Nondestructive Evaluation of Gr/Ep Composite Overwrapped Pressure Vessels.” Review of Progress in Quantitative Nondestruc-tive Evaluation, Vol. 13B, D. O. Thompson and D. E. Chimenti, Eds., pp. 1307–1312, New York, NY, 1994.
Poe, Jr. C. C. Relevance of Impacter Shape to Nonvisible Damage and Residual Tensile Strength of a Thick Graphite/Epoxy Laminate. NASA Technical Memorandum 102599, NASA Langley Research Center, Hampton, VA, January 1990.
Raju, P. K., J. R. Patel, and U. K. Vaidya. “Characterization of Defects in Graphite Fiber Based Com-posite Structures Using the Acoustic Impact Technique (AIT).” Journal of Testing and Evaluation, Vol. 21, No. 5, pp. 377–395. September 1993.
Sierakowski, R. L. and G. M. Newaz. Damage Tolerance in Advanced Composites. Technomic Publish-ing Co., Lancaster, PA, 1995.
Shivakumar, K. N., N. W. Elber, and W. Illg. “Prediction of Impact Force and Duration Due to Low–Velocity Impact on Circular Composite Laminates.” Journal of Applied Mechanics, Vol. 52, pp. 674–680. 1985.
5-31
Tapphorn, R. M. and H. D. Beeson. “Impact Damage Testing and Analysis of Carbon Composite Pres-sure Vessels.” Proceedings of 1993 Impact Damage Workshop, NASA Johnson Space Center White Sands Test Facility, Las Cruces, NM, September 22–23, 1993.
Tapphorn, R. M., P. M. Pellegrino, and H. D. Beeson. “Nondestructive Evaluation and Health Monitor-ing of Graphite/Epoxy Composite Overwrapped Pressure Vessels.” 1996 JANNAF Propulsion and Subcommittee Joint Meeting, Albuquerque, NM, December 9–13, 1996.
Zalameda, J. N., G. L. Farley, and B. T. Smith. “A Field Deployable Nondestructive Impact Damage Assessment Methodology for Composite Structures.” Journal of Composites Technology & Re-search, Vol. 16, No. 2, pp. 161–169. April 1994.


Appendix A
Survey Information and Impact Damage Scenarios

5A-1
COPV Manufacturer Facilities 25-MAR-93
Category Description
1. Manufacturers Visited ARDE, Inc.- Norwood, NJ (01/25/93) Lincoln Composites - Lincoln, NB - (3/24/93) Structural Composites Industries, Pomona CA - (01/14/93)
2. Design Manufacturing processes are unique to each manufacturer’s design & fabrication process. Critical manufacturing parameters are dependent on each manufacturer’s line of expertise & the technical approach to the COPV design. Confidential & proprietary information associ-ated with the detailed design of type COPV was collected as part of the survey for "govern-ment use only." This information is archived at WSTF, but is not available for public disclo-sure.
3. Qualification Testing Qualification testing of COPV is comparable industry-wide, and appears to be driven primarily by government requirements. Cyclic and burst test methodologies are similar for all manufacturers, but differ in the tolerances of specifications and types of instrumentation. Confidential and proprietary information associated with the detailed design of each type of COPV was collected as part of the survey for "government use only." This information is archived at WSTF, but is not available for public disclosure.
4. NDE Methods NDE inspections techniques & experience are highly dependent on the COPV design. Visual inspections are typical for the composite overwrap, while X-ray radiographic inspections or ultrasonic thickness measurements are performed for liner materials. Limited NDE experi-ence beyond these methods. He leak and pressure decay tests are frequently used on the COPV.
5. Impact Control (1) Ensolite foam protective covers or pads, (2) Compliant slings for heavy COPV lifts (3) Foam or foam padded support saddles and chocks.
6. Handling Procedures Handling procedures during COPV manufacturing differ, based on the unique design & size. Shipping container design & construction match complexity & design of the COPV being shipped. Common methods of foam padding.
7. Impact Damage History Impact damage history was not disclosed.
8. Shipping/Receiving Shipping containers: (1) Cardboard box with foam pads, saddles, or chocks (2) Wood box with foam pads, saddles, or chocks. No active or passive shock monitors are currently used during transportation.
9. QA & Safety COPV Quality control, pedigree documentation, & qualification testing are very comparable among all three manufacturers & appear to be driven primarily by government requirements.

5A-2
COPV Spacecraft Contractor Facilities 15-JUN-93
Category Description
1. Contractors Visited (1) Hughes Aircraft Co., Space and Communications Group, El Segundo, CA - Apr 14, 1993 (2) Martin Marietta Co. (GE Astro Space Division) DPF, Cape Canaveral AFS - Jun 23,1993, (3) Lockheed Space Operations Co. - Jun 24, 1993, (4) Lockheed Engineering and Sci-ences Co. - Jun 24, 1993, (5) McDonnell Douglas Space Systems Co. - Jun 24,1993.
2. Design Not applicable at this stage
3. Installation Testing Pressurization testing of the COPV depends on the spacecraft/vehicle processing, but typically included a few cycles in addition to the manufacturer's proof test. Pressurization durations range from 3-6 months with special cases in excess of one year.
4. NDE Methods NDE techniques are primarily restricted to visual inspections with limited field of view after installation. No established procedures for performing visual inspections (by trained inspec-tors) before final integration.
5. Impact Control Impact protection measures typically use elephant hide foams and tethering of inventoried tools. Deviations from these measures & the degree to which measures are enforced were noted during the survey. Limited use of hardshells with foam liners.
6. Handling Procedures Handling procedures during COPV integration depend on size & weight of vessels, but most COPVs are manually transferred from shipping containers to spacecraft/vehicle. Cleaning procedures (typically IPA) are specific to requirements for COPV application.
7. Impact Damage History Impact damage history was not disclosed (confidential survey form in process).
8. Shipping/Receiving Visual receiving inspections performed before spacecraft/vehicle installation. Uncertainties were encountered with identification of significant visual discontinuities, and the inspectors were not trained in the art of finding COPV impact damage defects.
9. QA & Safety Quality control & safety personnel are moderately aware of the COPV impact damage susceptibility, but identifying a potential incidence is primarily a judgement call. Procedures for visually inspecting the COPV after removing "elephant hide" were not disclosed. QA personnel are untrained in the visual detection of impact damage and other types of COPV defects.

5A-3
COPV Spacecraft and Launch Facilities 24-JUN-93
Category Description
1. Facilities Visited USAF Launch Facilities, CCAFS -- June 1993 [DSCS processing facilities], [Titan launch facilities] NASA KSC Launch Facilities -- June 1993 [Vertical/Horizontal processing facilities], [Orbiter processing facilities], [Vertical assembly building], [Launch complex 3913].
2. Design Not applicable at this stage.
3. Installation Testing Pressurization testing of the COPV depends on the spacecraft/vehicle processing, but typi-cally includes a few cycles in addition to the manufacturer's proof test. Pressurization dura-tions range from 3-6 months with special cases in excess of 1 year.
4. NDE Methods NDE techniques are primarily restricted to visual inspections with limited field of view after installation. No established procedures for performing visual inspections (by trained inspec-tors) before final integration.
5. Impact Control Procedures use trained teams and observers. Impact protection measures typically use elephant hide foams and tethering of inventoried tools. Deviations from these measures and the degree to which measures are enforced were noted during the survey. Limited use of hardshells with foam liners.
6. Handling Procedures Not applicable at this stage.
7. Impact Damage History Impact damage history was not disclosed.
8. Shipping/Receiving COPV generally integrated to spacecraft or vehicle at this stage.
9. QA & Safety Quality control and safety personnel are moderately aware of the COPV impact damage susceptibility, but identifying a potential incidence is primarily a judgement call. Procedures for visually inspecting the COPV after removing elephant hide foam were not disclosed. QA personnel are untrained in the visual detection of impact damage & other types of COPV defects.

5A-4
KSC-Horizontal Processing Facility 24-JUN-93
Category Subcategory Description 1. Shipping 1. Shipping/Carriers Not applicable except for rework of COPV.
2. Shipping Containers Not applicable except for rework of COPV.
3. QA & Safety Not applicable except for rework of COPV.
4. Damage Disposition Not applicable except for rework of COPV.
2. Receiving 1. Handling Procedures Not applicable except for rework of COPV.
2. NDE Not applicable except for rework of COPV.
3. Cleaning Not applicable except for rework of COPV.
4. Impact Control Not applicable except for rework of COPV.
5. Damage Disposition Not applicable except for rework of COPV.
3. Installation 1. Sequence Applicable only to COPV rework situations. Controlled by specific rework detail procedures.
2. Mounting Confg. See specific spacecraft or booster design for details.
3. Handling Procedures Spacecraft contractor controls rework handling procedures for COPVs with HPF contractor and KSC Safety/QA overview.
4. Impact Control Spacecraft may have some torque operations within the proximity of a COPV, particularly within the booster assemblies. If spacecraft rework is required to in-stall a COPV, then HPF contractor and NASA KSC Safety and QA typically re-quire tethered tools, elephant hide foam, and debris nets.
5. NDE None routinely performed on multilayered insulation (MLI)-covered COPVs. Rework activities typically rely on visual inspections.
6. Damage Disposition None disclosed.
4. Testing 1. Qualification Not applicable at this stage of process. See spacecraft documentation records if rework of COPV is required.
2. Pressure Cycles No hazardous payload processing performed in the HPF (O&C). COPVs are not pressurized in this facility.
3. Spacecraft Tests At this stage, payloads are installed in a transportation cansister for transporting to the Launch Complex and installing in the Shuttle cargo bay.
4. Impact Control The contractor indicated use of tethered tools, debris screens when working on upper stages. KSC Safety and QA coverage.
5. NDE Primarily visual inspections (although, MLI usually precludes visual inspection of COPV). Frequently use the KSC NDE capabilities when required.
6. Damage Disposition None disclosed.

5A-5
KSC-Vertical Processing Facility 24-JUN-93
Category Subcategory Description 1. Shipping 1. Shipping/Carriers Not applicable except for rework of COPV.
2. Shipping Containers Not applicable except for rework of COPV.
3. QA & Safety Not applicable except for rework of COPV.
4. Damage Disposition Not applicable except for rework of COPV.
2. Receiving 1. Handling Procedures Not applicable except for rework of COPV.
2. NDE Not applicable except for rework of COPV.
3. Cleaning Not applicable except for rework of COPV.
4. Impact Control Not applicable except for rework of COPV.
5. Damage Disposition Not applicable except for rework of COPV.
3. Installation 1. Sequence Applicable only to COPV rework situations. Controlled by specific rework detail procedures.
2. Mounting Confg. See specific spacecraft or booster design for details.
3. Handling Procedures Spacecraft contractor controls COPV rework handling procedures with HPF contractor and KSC Safety/QA overview.
4. Impact Control Spacecraft may have some torque operations within the proximity of a COPV, particularly within the booster assemblies. If spacecraft rework is required to install a COPV, then VPF contractor and NASA KSC Safety and QA typically require tethered tools, elephant hide foam, and debris nets.
5. NDE None routinely performed on MLI-covered COPVs. Rework activities typically rely on visual inspections.
6. Damage Disposition None disclosed.
4. Testing 1. Qualification Not applicable at this stage of process. See spacecraft documentation records if rework of COPV is required.
2. Pressure Cycles No hazardous payload processing performed in the HPF (O&C). COPV are not pressurized in this facility.
3. Spacecraft Tests At this stage, payloads are installed in a transportation canister to transport to the Launch Complex and install in the Shuttle cargo bay.
4. Impact Control The contractor indicated use of tethered tools, debris screens when working on upper stages. KSC Safety and QA coverage.
5. NDE Primarily visual inspections (afthough MLI usually precludes visual inspection of COPV). Frequently use the KSC NDE capabilities when required.
6. Damage Disposition None disclosed.
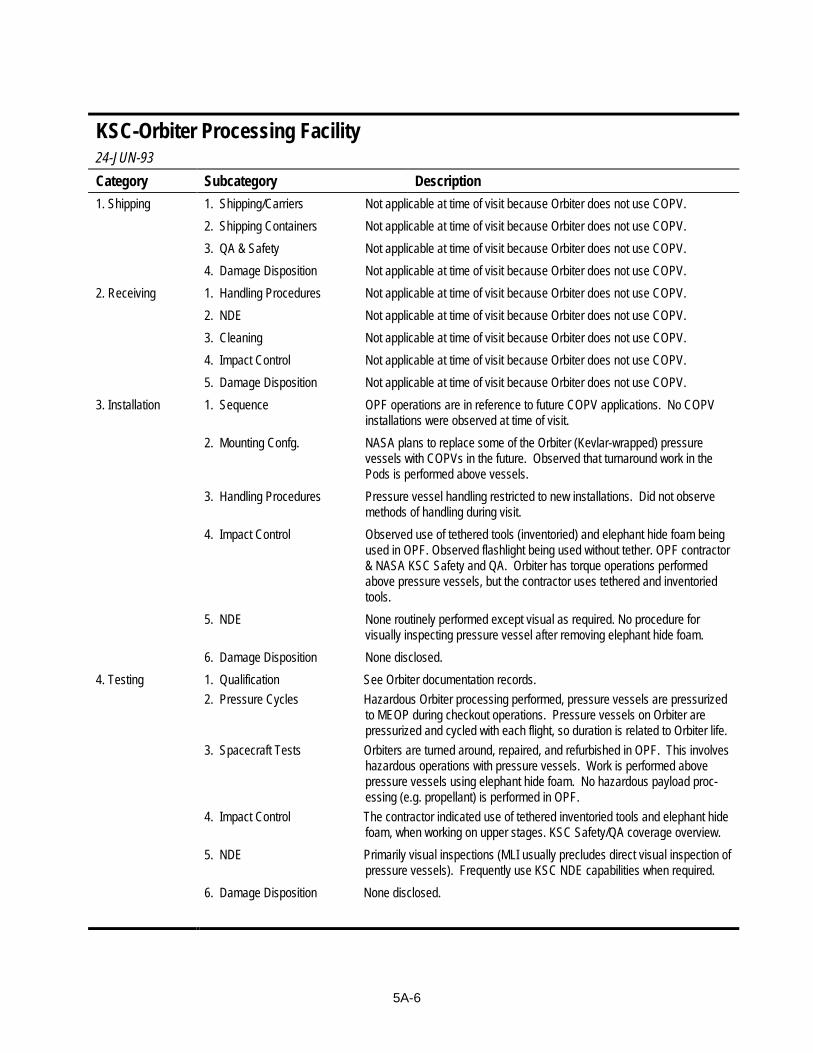
5A-6
KSC-Orbiter Processing Facility 24-JUN-93
Category Subcategory Description 1. Shipping 1. Shipping/Carriers Not applicable at time of visit because Orbiter does not use COPV.
2. Shipping Containers Not applicable at time of visit because Orbiter does not use COPV.
3. QA & Safety Not applicable at time of visit because Orbiter does not use COPV.
4. Damage Disposition Not applicable at time of visit because Orbiter does not use COPV.
2. Receiving 1. Handling Procedures Not applicable at time of visit because Orbiter does not use COPV.
2. NDE Not applicable at time of visit because Orbiter does not use COPV.
3. Cleaning Not applicable at time of visit because Orbiter does not use COPV.
4. Impact Control Not applicable at time of visit because Orbiter does not use COPV.
5. Damage Disposition Not applicable at time of visit because Orbiter does not use COPV.
3. Installation 1. Sequence OPF operations are in reference to future COPV applications. No COPV installations were observed at time of visit.
2. Mounting Confg. NASA plans to replace some of the Orbiter (Kevlar-wrapped) pressure vessels with COPVs in the future. Observed that turnaround work in the Pods is performed above vessels.
3. Handling Procedures Pressure vessel handling restricted to new installations. Did not observe methods of handling during visit.
4. Impact Control Observed use of tethered tools (inventoried) and elephant hide foam being used in OPF. Observed flashlight being used without tether. OPF contractor & NASA KSC Safety and QA. Orbiter has torque operations performed above pressure vessels, but the contractor uses tethered and inventoried tools.
5. NDE None routinely performed except visual as required. No procedure for visually inspecting pressure vessel after removing elephant hide foam.
6. Damage Disposition None disclosed.
4. Testing 1. Qualification See Orbiter documentation records. 2. Pressure Cycles Hazardous Orbiter processing performed, pressure vessels are pressurized
to MEOP during checkout operations. Pressure vessels on Orbiter are pressurized and cycled with each flight, so duration is related to Orbiter life.
3. Spacecraft Tests Orbiters are turned around, repaired, and refurbished in OPF. This involves hazardous operations with pressure vessels. Work is performed above pressure vessels using elephant hide foam. No hazardous payload proc-essing (e.g. propellant) is performed in OPF.
4. Impact Control The contractor indicated use of tethered inventoried tools and elephant hide foam, when working on upper stages. KSC Safety/QA coverage overview.
5. NDE Primarily visual inspections (MLI usually precludes direct visual inspection of pressure vessels). Frequently use KSC NDE capabilities when required.
6. Damage Disposition None disclosed.

5A-7
KSC-Vehicle Assembly Building 24-JUN-93
Category Subcategory Description
1. Shipping 1. Shipping/Carriers Not applicable except for potential rework of Orbiter pressure vessels.
2. Shipping Containers Not applicable except for potential rework of Orbiter pressure vessels.
3. QA & Safety Not applicable except for potential rework of Orbiter pressure vessels.
4. Damage Disposition Not applicable except for potential rework of Orbiter pressure vessels.
2. Receiving 1. Handling Procedures Not applicable except for potential rework of Orbiter pressure vessels.
2. NDE Not applicable except for potential rework of Orbiter pressure vessels.
3. Cleaning Not applicable except for potential rework of Orbiter pressure vessels.
4. Impact Control Not applicable except for potential rework of Orbiter pressure vessels.
5. Damage Disposition Not applicable except for potential rework of Orbiter pressure vessels.
3. Installation 1. Sequence Not applicable except for potential rework of Orbiter pressure vessels.
2. Mounting Confg. Not applicable except for potential rework of Orbiter pressure vessels.
3. Handling Procedures Not applicable except for potential rework of Orbiter pressure vessels.
4. Impact Control Not applicable except for potential rework of Orbiter pressure vessels.
5. NDE Not applicable except for potential rework of Orbiter pressure vessels.
6. Damage Disposition Not applicable except for potential rework of Orbiter pressure vessels.
4. Testing 1. Qualification See orbiter documentation records.
2. Pressure Cycles Hazardous Orbiter processing performed, that is pressure vessels are pressur-ized to MEOP during checkout opeations. Pressure vessels on Orbiter are pressurized and cycled with each flight, so duration is related to Orbiter life.
3. Spacecraft Tests Orbiters are mated to solid rocket boosters in VAB. Observed Orbiter work through portholes, and it is possible to perform work above pressure vessels. Ensolite foam was routinely used for general protection of hardware. No haz-ardous payload processing is performed in VAB.
4. Impact Control The contractor indicated use of tethered inventoried tools and elephant hide foam, when working on upper stages. KSC Safety/QA coverage overview.
5. NDE Primarily visual inspections (MLI usually precludes direct visual inspection of pressure vessels). Frequently use the KSC NDE capabilities when required.
6. Damage Disposition None disclosed.
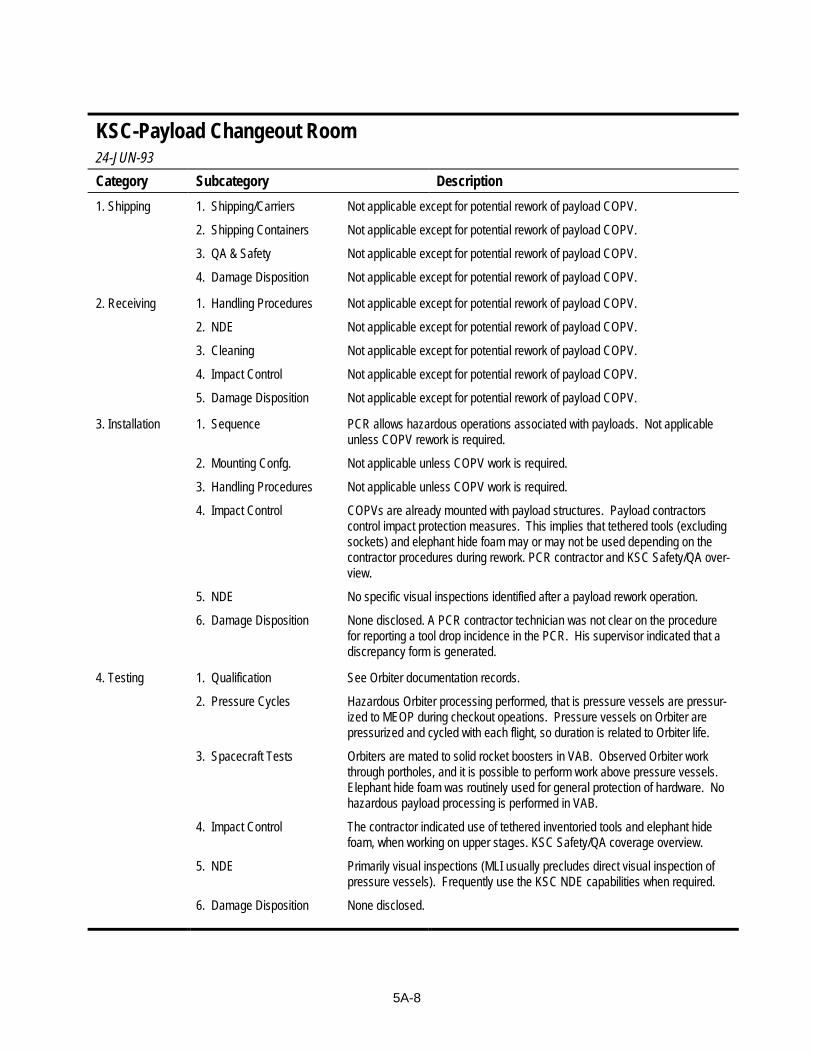
5A-8
KSC-Payload Changeout Room 24-JUN-93
Category Subcategory Description
1. Shipping 1. Shipping/Carriers Not applicable except for potential rework of payload COPV.
2. Shipping Containers Not applicable except for potential rework of payload COPV.
3. QA & Safety Not applicable except for potential rework of payload COPV.
4. Damage Disposition Not applicable except for potential rework of payload COPV.
2. Receiving 1. Handling Procedures Not applicable except for potential rework of payload COPV.
2. NDE Not applicable except for potential rework of payload COPV.
3. Cleaning Not applicable except for potential rework of payload COPV.
4. Impact Control Not applicable except for potential rework of payload COPV.
5. Damage Disposition Not applicable except for potential rework of payload COPV.
3. Installation 1. Sequence PCR allows hazardous operations associated with payloads. Not applicable unless COPV rework is required.
2. Mounting Confg. Not applicable unless COPV work is required.
3. Handling Procedures Not applicable unless COPV work is required.
4. Impact Control COPVs are already mounted with payload structures. Payload contractors control impact protection measures. This implies that tethered tools (excluding sockets) and elephant hide foam may or may not be used depending on the contractor procedures during rework. PCR contractor and KSC Safety/QA over-view.
5. NDE No specific visual inspections identified after a payload rework operation.
6. Damage Disposition None disclosed. A PCR contractor technician was not clear on the procedure for reporting a tool drop incidence in the PCR. His supervisor indicated that a discrepancy form is generated.
4. Testing 1. Qualification See Orbiter documentation records.
2. Pressure Cycles Hazardous Orbiter processing performed, that is pressure vessels are pressur-ized to MEOP during checkout opeations. Pressure vessels on Orbiter are pressurized and cycled with each flight, so duration is related to Orbiter life.
3. Spacecraft Tests Orbiters are mated to solid rocket boosters in VAB. Observed Orbiter work through portholes, and it is possible to perform work above pressure vessels. Elephant hide foam was routinely used for general protection of hardware. No hazardous payload processing is performed in VAB.
4. Impact Control The contractor indicated use of tethered inventoried tools and elephant hide foam, when working on upper stages. KSC Safety/QA coverage overview.
5. NDE Primarily visual inspections (MLI usually precludes direct visual inspection of pressure vessels). Frequently use the KSC NDE capabilities when required.
6. Damage Disposition None disclosed.

5A-9
CCAFS Payload Hazardous Servicing Facility 24-JUN-93
Category Subcategory Description
1. Shipping 1. Shipping/Carriers COPVs arrive already installed within spacecraft structures.
2. Shipping Containers No shock sensors are used on the COPVs, however, the spacecraft frequently use shock sensitive indicators during shipment to this processing facility.
3. QA & Safety NASA Eastern Range KSC Safety and QA personnel monitor any work or rework (including procedures) on the spacecraft while processing through Hanger AO. Manufacturer's COPV pedigree-logbooks are part of the space-craft documentation.
4. Damage Disposition None disclosed. Any COPV damage incidence is handled on a case-by-case basis (e.g. propellant leakage on MARS Observer Craft).
2. Receiving 1. Handling Procedures Not applicable, unless rework of a COPV on a spacecraft is required. COPVs are not generally handled during processing through the Hanger AO clean rooms because they are already installed on the spacecraft. COPV are filled/pressurized at the Payload Hazardous Servicing Facility.
2. NDE No NDE routinely performed on MLI-covered COPVs. No visual inspections of COPVs are routinely performed in Hanger AO clean rooms, unless specific rework is required with removal of MLI. Rework activities typically rely on vis-ual inspections only, if necessary.
3. Cleaning None routinely performed on COPVs. Rework activities involve cleaning procedures specified by spacecraft contractor.
4. Impact Control If spacecraft rework is required for installation of a COPV, then tethered tools, elephant hide foam, and NASA Eastern Range KSC Safety and QA debris typically require nets.
5. Damage Disposition None disclosed. Any COPV damage incidence is handled on a case-by-case basis (e.g. propellant leakage on MARS Observer Craft).
3. Installation 1. Sequence COPVs are already installed on spacecraft during this processing. See specific spacecraft or booster design for details.
2. Mounting Confg. See specific spacecraft or booster design for details.
3. Handling Procedures COPVs are not generally handled during processing through the Hanger AO clean rooms because they are already installed on the spacecraft. No fueling or pressurization allowed.
4. Impact Control Spacecraft may have some torque operations within the proximity of a COPV, particularly within the booster assemblies. If spacecraft rework is required for installation of a COPV, then tethered tools, elephant hide foam, and debris nets are typically required by NASA Eastern Range KSC Safety and QA.
5. NDE None routinely performed on MLI covered COPVs. Rework activities typically rely on visual inspections.
6. Damage Disposition None disclosed. Any COPV damage incidence is handled on a case-by-case basis (e.g. propellant leakage on MARS Observer).

5A-10
CCAFS Payload Hazardous Servicing Facility 24-JUN-93
Category Subcategory Description
4. Testing 1. Qualification Not applicable at this stage of process. See spacecraft documentation records.
2. Pressure Cycles Spacecraft contractors are allowed to pressurize to MEOP. Length of time in Hanger AO PHSF typically ranges from a few months to as long as a year depending on the payload.
3. Spacecraft Tests Typically, the types of test performed include electrical activation with some mechanical testing, but no hazardous operations.
4. Impact Control None routinely required for testing.
5. NDE Primarily visual inspections (although, MLI usually precludes direct visual inspection of COPV). Frequently use the KSC NDE capabilities when re-quired.
6. Damage Disposition None disclosed in detail. Mentioned the well-known MARS Observer problem with propellant leakage.
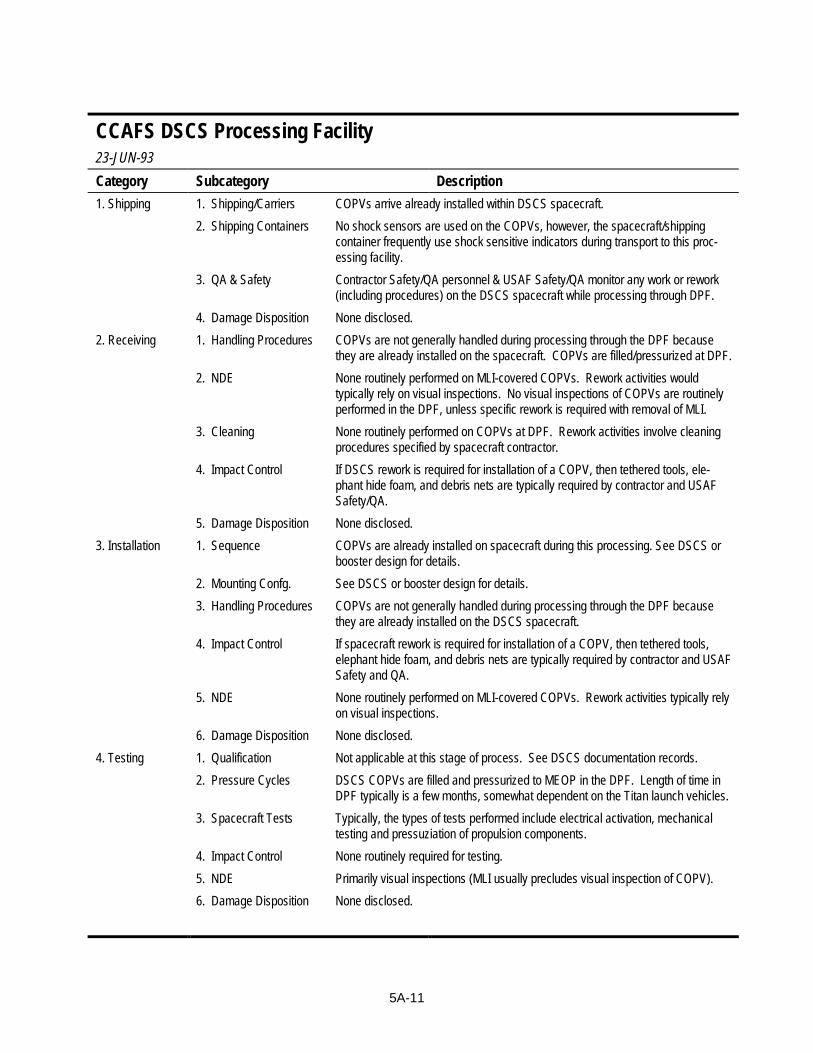
5A-11
CCAFS DSCS Processing Facility 23-JUN-93
Category Subcategory Description 1. Shipping 1. Shipping/Carriers COPVs arrive already installed within DSCS spacecraft.
2. Shipping Containers No shock sensors are used on the COPVs, however, the spacecraft/shipping container frequently use shock sensitive indicators during transport to this proc-essing facility.
3. QA & Safety Contractor Safety/QA personnel & USAF Safety/QA monitor any work or rework (including procedures) on the DSCS spacecraft while processing through DPF.
4. Damage Disposition None disclosed.
2. Receiving 1. Handling Procedures COPVs are not generally handled during processing through the DPF because they are already installed on the spacecraft. COPVs are filled/pressurized at DPF.
2. NDE None routinely performed on MLI-covered COPVs. Rework activities would typically rely on visual inspections. No visual inspections of COPVs are routinely performed in the DPF, unless specific rework is required with removal of MLI.
3. Cleaning None routinely performed on COPVs at DPF. Rework activities involve cleaning procedures specified by spacecraft contractor.
4. Impact Control If DSCS rework is required for installation of a COPV, then tethered tools, ele-phant hide foam, and debris nets are typically required by contractor and USAF Safety/QA.
5. Damage Disposition None disclosed.
3. Installation 1. Sequence COPVs are already installed on spacecraft during this processing. See DSCS or booster design for details.
2. Mounting Confg. See DSCS or booster design for details.
3. Handling Procedures COPVs are not generally handled during processing through the DPF because they are already installed on the DSCS spacecraft.
4. Impact Control If spacecraft rework is required for installation of a COPV, then tethered tools, elephant hide foam, and debris nets are typically required by contractor and USAF Safety and QA.
5. NDE None routinely performed on MLI-covered COPVs. Rework activities typically rely on visual inspections.
6. Damage Disposition None disclosed.
4. Testing 1. Qualification Not applicable at this stage of process. See DSCS documentation records.
2. Pressure Cycles DSCS COPVs are filled and pressurized to MEOP in the DPF. Length of time in DPF typically is a few months, somewhat dependent on the Titan launch vehicles.
3. Spacecraft Tests Typically, the types of tests performed include electrical activation, mechanical testing and pressuziation of propulsion components.
4. Impact Control None routinely required for testing.
5. NDE Primarily visual inspections (MLI usually precludes visual inspection of COPV).
6. Damage Disposition None disclosed.

5A-12
CCAFS Titan Launch Facility (TLF) 23-JUN-93
Category Subcategory Description
1. Shipping 1. Shipping/Carriers Not applicable for COPV.
2. Shipping Containers Not applicable for COPV.
3. QA & Safety Not applicable for COPV.
4. Damage Disposition Not applicable for COPV.
2. Receiving 1. Handling Procedures Not applicable for COPV.
2. NDE Not applicable for COPV.
3. Cleaning Not applicable for COPV.
4. Impact Control Not applicable for COPV.
5. Damage Disposition Not applicable for COPV.
3. Installation 1. Sequence Payloads are mounted within farings for Titan Vehicles.
2. Mounting Confg. Not applicable for COPV at TLF.
3. Handling Procedures Not applicable for COPV at TLF.
4. Impact Control COPVs are already mounted within payload structures. Impact protection meas-ures are controlled by payload contractors. This implies that tethered tools (not including sockets) and elephant hide foam may or may not be used depending on the contractor procedures during rework. Titan contractor and UASF Safety/QA overview.
5. NDE No specific visual inspections identified.
6. Damage Disposition None disclosed.
4. Testing 1. Qualification See DSCS documentation records.
2. Pressure Cycles Hazardous vehicle processing performed (i.e. pressurized pressure vessels) including top-off of He COPVs.
3. Spacecraft Tests
4. Impact Control
5. NDE Primarily visual inspections (MLI usually precludes direct visual inspection of pressure vessels). Frequently use the KSC NDE capabilities when required.
6. Damage Disposition None disclosed.
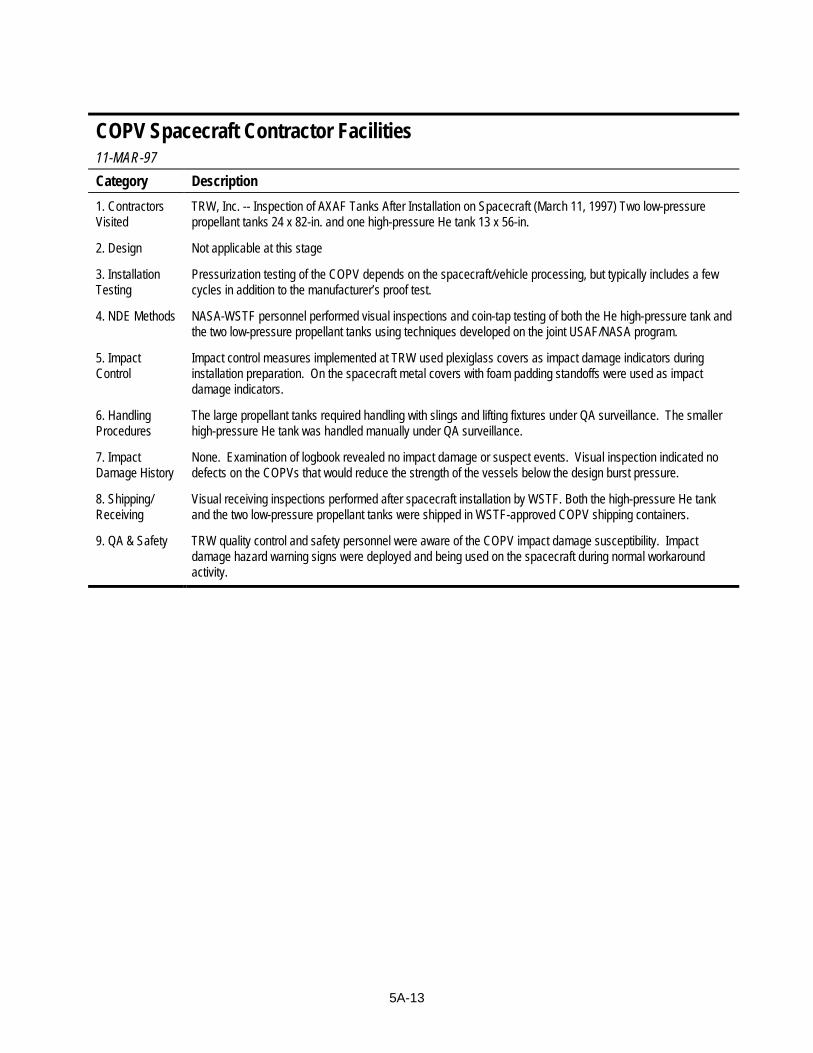
5A-13
COPV Spacecraft Contractor Facilities 11-MAR-97
Category Description
1. Contractors Visited
TRW, Inc. -- Inspection of AXAF Tanks After Installation on Spacecraft (March 11, 1997) Two low-pressure propellant tanks 24 x 82-in. and one high-pressure He tank 13 x 56-in.
2. Design Not applicable at this stage
3. Installation Testing
Pressurization testing of the COPV depends on the spacecraft/vehicle processing, but typically includes a few cycles in addition to the manufacturer’s proof test.
4. NDE Methods NASA-WSTF personnel performed visual inspections and coin-tap testing of both the He high-pressure tank and the two low-pressure propellant tanks using techniques developed on the joint USAF/NASA program.
5. Impact Control
Impact control measures implemented at TRW used plexiglass covers as impact damage indicators during installation preparation. On the spacecraft metal covers with foam padding standoffs were used as impact damage indicators.
6. Handling Procedures
The large propellant tanks required handling with slings and lifting fixtures under QA surveillance. The smaller high-pressure He tank was handled manually under QA surveillance.
7. Impact Damage History
None. Examination of logbook revealed no impact damage or suspect events. Visual inspection indicated no defects on the COPVs that would reduce the strength of the vessels below the design burst pressure.
8. Shipping/ Receiving
Visual receiving inspections performed after spacecraft installation by WSTF. Both the high-pressure He tank and the two low-pressure propellant tanks were shipped in WSTF-approved COPV shipping containers.
9. QA & Safety TRW quality control and safety personnel were aware of the COPV impact damage susceptibility. Impact damage hazard warning signs were deployed and being used on the spacecraft during normal workaround activity.
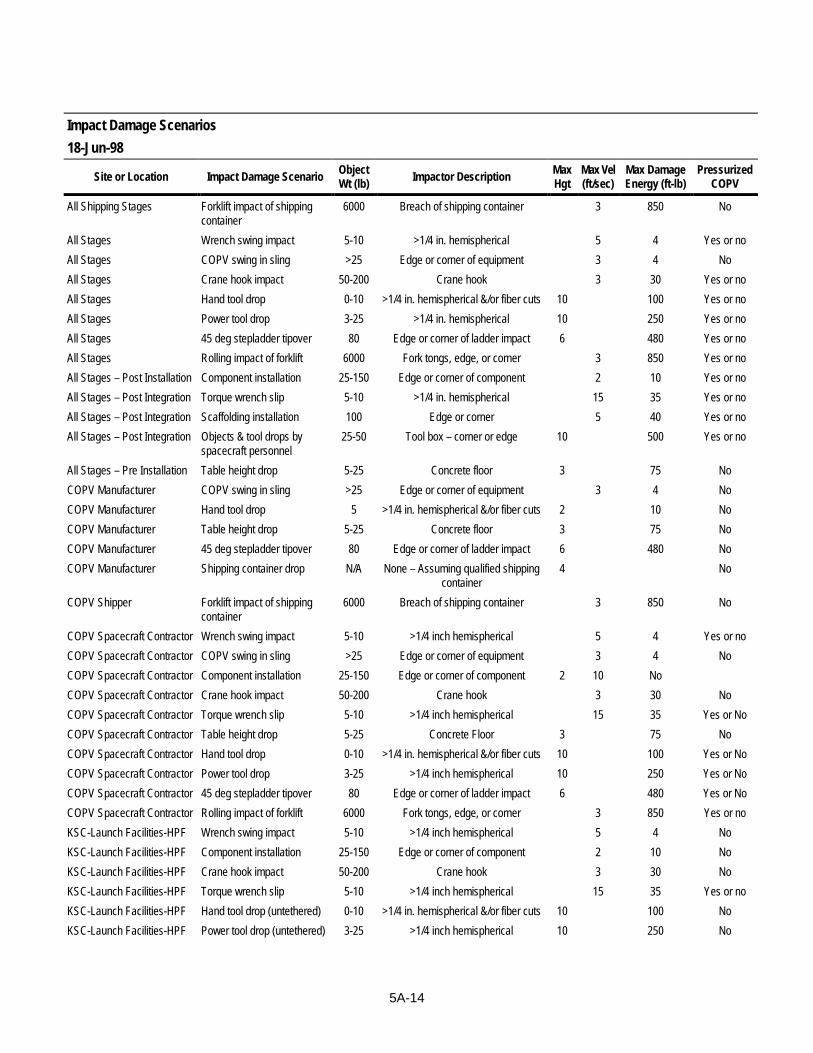
5A-14
Impact Damage Scenarios
18-Jun-98
Site or Location Impact Damage Scenario Object Wt (lb) Impactor Description Max
Hgt Max Vel (ft/sec)
Max Damage Energy (ft-lb)
Pressurized COPV
All Shipping Stages Forklift impact of shipping container
6000 Breach of shipping container 3 850 No
All Stages Wrench swing impact 5-10 >1/4 in. hemispherical 5 4 Yes or no
All Stages COPV swing in sling >25 Edge or corner of equipment 3 4 No
All Stages Crane hook impact 50-200 Crane hook 3 30 Yes or no
All Stages Hand tool drop 0-10 >1/4 in. hemispherical &/or fiber cuts 10 100 Yes or no
All Stages Power tool drop 3-25 >1/4 in. hemispherical 10 250 Yes or no
All Stages 45 deg stepladder tipover 80 Edge or corner of ladder impact 6 480 Yes or no
All Stages Rolling impact of forklift 6000 Fork tongs, edge, or corner 3 850 Yes or no
All Stages – Post Installation Component installation 25-150 Edge or corner of component 2 10 Yes or no
All Stages – Post Integration Torque wrench slip 5-10 >1/4 in. hemispherical 15 35 Yes or no
All Stages – Post Integration Scaffolding installation 100 Edge or corner 5 40 Yes or no
All Stages – Post Integration Objects & tool drops by spacecraft personnel
25-50 Tool box – corner or edge 10 500 Yes or no
All Stages – Pre Installation Table height drop 5-25 Concrete floor 3 75 No
COPV Manufacturer COPV swing in sling >25 Edge or corner of equipment 3 4 No
COPV Manufacturer Hand tool drop 5 >1/4 in. hemispherical &/or fiber cuts 2 10 No
COPV Manufacturer Table height drop 5-25 Concrete floor 3 75 No
COPV Manufacturer 45 deg stepladder tipover 80 Edge or corner of ladder impact 6 480 No
COPV Manufacturer Shipping container drop N/A None – Assuming qualified shipping container
4 No
COPV Shipper Forklift impact of shipping container
6000 Breach of shipping container 3 850 No
COPV Spacecraft Contractor Wrench swing impact 5-10 >1/4 inch hemispherical 5 4 Yes or no
COPV Spacecraft Contractor COPV swing in sling >25 Edge or corner of equipment 3 4 No
COPV Spacecraft Contractor Component installation 25-150 Edge or corner of component 2 10 No
COPV Spacecraft Contractor Crane hook impact 50-200 Crane hook 3 30 No
COPV Spacecraft Contractor Torque wrench slip 5-10 >1/4 inch hemispherical 15 35 Yes or No
COPV Spacecraft Contractor Table height drop 5-25 Concrete Floor 3 75 No
COPV Spacecraft Contractor Hand tool drop 0-10 >1/4 in. hemispherical &/or fiber cuts 10 100 Yes or No
COPV Spacecraft Contractor Power tool drop 3-25 >1/4 inch hemispherical 10 250 Yes or No
COPV Spacecraft Contractor 45 deg stepladder tipover 80 Edge or corner of ladder impact 6 480 Yes or No
COPV Spacecraft Contractor Rolling impact of forklift 6000 Fork tongs, edge, or corner 3 850 Yes or no
KSC-Launch Facilities-HPF Wrench swing impact 5-10 >1/4 inch hemispherical 5 4 No
KSC-Launch Facilities-HPF Component installation 25-150 Edge or corner of component 2 10 No
KSC-Launch Facilities-HPF Crane hook impact 50-200 Crane hook 3 30 No
KSC-Launch Facilities-HPF Torque wrench slip 5-10 >1/4 inch hemispherical 15 35 Yes or no
KSC-Launch Facilities-HPF Hand tool drop (untethered) 0-10 >1/4 in. hemispherical &/or fiber cuts 10 100 No
KSC-Launch Facilities-HPF Power tool drop (untethered) 3-25 >1/4 inch hemispherical 10 250 No

5A-15
Impact Damage Scenarios
18-Jun-98
Site or Location Impact Damage Scenario Object Wt (lb) Impactor Description Max
Hgt Max Vel (ft/sec)
Max Damage Energy (ft-lb)
Pressurized COPV
KSC-Launch Facilities-HPF Rolling impact of forklift 6000 Fork tongs, edge, or corner 3 850 No
KSC-Launch Facilities-OPF Wrench swing impact 5-10 >1/4 inch hemispherical 5 4 No
KSC-Launch Facilities-OPF Component installation 25-150 Edge or corner of component 2 10 No
KSC-Launch Facilities-OPF Crane hook impact 50-200 Crane hook 3 30 No
KSC-Launch Facilities-OPF Torque wrench slip 5-10 >1/4 inch hemispherical 15 35 Yes or No
KSC-Launch Facilities-OPF Scaffolding installation 100 Edge or corner 5 40 No
KSC-Launch Facilities-OPF Hand tool drop (untethered) 0-10 >1/4 in. hemispherical &/or fiber cuts 10 100 No
KSC-Launch Facilities-OPF Power tool drop (untethered) 3-25 >1/4 inch hemispherical 10 250 No
KSC-Launch Facilities-PCR Wrench swing impact 5-10 >1/4 inch hemispherical 5 4 Yes or No
KSC-Launch Facilities-PCR Component installation 25-150 Edge or corner of component 2 10 Yes or No
KSC-Launch Facilities-PCR Crane hook impact 50-200 Crane hook 3 30 Yes or No
KSC-Launch Facilities-PCR Torque wrench slip 5-10 >1/4 inch hemispherical 15 35 Yes or No
KSC-Launch Facilities-PCR Hand tool drop (untethered) 0-10 >1/4 in. hemispherical &/or fiber cuts 10 100 Yes or No
KSC-Launch Facilities-PCR Power tool drop (untethered) 3-25 >1/4 inch hemispherical 10 250 Yes or No
KSC-Launch Facilities-PCR Objects & tool drops by spacecraft personnel
25-50 Tool Box -- corner or edge 10 500 Yes or No
KSC-Launch Facilities-PCR Rolling impact of forklift 6000 Fork tongs, edge, or corner 3 850 Yes or No
KSC-Launch Facilities-VAB Wrench swing impact 5-10 >1/4 inch hemispherical 5 4 Yes
KSC-Launch Facilities-VAB Torque wrench slip 5-10 >1/4 inch hemispherical 15 35 Yes or No
KSC-Launch Facilities-VAB Scaffolding installation 100 Edge or corner 5 40 Yes
KSC-Launch Facilities-VAB Hand tool drop (untethered) 0-10 >1/4 in. hemispherical &/or fiber cuts 0-10 100 Yes
KSC-Launch Facilities-VAB Power tool drop (untethered) 3-25 >1/4 inch hemispherical 0-10 250 Yes
KSC-Launch Facilities-VPF Wrench swing impact 5-10 >1/4 inch hemispherical 5 4 Yes or No
KSC-Launch Facilities-VPF Component installation 25-150 Edge or corner of component 2 10 Yes or No
KSC-Launch Facilities-VPF Crane hook impact 50-200 Crane hook 3 30 Yes or No
KSC-Launch Facilities-VPF Torque wrench slip 5-10 >1/4 inch hemispherical 15 35 Yes or No
KSC-Launch Facilities-VPF Hand tool drop (untethered) 0-10 >1/4 in. hemispherical &/or fiber cuts 20 200 Yes or No
KSC-Launch Facilities-VPF Power tool drop (untethered) 3-25 >1/4 inch hemispherical 20 500 Yes or No
KSC-Launch Facilities-VPF Rolling impact of forklift 6000 Fork tongs, edge, or corner 3 850 Yes or No
Launch Facility-CCAFS-DPF Wrench swing impact 5-10 >1/4 inch hemispherical 5 4 Yes or No
Launch Facility-CCAFS-DPF Component installation 25-150 Edge or corner of component 2 10 Yes or No
Launch Facility-CCAFS-DPF Torque wrench slip 5-10 >1/4 inch hemispherical 15 35 Yes or No
Launch Facility-CCAFS-PHSF
Wrench swing impact 5-10 >1/4 inch hemispherical 5 4 Yes or No
Launch Facility-CCAFS-PHSF
Component installation 25-150 Edge or corner of component 2 10 Yes or No
Launch Facility-CCAFS-PHSF
Crane hook impact 50-200 Crane hook 3 30 Yes or No
Launch Facility-CCAFS-PHSF
Torque wrench slip 5-10 >1/4 inch hemispherical 15 35 Yes or No
Launch Facility-CCAFS-PHSF
Scaffolding installation 100 Edge or corner 5 40 Yes or No

5A-16
Impact Damage Scenarios
18-Jun-98
Site or Location Impact Damage Scenario Object Wt (lb) Impactor Description Max
Hgt Max Vel (ft/sec)
Max Damage Energy (ft-lb)
Pressurized COPV
PHSF
Launch Facility-CCAFS-PHSF
Hand tool drop (not tethered) 0-10 >1/4 in. hemispherical &/or fiber cuts 0-10 100 Yes or No
Launch Facility-CCAFS-PHSF
Power tool drop (untethered) 3-25 >1/4 inch hemispherical 0-10 250 Yes or No
Launch Facility-CCAFS-PHSF
Rolling impact of forklift 6000 Fork tongs, edge, or corner 3 850 Yes or No
Titan Launch Facility-CCAFS Wrench swing impact 5-10 >1/4 inch hemispherical 5 4 Yes or No
Titan Launch Facility-CCAFS Component installation 25-150 Edge or corner of component 2 10 Yes or No
Titan Launch Facility-CCAFS Crane hook impact 50-200 Crane hook 3 30 Yes or No
Titan Launch Facility-CCAFS Torque wrench slip 5-10 >1/4 inch hemispherical 15 35 Yes or No
Titan Launch Facility-CCAFS Scaffolding installation 100 Edge or corner 5 40 Yes or No
Titan Launch Facility-CCAFS Hand tool drop (not tethered) 0-10 >1/4 in. hemispherical &/or fiber cuts 0-10 100 Yes or No
Titan Launch Facility-CCAFS Power tool drop (untethered) 3-25 >1/4 inch hemispherical 0-10 250 Yes or No

Appendix 5B
Elements of a COPV Impact Control Plan

5B-1
5B1. Purpose
The purpose of this ICP is to establish procedures that:
• Prevent impact damage to COPVs during manufacturing, shipping, handling, installation, and sys-tem–level operations,
• Define methods for detecting, evaluating, and dispositioning potential impact damage incidences, and
• Identify the approach for assessing the burst strength of a COPV following an impact damage inci-dence.
5B3. Application
COPVs are known to be susceptible to damage resulting from handling, tool drop impacts, or impacts from other objects. The VDT for many COPVs is equal to or lower than the impact damage threshold (IDT) at 20% required to degrade the BAI below the specified proof pressure of the vessel. Thus, impact controls shall be required throughout all stages of the COPV handling and service life where VDT ≤ IDT at 20%. The ICP procedures contained herein are mandatory for all COPVs when this document is used as a contractual instrument. Specific approval by the procuring agency or the jurisdictional authority (e.g., appropriate launch or test range authority) is required before excluding, modifying, or revising any ICP procedures.
5B3. Referenced Documents
• MIL–PRF–26514, Polyurethane Foam, Rigid or Flexible, for Packaging
• FED–STD 101, Method 5007.1, Level B, Test Procedures for Packaging Materials
• AIAA S–080, AIAA Standard Aerospace Pressurized Systems, Vol. I, Metallic Pressure Vessels, Pressurized Structures, and Pressure Components (Draft, March 1998)
• AIAA S–081, AIAA Standard Aerospace Pressurized Systems, Vol. II, Composite Overwrapped Pressure Vessels (Draft, January 1998)
• ASNT SNT–TC–1A, Recommended Practice; Personnel Qualification and Certification in Nonde-structive Testing
• ASTM D 775–80, Standard Test Method for Drop Test of Loaded Boxes
• ASTM D 1083–88, Standard Test Methods for Mechanical Handling of Unitized Loads and Large Shipping Cases and Crates
• ASTM D 4169–90, Standard Practice for Performance Testing of Shipping Containers and Systems
5B4. Definitions
• Acceptance Tests: The required formal tests conducted on flight hardware to ascertain that the materials, manufacturing processes, and workmanship meet specifications and that the hardware is acceptable for intended usage.
• Autofrettage: A vessel sizing operation where pressure–driven deflection is used to plastically yield the metal liner into the overlying composite in order to induce initial stress states in the metal liner and composite.

5B-2
• Burst Factor: A multiplying factor applied to the maximum design pressure to obtain the design burst pressure.
• Burst–Strength After–Impact (BAI): The pressure required to burst a COPV after impact damage. The normalized BAI is defined as percentage relative to the pressure required to burst an undamaged COPV.
• Composite Overwrapped Pressure Vessel (COPV): A pressure vessel with a fiber–based compos-ite structure encapsulating a metal liner. The metal liner serves as a gas permeation barrier and may or may not carry substantive pressure loads. The composite overwrap carries pressure and environ-mental loads.
• Design Burst Pressure: A pressure that a pressure vessel, pressurized structures, and pressurized components must withstand without rupturing in the applicable operating environment.
• Design Safety Factor: A factor used to account for uncertainties in material properties and analysis procedures. Design safety factor is often called design factor of safety or simply, factor of safety.
• Flight Readiness Review: A process the jurisdictional authority conducts to determine that a sys-tem is ready for launch, including all operational and safety aspects.
• Impact Damage: An induced fault in the composite overwrap or metal liner that’s caused by an object strike on the vessel or vessel strike on an object.
• Impact Damage Threshold (IDT): The maximum impact energy level that will not degrade the residual strength of the COPV below DF times MEOP (DF = Damage Factor) ≥ 1.25 (fixed).
• Impact Control Plan (ICP): An approved process that addresses the prevention of and the protec-tion of a COPV from damage due to potential impact events occurring in the manufacturing, testing, transportation, ground handling, storage, assembly, and service stages of COPV use.
• Impact Damage Protector: A physical device that can be used to prevent impact damage.
• Jurisdictional Authority: Organization having the responsibility for maintaining safety at a manu-facturing plant, contractor facility, or launch facility (e.g., range safety).
• Material Review Board (MRB): An independent technical board assembled by a jurisdictional authority to assess the results of a failure analysis.
• Maximum Expected Operating Pressure (MEOP): The highest pressure which a pressure vessel, pressurized structure, or pressure component is expected to experience during its service life and re-tain its functionality, in association with its applicable operating environments.
• Nondestructive Evaluation (NDE): The term used to encompass all activities associated with nondestructive testing (NDT), nondestructive inspection (NDI), and nondestructive examination (NDEx).
• Proof Factor: A multiplying factor applied to the MEOP to establish the proof pressure.
• Proof Pressure or Level: The product of MEOP, a proof factor, and a factor accounting for the difference in material properties between test and service environment (such as temperature). The proof pressure is used to give evidence of satisfactory workmanship and material quality and/or es-tablish maximum initial flaw sizes for safe–life demonstration.
• Qualification Tests: The required formal contractual tests used to demonstrate that the design, manufacturing, and assembly have resulted in hardware designs conforming to specification require-ments.

5B-3
• Residual Strength: The maximum value of nominal load (stress) that a cracked body is capable of sustaining without unstable crack growth.
• Residual Stress: The stress remaining in a structure as a result of processing, fabrication, assembly, testing, or operation. A typical example is welding–induced residual stress.
• Service Life: The period of time (or stress cycles) starting with manufacturing the pressure vessel or the pressurized structure, and continuing through acceptance testing, handling, storage, transporta-tion, launch operations, orbital operations, refurbishment, retesting, reentry or recovery from orbit, and reuse that may be required or specified for the item.
• Undetectable Indication: Abnormality, defect, or damage that cannot reliably be detected.
• Visual Damage Threshold (VDT): An impact energy level that creates an indication that is barely detectable using an unaided visual technique.
5B4. Overview of Impact Control Requirements
5B4.1 General Overview
Chart 5B1 illustrates a general overview of ICP requirements. Implement the ICP at every stage throughout the life of the COPV, beginning at the manufacturing plant, through the various test and integration stages leading up to launch.
Installation & Test Procedure Requirements
Procedural Only Impact Indicators Impact Protectors
Reject COPV
Flight Readiness Review
Accept COPV
Assess COPV BAI
Impact Damage Event
Flight Readiness Review
No Impact Damage Event
Damage Evalutation
Receiving Inspection Requirements
Shipping Requirements
Manufacturer Impact Control Requirements
Impact Control Plan
Chart 5B1. Impact Control Plan Overview
The next section will outline the specific and unique ICP requirements for each COPV stage in more detail. Chart 5B1 identifies an evaluation stage used to determine if any potential impact damage to the COPV may have occurred before pressurization to MEOP or proof level. Note that this evaluation assumes that the vessel has passed the acceptance proof test at the manufacturing plant before delivery. If no impact damage event is known to exist, the COPV has been handled under an approved ICP, and there are no other unresolved issues or constraints, determine the COPV safe for pressurization to MEOP

5B-4
or proof level. The jurisdictional authority (e.g., range safety or flight readiness review board) grants approval before the physical pressurization process. On the other hand, if an impact damage event is known to have occurred or a suspect condition has been identified, assess the BAI of the degraded COPV to within an accuracy of at least ± 5% before pressurization to MEOP or proof level to determine the accept or reject status of the COPV.
In general, implement the ICP using at least one of three basic methodologies. The first method, by procedure only, requires 100% QA surveillance to ensure that no damage has occurred to the COPV. QA personnel must be trained and certified in the damage susceptibility of COPVs and in the methods of performing NDE, including visual inspections.
The second method uses impact indicators to identify any impact conditions, and reduces the level of required QA surveillance to inspections during the installation of the impact indicators and to periodic inspections thereafter.
Finally, the third method uses impact protectors capable of absorbing the indentation and deflection damage from all potential impact scenarios in the threat environment. This method of ICP requires only QA surveillance during the installation and removal of the COPV protective covers.
Chart 5B2 shows a chart for assessing the BAI of an impact–damaged COPV or suspect impact–damage condition. In general, the procedure involves reviewing the impact damage history, characterizing the extent of damage using visual and NDE methods, comparing the data with impact damage databases, and making a theoretical or empirical prediction of the BAI using three–dimensional nonlinear finite element analysis that includes progressive damage mechanisms. The BAI shall be predicted to within ± 5% at the 95% confidence level to provide sufficiently accurate data to accept or reject a damaged COPV. Demon-strate the accuracy of the prediction with historical test data for the COPV design and configuration in question.

5B-5
QA SurveillancePersonnel Certification
TrainingQualification
Reject COPV
Flight Readiness Review
MRB
Accept COPV
Apply Accept/Reject Criteria
Residual Burst Strength PredictionDatabase Comparison
NDE CorrelationFinite Element Modeling
Perform NDEVisual Inspection
IR Thermography, UT A-Scan, EC ScanAE During Pressurization & Other Methods
Review Impact History
Assess BAI of COPV
Chart 5B2. Assess BAI of COPV.
5B4.2 QA and NDE Requirements
QA and NDE requirements are common elements to all stages of the ICP; therefore, we specify the detailed requirements for these elements in general, and hereafter refer to or reference them for each of the ICP elements.
5B4.2.1 QA Requirements
Establish a QA program, based on a comprehensive study of the product (COPV) and engineering re-quirements (e.g., drawings, material specifications, process specifications, workmanship standards, design review records, and fail mode analysis) to ensure that the necessary NDE and acceptance tests are effectively performed to verify that the product meets the requirements of this ICP. The program shall ensure that the COPVs conform to applicable drawings and process specifications; that no damage or degradation has occurred during material processing, fabrication, inspection, shipping, storage, opera-tional use, and refurbishment; and that defects which could cause failure are detected or evaluated and corrected. As a minimum, include the following considerations in structuring the QA program.
5B4.2.1.1 Inspection Plan. Establish an inspection plan before fabrication starts. Specify in the plan appropriate inspection points and inspection techniques for use throughout the program, beginning with

5B-6
material procurement and continuing through fabrication, assembly, acceptance proof test, operation, and refurbishment, as appropriate. In establishing inspection points and inspection techniques, consider the material characteristics, fabrication processes, design concepts, structural configuration, and accessibility for inspection of flaws.
Develop the inspection plan to be in compliance with AIAA S–080 standards for the metal liner, and with AIAA S–081 for the composite overwrap. Establish acceptance and rejection standards for each phase of inspection, and for each type of inspection technique.
5B4.2.1.2 Personnel Qualifications, Training, and Certifications. Train and certify QA and NDE inspectors to visually recognize impact damage to a COPV. For visual inspections, train the in-spectors to identify impact damage indentations, cuts, matrix cracking, delaminations, and fiber breakage on representative COPV surfaces before performing the required COPV inspection. In addition, also train the inspectors to differentiate benign discontinuities (e.g., scuff marks, adhesive films, and superfi-cial abrasions) from the detrimental defects listed above.
Train and certify personnel involved in specialized NDE inspections in the application of the technique and data interpretation. Certify all personnel handling the COPV in the handling procedures associated with spaceflight hardware. As a minimum, this includes training in the damage susceptibility of the COPV and methods of preventing potential impacts during handling.
Level III American Society for Nondestructive Testing (ASNT) certification in the specific NDE tech-nique is a minimum requirement. Conduct specialized training and certification using representative impact damage defects on COPVs.
5B4.2.1.3 Discrepancy Reporting. Include discrepancy reporting as part of the QA program and inspection plan procedures. Report discrepancies in terms of impact damage, indications, overwrap or liner discontinuities, anomalies, or other flaws and disposition them on approved forms. The jurisdic-tional authority gives approval before pressurizing the COPV to MEOP levels or above.
5B4.2.2 NDE Requirements
Handling procedures for performing NDE inspections depend on the size of the COPV. For small COPV cylindrical or spherical vessels, perform handling under 100% QA surveillance using procedures that specify the use of gloves and foam pads to prevent scuffing of the composite overwrapped surface. Large COPVs require lifts and slings to move the COPV under 100% QA surveillance and the use of controlled procedures.
The selected NDE techniques for metal liner inspection shall be capable of 1) determining the size, geometry, and orientation of a flaw or defect, 2) identifying multiple defects, and 3) differentiating among defect shapes, from tight cracks to spherical voids. Use two or more NDE methods for a COPV that cannot be adequately examined by only one method.
NDE techniques applicable for COPV inspection include, but are not limited to, the following:
• Visual inspections
• Infrared thermography
• Ultrasonic A–scan or C–scan
5B-7
• Coin tapping inspections
• Acoustic emission analysis
• Eddy current
• Shearography
• X–ray radiography (metal liner)
Document the NDE procedures, based on using multiple NDE methods when appropriate to perform survey inspections or diagnostic inspections. Conduct survey NDE inspections when the location of the potential defect of damage zone is unknown a priori. Perform diagnostic NDE inspections within a localized suspect zone to characterize the type and extent of the damage. All NDE techniques, whether used as a single inspection technique or as a combination of methods, shall have the capability to detect defects, flaws, or damage that may cause the vessel to fail to meet the requirements of the COPV per-formance specification or the requirements of this document.
Base the flaw detection capability of each selected NDE technique or combination of NDE techniques, as applied to the composite overwrap, on similarity data from prior test programs. Where this data is not available or is not sufficiently extensive to provide reliable results, determine capability experimentally, under production of operational inspection conditions, and demonstrate it by tests approved by the pro-curing agency on representative material product form, thickness, design configuration, and damage source.
5B4.2.2.1 Visual NDE. Visually inspect the composite overwrap in accordance with ASNT SNT–TC–1A. Train the visual inspectors to recognize barely visible impact damage defects on COPV surfaces and to distinguish these defects from other types of manufacturing discontinuities (e.g., scuff marks, superficial abrasion, surface bubbles in matrix, voids, excess or lack of resin and discoloration, stray fibers, and water spots) that do not affect the burst strength of the COPV. Allow inspectors 100% acces-sibility to the COPV and permit them to move or rotate the COPV (unmounted case only) to provide maximum visual detectability. Conduct the visual inspections using fluorescent or quartz lamp lighting (50 ft–candle) and allow the inspectors to use a magnifier as required. Provide a flexible measuring tape to measure the distance to reported flaws, defects, or discontinuities. Record anomalies in the pedigree logbook. Specify anomaly locations by azimuthal angle relative to the label and by measuring the dis-tance to the port boss. Measure the dimensions of an impact indentation to determine area and depth.
Visually inspect the COPV liner in accordance with ASNT SNT–TC–1A using a borescope. Inspect the entire inner surface of the liner to look for foreign debris, cracks, corrosion, corrosion pits, discoloration, voids, or surface inclusions. Record description and locations of anomalies in the COPV pedigree log-book.
5B4.2.2.2 Other NDE Methods. Permit other optional NDE methods as required to en-hance the survey or diagnostic inspection capability. Chart 5B3 illustrates the typical types of NDE methods that are applicable for overwrap inspections depending on whether a global survey is required or a diagnostic evaluation of a suspect region.

5B-8
NDE Composite Overwrap Application Procedure
Other
Acoustic Emission*Sub-MEOP
IR ThermographyGlobal
VisualGlobal
Survey NDE
Other
Acoustic Emission*Sub-MEOP
UltrasonicA-Scan or C-scan
Visual
Pressurized COPVImpact Event
Other
Acoustic Emission*Sub-MEOP
Eddy Current
UltrasonicA-Scan or C-Scan
IR ThermographyLocalized
Visual
Unpressurized COPVDamage Sources
Diagnostic NDE
Process StageFabrication or In-field Service
Chart 5B3. NDE methods and application procedures for COPV.
*Note: Acoustic emission with pneumatic pressurization requires dwell durations at constant pressure to eliminate noise due to gas expansion through orifice structures.
5B5. Specific Impact Control Requirements
5B5.1 Manufacturing Impact Controls
Chart 4 illustrates how to implement the ICP during the manufacturing stage of the COPV. Implement QA and NDE requirements per the requirements identified in Section 5B4.2. Handling procedures for manufacturing plant operations depend on the size of the COPV. For small COPV cylindrical or spheri-cal vessels, accomplish manual handling with 100% QA surveillance using procedures that specify the

5B-9
use of gloves and foam pads to prevent scuffing of the composite overwrapped surface. Large COPVs require lifts and slings to be moved. Prevent COPV impact damage procedurally with 100% QA surveil-lance when using lifts and slings.
QA SurveillancePersonnel Certification
TrainingQualifications
Discrepancy Reporting
Proof Testing
Curing Operations
Winding Operations
Linear Fabrication
ToolsTethered and Inventoried
Mfg. Operations
Restraints
Slings
Fixtures
Pallet & Forklift
Manual Lift & Carry
Transporting
Handling Procedures
Optional MethodsFor Example
UT, IR Thermography,EC, AE during Proof
X-ray of Liner
VisualExternal/Internal
NDE Inspections
Manufacturer Impact Control Requirements
Impact Control Plan
Chart 4B4. Manufacturer’s impact control requirements.
5B5.1.1 Impact Control for Manufacturing Operations
Impact control for manufacturing operations shall include the identification of tool impacts, floor drop conditions, and threat environments that could potentially contribute or cause COPV impact damage. Since impact protective covers may not be practical for all stages of COPV manufacturing operations, the plan basically requires that the ICP be implemented via procedural controls with 100% QA surveillance.
Inventory tools in the ICP area of the manufacturing plants and control them by the QA program. Any situation that potentially may result in the accidental dropping of tools that may strike the COPV throughout the manufacturing process requires tethered tools on lanyards. These processes include but are not limited to liner fabrication, filament winding, curing, autofrettage, leak testing, NDE testing, proof testing, and shipping preparation or storage.

5B-10
5B5.1.2 Impact Control for Manufacturer’s Handling Operations
Include in the ICP handling procedures for protective covers or fixtures used during all stages of manu-facturing. Identify in the handling procedures the safety factors and certification requirements for lifting items like slings, restraints, foam–padded chocks, fixtures, forklifts, or hoist assemblies.
Perform manual handling of the COPV in the manufacturing plants with the surveillance QA inspectors monitoring for any floor drops or transportation collisions that may occur during handling operations. Likewise, transport COPVs that require forklift or hoist mechanical aids with a trained team of personnel to guide the COPV to avoid collision impacts with objects, walls, or floors.
Use protective measures including impact protection covers, foam pads, foam–padded chocks, and foam–lined transportation containers to reduce the likelihood of anomalies or discontinuities (e.g., scuff marks or light abrasions) associated with various handling operations.
5B5.2 Shipping Impact Control Plan
Chart 5B5 illustrates the ICP that shall be implemented with respect to COPV shipping requirements. Implement QA requirements per the requirements identified in Section 5B4.2. Handling procedures for shipping and receiving depend on the size of the COPV. For small COPV cylindrical or spherical ves-sels, perform handling under 100% surveillance using procedures that specify the use of gloves and foam pads to prevent scuffing of the composite overwrapped surface. Large COPVs require lifts and slings to be moved. Prevent COPV impact damage procedurally when using lifts and slings.
QA SurveillancePersonnel Certification
TrainingQualification
COPV Packaging
Chock Padding
Foam Padding
Box Design
Wood Box
COPV Packaging
Foam Padding
Box Design
Cardboard Box
Design Requirements
Drop Testing
Qualification Requirements
Acceleration EventsAMP-3000 ShockWriter
TemperatureAMP-3000 ShockWriter
Shipping Recorder
Active
Acceleration Limit Temperature Limit
Passive
Environmental ControlsMositure Barrier & Liner Plug
Temperature Specs
Shock Specs
Tracking
Handling Specifications
Carrier Requirements
Shipping Requirements
Manufacturer Impact Control Requirements
Impact Control Plan
Chart 5B5. Shipping ICP requirements.
5B5.2.1 Shipping Container Design Requirements
Design transportation containers to protect the COPV from the threat environments encountered during shipping without inflicting damage to the COPV. For small spherical COPVs (< 12–in. diameter) use shipping containers foam lined per MIL–PRF–26514. Sufficient foam thickness is required to prevent

5B-11
COPV damage resulting from shipping container drops or collision impacts to the shipping container structure. Use the shock case defined by FED–STD 101, Method 5007.1, Level B, to design the shipping container. Frequently, larger or cylindrical COPV containers are suspended on foam chocks or foam–lined saddle fixtures. American Society for Testing and Materials (ASTM) D 1974–91 provides standard practice for closing, sealing, and reinforcing fiberboard shipping containers.
Compartmental shipping containers shall be permitted for the shipment of a plurality of small COPVs, but individually line each compartment with sufficient foam to preclude damage during shipment. De-sign the entire crate to survive a drop from a height consistent with the threat environment (minimum 122 cm (4 ft)) without damaging the COPV.
For large COPVs, construct shipping containers to survive a minimum 122–cm (4–ft) drop while protect-ing the COPV. This includes suspending the COPV in foam pads, chocks, or saddles. Secure the lid of the shipping container with metal clamps held in place with banding straps. The thickness of foam required to preclude COPV damage depends on the size and weight of the COPV. Small vessels may require only 2.5–cm (1–in.) thick foam, while the large vessels require foam pads up to 15.2–cm (6–in.) thick or greater. The foam lining specification shall be in accordance with MIL–PRF–26514. ASTM D 1083–88 provides standard test methods for handling shipping cases and crates.
5B5.2.2 Shipping Container Qualification Testing
If the shipping container cannot be qualified by similarity to a previously qualified design, subject the new container design to drop testing from a height consistent with the threat environment (minimum 122 cm (4 ft)) with the COPV installed. The results of these drop tests shall demonstrate that the COPV does not sustain any measurable reduction (outside of a ± 5% nominal baseline tolerance) in burst strength. ASTM D 775–80 provides standard guidelines for drop testing loaded boxes, while ASTM D 4169–90 provides standard guidelines for performance testing of shipping containers and systems.
5B5.2.3 Shipping Container and Environmental Controls
Design the shipping container to protect the COPV from environmental factors that may degrade the performance of the COPV. Seal the COPV in a moisture barrier with an independent port boss seal that protects both the COPV overwrap and the liner from environmental exposure to high humidity environ-ments or from corrosive airborne contaminants during shipping and handling. Desiccants shall be per-mitted, provided the chemical materials are compatible with the COPV overwrap and liner. ASTM D 895–79 provides a standard test method for measuring the water vapor permeability of packages.
Although not required by this ICP, the shipping container may also be equipped with active or passive acceleration and temperature recording devices to monitor the environmental shock conditions and temperature conditions during shipment. In situ health monitoring of shipping containers can be imple-mented with both passive and active devices. Passive monitors include shock–sensitive indicators that unload a configuration of spring-loaded balls or shock-sensitive strips that change color when the indica-tor has been subjected to a shock event. Active monitors include units like the AMP–3000 Shockwriter with the capability of storing up to several hundred events logged over a shipping duration up to 90 days.

5B-12
5B5.2.4 COPV Shipping Carrier Requirements
Use a shipping carrier qualified to ship and handle flight hardware. Specify in the shipping and handling documents the acceptable ranges and limits with respect to shock, impact sensitivity, and temperature. Track the COPV cargo throughout all stages of the shipping process.
5B5.3 COPV Receiving Inspection Requirements
Chart 5B6 illustrates the ICP that shall be implemented with respect to COPV receiving inspection requirements. Implement QA and NDE requirements per the requirements identified in Section 4.2. Handling procedures for receiving inspection depend on the size of the COPV. For small COPV cylin-drical or spherical vessels, accomplish manual handling with 100% QA surveillance using procedures that specify the use of gloves and foam pads to prevent scuffing of the composite overwrapped surface. Large COPVs require lifts and slings to move the COPV. Prevent COPV impact damage procedurally with 100% QA surveillance when using lifts and slings.
QA SurveillancePersonnel Certification
TrainingQualification
Mfg. Logbook
Mfg. NDE Data
Pedigree Review
Environmental DataShock and Temperature Levels
Visual Damage
Shipping Container
Other as RequiredFor Example
IR ThermographyX-ray of Liner
VisualExternal/Internal Inspections
NDE Inspection
Access Controls
Environmental Controls
Bonded Stores
Receiving Inspection Requirements
Shipping Requirements
Manufacturer Impact Control Requirements
Impact Control Plan
Chart 5B6. Receiving inspection ICP requirements.
Perform COPV receiving inspections to assess the integrity of the COPV as received. These inspections shall include a visual inspection of the composite overwrap, a visual inspection of the COPV liner using a borescope, and an X–ray radiographic inspection of the metal liner. The general NDE requirements have been outlined in Section 5B4.2.
5B5.3.1 Review of Pedigree Information
Review pedigree information shipped with the COPV as part of the receiving inspection process to ensure that the COPV meets the program requirements. Review the manufacturer’s NDE data and com-
5B-13
pare it to procurement agency requirements for the COPV and the receiving inspection NDE records. Review the manufacturer’s COPV logbook to determine if any suspect impact damage conditions have been reported.
5B5.3.2 Shipping Container Inspections
Visually inspect the shipping container to determine if there are indications of a drop during shipment. Shipping container damage indications include crushed corners or impact indentations on the external surface. Internally, unusual foam deformation or compaction provide clues of potential damage from shipping container drops.
If the shipping container is equipped with active or passive shock and/or temperature monitors, use data from these units to assess the environmental conditions during shipment of the COPV.
5B5.3.3 Bonded Stores
Store all COPVs not installed on spacecraft or launch vehicle hardware in a Bonded Stores facility with access controls defined by the program QA requirements. The Bonded Stores facilities shall have envi-ronmental controls to maintain the COPV within the required temperature and humidity specifications.
5B5.4 Installation and System–Level Impact Control
Chart 1 illustrates the ICP overview that shall be implemented during the installation and system–level operations of the COPV mounted on the spacecraft hardware or the launch vehicle. Section 4.1 outlines the three basic methodologies that can be used to implement the ICP.
Implement QA and NDE requirements per the requirements identified in Section 5B4.2. COPV handling procedures for the spacecraft or launch vehicle installation and test phase depend on the size of the COPV. For small COPV cylindrical or spherical vessels, accomplish manual handling with 100% QA surveillance using procedures that specify the use of gloves and foam pads to prevent scuffing of the composite overwrapped surface. Large COPVs require lifts and slings to move the COPV. Prevent COPV impact damage procedurally with 100% QA surveillance when using lifts and slings.
5B5.4.1 ICP by Procedure Only
Chart 5B7 illustrates the procedural only ICP option that, if selected, shall be used during the installation and test of the COPV mounted on the spacecraft hardware or the launch vehicle. Implement QA and NDE requirements per the requirements identified in Section 4.2. Handling procedures for installation depend on the size of the COPV. For small COPV cylindrical or spherical vessels, accomplish manual handling using procedures that specify the use of gloves and foam pads to prevent scuffing of the com-posite overwrapped surface. Large COPVs require lifts and slings to move the COPV. Prevent COPV impact damage procedurally when using lifts and slings.

5B-14
Installation & Test Procedure Requirements
QA SurveillancePersonnel Certification
TrainingQualification
Inventoried Tools 100% QA Surveillance
Tethered Tools Scuff Protectors
Proximity Torquing Procedures Periodic Visual Inspections
Authorized & Controlled AccessImpact Caution Signs
Procedures -- Unpressurized COPV
Inventoried Tools 100% QA Surveillance
Tethered Tools Scuff Protectors
Proximity Torquing Procedures Periodic Visual Inspections
Authorized & Controlled AccessHazard Warning Signs
< MEOP/10
Tool Activity Within ProximityRequires Mandatory
Impact Protector Devices
PressurizationApproval Required byJurisdictional Authority
Authorized & Restricted AccessHazard Danger Signs
MEOP/10 < P </= MEOP
Procedures -- Pressurized COPV
Procedural Only
Receiving Inspection Requirements
Shipping Requirements
Manufacturer Impact Control Requirements
Impact Control Plan
Chart 5B7. Installation and system-level pProcedures for Procedural Only ICP.
5B5.4.1.1 Procedures for Unpressurized COPV. ICP procedures for unpressurized COPVs shall require access control and authorization by the jurisdictional authority for personnel to work within close proximity to the COPV and shall be performed with 100% QA surveillance. Display Caution signs near the COPV to make personnel aware of the impact sensitivity. Inventoried and tethered tools shall be required when this work is performed.
Perform torque or leverage tool operations within close proximity to the COPV under procedural control with 100% QA surveillance.
Use scuff–protective materials in the form of high–density Ensolite foam or equivalent to reduce the potential for false impact indications resulting from small tool scuffs and abrasions. Trained and certi-fied NDE inspectors must perform period inspections before the installation of scuff–protective materials and the removal of such materials.
5B5.4.1.2 Procedures for Pressurized COPV. The jurisdictional authority controls and author-izes access for working in close proximity to a pressurized COPV (< MEOP/10). Display Hazard Warn-ing signs near the COPV to warn personnel of the impact sensitivity and the potential burst hazard of the COPV. ICP procedures for COPV pressurized to < MEOP/10 require inventoried and tethered tools.
Perform torque or leverage tool operations within close proximity to the COPV under procedural control with 100% QA surveillance.
Use scuff–protective materials in the form of high–density Ensolite foam or equivalent to reduce the potential for false positive impact indications resulting from small tool scuffs and abrasions. Trained and

5B-15
certified NDE inspectors shall perform period inspections before the installation of scuff–protective materials and after the removal of such materials.
Pressurizing a COPV from MEOP/10 to MEOP or above requires authorization by the jurisdictional authority and restricted personnel access. Display Hazard Danger signs near the COPV to warn person-nel of impact sensitivity and the potential for catastrophic burst. In addition, any tool activity performed within proximity to the pressurized COPV shall require mandatory impact protector devices to be used.
5B5.4.2 ICP Implemented With Impact Indicators
Chart 5B8 illustrates the impact indicator ICP option that, if selected, shall be implemented during the installation and test of the COPV mounted on the spacecraft hardware or the launch vehicle. Implement QA and NDE requirements per the requirements identified in Section 4.2. Handling procedures for installation depend on the size of the COPV. For small COPV cylindrical or spherical vessels, accom-plish manual handling using procedures that specify the use of gloves and foam pads to prevent scuffing of the composite overwrapped surface. Large COPVs require lifts and slings to move the COPV. Pre-vent COPV impact damage procedurally when using lifts and slings.
Installation & Test Procedure Requirements
QA SurveillancePersonnel Certification
TrainingQualification
Inventoried Tools Periodic QA Surveillance
Tethered Tools Deploy Indicator
Proximity Torquing Procedures Periodic Visual Inspections
Authorized & Controlled AccessImpact Caution Signs
Procedures -- Unpressurized COPV
Inventoried Tools Periodic QA Surveillance
Tethered Tools Deploy Indicator
Proximity Torquing Procedures Periodic Visual Inspections
Authorized & Controlled AccessHazard Warning Signs
< MEOP/10
Tool Activity Within ProximityRequires Mandatory
Impactor Protector Devices
PressurizationApproval Required byJurisdictional Authority
Authorized & Restricted AccessHazard Danger Signs
MEOP/10 < P </= MEOP
Procedures -- Pressurized COPV
Impact IndicatorsActive or Passive
Receiving Inspection Requirements
Shipping Requirements
Manufacturer Impact Control Requirements
Impact Control Plan
Chart 5B8. Installation and system–level procedure for using Impact Indicators ICP.
5B5.4.2.1 Design Requirements for Impact Indicators. Impact indicators shall be capable of detecting any impact condition that could result in a 5% or greater degradation of COPV nominal burst strength. Piezoresistive film, commonly used as strain and force sensors, sandwiched between two

5B-16
0.63–cm (0.25–in.)-thick high-density Ensolite foam layers, provides an excellent active impact indicator with impact force discrimination. By using an electrical comparator circuit on the active indicator, a threshold can be set to respond only to detrimental impacts and to ignore all low-energy events.
Other types of passive indicators include bubble dye wraps, pressure–sensitive films, deformable covers (e.g., metal honeycomb and polystyrene foam), and thin Plexiglas or glass covers. The passive indicators shall have the means for discriminating detrimental impacts from low energy events (tapping, touching, scuffing) that will not compromise the burst strength of the COPV.
5B5.4.2.2 Procedures for Unpressurized COPV
The jurisdictional authority controls access to and authorizes ICP procedures for unpressurized COPVs using impact indicators to work within close proximity to the COPV. Display Caution signs near the COPV to make personnel aware of the impact sensitivity. Require inventoried and tethered tools when this work is performed as a prudent means of avoiding impact situations that require disposition. Per-form periodic QA surveillance to monitor the impact indicators.
Perform torque or leverage tool operations within close proximity to the COPV under procedural control with 100% QA surveillance.
Use scuff–protective materials in the form of high–density Ensolite foam used with an impact indicator to reduce the potential for false impact indications. Trained and certified NDE inspectors shall perform period inspections before the installation of the impact indicator device and after the removal of such materials. Install any impact indicator devices with protective high–density Ensolite foam to preclude any scuff or abrasion marks that may have to be analyzed as suspect impact conditions.
5B5.4.2.3 Procedures for Pressurized COPV
The jurisdictional authority controls and authorizes access control for working in close proximity to a COPV pressurized below MEOP (< MEOP/10). Display Hazard Warning signs near the COPV to warn personnel of the impact sensitivity and the potential burst hazard of the COPV. ICP procedures for COPV pressurized to < MEOP/10 shall require inventoried and tethered tools even with the use of an impact indicator.
Perform torque or leverage tool operations within close proximity to the COPV under procedural control with 100% QA surveillance.
Use scuff–protective materials in the form of high–density Ensolite foam (either used directly as part of the impact indicator or as additional scuff protection measures) to reduce the potential for false impact indications. Trained and certified NDE inspectors shall perform period inspections before the installa-tion of scuff–protective materials and after the removal thereof.
Pressurizing a COPV from MEOP/10 to MEOP or above requires authorization by the jurisdictional authority and restricted personnel access. Display Hazard Danger signs near the COPV to warn person-nel of impact sensitivity and the potential for catastrophic burst. In addition, use mandatory impact protector devices to perform any tool activity within proximity to the pressurized COPV.

5B-17
5B5.4.3 ICP Implemented With Impact Protectors
Chart 5B9 illustrates the impact protector ICP option that, if selected, shall be implemented during the installation and system–level operations of the COPV mounted on the spacecraft hardware or the launch vehicle. Implement QA and NDE requirements per the requirements identified in Section 5B4.2. Han-dling procedures for installation depend on the size of the COPV. For small COPV cylindrical or spheri-cal vessels, accomplish manual handling using procedures that specify the use of gloves and foam pads to prevent scuffing of the composite overwrapped surface. Large COPVs require lifts and slings to move the COPV. Prevent COPV impact damage procedurally when using lifts and slings.
Installation & Test Procedure Requirements
QA SurveillancePersonnel Certification
TrainingQualification
Minimal QA SurveillanceInstallation/Removal of Cover
Visual InspectionInstallation/Removal of Cover
Authorized & Controlled AccessImpact Caution Signs
Procedures -- Unpressurized COPV
Minimal QA SurveillanceInstallation/Removal of Cover
Visual InspectionInstallation/Removal of Cover
Authorized & Controlled AccessHarzard Warning Signs
< MEOP/10
Tool Activity Within ProximityRequires Mandatory
Impact Protector Devices
PressurizationApproval Required byJurisdictional Authority
Authorized & Restricted AccessHazard Danger Signs
MEOP/10 < P </= MEOP
Procedures -- Pressurized COPV
Impact Protectors
Receiving Inspection Requirements
Shipping Requirements
Manufacturer Impact Control Requirements
Impact Control Plan
Chart 5B9. Installation and system–level procedures for using Impact Protector ICP.
5B5.4.3.1 Design Requirements for Impact Protectors. Impact protectors shall be capable of shielding a COPV from impact damage consistent with the threat environment or at least up to the load limits for the integral boss and mounting fixtures. An impact inflicting any damage that potentially degrades the burst strength of the COPV more than 5% from its nominal burst pressure is unacceptable.
The minimum design cross–section of an impact protector cover shall include the shielding layers de-picted in Figure 5B1. The indentation damage from a credible impact shall be completely absorbed by a hardshell fabricated from fiberglass epoxy, Kevlar epoxy, or equivalent material that is sufficiently thick to absorb the indentation energy without penetration. Mitigate potential deflection damage by spreading the peak loading transmitted through the hardshell over an area consistent with the dimensions of the COPV. Further mitigate deflection damage by introducing an energy-absorbing material between the hardshell and the COPV. Aluminum mesh foam (20 pores per inch, 0.5-in. thick), manufactured by ERG
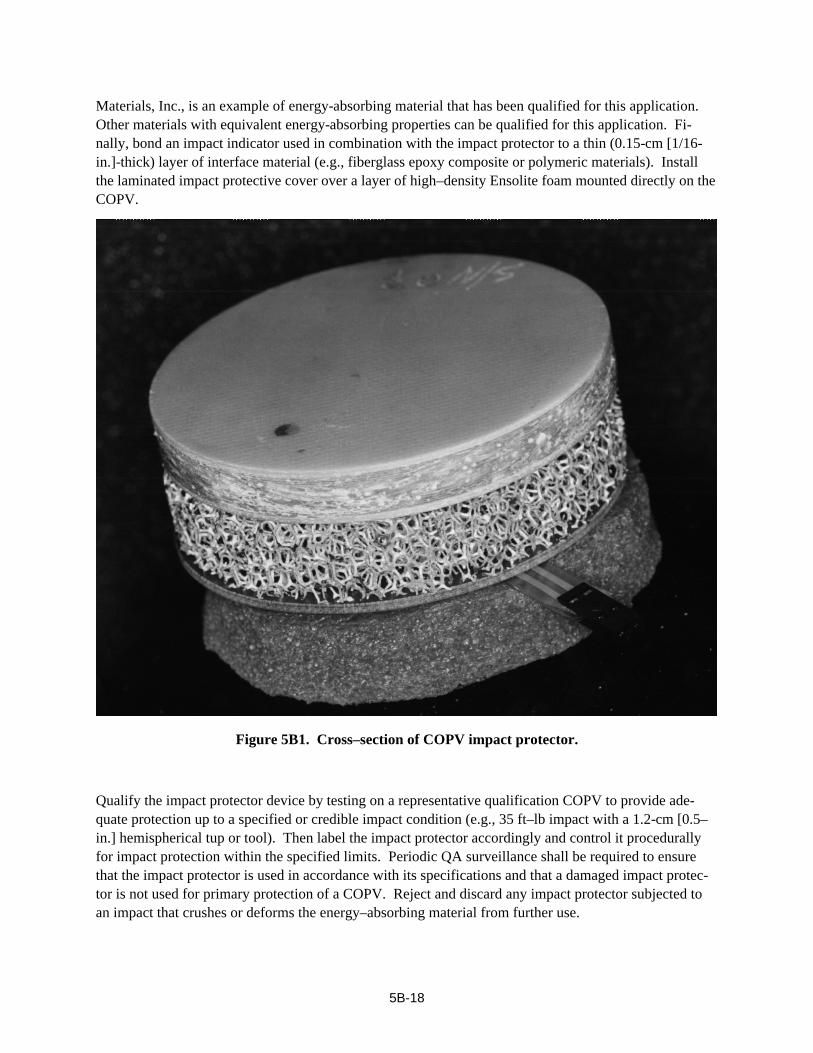
5B-18
Materials, Inc., is an example of energy-absorbing material that has been qualified for this application. Other materials with equivalent energy-absorbing properties can be qualified for this application. Fi-nally, bond an impact indicator used in combination with the impact protector to a thin (0.15-cm [1/16-in.]-thick) layer of interface material (e.g., fiberglass epoxy composite or polymeric materials). Install the laminated impact protective cover over a layer of high–density Ensolite foam mounted directly on the COPV.
Figure 5B1. Cross–section of COPV impact protector.
Qualify the impact protector device by testing on a representative qualification COPV to provide ade-quate protection up to a specified or credible impact condition (e.g., 35 ft–lb impact with a 1.2-cm [0.5–in.] hemispherical tup or tool). Then label the impact protector accordingly and control it procedurally for impact protection within the specified limits. Periodic QA surveillance shall be required to ensure that the impact protector is used in accordance with its specifications and that a damaged impact protec-tor is not used for primary protection of a COPV. Reject and discard any impact protector subjected to an impact that crushes or deforms the energy–absorbing material from further use.
5B-19
5B5.4.3.2 Procedures for Unpressurized COPV. ICP procedures for unpressurized COPV using impact protectors shall require controlled access authorized by the jurisdictional authority to work within close proximity to the COPV. Display Caution signs near the COPV to make personnel aware of the impact sensitivity and to use the impact protective covers.
Perform periodic QA surveillance to monitor that the impact protectors are being used.
Install an impact protector device with scuff-protective high-density Ensolite foam to preclude any scuff or abrasion marks that may be mistakenly identified as a suspect impact discontinuity. Trained and certified NDE inspectors shall perform period inspections before the installation of the impact protector device and after the removal of such materials.
5B5.4.3.3 Procedures for Pressurized COPV. The jurisdictional authority controls and author-izes access control for working in close proximity to a COPV pressurized below MEOP (sub–MEOP). Display Hazard Warning signs near the COPV to warn personnel of the impact sensitivity and the poten-tial burst hazard of the COPV.
Use scuff–protective materials in the form of high-density Ensolite foam (either used directly as part of the impact protector or as additional scuff protection measures) to reduce the potential for false impact indications. Trained and certified NDE inspectors shall perform period inspections before the installa-tion of scuff–protective materials and after the removal thereof.
The jurisdictional authority must authorize pressurization of a COPV from MEOP/10 to MEOP or above, and personnel access shall be restricted. Display Hazard Danger signs near the COPV to warn personnel of impact sensitivity and the potential for catastrophic burst. In addition, use mandatory impact protector devices to perform any tool activity within proximity to the pressurized COPV.

6-1
Chapter 6 Test Report, USAF/COPV Program Subtask 3.4: Sustained Load/Impact Effect Testing of Graphite/Epoxy Composite Over-
wrapped Pressure Vessels
(originally published as TR-807-001)
Abstract WSTF performed several subtasks of the Enhanced Technology for COPVs Program, including testing baseline structural strength, failure mode and safe-life, impact damage tolerance, and materials compati-bility (Subtasks 3.1, 3.2, 3.3, and 3.6, respectively) to contribute to the COPV database extension objec-tive of Task 3.0. Testing was supplemented by an ongoing exploration of NDE techniques and analytical methods. Sustained load/impact effect testing, Subtask 3.4 of the program, addresses safety concerns regarding COPVs already built and in operation by investigating the effects of continued service, simu-lated by long-term pressurized storage, on impact-damaged vessels. This report describes the facilities and systems designed and implemented at WSTF to accomplish this testing and presents the data gener-ated. No strength degradation was found to be attributable to the six-month sustained loading period. As a result, a three-year testing phase is currently in progress to generate longer-term data.
6.1 Introduction
Gr/Ep COPVs offer high strength-to-weight ratios relative to conventional vessels and are increasingly employed for pressurant and propellant containment. However, the inherent analytical complexity of anisotropic materials in general, coupled with the demonstrated structural sensitivity of Gr/Ep structures to low-velocity impact-induced damage, create a very real potential for loss of mission, facility, and life from the potential consequences of catastrophic vessel failure at pressure.
The Enhanced Technology for COPVs Program, funded by the United States Air Force and NASA and technically managed by the Aerospace Corporation, was established to:
• Identify and evaluate critical parameters in the design, analysis, testing, and operation of spaceflight COPVs to formulate safety requirements for already-built COPVs.
• Establish material requirements, manufacturing parameters, and NDE techniques to enhance the safety and reliability of future COPVs.
• Investigate practical approaches to improve performance and cost-effectiveness of COPVs in space systems.
• Provide inputs into the revision of MIL-STD-1522 (1986).
WSTF performed testing for several phases of this program, including baseline structural strength, im-pact effects, and materials compatibility, during which the utility of various NDE techniques was as-sessed and trend analyses were performed.
This report focuses on sustained load/impact effect testing, Subtask 3.4 of the Enhanced Technology for Composite Overwrapped Pressure Vessels Program Plan, Rev. D (Chang et al. 1993). It addresses safety concerns regarding COPVs already built and in operation by investigating the effects of continued ser-vice, simulated by long-term pressurized storage, on impact-damaged vessels. Data generated by this

6-2
testing will be integrated with that from Subtask 3.1 Structural Strength Testing and Subtask 3.3 Impact Effect Testing to contribute to the overall empirical COPV information database extension objective of Task 3.0. The reader is referred to the Subtask 3.3 Technical Memorandum11 for additional details.
6.2 Objective
Subtask 3.4 seeks to determine the effects of long-term pressurized storage on impact-damaged COPVs. We will compare results to COPVs tested without the sustained loading period for Subtask 3.3 under otherwise identical conditions.
6.3 Approach
Table 6-1 lists pertinent qualities of each vessel. Figure 6-1 shows the four COPV types tested.
In general, we followed the approach outlined in TP-WSTF-807, except that we reduced the quantity of vessels tested. Manufacturers supplied a component pedigree for each vessel, including traceability documentation for all overwrap and liner materials and fabrication processes. This information is in-cluded in the data file for each vessel and is archived at WSTF.
We performed pretest radiographic, IR thermographic, and visual inspections to identify any flaws or anomalies in a vessel’s overwrap and liner that may have been created during manufacturing or shipping.
Table 6-1. COPV Test Article Information
10.25 in. dia Spherical 6.6 in. dia x 20 in. long Cylindrical
13 in. dia x 25 in. long Cylindrical 19 in. dia Spherical
Manufacturer Lincoln Composites SCIa SCI Ardé, Inc.
Liner Material 5086 aluminum alloy 6061-T62 aluminum alloy
6061-T62 aluminum alloy
Cryostretched 301 CRES steel
Liner Thickness 0.050 in. (0.13 cm) 0.040 in. (0.10 cm) 0.040 in. (0.10 cm) 0.033 in. (0.084 cm)
Overwrap Fiber T-40 graphite T-1000 graphite T-1000 graphite IM-7 graphite
Overwrap Thickness
0.162 in. (0.41 cm) 0.104 in. (0.26 cm) 0.147 in. (0.37 cm) 0.168 in. (0.43 cm)
MEOPb 6000 psi (41.4 MPa) 6000 psi (41.4 MPa) 4500 psi (31.0 MPa) 4500 psi (31.0 MPa)
Baseline Burst Pressure
10,600c psi (73.1 MPa) 10,700c psi (73.8 MPa) 7850d psi (54.1 MPa) 7280e psi (50.2 MPa)
a Structural Composites Industries, Inc.
b Maximum Expected Operating Pressure c Average of two WSTF and one manufacturer’s burst tests d Average of one WSTF and one manufacturer’s burst tests e Manufacturer’s data
11 Keddy, C. P., W. L. Ross, R. M. Tapphorn, and H. D. Beeson. USAF/COPV Program Subtask 3.3: Graph-ite/Epoxy COPV Impact Damage Testing Database Extension. TR-936-001. NASA Johnson Space Center White Sands Test Facility, Las Cruces, NM, Publication in Process.

6-3
Figure 6-1. COPV types used for Subtask 3.4 testing.
Impact damage was applied to the undamaged vessels per the test matrix shown in Table 6-2, using a Dynatup Model 8250 drop-tower-type instrumented mechanical impact tester. We varied the initial height and mass of the impactor to achieve desired impact energy levels. A load cell in the impactor was sampled at a high rate to produce a load-time history of the impact events from which the evolutions of other variables (energy absorbed, deflection, etc.) were derived. As per standard program practice, each vessel was securely mounted by its end bosses for its impact event.
Post-impact inspection included ultrasonic (A-scan), IR thermographic, eddy current (where applicable), and visual examination around the impact location. We took a 3X magnification photograph of the impacted region for each COPV.
Following inspection, we installed each vessel in its blast enclosure at the sustained load test facility and hydrostatically pressurized it to its MEOP for the duration of the sustained loading period. We checked internal pressure weekly, and performed periodic adjustments as required. We also checked impact sites for major changes.

6-4
We performed post-sustained loading NDE inspections to compare with those done before sustained loading. Although crack extension was common, we didn’t take post-sustained load photographs for most vessels because of their similarity to pre-sustained load images.
Finally, we performed hydrostatic burst testing on each vessel to determine strength reduction from the undamaged vessel average, previously determined by Subtask 3.1 testing. Per standard program practice, internal pressure was increased at a nominal rate, pausing briefly at MEOP, until catastrophic vessel failure or insurmountable leakage occurred.
Table 6-2. Impact Test Matrix
COPV Impact Conditions Quantity
10.25 in. dia Spherical
Energy:
Impactor:
Location:
Pressure condition:
35 ft-lbf (47.5 J)
0.5 in. (1.27 cm) dia Hemispherical
45-degree membrane region
Unpressurized (at ambient)
3
6.6 in. dia x 20 in. long Cylindrical
Energy:
Impactor:
Location:
Pressure condition:
15 ft-lbf (20.3 J)
0.5 in. (1.27 cm) dia Hemispherical
Hoop region
6000 psi (41.4 MPa) hydrostatic
3
13 in. dia x 25 in. long Cylindrical
Energy:
Impactor:
Location:
Pressure condition:
35 ft-lbf (47.5 J)
0.5 in. (1.27 cm) dia Hemispherical
Hoop region
4500 psi (31.0 MPa) hydrostatic
2
19 in. dia Spherical
Energy:
Impactor:
Location:
Pressure condition:
100 ft-lbf (136 J)
0.5 in. (1.27 cm) dia Hemispherical
45-degree membrane region
4725 psi (32.6 MPa) pneumatic
2
19 in. dia Spherical
Energy:
Impactor:
Location:
Pressure condition:
100 ft-lbf (136 J)
0.5 in. (1.27 cm) dia Hemispherical
45-degree membrane region
Unpressurized (at ambient)
2
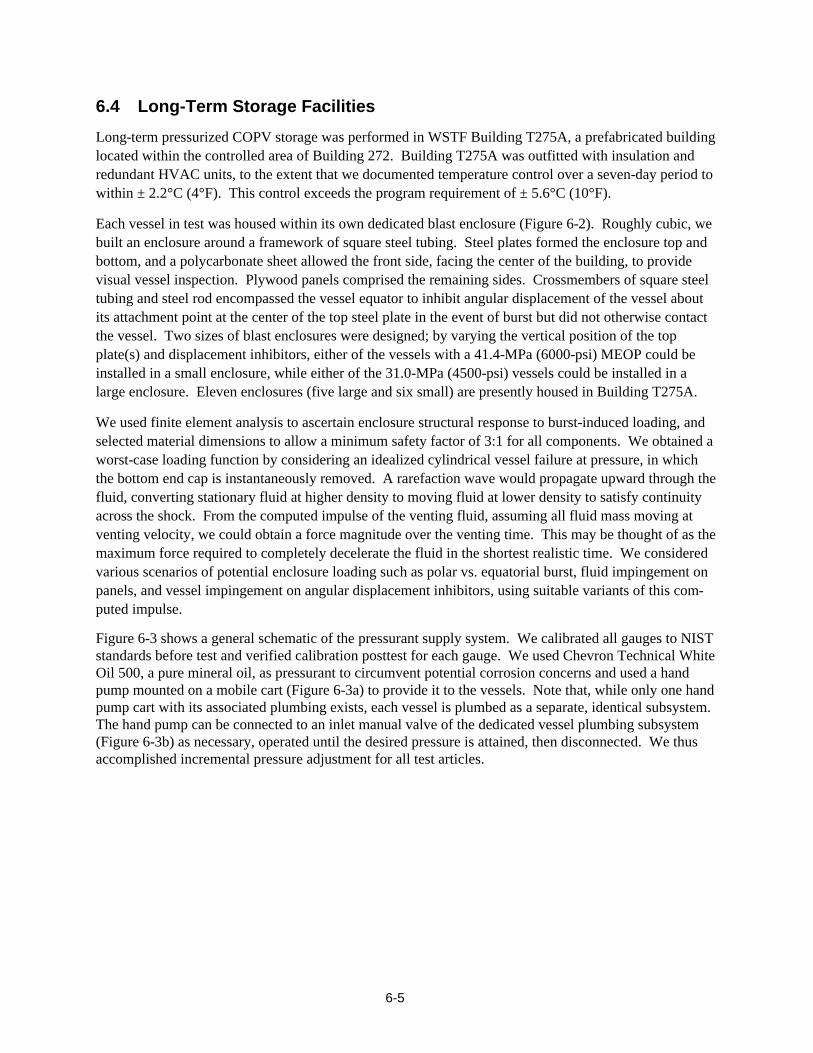
6-5
6.4 Long-Term Storage Facilities
Long-term pressurized COPV storage was performed in WSTF Building T275A, a prefabricated building located within the controlled area of Building 272. Building T275A was outfitted with insulation and redundant HVAC units, to the extent that we documented temperature control over a seven-day period to within ± 2.2°C (4°F). This control exceeds the program requirement of ± 5.6°C (10°F).
Each vessel in test was housed within its own dedicated blast enclosure (Figure 6-2). Roughly cubic, we built an enclosure around a framework of square steel tubing. Steel plates formed the enclosure top and bottom, and a polycarbonate sheet allowed the front side, facing the center of the building, to provide visual vessel inspection. Plywood panels comprised the remaining sides. Crossmembers of square steel tubing and steel rod encompassed the vessel equator to inhibit angular displacement of the vessel about its attachment point at the center of the top steel plate in the event of burst but did not otherwise contact the vessel. Two sizes of blast enclosures were designed; by varying the vertical position of the top plate(s) and displacement inhibitors, either of the vessels with a 41.4-MPa (6000-psi) MEOP could be installed in a small enclosure, while either of the 31.0-MPa (4500-psi) vessels could be installed in a large enclosure. Eleven enclosures (five large and six small) are presently housed in Building T275A.
We used finite element analysis to ascertain enclosure structural response to burst-induced loading, and selected material dimensions to allow a minimum safety factor of 3:1 for all components. We obtained a worst-case loading function by considering an idealized cylindrical vessel failure at pressure, in which the bottom end cap is instantaneously removed. A rarefaction wave would propagate upward through the fluid, converting stationary fluid at higher density to moving fluid at lower density to satisfy continuity across the shock. From the computed impulse of the venting fluid, assuming all fluid mass moving at venting velocity, we could obtain a force magnitude over the venting time. This may be thought of as the maximum force required to completely decelerate the fluid in the shortest realistic time. We considered various scenarios of potential enclosure loading such as polar vs. equatorial burst, fluid impingement on panels, and vessel impingement on angular displacement inhibitors, using suitable variants of this com-puted impulse.
Figure 6-3 shows a general schematic of the pressurant supply system. We calibrated all gauges to NIST standards before test and verified calibration posttest for each gauge. We used Chevron Technical White Oil 500, a pure mineral oil, as pressurant to circumvent potential corrosion concerns and used a hand pump mounted on a mobile cart (Figure 6-3a) to provide it to the vessels. Note that, while only one hand pump cart with its associated plumbing exists, each vessel is plumbed as a separate, identical subsystem. The hand pump can be connected to an inlet manual valve of the dedicated vessel plumbing subsystem (Figure 6-3b) as necessary, operated until the desired pressure is attained, then disconnected. We thus accomplished incremental pressure adjustment for all test articles.

6-6
Figure 6-2. Typical blast enclosure for Subtask 3.4 testing with 19-in. spherical COPV installed.

6-7
(a) (b)
Figure 3. (a) Hand pump and associated plumbing (b) vessel plumbing subsystem.
6.5 Results and Discussion
No COPV failed or leaked during its six-month sustained hydrostatic loading period. Although several power outages occurred over the test period, the combination of procedural controls and robust insulation of the test facility maintained the required ambient temperature range. Appendix 6A gives detailed results, including impact, inspection, and burst test results are given for each vessel tested. Table 6-3 lists burst test results, with comparisons to identically impacted Subtask 3.3 test articles. Figure 6-4 is a graphical representation of this information.
Though the data set is small, it was readily apparent that the six-month sustained loading period did not degrade COPV burst strength beyond that expected from the application of impact damage alone.
Circumferential strain induced by the internal radial pressure load separated the ends of fibers broken by the impactor and raised the cantilevered delaminated regions slightly from the surface. These effects are shown in Figures 6-5 through 6-8, before-and-after photographs of the impacted 45-deg membrane region of a large sphere and the hoop region of a small cylinder, respectively.
We also found that the sustained loading period produced a change in the images produced by IR ther-mographic inspection. Figure 6-9 compares notable before-and-after images; these images use 1.5-in.-long copper strips as fiduciary markers. Generally, regions of surface ply delamination exhibit increased detectability because of the aforementioned cantilever action on the regions of complete ply separation and the induced homogeneity of the liner in the impacted region by internal pressure-induced deformation.
FLUID
COPV

6-8
Table 6-3 Burst Test Results
Subtask 3.4 COPVs Subtask 3.3 COPVs
COPV (Impact Condition) S/N Burst Pressure Average Burst Pressure
Average Burst Pressure
109 8397 psi
(57.90 MPa)
131 7543 psi
(52.01 MPa)
10.25 in. dia Spherical
(35 ft-lbf, unpressurized)
140 8368 psi
(57.70 MPa)
8103 psi
(55.87 MPa)
7819 psi
(53.91 MPa)a
040 8309 psi
(57.29 MPa)
042 7368 psi
(50.80 MPa)
6.6 in. dia x 20 in. long Cylindrical
(15 ft-lbf, 6000 psi hydrostatic)
056 8791 psi
(60.61 MPa)
8156 psi
(56.23 MPa)
8134 psi
(56.08 MPa)b
003 6281 psi
(43.31 MPa)
13 in. dia x 25 in. long Cylindrical
(35 ft-lbf, 4500 psi hydrostatic)
007 5877 psi
(40.52 MPa)
6079 psi
(41.91 MPa)
6010 psi
(41.44 MPa)c
013 5987 psi
(41.28 MPa)
19 in. dia Spherical
(100 ft-lbf, 4725 psi pneumatic)
014 6235 psi
(42.99 MPa)
6111 psi
(42.13 MPa)
6228 psi
(42.94 MPa)c
015 6294 psi
(43.40 MPa)
19 in. dia Spherical
(100 ft-lbf, unpressurized)
018 6941 psi
(47.86 MPa)
6618 psi
(45.63 MPa)
6256 psi
(43.13 MPa)c
a Six data points b Three data points c One data point

6-9
Figure 6-4. Effect of sustained loading on burst strength of impact-damaged COPVs.
Visual inspection of impacted regions after sustained loading found that, for several vessels, the extent of matrix cracking and damaged fiber liftoff were notably larger than before sustained loading. Note that although significant crack extension was observed, there was no corresponding reduction in strength compared to that of vessels impacted only. This implies that the contribution of the matrix to the sharing of the overwrap circumferential tension load in COPVs is negligible, and overall strength reduction is a function of the quantity of fibers damaged by an impact event and remains essentially unchanged by the application of internal pressure over six months.
Through-the-thickness ultrasonic pulse-echo inspection was ineffective in detecting changes caused by the sustained loading. In those cases where linear cracking extents were visually detectable, we noted little change in ultrasonic indication, probably because of the limitation in resolution by the relatively bulky transducer used.
Post-sustained loading eddy current inspections yielded no detectable area of liner deformation since internal MEOP would readily deform the liner to the spherical geometry of the overwrap.
55
60
65
70
75
80
90
95
100
RE
SID
UA
L S
TRE
NG
TH (%
)
IMPACT ONLY IMPACT + 6-MONTH SUSTAINED LOADING
6.6 in. dia x 20 in. long cylinders
13 in. dia x 25 in. long cylinders
19 in. dia spheres
(pneumatic impact)
10.25 in. dia spheres
19 in. dia spheres (unpressurized)

6-10
6.6 Conclusions and Recommendations
We held impact-damaged COPVs at their respective MEOPs for six months and then burst-tested them. We then compared the burst test results to the baseline data for comparable damaged vessels burst imme-diately after normal post-impact NDE operations. Based on these results, the following conclusions and recommendations were reached:
• Six months of sustained internal pressure produced no additional degradation of residual strength in the impact-damaged COPVs tested.
• During the six months at sustained load, impact damage sites showed a detectable increase in both visible and IR thermographic indication propagation.
• For the large spherical COPV, there appeared to be no difference whether impacted in the pressur-ized or unpressurized condition.
We recommend that the effects of longer-term sustained load and post-sustained load cycling both need to be addressed. Both longer-term (3-year) and cycling effects are being addressed in a current ongoing program phase.
Figure 6-5. Impacted region of 19-in. spherical COPV (S/N 015), before sustained loading (approximately 3X magnification).

6-11
Figure 6-6. Impacted region of 19-in. spherical COPV (S/N 015), after sustained loading, showing crack growth (approximately 3X magnification).
Figure 6-7. Impacted region of 6.6-in.-dia × 20-in.-long cylindrical COPV (S/N 042), before sustained loading (approximately 3X magnification).

6-12
Figure 6-8. Impacted region of 6.6-in.-dia × 20-in.-long cylindrical COPV (S/N 042), after sus-tained loading, showing liftoff of delaminated band (approximately 3X magnification).
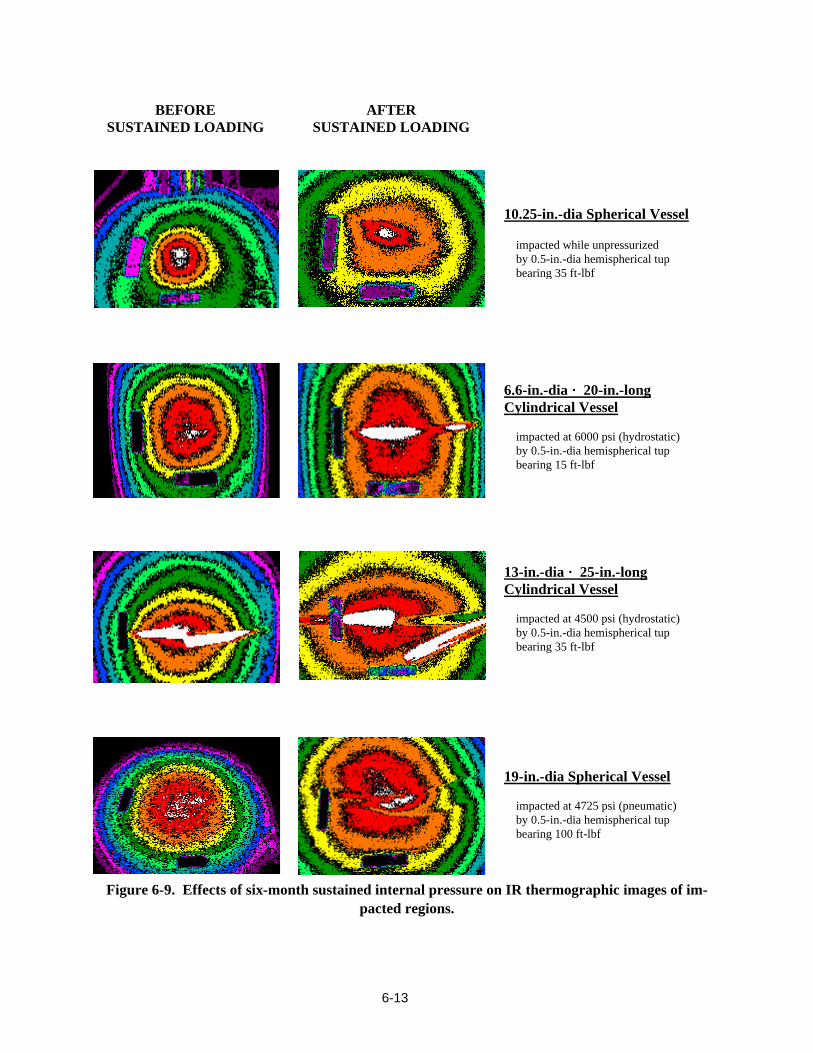
6-13
Figure 6-9. Effects of six-month sustained internal pressure on IR thermographic images of im-pacted regions.
BEFORE SUSTAINED LOADING
AFTER SUSTAINED LOADING
10.25-in.-dia Spherical Vessel
impacted while unpressurized by 0.5-in.-dia hemispherical tup bearing 35 ft-lbf
6.6-in.-dia × 20-in.-long Cylindrical Vessel
impacted at 6000 psi (hydrostatic) by 0.5-in.-dia hemispherical tup bearing 15 ft-lbf
13-in.-dia × 25-in.-long Cylindrical Vessel
impacted at 4500 psi (hydrostatic) by 0.5-in.-dia hemispherical tup bearing 35 ft-lbf
19-in.-dia Spherical Vessel
impacted at 4725 psi (pneumatic) by 0.5-in.-dia hemispherical tup bearing 100 ft-lbf
6-14
References Chang, J. B., L. A. Bailey, H. D. Beeson, M. R. Cain, S. T. Chiu, E. C. Johnson, D. R. Langley, W.L.
Ross, G. L. Steckel, and W. M. Zelinsky. Enhanced Technology for Composite Overwrapped Pres-sure Vessels Program Plan. Los Angeles, CA: Space and Missile Systems Center, 1993.
MIL-STD-1522A. Standard General Requirements for Safe Design and Operation of Pressurized Mis-siles and Space Systems. USAF, 1986.

Appendix 6A
Vessel-Specific Information

6A-1
Lincoln Composites P/N 220088-1 S/N 109 WSTF # 93-27549 A 10.25-in.-dia spherical graphite/epoxy composite overwrapped pressure vessel
SUBTASK 3.4 FINAL REPORT APPENDIX: VESSEL-SPECIFIC INFORMATION
IMPACT CONDITIONS: Nominal impact energy: 47.5 J (35 ft-lb) Impactor weight / drop height: 7.368 kg from 0.660 m (16.21 lbm from 26.0 in.) Impactor: 1.27 cm (0.5 in.) diameter hemispherical Internal COPV pressure: ambient Impact location: 29.2 cm (11.5”) down from base of inlet boss (45° membrane region) IMPACT DATA:
0
200
400
600
800
1000
1200
1400
1600
0 2 4 6 8 10 12
TIME (ms)
LO
AD
(lb
f)
0
5
10
15
20
25
30
35
40
AB
SO
RB
ED
EN
ER
GY
(ft-lbf)
LOAD ENERGY
Impact energy: 46.00 J (33.93 ft-lbf) Impact velocity: 3.539 m/s (11.61 ft/s) Maximum load: 6.044 kN (1,359 lbf) Energy to maximum load: 46.76 J (34.49 ft-lbf) Time to maximum load: 5.57 ms Deflection at maximum load: 1.1 cm (0.43 in.) Velocity slowdown at maximum load: 101.8 % Total absorbed energy: 38.61 J (28.48 ft-lbf)
INSPECTIONS:
After impact, before sustained loading: An indentation with associated cracking and tow detachment was visible at the impact site. Affected areas as ascertained by NDE methods are as fol-lows:
IR thermographic 17 cm2 (2.7 in2) Ultrasonic (A-scan) 44 cm2 (6.8 in2) Eddy current 19 cm2 (2.9 in2)
After sustained loading:
No significant propagation of damage was noted. IR thermographic 3.9 cm2 (0.6 in2) Ultrasonic (A-scan) 29 cm2 (4.5 in2)
BURST TEST DATA:
0
1000
2000
3000
4000
5000
6000
7000
8000
9000
10000
0 50 100 150 200 250
TIME (sec)
PR
ES
SU
RE
(p
sig
)
(227 s, 8397 psig)
Burst pressure: 57.90 MPa (8,397 psi) Strength degradation
from undamaged vessel average of 73.1 MPa (10,600 psi): 20.8% from impacted vessel average of 53.9 MPa (7,819 psi): none

6A-2
Lincoln Composites P/N 220088-1 S/N 131 WSTF # 93-27570 A 10.25-in.dia spherical graphite/epoxy composite overwrapped pressure vessel
SUBTASK 3.4 FINAL REPORT APPENDIX: VESSEL-SPECIFIC INFORMATION
IMPACT CONDITIONS: Nominal impact energy: 47.5 J (35 ft-lb) Impactor weight / drop height: 7.368 kg from 0.663 m (16.21 lbm from 26.1 in.) Impactor: 1.27 cm (0.5 in.) diameter hemispherical Internal COPV pressure: ambient Impact location: 29.2 cm (11.5”) down from base of inlet boss (45° membrane region) IMPACT DATA:
0
200
400
600
800
1000
1200
1400
0 2 4 6 8 10 12
TIME (ms)
LOA
D (l
bf)
0
5
10
15
20
25
30
35
40
AB
SO
RB
ED
EN
ER
GY
(ft-lbf)
LOAD ENERGY
Impact energy: 45.77 J (33.76 ft-lbf) Impact velocity: 3.530 m/s (11.58 ft/s) Maximum load: 5.900 kN (1,326 lbf) Energy to maximum load: 46.14 J (34.03 ft-lbf) Time to maximum load: 5.02 ms Deflection at maximum load: 1.0 cm (0.41 in.) Velocity slowdown at maximum load: 90.91 % Total absorbed energy: 40.02 J (29.52 ft-lbf)
INSPECTIONS:
After impact, before sustained loading: An indentation with associated cracking and tow detachment was readily visible at the impact site. Affected areas as ascertained by NDE methods are as follows:
IR thermographic 20 cm2 (3.1 in2) Ultrasonic (A-scan) 32 cm2 (4.9 in2) Eddy current 19 cm2 (2.9 in2)
After sustained loading:
Significant propagation of matrix cracking was noted, and a tendency to lift off from the vessel surface was observed in several broken strands. The pre-sustained load radial symmetry of the IR thermogram was replaced with a highly elliptical indication closely matching the observed delaminated region.
IR thermographic 6 cm2 (0.9 in2) Ultrasonic (A-scan) 32 cm2 (4.9 in2)
BURST TEST DATA:
0
1000
2000
3000
4000
5000
6000
7000
8000
9000
0 50 100 150 200 250
TIME (sec)
PR
ES
SU
RE
(p
sig
)
(210 s, 7543 psig)
Burst pressure: 52.01 MPa (7,543 psi) Strength degradation
from undamaged vessel average of 73.1 MPa (10,600 psi): 28.8% from impacted vessel average of 53.9 MPa (7,819 psi): 3.5%
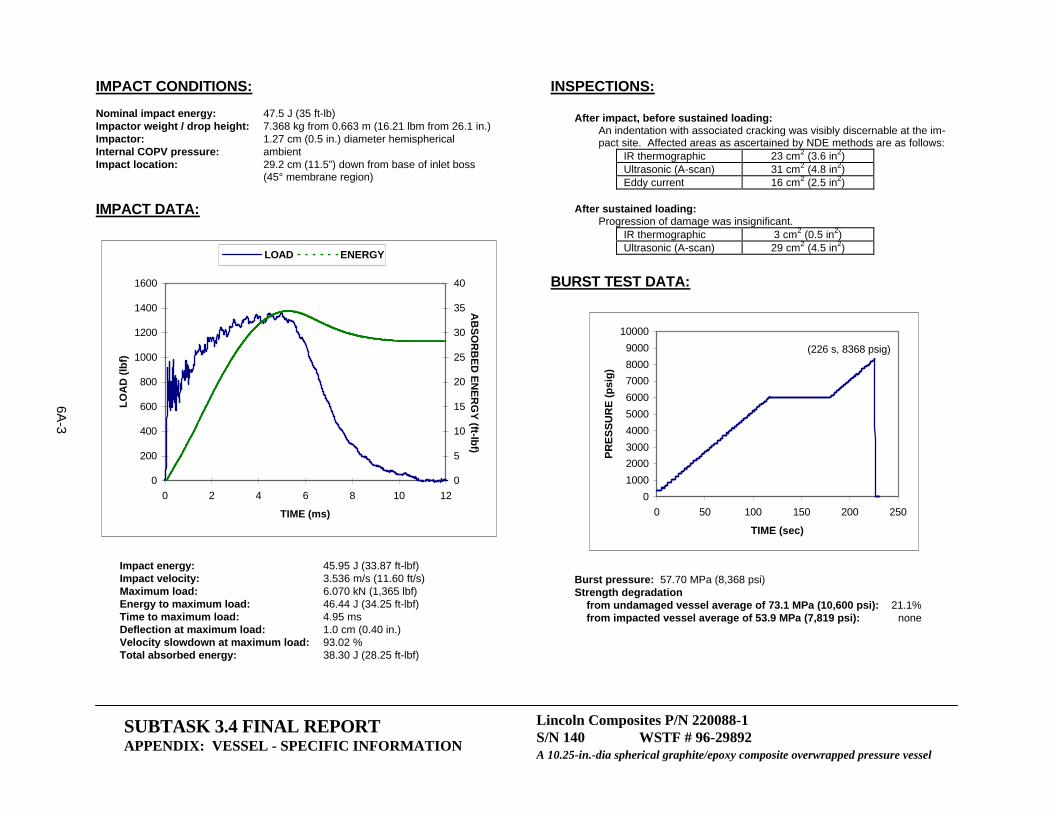
6A-3
Lincoln Composites P/N 220088-1 S/N 140 WSTF # 96-29892 A 10.25-in.-dia spherical graphite/epoxy composite overwrapped pressure vessel
SUBTASK 3.4 FINAL REPORT APPENDIX: VESSEL - SPECIFIC INFORMATION
IMPACT CONDITIONS: Nominal impact energy: 47.5 J (35 ft-lb) Impactor weight / drop height: 7.368 kg from 0.663 m (16.21 lbm from 26.1 in.) Impactor: 1.27 cm (0.5 in.) diameter hemispherical Internal COPV pressure: ambient Impact location: 29.2 cm (11.5”) down from base of inlet boss (45° membrane region) IMPACT DATA:
0
200
400
600
800
1000
1200
1400
1600
0 2 4 6 8 10 12
TIME (ms)
LO
AD
(lb
f)
0
5
10
15
20
25
30
35
40
AB
SO
RB
ED
EN
ER
GY
(ft-lbf)
LOAD ENERGY
Impact energy: 45.95 J (33.87 ft-lbf) Impact velocity: 3.536 m/s (11.60 ft/s) Maximum load: 6.070 kN (1,365 lbf) Energy to maximum load: 46.44 J (34.25 ft-lbf) Time to maximum load: 4.95 ms Deflection at maximum load: 1.0 cm (0.40 in.) Velocity slowdown at maximum load: 93.02 % Total absorbed energy: 38.30 J (28.25 ft-lbf)
INSPECTIONS:
After impact, before sustained loading: An indentation with associated cracking was visibly discernable at the im-pact site. Affected areas as ascertained by NDE methods are as follows:
IR thermographic 23 cm2 (3.6 in2) Ultrasonic (A-scan) 31 cm2 (4.8 in2) Eddy current 16 cm2 (2.5 in2)
After sustained loading:
Progression of damage was insignificant. IR thermographic 3 cm2 (0.5 in2) Ultrasonic (A-scan) 29 cm2 (4.5 in2)
BURST TEST DATA:
0
1000
2000
3000
4000
5000
6000
7000
8000
9000
10000
0 50 100 150 200 250
TIME (sec)
PR
ES
SU
RE
(p
sig
)
(226 s, 8368 psig)
Burst pressure: 57.70 MPa (8,368 psi) Strength degradation
from undamaged vessel average of 73.1 MPa (10,600 psi): 21.1% from impacted vessel average of 53.9 MPa (7,819 psi): none

6A-4
Structural Composites Industries, Inc. Model AC-5128A S/N 040 WSTF # 93-27609 A 6.6-in.∅ x 20-in.L cylindrical graphite/epoxy composite overwrapped pressure vessel
SUBTASK 3.4 FINAL REPORT APPENDIX: VESSEL-SPECIFIC INFORMATION
IMPACT CONDITIONS: Nominal impact energy: 20.3 J (15 ft-lb) Impactor weight / drop height: 7.368 kg from 0.287 m (16.21 lbm from 11.3 in.) Impactor: 1.27 cm (0.5 in.) diameter hemispherical Internal COPV pressure: 41.4 MPa (6000 psi) hydrostatic Pressurant: De-ionized water Impact location: 40.6 cm (16.0”) down from base of inlet boss (hoop region) IMPACT DATA:
0
500
1000
1500
2000
2500
3000
0 1 2 3 4 5
TIME (ms)
LO
AD
(lb
f)
0
2
4
6
8
10
12
14
16
AB
SO
RB
ED
EN
ER
GY
(ft-lbf)
LOAD ENERGY
Impact energy: 19.81 J (14.61 ft-lbf) Impact velocity: 2.323 m/s (7.62 ft/s) Maximum load: 11.26 kN (2,532 lbf) Energy to maximum load: 17.88 J (13.19 ft-lbf) Time to maximum load: 1.56 ms Deflection at maximum load: 0.28 cm (0.11 in.) Velocity slowdown at maximum load: 67.32 % Total absorbed energy: 17.16 J (12.66 ft-lbf)
INSPECTIONS:
After impact, before sustained loading: An indentation with associated cracking was clearly visible at the impact site. Band delamination extended (≈ 2”) from both sides of the impact indentation. Affected areas as ascertained by NDE methods are as follows:
IR thermographic 12 cm2 (1.8 in2) Ultrasonic (A-scan) None detected
(band delamination) After sustained loading:
Progression of damage was insignificant. IR thermographic Inflection of indication
too subtle to obtain area Ultrasonic (A-scan) None detected
(band delamination)
BURST TEST DATA:
0
1000
2000
3000
4000
5000
6000
7000
8000
9000
0 50 100 150 200 250
TIME (sec)
PR
ES
SU
RE
(p
sig
)
(226 s, 8309 psig)
Burst pressure: 57.29 MPa (8,309 psi) Strength degradation from undamaged vessel average of 73.8 MPa (10,700 psi): 22.3% from impacted vessel average of 56.1 MPa (8,134 psi): none

6A-5
Structural Composites Industries, Inc. Model AC-5128A S/N 042 WSTF # 93-27610 A 6.6-in.∅ x 20-in.L cylindrical graphite/epoxy composite overwrapped pressure vessel
SUBTASK 3.4 FINAL REPORT APPENDIX: VESSEL - SPECIFIC INFORMATION
IMPACT CONDITIONS: Nominal impact energy: 20.3 J (15 ft-lb) Impactor weight / drop height: 7.368 kg from 0.287 m (16.21 lbm from 11.3 in.) Impactor: 1.27-cm (0.5-in.)-diameter hemispherical Internal COPV pressure: 41.4 MPa (6000 psi) hydrostatic Pressurant: De-ionized water Impact location: 40.6 cm (16.0 in.) down from base of inlet boss (hoop region) IMPACT DATA:
0
500
1000
1500
2000
2500
3000
0 1 2 3 4 5
TIME (ms)
LO
AD
(lb
f)
0
2
4
6
8
10
12
14
16
AB
SO
RB
ED
EN
ER
GY
(ft-lbf)
LOAD ENERGY
Impact energy: 19.78 J (14.59 ft-lbf) Impact velocity: 2.320 m/s (7.61 ft/s) Maximum load: 10.85 kN (2,440 lbf) Energy to maximum load: 17.75 J (13.09 ft-lbf) Time to maximum load: 1.52 ms Deflection at maximum load: 0.25 cm (0.10 in.) Velocity slowdown at maximum load: 66.40 % Total absorbed energy: 17.45 J (12.87 ft-lbf)
INSPECTIONS:
After impact, before sustained loading: An indentation with associated cracking was clearly visible at the impact site. Band delamination extended from both sides of the impact indenta-tion. Affected areas as ascertained by NDE methods are as follows:
IR thermographic 13 cm2 (2.0 in2) Ultrasonic (A-scan) None detected
(band delamination) After sustained loading:
Separation and liftoff of the cut tow at the impact site produced pronounced buckling of the tow.
IR thermographic Inflection of indication too subtle to obtain area
Ultrasonic (A-scan) None detected (band delamination)
BURST TEST DATA:
0
1000
2000
3000
4000
5000
6000
7000
8000
0 50 100 150 200 250
TIME (sec)
PR
ES
SU
RE
(p
sig
)
(207 s, 7368 psig)
Burst pressure: 50.80 MPa (7,368 psi) Strength degradation
from undamaged vessel average of 73.8 MPa (10,700 psi): 31.1% from impacted vessel average of 56.1 MPa (8,134 psi): 9.4%

6A-6
Structural Composites Industries, Inc. Model AC-5128A S/N 056 WSTF # 93-27611 A 6.6-in.∅ x 20-in.L cylindrical graphite/epoxy composite overwrapped pressure vessel
SUBTASK 3.4 FINAL REPORT APPENDIX: VESSEL-SPECIFIC INFORMATION
IMPACT CONDITIONS: Nominal impact energy: 20.3 J (15 ft-lb) Impactor weight / drop height: 7.368 kg from 0.289 m (16.21 lbm from 11.4 in.) Impactor: 1.27-cm (0.5-in.) diameter hemispherical Internal COPV pressure: 41.4 MPa (6000 psi) hydrostatic Pressurant: De-ionized water Impact location: 40.6 cm (16.0 in.) down from base of inlet boss (hoop region) IMPACT DATA:
0
500
1000
1500
2000
2500
0 1 2 3 4 5
TIME (ms)
LO
AD
(lb
f)
0
2
4
6
8
10
12
14
16
AB
SO
RB
ED
EN
ER
GY
(ft-lbf)
LOAD ENERGY
Impact energy: 19.52 J (14.40 ft-lbf) Impact velocity: 2.304 m/s (7.56 ft/s) Maximum load: 10.44 kN (2,348 lbf) Energy to maximum load: 17.22 J (12.70 ft-lbf) Time to maximum load: 1.52 ms Deflection at maximum load: 0.25 cm (0.10 in.) Velocity slowdown at maximum load: 64.25 % Total absorbed energy: 17.68 J (13.04 ft-lbf)
INSPECTIONS:
After impact, before sustained loading: An indentation with associated cracking was clearly visible at the impact site. Band delamination extended from in one direction from the impact indentation. Affected areas as ascertained by NDE methods are as follows:
IR thermographic 2.6 cm2 (0.4 in2) Ultrasonic (A-scan) None detected
(band delamination) After sustained loading:
No significant progression of damage was noted. IR thermographic Inflection of indication
too subtle to obtain area Ultrasonic (A-scan) None detected
(band delamination)
BURST TEST DATA:
0
10002000
3000
40005000
6000
7000
80009000
10000
0 50 100 150 200 250
TIME (sec)
PR
ES
SU
RE
(p
sig
)
(235 s, 8791 psig)
Burst pressure: 60.61 MPa (8,791 psi) Strength degradation
from undamaged vessel average of 73.8 MPa (10,700 psi): 17.8% from impacted vessel average of 56.1 MPa (8,134 psi): none

6A-7
Structural Composites Industries, Inc. P/N ALT-464D S/N 003 WSTF # 93-27663 A 13-in.-∅ x 25-in- L cylindrical graphite/epoxy composite overwrapped pressure vessel
SUBTASK 3.4 FINAL REPORT APPENDIX: VESSEL-SPECIFIC INFORMATION
IMPACT CONDITIONS: Nominal impact energy: 47.5 J (35 ft-lb) Impactor weight / drop height: 7.368 kg from 0.660 m (16.21 lbm from 26.0 in.) Impactor: 1.27 cm (0.5 in.) diameter hemispherical Internal COPV pressure: 31.0 MPa (4500 psi) hydrostatic Pressurant: De-ionized water Impact location: 56.2 cm (22.1 in.) down from base of inlet boss (hoop region) IMPACT DATA:
0
500
1000
1500
2000
2500
3000
3500
4000
4500
5000
0 1 2 3 4 5
TIME (ms)
LO
AD
(lb
f)
0
5
10
15
20
25
30
35
40
AB
SO
RB
ED
EN
ER
GY
(ft-lbf)
LOAD ENERGY
Impact energy: 46.25 J (34.11 ft-lbf) Impact velocity: 3.548 m/s (11.64 ft/s) Maximum load: 19.54 kN (4,393 lbf) Energy to maximum load: 41.47 J (30.59 ft-lbf) Time to maximum load: 1.43 ms Deflection at maximum load: 0.38 cm (0.15 in.) Velocity slowdown at maximum load: 67.00% Total absorbed energy: 39.41 J (29.07 ft-lbf)
INSPECTIONS:
After impact, before sustained loading: An indentation with associated cracking and band delamination was clearly visible at the impact site. Tow detachment around the impact indentation extended nearly half the circumferential distance around the vessel. Af-fected areas as ascertained by NDE methods are as follows:
IR thermographic 8.4 cm2 (1.3 in2) Ultrasonic (A-scan) None detected
(band delamination) After sustained loading:
No significant progression of damage was noted. IR thermographic Inflection of indication
too subtle to obtain area Ultrasonic (A-scan) None detected
(band delamination)
BURST TEST DATA:
0
1000
2000
3000
4000
5000
6000
7000
0 50 100 150 200 250 300 350
TIME (sec)
PR
ES
SU
RE
(p
sig
)
(294 s, 5877 psig)
Burst pressure: 40.52 MPa (5,877 psi) Strength degradation
from undamaged vessel average of 54.1 MPa (7,850 psi): 25.1% from impacted vessel average of 41.8 MPa (6,056 psi): none
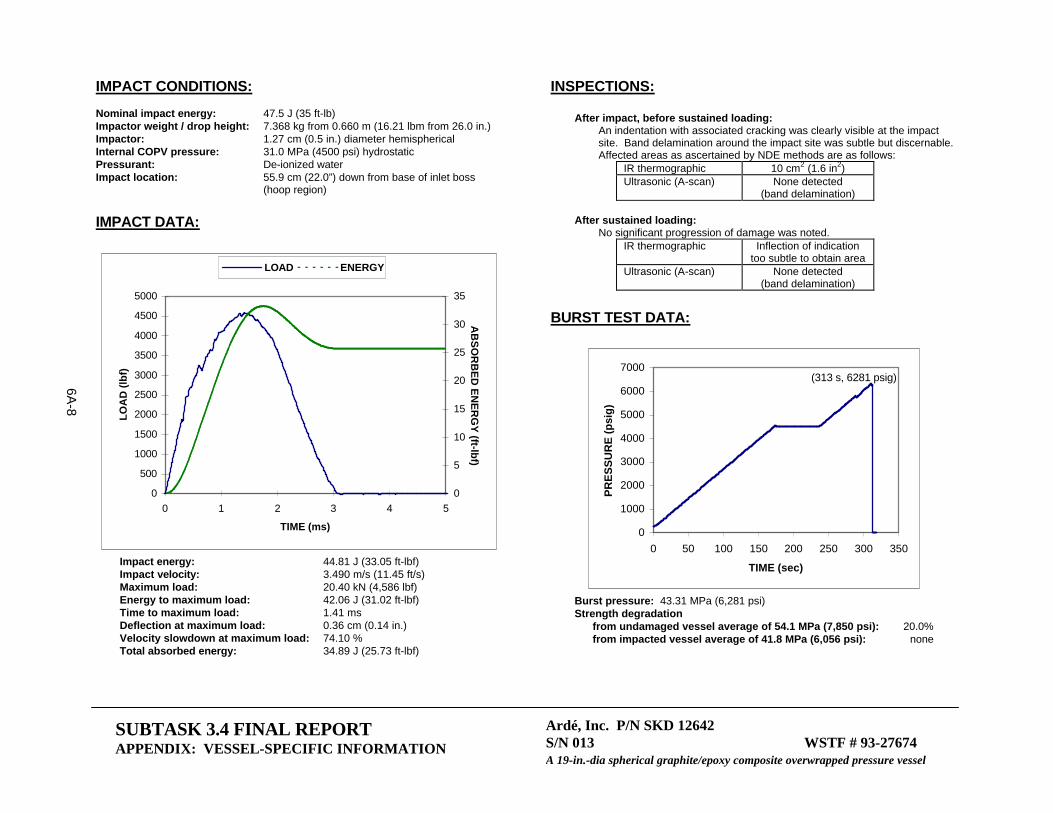
6A-8
Ardé, Inc. P/N SKD 12642 S/N 013 WSTF # 93-27674 A 19-in.-dia spherical graphite/epoxy composite overwrapped pressure vessel
SUBTASK 3.4 FINAL REPORT APPENDIX: VESSEL-SPECIFIC INFORMATION
IMPACT CONDITIONS: Nominal impact energy: 47.5 J (35 ft-lb) Impactor weight / drop height: 7.368 kg from 0.660 m (16.21 lbm from 26.0 in.) Impactor: 1.27 cm (0.5 in.) diameter hemispherical Internal COPV pressure: 31.0 MPa (4500 psi) hydrostatic Pressurant: De-ionized water Impact location: 55.9 cm (22.0”) down from base of inlet boss (hoop region) IMPACT DATA:
0
500
1000
1500
2000
2500
3000
3500
4000
4500
5000
0 1 2 3 4 5
TIME (ms)
LO
AD
(lb
f)
0
5
10
15
20
25
30
35
AB
SO
RB
ED
EN
ER
GY
(ft-lbf)
LOAD ENERGY
Impact energy: 44.81 J (33.05 ft-lbf) Impact velocity: 3.490 m/s (11.45 ft/s) Maximum load: 20.40 kN (4,586 lbf) Energy to maximum load: 42.06 J (31.02 ft-lbf) Time to maximum load: 1.41 ms Deflection at maximum load: 0.36 cm (0.14 in.) Velocity slowdown at maximum load: 74.10 % Total absorbed energy: 34.89 J (25.73 ft-lbf)
INSPECTIONS:
After impact, before sustained loading: An indentation with associated cracking was clearly visible at the impact site. Band delamination around the impact site was subtle but discernable. Affected areas as ascertained by NDE methods are as follows:
IR thermographic 10 cm2 (1.6 in2) Ultrasonic (A-scan) None detected
(band delamination) After sustained loading:
No significant progression of damage was noted. IR thermographic Inflection of indication
too subtle to obtain area Ultrasonic (A-scan) None detected
(band delamination)
BURST TEST DATA:
0
1000
2000
3000
4000
5000
6000
7000
0 50 100 150 200 250 300 350
TIME (sec)
PR
ES
SU
RE
(p
sig
)
(313 s, 6281 psig)
Burst pressure: 43.31 MPa (6,281 psi) Strength degradation
from undamaged vessel average of 54.1 MPa (7,850 psi): 20.0% from impacted vessel average of 41.8 MPa (6,056 psi): none

6A-9
Ardé, Inc. P/N SKD 12642 S/N 013 WSTF # 93-27674 A 19-in.-dia spherical graphite/epoxy composite overwrapped pressure vessel
SUBTASK 3.4 FINAL REPORT APPENDIX: VESSEL-SPECIFIC INFORMATION
IMPACT CONDITIONS: Nominal impact energy: 136 J (100 ft-lb) Impactor weight / drop height: 14.16 kg from 0.978 m (31.22 lbm from 38.5 in.) Impactor: 1.27 cm (0.5 in.) diameter hemispherical Internal COPV pressure: 32.6 MPa (4,725 psi) pneumatic Pressurant: Gaseous nitrogen (GN2) Impact location: 15.9 cm (6.25”) down from base of inlet boss (45° membrane region) IMPACT DATA:
0
1000
2000
3000
4000
5000
6000
7000
0 1 2 3 4 5
TIME (ms)
LO
AD
(lb
f)
0
20
40
60
80
100
120
AB
SO
RB
ED
EN
ER
GY
(ft-lbf)
LOAD ENERGY
Impact energy: 132.6 J (97.83 ft-lbf) Impact velocity: 4.328 m/s (14.20 ft/s) Maximum load: 26.30 kN (5,912 lbf) Energy to maximum load: 106.5 J (78.57 ft-lbf) Time to maximum load: 2.10 ms Deflection at maximum load: 7.1 mm (0.28 in.) Velocity slowdown at maximum load: 54.80 % Total absorbed energy: 132.7 J (97.90 ft-lbf)
INSPECTIONS:
After impact, before sustained loading: An indentation with associated cracking was readiily visible at the impact site. Extended delamination was apparent. Although surface delamination was easily detectable, the overall indication about the impact site was too subtle for a meaningful affected area to be as-certained by IR thermography. Ultrasonic inspection detected a narrow band of damage, roughly corresponding to the visually detectable damaged region, covering 60 cm2 (9.3 in2).
After sustained loading: Significant propagation of cracking was apparent, as was delamination liftoff. No meaningful affected area was derivable from the IR thermogram of the im-pact site, due to the subtlety of the indication; however, the delaminated re-gion grew in spatial extent and displayed markedly crisper edges. Ultrasonic inspection was ineffectual due to the extended delamination.
BURST TEST DATA:
0
1000
2000
3000
4000
5000
6000
7000
0 50 100 150 200 250 300 350
TIME (sec)
PR
ES
SU
RE
(p
sig
)
(291 s, 5987 psig)
Burst pressure: 41.28 MPa (5,987 psi) Strength degradation
from undamaged vessel average of 50.2 MPa (7,280 psi): 17.8% from impacted vessel average of 4.29 MPa (6,228 psi): 4%

6A-10
Ardé, Inc. P/N SKD 12642 S/N 014 WSTF # 93-27675 A 19-in.-dia spherical graphite/epoxy composite overwrapped pressure vessel
SUBTASK 3.4 FINAL REPORT APPENDIX: VESSEL-SPECIFIC INFORMATION
IMPACT CONDITIONS: Nominal impact energy: 136 J (100 ft-lb) Impactor weight / drop height: 14.16 kg from 0.978 m (31.22 lbm from 38.5 in.) Impactor: 1.27 cm (0.5 in.) diameter hemispherical Internal COPV pressure: 32.6 MPa (4,725 psi) pneumatic Pressurant: Gaseous nitrogen (GN2) Impact location: 15.9 cm (6.25”) down from base of inlet boss (45° membrane region) IMPACT DATA:
0
1000
2000
3000
4000
5000
6000
7000
0 1 2 3 4 5
TIME (ms)
LO
AD
(lb
f)
0
20
40
60
80
100
120
AB
SO
RB
ED
EN
ER
GY
(ft-lbf)
LOAD ENERGY
Impact energy: 131.8 J (97.20 ft-lbf) Impact velocity: 4.316 m/s (14.16 ft/s) Maximum load: 25.50 kN (5,734 lbf) Energy to maximum load: 85.24 J (62.87 ft-lbf) Time to maximum load: 1.60 ms Deflection at maximum load: 5.8 mm (0.23 in.) Velocity slowdown at maximum load: 40.06 % Total absorbed energy: 132.4 J (97.63 ft-lbf)
INSPECTIONS:
After impact, before sustained loading: An indentation with associated cracking was readiily visible at the impact site. Extended tow delamination was apparent. The overall indication about the impact site was too subtle for a meaningful af-fected area to be ascertained by IR thermography, and delamination was not discernable from the thermogram. No affected area outside the visually as-certained delaminated region was detected by ultrasonic inspection.
After sustained loading: Significant propagation of cracking was apparent, as was delamination liftoff. No meaningful affected area was derivable from the IR thermogram of the im-pact site, due to the subtlety of the indication; however, the delaminated re-gion was more apparent than in the presustained load image. Ultrasonic in-spection was ineffectual.
BURST TEST DATA:
0
1000
2000
3000
4000
5000
6000
7000
0 50 100 150 200 250 300 350
TIME (sec)
PR
ES
SU
RE
(p
sig
)
(302 s, 6235 psig)
Burst pressure: 42.99 MPa (6,235 psi) Strength degradation
from undamaged vessel average of 50.2 MPa (7,280 psi): 14.4% from impacted vessel average of 4.29 MPa (6,228 psi): 0%
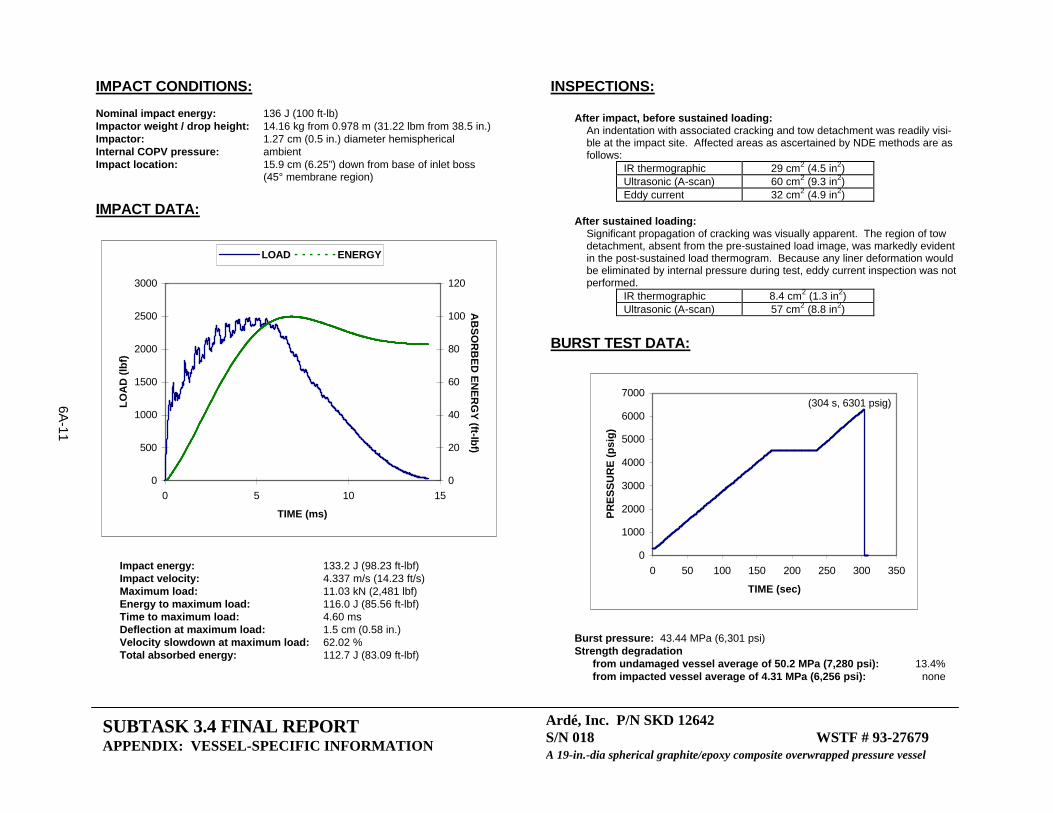
6A-11
Ardé, Inc. P/N SKD 12642 S/N 018 WSTF # 93-27679 A 19-in.-dia spherical graphite/epoxy composite overwrapped pressure vessel
SUBTASK 3.4 FINAL REPORT APPENDIX: VESSEL-SPECIFIC INFORMATION
IMPACT CONDITIONS: Nominal impact energy: 136 J (100 ft-lb) Impactor weight / drop height: 14.16 kg from 0.978 m (31.22 lbm from 38.5 in.) Impactor: 1.27 cm (0.5 in.) diameter hemispherical Internal COPV pressure: ambient Impact location: 15.9 cm (6.25”) down from base of inlet boss (45° membrane region) IMPACT DATA:
0
500
1000
1500
2000
2500
3000
0 5 10 15
TIME (ms)
LO
AD
(lb
f)
0
20
40
60
80
100
120
AB
SO
RB
ED
EN
ER
GY
(ft-lbf)
LOAD ENERGY
Impact energy: 133.2 J (98.23 ft-lbf) Impact velocity: 4.337 m/s (14.23 ft/s) Maximum load: 11.03 kN (2,481 lbf) Energy to maximum load: 116.0 J (85.56 ft-lbf) Time to maximum load: 4.60 ms Deflection at maximum load: 1.5 cm (0.58 in.) Velocity slowdown at maximum load: 62.02 % Total absorbed energy: 112.7 J (83.09 ft-lbf)
INSPECTIONS:
After impact, before sustained loading: An indentation with associated cracking and tow detachment was readily visi-ble at the impact site. Affected areas as ascertained by NDE methods are as follows:
IR thermographic 29 cm2 (4.5 in2) Ultrasonic (A-scan) 60 cm2 (9.3 in2) Eddy current 32 cm2 (4.9 in2)
After sustained loading:
Significant propagation of cracking was visually apparent. The region of tow detachment, absent from the pre-sustained load image, was markedly evident in the post-sustained load thermogram. Because any liner deformation would be eliminated by internal pressure during test, eddy current inspection was not performed.
IR thermographic 8.4 cm2 (1.3 in2) Ultrasonic (A-scan) 57 cm2 (8.8 in2)
BURST TEST DATA:
0
1000
2000
3000
4000
5000
6000
7000
0 50 100 150 200 250 300 350
TIME (sec)
PR
ES
SU
RE
(p
sig
)
(304 s, 6301 psig)
Burst pressure: 43.44 MPa (6,301 psi) Strength degradation
from undamaged vessel average of 50.2 MPa (7,280 psi): 13.4% from impacted vessel average of 4.31 MPa (6,256 psi): none

6A-12
Ardé, Inc. P/N SKD 12642 S/N 018 WSTF # 93-27679 A 19-in.-dia spherical graphite/epoxy composite overwrapped pressure vessel
SUBTASK 3.4 FINAL REPORT APPENDIX: VESSEL-SPECIFIC INFORMATION
IMPACT CONDITIONS: Nominal impact energy: 136 J (100 ft-lb) Impactor weight / drop height: 14.16 kg from 0.978 m (31.22 lbm from 38.5 in.) Impactor: 1.27 cm (0.5 in.) diameter hemispherical Internal COPV pressure: ambient Impact location: 18.1 cm (7.13”) down from base of inlet boss (45° membrane region) IMPACT DATA:
0
500
1000
1500
2000
2500
0 5 10 15
TIME (ms)
LO
AD
(lb
f)
0
10
20
30
40
50
60
70
80
90
100
AB
SO
RB
ED
EN
ER
GY
(ft-lbf)
LOAD ENERGY
Impact energy: 133.5 J (98.48 ft-lbf) Impact velocity: 4.343 m/s (14.25 ft/s) Maximum load: 10.92 kN (2,454 lbf) Energy to maximum load: 113.7 J (83.87 ft-lbf) Time to maximum load: 4.38 ms Deflection at maximum load: 1.4 cm (0.55 in.) Velocity slowdown at maximum load: 59.63 % Total absorbed energy: 123.7 J (91.21 ft-lbf)
INSPECTIONS:
After impact, before sustained loading: An indentation with associated cracking was readily visible at the impact site. No delamination was noted. Affected areas as ascertained by NDE methods are as follows:
IR thermographic 14 cm2 (2.1 in2) Ultrasonic (A-scan) 30 cm2 (4.7 in2)
After sustained loading:
Slight delamination / liftoff not seen in pre-sustained load inspections was visually detected. This region of tow detachment was very prominent in the post-sustained load thermogram.
IR thermographic 15 cm2 (2.3 in2) Ultrasonic (A-scan) None detected
BURST TEST DATA:
0
1000
2000
3000
4000
5000
6000
7000
8000
0 50 100 150 200 250 300 350
TIME (sec)
PR
ES
SU
RE
(p
sig
)
(337 s, 6941 psig)
Burst pressure: 47.86 MPa (6,941 psi) Strength degradation
from undamaged vessel average of 50.2 MPa (7,280 psi): 4.7% from impacted vessel average of 4.31 MPa (6,256 psi): none

7-1
Chapter 7 Test Report: Enhanced Technology for Composite Over-wrapped Pressure Vessels Program Subtask 3.3: Graphite/Epoxy
COPV Impact Damage Testing Database Extension
(originally published as TR-936-001)
Abstract The use of pressure vessels fabricated by overwrapping thin metal liners with Gr/Ep composite materials is increasingly used by industry and government in applications where high strength and low overall system weight are critical factors. As the use of COPVs increases, the need for information regarding COPV behavior under various conditions becomes evident to ensure that performance benefits and safety are maintained throughout vessel service life. One way to increase the accuracy of predicting COPV behavior is to conduct empirical studies that expand the available database.
The USAF, NASA, and the Aerospace Corporation began a joint effort in 1993 that is detailed in the Program Plan, Enhanced Technologies for Composite Overwrapped Pressure Vessels. This paper details a portion of Task 3: Database Extension of the Program Plan, specifically Subtask 3.3: Graphite/Epoxy COPV Impact Damage Testing Database Extension.
WSTF conducted testing to extend the database for impact testing of Gr/Ep COPVs. The results pre-sented here trace four types of COPVs through a systematic testing and evaluation process focusing on NDE, impact and burst strength testing, VDT and IDT data gathering, and trend analyses. We present these results with background information regarding testing techniques, facilities, and methodologies. This results in a database relating external influence parameters including impact energy, geometry, pressurization level, and media to COPV burst strength, IDT, and VDT.
7.1 Introduction
Pressure vessels fabricated by overwrapping thin metal liners with Gr/Ep composite materials are in-creasingly used by industry and government in applications where high strength and low overall system weight are critical factors. The use of these advanced materials for manufacturing lightweight pressure vessels provides distinct advantages over their traditional metal counterparts for many aerospace and transportation applications, especially where high performance-to-weight ratio is desired. However, characterizing composite vessels is a more complex task than that for homogeneous metal vessels. Principally, using fibrous graphite presents a new level in complexity when physical properties and damage susceptibility are examined. Unlike metal vessels, in which the material properties are essen-tially isotropic, the composite structure of graphite fibers and epoxy yields an orthotropic material that is difficult to analyze even with today’s more advanced computer codes. One way to increase the accuracy of predicting behavior of these COPVs is to conduct empirical studies that characterize their behavior.
A Program Plan, Enhanced Technologies for Composite Overwrapped Pressure Vessels, was initiated in 1993 to examine several major areas regarding COPVs with an emphasis on both performance and safety
7-2
(Chang et al. 1993). This study is part of a joint effort of the USAF, NASA, and the Aerospace Corpora-tion. The plan itself is subdivided into nine major task areas. This report presents and consolidates a portion of this study from Task 3: Database Extension of the Program Plan, specifically Subtask 3.3: Graphite/Epoxy COPV Impact Damage Testing Database Extension.12
7.2 Background
Using COPVs in a variety of applications provides distinct advantages over traditional pressure vessels. The primary advantage is that a COPV can offer the same maximum pressure rating of an all-metal vessel at a reduced weight. This is especially significant in aerospace applications for which the total weight of a system is a critical factor. The increase in strength is achieved from both the high tensile strength of the fibers used to wrap the liner and from the compression loading of the liner. This pre-stress condition, coupled with a high strength-to-weight ratio, allows the metal liner/composite combination to effectively withstand higher internal pressures than ordinary homogeneous metal vessels of the same weight.
All of the COPVs used in this study were constructed using a relatively thin metal liner with Gr/Ep composite materials wound to form the overwrap. We tested two vessel geometries: those with a spheri-cal liner and those with a cylindrical liner having hemispherical ends.
7.2.1 Current Use of COPVs in Aerospace Applications
COPVs are currently used as gas storage containers and propellant tanks in spacecraft and in launch boosters and vehicles. Many space launch systems such as the Space Shuttle, Titan/Centaur, At-las/Centaur, and Pegasus launch vehicles have used Gr/Ep COPVs. In addition, the Mars Observer and Advanced X-Ray Astrophysics Facility spacecraft also use Gr/Ep COPVs.
Spherical COPVs are used on the FS-1300 Intelsat VII Platform and on the Integrated Apogee Boost Subsystem for the Defense Satellite Communications System satellite. Cylindrical COPVs are also used on the Hughes Aircraft HS-601 common bus. Furthermore, most of the development work on Depart-ment of Defense satellite systems within the Ballistic Missile Defense Organization is baselined using Gr/Ep COPVs.
Finally, Gr/Ep COPVs have been used on aircraft including the YF-22, C-17, and the B-2 as pneumatic sources, air supplies, and air/fuel pressurization systems.
7.2.2 Future Use of COPVs in Aerospace Applications
The importance of Gr/Ep COPVs continues to grow for aerospace applications, as cost and performance advantages are realized. Performance is quantitatively defined by the ratio of pressure rating times the volume of a COPV to its weight (PV/W). Previously, Gr/Ep COPVs were used almost exclusively for gas storage containers, but more recently they have also become the design of choice for liquid propellant tanks. The design factor of safety for propellant tank designs is considerably higher than the 1.5 value typically used for gas storage-container applications. Typically, propellant storage tanks operate at pressures lower than those for gas supply COPVs. Therefore, these tanks will require fewer wraps of the
12 In addition, information from other portions of the program plan are incorporated where needed for clarity.
7-3
Gr/Ep filament winding to achieve the required design burst strength. However, using fewer wraps may cause propellant COPVs to become more susceptible to impact damage at lower impact levels.
Plastic-lined COPV development continues, to improve their performance and reduce cost. This design configuration was not tested as part of the joint USAF/NASA COPV Program Plan (Chang et al. 1993); however, methods of performing tests on plastic-lined vessels were discussed during program reviews. Material compatibility, liner fatigue, and liner aging are the primary issues to consider for plastic-lined COPVs.
Finally, reusable launch vehicles are being designed using Gr/Ep materials as propellant tanks that are part of load-bearing, structural members of the vehicle. These vessels were not considered in the Pro-gram Plan because of the added loads encountered using such a large vessel as a structural member. In this application, Gr/Ep COPVs are not only being designed for storage of cryogenic propellant materials, but in at least one case the prospect of nesting a He pressurant tank within a liquid hydrogen propellant tank has been considered for future launch vehicle designs.
7.2.3 Historical Impact Damage Investigations
7.2.3.1 General Impact Damage Studies of Gr/Ep Composite Laminates
Carins’ (1987) experimental work investigated impact damage susceptibility of Gr/Ep and Kevlar com-posites over a wide range of parameters. Carins performed impact tests at relatively low velocities (0 to 50 m/s, 0 to 164 ft/s) on composite plaques; influence parameters included impactor kinetic energy and mass, target boundary conditions, material type, and the influence of pre-load on the impact event. The study used ultrasonic C-scan and dye-penetrant-enhanced X-ray NDE techniques to characterize impact damage. Post-impact residual strength was determined by monotonically loading the plaques to failure. The experimental results for Gr/Ep plaques showed significantly more variance in the residual strength compared to the Kevlar plaques, particularly at energies below 15 ft-lbf. The study applied the Rayleigh-Ritz energy method for global deflection and a Hertzian contact model for loads associated with a hemi-spherical impactor to provide analytical predictions of residual strength.
Kwon and Sankar (1993) studied damage to Gr/Ep laminates for both quasi-static and impact loading conditions. The study showed that, for large-mass and low-velocity impacts (< 9.8 ft/s, 3 m/s) in which the impact duration was several orders of magnitude longer than the time for the flexural waves to travel to the boundaries of the target, the impact event can be considered to be quasi-static. They demonstrated that the temporal profile of the impact force and the delamination area in the Gr/Ep composite as meas-ured by ultrasonic C-scan and photomicrographic techniques can be predicted from static indentation flexure tests of similar laminate materials. This work corroborated the earlier findings of Wolf (1983), which showed an equivalency of low-velocity impact testing with quasi-static loading with respect to failure mechanics.
Poe (1990) studied damage to Gr/Ep laminates using impact-loading conditions in the range of 12.5 to 100 ft-lbf and quasi-static impact simulations. This study examined the effect of impactor shape on nonvisible damage and residual strength for sections of the solid rocket booster motors used on the Space Shuttle launch vehicle. The results of impact force, damage size and visibility, and residual tensile strength compared favorably with predicted values based on Hertzian contact, maximum stress criteria,

7-4
and surface crack analysis on the relatively thick (1.4-in., 3.6-cm) laminate sections of the 30-in. (76.2-cm)-dia motor casing.
Nettles (1990) documented that the residual strength of Gr/Ep laminate plaques (8 plies thick, 0.41 to 0.47 in., 1.04 to 1.19 cm) exhibited a sharp decline at a critical impact energy level as low as 0.7 to 1.5 ft-lbf. For these tests, the plaques were clamped between two thick aluminum plates with a central hole through which the tup could pass. The results indicate that very low impact energies were sufficient to crush fibers under the contact load of the tup for relatively thick Gr/Ep laminates.
Swanson (1993) evaluated, using experimental and analytical studies, both quasi-static and dynamic impact loading of plates and cylinders associated with investigating in-service impact damage mecha-nisms. Specifically, this investigation examined size effect and scaling laws. Delaminations were seen to have an absolute size effect consistent with fracture mechanics, while fiber fracture was related to a fiber strain failure criterion.
Lagace tested the need to include progressive damage mechanisms in modeling the response of Gr/Ep composites to impact loading (Lagace, Ryan, and Graves 1994). These tests were conducted on Gr/Ep plates; results indicated that static local indentation was affected by previous damage. However, the global response as measured by force or displacement time histories was not affected by the presence of damage. Lagace concluded that, for impact loads up to 202 lbf (900 N), it may be acceptable to ignore progressive damage mechanisms in modeling, although residual plate strength was not measured, and the extent of damage to the composite laminates was not characterized.
7.2.3.2 Impact Damage Studies of Gr/Ep Filament Wound Pressure Vessels
Early investigations of impact damage susceptibility of filament-wound pressure vessels showed that Gr/Ep vessels were much more sensitive to low-velocity impact damage compared to Kevlar vessels (Adler, Carlyle, and Dorsey 1984; Lloyd and Knight 1986). These comprehensive studies identified fiber fracture as the dominant factor for burst strength degradation. Influence parameters included impact energy and velocity, ply layup, pressure vessel diameter, composite membrane thickness, and propellant backing. They identified two mechanisms that contribute to fiber fracture: fiber crushing, cutting, or fracture under the contact load of the object or tup; and subsurface fiber fracture resulting from critical bending and/or shock waves in the laminate. For cases in which both mechanisms contributed to dam-age, Lloyd and Knight (1986) observed 60% degradation in BAI. Protective measures, such as adding a thin wrap of Kevlar over the Gr/Ep, significantly reduced surface fiber fracture damage and subsurface damage by adding stiffness to the laminate structure.
Wolcott (1993) developed an effective method for assessing the damage tolerance of filament-wound Gr/Ep rocket motorcases. The method
• assessed the threat environment.
• characterized the physical damage as a function of impact to establish the visible or NDE detection threshold.
• determined the critical energy level at which the impact energy and conditions caused a meaningful reduction in pressure vessel burst strength.
• quantified the residual strength after impact as a function of influence parameters.

7-5
This work demonstrated the strong dependence of damage tolerance on vessel diameter and loading conditions enabled by propellant backing material. It identified protective, removable covers as a cost-effective method for coping with the threat environment in the manufacturing plant and in the field.
Patterson (1996) tested the impact damage sensitivity of thin-walled (1.4-mm, 0.055-in.) Gr/Ep motor-cases and found as much as a 65% reduction in burst strength for impact energies as low as 5.6 ft-lbf. Even a 1-ft-lbf impact reduced the burst strength of these thin-walled vessels by as much as 30%. The most recent results on vessels filled with a propellant simulant gave twice the impact loading, with half the deflection of empty vessels; however, the residual BAI was comparable for both cases.
Collins performed impact damage studies of Gr/Ep COPVs to be used for the Space Shuttle Orbiter. Results indicate that impact energy and internal pressure influence residual strength after impact for both small cylindrical and spherical COPVs (Collins 1993; Collins, Rogers, and Cord 1994).
Several reports on the impact damage sensitivity of COPVs were issued throughout the duration of the joint USAF/NASA Program (Chang et al. 1993, 1994, and 1996; Beeson et al. 1996). These papers reported details of the Program and gave early indication of the impact sensitivities measured for various COPV designs and configurations.
Various methods involving gas guns, pendulums, and drop towers have been devised to deliver low-velocity impacts to composite laminate materials. Drop towers were used in most studies on pres-sure vessels (Lloyd and Knight 1986; Wolcott 1993; Kwon and Sankar 1993; Collins, Rogers, and Cord 1994; Nettles 1990; Adler, Carlyle, and Dorsey 1984; Patterson 1996). Generally, these instruments used an Instron-Dynatup strain gauge to record the time history load profile of the impact; however, acceler-ometers have also been used to measure impact load profiles (Svenson et al. 1994). The drop towers varied from sophisticated commercial units to those designed for simplicity and low cost of operation (Ambur, Prasad, and Waters 1995).
Swanson (1993) used the pendulum drop weight for quasi-static impacts at velocities below 33.8 ft/s (10 m/s) and an airgun launcher for dynamic impacts ranging from 16.4 to 197 ft/s (5 to 60 m/s) (Qian et al. 1990). Carins (1987) used a pressurized airgun originally designed and employed at NASA’s Langley Research Center to achieve dynamic impacts with spherical steel balls at velocities ranging from 33.8 to 263 ft/s (10 to 80 m/s). Wolf (1983) used an instrumented fiberglass cantilever impact fixture equipped with an accelerometer mounted to a 1-in. (2.54-cm) steel impactor to achieve impact velocities up to 23 ft/s (7 m/s) and energies of 2 ft-lbf.
7.2.4 Historical NDE Inspection Techniques for Gr/Ep Composites
Sierakowski and Newaz (1995) gave a general summary of the types of NDE techniques that historically have been used to detect defects in advanced composites, including ultrasonic, X-ray radiography, dye-penetrant-enhanced radiography, eddy current, and optical aided (10X) visual examination of surface discontinuities. The types of composite defects cited include translaminar surface and subsurface frac-tures, core cell damage and fluid ingestion, porosity, disbonds, impact damage, fastener hole damage, lightning damage, and heat or fire damage.
More specific to impact damage, Gros (1995) identified several types of NDE techniques that have been applied to detect low-energy impacts (0.37 to 7.4 ft-lbf) in carbon-reinforced composites, including visual inspection (VT), coin tapping, ultrasonic, eddy current, IR thermography, X-ray radiography, laser

7-6
holography, shearography, and air coupled ultrasonics. It was concluded that more than one type of NDE technique is usually required to inspect composite materials.
Zalameda compared IR thermography to ultrasonic C-scan techniques for inspecting impact damage to Kevlar and carbon composite flat and Y-stiffened panels (Zalameda, Farley, and Smith 1994). The study used IR thermography as a rapid in-service detection method in conjunction with ultrasonic C-scans to perform more detailed quantitative diagnostic inspections of suspect regions. Although the ultrasonic work focused on implementing C-scan measurements within immersion tanks, it was asserted that dry contact transducers were available for field use.
Task 4.0 of the USAF Program Plan was conducted at the Aerospace Corporation as a pathfinder project to the COPV Program (Johnson and Nokes 1998). This work reviewed the relative merits of IR thermo-graphy, ultrasonic C-scan, eddy current, shearography, and AE for the detection of essentially nonvisible impact damage to COPVs (Nokes et al. 1994; Beeson et al. 1996). All methods were recommended for qualitative detection of low-energy impacts to COPVs; however, ultrasonic C-scan was restricted to field cases that permitted COPV immersion in a coupling fluid, and shearography required a spray-on dye penetrant developer to obtain reliable fringes. This work did not attempt to correlate NDE indications with COPV residual burst strength after impact.
Two reports on NDE techniques used to inspect COPVs associated with Tasks 3.0 and 8.0 of the Pro-gram Plan were published during the Program. These reports covered details of VT, X-ray radiography, IR thermography, ultrasonic A-scan, eddy current, and AE techniques, and discussed the prospect of correlating BAI with measured NDE data (Tapphorn, Starritt, and Beeson 1995; Tapphorn, Pellegrino, and Beeson 1996).
Other investigators have searched for correlation between AE signatures and the burst strength or impact location of filament-wound Gr/Ep pressure vessels. Hill demonstrated that the burst pressure of undam-aged vessels can be predicted to within ± 5% using a back-propagation neural network analysis of the AE signatures measured during pressurization to 25% of expected burst pressure (Hill, Walker, and Rowell 1996). Connolly (1995) showed that waveform analysis of AE signatures can accurately locate an impact damage site using triangulation from a transducer array. In addition, the event density of the AE signa-tures at the impact zone correlated reasonably well with impact energy.
Hamstad, Downs, and Loechel investigated AE methods of detecting manufacturing flaws as part of the USAF Program Task 6.0 activity (Chang et al. 1993) and reported on it in several publications (Hamstad and Downs 1995; Downs and Hamstad 1995a and 1995b; Downs and Loechel 1996). In addition to the AE method, this work also explored the sensitivity of X-ray radiography, shearography, and IR thermo-graphy to detect defects in the metal liner and composite overwrap. Only AE activity measured during an initial pressurization ramp to the proof-pressure testing provided any degree of correlation to manufactur-ing variations. AE, measured in terms of the Felicity ratio13 during a second pressurization ramp to proof-pressure level, correlated reasonably well with the burst strength of spherical COPVs; however, similar measurements performed on small cylindrical COPVs yielded no definitive trend. These tests, performed with up to 16 transducers installed with special fixtures on the COPV, substantiated the de-gree of attenuation of AE signatures propagating in Gr/Ep composites.
13 Felicity ratio is defined as the load at which the onset of significant emission occurs on a subsequent loading,
divided by the previous maximum load (Downs and Hamstad 1995a and 1995b).

7-7
Previous studies associated with using AE analysis to inspect filament-wound vessels have focused on hydrostatically pressurizing filament-wound vessels or COPVs (Hamstad and Chiao 1973). It is still unknown if AE techniques can be reliably used for in situ monitoring of pneumatically pressurized COPVs. Also, no previous NDE work evaluated COPV sensitivity to impact damage when the vessel was hydrostatically or pneumatically pressurized during the impact event.
More recently, Downs and Hamstad (1998) reported using AE during the depressurization cycle of impact-damaged COPVs. They introduced the Shelby ratio as a means of quantitatively assessing the unload AE. Linear correlation between Shelby ratios and the residual vessel strength were obtained for impact-damaged COPVs that had been hydrostatically pressurized.
VT supplemented by ultrasonic NDE has been the primary method of impact damage inspection of filament-wound rocket motorcases (Wolcott 1993). More recently, ultrasonic A-scan techniques were recommended as effective inspection methods for detecting significant impact damage to rocket motor-cases.14 In addition, this study reported that instrumented coin tapping was effective for detecting impact flaws to composite motorcases, even through small holes in a cork liner. Other researchers have success-fully used a form of instrumented coin tapping to detect delamination defects in fiber-reinforced Gr/Ep composites (Raju, Patel, and Vaidya 1993).
7.3 Objectives
We conducted tests at WSTF to address the issues raised in the original USAF/NASA Program Plan under Subtask 3.3: Graphite/Epoxy COPV Impact Damage Testing Database Extension. The primary objectives of the plan were to investigate COPVs and extend the database of information for this type of pressure vessel. The database extension focused on COPV impact damage susceptibility and methodolo-gies used to characterize and quantify damage effects. We developed a testing program to accomplish this task using four representative types of Gr/Ep COPVs.
7.4 Approach
7.4.1 Test Program Overview
Extending the COPV database required developing a set of procedures covering several major areas. We followed the original Program Plan, focusing on these major areas of investigation:
• Receiving and Inspection
• Baseline Data Acquisition
• Impact Testing
• Cyclical Loading
• NDE Techniques
• Post-Impact Analysis
• Burst Testing
• Evaluation and Trend Analysis
14 Private discussion, J. B. Chang, The Aerospace Corporation, June 18, 1997.
7-8
• Data Archival
Figure 7-1 shows a process flowchart illustrating the interdependence of these major areas of investiga-tion.
7.4.2 Test Articles
We tested four types of COPVs: small (10.25-in.-dia) and large (19-in.-dia) spherical and small (6.6-in.-dia × 20-in.-long) and large (13-in.-dia × 25-in.-long) cylindrical (Figure 7-2). Vessel characteristics are listed in Table 7-1.
7.4.3 Test Properties and Influence Parameters
The following sections outline test properties and influence parameters used to characterize COPV.
7.4.3.1 Test Variables
Structural strength, damage threshold, and failure modes were the primary variables examined in this study. Examining these variables helped elucidate and define the various quantitative and qualitative properties measured during testing.
7.4.3.1.1 Structural Strength. Structural strength is the primary property for both COPV designers and end users. Structural strength testing focused primarily on impact effects on COPV burst strength. The basic criterion used was BAI. The amount of degradation of a BAI from the baseline burst test level is expressed as percent degradation, the normal mode of comparison to the baseline level of COPV structural strength. We also determined additional variables by examining the COPV burst char-acteristics; these are covered in detail in the Results and Discussion section.
7.4.3.1.2 Damage Threshold. Damage threshold applies to two types of threshold values that can be examined from COPV testing. The first is a qualitative threshold based on VT by trained person-nel. The second is based on impact damage that may or may not be detectable by visual or other NDE techniques. Threshold determination techniques are useful when compared with strength degradation values obtained during destructive testing.
Two common terms used to describe damage threshold are IDT and VDT. IDT is the maximum energy level that will not degrade the burst strength of a COPV below the proof level of 125% of the MEOP or 20% below nominal burst strength; VDT is the point at which impact damage is barely detectable by three independent trained visual inspectors. Determining these threshold values aids in assessing COPVs during receiving inspections, field maintenance, and suspect damage assessment. The data gathered in this area are intended to help assess damage throughout a vessel’s rated service life.
7.4.3.1.3 Failure Modes. Assessing COPV failure modes after exposure to an external influence can help determine the overall safety of a particular design. These modes are defined by a vessel’s behavior at or before failure. One mode, leak before burst (LBB), occurs when the media within the vessel begins to escape before the overall integrity of the vessel is compromised. Another failure mode, burst before leak, is usually a catastrophic event. The burst upon impact (BUI) failure mode is difficult to quantify because the burst threshold has been exceeded during the impact event itself. Stress rupture

7-9
resulting from long-term storage following impact is considered a failure mode; the results of this work have been reported in Subtask 3.4: Sustained Load/Impact Effect Testing of Graphite/Epoxy Composite Overwrapped Pressure Vessels (COPVs) (Hare et al. 1998).
7.4.3.2 Influence Parameters
Influence parameters used during this study arose from examining the environmental effects that the COPVs are likely to see in service. In most cases, the effect of these parameters is sufficient to lower the overall vessel strength. In general, these influence parameters pertain to properties external to the vessel (e.g., impacts, temperature) or to the vessel’s design (e.g., pressure, media, or materials). The influence parameters studied include:
• Impact Energy
• Impact Location
• Impactor Geometry
• Internal Pressurization
• Pressurization Media
• Single, Multiple, and Oblique Impacts
• Pressure and Thermal Cycling
All impacts were orthogonal except the oblique impact. Velocity for all cases except the oblique impact was of the same order of magnitude.
7.4.3.2.1 Impact Energy. We characterized the primary impact damage mechanism under investigation by methods similar to those described in the Background section. Impact energy included several components useful in characterizing any impact. We calculated absorbed energy by examining the load (F) vs. time (t) data acquired during impact, measured in ft-lb. Because the data presented here were gained using the drop tower method, the actual measured quantities were the mass of the drop weight and tup assembly (impactor) (W), velocity (v), load (F), and time (t). We calculated values for E directly from a known mass and determined velocity measurements from sensors on the impactor. These values were used to find the kinetic energy in the system, defined as:
2
21 mvE ≡
(1)
where E = kinetic energy m = impactor mass v = impactor tup velocity Nominal energies were reported rather than the exact numerical values computed from the IMIT. These nominal energies agreed with exact values to within a few percent. The IMIT (Figure 7-3) is more fully described in Section 4.4.1.
7.4.3.2.2 Impact Location. This influence parameter refers to the effect of impacting the same type of COPV at different locations perpendicular to the surface at the point of impact, i.e., the midpoint of the major axis of a cylindrical COPV vs. an impact upon the hemispherical, or dome, portion. Alter-

7-10
natively, we can compare the influence of impact location on a spherical COPV by impacting one COPV at the equator vs. another at a predetermined latitudinal line, such as at a 45-deg angle at the inlet end.
7.4.3.2.3 Impactor Geometry. We also examined the effects of impactor geometry. The com-mon impact tup used during these tests was a steel rod with a hemispherical end. A 0.5-in. hemispherical tup was used for most tests. For comparison, we performed some impacts using 0.25- and 1-in. hemi-spherical tups, a flat-faced 0.5-in. cylindrical tup, and a blade tup similar to a standard 0.25-in. screw-driver blade.
7.4.3.2.4 Internal Pressurization. This parameter allowed us to examine the effect of impacts on vessels in unpressurized and pressurized cases, allowing a vessel to be examined for both simulated conditions throughout its service life. Generally, pressurized tests were performed at MEOP, with a few tests at half MEOP. Pneumatic tests were performed at 105% of MEOP.
7.4.3.2.5 Pressurization Media. We varied this influence parameter to simulate possible operating conditions for either liquid or gas operations in a realistic impact environment, using GN2 and deionized water for these tests. In addition, this test determined if hydrostatic pressurization was equiva-lent to pneumatic pressurization during impact with respect to impact damage effects on burst strength.
7.4.3.2.6 Single, Multiple, and Oblique Impacts. A side path of the main testing examined influences of single, multiple, and oblique impacts, allowing determination of their relative influence on burst strength and of the need for further testing based on measured effects.
Single Impacts: Most impacts conducted were gravity-assisted single impact events. Secondary impacts during these dynamic loading tests were eliminated by experimental design and accomplished by catch-ing the impactor using a pneumatic rebound brake on the IMIT after its initial rebound from the COPV surface.
Multiple Impacts: We performed multiple impact testing by striking the COPV a second time in the exact same location (coincidence) or in an adjacent location separated by one fiber band (typically 0.5 to 0.7 in.). These tests were conducted on a set of the small spherical and small cylindrical COPVs.
Oblique Impacts: Oblique impact testing examined the effect of impact from an unconstrained, free-falling object whose initial path was not perpendicular to the local surface. This differed from previous testing in which the impact tup followed a path normal to the local surface and was constrained from lateral movement by the IMIT’s vertical guide rails. The testing used two small cylindrical COPVs chosen for comparison to three identically sized COPVs from the same lot that had been impacted at 15 ft-lbf in the IMIT (WSTF #s 93-27583, -27589, and -27593).
We did not use the IMIT in the oblique tests. Instead, we used a drop tube test system consisting of a 1-lb (0.45-kg) weight having an approximately 0.49-in.-dia hemispherical head dropped down a 0.5-in. ID by 13.5-ft-long tube set 1.5 ft above the impact point (Figure 7-4). This yielded the 15 ft-lbf required for comparison. The first vessel (WSTF # 93-27625) was impacted at the same location as the three reference vessels and was used as a baseline between the two groups. The second vessel (WSTF # 93-27627) was offset by approximately 2.25 in., which yielded an impact location of approximately 40+ deg down from the top of the vessel. Thus, the system simulated an impact similar to a glancing impact that would be present if a tool or other object were allowed to free-fall onto a COPV. The two COPVs were subjected to the same posttest NDE and burst testing used in the test program.
7-11
7.4.3.2.7 Pressure and Thermal Cycling. Another side path of the main testing examined influences of pressure and thermal cycling. This effort allowed determination of their relative influence on burst strength and of the need for further testing based on measured effects.
Pressure Cycling: We conducted post-impact cycling of the small spherical COPV to evaluate the effect of mission/use-induced cycling on a threshold-damaged (20% nominal degradation of burst strength) COPV test article. Three COPVs were given 35-ft-lbf, 0.5-in. tup impacts in the membrane region at ambient pressure and were then hydraulically cycled 50 times from ambient pressure to their MEOP of 6000 psig. We performed post-cycle VT and any additional complementary NDE as required. The impact damage sites were photographed if any significant change was noted. The test articles were then subjected to normal hydraulic burst testing.
Thermal Cycling: To further explore the subject of COPVs subjected to mission/use cycling, we ther-mally cycled a single small COPV (WSTF # 96-29865) in the VDT level damaged condition. The COPV was pressurized to its MEOP of 6000 psig using helium gas. The thermal cycling was induced by im-mersing the COPV mechanically into LN2 using the same test apparatus previously used in COPV LOX exposure testing. We monitored and controlled the immersion and withdrawal times to produce a 6000- to 4000-psig pressure cycle. Each thermal cycle required approximately 1 hr to complete. After 50 cycles the COPV was again subjected to inspection and released for burst test.
7.4.4 Test Facilities, Equipment, and Procedures
COPV test articles were impacted, burst tested, and nondestructively evaluated in the IMIT system, the burst test system, and in the high-pressure test area (HPTA), respectively.
7.4.4.1 IMIT System
The WSTF IMIT system (Figure 7-3) is located in the HPTA and was designed for routine testing of remotely located hazardous materials and components. We minimized personnel and equipment hazards by using this highly specialized WSTF test system.
The IMIT system houses the controls and equipment used to acquire COPV impact data. The system consists of a test cell that contains the IMIT, which is an industry standard Instron-Dynatup Model GRC 8250 drop-weight impact test machine equipped with a fully automated pneumatic rebound brake system, and a Model GRC-I data acquisition and analysis system. A special I-beam frame supports the IMIT to allow fixed-position mounting of a variety of COPVs under the impactor tup. The IMIT impactor tup was equipped with semiconductor strain gages that recorded high-speed real-time responses of a drop-weight impacted COPV. The rebound brake system caught the IMIT crosshead after impact, limiting the impact to a single event. The data acquisition and analysis system acquired, analyzed, plotted, and stored a complete record of each COPV impact test.
The HPTA test cell was configured to allow pressurization of each COPV test article to MEOP with either GN2 or DI water as required.
A variable pressure controller was installed on the pumps to control pressurization ramp rate and subse-quent pressure vent rates after nonburst impact events. A data acquisition and control system controlled and recorded the pressurization and venting processes.

7-12
A fixture assembly supported the COPVs by the end bosses in a special I-beam frame to simulate actual operational mounting configurations (Figure 7-5). One boss mounting point approximated a fixed condi-tion, and the mount at the other boss allowed the COPVs to expand and contract during pressurization and venting. Both bosses were gimbaled to facilitate filling the COPV with water and permitting impacts perpendicular to it at various locations. The gimbals allowed the COPV to rotate nearly 180 deg to the axis of impact to ensure that impact testing could be performed at the girth, transition, and dome-end regions (Figure 7-6). The boss also allowed 360 deg of rotation around the central or polar axis. The boss mounts were restrained from becoming projectiles during BUI events; in no case were COPVs supported by their shell section.
A blast enclosure protects the test cell in case a COPV were to burst under pressure during impact, (Figure 7-7). The primary function of the blast enclosure was to protect the surrounding equipment, structure, and plumbing from the blast pressure wave and fragments. The secondary function was to allow controlled pressure venting of post-blast pressure and from COPVs that exhibited BUI behavior. The enclosure is roughly cubic and incorporates the existing steel IMIT base plate that is attached to the cell floor. A Lexan flanged viewport in one wall of the enclosure allowed safe photo and video coverage of the impact event. We selected Lexan, a common ballistic material used for blast enclosures, because it is clear and allows for good photographic coverage during tests.
Further test cell protection was provided by stacked sandbags, as required, on the door side of the blast enclosure. The rear door to the test cell remained open to the exterior of the building during all pneu-matically pressurized impact tests to assist in any blast pressure wave dissipation and to avoid pressuriza-tion of interior rooms. For additional safety, test personnel controlled all activities remotely from a control room.
A personal computer – using standard software provided by the test equipment manufacturer – recorded impact data from the GRS-1 data acquisition system (load vs. time, impact energy and velocity, rebound energy, and maximum impact deflection) for subsequent analysis. The control software initiated the impact test sequence at the command of the test conductor. Figure 7-8 illustrates typical time-based test data output from the data acquisition system that was automatically recorded during each impact event.
7.4.4.2 Burst Test System
The second major test system used for data acquisition was the WSTF burst test system, which was designed for hazardous testing.
Burst tests were performed within a Lexan enclosure designed to isolate the test article and mounting fixture from surrounding equipment (Figure 7-9). The enclosure is roughly cubic (slightly taller than wide) with a steel plate floor; all other sides are Lexan sheet. The four sides, including the access door, are flat and anchored along their edge seams with metallic angle to the enclosure metal frame by frangi-ble retaining pins. These pins also provided pivot points if the resultant blast wave was insufficient to cause their complete shearing.
In the event of a catastrophic blast, the Lexan enclosure panels were designed to unfold when exposed to the effects of the emanating blast pressure wave. For noncatastrophic events, such as an LBB, the enclo-sure was designed to provide adequate venting to dissipate any loss of test media. The Lexan enclosure was placed within a plywood containment with a latched access door. Plywood was used to provide an
7-13
effective energy-dissipating barrier in case blast debris exited the Lexan enclosure. The Lexan enclosure provided the primary shielding for pressure manifolding, electrical connections, and photo/video equip-ment; the plywood enclosure provided secondary shielding. This whole assembly was situated within a three-sided welded steel structure located on a remote and controlled concrete test pad.
Video and instrumentation devices were installed to simulate the same configuration and methodology employed by COPV manufacturers. A close-up view of the enclosure with a typical COPV test configu-ration is shown in Figure 7-10.
Testing was conducted remotely from an underground bunker with constant video monitoring of both the burst test site and all surrounding area access routes (Figure 7-11).
A dedicated data acquisition system and control computer, in conjunction with a separate closed-loop proportional integral derivative pressure controller, controlled the test article pressure vs. time profile. An electrically adjusted pressure control valve provided final control. The system was capable of obtain-ing pressure cycling and ramp/dwell/ramp-to-burst profiles. The data acquisition system routinely moni-tored and recorded system temperatures and pressures and accommodated multiple strain gage measure-ments when required. AE monitoring, standard video, and high-speed video film recording capabilities were also included.
7.4.4.3 NDE Techniques
Various NDE techniques were used during the course of this program and are described in the following sections. All NDE inspections were performed in the HPTA.
7.4.4.3.1 Visual Inspection. Visual inspection of COPVs is an NDE technique that requires specific training of inspectors in the art of visually recognizing and distinguishing impact damage sites from other types of superficial discontinuities. Factors that influence visibility include lighting level, orientation, freedom of movement with respect to line of sight, impact location, and impactor geometry. Visual inspectors must be able to discriminate impact damage indentations from other anomalies, includ-ing matrix cracking, ply disorientation, surface bubbles in the matrix, voids, excess or lean resin condi-tions, discoloration, stray fibers, water spots, and general scuffs and scratches.
Visual inspections and photographs documented the initial receipt of vessels. Additional visual inspec-tions were performed following impact testing to determine damage visibility and VDT. Three inde-pendent trained inspectors typically conducted all visual inspections. They measured indentation size and depth for selected vessels, recorded the data, and also documented indentation locations.
7.4.4.3.2 IR Thermographic NDE Receiving Inspections. We performed an IR thermo-graphic pretest scan by exposing the COPV to an IR pyropanel heat lamp (Research, Inc., Model 4085) located approximately 30 cm from its surface while viewing it at a distance of approximately 1 m with an Inframetrics 760 IR camera and imaging system. The IR camera was positioned 180 degrees from the IR lamp, and the COPV was slowly rotated at a rate of 10 deg/s (Figure 7-12). The IR thermographic pretest scan was sensitive to manufacturing defects including potential impact-induced damage or proof-pressure stress cracking. Liner disbonds, deformation, and composite delaminations associated with impact damage were also detectable with IR thermographic NDE inspections.
7-14
7.4.4.3.3 IR Thermographic NDE Post-Impact Inspections. IR thermographic NDE post-impact inspection used an Inframetrics Model 760 IR camera and imaging system and an IR pyropanel heat lamp (Research, Inc., Model 4085). Figure 7-12 shows the IR thermographic inspection system and the angular relationship between the heat lamp and the IR camera. A large zone around the impact site was heated to temperatures approximately 5 to 10°C above ambient, and the IR camera recorded the thermal decay images sequentially following heat lamp termination.
The damage-affected zone was determined by image processing the three-dimensional (3-D) map of temperature distribution as a function of spatial position (Figure 7-13). Temperature profile cross-sections through the 3-D map permitted the detection of inflection points that mapped out the impact-damaged zone. We measured mean spatial diameters of the affected zone, determined by the inflection point locations, and used them to calculate an average circular area of damage. The spatial area associ-ated with impact damage was measured and scaled according to the dimensions of fiduciary copper tapes attached to the Gr/Ep COPV near the impact zone.
7.4.4.3.4 Ultrasonic A-Scan NDE Inspections. We used handheld probes (Figure 7-14) to perform an ultrasonic A-scan NDE inspection of the impact zones. These NDE inspections were not intended to extensively characterize the impact damage, but rather to demonstrate that very simplified NDE techniques could be used to detect the damage-affected zone and to independently corroborate the other NDE techniques. The ultrasonic A-scan inspections used a NorTec 1 MHz handheld probe with a rubber eraser delay line. The A-scan waveforms were viewed on a digital oscilloscope associated with a Sonix ultrasonic system. Ultra-gel II, a water-soluble couplant, was applied to a local impact damage or suspected zone and was easily removed without leaving a residue.
7.4.4.3.5 Coin Tapping Acoustic NDE. We frequently used coin tapping, a variant of the ultrasonic technique, to characterize a COPV impact event during VT. This acoustic analysis method permitted approximate identification of composite delaminations and disbonded or deformation liner regions surrounding an impact zone. The process is quick and simple because the only equipment needed is a coin—in this case a U. S. Washington quarter—and the human ear. Although this technique is not as accurate as an A-scan, it does offer advantages for rapid preliminary field detection of some COPV defects. It is dependent upon audio recognition of a shift in acoustic response caused by tapping in and around a damage site.
7.4.4.3.6 Eddy Current NDE Inspections. An NDE mapping technique, similar to ultrasonic A-scan, was used to perform the eddy current probe inspections of the impact-damaged zones (Figure 7-15). We used a 400-kHz Zetech probe driven by a Magnaflux 800 analyzer to map the damage-affected zone. We discriminated between undamaged and damaged zones by the lift-off effect associated with liner deformation. We measured mean spatial diameters along two orthogonal directions of the damage-affected zone and used them to calculate an average circular area of damage.
7.4.4.3.7 Acoustic Emission NDE. We monitored AE emitted during the Gr/Ep COPV pres-surization to MEOP or burst using a LOCAN-320 system (Figure 7-16). A single AE transducer (Model R-15) was mechanically clamped to the inlet tube of the Gr/Ep COPV using commercially available honey or silicone vacuum grease as a couplant. AE hits as a function of hydrostatic pressure were moni-tored and displayed as differential and accumulated spectra during the pressurization cycle. An AE hit was defined as an event exceeding a preset amplitude threshold that occurred within a rise time of

7-15
30 microseconds (µs) and a duration of 300 µs. Multiple AE events occurring within 300 µs of the previous event were locked out and were not analyzed.
Attempts to mount AE transducers directly onto the Gr/Ep COPV surface were not successful because of surface roughness and destruction of the AE transducer during the burst process. In principle, the AE transducers could have been removed before bursting, but safety requirements dictated that the Gr/Ep COPV pressure would have to be reduced to a low pressure before removal. The implicit pressure cycle required to remove the transducer was not acceptable as part of the test conditions permitted by the test program plan.
We collected AE spectral data from a single transducer mounted on the vessel inlet tube, as a function of pressure during hydrostatic burst testing, and used them to determine the Felicity ratio for the impact-damaged vessel. For a pristine or undamaged Gr/Ep COPV, the Felicity ratio has a value of 1.0. The Felicity ratio for this work was defined as the pressure for onset of significant and continuous AE compared to the previous proof pressure for the vessel.
7.4.4.3.8 X-ray Radiography NDE. We only used X-ray radiography in conjunction with receiving inspections to verify that the candidate test article was free of defects that may have been incurred after proof-pressure testing by the manufacturer. X-ray radiography complements VT in that it distinguishes any readable defect associated solely with the metallic liner.
In general, we conducted X-ray radiography in accordance with MIL-STD-453 (USAF 1984). However, adequate screening required five 72-deg views. The X-ray radiographic film is on file for each individual COPV pedigree and is part of the archived program data.
7.4.5 Test Accuracy
The accuracy of pressure transducers used in testing was ± 1%. The IMIT accuracy was more difficult to explicitly determine because data acquisition under impact conditions required both instrumented read-ings and internal software calculations. Overall, these can have a combined effect of up to ± 3% for energy and load readings per manufacturer specifications and calibration records. Each individual com-ponent’s accuracy was higher because this is a combined effect of mass, velocity, and load cell measure-ments.
Impact location accuracies were measured to within ± 0.25 in. relative to the inlet port of the vessel and the angular accuracy was measured to within ± 10 deg relative to the COPV label location.
The most difficult accuracy to assess was that for testing, which relied on techniques that used human judgment, such as the human eye and ear. Thus, the visual inspection and coin tapping acoustic tech-nique error can be reduced through formal training and experience.
Early in the program (July 19, 1994) WSTF conducted training for eight personnel who were already versed in the VT of pressure components. All were subject to and passed a WSTF Medical Office eye exam required for flight article visual inspectors. A specific training session was conducted to acquaint these personnel with the four types of program COPV test articles. They were instructed in how to handle COPVs and were introduced to COPV manufacturing methods and general construction and components. Examples of impact damage, matrix cracking, and general scruffs, abrasion, and cuts were shown. In this training session, each participant inspected an actual COPV and was then certified as a

7-16
COPV visual inspector with the ability to handle and inspect WSTF critical test articles. Training con-tinued on a rotational basis for inspecting COPV test articles both in damaged and undamaged condi-tions. This provided for both the initial receiving and post-impact visual inspections. Each inspection was conducted with three inspectors, whose findings were reviewed and compared against an independ-ent and experienced COPV inspector for the balance of the program. All individually signed VT reports are located in each COPV data package on file at WSTF.
IR thermography used data from an Inframetrics 760 camera. This testing used 5 and 10 °C span scales yielding 0.02 and 0.04 degrees per color value, respectively, which was more than adequate for use in 3-D thermograms. For screening and comparison this was reduced to 0.5 °C and 1 degree per color value, which proved adequate for evaluation purposes.
We used image data to extract areas of impact damage for several of the NDE techniques. For IR ther-mography images, we used fiduciary copper tapes in two orthogonal directions to scale the image size to an accuracy of ± 0.0625 in. Discrimination of the inflection points in the IR thermogram also introduced a nominal inaccuracy of ± 0.125 in. This combined error then gave a nominal inaccuracy of ± 20% in the area measured for the IR thermographic NDE data. In addition, the human factor associated with locat-ing inflection points in the IR thermogram frequently introduced more error, depending on the contrast discernible in any particular image.
The NDE area data extracted for the ultrasonic and eddy current methods were located with a nominal accuracy of ± 0.25 in. and measured to within ± 0.125 in. This combined error produced a nominal accuracy of ± 35% in these NDE measurements. Again, the human judgment factor played a role with respect to locating the edge of impact damage for all of the handheld NDE probes.
7.5 Results and Discussion
The data presented in this section are a portion of the overall database extension information collected during this test program. We have condensed a subset of the database and included it as appendices as follows:
• Appendix 7A, COPV Hydrostatic Burst Testing Baseline Data Summary Table
• Appendix 7B, Impact Data Summary Tables
• Appendix 7C, Multiple Impact Data Summary Tables
• Appendix 7D, Oblique Impact Data Summary Table
• Appendix 7E, Thermal and Pressure Cycling Data Summary Table
Each appendix contains data separated by vessel type and referenced by the WSTF number assigned to each vessel at program commencement.
7.5.1 Baseline Burst Testing
We performed baseline hydrostatic burst testing of the small spherical COPV and the small and large cylin-drical COPVs to establish correlation with the manufacturer’s test results and to assess the statistical vari-ance or scatter in BAI for undamaged COPVs. These data are tabulated in Appendix 7A.
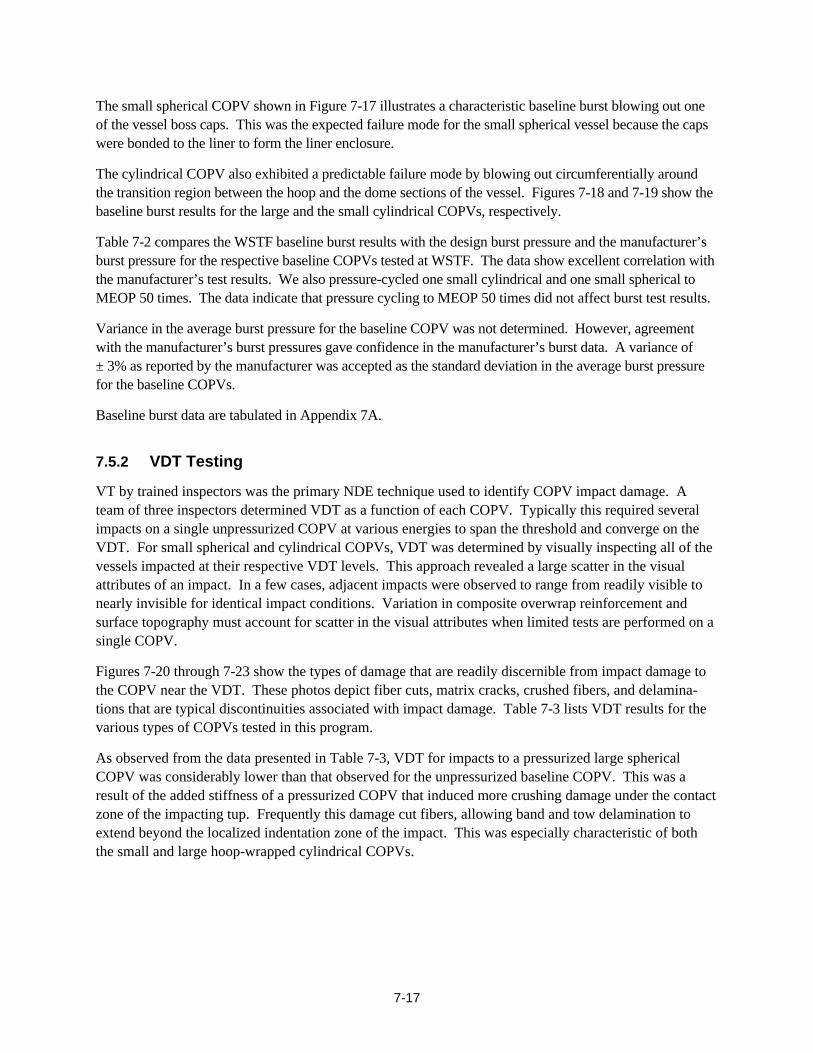
7-17
The small spherical COPV shown in Figure 7-17 illustrates a characteristic baseline burst blowing out one of the vessel boss caps. This was the expected failure mode for the small spherical vessel because the caps were bonded to the liner to form the liner enclosure.
The cylindrical COPV also exhibited a predictable failure mode by blowing out circumferentially around the transition region between the hoop and the dome sections of the vessel. Figures 7-18 and 7-19 show the baseline burst results for the large and the small cylindrical COPVs, respectively.
Table 7-2 compares the WSTF baseline burst results with the design burst pressure and the manufacturer’s burst pressure for the respective baseline COPVs tested at WSTF. The data show excellent correlation with the manufacturer’s test results. We also pressure-cycled one small cylindrical and one small spherical to MEOP 50 times. The data indicate that pressure cycling to MEOP 50 times did not affect burst test results.
Variance in the average burst pressure for the baseline COPV was not determined. However, agreement with the manufacturer’s burst pressures gave confidence in the manufacturer’s burst data. A variance of ± 3% as reported by the manufacturer was accepted as the standard deviation in the average burst pressure for the baseline COPVs.
Baseline burst data are tabulated in Appendix 7A.
7.5.2 VDT Testing
VT by trained inspectors was the primary NDE technique used to identify COPV impact damage. A team of three inspectors determined VDT as a function of each COPV. Typically this required several impacts on a single unpressurized COPV at various energies to span the threshold and converge on the VDT. For small spherical and cylindrical COPVs, VDT was determined by visually inspecting all of the vessels impacted at their respective VDT levels. This approach revealed a large scatter in the visual attributes of an impact. In a few cases, adjacent impacts were observed to range from readily visible to nearly invisible for identical impact conditions. Variation in composite overwrap reinforcement and surface topography must account for scatter in the visual attributes when limited tests are performed on a single COPV.
Figures 7-20 through 7-23 show the types of damage that are readily discernible from impact damage to the COPV near the VDT. These photos depict fiber cuts, matrix cracks, crushed fibers, and delamina-tions that are typical discontinuities associated with impact damage. Table 7-3 lists VDT results for the various types of COPVs tested in this program.
As observed from the data presented in Table 7-3, VDT for impacts to a pressurized large spherical COPV was considerably lower than that observed for the unpressurized baseline COPV. This was a result of the added stiffness of a pressurized COPV that induced more crushing damage under the contact zone of the impacting tup. Frequently this damage cut fibers, allowing band and tow delamination to extend beyond the localized indentation zone of the impact. This was especially characteristic of both the small and large hoop-wrapped cylindrical COPVs.

7-18
7.5.3 Typical Impact and Burst Testing
7.5.3.1 Typical Impact Test Results
Figures 7-24 and 7-25 show typical impact loading results for the small spherical COPV. Figure 7-24 shows the results of three separate impact tests on different small spherical COPVs overlaid to show the repeatability of the impact tests for identical conditions. The impacts were performed using a 0.5-in. hemispherical tup at an impact energy of 35 ft-lbf, with no internal pressure applied to the vessel. The secondary contact peak was not always observed for pressurized impacts, depending on how fast the vessel’s surface responded to the initial elastic deformation compared to the rebound time-of-flight of the impactor’s tup.
Note the sharp rise in the load curves at the beginning of the impact event. The peak associated with this rising edge indicates the elastic load limit of the impact event, while the energy absorption curve gives the total energy absorbed as a function of the impact duration. The oscillatory variation in the load curves indicates progressive damage as the impact event proceeds up to the maximum load value. The terminal value of the energy curves gives the total energy absorbed by the vessel during the impact event. This absorbed energy was distributed primarily into deformation and deflection work associated with indentation fracture of the fibers and local collapse of a spherical cap surrounding the impactor. Some smaller energy was also absorbed by the mechanical work associated with global flexure of the vessel and its boss connections.
Figure 7-25 contrasts the loading curves of impacts to pneumatically and hydrostatically MEOP-pressurized COPVs, respectively, compared to an unpressurized impact event. Note that the peak loads for impacts to pressurized vessels are more than double that for impacts to unpressurized vessels, while the duration is about one-half as long. Also, the second peak on the load curve was generated by a rebound of the vessel surface contacting the tup before it had time to fully rebound from the vessel proximity.
Impact data are tabulated in Appendix 7B.
7.5.3.2 Typical Burst Test Results
Vessels burst-tested after impact yielded consistent results, indicating failure at or near the point of impact. Figures 7-26 through 7-29 show typical photographs of these failures. Red indicator tape strips illustrate impact locations in Figures 7-26 through 7-28. A posttest photograph of a burst vessel shows the effectiveness of the enclosure to contain debris from a typical burst test (Figure 7-30).
7.5.3.3 Average Burst Strength after Impact
Appendices 7B and 7C give detailed results of the impact testing and statistical variance for each type of COPV. Most of the trend analyses were directed at correlating the normalized BAI and impact influence parameters. The large statistical spread in the normalized BAI contributed to poor correlation (R < 0.5) independent of any particular impact variable.
The data reduction did allow a statistical burst strength examination on six small spherical and six small cylindrical vessels (Table 7-4). The first column contains the impact conditions for each set of COPVs and corresponds to the nominal IDT values for unpressurized vessels impacted with the 0.5-in. hemi-

7-19
spherical tup. The data indicate that average burst strength decreased 16.2% for the small cylindrical COPVs and 26.3% for the small spherical COPVs.
7.5.3.4 Atypical Impact Test Results
The blast enclosure design proved effective for an actual unplanned pneumatic BUI event during impact of a 6000 psig (41.4 MPa) pressurized, small cylindrical COPV. The blast enclosure performed as de-signed, and the IMIT went unscathed. The BUI aftermath is shown in Figure 7-31 along with the remains of interior lighting used during high-speed film acquisition. There was some damage from the event to the floor and some expansion of the blast enclosure. All floor damage was repairable.
7.5.4 NDE Inspection
7.5.4.1 IR Thermography
Figure 7-32 shows a discontinuity associated with a small cylindrical COPV that was not detected by VT. The matrix crack and de-bond of the overwrap-to-liner interface in the transition zone of the cylindrical COPV was readily detectable with IR thermography. Although this discontinuity was observable on several of the small cylindrical COPVs, it did not degrade their strength and was eventually accepted as a permissible manufacturing defect for this type of vessel.
IR thermographic spot inspections of impacts to unpressurized COPVs were all readily observable at the VDT level. Figure 7-33 shows typical IR thermograms recorded for impacts at the VDT level for the various types of COPV. The VDT impact energy level was consistent with the 20% degradation IDT for all COPVs except the large spherical vessels. Attempts to correlate the IR thermographic damage area with the BAI of a COPV were not successful because of the high degree of scatter in COPV burst strength following impact under identical conditions (Tapphorn, Pellegrino, and Beeson 1996; Tapphorn et al. 1998).
Impacts to pressurized COPVs produced a less discernible IR thermographic signature because the liner deformation and separation no longer contributed to the discontinuity. In most cases, the IR thermogram from a pressurized impact did not show any damage beyond the crushed fiber region associated with the tup indentation.
7.5.4.2 Ultrasonic A-scan
We determined average impact damage areas with this NDE technique at the VDT level and used it to corroborate the IR thermographic NDE results. In general, the average impact-damaged area determined with ultrasonic A-scan exceeded the IR thermographic area because the method was more sensitive to kissing disbonds between the COPV overwrap and the liner. Attempts to correlate the ultrasonic A-scan damage area with the BAI of a COPV were not successful because of the high degree of scatter in the burst strength of a COPV following impact under identical conditions (Tapphorn, Pellegrino, and Beeson 1996; Tapphorn et al. 1998).
Figure 7-34 shows an A-scan profile of the ultrasonic signal used to distinguish undamaged from dam-aged zones. In the undamaged regions, two peaks were discernible. The early peak was the pulse-echo time-of-flight signal originating from the interface between the rubber eraser delay line and the outer

7-20
surface of the Gr/Ep composite. The delayed peak in the time-of-flight A-scan was associated with the pulse-echo reflection from the back surface of the metal liner.
By contrast, Figure 7-35 shows the A-scan ultrasonic signature of an impact zone. The lack of the sec-ond time-of-flight peak indicates that the liner was no longer in contact with the Gr/Ep COPV overwrap. Hence, the method provides a reliable technique for mapping out the damage zone area. We measured mean spatial diameters along two orthogonal directions of the damage-affected zone and used it to calcu-late an average circular area of damage.
Although coin tapping was demonstrated to be useful for assessing the extent of impact damage to pres-surized COPVs, the damage was generally restricted to localized crushing of fibers in the region of the tup indentation. In most cases, the detectable signature did not extend beyond the crushed fiber zone of the tup indentation. As a result, the ultrasonic A-scan NDE technique can be used only as a qualitative indicator of impact damage to supplement VT and to corroborate the IR thermographic images.
7.5.4.3 Eddy Current
Eddy current NDE was applicable only for inspecting impact damage to unpressurized COPVs in which the lift-off effect associated with liner deformation provided a signature that permitted mapping of the damaged area. The average damage areas were highly correlated with the IR thermographic average areas because both NDE techniques were equally sensitive to liner disbond and deformation resulting from localized impact deflection. As a result, the eddy current NDE technique was frequently not per-formed because it added no value over the IR thermographic NDE results. Also, the eddy current probe was influenced by the surface texture of the overwrap, which made the technique less reliable compared to IR thermographic analysis.
In addition, eddy current did not provide any indication outside of the visual attributes for inspecting impacts to pressurized COPV because the liner was not permanently deformed for these events.
7.5.4.4 Acoustic Emission
We collected AE signatures in the form of differential and accumulative spectra as a function of COPV pressure during the hydrostatic pressurization-to-burst for many of the COPVs tested in this program. Figures 7-36 and 7-37 show a cumulative spectrum of hits vs. pressure for undamaged and damaged COPVs (respectively). The more intense AE signatures recorded by a single transducer on the COPV inlet tube indicate that the onset of significant and continuous AE occurred at pressures well below the proof-pressure level for a damaged COPV. In contrast, a pristine COPV did not begin to emit strong AE signatures until the vessel pressure exceeded the previous proof-pressure level. This gave a Felicity ratio consistent with unity for undamaged COPVs.
Attempts to correlate the AE Felicity ratio with the BAI of a COPV were not successful because of the high degree of scatter in the burst strength of a COPV following impact under identical conditions (Tap-phorn, Pellegrino, and Beeson 1996; Tapphorn et al. 1998). As a result, the AE NDE technique can be used only as a qualitative indicator of potential impact damage to COPVs during pressurization. Al-though the AE NDE technique worked reasonably well for hydrostatically pressurized COPVs, it is doubtful that the technique could be applied to pneumatic pressurization applications because of the

7-21
competing AE noise generated from gas flowing through orifice structures. Attempts to perform this type of AE measurement during pneumatic pressurization were not successful.
7.5.4.5 X-ray Radiography
In no case did we find a defect using X-ray radiography that led to rejecting the vessel. This technique was very useful in locating the electrical discharge machining notches in flawed COPVs that were not visible to the eye; these results have been reported (Hare et al. 1998). It was also useful for locating and inspecting COPV liner weld seams for porosity. We detected a few occurrences of very fine porosity in the weld fusion zone of the large spherical vessels with stainless steel liners.
7.5.5 Trend Analysis
7.5.5.1 Impact Energy Effects
Impact energy had a strong influence on the BAI for all COPVs tested. Although the limited number of test articles precluded establishing statistically significant BAI averages with a high degree of confidence for each energy selected, the data trend indicates that for all COPVs the burst strength is degraded as the impact energy is increased.
The impact energy necessary to cause a nominal reduction of 20% in vessel burst strength varied between vessel types. With a 0.5-in. hemispherical tup, small spherical vessels required 28 ft-lbf of energy to de-crease the average burst strength by 20%, while the small cylindrical vessels required only 18 ft-lbf to reduce the average burst strength by the same amount. The average burst strength of a large cylindrical vessel was reduced by 20% with a 35 ft-lbf impact, while the large spherical vessels withstood a 100-ft-lbf impact with only a 14% reduction in the average burst strength.
The current hypothesis is that local deflection of the vessel in the impact damage area was the largest con-tributor to unpressurized COPV damage. Geometrically, a spherical vessel is stiffer than a cylindrical vessel. This greater stiffness, combined with a more favorable external ply layup pattern, caused the spheri-cal COPVs to resist deflection, indentation, and damage propagation and would account for the higher energy level required to damage them.
7.5.5.2 Impact Energy Dependence: Critical Impact Energy and Impact Damage Threshold
Figures 7-38 through 7-41 illustrate the maximum load measured for each type of COPV as a function of the impact energy for impacts to unpressurized COPVs. The plots depict the theoretical load curve (solid gray line) for an elastic response as defined by Poe for the flexure and Hertzian contact impact response (1990). The data points labeled “Damaged Load Response” give the maximum load response as meas-ured for the VDT and IDT test vessels at the respective impact energies.
The trend line for the VDT impacts shows a linear relationship between maximum load and the impact energy for the damaged COPVs. The slope of this line deviates significantly from the elastic response function. Thus, the COPV VDT can be used not only to assess the VDT, but also to define the maximum load for impacts that no longer have an elastic impact response. For most COPVs, the agreement be-tween the trend line for the damaged load response of a single VDT COPV and the maximum loads

7-22
measured for several IDT COPVs at various impact energies is consistent to within a variance of ± 10%. Only the small cylindrical COPV indicated a much larger variation from the established VDT trend line. This larger variation was attributed to differences in the burst strength characteristics of the small cylin-drical COPVs with respect to design, ply layup, and differing manufacturing lots.
The BAI test data are labeled “Normalized BAI (percent) for IDT COPVs” on the plots shown in Figures 7-38 through 7-41 for each different type of COPV. The right-hand axis represents the scale for the BAI data displayed as a function of impact energy. The trend line for this data is assumed to be a linear function with impact energy emanating from the undamaged (BAI = 100%) threshold at the critical impact energy. For all types of COPVs tested in this program, the linear relationship appears to be a reasonable trend line for the data considering a ± 6% standard deviation in the BAI for identical impact conditions at a given impact energy.
The trend line for the normalized BAI gives a method for mapping the 20% degradation level (80% BAI) into the IDT for a particular COPV. In addition, by using the BAI variance, one can also deduce the corresponding IDT variance.
7.5.5.3 Impact Location Effects
For small spherical vessels, impacts very near the boss caused less damage because of the added rein-forcement contributed by the bonded-in boss. Impacts in the equatorial region produced the same de-crease in vessel strength as impacts in the membrane regions of the vessel.
The effects of impact location on various regions of cylindrical vessels were more discernible than those for small spherical vessels. For the large cylindrical COPV, the mid-dome impacts degraded the vessel strength by an average of 34%. These impacts were imparted to the weakest region of the dome (Chang et al. 1993). Results of the mid-dome impacts at 15 ft-lbf to the small cylindrical COPV resulted in only a slight degradation of COPV burst strength.
An impact test in the center of the hoop wrap section for a small cylindrical vessel resulted in a 5% reduction of the normalized BAI, but failure did not occur at the impact point. For this case, the impact induced a more extended membrane deflection that caused failure to occur away from the impact site. Generally, the hoop ply layup on the small and large cylindrical COPVs is more susceptible to impact damage, particularly when the COPV is pressurized. No impact location tests were performed on the large spherical COPV; however, this type of vessel was so robust that impact location was not expected to change its BAI characteristics.
7.5.5.4 Impact Geometry Effects
We examined the effect of impactor geometry (0.5- vs. 1.0-in. hemispherical tups). Data indicate that, for unpressurized small spherical vessels, impactor geometry does not affect damage level. For unpres-surized small cylindrical vessels, the 1.0-in. hemispherical tup caused a damage level just slightly lower than the normal undamaged burst test.
We also further examined the effect of impactor geometry (0.25- vs. 0.5-in. hemispherical tups). Data indicate that, for both the pressurized (6000-psig hydraulic) and unpressurized conditions, small spherical vessels exhibited the same order of magnitude of damage for both tup sizes. For small spherical vessels

7-23
in the pressurized condition, impacts were performed at both the 25- and 35-ft-lbf levels with no signifi-cant change in damage level. The small cylindrical vessels tested in the pressurized condition showed the same damage level.
The 0.5-in. flat-faced cylindrical tup was applied to both vessel sizes, as previously described, in both the unpressurized and pressurized conditions. In the case of the small spherical vessel, damage in the un-pressurized condition was significant and well within the VDT range. In the pressurized condition, the same vessel exhibited a typical undamaged burst pressure level. The small cylindrical vessel exhibited unaffected damage levels for both pressure conditions.
The blade tup similar to a standard 0.25-in. screwdriver blade was tested only on threshold or practice vessel(s) in the unpressurized condition. Damage was so highly visible and drastic in nature that no test vessels were actually tested. At normal impact energy levels, full overwrap penetration was evidenced.
7.5.5.5 Pressurization and Pressurization Media Effects
Internal pressure had a significant effect on the damage sustained by most of the COPVs. For small spheri-cal vessels, internal pressure caused the vessel to be more impact-resistant because the added stiffness reduced the degree of localized deflection associated with hemispherical collapse of the vessel in the region surrounding the impact point. The pressurization media did not have a significant effect on the damage tolerance of small spherical vessels.
The data trends for impacts to pressurized COPVs are shown in Figures 7-42 through 7-45 for each type of COPV. The data trend indicates a slightly more impact-tolerant condition for most pressurized COPVs with the exception of small cylindrical COPVs. The additional BAI degradation of this vessel as a function of internal pressure during impact was attributed to vessel geometry and the unique hoop-ply wrap that tended to crush and cut fibers in the tup indentation region.
The added stiffness of small spherical COPVs pressurized to MEOP made them more impact resistant than the small cylindrical COPVs. Impact tolerance was observed to be lowered when pressurized with gaseous media than when pressurized with liquid media; in one instance, the vessel burst strength was reduced by an additional 10%. In another test involving gaseous media at MEOP, the vessel burst 0.7 s after impact, representing a 40% reduction in burst strength. Vessel remnants from this pneumatic burst are shown in Figure 7-46.
Large cylindrical COPVs were not tested as a function of pressurization media. The comparison of impacts to pressurized vs. unpressurized vessels indicated that the large cylindrical COPV may be slightly more tolerant to impacts when pressured hydrostatically, but not significantly outside the stan-dard deviation variation observed in the BAI. The large spherical COPV exhibited no BAI dependence on internal pressure or pressurization media for all vessels tested in the program.
In general, the maximum load increased on the average of a factor of 2.4 for all vessels when the COPV was pressurized to MEOP when compared to results from unpressurized tests. For the small cylindrical COPV, however, the maximum load increased by a factor of only 1.4. This lower value for maximum loading of impacts to the pressurized vessels was attributed to vessel geometry (L/D = 3) that permitted more global flexure during impact compared to the spherical vessels (L/D = 1) and the large cylindrical COPV (L/D = 1.9).

7-24
7.5.5.6 Multiple Impact Effects
Multiple impacts to small spherical COPVs degraded their burst strength well below one standard devia-tion of the average BAI for single impacts at the same impact energy (Appendix 7C). On the other hand, the burst strength of small cylindrical COPVs was not degraded beyond that observed for the average BAI associated with single impacts. Multiple impacts data are tabulated in Appendix 7C.
7.5.5.7 Oblique Impact Effects
The baseline COPV (WSTF # 93-27625) that normally impacts at the 15-ft-lbf energy level was hydro-statically pressurized to 9493 psig before failure. Post-burst examination indicated that the failure of this vessel was associated with the impact location, which is consistent with the three similar vessels im-pacted at the same 15-ft-lbf energy level using the IMIT (WSTF #s 93-27583, 93-27589, and 93-27593).
The oblique test COPV (WSTF # 93-27627) exhibited different behavior. The oblique impact on the aft end indicated a concentrated and visible scuff mark with a smaller trailing mark. However, the thermal NDE results showed no indication of the impact or separation of layers.
The hydrostatic burst test achieved a pressure of 10,542 psig before burst, which is in close agreement with the specified undamaged burst strength of 10,700 psig. Closer examination of the remnants also showed no internal evidence of the exterior oblique impact. Finally, the burst pattern was consistent with the normal mode of failure, i.e., end cap blowout on the inlet end. Thus, less damage is associated with the oblique impact when compared to an impact of the same level (15 ft-lbf) occurring normal to the surface. Oblique impact effects data are tabulated in Appendix 7D.
7.5.5.8 Pressure and Thermal Cycling Effects
The effects of impacting and pressure cycling three small spherical COPVs (WSTF #s 93-27528, 93-27540, and 93-27541) when compared to a set of three small spherical COPVs impacted identically without cycling (WSTF #s 93-27547, 93-27551, and 93-27552) resulted in no apparent degradation of burst strength due to the pressure cycles after impact.
The one thermally cycled small spherical COPV (WSTF # 96-29865) was also impacted before cycling; it burst at the same pressure as the three uncycled COPVs (WSTF #s 93-27547, 93-27551, and 93-27552) also in the damaged condition. Pressure and thermal cycling effects data are tabulated in Appendix 7E.
7.5.5.9 Performance Factor
Manufacturers have conventionally used the PV/W factor as a measure of performance for an undamaged COPV. This figure-of-merit could be downgraded to the BAI associated with the VDT (BAIVDT) level to account for potential damage to an unprotected COPV. We obtained a more important criterion for assessing the impact control requirement by comparing the BAIVDT level with the COPV design burst pressure BAI. Table 7-5 illustrates this comparison and shows the results for the various types of COPVs tested in this program and how this is used to determine implementation of impact control measures.
As indicated in Table 7-5, only COPVs with a BAIVDT in excess of the design burst pressure BAI may be used without impact indicators and protectors, provided the COPV is not pressurized during threats

7-25
greater than VDT with personnel exposed. In addition, all COPVs with any visible impact damage should be rejected and require MRB action for disposition.
7.5.6 Summary Comparison With Other COPV Studies
Table 7-6 summarizes a comparison of the joint USAF/NASA impact damage test results with those of other investigators. A detailed quantitative comparison was difficult to make because of the differences in vessel design among the various test programs. In general, the USAF/NASA test results identified vessel design/geometry, impact energy, and pressurization conditions during impact as the most signifi-cant variables influencing COPV BAI for fixed impactor geometry. This finding appears to be in com-plete agreement with previously reported work on impact susceptibility of Gr/Ep filament-wound pres-sure vessels. The most consistent agreement between previous work and the findings of this test program was that fiber fracture induced by impactor crushing and local deflection was the dominant failure mode leading to degradation of COPV burst strength.
Impact damage degradation reported by Adler et al. (1984) and Lloyd and Knight (1986) for the Mor-ton-Thiokol (5.75-in.-dia cylindrical) vessels appeared to be more severe compared to the 20% degrada-tion at 18 ft-lbf for the small cylindrical COPVs (6.6 in. dia x 20 in. long) tested at WSTF (Adler, Car-lyle, and Dorsey 1984). The same was true for the Gr/Ep motorcases tested by Patterson (1996), but these vessels were rigidly mounted in a V-block during impact. This difference was attributed to a thinner composite layup (0.06 to 0.08 in. vs. 0.104 in.) and a smaller length-to-diameter ratio (1.7 vs. 3.0) for the Morton-Thiokol cylindrical COPVs compared to the small cylindrical COPVs tested at WSTF, respectively. Composite thickness is a first-order influence parameter on the impact damage susceptibil-ity of a COPV. Finally, a large length-to-diameter ratio vessel was more impact-damage tolerant in the hoop region for an unpressurized COPV because it permitted global flexure as a secondary energy-absorbing mechanism.
The USAF/NASA test results were in good agreement with the work reported by Collins (1993 and 1994). VDT values measured by Collins were within an assigned uncertainty value of ± 5 ft-lbf for comparable COPVs tested at WSTF. IDT values at the 20% degradation level were comparable only for small spherical COPVs; energy levels reported by Collins were in complete agreement with the WSTF measurements. For the large spherical COPVs, neither Collins nor WSTF observed any degradation up to 50 ft-lbf. Even at 100 ft-lbf, WSTF observed only an approximately 15% degradation in the BAI. The design and geometry of the small cylindrical COPVs (3.7 in. dia x 9 in. long) tested by Collins were sufficiently different from the small cylindrical COPVs (6.6 in. dia x 20 in. long) tested at WSTF to make a quantitative comparison difficult. The WSTF test results with respect to impactor geometry and inter-nal pressurization of the COPV during impact were consistent with the findings reported by Collins.
The joint USAF/NASA Program at WSTF not only extended the existing database to large-scale spheri-cal and cylindrical COPVs, but the program was able to evaluate other influence parameters such as impact location, impactor geometry, multiple impacts, oblique impacts, pressure cycling, and stress rupture. Of greater importance, the joint USAF/NASA effort measured the statistical variance associated with the 20% degradation threshold for identical impact conditions that heretofore was poorly known. Procedures developed for performing VT and impact testing not only permitted measurement of the VDT and IDT at 20% degradation values for the COPVs tested, but defined the methodology for assessing impact control requirements for safe use of COPVs.
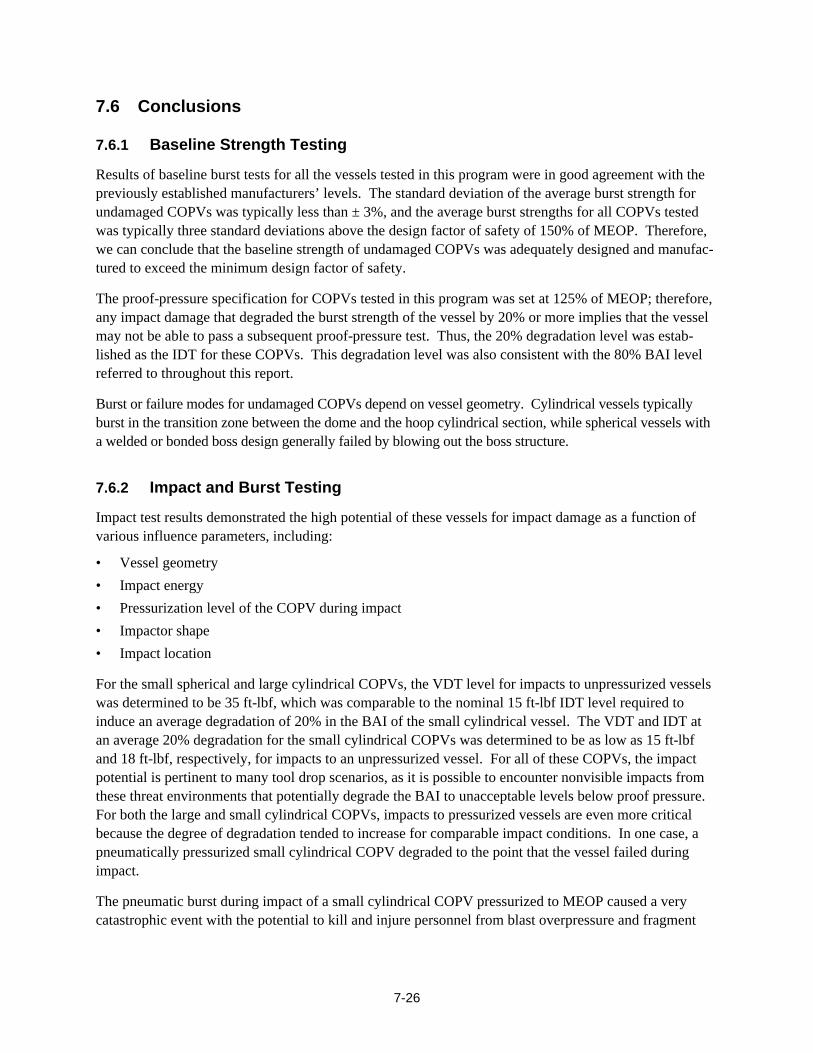
7-26
7.6 Conclusions
7.6.1 Baseline Strength Testing
Results of baseline burst tests for all the vessels tested in this program were in good agreement with the previously established manufacturers’ levels. The standard deviation of the average burst strength for undamaged COPVs was typically less than ± 3%, and the average burst strengths for all COPVs tested was typically three standard deviations above the design factor of safety of 150% of MEOP. Therefore, we can conclude that the baseline strength of undamaged COPVs was adequately designed and manufac-tured to exceed the minimum design factor of safety.
The proof-pressure specification for COPVs tested in this program was set at 125% of MEOP; therefore, any impact damage that degraded the burst strength of the vessel by 20% or more implies that the vessel may not be able to pass a subsequent proof-pressure test. Thus, the 20% degradation level was estab-lished as the IDT for these COPVs. This degradation level was also consistent with the 80% BAI level referred to throughout this report.
Burst or failure modes for undamaged COPVs depend on vessel geometry. Cylindrical vessels typically burst in the transition zone between the dome and the hoop cylindrical section, while spherical vessels with a welded or bonded boss design generally failed by blowing out the boss structure.
7.6.2 Impact and Burst Testing
Impact test results demonstrated the high potential of these vessels for impact damage as a function of various influence parameters, including:
• Vessel geometry
• Impact energy
• Pressurization level of the COPV during impact
• Impactor shape
• Impact location
For the small spherical and large cylindrical COPVs, the VDT level for impacts to unpressurized vessels was determined to be 35 ft-lbf, which was comparable to the nominal 15 ft-lbf IDT level required to induce an average degradation of 20% in the BAI of the small cylindrical vessel. The VDT and IDT at an average 20% degradation for the small cylindrical COPVs was determined to be as low as 15 ft-lbf and 18 ft-lbf, respectively, for impacts to an unpressurized vessel. For all of these COPVs, the impact potential is pertinent to many tool drop scenarios, as it is possible to encounter nonvisible impacts from these threat environments that potentially degrade the BAI to unacceptable levels below proof pressure. For both the large and small cylindrical COPVs, impacts to pressurized vessels are even more critical because the degree of degradation tended to increase for comparable impact conditions. In one case, a pneumatically pressurized small cylindrical COPV degraded to the point that the vessel failed during impact.
The pneumatic burst during impact of a small cylindrical COPV pressurized to MEOP caused a very catastrophic event with the potential to kill and injure personnel from blast overpressure and fragment
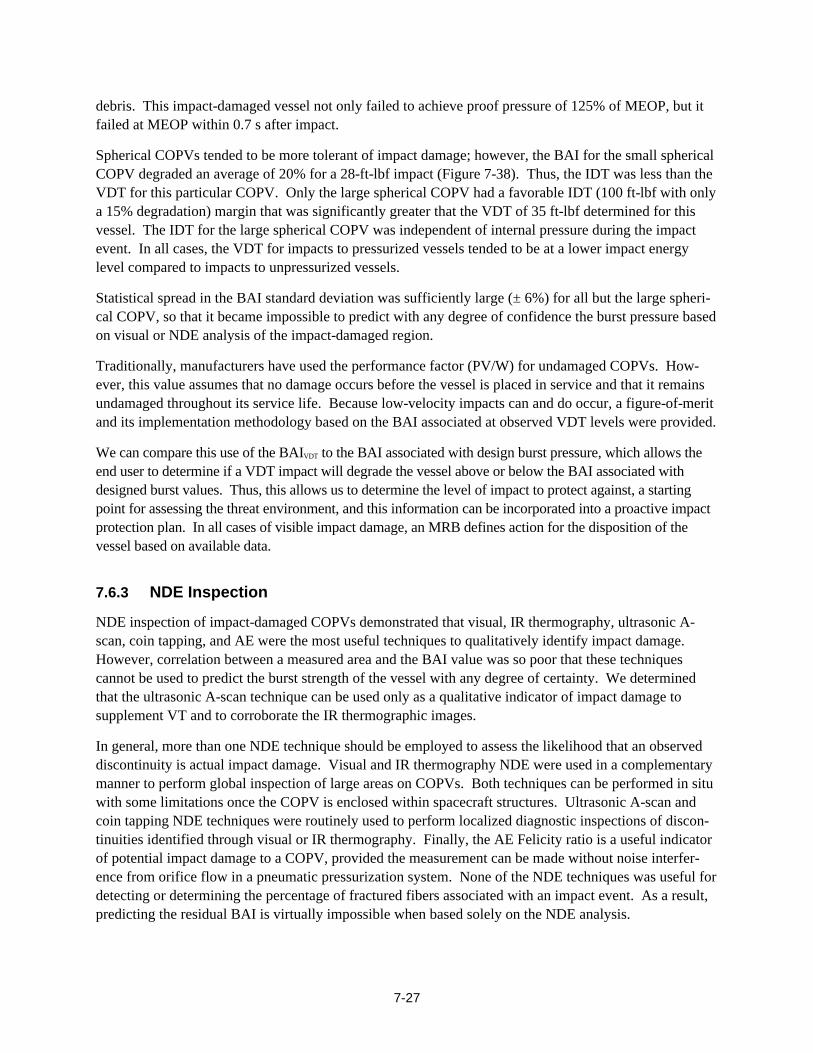
7-27
debris. This impact-damaged vessel not only failed to achieve proof pressure of 125% of MEOP, but it failed at MEOP within 0.7 s after impact.
Spherical COPVs tended to be more tolerant of impact damage; however, the BAI for the small spherical COPV degraded an average of 20% for a 28-ft-lbf impact (Figure 7-38). Thus, the IDT was less than the VDT for this particular COPV. Only the large spherical COPV had a favorable IDT (100 ft-lbf with only a 15% degradation) margin that was significantly greater that the VDT of 35 ft-lbf determined for this vessel. The IDT for the large spherical COPV was independent of internal pressure during the impact event. In all cases, the VDT for impacts to pressurized vessels tended to be at a lower impact energy level compared to impacts to unpressurized vessels.
Statistical spread in the BAI standard deviation was sufficiently large (± 6%) for all but the large spheri-cal COPV, so that it became impossible to predict with any degree of confidence the burst pressure based on visual or NDE analysis of the impact-damaged region.
Traditionally, manufacturers have used the performance factor (PV/W) for undamaged COPVs. How-ever, this value assumes that no damage occurs before the vessel is placed in service and that it remains undamaged throughout its service life. Because low-velocity impacts can and do occur, a figure-of-merit and its implementation methodology based on the BAI associated at observed VDT levels were provided.
We can compare this use of the BAIVDT to the BAI associated with design burst pressure, which allows the end user to determine if a VDT impact will degrade the vessel above or below the BAI associated with designed burst values. Thus, this allows us to determine the level of impact to protect against, a starting point for assessing the threat environment, and this information can be incorporated into a proactive impact protection plan. In all cases of visible impact damage, an MRB defines action for the disposition of the vessel based on available data.
7.6.3 NDE Inspection
NDE inspection of impact-damaged COPVs demonstrated that visual, IR thermography, ultrasonic A-scan, coin tapping, and AE were the most useful techniques to qualitatively identify impact damage. However, correlation between a measured area and the BAI value was so poor that these techniques cannot be used to predict the burst strength of the vessel with any degree of certainty. We determined that the ultrasonic A-scan technique can be used only as a qualitative indicator of impact damage to supplement VT and to corroborate the IR thermographic images.
In general, more than one NDE technique should be employed to assess the likelihood that an observed discontinuity is actual impact damage. Visual and IR thermography NDE were used in a complementary manner to perform global inspection of large areas on COPVs. Both techniques can be performed in situ with some limitations once the COPV is enclosed within spacecraft structures. Ultrasonic A-scan and coin tapping NDE techniques were routinely used to perform localized diagnostic inspections of discon-tinuities identified through visual or IR thermography. Finally, the AE Felicity ratio is a useful indicator of potential impact damage to a COPV, provided the measurement can be made without noise interfer-ence from orifice flow in a pneumatic pressurization system. None of the NDE techniques was useful for detecting or determining the percentage of fractured fibers associated with an impact event. As a result, predicting the residual BAI is virtually impossible when based solely on the NDE analysis.

7-28
We used X-ray radiography testing only to inspect the metallic liners of COPVs during their initial receipt. This NDE allowed for verification of liner integrity; however, it must be noted that in no case was a defect warranting rejection found. X-ray radiography was also useful in the location and inspec-tion of COPV liner weld seams, but the only visible defects seen were the minor and inconsequential presence of porosity.
7.6.4 Pressure and Thermal Cycling
Based on the pressure cycling data from testing performed on the small spherical COPV, the only con-clusion that can be reached is that this type of COPV is insensitive to cycling 50 times either by pressure cycling or by thermal cycling with impact damage at the VDT level. Thermal cycling of a similar un-damaged COPV had no effect on burst pressure.
7.7 Recommendations
We present the following recommendations from this research, test, and evaluation program:
• COPV manufacturers and users should make a concerted effort to use trained and experienced dam-age detection inspectors at each inspection point in their operations.
• COPV users should use some form of ICP and/or some form of COPV protection to minimize the threat of impact damage during all operations leading up to final mission assurance.
• Impact-damage thresholds (VDT and IDT) should be established for other designs and fiber systems that differ significantly from those tested either before or as part of qualification for use in spacecraft and launch vehicles. This is particularly important for the thin-wall propellant COPVs.
• The effects of long-term sustained load (beyond 6 mo) and post-impact load cycling (beyond 50 cycles) need to be addressed. Long-term (3-year) effects are being studied in a current ongoing NASA-funded COPV program phase using impact-damaged COPVs.
• Physical impact testing should continue, not only to increase the current database and provide im-proved statistical analysis, but to further refine the effects of major influence parameters, including pressurization state and media effects.
• A figure-of-merit approach for assessing the impact control requirements should be implemented for COPVs based on measuring and comparing the BAIVDT to the design burst pressure BAI. A BAIVDT < BAIDesign Burst Pressure requires an ICP that uses impact indicators and protectors. In all cases of visible im-pact damage, an MRB defines action for the disposition of the vessel based on available data.
• Research and development to improve the finite element analysis modeling of progressive impact damage mechanisms should continue. It is essential to understand how the residual strength of the composite can be predicted from NDE measurements and used to formulate safety-oriented or “safety-based” accept/reject criteria.
• Tup geometry effects on unpressurized and pressurized vessels should be characterized in much greater detail than was possible in this study.

7-29
Table 7-1. Gr/Ep COPV Test Articles - Physical Parameter Summary
Thickness Pressure
Shape Liner Material Size in. (cm)
Composite in.
(cm)
Liner In. (cm)
Volume in3
(cm3)
Mass lb (kg)
MEOP psig
(MPa)
Proof psig
(MPa)
Burst psig
(MPa)
Spherical Aluminum
Alloy (5086)
10.25 dia (26.04 dia)
0.162 (0.411)
0.050 (0.127)
484 (7931)
5.3 (2.4)
6000 (4.220
7500 (5.27)
10,600b
(7.45)
Spherical
Stainless Steel (301
CRES)
19 dia (48.26 dia)
0.168 (0.427)
0.033 (0.084)
3157 (51,730)
24.5 (11.1)
4500 (3.16)
5650 (3.97)
7280a (5.12)
Cylindrical Aluminum
Alloy (6061-T62)
6.6 dia x 20 long (16.76 dia x 50.80
long)
0.104 (0.356)
0.040 (0.102)
500 (8193)
5.3 (2.4)
6000 (4.22)
7500 (5.27)
10,700b (7.53)
Cylindrical Aluminum
Alloy (6061-T62)
13 dia x 25 long (33.02 dia x 63.50
long)
0.147 (0.373)
0.040 (0.102)
2650 (43,430)
16.7 (7.6)
4500 (3.16)
5650 (3.97)
7850c (5.52)
a Manufacturer’s data b Average of two WSTFand one manufacturer burst tests c Average of one WSTF and one manufacturer burst tests
Table 7-2. Baseline COPV Burst Test Results
COPV Type Design Burst
Pressure (psig)
Manufacturer’s Burst Pressure
(psig)
WSTF Baseline Burst Pressure
(psig)
Large spherical 6750 7280 NA
Small spherical 9000 10,420 10,823a 10,472b
Small cylindrical 9000 10,882 10,508a 10,691b
Large cylindrical 6750 7774 7919 a Burst test only b Cycle, then burst
NOTE: NA = Not available

7-30
Table 7-3. VDT Results for Subtask 3.3 COPVs
COPV Type Design Burst Pressure (psi)
VDT Impact Energy Unpressurized
(ft-lbf)
VDT Impact Energy at MEOP
(ft-lbf)
Large spherical 6750 35 5-10
Small spherical 9000 35 --
Small cylindrical 9000 15 --
Large cylindrical 6750 35 --
NOTE: -- means no information was available
Table 7-4. Statistical Burst Strength Results
Common Test Parameters WSTF Number Burst Pressure (psig)
BAI (%)
Small Cylindrical COPV 15 ft-lbf impact 93-27583 8246 77.1
0.5 in. tup 93-27593 8377 78.3
Hoop region 93-27631 9006 84.2
Unpressurized COPV 93-27589 9257 86.5
93-27632 9342 87.3
93-27628 9547 89.2
Average 8963 83.8
Standard deviation 535 5
% Variance of average 6 6
Small Spherical COPV 35 ft-lbf impact 93-27518 7136 67.3
0.5 in. tup 93-27547 7456 70.3
45 deg membrane region 93-27519 7816 73.7
Unpressurized COPV 93-27551 7917 74.7
93-27552 8187 77.2
93-27516 8400 79.2
Average 7819 73.7
Standard deviation 465 4
% Variance of average 6 6

7-31
Table 7-5. Assessment Impact Control Requirements for COPV
COPV Type CIE (ft-lbf)
VDT (ft-lbf)
BAIVDT
(%) Impact Control Requirementsa
Small spherical < 5 35 74 Yes - BAIVDT < 85%
Large spherical < 5 35 > 93 No - BAIVDT > 93%
Small cylindrical < 2.5 15 84 Yes - BAIVDT < 84%
Large cylindrical < 5 35 80 Yes - BAIVDT < 86% a Impact indicators or protectors required if BAIVDT is < design burst pressure BAI value
NOTE: Any visible impact > VDT requires MRB action for disposition
Table 7-6. Comparison of USAF/NASA Test Results with other COPV Studies
Variable USAF/NASA-WSTF Adler, Carlyle, and Dorsey (1984)
Lloyd and Knight (1986) Collins (1993 and 1994) Patterson (1996)
Instrumented Impactor
GRC Instron-Dynatup Model 8250
GRC Instron-Dynatup GRC Instron-Dynatup Model 8200
Rockwell Instrument-ed Impactor
GRC Instron-Dynatup
Tup Geometry 1 in. hemispherical, 0.5 in. hemispherical, 0.25 in. hemispherical Flat Blade
0.5 in. hemispherical 0.5 in. hemispherical 1 in. hemispherical, 0.5 in. hemispherical, Flat Chisel Corner
0.5 in. hemi-spherical
Vessel Design 6.6 in. dia x 20 in. long cylinder
5.75 in. dia x 5.75 in. long cylinder
5.75 in. dia x 4.0 in. long cylinder
3.7 in. dia x 9 in. long cylinder
5.0 in. dia x 12.5 in. long cylindri-cal motorcase
Design MEOP 6000 psi Not specified Not specified 4200 psi 3000 psi
Design Burst 9000 psi 4000 psi Not specified 5900 psi 4500 psi
Liner 6061-T62 Al liner Thick-ness: 0.040 in.
Not specified Not specified 6061 Al liner Thickness: 0.090 in.
Not specified
Graphite Fiber Type
T-1000 Thickness: 0.104 in.
AS-4 IM-6 Thickness: 0.060 to 0.068 in.
T-40 IM-6 HS-46 Thickness: 0.030 to 0.180 in.
T-1000 Thickness: 0.028 in.
IM-6 Thickness: 0.055 in.
Epoxy Resin SCIREZ UFX82-17 UF3298 UFX84-08 ERX-4T ERL1908 5245C V388A
SCIREZ Not specified
Layup Pattern
X: Polar O: Hoop
Ext. Hoop Ply Ext. Hoop Ply Ext. Polar Ply Layup (XOOOOX)
Ext. Hoop Ply Layup (XXOOOO)
Not specified Ext. Helical/Hoop Layup (XOXO)
Vessel Design 13 in. dia x 25 in. long cylinder
Not specified 18 in. dia x 10 in. long cylinder
Not specified Not specified
Design MEOP 6000 psi Not specified Not specified Not specified Not specified
Design Burst 6750 psi Not specified Not specified Not specified Not specified
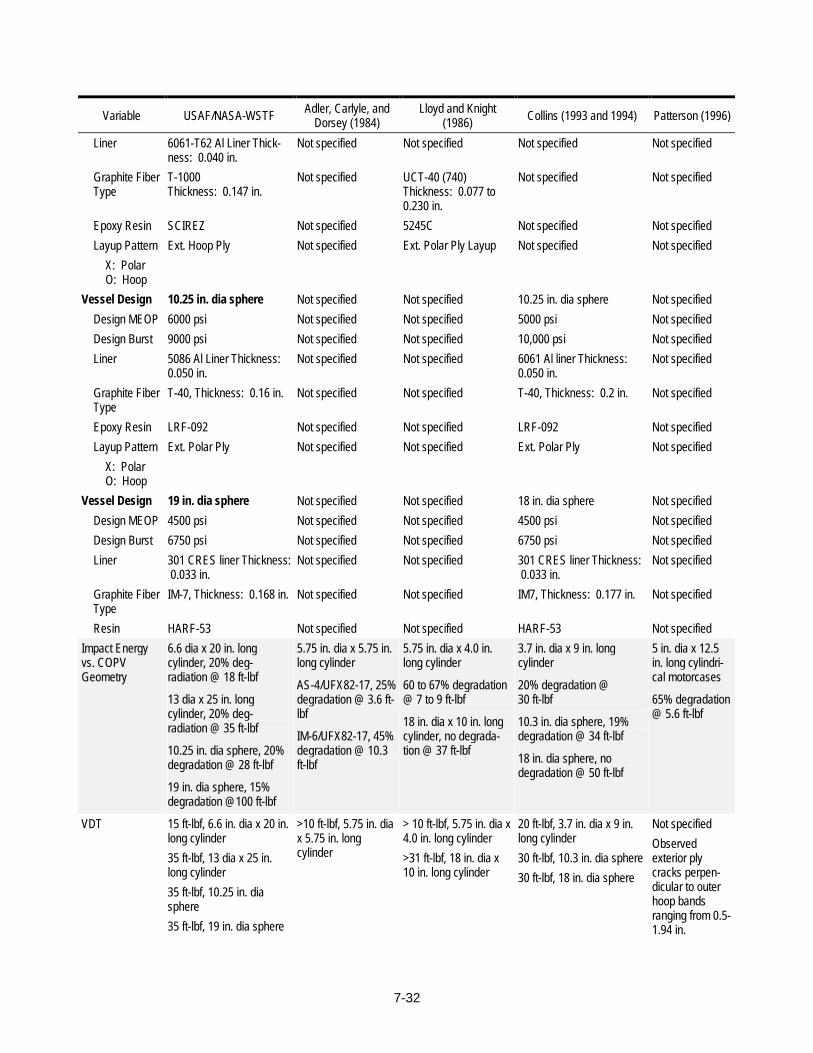
7-32
Variable USAF/NASA-WSTF Adler, Carlyle, and Dorsey (1984)
Lloyd and Knight (1986) Collins (1993 and 1994) Patterson (1996)
Liner 6061-T62 Al Liner Thick-ness: 0.040 in.
Not specified Not specified Not specified Not specified
Graphite Fiber Type
T-1000 Thickness: 0.147 in.
Not specified UCT-40 (740) Thickness: 0.077 to 0.230 in.
Not specified Not specified
Epoxy Resin SCIREZ Not specified 5245C Not specified Not specified
Layup Pattern
X: Polar O: Hoop
Ext. Hoop Ply Not specified Ext. Polar Ply Layup Not specified Not specified
Vessel Design 10.25 in. dia sphere Not specified Not specified 10.25 in. dia sphere Not specified
Design MEOP 6000 psi Not specified Not specified 5000 psi Not specified
Design Burst 9000 psi Not specified Not specified 10,000 psi Not specified
Liner 5086 Al Liner Thickness: 0.050 in.
Not specified Not specified 6061 Al liner Thickness: 0.050 in.
Not specified
Graphite Fiber Type
T-40, Thickness: 0.16 in. Not specified Not specified T-40, Thickness: 0.2 in. Not specified
Epoxy Resin LRF-092 Not specified Not specified LRF-092 Not specified
Layup Pattern
X: Polar O: Hoop
Ext. Polar Ply Not specified Not specified Ext. Polar Ply Not specified
Vessel Design 19 in. dia sphere Not specified Not specified 18 in. dia sphere Not specified
Design MEOP 4500 psi Not specified Not specified 4500 psi Not specified
Design Burst 6750 psi Not specified Not specified 6750 psi Not specified
Liner 301 CRES liner Thickness: 0.033 in.
Not specified Not specified 301 CRES liner Thickness: 0.033 in.
Not specified
Graphite Fiber Type
IM-7, Thickness: 0.168 in. Not specified Not specified IM7, Thickness: 0.177 in. Not specified
Resin HARF-53 Not specified Not specified HARF-53 Not specified
Impact Energy vs. COPV Geometry
6.6 dia x 20 in. long cylinder, 20% deg-radiation @ 18 ft-lbf
13 dia x 25 in. long cylinder, 20% deg-radiation @ 35 ft-lbf
10.25 in. dia sphere, 20% degradation @ 28 ft-lbf
19 in. dia sphere, 15% degradation @100 ft-lbf
5.75 in. dia x 5.75 in. long cylinder
AS-4/UFX82-17, 25% degradation @ 3.6 ft-lbf
IM-6/UFX82-17, 45% degradation @ 10.3 ft-lbf
5.75 in. dia x 4.0 in. long cylinder
60 to 67% degradation @ 7 to 9 ft-lbf
18 in. dia x 10 in. long cylinder, no degrada-tion @ 37 ft-lbf
3.7 in. dia x 9 in. long cylinder
20% degradation @ 30 ft-lbf
10.3 in. dia sphere, 19% degradation @ 34 ft-lbf
18 in. dia sphere, no degradation @ 50 ft-lbf
5 in. dia x 12.5 in. long cylindri-cal motorcases
65% degradation @ 5.6 ft-lbf
VDT 15 ft-lbf, 6.6 in. dia x 20 in. long cylinder
35 ft-lbf, 13 dia x 25 in. long cylinder
35 ft-lbf, 10.25 in. dia sphere
35 ft-lbf, 19 in. dia sphere
>10 ft-lbf, 5.75 in. dia x 5.75 in. long cylinder
> 10 ft-lbf, 5.75 in. dia x 4.0 in. long cylinder
>31 ft-lbf, 18 in. dia x 10 in. long cylinder
20 ft-lbf, 3.7 in. dia x 9 in. long cylinder
30 ft-lbf, 10.3 in. dia sphere
30 ft-lbf, 18 in. dia sphere
Not specified
Observed exterior ply cracks perpen-dicular to outer hoop bands ranging from 0.5-1.94 in.

7-33
Variable USAF/NASA-WSTF Adler, Carlyle, and Dorsey (1984)
Lloyd and Knight (1986) Collins (1993 and 1994) Patterson (1996)
Internal Pressure Induced more degrada-tion damage for hoop ply layup of cylindrical COPV, less damage for spherical designs
Not evaluated Simulated propellant reduced fiber damage associated with deflection, particularly for external polar layup
3.7 in. dia x 9 in. long cylinder (2000 psi), <6% degradation @ 20 to 30 ft-lbf
10.3 in. dia sphere; no burst tests, only VT verified less damage occurs under pressurized impact
18 in. dia sphere, not evaluated under pressure
Simulated propellant produced no significant differences in damage degra-dation with respect to BAI
Pressurization Media
No statistically significant differences for gas vs. water
Not evaluated Simulated propellant Pneumatically pressurized impact tests at 0.5 MEOP
Simulated propellant
Pressure Cycling (Post-impact)
No effect on enhancing damage degradation
Not evaluated Not evaluated Liner failure on 18 in. dia sphere after 750 cycles, not induced by 30 ft-lbf impact (1 in. tup)
Not evaluated
Impact Location Significant effect for cylinders depending on length to dia ratios and hoop vs. dome regions
Not evaluated Not evaluated Not evaluated Not evaluated
Impactor Geometry
Predominantly 0.5 in. tup with other tup comparisons
Tup ranking order (most- to least-detectable damage): Blade (Most) 0.25 in. 0.5 in. 1 in. Flat tup (Least)
Not evaluated Not evaluated 1 in. tup, 3.7 in. dia x 9 in. long cylinder, 10.25 in. dia sphere, 18 in. sphere
0.5 in. tup, 10.25 in. dia sphere, 18 in. sphere
Chisel and corner tup evaluations
Tup ranking order (most- to least-detectable damage): Chisel (Most) Corner 0.5 in. 1 in. Flat tup (Least)
Not evaluated
Multiple Impacts Damage degradation additive for stiff spherical design; cylindrical geome-try more tolerant of multiple impacts
Not evaluated Not evaluated No accumulative effect with widely spaced multiple impacts
Not evaluated
Oblique Impacts Normal angle impacts represent worst case damage degradation
Not evaluated Not evaluated Not evaluated Not evaluated
Stress Rupture No degradation over 6 mo @ MEOP; 3 year test in progress
Not evaluated Not evaluated Not evaluated Not evaluated
Fiber Fracture Dominant factor for indentation crushing damage and associated deflection damage
Dominant factor in damage degradation
Dominant factor in damage degradation
Dominant factor for indentation crushing damage and associated deflection damage
Predominant damage-induced failure mode not identified; slight fiber fracture cause for

7-34
Variable USAF/NASA-WSTF Adler, Carlyle, and Dorsey (1984)
Lloyd and Knight (1986) Collins (1993 and 1994) Patterson (1996)
concern
Delamination Not tested as pre-existing defect
Not tested as pre-existing defect
Not significant if no associated fiber fracture
Not tested as pre-existing defect
Not conclusive with respect to failure mode
Ply Layup Increased damage deg-radation observed with external hoop ply layup for both unpressurized and pressurized cylindrical COPV
Variations not evaluated
Not conclusive; hoop design more damage tolerant compared to external polar design, dependent on polar-to-hoop stress ratio
Not evaluated Not evaluated
Composite Thickness
Not tested for identical COPV design and geometry
Not evaluated Discovered that maxi-mum damage degra-dation (60%) occurs at 0.075 in. thick com-pared to thinner or thick layup designs for a 4.5 ft-lbf impact
Not tested for identical COPV design and geome-try
Not tested for identical COPV design and geometry
Toughened Resins
Not tested for identical COPV design and geometry
No significant differ-ences observed for two different resins
Little effect in prevent-ing fiber fracture
Not tested for identical COPV design and geome-try
Not evaluated
Overwrap Protection
Overlap plies not tested; evaluated removable protection designs
Not evaluated; study identified poor damage tolerance of Kevlar compared to Gr/Ep overwrap
Kevlar overwrap reduces damage degradation
Not evaluated Not evaluated
NOTE: - - means no information was available.

7-35
Figure 7-1. COPV testing: process flow and data acquisition path.
VisualInspection
Visual Inspection Report& Photographs
Pre-Impact Evaluation IRThermography
X-Ray (liners only)
IR Thermographs,Data Sheets,
Photographs & VisualInspection
Impact
Post-Impact NDE
Impact Parameters,Impactor Data Sheets,Photographs & Visual
Inspection
Visual Inspection, IRThermographs,
Ultrasonic Water;Eddy Current (optional)
Tracking &Documentation Package
Initiated
Long-termStorage
Hydrostatic Burst;Acoustic Emmision (optional)
PressureCycles
Subtask3.4
Pressure Cycle Data &Visual Inspection
DATA ACQUISITION
Burst Data, Photographs,Acoustic Emission &
Visual Inspection
YES
YES
YES
Physical ArchiveCOPV Database
Extension,Evaluation, andTrend Analysis
Documents
COPVRECEIVING

7-36
Figure 7-2. Four representative Gr/Ep COPV test articles.
Figure 7-3. The IMIT system.

7-37
Figure 7-4. Oblique impact test setup.
Figure 7-5. Special I-beam frame.

7-38
Figure 7-6. Close-up view of mounted COPV and tup assembly.
Figure 7-7. Blast enclosure.

7-39
Figure 7-8. Typical time-based data output.

7-40
Figure 7-9. Lexan enclosure designed to isolate the test article, with 4 in. dia x 9 in. long COPV installed.
Figure 7-10. Close-up view of Lexan blast enclosure with mounted 6.6 in. dia x 20 in. long COPV.
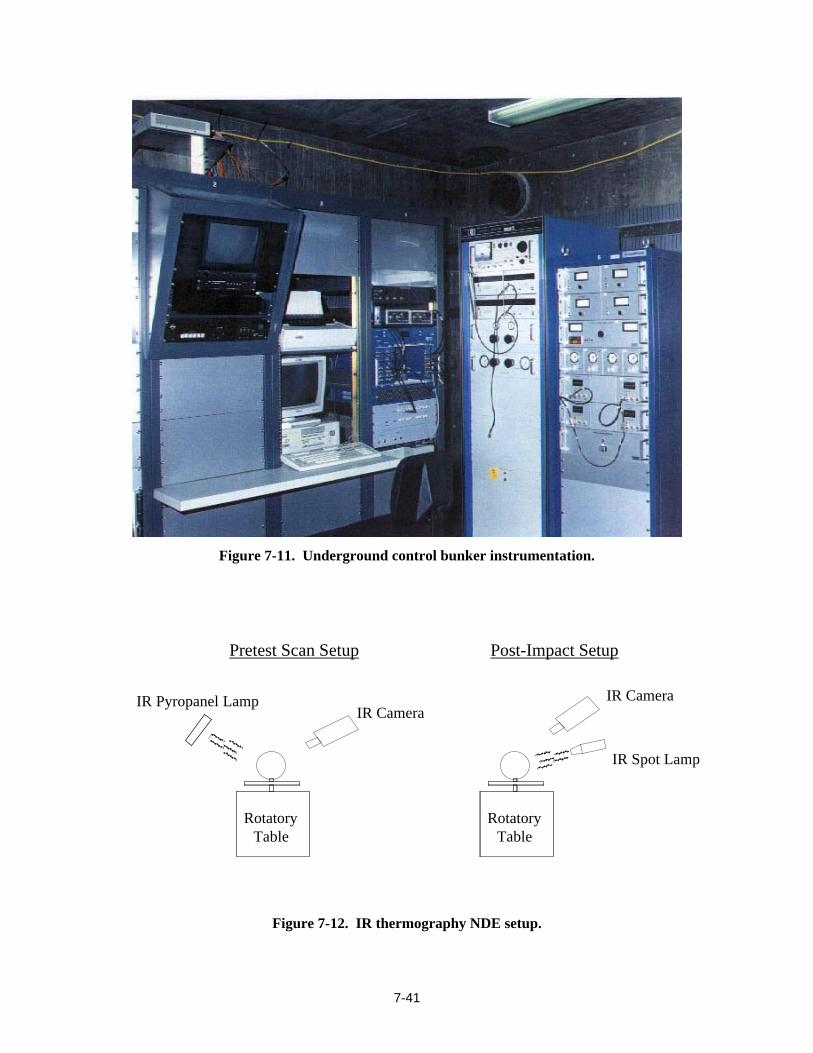
7-41
Figure 7-11. Underground control bunker instrumentation.
Figure 7-12. IR thermography NDE setup.
IR Camera
IR Spot Lamp
RotatoryTable
IR CameraIR Pyropanel Lamp
RotatoryTable
Pretest Scan Setup Post-Impact Setup

7-42
Figure 7-13. Three-dimensional temperature distribution map of COPV impact damage zone.

7-43
COPV1 MHz Hand Probe
(Ultra-Gel Couplant)
PanametricsOscilloscope
Figure 7-14. Ultrasonic A-scan NDE setup.
COPV
400 kHz Hand Probe
Magnaflux
Figure 7-15. Eddy current NDE setup.
COPVAE Sensor
PT
LOCAN-320
Lexan Burst Cell
Figure 7-16. Acoustic emission NDE setup.

7-44
Figure 7-17. Baseline burst: small spherical COPV.
Figure 7-18. Baseline burst: large cylindrical COPV.

7-45

7-46
Figure 7-19. Baseline burst: small cylindrical
COPV.
Figure 7-20. Typical fiber cuts.

7-47
Figure 7-21. Typical matrix cracks.
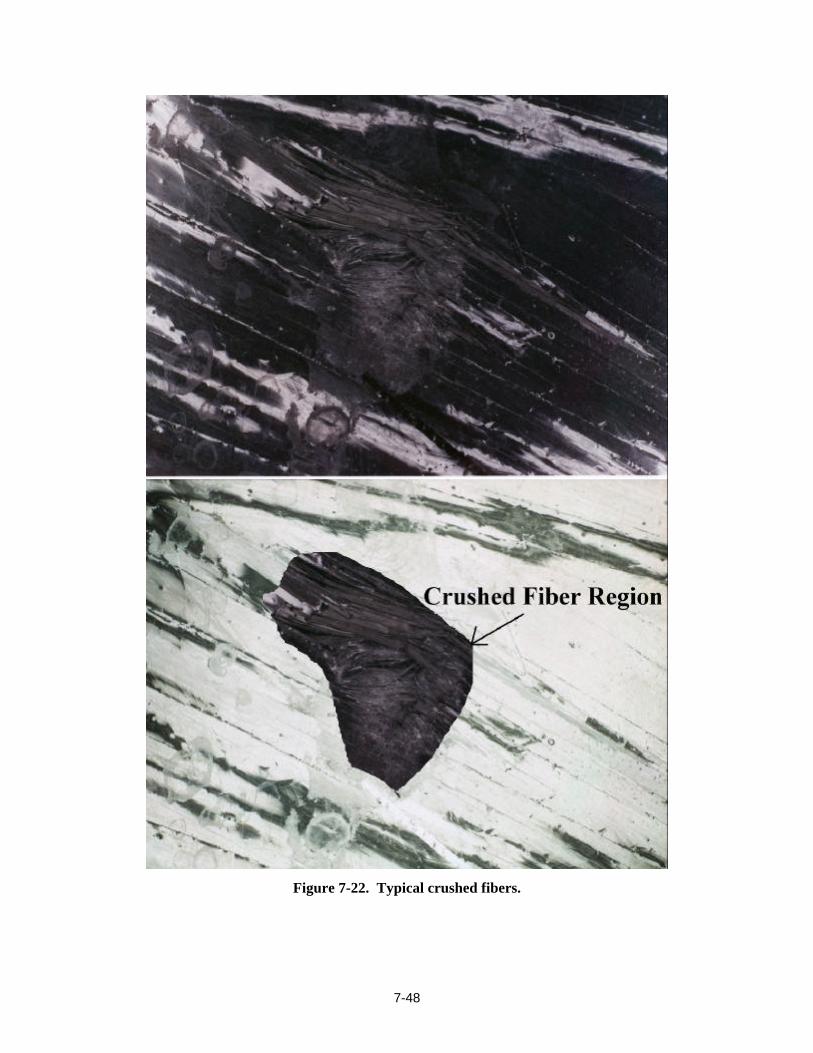
7-48
Figure 7-22. Typical crushed fibers.

7-49

7-50
Figure 7-23. Typical delamina-tions.
0
200
400
600
800
1000
1200
1400
1600
0 1 2 3 4 5 6 7 8 9 10 11 12
TIME (ms)
LO
AD
(lb
f)
0
5
10
15
20
25
30
35
40
Load Curves
Energy Curves
Figure 7-24. Load-energy response of unpressurized 10.25-in.-dia spherical COPV impacted at 35 ft-lb.
0
500
1000
1500
2000
2500
3000
3500
4000
0 1 2 3 4 5 6 7 8 9 10
TIME (ms)
LO
AD
(lb
f)
UNP PNEU
HYD

7-51
Figure 7-25. Load-energy response of pressurized 10.25-in.-dia spherical COPV impacted at 35 ft-lb.
Figure 7-26. Typical burst after impact of a small spherical
COPV.

7-52
Figure 7-27. Typical burst after impact of a large spherical
COPV.
Figure 7-28. Typical burst after impact of a small cylindrical
COPV.

7-53
Figure 7-29. Typical burst after impact of a large cylindrical
COPV.
Figure 7-30. Lexan enclosure with burst COPV.
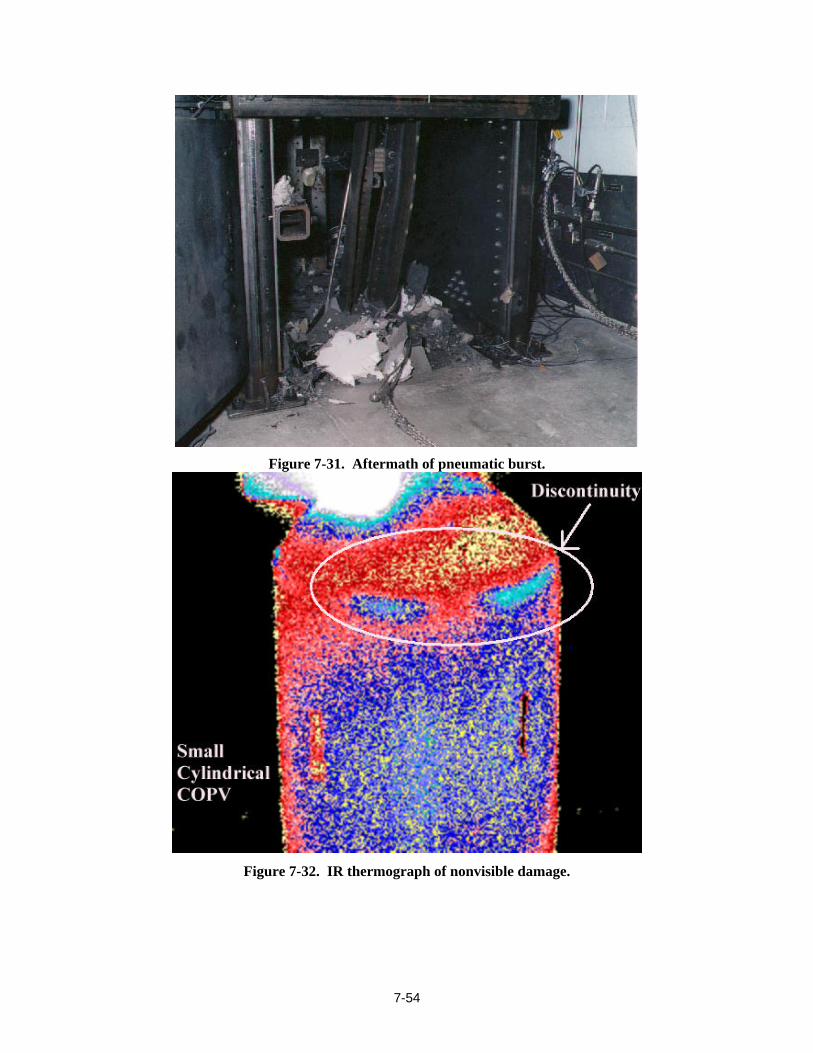
7-54
Figure 7-31. Aftermath of pneumatic burst.
Figure 7-32. IR thermograph of nonvisible damage.
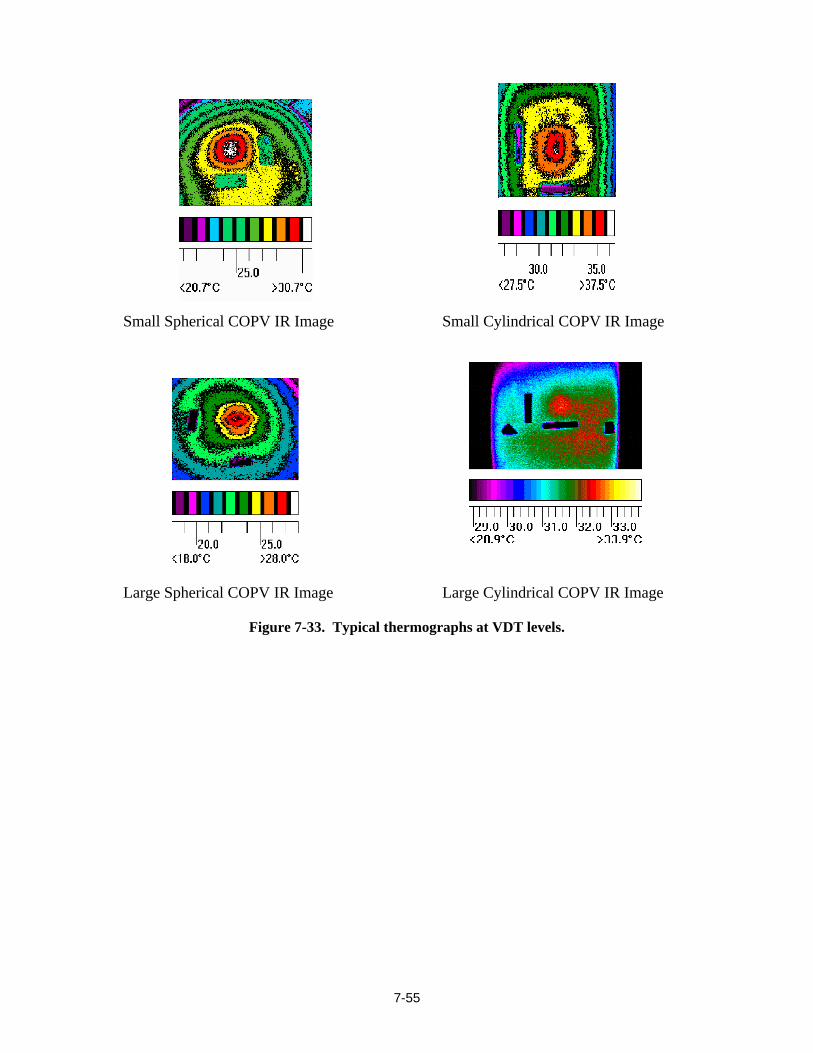
7-55
Figure 7-33. Typical thermographs at VDT levels.
Small Spherical COPV IR Image
Large Spherical COPV IR Image
Small Cylindrical COPV IR Image
Large Cylindrical COPV IR Image

7-56
UT A-Scan of Undamaged COPV
0
10
20
30
40
50
60
70
80
90
100
11 14 17 20 23 26 29 32 35 38 41
Time (microseconds)
Am
plit
ud
e (%
)
Figure 7-34. Ultrasonic A-scan of undamaged COPV.
0
10
20
30
40
50
60
70
80
90
100
11 14 17 20 23 26 29 32 35 38 41
Time (microseconds)
Am
plit
ud
e(%
)
Figure 7-35. Ultrasonic A-scan of damaged COPV.

7-57
Figure 7-36. Acoustic emission spectra of an undamaged COPV.
Num
ber o
f Hits
Pressure (psig)
Num
ber o
f Hits
Pressure (psig)

7-58
Figure 7-37. Acoustic emission spectra of an impact-damaged COPV.
Pressure (psig)
Num
ber o
f Hits
N
umbe
r of H
its
Pressure (psig)
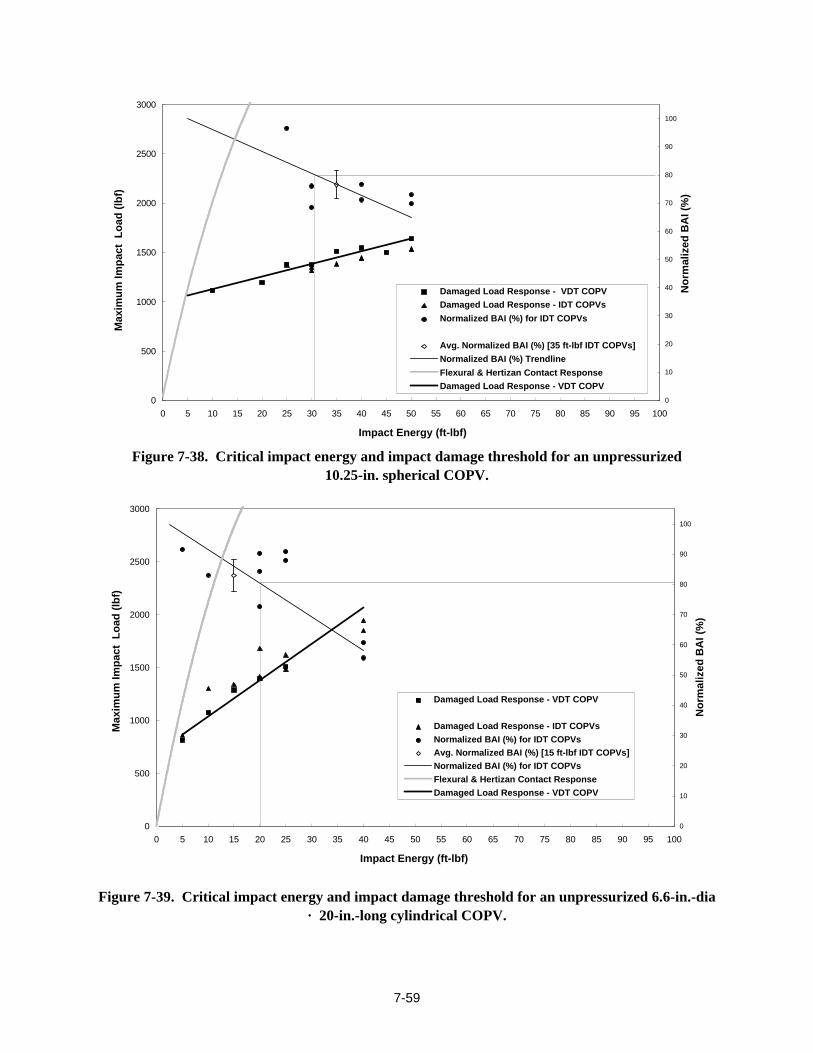
7-59
Figure 7-38. Critical impact energy and impact damage threshold for an unpressurized 10.25-in. spherical COPV.
Figure 7-39. Critical impact energy and impact damage threshold for an unpressurized 6.6-in.-dia × 20-in.-long cylindrical COPV.
0
500
1000
1500
2000
2500
3000
0 5 10 15 20 25 30 35 40 45 50 55 60 65 70 75 80 85 90 95 100
Impact Energy (ft-lbf)
Max
imu
m Im
pac
t L
oad
(lb
f)
0
10
20
30
40
50
60
70
80
90
100
No
rmal
ized
BA
I (%
)
Damaged Load Response - VDT COPVDamaged Load Response - IDT COPVs
Normalized BAI (%) for IDT COPVs
Avg. Normalized BAI (%) [35 ft-lbf IDT COPVs]Normalized BAI (%) Trendline
Flexural & Hertizan Contact ResponseDamaged Load Response - VDT COPV
0
500
1000
1500
2000
2500
3000
0 5 10 15 20 25 30 35 40 45 50 55 60 65 70 75 80 85 90 95 100
Impact Energy (ft-lbf)
Max
imu
m Im
pac
t L
oad
(lb
f)
0
10
20
30
40
50
60
70
80
90
100
No
rmal
ized
BA
I (%
)Damaged Load Response - VDT COPV
Damaged Load Response - IDT COPVsNormalized BAI (%) for IDT COPVsAvg. Normalized BAI (%) [15 ft-lbf IDT COPVs]Normalized BAI (%) for IDT COPVsFlexural & Hertizan Contact ResponseDamaged Load Response - VDT COPV

7-60
Figure 7-40. Critical impact energy and impact damage threshold for an unpressurized 13-in.-dia × 25-in.-long cylindrical COPV.
Figure 7-41. Critical impact energy and impact damage threshold for an unpressurized 19-in. spherical COPV.
0
1000
2000
3000
4000
5000
6000
0 5 10 15 20 25 30 35 40 45 50 55 60 65 70 75 80 85 90 95 100
Impact Energy (ft-lbf)
Max
imu
m Im
pac
t L
oad
(lb
f)
0
10
20
30
40
50
60
70
80
90
100
No
rmal
ized
BA
I (%
)
Damaged Load Response - VDT COPV
Damaged Load Response for IDT COPVsNormalized BAI (%) for IDT COPVs
Normalized BAI (%) for IDT COPVsFlexural & Hertizan Contact ResponseDamaged Load Response - VDT COPV
0
1000
2000
3000
4000
5000
6000
0 5 10 15 20 25 30 35 40 45 50 55 60 65 70 75 80 85 90 95 100 105 110 115 120
Impact Energy (ft-lbf)
Max
imu
m Im
pac
t L
oad
(lb
f)
0
10
20
30
40
50
60
70
80
90
100
No
rmal
ized
BA
I (%
)
Damaged Load Response - VDT COPV
Damaged Load Response - IDT COPVsNormalized BAI (%) for IDT COPVs
Flexural & Hertzian Contact ResponseDamaged Load Response - VDT COPVNormalized BAI (%) Trendline

7-61
Figure 7-42. Data trend for 10.25-in. spherical COPVs.Figure 7-43. Data trends for 6.6-in.-dia × 20-in.-long cylindrical COPVs.
Figure 7-44. Data trend for 13-in.-dia × 25-in.-long cylindrical COPVs.Figure 7-45. Data trend for 19-in. spherical COPVs.
6
6
7
7
8
8
9
9
10
10
Pressure Condition at
Ave
rag
e N
orm
aliz
ed B
AI
35 ft-lbf impact loading
35 ft-lbf impact + 6 mo. sustained loading at
UNPRESSURIZ MEOP HYDROSTAT
MEOP PNEUMAT
60
65
70
75
80
85
90
95
100
105
UNPRESSURIZED MEOPHYDROSTATIC
Pressure Condition at Impact
Ave
rag
e N
orm
aliz
ed B
AI (
%)
35 ft-lbf impact loading only
35 ft-lbf impact + 6 mo. sustained loading at MEOP
60
65
70
75
80
85
90
95
100
105
UNPRESSURIZED MEOPHYDROSTATIC
MEOPPNEUMATIC
Pressure Condition at Impact
No
rmal
ized
BA
I (%
)
100 ft-lbf impact loading only
100 ft-lbf impact + 6 mo. sustained loading at MEOP
6
6
7
7
8
8
9
9
10
10
UNPRESSURIZ 1/2 MEOP HYDROSTA
MEOP HYDROSTA
MEOP PNEUMAT
Pressure Condition at
15 ft-lbf impact loading 15 ft-lbf impact + 6 mo. sustained loading at
Ave
rag
e N
orm
aliz
ed B
AI
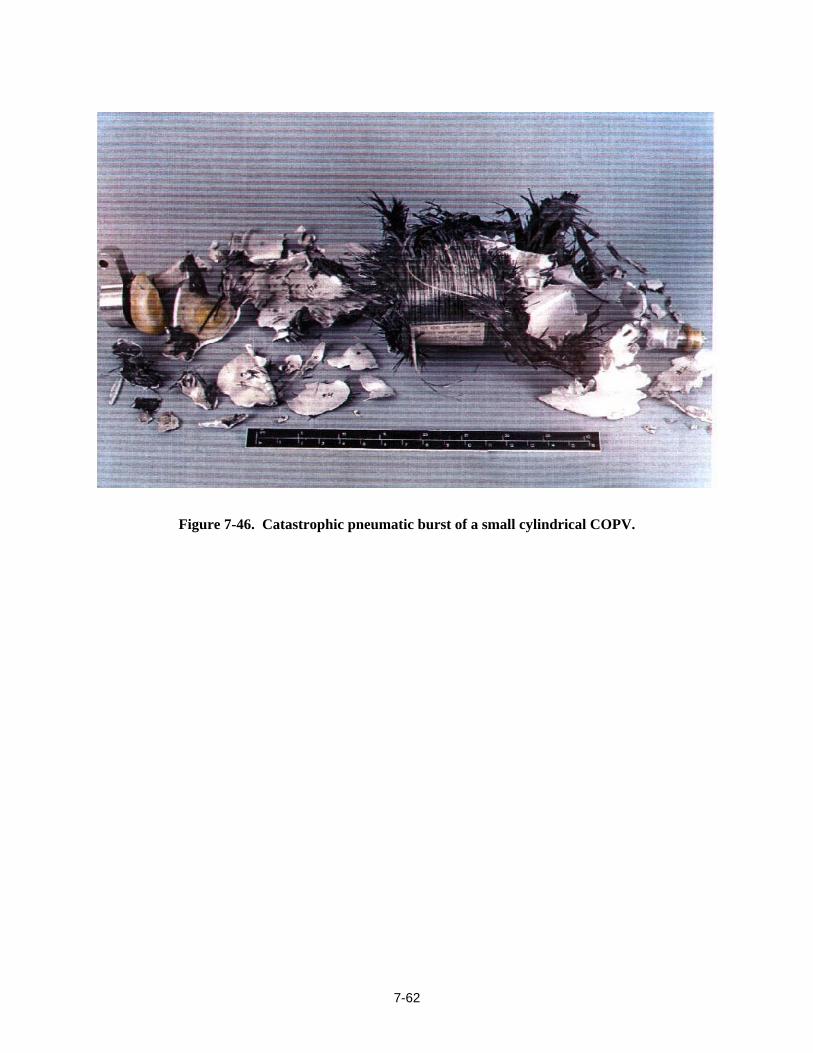
7-62
Figure 7-46. Catastrophic pneumatic burst of a small cylindrical COPV.

References
63
Adler, W. F., J. D. Carlyle, and J. J. Dorsey. Damage Tolerance Assessment of Six-inch Composite Pressure Vessels. Vol. 1-Technical Discussion, CR-84-1263, General Research Corp., Santa Barbara, CA, April l, 1984.
Ambur, D. R., C. B. Prasad, and W. A. Waters, Jr. “A Dropped-weight Apparatus for Low-speed Impact Testing of Composite Structure.” Experimental Mechanics, Vol. 35, No. 1 (March 1995): pp. 77-82.
Beeson, H. D., K. S. Payne, J. B. Chang, J. P. Nokes, R. M. Tapphorn, W. L. Ross, and D. D. Davis. “Ef-fects of Impact Damage and Fluid Exposure on Graphite/Epoxy Composite Overwrapped Pressure Ves-sels.” 32nd AIAA/ASME/SAE/ASEE Joint Propulsion Conference, Lake Buena Vista, FL, July 1-3, 1996.
Carins, D. S. Impact and Post-Impact Response of Graphite/Epoxy and Kevlar/Epoxy Structures. Ph.D. Dissertation, Massachusetts Institute of Technology, Boston, MA, August 1987.
Chang, J. B., S. T. Chiu, E. C. Johnson, D. R. Langley, G. L. Steckel, W. M. Zelinsky, H. D. Beeson, W. L. Ross, L. A. Bailey, and M. R. Cain. Enhanced Technology for Composite Overwrapped Pressure Ves-sels Program Plan, Rev. D. The Aerospace Corporation, El Segundo, CA, August 1993.
Chang, J. B., H. D. Beeson, M. R. Cain, W. L. Ross and D. D. Davis. “Experimental Evaluation of Space Flight Composite Overwrapped Pressure Vessels.” Paper at the 1994 JANNAF Structures & Me-chanical Behavior Subcommittee and Nondestructive Evaluation Subcommittee Meeting. Hill AFB, UT, October 24-28, 1994.
Chang, J. B., S. T. Chiu, H. D. Beeson, and K. S. Payne. “Damage Tolerance Assessment of Space Flight Composite Overwrapped Pressure Vessels.” 37th AIAA/ASME/ASCE/AHS/ASC Structures, Structural Dynamics and Materials Conference, Salt Lake City, UT, April 18-19, 1996.
Collins, T. E. “Impact Testing of Graphite Composite Overwrapped Vessels at Rockwell.” Proceedings of the 1993 Workshop on Impact Damage Testing and Analysis of Carbon Composite Pressure Ves-sels. NASA White Sands Test Facility, Las Cruces, NM, September 1993.
Collins, T. E., J. P. Rogers, and G. E. Cord. “Impact Damage and Residual Strength in Graphite Epoxy, Composite, Metal Lined, Pressure Vessels.” Preliminary Report, Rockwell Aerospace, Downey, CA, 1994.
Connolly, M. P. “The Detection of Impact Damage in Composite Pressure Vessels Using Source Loca-tion Acoustic Monitoring.” In Proceedings of the 31st AIAA/ASME/SAE/ASEE Joint Propulsion Conference and Exhibit, AIAA 95-2911, San Diego, CA, July 10-12, 1995.
Downs, K. S. and M. A. Hamstad. “Acoustic Emission from Depressurization to Detect/Evaluate Sig-nificance of Impact Damage to Graphite/Epoxy Pressure Vessels.” Journal of Composite Materials, Vol. 32, No. 3 (1998): pp. 258-307.

References (continued)
7-64
Downs, K. S. and M. A. Hamstad. “Relationships of Composite Manufacturing Parameters of Filament Wound Graphite/Epoxy Vessels to Their Acoustic Emission Characteristics.” In Proceedings of the 40th International SAMPE Symposium/Exhibition, Anaheim, CA, May 8-11, 1995a.
Downs, K. S. and M. A. Hamstad. “High Sensor Density Acoustic Emission Monitoring of Graphite/ Epoxy Pressure Vessels.” In Proceedings of the Fifth International Symposium on Acoustic Emission from Composite Material. Committee on Acoustic Emission from Reinforced Plastics (CARP) and the American Society for Nondestructive Testing. Sundsvall, Sweden, July 10-14, 1995b.
Downs, K. S. and L. W. Loechel. “Composite Overwrapped Pressure Vessels.” WL-TR-96-8007, (Lockheed Martin) Manufacturing Technology Directorate Wright Laboratory, U. S. Air Force Mate-rial Command, Wright Patterson AFB, OH, April 1996.
Gros, X. E. “Review of NDT Techniques for Detection of Low Energy Impacts in Carbon Reinforce-ments.” Society for the Advancement of Material and Process Engineering (SAMPE) Journal, Vol. 31, No. 2 (March/April 1995): pp. 29-33.
Hamstad, M. A. and T. T. Chiao. “Acoustic Emission Produced During the Burst Test of Filament-Wound Bottles.” Journal of Composite Materials, Vol. 7 (July 1973): pp. 320-332.
Hamstad, M. A. and K. S. Downs. “On Characterization and Location of Acoustic Emission Sources in Real Size Composite Structures.” Journal of Acoustic Emission, Vol. 13, Nos. 1-2 (1995): pp. 31-34.
Hare, C. A., W. L. Ross, H. D. Beeson, and H. T. Johnson. USAF/COPV Program Subtask 3.4: Sus-tained Load/Impact Effect Testing of Graphite/Epoxy Composite Overwrapped Pressure Vessels (COPVs). TR-807-001, NASA White Sands Test Facility, Las Cruces, NM, August 24, 1998.
Hill, E. v. K., J. L. Walker, Jr., and G. H. Rowell. “Burst Pressure Prediction in Graphite/Epoxy Pressure Vessels Using Neural Networks and Acoustic Emission Amplitude Data.” Materials Evaluation, Vol. 54, No. 6 (June 1996): pp. 744-748.
Johnson, E. C. and J. P. Nokes. “Nondestructive Evaluation Techniques Assessment for Gr/Ep Compos-ite Overwrapped Pressure Vessels.” Final Report for Task IV of the Enhanced Technology for COPV Test Plan, The Aerospace Corporation, El Segundo, CA, 1998.
Kwon, Y. S. and B. V. Sankar. “Indentation-Flexure and Low-Velocity Impact Damage in Graphite Epoxy Laminates.” Journal of Composites Technology & Research, Vol. 15, No. 2 (1993): pp. 101-111.
Lagace, P. A., K. F. Ryan, and M. J. Graves. “Effect of Damage on the Impact Response of Composite Laminates.” AIAA Journal, Vol. 32, No. 6 (June 1994): pp. 1328-1330.
Lloyd, B. A. and G. K. Knight. “Impact Damage Sensitivity of Filament Wound Composite Pressure Vessels.” 1986 JANNAF Propulsion Meeting, New Orleans, LA, August 1986.
MIL-STD-453C. Military Standard. Inspection, Radiographic. U.S. Department of Defense, Washing-ton, DC (1984).

References (continued)
7-65
Nettles, A. T. Instrumented Impact and Residual Tensile Strength Testing of Eight-Ply Carbon/ Epoxy Specimens. NASA TP-2981, NASA Marshall Space Flight Center, Huntsville, AL, January 1990.
Nokes, J. P., F. Izaguirre, J. R. Hribar, R. L. Ruis, and E. C. Johnson. “Nondestructive Evaluation of Gr/Ep Composite Overwrapped Pressure Vessels.” Review of Progress in Quantitative Nondestruc-tive Evaluation, Vol. 13B, D. O. Thompson and D. E. Chimenti, Eds., pp. 1307-1312, New York, NY, 1994.
Patterson, J. “Impact Response of Loaded Graphite/Epoxy Motorcase Simulants.” Paper presented at the 1996 JANNAF Propulsion and Joint Subcommittee Meetings, Albuquerque, NM, December 9-13, 1996.
Poe, Jr., C. C. Relevance of Impacter Shape to Nonvisible Damage and Residual Tensile Strength of a Thick Graphite/Epoxy Laminate. NASA Technical Memorandum 102599, NASA Langley Research Center, Hampton, VA, January 1990.
Qian, Y., S. R. Swanson, R. J. Nuismer, and R. B. Bucinell. “An Experimental Study of Scaling Rules for Impact Damage in Fiber Composites.” Journal of Composite Materials, Vol. 24 (May 1990): pp. 559-570.
Raju, P. K., J. R. Patel, and U. K. Vaidya. “Characterization of Defects in Graphite Fiber Based Com-posite Structures Using the Acoustic Impact Technique (AIT).” Journal of Testing and Evaluation, Vol. 21, No. 5 (September 1993): pp. 377-395.
Sierakowski, R. L. and G. M. Newaz. Damage Tolerance in Advanced Composites. Technomic Publish-ing Co., Lancaster, PA, 1995.
Svenson, A. L., M. W. Hargrave, L. C. Bank, and S. Y. Bishan. “Data Analysis Techniques for Impact Tests of Composite Materials.” Journal of Testing and Evaluation, Vol. 22, No. 5 (September 1994): pp. 431-441.
Swanson, S. R. “Mechanics of Transverse Impact in Fiber Composite Plates and Cylinders.” Journal of Reinforced Plastics and Composites, Vol. 12 (March 1993): pp. 256-267.
Tapphorn, R. M., W. L. Ross, Sr., H. D. Beeson, and H. T. Johnson. Impact Damage Effects and Control Applied to Composite Overwrapped Pressure Vessels. TR-806-001, NASA White Sands Test Facil-ity, Las Cruces, NM, July 29, 1998.
Tapphorn, R. M., L. Starritt, and H. D. Beeson. “NDE Techniques Applied to Impact-Damage Testing of Carbon Overwrapped Pressure Vessels.” Paper at the 1995 JANNAF Propulsion and Subcommittee Meeting, Tampa, FL, December 4-8, 1995.
Tapphorn, R. M., P. Pellegrino, and H. D. Beeson. “Nondestructive Evaluation and Health Monitoring of Graphite/Epoxy Composite Overwrapped Pressure Vessels.” Paper presented at the 1996 JANNAF Propulsion and Joint Subcommittee Meetings, Albuquerque, NM, December 9-13, 1996.
Wolcott, E. “Assessing the Damage Tolerance of Composite Motor Cases for Tactical Missile Systems.” 1993 JANNAF Propulsion Meeting, Monterey, CA, October 1993.
References (continued)
7-66
Wolf, E. Failure Mechanics in Low-Velocity Impacts on Thin Composite Plates. NASA TP-2152, NASA Langley Research Center, Hampton, VA, May 1983.
Zalameda, J. N., G. L. Farley, and B. T. Smith. “A Field Deployable Nondestructive Impact Damage Assessment Methodology for Composite Structures.” Journal of Composites Technology & Re-search, Vol. 16, No. 2 (April 1994): pp. 161-169.

Appendix 7A
COPV Baseline Data Summary Table

7A-1
COPV BASELINE DATA
SUMMARY TABLE
WSTF Number
COPV Shape
COPV Size (in.)
Liner Material
Liner Thickness
(in.)
MEOP (psig)
Proof Pressure
(psig)
Designed Burst
Pressure (psig)
Nominal Burst
Pressure (psig)
Burst Pressure
(psig)
Residuala Burst
Strength (%)
93-27507 Spherical 10.25 ∅ 5086-T0 Aluminum 0.050 6000 7500 9000 10600 10823 102.1
93-27508 Spherical 10.25 ∅ 5086-T0 Aluminum 0.050 6000 7500 9000 10600 10800 101.9
93-27509b Spherical 10.25 ∅ 5086-T0 Aluminum 0.050 6000 7500 9000 10600 10472 98.8
93-27537 Spherical 10.25 ∅ 5086-T0 Aluminum 0.050 6000 7500 9000 10600 10656 100.5
93-27562 Spherical 10.25 ∅ 5086-T0 Aluminum 0.050 6000 7500 9000 10600 10492 99.0
93-27568 Spherical 10.25 ∅ 5086-T0 Aluminum 0.050 6000 7500 9000 10600 10937 103.2
93-27578a Cylindrical 6.6 ∅ x 20
6061-T62 Aluminum
0.040 6000 7500 9000 10700 10691 99.9
93-27580 Cylindrical 6.6 ∅ x 20
6061-T62 Aluminum
0.040 6000 7500 9000 10700 10508 98.2
93-27598 Cylindrical 6.6 ∅ x 20
6061-T62 Aluminum
0.040 6000 7500 9000 10700 9556 89.3
93-27602 Cylindrical 6.6 ∅ x 20
6060-T62 Aluminum
0.040 6000 7500 9000 10700 11064 103.4
93-27608 Cylindrical 6.6 ∅ x 20
6061-T62 Aluminum
0.040 6000 7500 9000 10700 11048 103.3
93-27617 Cylindrical 6.6 ∅ x 20
6061-T62 Aluminum
0.040 6000 7500 9000 10700 10500 98.1
93-27655 Cylindrical 13 ∅ x 25
6061-T62 Aluminum
0.040 4500 5650 6750 7850 7568 96.4
93-27656 Cylindrical 13 ∅ x 25
6061-T62 Aluminum
0.040 4500 5650 6750 7850 7919 100.9
a Relative to nominal b 50 pressure cycles
Appendix 7B
Impact Data Summary Tables

Impact Data Summary Table: Small Spherical COPVs (10.25 in. dia)
7B-1
Liner Material: 5086-T0 Aluminum MEOP: 6000 psig
Liner Thickness: 0.050 in. Proof Pressure: 7500 psig
Graphite Fiber Type: T-40 Design Burst Pressure: 9000 psig
Overwrap Thickness: 0.162 in. Nominal Burst Pressure: 10,600 psig
WSTF Number
Impactor Tup Geometry
Impact Location/ Region
COPV Pressurant
COPV Internal Pressurea
Impact Force (lbf)
Impact Deflection (in.)
Impact Energy Measured
Impact Energy Absorbed
Burst Pressure (psig)
Residual Burst Strength (%)
93-27506 0.5 in. hemi-spherical
Membrane-Blind
Water 6000 3807.00 0.14 33.92 34.14 9914 93.5
93-27511 0.5 in. hemi-spherical
Boss-Blind Air 12.8 1433.50 0.17 24.53 19.87 10725 101.2
93-27514 0.5 in. hemi-spherical
Membrane-Inlet
Air 12.8 1536.83 0.44 50.48 51.14 7399 69.8
93-27515 0.5 in. hemi-spherical
Membrane-Blind
Air 12.8 1442.14 0.4 39.53 34.14 8145 76.8
93-27516 0.5 in. hemi-spherical
Membrane-Blind
Air 12.8 1491.50 0.38 35.16 29.2 8400 79.2
93-27517 0.5 in. hemi-spherical
Membrane-Blind
Air 12.8 1374.85 0.27 24.48 19.88 10243 96.6
93-27518 0.5 in. hemi-spherical
Membrane-Blind
Air 12.8 1503.37 0.34 34.65 33.85 7136 67.3
93-27519 0.5 in. hemi-spherical
Membrane-Blind
Air 12.8 1434.80 0.41 35.33 32.23 7816 73.7
93-27520 1.0 in. hemi-spherical
Membrane-Blind
Air 12.8 1454.83 0.37 34.71 34.46 8707 82.1
93-27522 0.5 in. hemi-spherical
Membrane-Blind
Water 6000 3718.19 0.15 34.04 34.27 9417 88.8
93-27523 1.0 in. hemi-spherical
Membrane-Blind
Air 12.8 1367.28 0.02 34.47 30.89 9826.2 92.7
93-27524 1.0 in. hemi-spherical
Membrane-Blind
Air 12.8 1388.18 0.36 34.25 27.7 9294 87.7
93-27526 0.5 in. hemi-spherical
Membrane-Blind
Water 6000 3501.87 0.15 34.07 34.31 9294 87.7
93-27527 0.5 in. hemi-spherical
Equator Band
Air 12.8 1559.38 0.38 34.43 28.63 8920 84.2
93-27528b 0.5 in. hemi-spherical
Membrane-Blind
Air 12.8 1527.24 0.39 34.57 29.39 8157 77
a 12.8 psi is absolute (local WSTF ambient); all others are psig (gauge) b 50 pressure cycles
NOTE: M = second impact for multiply impacted COPVs

Impact Data Summary Table: Small Spherical COPVs (10.25 in. dia) (continued)
7B-2
WSTF Number
Impactor Tup Geometry
Impact Location/ Region
COPV Pressurant
COPV Internal Pressurea
Impact Force (lbf)
Impact Deflection (in.)
Impact Energy Measured
Impact Energy Absorbed
Burst Pressure (psig)
Residual Burst Strength (%)
93-27538 0.5 in. hemi-spherical
Membrane-Blind
GN2 6300 3380.30 0.11 33.94 31.25 10496 99
93-27539 0.5 in. hemi-spherical
Membrane-Blind
GN2 6300 3383.99 0.12 34.07 30.44 9396 88.6
93-27540b 0.5 in. hemi-spherical
Membrane-Blind
Air 12.8 1264.01 0.29 34.61 29.41 9113 86
93-27541b 0.5 in. hemi-spherical
Membrane-Blind
Air 12.8 1319.16 0.33 34.64 28.43 8894 84
93-27543 0.5 in. hemi-spherical
Membrane-Blind
Air 12.8 1353.99 0.35 29.68 24.09 7262 68.5
93-27544 0.5 in. hemi-spherical
Membrane-Blind
Water 6000 3774.84 0.14 34.18 34.41 6980 65.8
93-27544M
0.5 in. hemi-spherical
Membrane-Blind
Water 6000 3704.56 0.11 34.22 34.43
93-27545 0.5 in. hemi-spherical
Membrane-Blind
Water 6000 3829.97 0.14 34.03 34.25 7469 70.5
93-27545M
0.5 in. hemi-spherical
Membrane-Blind
Water 6000 3650.98 0.15 34.13 34.35
93-27546 0.5 in. hemi-spherical
Membrane-Blind
Air 12.8 1379.08 0.38 33.73 28.74 6542 61.7
93-27546M
0.5 in. hemi-spherical
Membrane-Blind
Air 12.8 1490.95 0.51 33.68 25.94
93-27547 0.5 in. hemi-spherical
Membrane-Blind
Air 12.8 1381.44 0.42 34.16 28.33 7456 70.3
93-27548 0.5 in. hemi-spherical
Membrane-Blind
Air 12.8 1386.73 0.4 33.91 28.49 7637 72
93-27548M
0.5 in. hemi-spherical
Membrane-Blind
Air 12.8 1465.22 0.39 34.13 25.42
93-27549 0.5 in. hemi-spherical
Membrane-Blind
Air 12.8 1358.69 0.43 33.93 28.48 8397 79.2
93-27550 0.5 in. hemi-spherical
Membrane-Blind
Air 12.8 1309.90 0.32 34.07 30.38 6462 61
93-27550M
0.5 in. hemi-spherical
Membrane-Blind
Air 12.8 1228.24 0.45 34.29 27.06
93-27551 0.5 in. hemi-spherical
Membrane-Blind
Air 12.8 1319.83 0.42 34.17 29.25 7917 74.7
a 12.8 psi is absolute (local WSTF ambient); all others are psig (gauge) b 50 pressure cycles
NOTE: M = second impact for multiply impacted COPVs
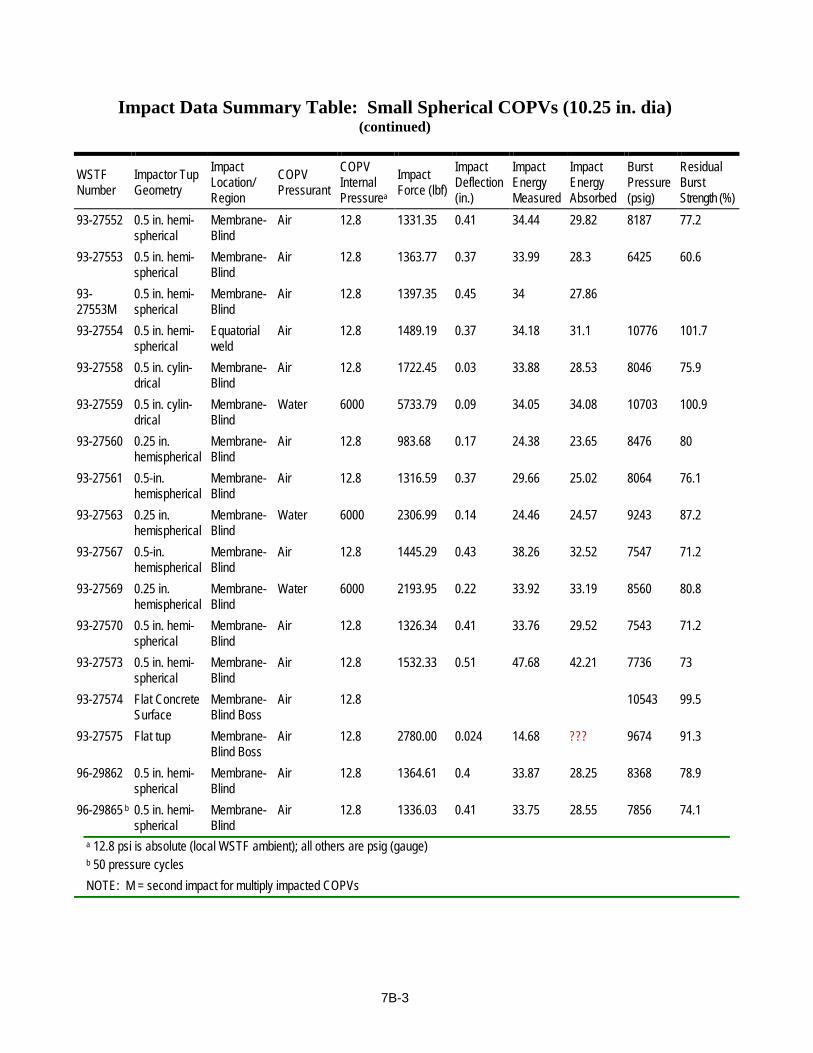
Impact Data Summary Table: Small Spherical COPVs (10.25 in. dia) (continued)
7B-3
WSTF Number
Impactor Tup Geometry
Impact Location/ Region
COPV Pressurant
COPV Internal Pressurea
Impact Force (lbf)
Impact Deflection (in.)
Impact Energy Measured
Impact Energy Absorbed
Burst Pressure (psig)
Residual Burst Strength (%)
93-27552 0.5 in. hemi-spherical
Membrane-Blind
Air 12.8 1331.35 0.41 34.44 29.82 8187 77.2
93-27553 0.5 in. hemi-spherical
Membrane-Blind
Air 12.8 1363.77 0.37 33.99 28.3 6425 60.6
93-27553M
0.5 in. hemi-spherical
Membrane-Blind
Air 12.8 1397.35 0.45 34 27.86
93-27554 0.5 in. hemi-spherical
Equatorial weld
Air 12.8 1489.19 0.37 34.18 31.1 10776 101.7
93-27558 0.5 in. cylin-drical
Membrane-Blind
Air 12.8 1722.45 0.03 33.88 28.53 8046 75.9
93-27559 0.5 in. cylin-drical
Membrane-Blind
Water 6000 5733.79 0.09 34.05 34.08 10703 100.9
93-27560 0.25 in. hemispherical
Membrane-Blind
Air 12.8 983.68 0.17 24.38 23.65 8476 80
93-27561 0.5-in. hemispherical
Membrane-Blind
Air 12.8 1316.59 0.37 29.66 25.02 8064 76.1
93-27563 0.25 in. hemispherical
Membrane-Blind
Water 6000 2306.99 0.14 24.46 24.57 9243 87.2
93-27567 0.5-in. hemispherical
Membrane-Blind
Air 12.8 1445.29 0.43 38.26 32.52 7547 71.2
93-27569 0.25 in. hemispherical
Membrane-Blind
Water 6000 2193.95 0.22 33.92 33.19 8560 80.8
93-27570 0.5 in. hemi-spherical
Membrane-Blind
Air 12.8 1326.34 0.41 33.76 29.52 7543 71.2
93-27573 0.5 in. hemi-spherical
Membrane-Blind
Air 12.8 1532.33 0.51 47.68 42.21 7736 73
93-27574 Flat Concrete Surface
Membrane-Blind Boss
Air 12.8 10543 99.5
93-27575 Flat tup Membrane-Blind Boss
Air 12.8 2780.00 0.024 14.68 ??? 9674 91.3
96-29862 0.5 in. hemi-spherical
Membrane-Blind
Air 12.8 1364.61 0.4 33.87 28.25 8368 78.9
96-29865 b 0.5 in. hemi-spherical
Membrane-Blind
Air 12.8 1336.03 0.41 33.75 28.55 7856 74.1
a 12.8 psi is absolute (local WSTF ambient); all others are psig (gauge) b 50 pressure cycles
NOTE: M = second impact for multiply impacted COPVs
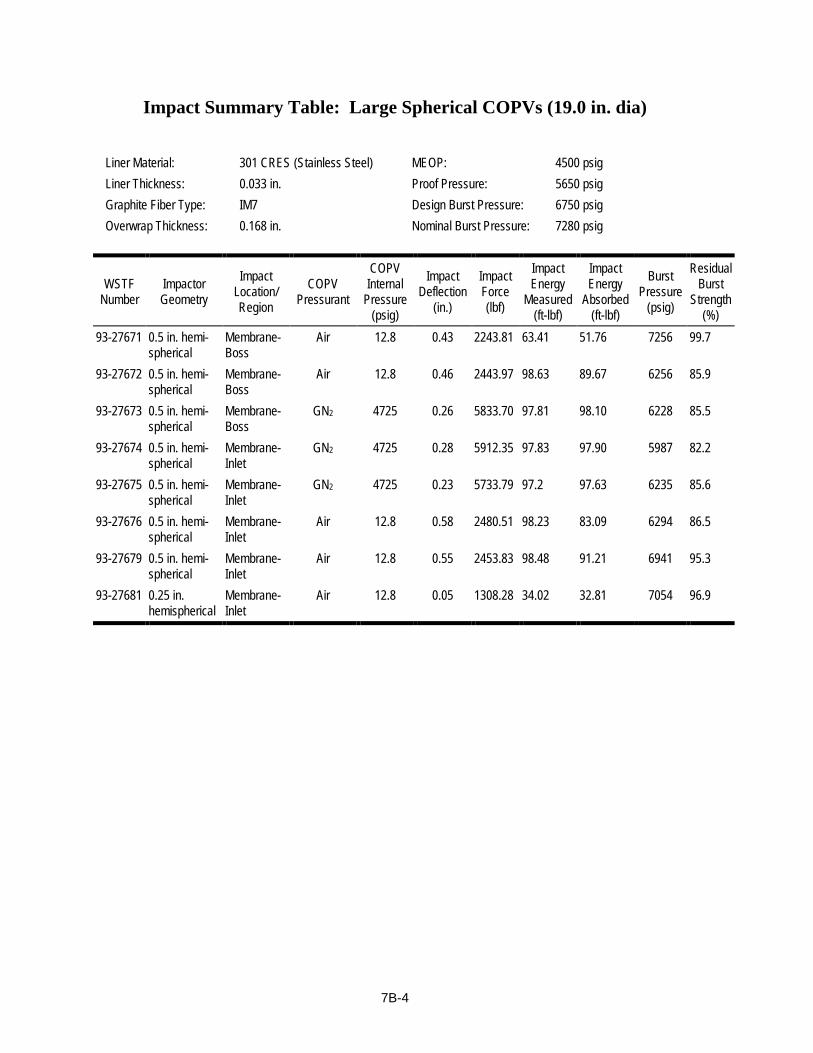
Impact Summary Table: Large Spherical COPVs (19.0 in. dia)
7B-4
Liner Material: 301 CRES (Stainless Steel) MEOP: 4500 psig
Liner Thickness: 0.033 in. Proof Pressure: 5650 psig
Graphite Fiber Type: IM7 Design Burst Pressure: 6750 psig
Overwrap Thickness: 0.168 in. Nominal Burst Pressure: 7280 psig
WSTF Number
Impactor Geometry
Impact Location/ Region
COPV Pressurant
COPV Internal
Pressure (psig)
Impact Deflection
(in.)
Impact Force (lbf)
Impact Energy
Measured (ft-lbf)
Impact Energy
Absorbed (ft-lbf)
Burst Pressure
(psig)
Residual Burst
Strength (%)
93-27671 0.5 in. hemi-spherical
Membrane-Boss
Air 12.8 0.43 2243.81 63.41 51.76 7256 99.7
93-27672 0.5 in. hemi-spherical
Membrane-Boss
Air 12.8 0.46 2443.97 98.63 89.67 6256 85.9
93-27673 0.5 in. hemi-spherical
Membrane-Boss
GN2 4725 0.26 5833.70 97.81 98.10 6228 85.5
93-27674 0.5 in. hemi-spherical
Membrane-Inlet
GN2 4725 0.28 5912.35 97.83 97.90 5987 82.2
93-27675 0.5 in. hemi-spherical
Membrane-Inlet
GN2 4725 0.23 5733.79 97.2 97.63 6235 85.6
93-27676 0.5 in. hemi-spherical
Membrane-Inlet
Air 12.8 0.58 2480.51 98.23 83.09 6294 86.5
93-27679 0.5 in. hemi-spherical
Membrane-Inlet
Air 12.8 0.55 2453.83 98.48 91.21 6941 95.3
93-27681 0.25 in. hemispherical
Membrane-Inlet
Air 12.8 0.05 1308.28 34.02 32.81 7054 96.9

Impact Summary Table: Small Cylindrical COPVs (6.6 in. dia x 22 in. long)
7B-5
Liner Material: 6061-T62 MEOP: 6000 psig Liner Thickness: 0.040 in. Proof Pressure: 7500 psig Graphite Fiber Type: IM7 Design Burst Pressure: 9000 psig Overwrap Thickness: 0.168 in. Nominal Burst Pressure: 10,700 psig
WSTF Number
Impactor Geometry
Impact Location/ Region
COPV Pressurant
COPV Internal
Pressure (psi)a
Impact Deflection
(in.)
Impact Force (lbf)
Impact Energy
Measured (ft-lbf)
Impact Energy
Absorbed (ft-lbf)
Burst Pressure
(psig)
Residual Burst
Strength (%)
93-27583 0.5 in. hemi-spherical
Hoop Air 12.8 0.17 1549.35 14.73 4.47 8246 77.1
93-27584 0.5 in. hemi-spherical
Hoop Water 6000 0.10 2558.49 14.14 11.47 8877 83
93-27585 0.5 in. hemi-spherical
Hoop Air 12.8 0.23 1681.42 19.72 8.1 7764 72.6
93-27586 0.5 in. hemi-spherical
Hoop Air 12.8 0.13 1305.24 9.89 3.77 8884 83.1
93-27587 0.5 in. hemi-spherical
Hoop Air 12.8 0.10 862.94 4.9 3.54 9800 91.6
93-27588 0.5 in. hemi-spherical
Hoop Water 6000 0.11 2538.56 14.8 12.81 7950 74.3
93-27589 0.5 in. hemi-spherical
Hoop Air 12.8 0.20 1278.03 14.34 10.72 9257 86.5
93-27592 0.5 in. hemi-spherical
Hoop Water 3000 0.11 2017.71 14.07 12.65 9776 91.4
93-27593 0.5 in. hemi-spherical
Hoop Air 12.8 0.20 1303.59 14.76 10.63 8377 78.3
93-27594 0.5 in. hemi-spherical
Hoop Water 6000 0.10 2280.87 14.61 13.09 7510 70.2
93-27595 0.5 in. hemi-spherical
Hoop Water 3000 0.12 2120.07 14.23 11.58 9425 88.1
93-27596 0.5 in. hemi-spherical
Hoop GN2 6300 0.10 2393.32 14.59 12.5 7569 71
93-27597 0.5 in. hemi-spherical
Hoop Water 3000 0.12 2104.7 14.15 11.97 9892 92.4
93-27598 No impact 9556 89.3 93-27599 0.5 in. hemi-
spherical Hoop GN2 6300 0.10 2149.57 14.54 12.89 7724 72.2
93-27600 1.0 in. hemi-spherical
Hoop Air 12.8 0.19 1315.44 14.7 9.84 10123 94.6
93-27602 No impact 11064 103.4
a 12.8 psi is absolute (local WSTF ambient); all others are psig (gauge)
NOTE: M = second impact for multiply impacted COPVs

Impact Summary Table: Small Cylindrical COPVs (6.6 in. dia x 22 in. long) (continued)
7CB-6
WSTF Number
Impactor Geometry
Impact Location/ Region
COPV Pressurant
COPV Internal
Pressure (psi)a
Impact Deflection
(in.)
Impact Force (lbf)
Impact Energy
Measured (ft-lbf)
Impact Energy
Absorbed (ft-lbf)
Burst Pressure
(psig)
Residual Burst
Strength (%)
93-27603 0.5 in. hemi-spherical
Hoop GN2 6300 0.10 2182.61 14.47 12.49 6260 59
93-27608 No impact 11048 103.3 93-27609 0.5 in. hemi-
spherical Hoop Water 6000 0.11 2531.66 14.61 12.66 8309 77.7
93-27610 0.5 in. hemi-spherical
Hoop Water 6000 0.10 2531.66 14.59 12.87 7368 68.9
93-27611 0.5 in. hemi-spherical
Hoop Water 6000 0.10 2348.2 14.4 13.04 8791 82.2
93-27614 0.5 in. hemi-spherical
Hoop Water 6000 0.10 2427.6 14.61 13.57 7644 71.4
93-27614M
0.5 in. hemi-spherical
Hoop Water 6000 0.10 2343.33 14.53 13.53
93-27615 0.5 in. hemi-spherical
Hoop Air 12.8 0.19 1257.04 14.44 11.42 8075 75.5
93-27615M
0.5 in. hemi-spherical
Hoop Air 12.8 0.20 1297.13 14.7 11.59
93-27616 0.5 in. hemi-spherical
Hoop Air 12.8 0.18 1311.63 14.74 11.73 8520 79.6
93-27616M
0.5 in. hemi-spherical
Hoop Air 12.8 0.20 1462.23 14.35 9.92
93-27617 No impact 0 0.00 0 0 0 10500 98.1 93-27618 0.5 in. hemi-
spherical Hoop Air 12.8 0.17 1292.1 14.67 11.41 8652 80.9
93-27618 0.5 in. hemi-spherical
Hoop Air 12.8 0.17 1292.1 14.67 11.41 8652 80.9
93-27618M
0.5 in. hemi-spherical
Hoop Air 12.8 0.20 1477.21 14.46 9.76
93-27619 0.5 in. hemi-spherical
Hoop Air 12.8 0.18 1208.28 14.64 11.72 8834 82.6
93-27619M
0.5 in. hemi-spherical
Hoop Air 12.8 0.21 1226.78 14.7 11.04
93-27620 0.5 in. cylindri-cal
Hoop Air 12.8 0.04 1360.34 14.66 11.74 10265 95.9
93-27621 0.5 in. cylindri-cal
Hoop Water 6000 0.06 3495.89 14.66 13.89 10228 95.6
93-27622 0.5 in. hemi-spherical
Inlet mid-dome
Water 6000 0.08 2327.73 14.88 15.03 9920 92.7
a 12.8 psi is absolute (local WSTF ambient); all others are psig (gauge)
NOTE: M = second impact for multiply impacted COPVs

Impact Summary Table: Small Cylindrical COPVs (6.6 in. dia x 22 in. long) (continued)
7CB-7
WSTF Number
Impactor Geometry
Impact Location/ Region
COPV Pressurant
COPV Internal
Pressure (psi)a
Impact Deflection
(in.)
Impact Force (lbf)
Impact Energy
Measured (ft-lbf)
Impact Energy
Absorbed (ft-lbf)
Burst Pressure
(psig)
Residual Burst
Strength (%)
93-27623 0.5 in. hemi-spherical
Inlet mid-dome
Air 12.8 0.18 1414.06 14.87 12.27 9291 86.8
93-27624 0.25 in. hemispherical
Hoop Water 6000 0.13 1971.34 15.07 14.11 7975 74.5
93-27625 0.5 in. hemi-spherical (oblique setup)
Hoop Air 12.8 9493 88.7
93-27626 0.5 in. hemi-spherical
Hoop/ centerline
Air 12.8 0.20 1302.64 14.72 10.55 10153 94.9
93-27627 0.5 in. hemi-spherical (oblique setup)
Hoop Air 12.8 10542 99.5
93-27628 0.5 in. hemi-spherical
Hoop Air 12.8 0.19 1231.62 14.39 11.64 9547 89.2
93-27631 0.5 in. hemi-spherical
Hoop Air 12.8 0.20 1210.24 14.47 10.9 9006 84.2
93-27632 0.5 in. hemi-spherical
Hoop Air 12.8 0.20 1249.67 14.56 10.61 9342 87.3
93-27633 0.5 in. hemi-spherical
Hoop/Centerline
Air 12.8 0.22 1224.03 14.38 10.89 9349 87.4
93-27634 0.5 in. hemi-spherical
Hoop (fiber-glass edge)
Air 12.8 0.23 1221.07 14.39 10.8 9035 84.4
93-27637 0.5 in. hemi-spherical
Hoop Air 12.8 0.37 1944.91 38.64 29.94 5964 55.7
93-27642 0.5 in. hemi-spherical
Hoop Air 12.8 0.39 1851.71 38.5 37.97 6497 60.7
93-27643 0.5 in. hemi-spherical
Hoop Air 12.8 0.15 1016.28 9.14 7.15 10536 98.5
93-27648 0.5 in. hemi-spherical
Hoop Air 12.8 0.16 999.52 9.3 7.25 10106 94.4
93-27649 0.5 in. hemi-spherical
Hoop Air 12.8 0.24 1403.58 19.04 15.19 9661 90.3
93-27650 0.5 in. hemi-spherical
Hoop Air 12.8 0.24 1410.1 19.7 15.36 9034 84.4
93-27651 0.5 in. hemi-spherical
Hoop Air 12.8 0.28 1482.57 24.84 20.14 9420 88
93-27652 0.5 in. hemi-spherical
Hoop Air 12.8 0.30 1619.03 24.95 18.97 9712 90.8
a 12.8 psi is absolute (local WSTF ambient); all others are psig (gauge)
NOTE: M = second impact for multiply impacted COPVs

7B-8
Impact Data Summary Table: Large Cylindrical COPVs (13.0 in. dia x 25 in. long)
Liner Material: 6061-T62 MEOP: 4500 psig
Liner Thickness: 0.040 in. Proof Pressure: 5650 psig
Graphite Fiber Type: T-1000 Design Burst Pressure: 6750 psig
Overwrap Thickness: 0.147 in. Nominal Burst Pressure: 7850 psig
WSTF Number
Impactor Geometry
Impact Loca-
tion/Region
COPV Pressurant
COPV Internal
Pressure (psi)a
Impact Deflection
(in.)
Impact Force (lbf)
Impact Energy
Measured (ft-lbf)
Impact Energy
Absorbed (ft-lbf)
Burst Pressure
(psig)
Residual Burst
Strength (%)
93-27658 0.5 in. hemi-spherical
Hoop Air 12.8 0.42 2726.18 63.66 47.1 5186 66.1
93-27659 0.5 in. hemi-spherical
Hoop Air 12.8 0.16 1542.12 14.54 10.08 6876 87.6
93-27660 0.5 in. hemi-spherical
Hoop Air 12.8 0.38 2275.05 48.49 36.72 5401 68.8
93-27661 0.5 in. hemi-spherical
Hoop Air 12.8 0.28 2153.83 34.22 24.98 5953 75.8
93-27662 0.5 in. hemi-spherical
Hoop Air 12.8 0.22 1747.26 24.09 18.77 7263 92.5
93-27663 0.5 in. hemi-spherical
Hoop Water 4500 0.15 4392.7 34.11 29.07 5877 74.9
93-27664 0.5 in. hemi-spherical
Hoop Water 4500 0.15 4190.28 34.19 29.08 6010 76.6
93-27666 0.5 in. hemi-spherical
Hoop Air 12.8 0.26 1980.23 29.62 21.34 6482 82.6
93-27668 0.5 in. hemi-spherical
Mid-dome Air 12.8 0.33 1633.37 34.21 31.92 5126 65.3
93-27670 0.5 in. hemi-spherical
Mid-dome Air 12.8 0.29 1824.84 34.15 31.12 5309 67.6
a 12.8 psi is absolute (local WSTF ambient); all others are psig (gauge)
NOTE: M = second impact for multiply impacted COPVs

Appendix 7C
Multiple Impact Data Summary Table

7C-1
Multiple Impacts Summary Table: Small Spherical COPV (10.25 in. dia)
Liner Material 5086-T0 Aluminum MEOP: 6000 psig
Liner Thickness: 0.050 in. Proof Pressure: 7500 psig
Graphite Fiber Type: T-40 Design Burst Pressure: 9000 psig
Overwrap Thickness: 0.162 in. Nominal Burst Pressure: 10,600 psig
Impact Tup Geometry: Hemispherical
Impact Tup Dimension: 0.50 in.
Impact Location: Membrane-Blind
WSTF Number
COPV Pressurant
Multiple Impact Type
Internal Pressure @ Impact (psi)a
Impact Force (lbf)
Impact Deflection (in.)
Impact Energy Measured (ft-lbf)
Impact Energy Absorbed (ft-lbf)
Burst Pressure (psig)
Residual Burst Strength (%)
93-27544 Water 6000 3774.84 0.14 34.18 34.41 6980 65.8
93-27544M Water Adjacent 6000 3704.56 0.11 34.22 34.43
93-27545 Water 6000 3829.97 0.14 34.03 34.25 7469 70.5
93-27545M Water Adjacent 6000 3650.98 0.15 34.13 34.35
93-27546 Air 12.8 1379.08 0.38 33.73 28.74 6542 61.7
93-27546M Air Coincident 12.8 1490.95 0.51 33.68 25.94
93-27548 Air 12.8 1386.73 0.40 33.91 28.49 7637 72.0
93-27548M Air Coincident 12.8 1465.22 0.39 34.13 25.42
93-27550 Air 12.8 1309.90 0.32 34.07 30.38 6462 61.0
93-27550M Air Adjacent 12.8 1228.24 0.45 34.29 27.06
93-27553 Air 12.8 1363.77 0.37 33.99 28.30 6425 60.6
93-27553M Air Coincident 12.8 1397.35 0.45 34.00 27.86
a 12.8 psi is absolute (local WSTF ambient); all others are psig (gauge)
NOTE: M = second impact for multiply impacted COPVs
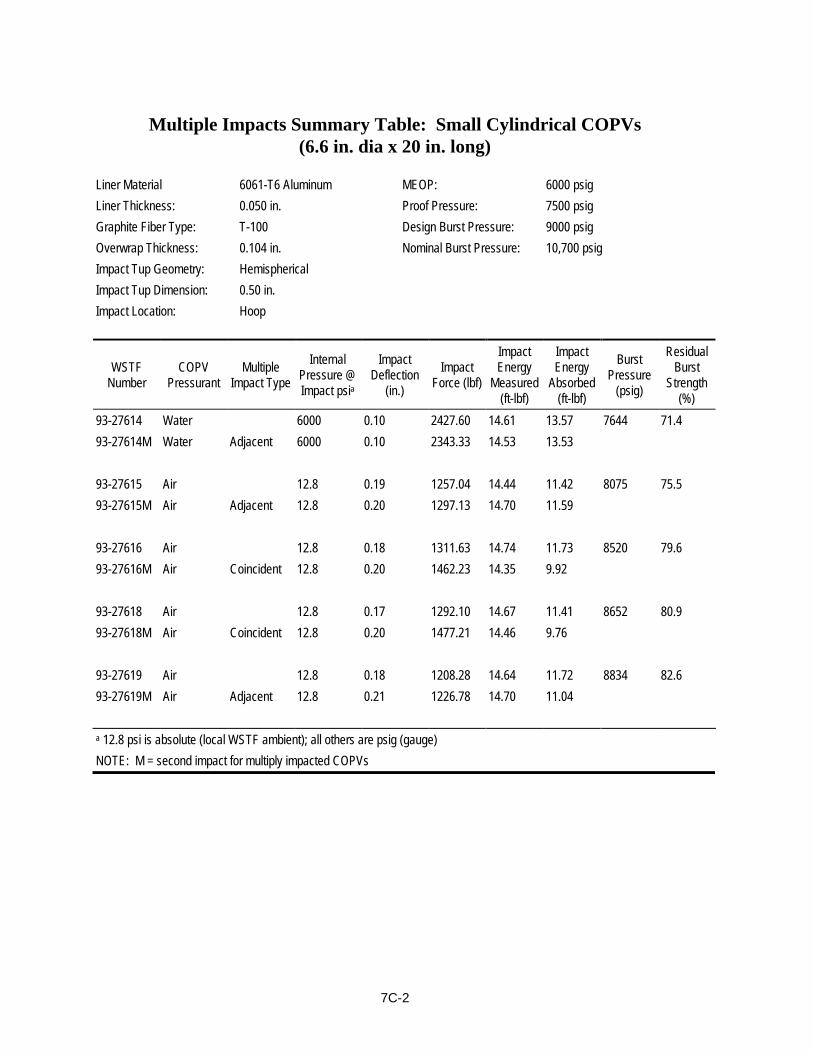
7C-2
Multiple Impacts Summary Table: Small Cylindrical COPVs
(6.6 in. dia x 20 in. long)
Liner Material 6061-T6 Aluminum MEOP: 6000 psig
Liner Thickness: 0.050 in. Proof Pressure: 7500 psig
Graphite Fiber Type: T-100 Design Burst Pressure: 9000 psig
Overwrap Thickness: 0.104 in. Nominal Burst Pressure: 10,700 psig
Impact Tup Geometry: Hemispherical
Impact Tup Dimension: 0.50 in.
Impact Location: Hoop
WSTF Number
COPV Pressurant
Multiple Impact Type
Internal Pressure @ Impact psia
Impact Deflection
(in.)
Impact Force (lbf)
Impact Energy
Measured (ft-lbf)
Impact Energy
Absorbed (ft-lbf)
Burst Pressure
(psig)
Residual Burst
Strength (%)
93-27614 Water 6000 0.10 2427.60 14.61 13.57 7644 71.4
93-27614M Water Adjacent 6000 0.10 2343.33 14.53 13.53
93-27615 Air 12.8 0.19 1257.04 14.44 11.42 8075 75.5
93-27615M Air Adjacent 12.8 0.20 1297.13 14.70 11.59
93-27616 Air 12.8 0.18 1311.63 14.74 11.73 8520 79.6
93-27616M Air Coincident 12.8 0.20 1462.23 14.35 9.92
93-27618 Air 12.8 0.17 1292.10 14.67 11.41 8652 80.9
93-27618M Air Coincident 12.8 0.20 1477.21 14.46 9.76
93-27619 Air 12.8 0.18 1208.28 14.64 11.72 8834 82.6
93-27619M Air Adjacent 12.8 0.21 1226.78 14.70 11.04
a 12.8 psi is absolute (local WSTF ambient); all others are psig (gauge)
NOTE: M = second impact for multiply impacted COPVs

Appendix 7D
Oblique Impact Data Summary Table

7D-1
Oblique Impact Data Summary Table
Liner Material: 6061-T62 Al alloy MEOP: 6000 psig Impactor Tup Geometry:
0.5 in. hemispherical
Liner Thick-ness:
0.040 in. Proof Pres-sure:
7500 psig Impact Location Region:
Hoop
Graphite Fiber Type:
T-1000 Gr/Ep resin Design Burst Pressure:
9000 psig COPV Pressurant: Air
Overwrap Thickness:
0.104 in. Nominal Burst Pressure:
10,700 psig COPV Internal Pressure:
12.8 psi
WSTF Number
Impact Origin Impact Force (lbf)
Impact Reflection
(in.)
Impact Energy Measured
(ft-lbf)
Impact Energy Absorbed
(ft-lbf)
Burst Pres-sure (psig)
Residual Burst Strength
(%)
93-27583 IMIT baseline 1549.35 0.17 14.73 4.47 8246 77.1
93-27589 IMIT baseline 1278.03 0.20 14.34 10.72 9257 86.5
93-27593 IMIT baseline 1303.59 0.20 14.76 10.63 8377 78.3
93-27625 DT orthogonal -a - - - 9493 88.7
93-27627 DT oblique -a - - - 10542 99.5
a IMIT was not used, so no instrumentation was available

Appendix 7E
Pressure and Thermal Cycling Data Summary Table

7E-1
Thermal and Pressure Cycling Data Summary Table
Liner Material: 5086 Al alloy MEOP: 6000 psig Impactor Tup Geometry:
0.5 in. hemi-spherical
Liner Thickness: 0.05 in. Proof Pressure: 7500 psig Impact Location Region: Membrane-Blind
Graphite Fiber Type: T-40 Gr/Ep Design Burst Pressure: 9000 psig COPV Pressurant: Air
Nominal Burst Pressure: 10,600 psig COPV Internal Pressure: 12.8 psi
WSTF Number
Condition Overwrap Thickness
(in.)
Impact Force (lbf)
Impact Deflection
(in.)
Impact Energy Measured
(ft-lbf)
Impact Energy Absorbed
(ft-lbf)
Burst Pressure
(psig)
Residual Burst Strength
(%)
93-27528 Impacted + 50 cycles
0.162 1527.24 0.39 34.57 29.39 8157 77
93-27540 Impacted + 50 cycles
0.164 1264.01 0.29 34.61 29.41 9113 86
93-27541 Impacted + 50 cycles
0.164 1319.16 0.33 34.64 28.43 8894 84
93-27547 Impacted 0.162 1381.44 0.42 34.16 28.33 7456 70
93-27551 Impacted 0.162 1319.83 0.42 34.17 29.25 7917 75
93-27552 Impacted 0.162 1331.35 0.41 34.44 29.82 8187 77
93-29865 Impacted + 50 thermal
cycles
0.162 1336.03 0.41 33.75 28.55 7856 74

REPORT DOCUMENTATION PAGE Form Approved OMB No. 0704-0188
Public reporting burden for this collection of information is estimated to average 1 hour per response, including the time for reviewing instructions, searching existing data sources, gathering and maintaining the data needed, and completing and reviewing the collection of information. Send comments regarding this burden estimate or any other aspect of this collection of information, including suggestions for reducing this burden, to Washington Headquarters Services, Directorate for Information Operations and Reports, 1215 Jefferson Davis Highway, Suite 1204, Arlington, VA 22202-4302, and to the Office of Management and Budget, Paperwork Reduction Project (0704-0188), Washington, DC 20503.
1. AGENCY USE ONLY (Leave Blank) 2. REPORT DATE 3. REPORT TYPE AND DATES COVERED 1/02 NASA Technical Memorandum
4. TITLE AND SUBTITLE 5. FUNDING NUMBERS Composite Overwrapped Pressure Vessels: Database Extension Task 3.0 and Impact Damage Effects Control Task 8.0*
6. AUTHOR(S) Harold D. Beeson
7. PERFORMING ORGANIZATION NAME(S) AND ADDRESS(ES) 8. PERFORMING ORGANIZATION REPORT NUMBERS
White Sands Test Facility Lyndon B. Johnson Space Center Houston, Texas 77058
S-878
9. SPONSORING/MONITORING AGENCY NAME(S) AND ADDRESS(ES) 10. SPONSORING/MONITORING AGENCY REPORT NUMBER
National Aeronautics and Space Administration Washington, DC 20546-0001
TM-2002-210769
11. SUPPLEMENTARY NOTES *Also published as White Sands Test Facility document # WSTF-TR-0957
12a. DISTRIBUTION/AVAILABILITY STATEMENT 12b. DISTRIBUTION CODE
Available from the NASA Center for AeroSpace Information (CASI) 7121 Standard Hanover, MD 21076-1320 Subject Code: 39
13. ABSTRACT (Maximum 200 words) This document represents efforts accomplished at the NASA Johnson Space Center White Sands Test Facility in support of the Enhanced Technology for Composite Overwrapped Pressure Vessels Program, a joint research and technology effort among the U.S. Air Force, NASA, and the Aerospace Corporation. WSTF performed testing for several facects of the program. Testing that contributed to the Task 3.0 COPV database extension objective included baseline structural strength, failure mode and safe-life, impact damage tolerance, sustained load/impact effect, and materials compatibility. WSTF was also responsible for establishing impact protection and control requirements under Task 8.0 of the program. This included developing a methodology for establishing an impact control plan. Seven test reports detail the work done at WSTF. As such, this document contributes to the database of information regarding COPV behavior that will ensure performance benefits and safety are maintained throughout vessel service life.
14. SUBJECT TERMS 15. NUMBER OF PAGES
16. PRICE CODE
composite materials; pressure vessel design; pressure vessels; impact damage; materials 267
17. SECURITY CLASSIFICATION OF REPORT
18. SECURITY CLASSIFICATION OF THIS PAGE
19. SECURITY CLASSIFICATION OF ABSTRACT
20. LIMITATION OF ABSTRACT
Unclassified Unclassified Unclassified Unlimited Standard Form 298 (Rev Feb 89) (MS Word Mar 97) Prescribed by ANSI Std. 239-18 298-102
NSN 7540-01-280-5500