Embed Size (px)
Citation preview
Diss. ETH No. 12947
Compositional and Structural AnalysisofCamel Milk Proteins
with Emphasis on Protective Proteins
A DISSERTATION
For the Degree of
DOCTOR OF TECHNICAL SCIENCES
Submitted to the
EIDGENOSSISCHE TECHNISCHE HOCHSCHULE
SWISS FEDERAL INSTITUTE OF TECHNOLOGY
Zurich
Presented by
STEFAN KAPPELER
Dipl. Natw. ETH
Born on 25 July 1968
Swiss Citizen
Accepted on the Recommendation of
Prof. Dr. Zdenko Puhan, Examiner
Dr. Zakaria Farah, Co-examiner
Prof. Dr. Gerald Stranzinger, Co-examiner
Zurich 1998

To myfamily, especially my parents,much appreciation
ACKNOWLEDGEMENTS
I would like to thank Prof. Z. Puhan and Dr. Z. Farah for giving me the
chance to carry out this thesis and for their guidance and advise in the
course of the work.
I thank Prof. Stranzinger for taking over the external examination of this
work.
I am in debt to Prof. Teuber and the Laboratory of Food Microbiology, whoallowed me to carry out all molecular biological experiments havingunrestricted access to their laboratories and equipment.
I wish to thank Prof. Bruckner of the University Giessen, and Dr. Greilingand Mr M. Leitenberger, of the University Hohenheim, Stuttgart, who
helped me in many ways in the course of the thesis.
Doing research about an animal, which lives in arid regions, but not in
Switzerland, I was happy and thankful, that I could do part of my research
at the Central Veterinary Research Laboratory, Dubai, under assistance of
Dr. Dr. habil. U. Wernery and his group. Especially I would like to thank Dr
W. Holzer and Dr. J. Kinne, who helped me to carry out my experiments.
I also would like to thank the Evans family and Ms D. Atkins, for giving methe possibility to do research at 01 Maisor Farm, Rumuruti, Kenya, as well
as to Dr M. Younan and Dr E. Beretta for doing biopsy of udder tissue.
I wish to thank Dr. M. Hassig of Tierspital Zurich, who often advised me in
questions about anatomy and veterinary medicine.
I am also very grateful to Mr and Mrs Breitling of the Kamelfarm
Fatamorgana in Rotfelden, Germany, for giving me a hearty welcome every
time I went there and for providing me with blood and milk samples of
excellent quality.
Last but not least, I wish to thank my colleagues at the Laboratory of DairyScience, for providing a sociable working atmosphere and assisting me in
numerous ways.
I
Table ofContent I
Acknowledgements III
Abbreviations III
Summary rv
Zusammenfassung VII
1 Introduction i
2 Literature Review 5
Taxonomy 5
Anatomy and Physiology 5
Gross Composition of Camel Milk 6
Physico-chemical Properties of Camel Milk 8
Composition and Characteristics of the Protein Fraction 9
Technology applied for Processing of Camel Milk 11
Nutritional Quality and Therapeutic Use of Camel Milk 13
3 Materials and Methods 15
3.1 Protein Analysis 15
Sample Preparation 15
RP-Cis HPLC Chromatography 15
Heparin-Sepharose Affinity Chromatography 16
Amino Acid Sequencing 16
Evaluation of Protein Purity 17
Mass Determination of HPLC Separated Proteins 17
Quantification 17
3.2 DNAAnalysis 18
PolyA-mRNA Isolation 18
Construction of a cDNA Library 18
Sequence Analysis 18
3.3 Computational Sequence Analysis 23
4 Results and Discussion 25
4.1 Caseins 25
Literature 25
Elution Pattern of Caseins in Reversed-Phase Chromatography 32
Signal Sequences 33
Phosphorylation 34
Glycosylation of K-Casein 34
Primary Structure 36
Secondary Structure 37
Chymosin Sensitive Site of K-Casein 40
Rennet Coagulation 41
Considerations for Camel Milk Processing 42
4.2 Renneting enzymes 42
Literature 42
Primary Structures 45
Functional Aspects 48
II
4.3 Major Whey Proteins 59
Literature 59
Reversed-Phase Chromatography ofWhey Proteins 59
4.3.1 Lactophorin 62
Literature 62
Lactophorin Gene Structure 63
Primary Structure 63
N-terminal Heterogeneity 67
Secondary Structure 70
Phosphorylation 72
Potential for Binding of free Calcium 73
Glycosylation 73
Relation to the Mucin-type Proteins 75
Protein Expression and Concentration in Camel Milk 76
Oligomerisation 77
Proteolytic Cleavage 77
Inhibition of Lipolysis 77
Applications 79
4.4 Minor Whey Proteins 79
Antimicrobial Proteins in Milk 79
4.4.1 Peptidoglycan Recognition Protein 81
Literature 81
Primary Structure 81
Affinity Chromatography and Quantification 84
Functional Aspects of PGRP 86
4.4.2 Lactoferrin 89
Literature 89
Primary Structure 92
Glycosylation 92
Concentration in Camel Milk 93
Iron Content 93
Bacteriostatic Activity of the N-terminal End 97
Bacteriostatic Breakdown Products 98
Functional Aspects 100
Food Preservation 101
4.4.3 Lactoperoxidase 101
Literature 101
Primary Structure 103
Posttranslational Modifications and Ligand Binding 103
Tertiary Structure and Catalytic Activity 107
Potential for Milk Preservation 113
5 Conclusions And Outlook 115
6 References 119
7 Curriculum Vitae 137
Ill Abbreviations
ABBREVIATIONS
aa Amino Acid
Ab AntibodyABTS 2,2'-azinobis-3-ethylbenzothiazoline-6-sulphonic acid
AS Aminosaure(n)
ocsi-CN oc-Casein, calcium sensitive type 1
ois2-CN a-Casein, calcium sensitive type 2
P-CN (i-Caseink-CN K-Casein
kDa Kilo Dalton
HPLC High Pressure Liquid ChromatographyLINE Long Interspersed Repetitive Element
LP-s Lactoperoxidase-systemMALDI-MS Matrix Assisted Laser Desorption/Ionization
Mass SpectrometryMFG Milk Fat Globule
MFGM Milk Fat Globule Membrane
ORF Open Reading Frame of a cDNA or genomic DNA
sequence
PAGE Polyacrylamide Gel ElectrophoresisPCR Polymerase Chain Reaction
pfu Plaque Forming Units
PGRP Peptidoglycan Recognition Protein
PP3 Proteose Peptone Component 3
SDS SodiumDodecyl SulphateSINE Short Interspersed Repetitive Element
TFA Trifluoroacetic Acid
WAP Whey Acidic Protein
IV
SUMMARY
The present study aims to contribute in characterisation of the camel milk
protein fraction.
Proteins from milk of Somali and Arabian camel breeds (Camelus
dromedarius) were separated by acid precipitation into a casein and a wheyfraction. Both fractions were further separated by reversed-phase HPLC
chromatography, whey proteins also by Heparin-Sepharose
chromatography. Purity of isolated proteins was verified by SDS-PAGE.
Proteins were quantified by absorption spectrometry at 280 nm, or by peak
integration at 220 nm. The structures of the isolated proteins, as well as of
gastric aspartic proteases, were characterised by mass spectrometry, N-
terminal sequence analysis, and cDNA sequence analysis. It was concluded,
that camel and cow milk strongly differ in the composition of both, casein
and whey protein fraction, and that camel and bovine milk proteins exhibit
distinct structural variations.
Tryptic digests of asr, aS2-, (3- and k-CN, and cDNA clones corresponding to
the four caseins, were sequenced. The number of residues were asi-CN 207,
aS2-CN 178, (3-CN 217, k-CN 162. Similarity to bovine proteins was asi-CN A
60.3%, CterCN 73.0%, (3-CN 80.4%, k-CN 73.8%. Acid precipitated casein of
pooled milk was separated by reversed-phase HPLC and monitored at 220
nm, and its composition, estimated from peak integration, was cisi-CN 22%,
ocsa-CN 9.5%, (3-CN 65%, k-CN 3.5%. Degrees of phosphorylation and
glycosylation were determined by mass spectrometry and sequence pattern
analysis. Molecular masses determined were asi-CN A, 24.7 kDa and 24.8
kDa; asi-CN B, 25-3 kDa; as2-CN, 22.0 kDa; (3-CN, 24.9 kDa; K-CN, 22.3-
23.0 kDa. The pH values of the most probable isoelectric points were: oisi-
CN A 6P, 4.41; c-si-CN B 6P, 4.40; cfarCN 9P, 4.58; (3-CN 4P, 4.66; k-CN IP,
with 10 sialic acid residues bound, 4.10. It was concluded, that the low gel
firmness of renneted camel milk, as compared to renneted milk of true
ruminants, is a result of the different composition of the casein fraction, and
marked variations in the k-CN primary structure.
The structure of chymosin and pepsin mRNAfrom gastric mucosa of camels
was determined, to understand specificity of interaction with k-CN.
Chymosin was 323 aa residues long, with a molecular weight of 35.6 kDa
and an isoelectric point at pH 4.71. It shared 96.9% sequence similarity with
V Summary
bovine chymosin. Specificity pockets for interaction with the chymosinsensitive region in k-CN were found to have more pronounced hydrophobicor hydrophilic characteristics than those in bovine chymosin, and were thus
probably better suited for hydrolysis of the scissile bond in camel k-CN.
Pepsin was 327 aa residues long, with a molecular weight of 34.9 kDa and
an isoelectric point at pH 3.16. It shared 98.5% sequence similarity with
porcine pepsin and was supposed to have a similar activity. It was
concluded, that the higher activity of camel chymosin in milk renneting,
compared to bovine chymosin, was based on higher specificity towards its
natural substrate, which is camel milk k-CN, and that large-scale
production should be envisaged.
Whey proteins of camel milk were examined with focus on their relative
distribution, as compared to whey proteins of cow milk, and with specialinterest in proteins with possible antimicrobial activity.
A novel milk protein was isolated by heparin-sepharose affinitychromatography from camel whey, which was found at a high concentration
of 370 mg l-1 and had 91.2% similarity with human peptidoglycanrecognition protein (PGRP). The protein was 172 aa residues long, with a
molecular mass of 19.117 kDa, and an isoelectric point at pH 8.73. In
analogy to homologous proteins from the immune system of vertebrates
and invertebrates, activity against gram-positive, and probably against
gram-negative bacteria, and a potential anti-tumour activity was proposed.
A camel whey protein with 83.6% amino acid sequence similarity to
lactophorin from bovine whey and 67.9% similarity to the mouse (Mus
musculus) glycosylation dependent cell adhesion molecule GlyCAM-1, was
found to be a product of a alternatively spliced gene. About 75% of the
protein was expressed as a long variant A with 137 aa residues and a
molecular weight of 15.7 kDa, about 25% was expressed as a short variant B
with 122 aa residues and a molecular weight of 13.8 kDa. Both proteins were
probably three-fold phosphorylated. In contrast to bovine lactophorin and
mouse and rat GlyCAM-1, no glycosylation was found in the camel whey
protein. Due to this difference, specific interaction with carbohydrate
binding proteins, as reported for GlyCAM-1, was excluded, and a function of
the protein other than cell recognition or rotaviral inhibition was proposed.
Higher amounts of the protein were found in camel milk, with about 954
mg l-1, than in cow milk, with about 300 mg H. In analogy to bovine
lactophorin, the protein was proposed to have a function in prevention of
fat globule aggregation, e.g. during secretion of fat globules into the alveolar
VI
lumen of the lactating udder, and to be a natural inhibitor of spontaneous
lipolysis by lipoprotein lipase.
Lactoferrin of camel whey was isolated by heparin affinity chromatography.The protein sequence, as deduced from cDNA, had 91.6% similarity to
bovine lactoferrin, the same length of 689 aa residues, a molecular mass of
about 80.5 kDa and an isoelectric point at pH 8.14. The protein was
probably two-fold glycosylated, and was found to have two centres for
binding of Fe3+ and C032-. An antimicrobial N-terminal proteolyticbreakdown product was proposed in analogy to bovine lactoferricin. The
protein was found in camel milk at a higher concentration of 220 mg r1,
than in cow milk with 140 mg 1_1.
Lactoperoxidase, as deduced from cDNA, was 612 aa residues long, with a
molecular mass of 69.5 kDa for the unmodified protein and an isoelectric
point at pH 8.63. Analysis of the primary structure, which had 94.9%
homology to cow lactoperoxidase, showed potential for four sites of
glycosylation, covalent binding of a ferric heme and strong binding of a
calcium ion. Similar activity in a lactoperoxidase system as reported for
bovine lactoperoxidase, was proposed.
The different composition of the camel milk whey and casein fractions, as
compared to milk of ruminants, was suggested to be a result of genetic and
environmental factors.
VII Zusammenfassung
ZUSAMMENFASSUNG
Mit der vorliegenden Arbeit mochten wir zum besseren Verstandnis der
Proteinfraktion von Kamelmilch beitragen.
Milch von Somalischen und Arabischen Kamelen wurde durch Saurefallungin eine Kasein- und eine Molkenfraktion aufgetrennt. Beide Fraktionen
wurden mit Hilfe der Phasenumkehr-Chromatographie weiter aufgetrennt.Ausserdem wurden Molkenproteine mittels Heparin-
Affinitatschromatographie isoliert. Die Reinheit der Fraktionen wurde mit
SDS-PAGE uberpriift. Proteinkonzentrationen wurden mittels
Absorptionsspektrometrie bei 280 nm gemessen, oder durch Integrationder Signale, die wahrend der Phasenumkehr-Chromatographie bei 220 nm
aufgezeichnet wurden. Die Struktur der isolierten Milchproteine und der
Labenzyme wurde durch Massenspektrometrie, Edman-Abbau und cDNA-
Sequenzierung bestimmt. Sowohl die Zusammensetzung der Kasein- und
Molkenfraktionen, als auch strukturelle Eigenschaften der einzelnen
Proteine, unterschieden sich stark von Resultaten, die aus der
Untersuchung von Kuhmilch bekannt waren.
Die Primarstruktur von ocsr, Os2-, (3- und k-CN wurde durch Edman-Abbau
von tryptischen Fragmenten und durch cDNA-Sequenzierung bestimmt.
ctsi-CN hatte 207, as2-CN 178, (3-CN 217 und k-CN 162 AS. Die Ahnlichkeit
zu Kuhmilchproteinen war 60.3% fur ctsi-CN, 73.0% fur ocS2-CN, 80.4% fur
(3-CN und 73.8% fur k-CN. Sauregefalltes Kasein von Mischmilch wurde
ausserdem mittels Phasenumkehr-Chromatographie getrennt und bei 220
nm aufgezeichnet. Aufgrund der Signalintensitat wurde der relative Gehalt
von asi-CN auf 22%, von ocs2-CN auf 9.5%, von (3-CN auf 65% und von k-CN
auf 3.5% des Gesamtkaseins geschatzt. Seitenketten der Proteine, die
moglicherweise posttranslational phosphoryliert oder glykosyliert waren,
wurden durch Massenspektrometrie und durch die Analyse von
Erkennungsmustern in der Primarstruktur bestimmt. Fur asi-CN A wurden
Massen von 24.7 und 24.8 kDa gemessen, ocsi-CN B, aS2-CN, [3-CN und k-CN
hatte Massen von 25.3 kDa, 22.0 kDa, 24.9 kDa und 22.3-23.0 kDa. Der
isoelektrische Punkt von asi-CN A 6P war bei pH 4-41, von asi-CN B 6P bei
4.40, von as2-CN 9P bei 4.58, von [3-CN 4P bei 4.66 und von k-CN IP mit 10
gebundenen Salicilsaureresten bei 4.10. Die geringe Gallertfestigkeit von
labbehandelter Kamelmilch, verglichen mit labbehandelter Milch von
echten Wiederkauern, wurde auf die verschiedenartige Zusammensetzung
VIII
der Kaseinfraktion, und auf deutliche Unterschiede in der K-CN-Struktur
zuriickgefiihrt.Die mRNA von Chymosin und Pepsin aus der Schleimhaut des Labmagenseines Kamels wurde sequenziert, um die spezifische Interaktion der Enzymemit k-CN zu analysieren. Kamel-Chymosin hatte eine Lange von 323 AS, ein
Molekulargewicht von 35.6 kDa und einen isoelektrischen Punkt bei pH4.71- Die Ahnlichkeit zu bovinem Chymosin war 96.9%. Sogenannte
Spezifizitatstaschen fur die Interaktion mit der chymosin-sensitiven Regionvon k-CN wurden gefunden, mit hydrophilen oder hydrophoben
Eigenschaften, die ausgepragter waren, als diejenigen in bovinem
Chymosin. Daraus wurde geschlossen, dass Kamel-Chymosin zur Hydrolysevon Kamel-K-CN wahrscheinlich besser geeignet ist als bovines Chymosin.
Kamel-Pepsin hatte eine Lange von 327 AS, ein Molekulargewicht von 34.9
kDa und einen isoelektrischen Punkt bei pH 3.16. Die Ahnlichkeit zu
Schweine-Pepsin war 98.5%. Es wurde angenommen, dass die Aktivitat
beider Enzyme ahnlich war. Die hohere Aktivitat von Kamel-Chymosin, die
fiir die Gerinnung von Kamelmilch im Vergleich zur Aktivitat von bovinem
Chymosin nachgewiesen worden war (Wangoh, 1993), wurde auf die hohe
Enzym-Substrat-Spezifitat von Chymosin und k-CN zuriickgefiihrt, und es
wurde angeregt zu priifen, ob sich das Enzym fiir die Kaseproduktion
eignen wurde.
Die Molkenproteine der Kamelmilch wurden im Hinblick auf ihre
Konzentration, im Vergleich zu Molkenproteinen der Kuhmilch, untersucht,mit besonderem Interesse an Proteinen mit moglicher antimikrobieller
Aktivitat.
Ein Protein wurde mittels Heparin-Sepharose-Affinitatschromatographieaus Kamelmolke isoliert, das keine Ahnlichkeit zu in der Literatur
beschriebenen Molkenproteinen hatte. Die Konzentration in Molke wurde
auf 370 mg l1 geschatzt. Das Protein hatte 91.2% strukturelle Ahnlichkeit
zum menschlichen Peptidoglycan Erkennungsprotein (PGRP), eine Langevon 172 AS, eine Masse von 19.117 kDa und einen isoelektrischen Punkt bei
pH 8.73. Aufgrund der Wirkungsweise von strukturell verwandten
Proteinen von Wirbeltieren und Invertebraten wurde vorgeschlagen, dass
das Protein gegen grampositive, und wahrscheinlich auch gramnegativeBakterien wirksam ist.
Kamel-Lactophorin, ein Molkenprotein mit 83.6% Ahnlichkeit zu bovinem
Lactophorin und 67.9% zum murinen Zelladhasions-Molekiil GlyCAM-1,wurde zu ca. 75% in einer langen Variante A mit 137 AS und einer Masse
von 15.7 kDa, und zu ca. 25% in einer kurzen Variante B mit 122 AS und
IX Zusammenfassung
einer Masse von 13.8 kDa gefunden. Die Heterogenitat war die Folge von
differenziellem Splicing und Verlust des zweiten Exons in Variante B. Beide
Proteine waren vermutlich dreifach phosphoryliert. Im Gegensatz zu
bovinem Lactophorin, und zu den Maus- und Rattenvarianten von
GlyCAM-1, war das Kamelprotein nicht glycosyliert. Spezifische Interaktion
mit zuckerbindenden Proteinen, wie sie bei GlyCAM-1 berichtet wurden,
konnten deshalb ausgeschlossen werden, und eine Funktion des Proteins in
der spezifischen Erkennung von Zelltypen oder in der Suppression von
Rotaviren ist nicht wahrscheinlich. Die Konzentration in Kamelmilch war
etwa 954 mg l1, wahrend die Konzentration von bovinem Lactophorin in
Kuhmilch lediglich etwa 300 mg H betrug. Es wurde vermutet, dass das
Protein eine ahnliche Funktion in Milch wie sein bovines Pendant ausiibte,das die Zusammenballung der Fettkiigelchen unterdriickt, z.B. wahrend der
Ausscheidung in die Milchdriisen, und das die spontane Lipolyse des
Milchfetts durch Lipoprotein Lipase hemmt.
Lactoferrin wurde aus Kamelmolke mit Hilfe der Heparin-
Affinitatschromatographie isoliert. Die Proteinsequenz, die von der cDNA-
Sequenz abgeleitet wurde, hatte 91.6% Ahnlichkeit mit bovinem
Lactoferrin, hatte ebenso wie dieses Protein eine Lange von 689 AS, eine
Masse von 80.5 kDa und einen isoelektrischen Punkt bei pH 8.41- Das
Protein war wahrscheinlich zweifach glycosyliert und hatte zwei moglicheZentren fur die Bindung von Eisen und Karbonat. Analog zu bovinem
Lactoferricin wurde ein N-terminales proteolytisches Abbauprodukt mit
antimikrobiellem Potential vorgeschlagen. Die Konzentration des Proteins
betrug 220 mg l1, und war hbher als in Kuhmilch mit 140 mg H.
Die Primarstruktur von Lactoperoxidase wurde aus ihrer cDNA-Sequenz
abgeleitet, umfasste 612 AS, hatte eine Masse von 69.5 kDa und einen
isoelektrischen Punkt bei pH 8.63. Die Ahnlichkeit zum bovinen Homologwar 94.9%. Ahnlich wie dieses Protein war Lactoperoxidase aus Kamelmilch
vermutlich vierfach glycosyliert, hatte eine Ham-Gruppe kovalent und ein
Kalziumion elektrostatisch gebunden. Eine vergleichbare Aktivitat im
Lactoperoxidase-System wurde vermutet.
Die unterschiedliche Zusammensetzung von Molke und Kasein, im
Vergleich zu Milch von Wiederkauern, ist vermutlich eine Folge von
erblichen Faktoren und Umwelteinflussen.
1 Introduction
1 INTRODUCTION
The Arabian camel (Camelus dromedarius) is the most important livestock
animal in the semi-arid areas of Northern and Eastern African countries. Of
19.6 million camels world-wide (dromedaries and bactrians), 14.6 million
are held in Africa, 6.1 million of which in Somalia alone. Camels are
multipurpose animals, they are used for milk, meat and hide supply, as well
as for transport and for field cropping.
Whereas world-wide production of camel milk merely contributes to 0.23%
of total milk production, it accounts for 38% of total milk production in
Somalia. World-wide production of camel milk exceeds production of camel
meat 5.3 times. Compared to world milk production of all livestock, which
surpasses world meat production only 2.6 times, it is obvious, that camels
are mainly held as a milk supplying livestock. Total milk yield of the 19.6
million camels was 1.3 billion litre in 1997. Average milk yield per animal
was therefore 0.18 litre per day. Total milk yield of the 1.333 billion cattle
was 471 billion litre, average milk yield per animal was therefore 0.97 litre
per day. This figures implicate, that milk productivity of camels is more
than five times lower than milk productivity of cattle. On the other hand,
average milk yield of Somali camels was 0.38 litre per day, of Somali cattle
only 0.30 litre per day (FAO, 1998). This figures illustrate, that camel milk
yield is higher than the milk yield of cattle in arid countries. Milk yield per
hectare is even higher in a mixed herd of camels and small ruminants, due
to complementary grazing patterns. The Arabian camel is the livestock,which has the best chance to survive a prolonged drought period, and helpsthe camel keeping societies to survive one ore more dry seasons.
Furthermore, due to their instinct for deferred grazing, camel herds help to
keep the ecological balance intact.
Research on camels is scarce, especially on camel milk. Of a total of more
than 150,000 publications indexed by CAB International, Oxon, UK, every
year, an average of 210 publications was dedicated to camel research in
general, and an average of merely 24 studies focused on camel milk
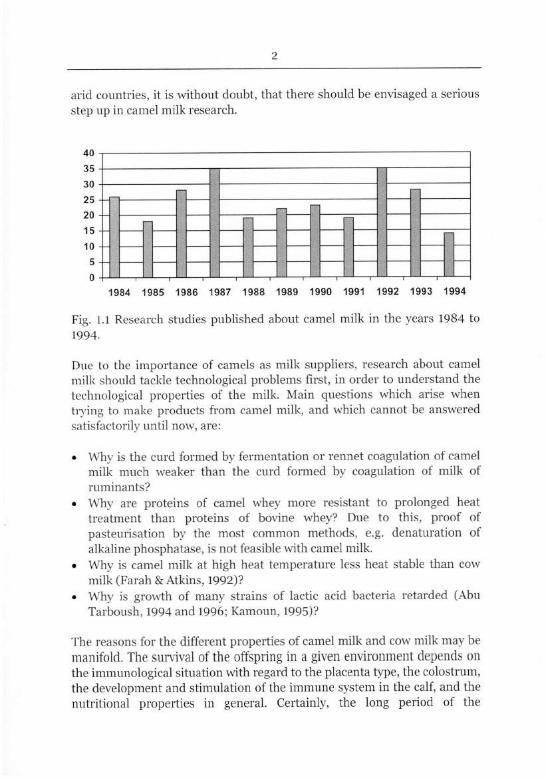
research. As Fig. 1.1 illustrates, research with focus on camel milk was rare,
compared to the much greater efforts in research about cow milk, but
relatively continuous over the years. Nevertheless, only 0.33% of all
research done about milk focused on camels in the years 1984 to 1998.
Given the impact, this animal has on the social and economical situation in
2
arid countries, it is without doubt, that there should be envisaged a serious
step up in camel milk research.
40
35
30
25
20
15
10
5
0«, 1
1984 1985 1986 1987 1988 1989 1990 1991 1992 1993 1994
Fig. 1.1 Research studies published about camel milk in the years 1984 to
1994.
Due to the importance of camels as milk suppliers, research about camel
milk should tackle technological problems first, in order to understand the
technological properties of the milk. Main questions which arise when
tiying to make products from camel milk, and which cannot be answered
satisfactorily until now, are:
• Why is the curd formed by fermentation or rennet coagulation of camel
milk much weaker than the curd formed by coagulation of milk of
ruminants?
• Why are proteins of camel whey more resistant to prolonged heat
treatment than proteins of bovine whey? Due to this, proof of
pasteurisation by the most common methods, e.g. denaturation of
alkaline phosphatase, is not feasible with camel milk.
• Why is camel milk at high heat temperature less heat stable than cow
milk (Farah & Atkins, 1992)?
• Why is growth of many strains of lactic acid bacteria retarded (Abu
Tarboush, 1994 and 1996; Kamoun, 1995)?
The reasons for the different properties of camel milk and cow milk may be
manifold. The survival of the offspring in a given environment depends on
the immunological situation with regard to the placenta type, the colostrum,
the development and stimulation of the immune system in the calf, and the
nutritional properties in general. Certainly, the long period of the
3 Introduction
paleontological development may have caused noticeable differentiation.
The family of the Arabian and the Bactrian camels belong to the suborder of
Tylopoda, together with the llama and vicuna families. Because all
members of the Camelidae suborder ruminate, they were put into a close
paleontological relationship with true ruminants. Most animals used for
milk production are members of the Bovidae family of Ruminantae, e.g.
cattle, sheep, buffaloes and goats. Recent research using morphological and
molecular biological methods showed, that true ruminants are closer
related to Cetacea (baleen and tooth whales) than to Tylopoda and
Suiformae, which are more distantly related. For this reason, the order of
Cetacea and the order of Artiodactyla (even toed ungulates) were put into
one order Cetartiodactyla (Graur and Higgins, 1994). Tylopoda and
Suiformae are probably closer related to each other than to Ruminantae
(Martinat era/. 1991).
Differences in the immunological situation as a result of the different
habitats, in which the animals live, adaptation to a sub-optimal food supplyand quality, and differences in the way, the offspring is raised, as well as the
more distant paleontological relationship, can give some explanations to
generally observed differences between camel milk and milk of ruminants,in terms of chemical characteristics and technological properties.
Furthermore, it has to be considered, that systematic selection for
productive traits has never been done in camels (Schwartz & Dioli, 1992).
Most research done for characterisation of camel milk focused on the studyof gross components, such as total protein, fat or minerals. Many propertiesof milk depend on the protein fraction. To understand the true nature of the
different proteins, modern analytical methods for isolation and
characterisation have to be applied. There is a need to know the distribution
of the individual proteins in the casein and whey fraction, and to obtain
insight into the primary structure and the way of modifications of the
different proteins, which finally will lead to a better understanding of the
processing quality of camel milk. In the course of this thesis, we tried to
throw light on different aspects of the camel milk protein fraction.
Among these were:
• Quantification and structural analysis of camel milk caseins.
• Quantification of the main whey proteins a-lactalbumin and lactophorin.• Structural analysis of different functional whey proteins: lactoferrin,
lactoperoxidase, and peptidoglycan recognition protein.
4
• Structural analysis of renneting enzymes chymosin and pepsin, and
comparison to the homologous proteins from cattle.
As there is little research already done in this area, and the milk proteinfraction is a complex subject to investigate, the results of the present work
can only give limited insight into the nature of camel milk proteins, but will
give hints, which questions have to be addressed in further research on this
subject.
In the present thesis, only Camelus dromedarius proteins were studied.
Camel proteins described are named without annotation of species in the
following text, to facilitate ease of reading.
5 Literature Review
2 LITERATURE REVIEW
This review was written with the intention to cover some general aspects
with regard to camel milk, and not to give background information about
the proteins studied. Literature concerning individual proteins will be
discussed in the respective chapters of "Results and Discussion".
TaxonomyThe Camelidae belong to the order of Artiodactyla (even toed ungulates),and the suborder Tylopoda (pad footed animals). They are divided into the
genus Camelus, with the two old-world species Camelus dromedarius
(Arabian camel) and Camelus bactrianus (Bactrian camel), the genus
Lama, with the new-world species Lama glama (llama), Lama guanicoe
(guanaco), and Lama pacos (alpaca), and the genus Vicugna with the new-
world species Vicugna vicugna (vicuna). Camelids spread from North
America, where their ancestors originated, to South America, Asia and
Africa in the late tertiary age. In North America they became extinct. The
old-world species Camelus dromedarius and Camelus bactrianus can be
crossed and the female offspring is most likely fertile in the first generation,but the males Fi seem to be sterile. The Arabian camel was probablydomesticated in the region of today's Yemen and Oman about 3,000 to
4,000 years ago and then introduced with the spice trade into North and
East Africa, Persia and India. The wild Arabian camel became extinct
(Schwartz & Dioli, 1992).
Camel breeds are not as much differentiated as breeds from other livestock.
Systematic selection for productive traits has never been done in camels,
with the exception of racing camels. There is a rough classification into the
slender type, which is used for riding purposes, and the stout type, which is
used for transport and milk production purposes, and which dominates in
Eastern Africa. The weights of former type rarely exceed 400 kg in females
and 550 kg in males, whereas females of the milk type have weights up to
650 kg and males up to 800 kg. The typical Somali dairy breed, which is the
"Benadir" type, belongs to the heavy baggage type. It can be assumed, that
there is a genetic variability, which is about as high as in cattle, upon studyof body constitution, milk and meat production (Wilson, 1990).
Anatomy and PhysiologyCamels are ruminating, but do not belong to the suborder Ruminantia.
They differ from true ruminants in their foot anatomy, the absence of horns
6
or antlers and their stomach system. A similar system of multi-
compartmented stomach digestion of fibrous food by rumination and bymicrobial fermentation evolved in Ruminantia and Tylopodaindependently. Whereas the stomach of ruminants consists of four
compartments, the stomach of camels is merely divided into three
compartments. The compartment, where the renneting enzymes chymosinand pepsin are secreted, is the largest one, and is subdivided by a strongmuscular ridge into a cranial and a caudal portion. The mechanism of
digestion is also different in ruminants and camels. Whereas all digestedfood is mixed in the rumen and reticulum of ruminants, and transported in
the organ homogeneously some hours after feed intake, the camels have
developed a suction pressure rhythm to separate particles and fluids,
whereby fluids are pressed into the glandular sacs for absorption, and feed
particles are retained in the forestomach for prolonged microbial
degradation (Schwartz & Dioli, 1992).
Arabian camels are especially adapted to a hot and arid environment. The
hump of the camel serves to survive seasons of limited forage supply. Other
livestock in arid areas, such as zebus and fat tailed sheep developed a
similar organ. Even more important for survival in arid regions is short time
water deprivation. Whereas cattle death occurs 3 to 4 days after water
deprivation, healthy camels can survive up to 20 days. The mechanisms,which help to keep water requirement at a low level for a prolonged periodof time are multiple. Water losses through urine are minimised by a
superior system of urine concentration, faecal dehydration and retention of
metabolites in the body fluids. Unlike other mammals, Arabian camels can
tolerate body temperature fluctuations from 34 °C to 42 °C, thus saving a
considerable amount of water during the daytime, mainly in the afternoon,in contrast to other animals, which regulate their body temperature byreinforced sweating. The body temperature is lowered in the night time
beneath a level, which is physiologically tolerable for other mammals.
(Schwartz & Dioli, 1992). Camels have developed a system of increased and
diluted milk delivery in times of water deprivation, to prevent the newborn
from dehydration (Yagil & Etzion, 1980).
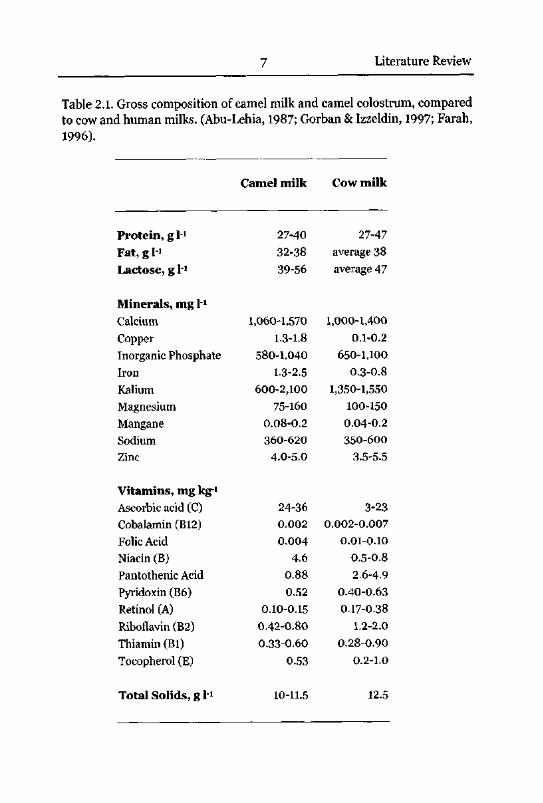
Gross Composition ofCamel Milk
There are several studies concerning the content of proteins, fat, lactose,minerals and vitamins in camel milk. Table 2.1 gives an overview of these
data.
7 Literature Review
Table 2.1. Gross composition of camel milk and camel colostrum, comparedto cow and human milks. (Abu-Lehia, 1987; Gorban & Izzeldin, 1997; Farah,
1996).
Camel milk Cow milk
Protein, g V1 27-40 27-47
Fat,gli 32-38 average 38
Lactose, g 1_1 39-56 average 47
Minerals, mg l1
Calcium 1,060-1,570 1,000-1,400
Copper 1.3-1.8 0.1-0.2
Inorganic Phosphate 580-1,040 650-1,100
Iron 1.3-2.5 0.3-0.8
Kalium 600-2,100 1,350-1,550
Magnesium 75-160 100-150
Mangane 0.08-0.2 0.04-0.2
Sodium 360-620 350-600
Zinc 4.0-5.0 3.5-5.5
Vitamins, mg kg-1
Ascorbic acid (C) 24-36 3-23
Cobalamin (B12) 0.002 0.002-0.007
Folic Acid 0.004 0.01-0.10
Niacin (B) 4.6 0.5-0.8
Pantothenic Acid 0.88 2.6-4.9
Pyridoxin (B6) 0.52 0.40-0.63
Retinol (A) 0.10-0.15 0.17-0.38
Riboflavin (B2) 0.42-0.80 1.2-2.0
Thiamin (Bl) 0.33-0.60 0.28-0.90
Tocopherol (E) 0.53 0.2-1.0
Total Solids, g l1 10-11.5 12.5
8
The average concentration of total solids is slightly lower than in cow milk,
but the relative amount of the main components protein, fat and lactose is
similar to cow milk.
Main mineral salts in camel and cow milk are sodium chloride, calcium and
magnesium phosphate, and citrate. The ionic strength of milk is low
compared to body fluids. Nevertheless, the physical state of milk
components, and the stability of proteins are strongly influenced by mineral
salts, particularly by the phospho-caseinate complex. The reported levels for
calcium and phosphate are similar to cow milk, the casein stabilisation
potential is therefore similar in camel and cow milk. It has to be considered,
that mineral and vitamin content of milk depend mainly on feeding, health
status of the udder and stage of lactation.
Camel milk contains less vitamin A, Bi, B2, E, folic acid and pantothenicacid. The opaque white appearance of camel milk may be a consequence of
the low vitamin A level. The content of niacin and vitamin C is substantially
higher than in cow milk. A higher level was also reported for carnitin
(vitamin Bt). Whereas only 235-290 nmol H were measured in fresh cow
milk, 410 nmol 1_1 were detected in camel milk (Alhomida, 1996). The higher
proportions of these vitamins were considered to be an adaptation to the
arid environment.
Physico-chemical Properties ofCamel Milk
The chemical and technological characteristics of raw camel milk are
different from those of raw cow milk. Basic parameters, which influence the
suitability of the milk for processing, such as acidity, specific gravity and
freezing point, were reported by several authors and usually compared to
values of cow milk. The data collected show great variations and should be
interpreted with care. Systematic errors may have arisen from experimental
implementation and from the small sample sizes, which were studied. Some
values may vary due to differences in animal feeding and husbandry. An
additional constraint for interpretation is, that breeds are poorlycharacterised, which applies also to the camels chosen for investigation.There would be a need for a more systematic approach for determination of
compositional values.
The value for the actual acidity of camel milk is similarly to cow milk
between pH 6.5 and 6.75. The maximal buffering capacity of skim camel
milk is at pH 4.95, compared to pH 5.65 for skim cow milk (Al-Saleh &
Hammad, 1992). This gives indication that the composition of constituents
9 Literature Review
with buffering capacity is different between camel and cow milk. Titratable
acidity is between an equivalent of 0.13-0.16% lactic acid in fresh milk,which is slightly lower than the mean value of 0.17% for cow milk, and
seems to depend on the breed (Wangoh, 1997).
Whereas cow milk possesses a pronounced heat stability maximum at pH6.7 and a minimum at pH 6.9, when determined at 130 °C, with stabilitydecreasing at pH lower than 6.7 and increasing at pH higher than 6.9, camel
milk does not show an increased stability at pH 6.7. Heat stability of camel
milk is much lower than of cow milk. Heat coagulation time for cow milk at
130 °C is about 40 min at pH 6.7, whereas camel milk coagulates at this
temperature and pH in 2 to 3 min (Farah & Atkins, 1992). There is no
information available concerning the ethanol stability of camel milk.
The freezing point of camel milk was found to be between -0.57 °C and
-0.61 °C (Wangoh, 1997). It is lower than the freezing point of cow milk,which is between -0.51 °C and -0.56 °C. A higher salt or lactose
concentration in the camel milk, which was studied, as compared to cow
milk, may have contributed to this result.
Values for specific gravity measured by Kamoun (1990) and Wangoh (1997)
depended on the breed chosen and varied between 1.028 kg r1 and 1.033 kgl1. These values are similar to values for cow milk, which are between 1.026
kg I"1 and 1.034 kg H Other authors reported lower viscosity and density for
camel milk than for cow milk (Kamoun, 1995). A mean value for viscosity of
Egyptian camel milk was 2.2 mPa s, which is higher than the mean value of
1.8 mPa s for cow milk (Hassan et al. 1987). These contradictory results
may be explained by differences in husbandry, mainly in water supply.Hassan et al. (1987) also observed strong seasonal variations in milk
viscosity, specific gravity and titratable acidity. Milk of heifers deprivedfrom water for several days was reported to be more dilute, probably to
protect the calf from dehydration during dry periods (Yagil & Etzion, 1980).
Composition and Characteristics ofthe Protein Fraction
The total protein content of camel milk is similar to cow milk. Values are in
the range of 27 g l"1 to 40 g l'1 (Farah, 1996). The ratio of whey proteins to
caseins is about 0.4, and thus higher than in cow milk, where it is about 0.2.
Camel milk seems to have a slightly higher amount of non protein nitrogenthan cow milk (Farah, 1996). There are no statistically significant data
available to the average amino acid composition of the camel milk proteinfraction.
10
The size distribution of casein micelles is in the range of 15 nm to 500 nm
with a maximum in volume frequency between 260 nm and 300 nm (Farah& Riiegg, 1989). The distribution is significantly broader than that of cow
milk, where it is in the range of 15 nm to 300 nm, with a maximum between
100 nm and 140 nm. The number of large micelles is significantly higher,which is unfavourable for formation of a firm coagulum in milk processing.A negative correlation between mean micelle size and k-CN content of cow
milk was reported (Schlimme, 1990). Small micelles of about 60 nm
contained 12% k-CN, large micelles of about 200 nm contained mere 2% k-
CN. Since these data also correlate in human milk, which has a mean
micelle diameter of 20 nm to 60 nm and a rather high k-CN content, it was
assumed, that camel milk was low in k-CN or devoid of this protein (Farah,
1996).
A markedly higher resistance of whey proteins towards heat treatment was
reported (Farah, 1986). Degree of denaturation varied in camel milk from
32% to 35% at 80 °C. In cow milk, 70% to 75% of whey proteins were
denatured at this temperature.
Activity of plasmin and plasminogen in camel milk of early lactation was
shown to be below the level in cow milk (Baer et al. 1994). Furthermore,activation of plasminogen into plasmin by urokinase was threefold lower
than activation of bovine plasminogen. Cross-reactivity of bovine and camel
plasminogen, using antibodies against bovine plasminogen, was not
detected, which indicated, that the two plasminogen types were structurallydifferent. Slow activation and low activity may be a consequence of serine
protease inhibitors in camel milk. The activity of camel and cow plasmin on
camel casein were similar. Other authors reported higher proteolyticactivity in camel milk than in cow milk (Abu-Tarboush, 1994).
Milk of non-ruminants, such as human, horse or pig milks, revealed high
proportions of glycoproteins, which were connected to the milk fat globulemembrane. These glycoproteins were similar in structure and function to
intestinal mucins, with molecular masses up to 500 kDa and with up to
80% carbohydrate content (Schlimme, 1990). The main function of these
proteins may be in prevention of fat globule aggregation and of lipolysis.
They may also have an antiviral and antimicrobial effect. A high proportionof these proteins is also likely to occur in camel milk, since a far thicker
MFGM was observed than in milk of other animals (Knoess et al. 1986).
11 Literature Review
Technology appliedfor Processing ofCamel Milk
The far greatest amount of camel milk is consumed as a fresh or as a
naturally fermented product. "Susa", a product consumed in North-Eastern
Africa, is made by incubation of milk in smoke sanitised wooden buckets for
about one to three days. The consistency of fermented camel milk is thin. A
flocculent precipitate is formed, rather than a firm coagulum. Studies
carried out in Kenya showed that the quality of "Susa" can be improved
using selected, mesophilic starter cultures rather than spontaneous
bacterial contamination for fermentation. The Somali consumers preferredthis novel product to the traditional product (Farah et al. 1990). Growth of
bacterial strains used for cow milk fermentation may be inhibited by the
natural antimicrobial activity of camel milk (Elagamy et al. 1992). Strongerinitial growth was reported for Lactobacillus acidophilus (Abu-Tarboush,
1994). This could be due to a higher content of non protein nitrogen in
camel milk (Bayoumi, 1990).
Butter is traditionally produced by skimming of creamed up fat, and
subsequent churning. This technique cannot be applied to camel milk fat,since the milk shows little tendency to cream up. Butter was produced byheating the milk at 65 °C for 30 min and separating the cream bycentrifugation. To obtain a reasonable butter yield, camel cream was
churned at temperature between 22 °C and 25 °C. The correspondingtemperature for cow milk cream are between 8 °C to 14 °C. The reason for
this difference is the high melting point of camel milk fat, which is at 40 °C
to 41 °C. This seems to shift the ideal ratio of solid to liquid fat at given
temperature towards a point higher than that of cow milk fat (Farah &
Riiegg, 1989). It was shown, that creaming of camel milk fat was markedlyimproved by dissolution in skim cow milk. Cow milk fat dissolved in skim
camel milk, on the other hand, showed a sharp decrease in the ability to
cream up. It can therefore be concluded, that agglutinin (immunoglobulinM), the factor, which promotes creaming of cow milk fat, is low or devoid in
camel milk (Farah & Riiegg, 1989). Churning of camel milk fat may be
aggravated by the much lower ratio of lipid droplet to MFGM in camel milk
fat globules. The average moisture content of camel butter is 12.65%, and
thus much lower than the content in cow milk butter, which is 15-56%
(Hagrass et al. 1987). This may explain the sticky texture of camel milk
butter. Camel milk butter may be more susceptible to light oxidation, due to
the higher amount of non saturated triglycerides. It would be well worthy to
study the sensitivity of camel milk fat towards lipolysis and oxidation.
Having in mind, that insolation in camel keeping countries is high and the
total surface of milk fat is larger, since the volume to surface ratio of camel
12
milk fat globules is only 4-40 um (Farah & Riiegg, 1989; Mehaia, 1995),
compared to a value of 5.32 um for cow milk fat globules, light oxidation of
fresh camel milk may be a concern, since milk is often stored in transparentcontainers.
Similarly to horse milk, the renneting capability of camel milk is poor
(Bayoumi, 1990). Addition of 2% CaCl2 increased curd firmness slightly,whereas addition of higher percent amounts decreased coagulation time
without further improvement of curd firmness. Renneting is probably low,because the mean size of casein micelles is about double of cow milk casein
micelles. Electron micrographs showed, that the network formed at the
coagulation point was less compact than in renneted cow milk, and the
micelles were linked merely by contact adhesion, with little change in the
original micellar structure, whereas the network formed in cow milk
consisted of fused micelles (Farah & Bachmann, 1987). Cheese yield is in
the range of 35% of milk dry mass, compared to about 85% for cow milk.
This result may be explained by the lower amount of total solids, the poor
rennetability, the smaller fat globules, the sodium concentration, which is
often higher than in cow milk, and the higher proportion of whey proteins.
Higher cheese yield was obtained with sophisticated technology, addition of
CaCk and fourfold higher chymosin concentrations than used in cow milk
(Ramet, 1987). Higher cheese yields were also obtained, when the milk was
blended with milk from ruminants (Ramet, 1991). Most studies on cheese
production from camel milk report the production of a low fat cheese with
slightly bitter taste (Farah, 1996). It can be assumed, that this type of cheese
finds little consumer acceptability in camel keeping countries, where cheese
has to be introduced as a novel product.
Different studies showed that seasonal variations in camel milk productionare great and much of surplus milk is collected during the rainy season.
Processing camel milk into pasteurised and fermented products will
therefore be of great advantage, allowing the camel small-holder to
commercialise his milk (Farah, 1996). Camel milk is commercially
pasteurised in Saudi-Arabia and Mauritania. Problems may arise from the
low heat coagulation time of camel milk and a tendency to flocculate. There
are also environmental and socio-economical factors which make milk
processing by pasteurisation a difficult task in arid countries
(Abeiderrahmane & Reed, 1993).
A problem, which arises from the higher general heat stability of camel
whey proteins is, that the most commonly used methods for determination
13 Literature Review
of pasteurisation all fail. The inactivation of phosphatase and
lactoperoxidase do not occur to the same extent. Positive reaction of the
former by short time heat denaturation is able to detect 0.1% raw milk in
pasteurised cow milk. The latter is able to detect 5% raw milk in high
temperature treated cow milk. Both reactions do not work in camel milk
(Montet, 1997), even not when modified in a way similar to the
pasteurisation proof of goats milk by alkaline phospatase.
Nutritional Quality and Therapeutic Use ofCamel Milk
The gross composition of camel milk is similar to cow milk. Camel milk is
therefore supposed to be nutritionally equivalent to cow milk.
The low proportion of vitamins A, Bi, B2, E, folic acid and pantothenic acid
is a disadvantage in the composition of camel milk. A balanced diet with
camel milk as basic foodstuff should consider this aspect. Especially a
problem is the low level of vitamin A, since green vegetables are a minor
part of the diet in arid areas. Lack of vitamin A leads to a higher child
mortality rate and, in extreme cases, to blindness. There is no information
available about the vitamin D (calciferol) content of camel milk. Vitamin D
is important for bone formation of children. A high amount in camel milk
would therefore be desirable. A higher level of vitamin A and D could be
achieved by appropriate feeding, whereas the vitamins of the B-group are
mainly provided by the microflora of the rumen. The high content of
vitamin C, niacin and carnitin is nutritionally important for camel milk
consumers, since fruits and vegetables are scarce in arid areas (Farah,
1996).
The lipid fraction in camel milk is characterised by a high proportion of longchain fatty acids, which accounts for 96.4%, compared to 85.3% in bovine
milk (Abu-Lehia, 1989). A higher proportion of short chain fatty acids
would be favourable for consummation, since short chain fatty acids
alleviate digestion of the triglycerides. The higher proportion of 43.1% non
saturated fatty acids, compared to 38.8% in cow milk fat, is favourable for
the body metabolism. Most prominent is palmitoleic acid with 10.4%,
compared to 3.6% in cow milk fat, whereas the proportion of the essential
linoleic acid is slightly lower in camel milk fat, with 2.9% compared to 3.2%
in cow milk fat. There is no information about the amount of cholesterol in
camel milk fat, which is about 0.4% in cow milk fat (Schlimme, 1990).
Camel milk is used in the traditional medicine of Northern and Eastern
African countries for treatment of inflammation and wounds (Yagil, 1987).
14
Raw milk is also used in the therapy of diarrhea, mainly of newborn
children, and of peptic ulcers. Complete healing of 57.5 % ofhuman patients
suffering from gastrointestinal ulcers, and treated with camel milk was
reported, compared to 34.5 % after treatment with cow milk (Lozovich,
1995). A higher antimicrobial potential of raw camel milk compared to raw
cow milk has been reported (Farah, 1996). There are also reports of camel
milk used in non-conventional cancer therapy and treatment of
neurodermitis and diabetes. Fermented camel milk (shubat) is sucessfullyused in the treatment of peptic ulcers in Russia (Sukhovef al. 1986).
15 Materials and Methods
3 MATERIALS AND METHODS
3.1 Protein Analysis
Sample PreparationMilk of individual Somali and Arabian camels was collected during milkingat 01 Maisor Ranch, Rumuruti, Kenya, and at Kamelfarm Fatamorgana,
Rotfelden, Germany, immediately frozen at -20 °C for transport and stored
at -70 °C until analysis. After thawing, the milk, which had a pH of about
6.6, was skimmed at 1000 g, 4 °C for 15 min. The casein fraction was
isolated by acid precipitation of 11 milk at pH 4.6 and 37 °C for 20 min,
using 0.1% acetic acid, followed by addition of 10 mM sodium acetate for
neutralisation, and centrifugation at 4000 g for 5 min. Casein pellet and
whey were frozen and stored at -70 °C. For crude preparation of an a- and a
P-CN fraction, the casein pellet was dissolved in 200 ml 10 M urea, diluted
with 460 ml double distilled water and the pH adjusted to 7.5 with 1 M
sodium hydroxide. The solution was diluted with 200 ml double distilled
water and adjusted to pH 5-0 with 1 M-HC1 (Hipp et al. 1952). The firm
precipitate consisted mainly of a- and k- CN. After centrifugation at 600 g
for 5 min, the supernatant was saturated with ammonium sulphate for
precipitation of P-CN. Both precipitates were lyophilised. 1 g acid
precipitated casein or lyophilisate were dissolved in 5 ml sample buffer with
10 M urea, 140 mM sodium citrate, 35 mM l,3-Bis[tris(hydroxy-methyl)-
methylamino]-propane, 780 mM P-mercaptoethanol, and 200 mM Tris-
(hydroxymethyl)-aminomethan/HCl at pH 8.0, and stirred for 1 h. Wheywas dialysed twice against double distilled water for 5 h at 4 °C, and once
against 10 mM sodium phosphate buffer at pH 7.4 for 14 h, using an
autoclaved SPECTRA/POR membrane tubing with a molecular cutoff of 6 to
8 kDa (Spectrum Medical Industries, Inc., Los Angeles, CA 90060 USA).
Prior to chromatography, samples were filtered through a hydrophilic 0.45
urn membrane (ME25; Schleicher & Schuell, 37586 Dassel, Germany).
RP-&8 HPLC ChromatographyIndividual caseins were separated by HPLC (LaChrom; Merck, D-64293
Darmstadt, Germany) on a silica-coated, analytical reversed-phase Gs
column (GromSil 200 ODS-4 HE, 5[i, 250 x 4.6 mm; Grom, D-71083
Herrenberg, Germany). Solvent A was 0.1% (v/v) TFA in double distilled,nanofiltered water, solvent B was 0.1% (v/v) TFA in acetonitrile. After
injection of 10 jj.1 to 50 ul casein filtrate, elution was performed by a linear
16
gradient from 0 to 35% solvent B over 15 min, followed by a linear gradientfrom 35 to 45% B over 35 min. The flow rate was 1 ml min-1 and runs were
performed at ambient temperature. Whey proteins were separated byinjection of 40 ul filtrate. Elution was performed by a 5 min hold with 0%
solvent B, a linear gradient from 0 to 30% solvent B over 5 min, followed bya linear gradient from 30 to 70% B over 40 min. The flow rate was 1 ml mirr
1 and runs were performed at ambient temperature. For large scale isolation
of individual caseins, a silica-coated, semi-preparative reversed-phase ds
column (GromSil 300 ODS-5 ST, 5 u, 250 x 20 mm; Grom) was used to
separate the proteins of the crude a- and p-CN fractions. After injection of 1
ml filtrate, elution was performed by a 9 min hold at 0% solvent B, followed
by a linear gradient from 0 to 40% B over 3 min and a linear gradient from
40 to 43% B over 28 min. The flow rate was 9.5 ml mm1, and runs were
performed at 30 °C. The column effluent was monitored with a diode array
detector (L-7450; Merck) from 200 to 300 nm. Proteins eluted were
collected manually and lyophilised.
Heparin-SepharoseAffinity Chromatography40 ml whey were loaded on a 1 ml Heparin Sepharose HiTrap column
(Amersham Pharmacia, 751 25 Uppsala, Sweden). The column was washed
with 10 ml of 10 mM sodium phosphate, 20 mM sodium chloride buffer at
pH 7.4. Elution was performed at ambient temperature by a linear gradientfrom 0.02 to 1 M sodium chloride over 40 min. The column effluent was
monitored with an UV detector (L-7300; Merck) at 280 nm. Proteins eluted
were collected manually and lyophilised. Fractions were further purified,
prior to micro-sequencing and molecular mass determination, by reversed-
phase Ci8 HPLC. Elution was performed by a linear gradient from 0.1% TFA
in double distilled, nanofiltered water, to 0.1% TFA in acetonitrile, over 60
min.
Amino Acid SequencingProteins collected from the effluent of the semi-preparative column were
used directly for N-terminal sequencing. Eluted proteins were applied on a
TFA-treated cartridge filter and dried under continuous nitrogen flow.
Automated Edman degradation (Matsudaira, 1989) was performed using an
ABI 471A sequencer (PE Applied Biosystems, Foster City, CA 94404 USA),
equipped with a 120A HPLC, for on-line reversed-phase Cis HPLC analysisof phenylthiohydantoinyl aa derivatives.
From each of the peaks corresponding to asi-, aS2-, (3- and k-CN, 1 mg
lyophilisate was dissolved in 1 ml of a buffer with 40% (v/v) acetonitrile,
17 Materials and Methods
60% (v/v) double distilled water, containing 400 mM ammonium
carbonate, pH 9 and digested overnight at 37 °C with 25 ug trypsin
(Sequencing grade, Boehringer, D-68305 Mannheim, Germany). Peptideswere separated using the same analytical column and a linear gradient from0 to 100% solvent B over 180 min. The flow rate was 1 ml min-1 and runs
were performed at ambient temperature. Peptides eluted from the column
were collected manually and dried by vacuum-centrifugation with a speed-vac SVC100 (Savant Instruments, New York, 11741-4306 USA). Sampleswere dissolved in 100 ul of 50% (v/v) acetonitrile, 50% (v/v) water. 20-100
\il were applied on a TFA treated cartridge filter and dried under a
continuous nitrogen flow, and used for automated Edman degradation.
Evaluation ofProtein PurityAbout 1 ug sample was loaded on a 12.32% T, 2.7% Cbis sodium
dodecylsulfate (SDS) polyacrylamide 1.5 mm vertical slab gel with a pH at
8.8, which was overlaid by a 4.62% T, 2.7% Cbis SDS stacking gel at pH 6.8.
Samples were separated in a MiniProtean II apparatus (BioRad, Hercules,CA 94547 USA) at 40 mA. Proteins were stained with 1% Coomassie G-250
in 40% methanol, 10% acetic acid for one hour, followed by destaining in
40% methanol, 10% acetic acid overnight. A 1:10 diluted protein marker
(V5231; Promega, Madison, WI 53711-5399 USA) was used for mass
determination.
Mass Determination ofHPLC Separated Proteins
Molecular masses of proteins were measured by matrix assisted laser
desorption/ionization mass spectrometry (MALDI-MS). Vacuum-dried
casein and whey protein samples were dissolved in 39.5% (v/v) acetonitrile,59.5% (v/v) double distilled water, 1% TFA. Samples were co-crystallisedwith an equal volume amount of oc-cyano-4-hydroxy-cinnamic acid (5 g l'1)
in 0.2% TFA. 1-3 pmol sample was applied to the target, and air-dried at
ambient temperature. For analysis, to a time-of-flight mass spectrometer in
linear mode was used (Voyager Elite, PerSeptive Biosystems, Framingham,MA 01701 USA). Spectra were recorded using a nitrogen ultraviolet laser at
337.1 nm and an acceleration voltage of 25 kV. The instrument was
calibrated with porcine myoglobin, a monomelic protein of 16,953 kDa.
QuantificationProtein peaks of the HPLC runs described in "Isolation of individual
caseins" were integrated at 220 nm. Relative amounts of peakscorresponding to the different caseins and whey proteins were calculated
18
and the results were compared with weights of the lyophilized fractions and
literature values (Farah, 1996).
3.2 DNA Analysis
PolyA-mRNA Isolation
Udder tissue of a lactating Somali camel (1 g) was taken in the morningafter milking and immediately homogenised with a rotor-stator
homogeniser (Kinematica, CH-6014 Littau, Switzerland). PolyA-mRNA was
isolated with the Oligotex Direct mRNA Kit (Quiagen, D-40724 Hilden,
Germany) according to the manufacturer's instruction for large scale
preparation of mRNA. Total yield was 21.6 ug mRNA and the A26o:A28o ratio
was 2.4. In the same way, polyA-mRNA was prepared from 500 ug of
mucosa tissue from the rough and the smooth part of the rennet stomach of
a 1.5 years old Arabian camel. Yield was 68 ug mRNA, and 60ug mRNA,
respectively, with an A26o:A28o ratio of 1.9.
Construction ofa cDNA Library
Single stranded cDNA, for use in PCR, was synthesised with a reverse
transcription system (A3500; Promega), according to the manufacturer's
recommendations.
A sample of mRNA (2 ug) was used for synthesis of cDNA using the
Universal RiboClone® cDNA Synthesis System (Promega) with an
oligo(dT)i5 primer and EcoR I adapters. One-fifth of the resulting cDNA was
ligated to 1 ug dephosphorylated X,-gtll arms (Promega). The ligated DNA
was in-vitro packaged using an E. coli C Packagene® X DNA extract
(Promega). All work was done according to the manufacturer's instructions.
Phages were plated on E. coli LE 392 (Promega). The titre of the library wasestimated at 2.6xl05 pfu ml1. 100 ul of the library were amplified and
produced a lysate with a titre of 1x10s pfu ml1.
Sequence AnalysisThe cDNA library was screened for cDNA corresponding to asi-, aS2-, (3- and
k-CN by nucleic acid hybridisation (Maniatis et al. 1989). Plaque lifts,
hybridisation and signal detection were done with the digoxigenin (DIG)
system of Boehringer, using uncharged nylon membranes, DIG EasyHyb
solution, anti-DIG-AP Fab fragments and CSPD®, according to the
manufacturer's instructions. Specific probes were synthesised by the
19 Materials and Methods
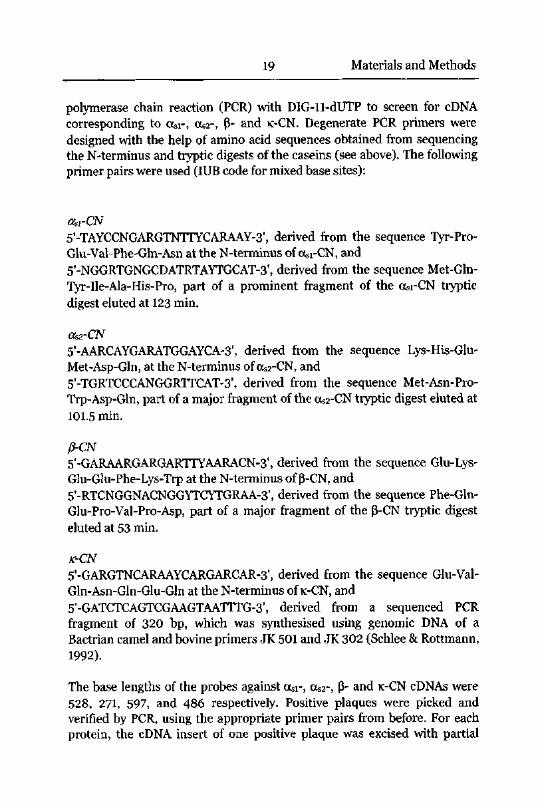
polymerase chain reaction (PCR) with DIG-11-dUTP to screen for cDNA
corresponding to Osi-, cfer, (3- and k-CN. Degenerate PCR primers were
designed with the help of amino acid sequences obtained from sequencing
the N-terminus and tryptic digests of the caseins (see above). The following
primer pairs were used (IUB code for mixed base sites):
Oki-CN
5'-TAYCCNGARGTNTTYCARAAY-3', derived from the sequence Tyr-Pro-Glu-Val-Phe-Gln-Asn at the N-terminus of asi-CN, and
5'-NGGRTGNGCDATRTAYTGCAT-3', derived from the sequence Met-Gln-
Tyr-Ile-Ala-His-Pro, part of a prominent fragment of the asi-CN tryptic
digest eluted at 123 min.
ccs2-CN
5'-AARCAYGARATGGAYCA-3', derived from the sequence Lys-His-Glu-
Met-Asp-Gin, at the N-terminus ofOs2-CN, and
5'-TGRTCCCANGGRTTCAT-3', derived from the sequence Met-Asn-Pro-
Trp-Asp-Gln, part of a major fragment of the aS2-CN tryptic digest eluted at
101.5 min.
p-CN5'-GARAARGARGARTTYAARACN-3', derived from the sequence Glu-Lys-
Glu-Glu-Phe-Lys-Trp at the N-terminus of p-CN, and
5'-RTCNGGNACNGGYTCYTGRAA-3', derived from the sequence Phe-Gln-
Glu-Pro-Val-Pro-Asp, part of a major fragment of the (3-CN tryptic digesteluted at 53 min.
k-CN
5'-GARGTNCARAAYCARGARCAR-3', derived from the sequence Glu-Val-
Gln-Asn-Gln-Glu-Gln at the N-terminus of K-CN, and
5'-GATCTCAGTCGAAGTAATTTG-3', derived from a sequenced PCR
fragment of 320 bp, which was synthesised using genomic DNA of a
Bactrian camel and bovine primers JK 501 and JK 302 (Schlee & Rottmann,
1992).
The base lengths of the probes against asi-, ocS2-, |3- and k-CN cDNAs were
528, 271, 597, and 486 respectively. Positive plaques were picked and
verified by PCR, using the appropriate primer pairs from before. For each
protein, the cDNA insert of one positive plaque was excised with partial
20
EcoR I-digest, ligated into a pGEM-7Z vector (Promega), dialysed, and
transformed into E. coli XLl-Blue (Stratagene, La Jolla, CA 92037 USA) by
electroporation with a Gene-Pulser® (BioRad) at 2.5 kV, 25 |^FD, and 200 O
in 0.2 cm cuvettes. The transformed bacteria were plated overnight at 37 °C
on IPTG/X-Gal/Ampicillin-selective agar. White colonies were picked and
grown overnight in 20 ml LB-Ampicillin 100 (Maniatis, 1989). Plasmid
DNA was purified for fluorescent sequencing with the Wizard Plus SV
Minipreps DNA Purification System (Promega).
Fluorescent sequencing of the cDNA was carried out using an ALF
automated device (Amersham Pharmacia), internal Cy5-dATP labelling
(Amersham Pharmacia) and primer walking starting from commercial SP6
and T7 primers (Promega).
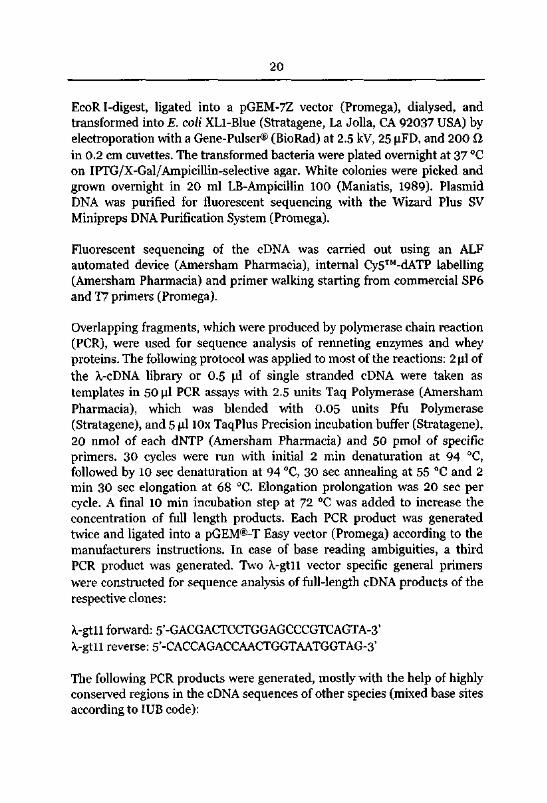
Overlapping fragments, which were produced by polymerase chain reaction
(PCR), were used for sequence analysis of renneting enzymes and whey
proteins. The following protocol was applied to most of the reactions: 2ul of
the X,-cDNA library or 0.5 M-l of single stranded cDNA were taken as
templates in 50 ul PCR assays with 2.5 units Taq Polymerase (Amersham
Pharmacia), which was blended with 0.05 units Pfu Polymerase
(Stratagene), and 5 ul 10x TaqPlus Precision incubation buffer (Stratagene),20 nmol of each dNTP (Amersham Pharmacia) and 50 pmol of specific
primers. 30 cycles were run with initial 2 min denaturation at 94 °C,
followed by 10 sec denaturation at 94 °C, 30 sec annealing at 55 °C and 2
min 30 sec elongation at 68 °C. Elongation prolongation was 20 sec per
cycle. A final 10 min incubation step at 72 °C was added to increase the
concentration of full length products. Each PCR product was generatedtwice and ligated into a pGEM®-T Easy vector (Promega) according to the
manufacturers instructions. In case of base reading ambiguities, a third
PCR product was generated. Two A,-gtll vector specific general primerswere constructed for sequence analysis of full-length cDNA products of the
respective clones:
X-gtH forward: 5'-GACGACTCCTGGAGCCCGTCAGTA-3'
X-gtll reverse: 5'-CACCAGACCAACTGGTAATGGTAG-3'
The following PCR products were generated, mostly with the help of highlyconserved regions in the cDNA sequences of other species (mixed base sites
according to IUB code):
21 Materials and Methods
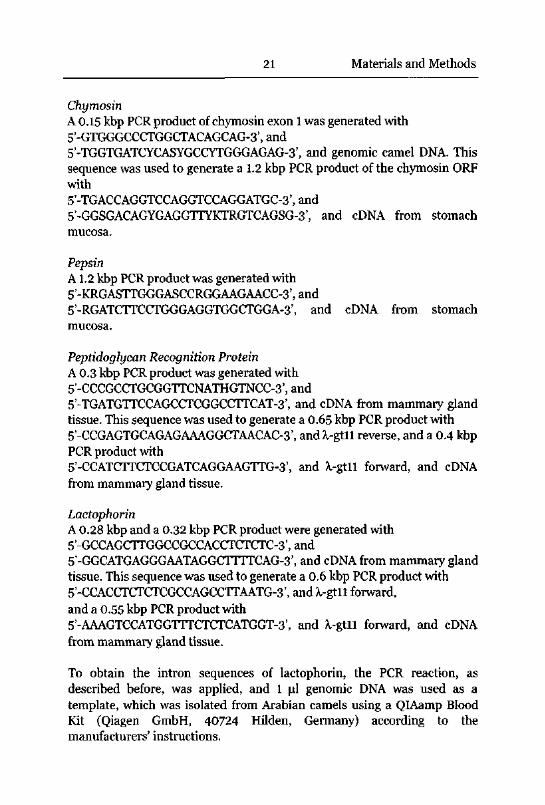
ChymosinA 0.15 kbp PCR product of chymosin exon 1 was generated with
5'-GTGGGCCCTGGCTACAGCAG-3', and
5'-TGGTGATCYCASYGCCYTGGGAGAG-3', and genomic camel DNA. This
sequence was used to generate a 1.2 kbp PCR product of the chymosin ORF
with
5'-TGACCAGGTCCAGGTCCAGGATGC-3',and
5'-GGSGACAGYGAGGTTYKTRGTCAGSG-3', and cDNA from stomach
mucosa.
PepsinA 1.2 kbp PCR product was generated with
5'-KRGASTTGGGASCCRGGAAGAACC-3', and
5'-RGATCTTCCTGGGAGGTGGCTGGA-3', and cDNA from stomach
mucosa.
Peptidoglycan Recognition Protein
A 0.3 kbp PCR product was generated with
5'-CCCGCCTGCGGTTCNATHGTNCC-3', and
5'-TGATGTTCCAGCCTCGGCCTTCAT-3', and cDNA from mammary glandtissue. This sequence was used to generate a 0.65 kbp PCR product with
5'-CCGAGTGCAGAGAAAGGCTAACAC-3', andX-gtll reverse, and a 0.4 kbpPCR product with
5'-CCATCTTCTCCGATCAGGAAGTTG-3', and X-gtll forward, and cDNA
from mammary gland tissue.
LactophorinA 0.28 kbp and a 0.32 kbp PCR product were generated with
5'-GCCAGCTTGGCCGCCACCTCTCTC-3',and
5'-GGCATGAGGGAATAGGCTTTTCAG-3', and cDNA from mammary glandtissue. This sequence was used to generate a 0.6 kbp PCR product with
5'-CCACCTCTCTCGCCAGCCTTAATG-3', and X-gtll forward,
and a 0.55 kbp PCR product with
5'-AAAGTCCATGGTTTCTCTCATGGT-3', and X-gtll forward, and cDNA
from mammary gland tissue.
To obtain the intron sequences of lactophorin, the PCR reaction, as
described before, was applied, and 1 ul genomic DNA was used as a
template, which was isolated from Arabian camels using a QIAamp Blood
Kit (Qiagen GmbH, 40724 Hilden, Germany) according to the
manufacturers' instructions.
22
A PCR product, which contained intron 1 was generated with
5'-ATGAAATTCTTCGCTGTCCTGCTG-3' and
5'-CTGAGACTCCATGTAGATTTCATC-3'.
A PCR product, which contained intron 2 was generated with
5'-GATGAAATCTACATGGAGTCTCAG-3'
5'-GACCTGATGGTTGCTCATGATGAC-3'
A PCR product, which contained intron 3 was generated with
5'-CAATCAGAAGAGACCAAAGAACTC-3'
5'-TATGATTTTATGAGTGAGCTCCAC-3'
LactoferrinA 0.4 kbp PCR product was generated with
5'-CTGTCCCATAGACCTCTGCCGCTA-3', X-gtll reverse, and cDNA from
mammary gland tissue. A 0.8 kbp PCR product was generated with
5'-GTTCRRTGGTGTRCCRTMTCCMMA-3',and
5'-GTCTTTGAACAGCAGGTCCTTCTG-3', and cDNA from mammary glandtissue. A1 kbp PCR product was generated with
5'-TTCCAGCTCTTTGGCTCYCC-3', and
5'-TTGAACAGAAGGTnTTGGT-3', and cDNA from mammary glandtissue. A 0.4 kbp PCR product was generated with
5'-CCAGGCAAGTTTTGCTTGTTCCAG-3', Jl-gtll reverse, and cDNA from
mammary gland tissue.
LactoperoxidaseA 1.35 kbp PCR product was generated with
5'-CTTCTGCATCTCATCACCTAGCAC-3', X-gtll reverse, and cDNA from
mammary gland tissue. A 0.24 kbp PCR product was generated with
5'-GGAGCAYAACCGGCTGGCCAGAGAA-3',and
5'-GTGGCCAAAGCGGAAGGCRAAGGTG-3', and cDNA from mammary
gland tissue. A 1.35 kbp PCR product was constructed with
5'-GTGCTAGGTGATGAGATGCAGAAG-3', Ji-gtll reverse, and cDNA from
mammary gland tissue.
Transformation, blue/white screening, bacterial culture and plasmidpurification was done in the same way as with the pGEM-7Z vector.
Fluorescent sequencing was carried out using an ALF automated device
(Amersham Pharmacia) with standard operating procedures. Sequencing
samples were prepared, using the Cy5-dATP labelled, vector specificprimers:
23 Materials and Methods
Cy5-SP6: 5'-TACTCAAGCTATGCATCCAACGCG-3', and
Cy5-T7: 5'-ACTCACTATAGGGCGAATTGGGCC-3',
and the Thermo Sequenase cycle sequencing kit RPN 2438 (Amersham
Pharmacia) according to the manufacturer's instructions. The following 25
cycles were applied: 95 °C, 30 sec, 50 °C, 30 sec, 72 °C, 50 sec. Where
sequencing results differed, a third PCR product was sequenced.Overlapping sequences were detected using the FASTA module of the
gcg/egcg programme package (Genetics Computer Group, Madison, WI
53711 USA). Consecutive sequences were joined and vector specificsequences removed. In this way, complete cDNA sequences were obtained.
3.3 Computational Sequence Analysis
Alignments of DNA and protein sequences and DNA similarity searches
were performed using the gcg/egcg programme package (Genetics
Computer Group).
Genomic DNA was screened for interspersed elements using RepeatMasker(Smit, 1996).
Probability calculations for intron-exon junctions were made by a combined
linear discriminant recognition function, using information about
significant triplet frequencies in various functional parts of splicing site
regions, and preferences of octanucleotides in protein coding and intron
regions (Solovyev et al. 1994).
Protein sequence similarity searches against the Swissprot database (SwissInstitute of Bioinformatics, Geneva, Switzerland) were made using a Smith
& Waterman algorithm with default values (Barton, 1997).
Secondary structure predictions were made using nearest neighbouranalysis with local alignments (Salamov & Solovyev, 1997).
Potential for O-glycosylation was analysed, using the NetOGlyc 2.0.
Prediction Server trained on mucin type O-glycosylation sites in
mammalian proteins, which are glycosylated by the UDP-GalNAc-
polypeptide N-acetylgalactosaminyltransferase family (Hansen et al. 1995).
24
Low resolution models of the tertiary structures of camel milk proteins were
obtained by comparative modelling (Guex & Peitsch 1997). The primary
structures, which were revealed by amino acid and cDNA sequencing, were
threaded over tertiary structures of proteins with high similarity in primary
structure. Multiple sequence alignments were made for improvement of
modelling reliability. Energy minimisation of the model was done with force
field computation by GROMOS96.
25 Results and Discussion
4 RESULTS AND DISCUSSION
4.1 Caseins
Literature
The protein fraction of cow milk consists to about 80% of caseins. Four
different gene products are designated as asr, Os2-, P-, and K-caseins, which
together form micellar structures of 20 nm to 500 nm by non-covalent
aggregation. asi-CN, Os2-CN, and P-CN are structurally related and
contribute to 38%, 10% and 36% of total casein. y-CN, a term used for
breakdown products of P-CN, contributes to about 3% of the casein fraction,
and k-CN, a protein, which is structurally not related to the other caseins,
contributes to about 13% of total casein. All caseins share a distinct
amphiphilic nature. The N-terminal region of k-CN, and the C-terminal
regions of ctsi-, aS2-, and p-CN are pronounced hydrophobic. The N-terminal
regions of ccsi-, ccS2-, and p-CN are hydrophilic and contain clustered
phosphoserines, which bind inorganic calcium phosphate with extremelylow dissociation rates. The C-terminal region of k-CN is hydrophilic and
poly-O-glycosylated. All caseins have a high proline content, which prevents
formation of secondary structures, mainly of a-helices, in the intact protein.
Cysteine was not found in asr, aS2-, and p-CN of any species analysed. The
two cysteines found in bovine k-CN were shown to form intermolecular
crosslinks in micelles, which may support the rigidity of the structure and
help in growth termination of micelles (Swaisgood, 1992). In camel milk,
large micelles, which usually contain low amounts of k-CN, were found in
higher amounts than in cow milk (Farah & Riiegg, 1989). Due to the abilityto bind inorganic calcium phosphate, casein is a rich source of this mineral,
which is a prerequisite in bone formation of the suckling.
The colloidal-dispersed structure of caseins contributes to the low viscosityof the milk. Casein micelles are held together mainly by hydrophobic forces
between the hydrophobic parts of the proteins, which are found in the core
of the micelles, and by phosphoserine clusters, which bind calcium
phosphate crystals with high affinity. Milk casein micelles are protected
against hydrophobic forces, which promote aggregation and coagulum
formation, by a hydrophilic, negatively charged layer of oligosaccharides,which cover the entire surface, and which are attached to C-terminal
threonines of k-CN. Proteolytic cleavage of the glycomacropeptide, which is
the C-terminal part of k-CN, by the renneting enzymes chymosin and
26
pepsin, leads to aggregation of casein micelles, which subsequently form a
micellar network, observed as a firm coagulum. The coagulation process is
promoted by acidification of the milk to pH 4.7, which leads to chargeneutralisation, and by addition of calcium salts. Camel milk shows little
tendency to coagulate upon rennet treatment and acidification, only a weak
curd is obtained (Farah, 1996). The milk tends to flocculate, which is of
disadvantage for manufacturing of cheese and fermented milk products.Addition of up to 2% CaCl2 increases the strength of the coagulum slightly(Bayoumi, 1990).
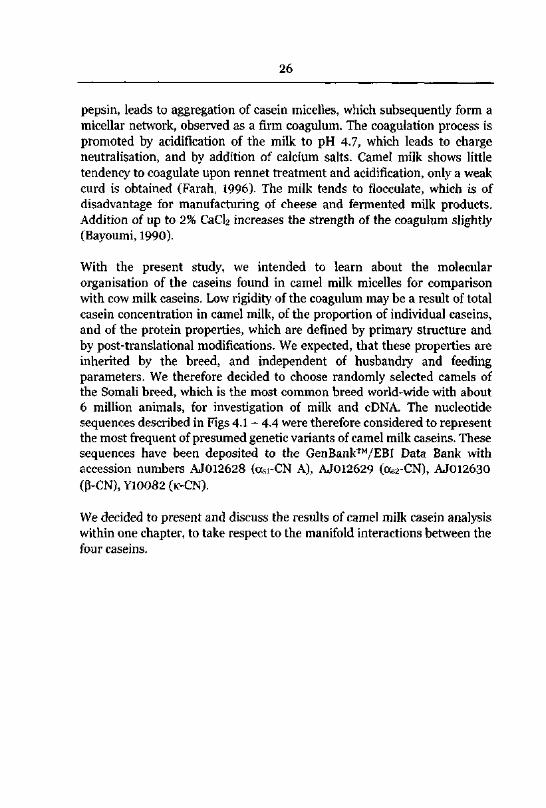
With the present study, we intended to learn about the molecular
organisation of the caseins found in camel milk micelles for comparisonwith cow milk caseins. Low rigidity of the coagulum may be a result of total
casein concentration in camel milk, of the proportion of individual caseins,and of the protein properties, which are defined by primary structure and
by post-translational modifications. We expected, that these properties are
inherited by the breed, and independent of husbandry and feedingparameters. We therefore decided to choose randomly selected camels of
the Somali breed, which is the most common breed world-wide with about
6 million animals, for investigation of milk and cDNA. The nucleotide
sequences described in Figs 4.1 - 4.4 were therefore considered to representthe most frequent of presumed genetic variants of camel milk caseins. These
sequences have been deposited to the GenBank/EBI Data Bank with
accession numbers AJ012628 (oci-CN A), AJ012629 (as2-CN), AJ012630
(P-CN), Y10082 (k-CN).
We decided to present and discuss the results of camel milk casein analysiswithin one chapter, to take respect to the manifold interactions between the
four caseins.
3oN3
49.
Fig.
in
aligned
as
resi
dues
,identical
and
Similar
c
USA).
WI53711
Madison,
Group,
Computer
(Genetics
programme
gcg
the
with
Calculated
b(1
984)
.al.
et
Eige
lafter
caseins
cow
on
Data
a
acid.
(sialic)
JV-acetylneuraminic
NANA,
Thr-NANA
12
13%
Ser-P,
13.97
5.97
Thr-NANA
10
73.8%
3.5%
Ser-
P,1
4.11
8.27
39%
Ser-P
54.49
5.01
80.4%
65%
Ser-P
34.76
5.17
10%
Ser-P
11
4.78
8.68
73.0%
9-5%
Ser-P
94.58
5.81
38%
Ser-P
84.26
4.76
60.3%
22%
Ser-P
64.41
4.78
22.987
22.294-
24.900
21.993
24.668
24.755
18.974
18.254
23.583
24.651
24.348
21.266
22.975
24.275
169
k-CNA
162
K-CN
209
P-CNA2
217
P-CN
207
ccs2-CNA
178
ots2-CN
199
ocsi-CNB
Cow
Camel
Cow
Camel
Cow
Camel
Cow
207
oisi-CNA
Camel
modifications
sequence
prot
einsc
with
sequence
acid
bovine
casein
residues
acid
Amino
Amino
ponding
total
in
acid
amino
of
corres-
to
amount
modifications
Similari
tyRelative
Charged
metry
spectro¬
Mass
sequence
acid
Amino
on
based
poin
t6Isoelectric
on
based
[kDa]
mass
Molecular
residues
acid
Amino
Casein
Spec
ies
caseins3
milk
cow
to
compared
caseins
milk
camel
of
characteristics
Physicochemical
4.1-
Table
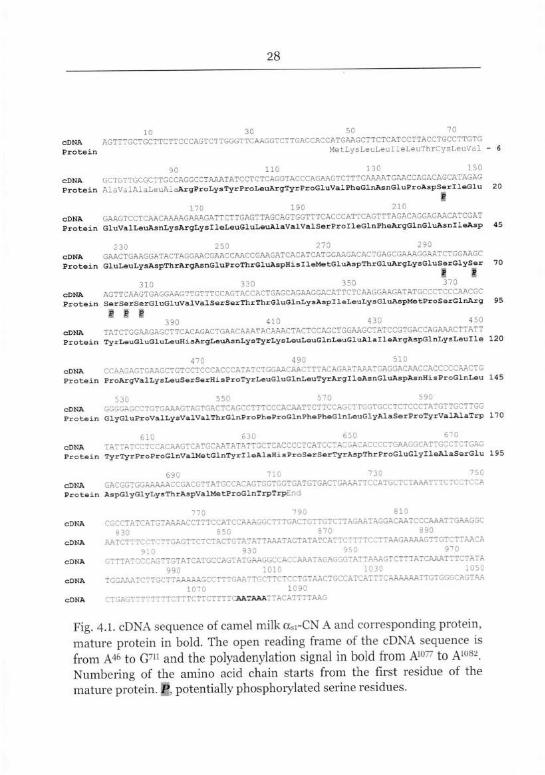
28
10 30 50 70
cDNA AGTTGCTGCTTCTTCCCAGTCTTGGGTTCAAGGTCTTGACCACCATGAAGCTTCTCATCCTTACCTGCCTTGTG
Protein MetLysLeuLeuIleLeuThrCysLeuVal - 6
90 110 130 150
cDNA GCTGTTGCGCTTGCCAGGCCTAAATATCCTCTCAGGTACCCAGAAGTCTTTCAAAATGAACCAGACAGCATAGAG
Protein AlaValAlaLeuAlaArgProLysTyrProLeuArgTyrProGluValPheGlnAsnGluProAspSerlleGlu 20
1
170 190 210
cDNA GAAGTrCTCAACAAAAGAAAGATTCTTGAGTTACCAGTGGTTTCACCCATTCAGTTTAGACAGGAGAACATCGATProtein GluValLeuAsnLysArgLysIleLeuGluLeuAlaValValSerProIleGlnPheArgGlnGluAsnlleAsp 45
230 250 270 290
cDNA GAACTGAAGGATACTAGGAACGAACCAArCGAACATCACATCATGGAAGACACTGAGCGAAAGGAATCTGGAAGC
Protein GluLeuLysAspThrArgAsnGluProThrGluAspHisIleMetGluAspThrGluArgLysGluSerGlySer 70
B
i I
-1C " 370
cDNA AGTTCAAGTGAGGAAGTTGTTTCCAGTACCACTGAGCAGAAGGACATTCTCAAGGAACATATGCCCTCCCAACGC
Protein SerSerSerGluGluValValSerSerThrThrGluGlnLysAspIleLeuLysGluAspMetProSerGlnArg 95
I390 410 430 450
cDNA TATC-TGGAAGAGCTTCACAGACTGAACAAATACAAACTACTCCAGCTGGAACCTATCCGTGACCAGAAACTTATT
Protein TyrLeuGluGluLeuHisArgLeuAsnLysTyrLysLeuLeuGlnLeuGluAlalleArgAspGlnLysLeuIle 120
4"0 -liSo DlO
cDNA CCAAGAGTGAAGCTGTCCTCCCACCCATATCTGGAACAACTTTACAGAATAAATGAGGACAACCACCCCCAACTG
Protein ProArgValLysLeuSerSerHisProTyrLauGluGlnLeuTyrArglleAsnGluAspAsnHisProGlnLeu 145
530 550 570 590
CDNA 3GGGAGCCTGTGAAAGTAGTGACTCAGCCTTTCCCACAATTCTTCCAGCTTGGTGCCTCTCCCTATGTTGCTTGG
Protein GlyGluProValLysValValThrGlnProPheProGlnPhePheGlnLeuGlyAlaSerProTyrValAlaTrp 170
610 630 650 670
cDNA TATTATCCTCCACAAGTCATGCAATATATTGCTCACCCCTCATCCTACGACACCCCTGAAGGCATTGCCTCTGAG
Protein TyrTyrProProGlnValMetGlnTyrlleAlaHisProSerSerTyrAspThrProGluGlylleAlaSerGlu 195
cDNA ^ACGGTGGAAAAACCGACCTTATGCCAGAGTGGTGGTGATGTGACTGAAATTCCATGCTCTAAATTTCTCCTCCA
Protein AspGlyGlyLysThrAspValMetProGlnTrpTrpEnd
770 790 810
cDNA CGCCTATCATGTAAAACCTTTCCATCCAAAGGCTTTGACTGTTGTCTTAGAATAGGACAATCCCAAATTGAAGGC830 850 870 890
cDNA AATCTTTCCTCTTGAGTTCTCTACTGTATATTAAATAGTATATCATTCTTTTCCTTAAGAAAAGTTGTCTTAACA
910 930 950 970
cDNA GTTTATCCCAGTTGTATCATGCCAGTATGAAGGCCACCAAATAGAGGGTATTAAAGTCTTTATCAAATTTCTATA990 1010 1030 1050
cDNA TGGAAATCTTGCTTAAAAAGCCTTTGAATTGCTTCTCCTGTAACTGCCATCATTTCAAAAAATTGTGGGCAGTAA1070 1090
oDNA CTGAGTTTTTTTTCTTTCTTCTTTTCAATAAAT"ACATTTTAAG
Fig. 4.1. cDNA sequence of camel milk oci-CN A and corresponding protein,
mature protein in bold. The open reading frame of the cDNA sequence is
from A46 to G711 and the polyadenylation signal in bold from A10 to A1082.
Numbering of the amino acid chain starts from the first residue of the
mature protein. f§, potentially phosphorylated serine residues.
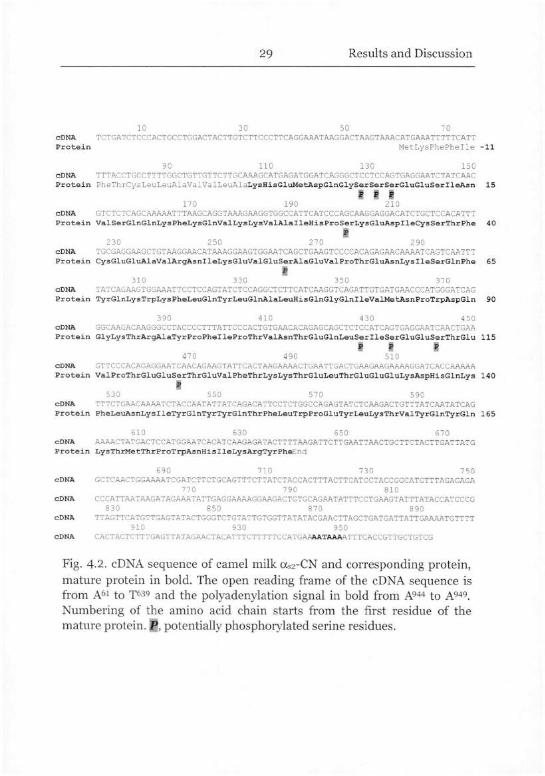
29 Results and Discussion
10 30 50 70
CDNA TCTGATCTCCCACTGCCTGGACTACTTGTCTTCCCTTCAGGAAATAAGGACTAAGTAAACATGAAATTTTTCATT
Protein MetLysPhePhelle -11
90 110 130 150
CDNA TTTACCTGCCTTTTGGCTGTTGTTCTTGCAAAGCATGAGATGGATCAGGGCTCCTCCAGTGAGGAATCTATCAAC
Protein PheThrCysLeuLeuAlaValValLeuAlaLysHisGluMetAspGlnGlySerSerSerGluGluSerlleAsn 15
III170 190 210
CDNA GTCTCTCAGCAAAAATTTAAGCAGGTAAAGAAGGTGGCCATTCATCCCAGCAAGGAGGACATCTGCTCCACATTT
Protein ValSerGlnGlnLysPheLysGlnValLysLysValAlalleHisProSerLysGluAspIleCysSerThrPhe 40
I230 250 270 290
CDNA TGCGAGGAAGCTGTAAGGAACATAAAGGAAGTGGAATCAGCTGAAGTCCCCACAGAGAACAAAATCAGTCAATTT
Protein CysGluGluAlaValArgAsnlleLysGluValGluSerAlaGluValProThrGluAsnLysIleSerGlnPhe 65
#
CDNA TATCACAAGTGGAAATTCCTCCAGTATCTCCAGGCTCTTCATCAAGGTCAGATTGTGAIGAACCCATGGGATCAG
Protein TyrGlnLysTrpLysPheLeuGlnTyrLeuGlnAlaLeuHisGlnGlyGlnlleValMetAsnProTrpAspGln 90
390 410 430 450
CDNA GGCAAGACAAGGGCCTACCCCTTTATTCCCACTGTGAACACAGAGCAGCTCTCCATCAGTGAGGAATCAACTGAA
Protein GlyLysThrArgAlaTyrProPhelleProThrValAsnThrGluGlnLeuSerlleSerGluGluSerThrGlu 115
fis is
470 h92 510
CDNA GTTCCCACAGAGGAATCAACAGAAGTATTCACTAAGAAAACTGAATTGACTGAAGAAGAAAAGGATCACCAAAAA
Protein ValProThrGluGluSerThrGluValPheThrLysLysThrGluLeuThrGluGluGluLysAspHisGlnLys 140
530 550 570 590
CDNA TTTCTGAACAAAATCTACGAATATTATCAGArATTCCTCTGGCCAGAGTATCTCAAGACTGTTTATCAATATCAG
Protein PheLeuAsnLysIleTyrGlnTyrTyrGlnThrPheLeuTrpProGluTyrLeuLysThrValTyrGlnTyrGln 165
610 630 650 670
CDNA AAAACTATGACTCCATGGAATCACATCAAGAGATACTTTTAAGATTCTTGAATTAACTGCTTCTACTTGATTATG
Protein LysThrMetThrProTrpAsnHisIleLysArgTyrPheEnd
690 710 730 750
CDNA GCTCAACTGGAAAATCGATCTTCTGCAGTTTCTTATCTACCACTTTACTTCATCCTACCGGCATGTTTAGAGAGA
770 790 810
CDNA CCCATTAATAAGATAGAAATATTGAGGAAAAGGAAGACTGTGCAGAATATTTCCTGAAGTATTTATACCATCCCG
830 850 870 890
CDNA TTAGTTCATGTTGAGTATACTGGGTCTGTATTGTGGTTATATACGAACTTAGCTGATGATTATTGAAAATGTTTT
910 930 950
CDNA CACTACTCTTTGAGTTATAGAACTACATTTCTTTTTCCATGAAAATAAAATTTCACCGTTGCTGTCG
Fig. 4.2. cDNA sequence of camel milk aS2-CN and corresponding protein,mature protein in bold. The open reading frame of the cDNA sequence is
from A61 to T639 and the polyadenylation signal in bold from A944 to A949.
Numbering of the amino acid chain starts from the first residue of the
mature protein. H, potentially phosphorylated serine residues.
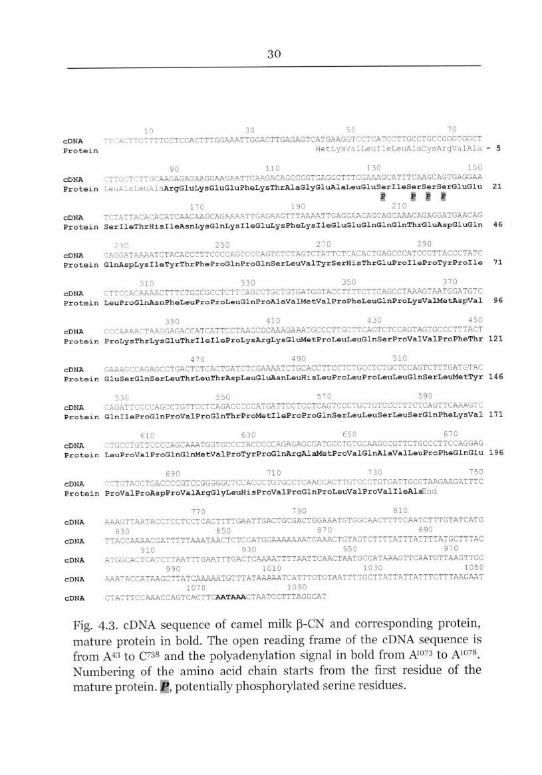
30
10 30 50 70
cDNA TTrACTTCTTTTCCTCCACTTTGGAAATTGGACTTGAGAGTCATGAAGGTCCTCATCCTTGCCTGCCGGGTGGCT
Protein MetLysValLeuIleLeuAlaCysArgV^lAla - 5
90 110 130 150
CDNA TTGf TGTTGCAAGAGAGAAGGAAGAATTCAAGACAGCCGGTGAGGCTTTGGAAAGCATTTCAAGCAGTGAGGAA
Protein [euAlaLeuAlaArgGluLysGluGluPheLysThrAlaGlyGluAlaLeuGluSerlleSerSerSerGluGlu 21
m m m
170 190 210
CDNA TGTATTACACACATCAACAAGCAGAAAATTGAGAAGTTTAAAATTGAGGAACAGCAGCAAACAGAGGATGAACAG
Protein SerlleThrHisIleAsnLysGlnLysIleGluLysPheLysIleGluGluGlnGlnGlnThrGluAspGluGln 46
230 250 270 290
CDNA AGGATAAAATCTACACCTTTCCCCAGCCCCAGTCTCTAGTCTATTCTCACACTGAGCCCATCCCTTACCCTATC
Protein GlnAspLysIleTyrThrPheProGlnProGlnSerLeuValTyrSerHisThrGluProIleProTyrProIle 71
1 1 J 5
CDNA TTCCACAAAACTT~CTGCCGCCTCTTCAGLCTGCTGTGAIGCTACCTTTTCTTCA^CCTAAAGTAA^GGATGTC
Protein LeuProGlnAsnPheLeuProProLeuGlnProAlaValMetValProPheLeuGlnProLysValMetAspVal 96
390 410 430 450
CDNA "AAAACTAAGGAGACCATCATTCCTAACCGCAAAGAAATGCCCTTGCTTCAGTCTCCAGTAGTGCCCTTTACT
Protein ProLysThrLysGluThrllelleProLysArgLysGluMetProLeuLeuGlnSerProValValProPheThr 121
4 0 49o 510
oDNA GAAAGCCAGAGCCTGACTCTCACTGATCTCGAAAATCTGCACCTTCCTCTGCCTCTGCTCCAGTCTTTGATGTAC
Protein GluSerGlnSerLeuThrLeuThrAspLeuGluAsnLeuHisLeuProLeuProLeuLeuGlnSerLeuMetTyr 146
530 550 570 590
CDNA BrATTGrcfAGCCTCTTCCTCAGACCrCCATGATTCrTCC^CACTr^r-TccTCTCC^TTCTCAGTTCAAAGTC
Protein GlnlleProGlnProValProGlnThrProMetlleProProGlnSerLeuLeuSerLeuSerGlnPheLysVal 171
610 630 650 670
oDNA TGCGTGTTCCCCAGCAAATGGTGCCCTACCCCCAGAGAGCCATGCCTGTGCAAGCCGTTCTGCCCTTCCAGGAG
Protein LeuProValProGlnGlnMetValProTyrProGlnArgAlaMetProValGlnAlaValLeuProPheGlnGlu 196
D^ 1 J u
ODNA gt&tagctga;cccgtccgggggctccaccctgtgcctcaaccacttgtccctgtga^tgcctaagaagatttc
Protein ProValProAspProValArgGlyLeuHisProValProGlnProLeuValProVallleAlaEnd
770 790 810
ODNA aaagttaatacctcctcctcacttttgaattgactgcgactggaaatgtggcaacttttcaatctttgtatcatg
830 850 870 890
oDNA ^TACCAAAACGATTTTTAAATAACTCTCCATGGAAAAAAATGAAACTGTAGTCTTTTATTTA"TTTATGCTTTAC
910 930 950 970
CDNA ATGGCACTCATCTTAATTTGAATTTGACTCAAAATTTTAATTCAACTAATGCCATAAAGTTCAATGTTAAGTTGG
990 1010 1030 1050
CDNA AAA"ACCATAAGCTTATCAAAAATGTTTATAAAAATCATTTGTGTAATTTTGCTTATTATTATTTCTTTAAGAAT
1070 1090
CDNA "TA"TTCCAAACCAGTCACTTCAATAAACTAArTCCTTTAGGCAT
Fig. 4-3. cDNA sequence of camel milk (3-CN and corresponding protein,
mature protein in bold. The open reading frame of the cDNA sequence is
from A4! to C738 and the polyadenylation signal in bold from A1073 to A1078.
Numbering of the amino acid chain starts from the first residue of the
mature protein. j§, potentially phosphorylated serine residues.
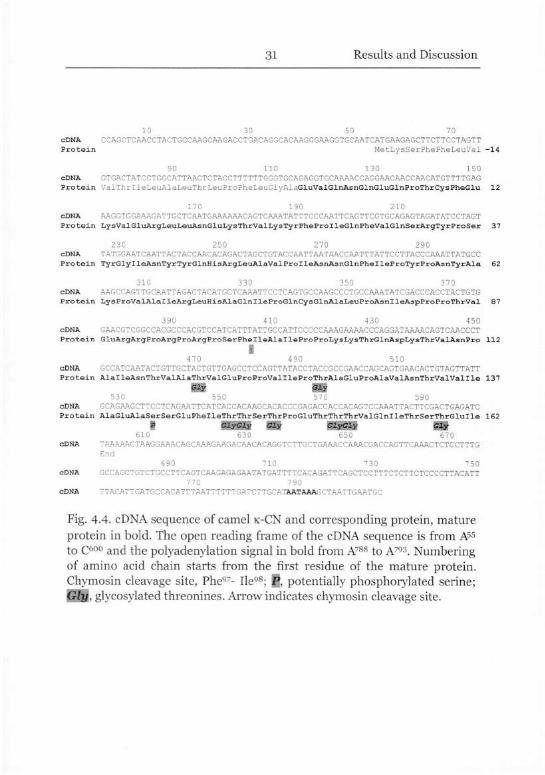
31 Results and Discussion
10 30 50 70
CDNA CCAGCTCAACCTACTGCCAAGCAAGACCTGACAGGCACAAGGGAAGGTGCAATCATGAAGAGCTTCTTCCTAGTT
Protein MetLysSerPhePheLeuVal -14
90 110 130 150
cDNA CTGACTATCCTGGCATTAACTCTACCTTTTTTGGGTGCAGAGGTGCAAAACCAGGAACAACCAACATGTTTTGAG
Protein ValTbrlleLeuAlaLeuThrLeuProPheLeuGlyAlaGluValGlnAsnGlnGluGlnProThrCysPheGlu 12
170 190 210
cDNA AAGGTGGAAAGATTGCTCAATGAAAAAACAGTCAAATATTTCCCAATTCAGTTCGTGCAGAGTAGATATCCTAGT
Protein LysValGluArgLeuLeuAsnGluLysThrValLysTyrPheProIleGlnPheValGlnSerArgTyrProSer 37
23C 250 270 290
CDNA TATGCAATCAATTACTACCAACACAGACTAGCTGTACCAATTAATAACCAATTTATTCCTTACCCAAATTATGCC
Protein TyrGlylleAsnTyrTyrGlnHisArgLeuAlaValProIleAsnAsnGlnPhelleProTyrProAsnTyrAla 62
310 J1 j
cDNA AAGCCAGTTGCAATTAGACTACATGCTCAAAT~CCTCAGTGCCAAGCCCTGCCAAATATCGACCCACCTACTGTG
Protein LysProValAlalleArgLeuHisAlaGlnlleProGlnCysGlnAlaLeuProAsnlleAspProProThrVal 87
390 410 430 450
cDNA GAACGTCGCCCACGCCCACGTCCATCATTTATTGCCATTCCCCCAAAGAAAACCCAGGATAAAACAGTCAACCCT
Protein GluArgArgProArgProArgProSerPhelleAlalleProProLysLysThrGlnAspLysThrValAsnPro 112
I41u 490 d10
cDNA GCCATCAATACTGTTGCTACTGTTGAGCCTCCAGTTATACCTACCGCCGAACCAGCAGTGAACACTGTAGTTATT
Protein AlalleAsnThrValAlaThrValGluProProVallleProThrAlaGluProAlaValAsnThrValVallle 137
530 550 570 590
CDNA GCAGAAGCTTCCTCAGAATT'~ = -n'~"'~'~'>''""^"'"'ACCCGAGACCACCACAGTCCAAATTACTTCGACTGAGATC
Protein AlaGluAlaSerSerGluPhelleThrThrSerThrProGluThrThrThrValGlnlleThrSerThrGluIle 162
| GlyGly Gly mUS®610 630 650 670
cDNA TAAAAACTAAGGAAACAGCAAAGAAGACAACACAGGTCTTGCTGAAACCAAACGACCAGTTCAAACTCTCCTTTG
End
690 710 730 750
CDNA GCCAGCTGTCTGCCTTCAGTCAAGAGAGAATATGATTTTCACAGATTCAGCTCCTTTCTCTTCTCCCCTTACATT
770 790
cDNA "TACATTCATGCCACATTTAATTTTTTGATCTTGCATAATAAAGCTAATTGAATGC
Fig. 4.4. cDNA sequence of camel k-CN and corresponding protein, mature
protein in bold. The open reading frame of the cDNA sequence is from A55
to C600 and the polyadenylation signal in bold from A788 to A793. Numberingof amino acid chain starts from the first residue of the mature protein.Chymosin cleavage site, Phe97- He98; jt, potentially phosphorylated serine;
CHy, glycosylated threonines. Arrow indicates chymosin cleavage site.
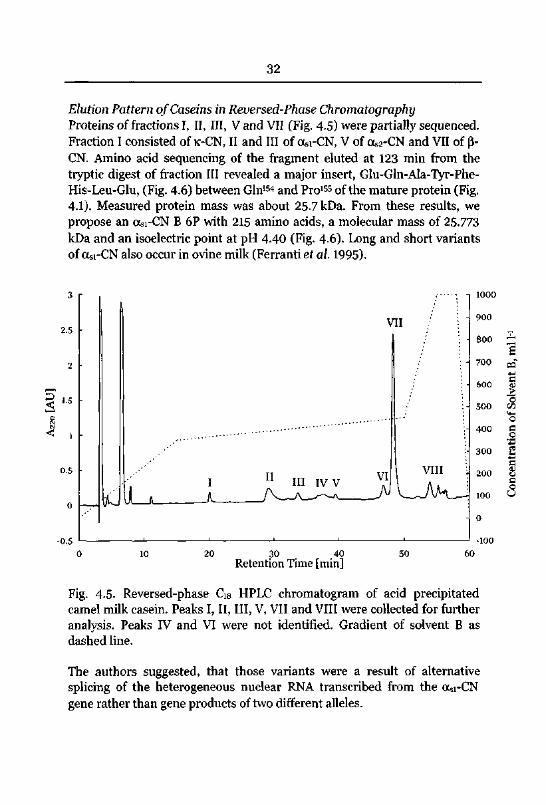
32
Elution Pattern ofCaseins in Reversed-Phase ChromatographyProteins of fractions I, II, III, V and VII (Fig. 4.5) were partially sequenced.Fraction I consisted of k-CN, II and III of ocsi-CN, V of aS2-CN and VII of (J-CN. Amino acid sequencing of the fragment eluted at 123 min from the
tryptic digest of fraction III revealed a major insert, Glu-Gln-Ala-Tyr-Phe-His-Leu-Glu, (Fig. 4.6) between Gin154 and Pro155 of the mature protein (Fig.4.1). Measured protein mass was about 25.7 kDa. From these results, we
propose an Ofei-CN B 6P with 215 amino acids, a molecular mass of 25.773
kDa and an isoelectric point at pH 4.40 (Fig. 4.6). Long and short variants
of oisi-CN also occur in ovine milk (Ferranti et al. 1995).
25
05
-0 5
K-
VII- 900
800 ~
S700 m-
600
- 500
400
300
- 0
10 30 40
Retention Time [min]50 60
c
"3
auo
coo
Fig. 4.5. Reversed-phase Cis HPLC chromatogram of acid precipitatedcamel milk casein. Peaks I, II, III, V, VII and VIII were collected for further
analysis. Peaks IV and VI were not identified. Gradient of solvent B as
dashed line.
The authors suggested, that those variants were a result of alternative
splicing of the heterogeneous nuclear RNA transcribed from the asi-CN
gene rather than gene products of two different alleles.
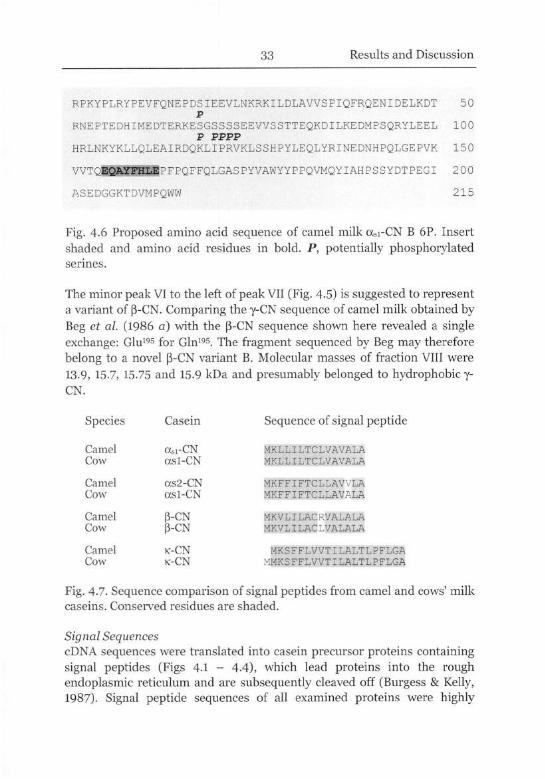
33 Results and Discussion
RPKYPLRYPEVFQNEPDSIEEVLNKRKILDLAVVSPIQFRQENIDELKDT 50
P
RNEPTEDHIMEDTERKESGSSSSEEVVSSTTEQKDILKEDMPSQRYLEEL 100
P PPPP
HRLNKYKLLQLEAIRDQKLIPRVKLSSHPYLEQLYRINEDNHPQLGEPVK 150
VVTQS5SfI«ElPFPQFFQLGASPYVAWYYPPQVMQYIAHPSSYDTPEGI 200
ASEDGbKTDVMPQWW 215
Fig. 4.6 Proposed amino acid sequence of camel milk asi-CN B 6P. Insert
shaded and amino acid residues in bold. P, potentially phosphorylatedserines.
The minor peak VI to the left of peak VII (Fig. 4.5) is suggested to represent
a variant of (3-CN. Comparing the y-CN sequence of camel milk obtained by
Beg et al. (1986 a) with the (3-CN sequence shown here revealed a single
exchange: Glu195 for Gin195. The fragment sequenced by Beg may therefore
belong to a novel (3-CN variant B. Molecular masses of fraction VIII were
13.9, 15.7, 15-75 and 15.9 kDa and presumably belonged to hydrophobic y-
CN.
Species Casein Sequence of signal peptide
Camel
Cow
asi-CNasl-CN
MKLLILTCLVAVALA
MKLLILTCLVAVALA
Camel
Cow
as2-CN
asl-CN
MKFFIFTCLLAVVLA
MKFFIFTCLLAVALA
Camel
Cow(3-CN(3-CN
MKVLILACRVALALA
MKVLILACLVALALA
Camel
Cow
k-CN
k-CN
MKSFFLVVTILALTLPFLGA
MMKSFFLVVTILALTLPFLGA
Fig. 4.7. Sequence comparison of signal peptides from camel and cows' milk
caseins. Conserved residues are shaded.
Signal SequencescDNA sequences were translated into casein precursor proteins containing
signal peptides (Figs 4.1 - 4.4), which lead proteins into the rough
endoplasmic reticulum and are subsequently cleaved off (Burgess & Kelly,
1987). Signal peptide sequences of all examined proteins were highly
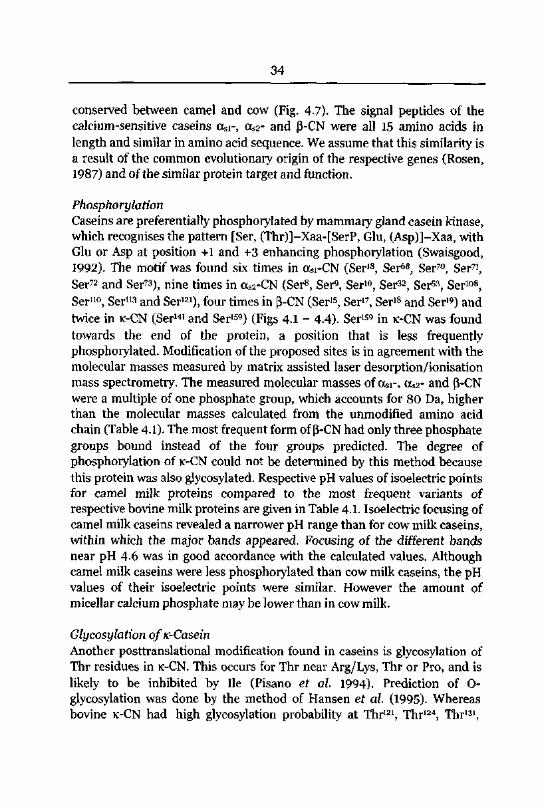
34
conserved between camel and cow (Fig. 4.7). The signal peptides of the
calcium-sensitive caseins otsi-, aS2- and (3-CN were all 15 amino acids in
length and similar in amino acid sequence. We assume that this similarity is
a result of the common evolutionary origin of the respective genes (Rosen,
1987) and of the similar protein target and function.
PhosphorylationCaseins are preferentially phosphorylated by mammary gland casein kinase,which recognises the pattern [Ser, (Thr)]-Xaa-[SerP, Glu, (Asp)]-Xaa, with
Glu or Asp at position +1 and +3 enhancing phosphorylation (Swaisgood,1992). The motif was found six times in otsi-CN (Ser18, Ser68, Ser70, Ser7',
Ser72 and Ser73), nine times in as2-CN (Ser8, Ser^, Ser10, Ser32, Ser^, Ser108,
Ser110, Ser"3 and Ser121), four times in p-CN (Ser^, Ser17, Ser18 and Ser1^ and
twice in k-CN (Ser^1 and Ser159) (Figs 4.1 - 4-4). Ser^ in k-CN was found
towards the end of the protein, a position that is less frequentlyphosphorylated. Modification of the proposed sites is in agreement with the
molecular masses measured by matrix assisted laser desorption/ionisationmass spectrometry. The measured molecular masses of asi-, ocS2- and P-CNwere a multiple of one phosphate group, which accounts for 80 Da, higherthan the molecular masses calculated from the unmodified amino acid
chain (Table 4.1). The most frequent form of p-CN had only three phosphate
groups bound instead of the four groups predicted. The degree of
phosphorylation of k-CN could not be determined by this method because
this protein was also glycosylated. Respective pH values of isoelectric pointsfor camel milk proteins compared to the most frequent variants of
respective bovine milk proteins are given in Table 4.1. Isoelectric focusing of
camel milk caseins revealed a narrower pH range than for cow milk caseins,within which the major bands appeared. Focusing of the different bands
near pH 4-6 was in good accordance with the calculated values. Althoughcamel milk caseins were less phosphorylated than cow milk caseins, the pHvalues of their isoelectric points were similar. However the amount of
micellar calcium phosphate may be lower than in cow milk.
Glycosylation ofic-CaseinAnother posttranslational modification found in caseins is glycosylation of
Thr residues in k-CN. This occurs for Thr near Arg/Lys, Thr or Pro, and is
likely to be inhibited by He (Pisano et al. 1994). Prediction of O-
glycosylation was done by the method of Hansen et al. (1995). Whereas
bovine k-CN had high glycosylation probability at Thr121, Thr124, Thr,
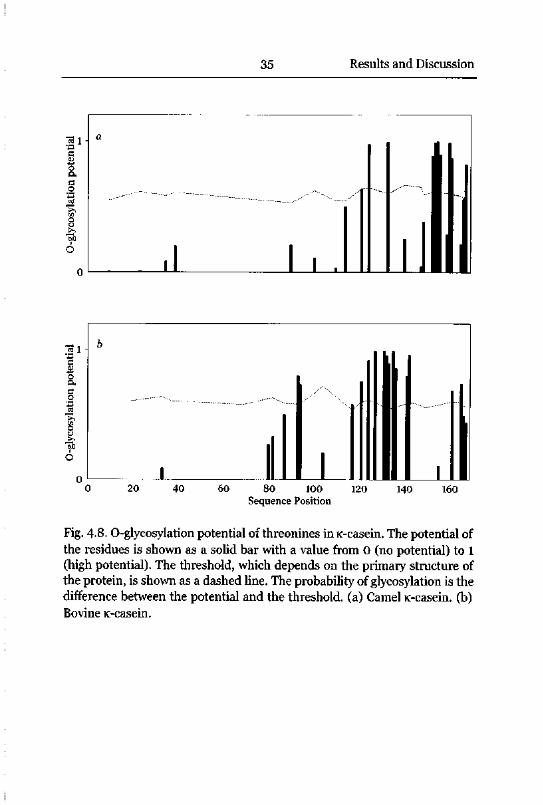
35 Results and Discussion
-gi-
6
1 1 1 1
|20 40 60 80 100 120
Sequence Position
140 160
Fig. 4.8. O-glycosylation potential of threonines in K-casein. The potential of
the residues is shown as a solid bar with a value from 0 (no potential) to 1
(high potential). The threshold, which depends on the primary structure of
the protein, is shown as a dashed line. The probability of glycosylation is the
difference between the potential and the threshold, (a) Camel K-casein. (b)Bovine K-casein.
36
Thr133, Thr135, Thr136, Thr142, and Thr16^ glycosylation potential of camel k-
CN was high at Thr11", Thr12?, Thr1**, Thr1^, Thr^, Thr^3, Thr1**, and Thr160
(Fig. 4.8). Ser"8 in camel k-CN, and Ser12?, Ser132, and Ser1"1 of bovine k-CN
also had a high glycosylation potential and the bovine k-CN serine residues
were reported to be glycosylated sometimes (Swaisgood, 1992). The
positions in camel k-CN were predominantly towards the C-terminal end of
the glycomacropeptide, whereas glycosylation potential of bovine k-CN was
high towards the N-terminal end. This difference is suggested to be a
structural consequence of a deletion, which makes camel k-CN seven amino
acids shorter than the bovine counterpart (Fig. 4.9). It is assumed, that
bovine k-CN and camel k-CN have different affinities towards camel and
bovine chymosin. These differences between camel and bovine k-CN may
also have implications on k-CN tertiary structure, micelle assembly and
structure, hydrophilic shielding of the micelle core by the glycosylated partof k-CN, and charge neutralisation by calcium salts. Total glycosylation
potential was similar in bovine and camel k-CN. Micro-heterogeneity found
in k-CN of other species due to differences in pattern and composition of
carbohydrate moieties is also expected in camel k-CN. The carbohydratesattached in bovine k-CN are trisaccharides of the type NANA-cc(2->3)Gal-
P(1->3)NAGA-P(1), or tetrasaccharides, which have an additional
ce(2—>6)NAGA linked NANA residue. If five of the threonines with
glycosylation potential have two sialic acid residues bound, and one serine
is phosphorylated, the isoelectric point will be lowered to 4.11. SDS-PAGE
and mass spectroscopic studies revealed that most of the k-CN analysed was
of relatively low molecular mass, making the low glycosylated form
predominant and the protein very basic. This finding disagrees with the
high sialic acid content reported by Mehaia (1987). It is assumed, that peaksin the MALDI spectrum with higher molecular masses were not detected,due to peak broadening by k-CN micro-heterogeneity.
Primary Structure
Similarly to bovine caseins, camel 0Csi-CN and (3-CN were devoid of cysteine
residues, and ocS2-CN and k-CN both contained only two cysteines. The
proline content in camel caseins was slightly higher than in bovine caseins,
with 9.2% in asi-CN, 4.5% in as2-CN, 17.1% in (3-CN, and 13.6% in k-CN,
compared to 8.5% in bovine asi-CN B, 4.8% in bovine aS2-CN A, 16.7% in
bovine (3-CN A2, and 11.8% in bovine k-CN A. This higher proline content in
camel caseins may lead to destabilisation of secondary structures in a more
pronounced way than it occurs in bovine caseins.
37 Results and Discussion
The gene structure of asi-, as2-, and 0-CN is characterised by many short
exon sequences, which are usually interrupted by long introns. The mRNA
of bovine ocsi-CN is only 1172 bp long, the related hnRNA comprises 17,508
bp. The inserted sequence Asn14 to Glu20 in both variants of camel otsi-CN
was probably the result of an additionally expressed exon between bovine
exon 3 and exon 4, and the deletion of bovine Glu141 to Glu148 in camel otsr
CN A referred to bovine exon 16. The insert of Gin11? to His128 in camel Osi-
CN A and B was not at an intron/exon junction and therefore likely the
result of an insertion in the camel Osi-CN gene. The intron/exon structure of
the bovine ocS2-CN gene is not yet resolved. The mRNA of bovine (J-CN is
1089 bp long, the heterogeneous nuclear RNA precursor 8498 bp. Camel
and bovine (3-CN had a similar length with few insertions in camel P-CN
(Fig. 4.9). The short insertions were a result of mutations in the camel (3-CN
gene, rather than a consequence of alternative splicing. Camel k-CN was
seven residues shorter than the bovine counterpart. Deletion of Val83 to
Ala90 is suggested to be the result of a mutation in the third exon of the k-
CN gene, which codes for the largest part of the mature protein in both
species. The bovine k-CN mRNA is 850 bp long, the corresponding hnRNA
more than 6,000 bp. In contrast to the other casein genes, the gene does not
consist of short exon sequences, which partially may have evolved by exon
duplication in tandem direction. The deletion of VaP3 to Ala90 is also found
in porcine k-CN, and the cleavage site Phe97-Ile98 also corresponds to the
porcine cleavage site. Nonetheless, porcine k-CN contains an insert in the
glycomacropeptide, which was not found in the camel protein. The
glycosylation potential of porcine k-CN was more evenly distributed alongthe whole glycomacropeptide sequence than in camel and bovine k-CN.
Secondary Structure
Sequence comparison of cow and camel milk caseins are shown in Fig. 4-9.
Few pronounced structural differences were found, when camel and cow
milk caseins were compared. Although asi-CN of camel and cow milk had a
low percentage similarity in primary structure, similarities in the secondarystructure, (a series of a-helical regions followed by a C-terminus with little
defined secondary structure), predominated. In camel milk Osi-CN,
hydrophilicity of the N-terminal end was slightly more pronounced. The
deletions that shortened camel milk ocS2-CN compared with cow milk ots2-
CN A occurred in an a-helical region between bovine Glu49 and Asn83 (Fig.4.9). They went along with the loss of the phosphorylated serine cluster
Ser56, Ser57 and Ser58). This loss may have implications in micelle
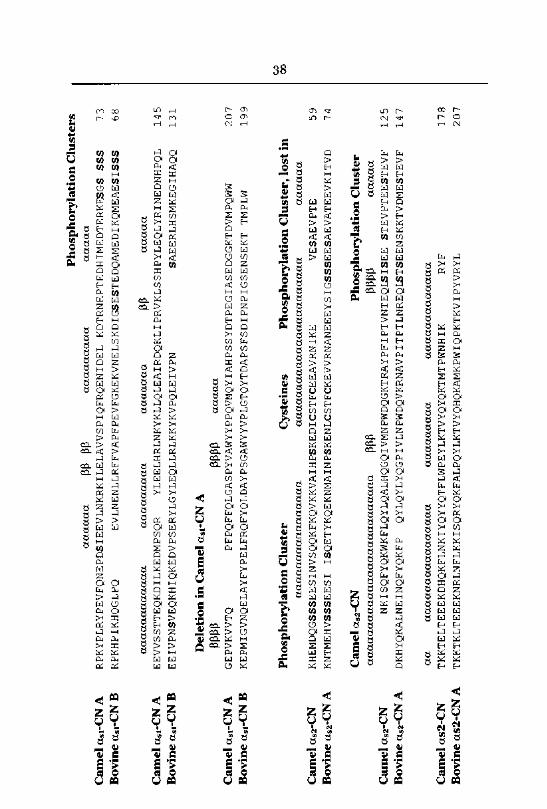
207
178
tkktklteeeknrlnflkkisqryqkfalpqylktvyqhqkamkpwiqpktkvipyvryl
Aas2-CN
Bovine
ryf
tkktelteeekdhqkflnkiyqyyqtflwpeylktvyqyqktmtpwnhik
Camelas2-CN
aaaaaaaaaaaaa
aaaaaaaaa
aaaaaaaaaaaaaaaa
aa
714
QYLQYLYQGPIVLNPWDQVKRNAVPITPTLNREQLSTSEENSKKTVDMESTEVF
DKHYQKALNEINQFYQKFP
512
STEVPTEESTEVF
NKISQFYQKWKFLQYLQALHQGQIVMNPWDQGKTRAYPFIPTVNTEQLSISEE
aaaaa
PPPP
ppp
aaaaaaaaaaaaaaaaaaaaaaaaaa
Cluster
Phosphorylation
aS2-CN
Camel
AaS2-CN
Bovine
aS2-CN
Camel
00W
47
ISQETYKQEKNMAINPSKENLCSTFCKEVVRNANEEEYSIGSSSEESAEVATEEVKITVD
KNTMEHVSSSEESI
59
VESAEVPTE
KHEMDQGSSSEESINVSQQKFKQVKKVAIHPSKEDICSTFCEEAVRNIKE
aaaaaa
aaaaaaaaaaaaaaaaaaaaaaa
aaaaaaaaaaaaaaaa
in
lost
Cluster,
Phosphorylation
Cysteines
Cluster
Phosphorylation
AaS2-CN
Bovine
aS2-CN
Camel
199
207
TMPLW
KEPMIGVNQELAYFYPELFRQFYQLDAYPSGAWYYVPLGTQYTDAPSFSDIPNPIGSENSEKT
PFPQFFQLGASPYVAWYYPPQVMQYIAHPSSYDTPEGIASEDGGKTDVMPQWW
GEPVKVVTQ
aaaaa
pppp
PPPP
Aasi-CN
Camel
in
Deletion
Basi-CN
Bovine
Aasi-CN
Camel
131
SAEERLHSMKEGIHAQQ
EEIVPNSVEQKHIQKEDVPSERYLGYLEQLLRLKKYKVPQLEIVPN
514
YLEELHRLNKYKLLQLEAIRDQKLIPRVKLSSHPYLEQLYRINEDNHPQL
EEVVSSTTEQKDILKEDMPSQR
aaaaa
PP
aaaaaaa
aaaaaaaaa
aaaaaaaaaaaa
Basi-CN
Bovine
Aasi-CN
Camel
68
EVLNENLLRFFVAPFPEVFGKEKVNELSKDIGSESTEDQAMEDIKQMEAESISSS
RPKHPIKHQGLPQ
73
SSS
KDTRNEPTEDHIMEDTERKESGS
RPKYPLRYPEVFQNEPDSIEEVLNKRKILELAVVSPIQFRQENIDEL
aaaaa
aaaaaaaaa
pip
(5(5
aaaaaa
Clusters
Phosphorylation
Basi-CN
Bovine
Aasi-CN
Camel
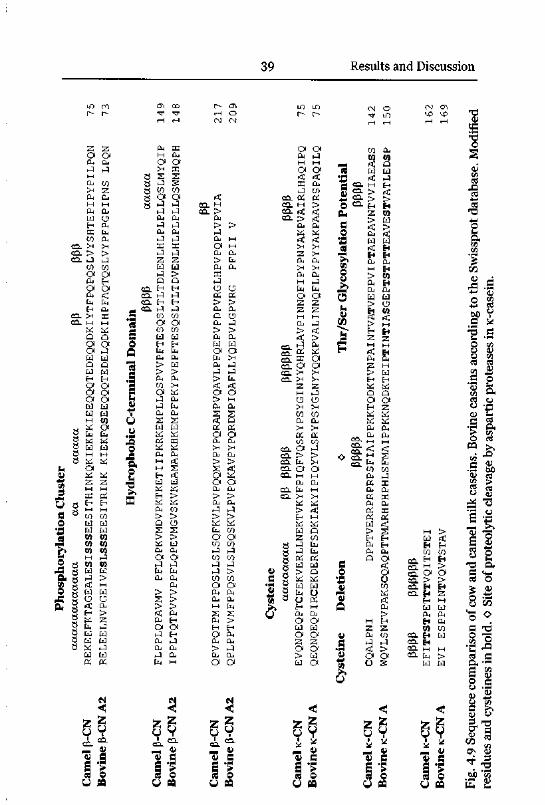
3oGoGCO
K-casein.
in
proteases
aspa
rtic
by
clea
vage
prot
eoly
tic
of
Site
Obold.
in
cyst
eine
sand
residues
Modified
database.
Swissprot
the
to
acco
rdin
gcaseins
Bovine
caseins.
milk
camel
and
cow
of
comparison
Sequence
4.9
Fig.
169
162
ESPPEINTVQVTSTAV
EVI
EFITTSTPETTTVQITSTEI
PPPPPP
PPPP
150
wqvlsntvpakscqaqpttmarhphphlsfmaippkknqdkteiptintiasgeptstptteavestvatledsp
142
dpptverrprprpsfiaippkktqdktvnpaintvatveppviptaepavntvviaeass
cqalpni
PPPP
PPPPP
Potential
Glycosylation
Thr/Ser
<0Deletion
Cysteine
Ak-CN
Bovine
k-CN
Camel
Ak-CN
Bovine
k-CN
Camel
75
75
qeqnqeqpircekderffsdkiakyipiqyvlsrypsyglnyyqqkpvalinnqflpypyyakpaavrspaqilq
Ak-CN
Bovine
evqnqeqptcfekverllnektvkyfpiqfvqsrypsyginyyqhrlavpinnqfipypnyakpvairlhaqipq
Camelk-CN
PPPP
PPPPPP
PPPPP
PP
aooaoaao
Cysteine
209
217
Vpfpii
qplpptvmfppqsvlslsqskvlpvpqkavpypqrdmpiqafllyqepvlgpvrg
qpvpqtpmippqsllslsqfkvlpvpqqmvpypqrampvqavlpfqepvpdpvrglhpvpqplvpvia
pp
A2
p-CN
Bovine
p-CN
Camel
14E
14?
ippltqtpvvvppflqpevmgvskvkeamapkhkempfpkypvepftesqsltltdvenlhlplpllqswmhqph
pflqpkvmdvpktketiipkrkempllqspvvpftesqsltltdlenlhlplpllqslmyqip
flpplqpavmv
aaaaa
PPPP
Domain
C-terminal
Hydrophobic
A2
p-CN
Bovine
p-CN
Camel
73
75
lpqn
kiekfqseeqqqtedelqdkihpfaqtqslvypfpgpipns
releelnvpgeiveslssseesitrink
rekeefktagealesissseesithinkqkiekfkieeqqqtedeqqdkiytfpqpqslvyshtepipypilpqn
ppp
pp
aaaaa
aa
aaaaaaaaaaaa
Cluster
Phosphorylation
P-CNA2
Bovine
p-CN
Camel
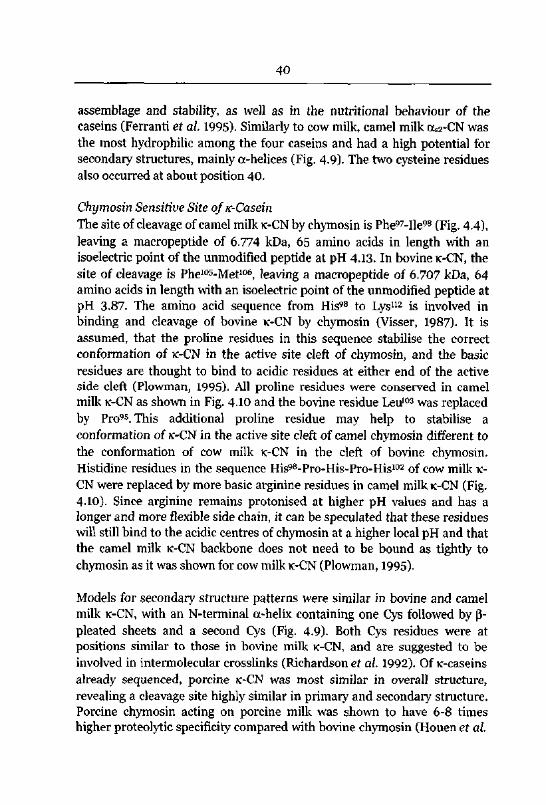
40
assemblage and stability, as well as in the nutritional behaviour of the
caseins (Ferranti et al. 1995). Similarly to cow milk, camel milk ocS2-CN was
the most hydrophilic among the four caseins and had a high potential for
secondary structures, mainly cc-helices (Fig. 4.9). The two cysteine residues
also occurred at about position 40.
Chymosin Sensitive Site ofic-CaseinThe site of cleavage of camel milk k-CN by chymosin is Phe97-Ile98 (Fig. 4.4),
leaving a macropeptide of 6.774 kDa, 65 amino acids in length with an
isoelectric point of the unmodified peptide at pH 4.13. In bovine k-CN, the
site of cleavage is Phe105-Met106, leaving a macropeptide of 6.707 kDa, 64
amino acids in length with an isoelectric point of the unmodified peptide at
pH 3-87. The amino acid sequence from His98 to Lys112 is involved in
binding and cleavage of bovine k-CN by chymosin (Visser, 1987). It is
assumed, that the proline residues in this sequence stabilise the correct
conformation of k-CN in the active site cleft of chymosin, and the basic
residues are thought to bind to acidic residues at either end of the active
side cleft (Plowman, 1995). All proline residues were conserved in camel
milk k-CN as shown in Fig. 4.10 and the bovine residue Leu103 was replaced
by Pro95. This additional proline residue may help to stabilise a
conformation of k-CN in the active site cleft of camel chymosin different to
the conformation of cow milk k-CN in the cleft of bovine chymosin.Histidine residues in the sequence His98-Pro-His-Pro-His102 of cow milk k-
CN were replaced by more basic arginine residues in camel milk k-CN (Fig.4.10). Since arginine remains protonised at higher pH values and has a
longer and more flexible side chain, it can be speculated that these residues
will still bind to the acidic centres of chymosin at a higher local pH and that
the camel milk k-CN backbone does not need to be bound as tightly to
chymosin as it was shown for cow milk k-CN (Plowman, 1995).
Models for secondary structure patterns were similar in bovine and camel
milk k-CN, with an N-terminal a-helix containing one Cys followed by (3-
pleated sheets and a second Cys (Fig. 4.9)- Both Cys residues were at
positions similar to those in bovine milk k-CN, and are suggested to be
involved in intermolecular crosslinks (Richardson et al. 1992). Of K-caseins
already sequenced, porcine k-CN was most similar in overall structure,
revealing a cleavage site highly similar in primary and secondary structure.
Porcine chymosin acting on porcine milk was shown to have 6-8 times
higher proteolytic specificity compared with bovine chymosin (Houen et al.
41 Results and Discussion
1996). A similar ability to cleave camel milk k-CN with very high specificityis assumed rennet coagulation of camel milk with camel chymosin.
Camel:
Arg90-||io-Arg-Pro-Arg-Pro-Ser-Pbe-Ile-Ala-Ile-Fro-Pro-Lys-I.YS1<M
Cow:
His98-j^-His-^(-His-Leu-Ser::SS-Met-All"^ie-Pro-Pro-Lys-LYsm
Fig. 4.10. Sequence comparison of the chymosin-sensitive region of k-CN
from camel and cow milk. Conserved residues are shaded.
Rennet CoagulationThe quantitative distribution of individual caseins in total casein, as
calculated from Fig. 4.5, were asi-CN 22%, a,2-CN 9.5%, P-CN 65%, k-CN
3.5%. k-CN was considered to have a terminating function in micelle growth
(Home et al. 1989), as well as a stabilizing effect on the micelle by its net
charge and by steric hindrance of aggregation by its hydrophilic C-terminal
end (Holt et al. 1996). The glycosylated forms may have a stronger impacton both these functions than the non-glycosylated form, which seemed to be
predominant in camel milk, owing to steric repulsion of charged sialic acid
groups and to increased hydrophilicity. After cleavage of the macropeptide,hydrophobic forces and electrostatic interactions of bivalent cations with
negatively charged groups promote coagulation and stabilise the curd
(Dalgleish, 1983, Mora-Gutierrez et al. 1993). Since (3-CN predominated in
the camel milk studied and phosphorylation of o^i- and aS2-CN was lower
than in cow milk, we assume that hydrophobicity is the driving force in
coagulation of camel milk. It has been shown that camel milk casein is less
stable at elevated temperature than cow milk (Farah & Atkins, 1992). This
may be an effect of the high (3-CN content. On the other hand, in milks with
amounts of k-CN higher than in cow milk, e.g. in buffalo milk with 130-200
g K-CN/kg total casein (El-Din & Aoki, 1993), curd firmness was found to be
higher than in cow milk (Bayoumi, 1990). Moreover, milks of transgenicmice producing bovine k-CN were shown to have a linear correlation
between the amount of k-CN and curd firmness (Gutierrez-Adan et al.
1996), and an inverse correlation with micelle size. The mean diameter of
camel milk casein micelles is larger than that of casein micelles in bovine
42
milk (Buchheim et al. 1989). Milk of animals traditionally used for
processing to cheese has higher amounts of k-CN and lower amounts of (3-CN than camel milk. It may be assumed that lack of selective breeding of
camels for milk with favourable cheese-making properties is responsible for
the high |3-CN and the low k-CN content.
Considerationsfor Camel Milk Processing
Technological difficulties in processing camel milk are probably due to
different proportions of the individual caseins compared with cow milk,rather than to structural variations within the proteins. It has been shown
that a high degree of P-CN and a low degree of k-CN adversely affects some
of the processing characteristics of casein micelles (Schmidt & Koops, 1977),such as stability towards ethanol, homogenisation and heat treatment. It
must be assumed that the differences in protein composition between the
ruminant milks and camel milk will have a major impact on technological
properties, and that a lower ratio of JJ-CN to k-CN would be favourable for
curd coagulation and heat sterilisation.
4.2 Renneting enzymes
Literature
Chymosin (EC 3.4.23.4) and pepsin (EC 3.4.23.1), the renneting enzymes of
the main stomach, are aspartic proteases, and thus belong to the broad AA
clan of peptidases (Rawlings & Barrett, 1995). Aspartic proteases are found
in eukaryotes, retroviruses and some plant viruses. Eukaryotic aspartic
proteases are monomers of about 35 kDa, which are folded into a pair of
tandemly arranged domains, with, e.g. in camel chymosin, about 20.4%
similarity. It is assumed, that the two domains evolved from duplication of
an ancestral gene encoding a primordial domain. The overall secondarystructure consists almost entirely of pleated sheet, and is low in a-helices.
Each domain contains an active site, centred on a catalytic aspartyl residue,
with a consensus sequence [hydrophobic]-Asp-Thr-Gly-[Ser/Thr], which
helps to maintain the correct (p-loop conformation of the site, and with
multiple hydrophobic residues near the aspartic residue. The two catalyticcentres are arranged face-to-face in the tertiary structure of correctly folded
proteins. The distance between the aspartic side-chains is about 3.5 A in
bovine chymosin. The residues were reported to be extensively hydrogen
bonded, concomitantly with the adjacent threonine residues, to the
corresponding residues of the other domain, or to neighbouring atoms of
the own domain, to fix the correct position. Optimal activity of an aspartic
43 Results and Discussion
protease is achieved, when one of the aspartic residues is protonated, and
the other negatively charged. Thus, the pH optimum depends on the
electrostatic micro-environment created by the residues surrounding the
aspartic residues. The active sites are embedded, with low accessibility, in
the middle of a cleft, about 40 A in length, which separates the two
domains, and which is covered by a flap that extends about from Leu73 to
He85 in the N-terminal domain of bovine and camel chymosin. The B-factor
of this flap is low, which indicates high flexibility. In crystallographicstudies, oligopeptide protease inhibitors were shown to bind within the
cleft. The flap was found to close down over the inhibitors, excludingsolvent, while becoming considerably less flexible (Davies, 1990).
A short N-terminal peptide of about 45 aa is cleaved from the proenzyme of
eukaryotic aspartate proteases by an autocatalytic process at acidic pH (Fig.4.13). This peptide is of distinctly basic nature, with isoelectric points at pH10.37 for camel chymosin, and at pH 10.17 for camel pepsin. In porcinepepsin, the peptide was shown to be buried along the substrate binding cleft
in the proenzyme, thereby inhibiting the enzyme by blocking the active site
with Ser34 and Leu1, and by displacing a water molecule, which is bound in
the active enzyme, with the highly conserved Lys-9 (Sielecki et al. 1991). Six
of the basic aa residues of the porcine peptide were shown to form ion pairswith acidic residues, which are involved in substrate binding in mature
porcine pepsin. Lowering the pH possibly protonates these acidic residues,conformational changes and loss of a-helical structure are followed by
cleavage of the amide bond between Leu29 and lie-28, with further structural
rearrangement and proteolytic steps leading to the mature enzyme (Davies,1990). The propeptide was found to be a prerequisite for correct folding of
the enzyme (Li et al. 1998). It serves for protection of cellular proteins from
digestion, before the enzyme is transferred, for example into a lysosomalcompartment, or is secreted, which is, in the case of the renneting enzymes
chymosin and pepsin, from the mucosa layer of the stomach into the pepticjuices.
Aspartic proteases are endopeptidases with high substrate specificity. The
peptide substrate is numbered away from the scissile bond, Pi to Pn on the
N-terminal side of the amino acid chain, and P'i to P'n on the C-terminal
side. Specificity pockets of the corresponding enzyme subsites are labelled
Si to Sn, and S'i to S'n, respectively. Substrates, such as k-CN or
angiotensinogen, a protein cleaved by renin, are usually bound in a (3-
pleated structure with a turn at P'3 to P'5. The active site cleft accommodates
a hepta- to nonapeptide substrate, and probably also the same target site of
44
a protein, such as k-CN in chymosin. P3 and P'2 were found to be critical in
substrate binding (Davies, 1990). It is assumed, that binding of an
appropriate peptide leads to a conformational strain in the scissile peptidebond, which is twisted out of planarity. This twisting reduces the double-
bond character of the amide bond, in a way, that the nitrogen atom of P\
adopts the pyramidal nature of a secondary amine, which is more likely to
accept a proton. A central water molecule, which is bound by hydrogenbonds to two carbonyl groups of the catalytic aspartates, is ready for a
nucleophilic attack on the carbonyl group of Pi. The nitrogen atom will be
protonated by the C-terminal catalytic aspartic acid, and the originalconformation of the enzyme restored by release of the hydrolysed
fragments, and binding of a free water molecule by the catalytic aspartates.
In this way, and by isotope exchange experiments with 180-water, the
reaction mechanism is supposed to be based on a general base catalysis,without covalent intermediates (Davies, 1990).
Enzymes of the aspartic protease family are of commercial interest in
processing of milk, soya and cocoa (Albert et al. 1998). Chymosin is the
preferred enzyme in the cheese-making process, since specificity for k-CN is
high, general proteolytic activity is low, and optimal activity is achieved at
mildly acidic conditions (Williams et al. 1997). Zymogens of the natural
renneting enzymes chymosin and pepsin are isolated from the mucosa layerof the forth stomach of the unweaned calf, and in the case of pepsin, also of
the adult animal. Pepsin exhibits broader proteolytic activity than
chymosin, with a lower pH optimum, and is less suitable for cheese
production, since bitter, hydrophobic peptides, which are formed by
proteolytic action on asi- and |3-CN during ripening, impair the sensory
value of the cheese. The low general activity of bovine chymosin was
explained by a self-inhibited state of the resting enzyme, which is provoked
by occupation of the Si substrate binding pocket by Tyr77, a residue at the tipof the flap, which extends from the N-terminal domain, and which is in
chemical equilibrium with the active state of the enzyme. It was suggested,that only interaction with a specific substrate, which should be an analogueof the chymosin sensitive region in k-CN, would be able to shift the
equilibrium towards the active state of the enzyme. Binding of the cluster
His-Pro-His-Pro-His, which corresponds to bovine chymosin His98 to
His102, (Fig 4-10) was shown to induce conversion from the self-inhibited to
the active state, probably by structural transformation of the enzyme
(Gustchina et al. 1998). Self-inhibition is suppressed in pepsin. Steric
hindrance by Phem, which corresponds to Val113 in bovine chymosin,inhibits interaction of Tyr75 with the active site. Pepsin has therefore greater
45 Results and Discussion
general proteolytic activity than other mammalian acidic proteases. A site-
directed mutation of Val113 to Phe113 in recombinant calf chymosin led to a
two-fold increase in Km values, as compared to wild-type chymosin, without
altering kcat values, and increased the number of residues participating in
specificity subsites Si and S3, giving further support for the central role of
the side-chain at position Val113 in chymosin, respectively Phe111 in pepsin,in proteolytic activity (Strop et ai 1990).
Enzymatic coagulation of milk by proteolytic enzymes is an apparent two-
step process. The first step is characterised by hydrolysis of k-CN at the
surface of casein micelles. k-CN covers the predominantly hydrophobic core
of the micelles by a C-terminal glycomacropeptide, which prevents micellar
aggregation by steric hindrance and charge repulsion. This C-terminal partis specifically cleaved during the enzymatic reaction at a hydrophobic
cleavage site, which is Phe105-Met106 in bovine k-CN. In the second step of
the renneting process, an exponential increase in coagulation of casein
micelles is observed. Aggregation starts from the moment, when about 60%
to 80% of k-CN is cleaved. At this time, a sufficient part of the hydrophobicmicelle surface is supposed to have the potential to participate in the
aggregation process. A substantial reduction in coagulation time and an
increase in curd strength is achieved by pH reduction and by addition of
free Ca2+ (Dalgleish, 1992). Rennet coagulation of camel milk was found to
follow a similar mechanism as reported for cow milk (Mehaia, 1988).
Camel k-CN was found to contain a distinctly different cleavage site for
aspartic proteases, compared to bovine k-CN (Fig. 4.10). The exchange of
the amino acid Leu103 to the imino acid Pro95, which probably has
implications on peptide folding, is most significant. It was of interest to see,
if the amino acid substitutions in k-CN could be correlated with changes in
the specificity pockets of aspartic proteases from the camel stomach.
Primary Structures
PCR amplification products of partial cDNA clones of camel chymosin and
pepsin were sequenced (Figs 4-11 and 4.12). The clone for camel chymosin
(EMBL/GenBank accession number AJ131677) was 1173 bp long, and
contained a 5'-untranslated region of 21 bp, and a 3'-untranslated region of
9 bp. Only a partial consensus region according to Kozak (1989) was found
in front of the translational start, with a purine at -3 bp and cytosines at
-4 bp and -5 bp. The open reading frame ranged from A22 to C1164. Proprae-
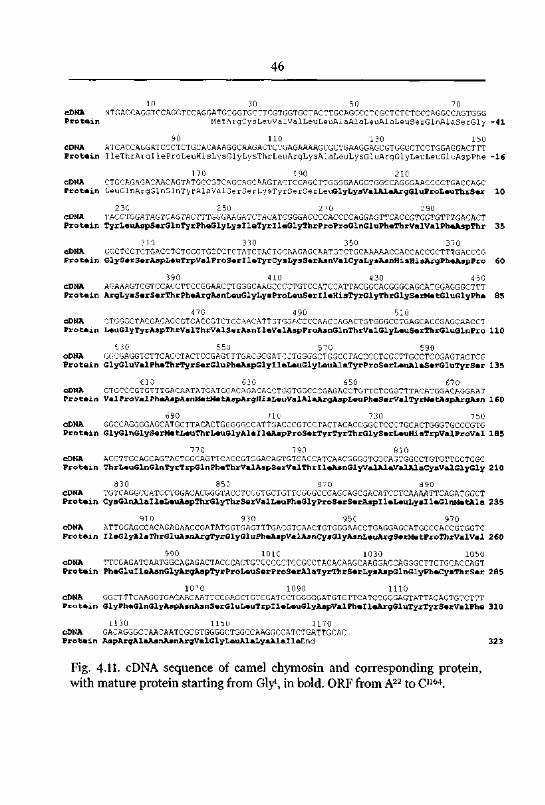
46
10 30 50 70
cDNA NTGACCAGGTCCAGGTCCAGGATGCGGTGCCTCGTGGTGCTACTTGCAGCCCTCGCTCTCTCCCAGGCCAGTGGGProtein MetArgCysLeuVa^ValLeuLeuAlaAlaLeuAlaLeuSerGlnAlaSerCly -41
90 110 130 150
cDNA ATCACCAGGATCCCTCTGCACAAAGGCAAGACTCTGAGAAAAGCGCTGAAGGAGCGTGGGCTCCTGGAGGACTTT
Protein IleThrArglleProLeuHisLysGlyLysThrLeuArgLysAlaLeuLysGluArgGlyLeuLeuGluAspPhe -16
170 190 210
CDNA CTGCAGAGACAACAGTATGCCGTCAGCAGCAAGTAGTCCAGCTTGGGGAAGGTGGCCAGGGAACCCCTGACCAGC
Protein LeuGlnArgGlnGlnTyrAlaValSerSerLysTyrSerSerLeuGlyLysValAlaArgGluProLeuThrSar 10
230 250 270 290
CDNA TArCTGGATAGTCAGTACTTTGGGAAGATr^ACATCGGGACCCCACCCCAGGAGTTCACCGTGGTGTTTGACACTProtein TyrLeuAspSerGlnTyrPheGlyLysIleTyrlleGlyThrProProGlnGluPheThrValValPheAspThr 35
310 330 350 370
cDNA GGCTCCTrTGACCTGTGGGTGCCCTCTATCTACTGGAAGAGCAA,pGTCTGCAAAAACCACCACCGCTTTGACCCG
Protein GlySerSerAspLeuTrpValProSerlleTyrCysLysSerAsnValCyaLysAsnHisHlsArgPheAspPro 60
390 410 430 450
cDNA AGAAAGTCGTCCACCTTCCGGAACCTGGGrAAGCCGCTGTCCATCCATTACGGCACGGGCAGCATGGAGGGCTTT
Protein ArgLyaSerSerThrPheArgAsnLeuGlyLysProLeuSerlleHisTyrGlyThrGlySerMetGluGlyPhe 85
470 490 510
CDNA '"TGGGCTACGACACCGTCACCGTCTCGAACATTGTGGACCCCAACCAGACTGTGGGCCTGAGCACCGAGCAACCT
Protein LeuGlyTyrAspThrValThrValSerAsnlleValAspProAsnGlnThrValGlyLeuSerThrGluGlnPro 110
r^0 550 570 590
cDNA ( t GAGGTCTTCACLTACTCCGAGTTTuACGGGAT CTGGGGCTGGCCTACCCCTCGCTTGCCTCCGAGTACTCG
Protein GlyGluValPheThrTyrSerGluPheAspGlylleLeuGlyLeuAlaTyrProSerLeuAlaSerGluTyrSer 135
610 630 650 670
CDNA GTGCCCGTGTTTGACAATATGATGCACAGArACCTGGTGGCCCGAGACCTGTTCTCGGTTTACATGGACAGGAAT
Protein ValProValPheAspAsnMetMetAspArgHisLeuValAlaArgAspLeuPheSerValTyrMetAspArgAsn 160
690 710 730 750
cDNA CGCCAGGGGAGCATGCTTACACTGCGGGCCATTGACCCGTCCTACTACACCGGCTCCCTGCACTGGGTGCCCGTGProtein GlyGlnGlySerMetLeuThrLeuGlyAlalleAspProSerTyrTyrThrGlySerLeuHisTrpValProVal 185
770 790 810
cDNA AGCTTGCAGCAGTACTGGCAGTTCACCGTGGACAGTGTCACCATCAACGGGGTGGCAGTGGCCTGTGTTGGTGGC
Protein ThrLeuGlnGlnTyrTrpGlnPheThrValAspSerValThrlleAsnGlyValAlaValAlaCysValGlyGly 210
830 850 870 890
CDNA TGTCAGGCCATCCTGGACACGGGTACCTCCGTGCTGTTCGGGCCCAGCAGCGACATCCTCAAAATTCAGATGGCT
Protein CysGlnAlalleLeuAspThrGlyThrSerValLeuPheGlyProSerSerAspIleLeuLysIleGlnMetAla 235
910 930 950 970
cDNA ATTGGAGCCACAGAGAACCGATATCGTGAGTTTGACGTCAACTGTGGGAACCTGAGGAGCATGCCCArCGTGGTC
Protein ZleGlyAlaThrGluAsnArgTyrGlyGluPheAspValAsnCysGlyAsnLeuArgSerMetProThrValVal 260
990 1010 1030 1050
cDNA TTCGAGATCAATGGCAGAGACTACCCACTGTCCCC~TrCGCCTACACAAGCAAGGACCAGGGCTTCTGCACCAGT
Protein PheGluIleAsnGlyArgAspTyrProLeuSerProSerAlaTyrThrSerLysAspGlnGlyPheCysThrSer 285
1070 1090 1110
cDNA GGCTTTCAAGGTGACAACAATTCCCAGCTGTGGAT"CTGGGGGATGTCTTCATCCGGGAGTATTACAGTGTCTTTProtein GlyPheGlnGlyAspAsnAsnSerGluLeuTrpIleLeuGlyAspValPhelleArgGluTyrTyrSerValPhe 310
1130 115C 1170
cDNA GACAGGGCCAACAATCGCGTGGGGCTGGCCAAGGCCATC^GATTGCAC
Protein AspArgAlaAsnAsnArgValGlyLeuAlaLysAlalleEnd 323
Fig. 4.11. cDNA sequence of camel chymosin and corresponding protein,with mature protein starting from Gly1, in bold. ORF from A22 to C1164.
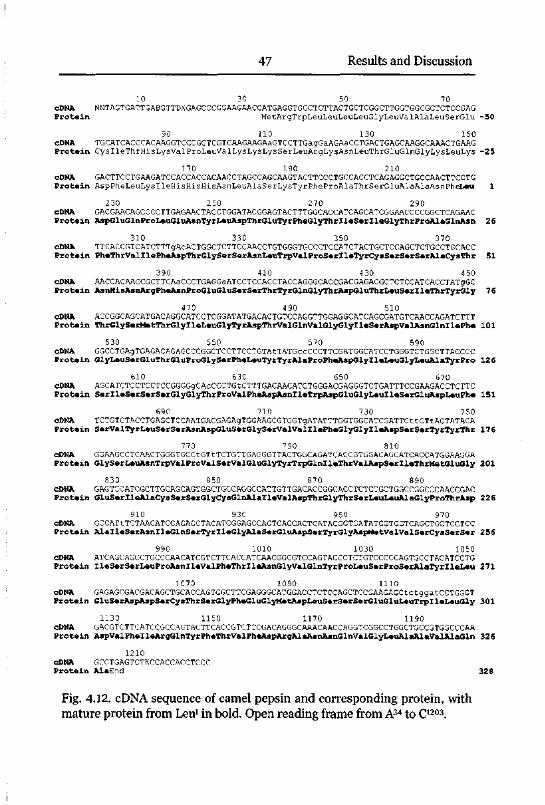
47 Results and Discussion
10 30 50 70
cDNA NNTAGTGATTGABGTTDXGAGCCGGGAAGAACCATGAGGTGGCTGTTACTGCTCGGCTTGGTGGCGCTCTCCGAG
Protein MetArgTrpLeuLeuLeuLeuGlyLeuValAlaLeuSerGlu -50
90 110 130 150
cDNA TGCATCACCCACAAGGTCCCGCTCGTCAAGAAGAaGTCCTTGagGaAGAaCCTGACTGAGCAAGGCAAACTGAAGProtein CysIleThrHisLysValProLeuValLysLysLysSerLeuArgLysAsnLeuThrGluGlnGlyLysLeuLys -25
170 190 210
cDNA GACTTCCTGAAGATCCACCACCACAACCTAGCCAGCAAGTACTTCCCTGCCACCTCAGAGGCTGCCAACTTCCTG
Protein AspPheLeuLysIleHisHlsHlsAsnLeuAlaSerLysTyrPheProAlaThrSerGluAlaAlaAsnPheLeu 1
230 250 270 290
CDNA GACGAACAGCCCCTTGAGAACTACCTGGATACGGAGTACTTTGGCACCATCAGCATCGGAACCCCGGCTCAGAAC
Protein AspGluGlnProLeuGluAsnTyrXieuAspThrGluTyrPheGlyThrXleSerllaGlyThrProAlaGlnAsn 26
310 330 350 370
oDNA TTCACCGTCATCTTTgAcACTGGCTCTTCCAACCTGTGGGTGCCCTCCATCTACTGCTCCAGCTCTGCCTGCACCProtein pheThrValllePheAspThrGlySerSerAsnlieuTrpValProSerlleTyrCysSerSerSerAlaCysThr 51
390 410 430 450
cDNA AACCACAACCGCTTCAaCCCTGAGGaATCCTCCACCTACCAGGGCACCGACGAGACGCTCTCCATCACCTATgGCProtein AsnHisAsnArgFheAsnProGluGluSerSerThrTyrGlnGlyThrAspGluThrLeuSerlleThrTyrGly 76
470 490 510
cDNA ACCGGCAGCATGACAGGCATCCTCGGATATGACACTGTCCAGGTTGGAGGCATCAGCGATGTCAACCAGATCTTT
Protein ThrGlySerMetThrGlylleLeuGlyTyrAspThrValGlnValGlyGlylleSerAspValAsnGlnllePhe 101
530 550 570 590
cDNA GGCCTGAgTGAGACAGAGCCCGGCTCCTTCCTGTAtTATGccCCCTTCGATGGCATCCTGGGTCTGGCTTACCCCProtein GlyLeuSerGluThrGluProGlySerPheLeuTyrTyrAlaProPheAspGlylleLeuGlyLeuAlaTyrPro 126
610 630 650 670
cDNA AGCATCTCCTCCTCCGGGGgCAcCCCTGtCTTTGACAACATCTGGGACGAGGGTCTGATTTCCGAAGACCTCTTCProtein SerlleSerSerSerGlyGlyThrProValPheAspAsnlleTrpAspGluGlyLeuIleSerGluAspLeuPhe 151
690 710 730 750
cDNA TCTGTCTACCTGAGCTCCAATGACGAGAgTGGAAGCGTGGTgATATTTGGTGGCATCGATTCttCTtACTATACAProtein SerValTyrLeuSerSerAsnAspGluSerGlySerValValXlePheGlyGlyXleAspSerSerTyrTyrThr 176
770 790 810
cDNA GGAAGCCTCAACTGGGTGCCtGTtTCTGTTGAGGGTTACTGGCAGATCACCGTGGACAGCATCACCATGGAAGGA
Protein GlySerLeuAsnTrpValProValSerValGluGlyTyrTrpGlnlleThrValAspSerlleThrMetGluGly 201
830 850 870 890
cDNA GAGTCCATCGCTIGCAGCAGTGGCTGCCAGGCCATTGTTGACACCGGCACCTCTCTGCTGGCCGGCCCAACCGAC
Protein GluSerlleAlaCysSerSerGlyCysGlnAlalleValAspThrGlyThrSerLeuLeuAlaGlyProThrAsp 226
910 930 950 970
CDNA GCCATtTCTAACATCCAGAGCTACATCGGAGCCAGTGAGGACTCATACGGTGATATGGTGGTCAGCTGCTCCTCC
Protein AlalleSerAsnlleGlnSerTyrlleGlyAlaSerGluAspSerTyrGlyAspMetValValSerCysSerSer 256
990 1010 1030 1050
cDNA ATCAGCAGCCTGCCCAACATCGTCTTCACCATCAACGGCGTCCAGTACCCTCTGTCCCCCAGTGCCTACATCCTG
Protein xleSerSerLeuProAsnlleValPheThrXleAsnGlyValGlnTyrProLeuSerProSerAlaTyrlleLeu 271
1070 1090 1110
cDNA GAGAGCGACGACAGCTGCACCAGTGGCTTCGAGGGCATGGACCTCTCCAGCTCCGAAGAGCtctggatCCTGGGTProtein GluSerAspAspSerCysThrSerGlyPheGluGlyMetAspLeuSerSerSerGluGluLeuTrpXleLeuGly 301
1130 1150 1170 1190
cDNA GACGTCTTCATCCGCCAGTACTTCACCGTCTTCGACAGGGCAAACAACCAGGTCGGCCTGGCTGCCGTGGCCCAA
Protein AspValPhelleArgGlnTyrPheThrValPheAspArgAlaAsnAsnGlnValGlyLeuAlaAlaValAlaGln 326
1210
cDNA GCCTGAGTCTKCCACCACCTCCC
Protein AlaEnd 328
Fig. 4.12. cDNA sequence of camel pepsin and corresponding protein, with
mature protein from Leu1 in bold. Open reading frame from A34 to C1203.
48
chymosin was 381 aa residues long, with a molecular weight of 42.082 kDa
and an isoelectric point at pH 6.25. The start site of praechymosin was
determined by similarity as Ser42. The 16 aa signal peptide had 100%
sequence similarity with the signal sequence of bovine chymosin.Praechymosin was 365 aa resiudes long, with a molecular weight of 40.428
kDa and an isoelectric point at pH 5.99. The start site of mature, activated
chymosin was determined by similarity as Gly1. Mature chymosin was 323
aa residues long, with a molecular weight of 35.629 kDa and an isoelectric
point at pH 4.71. It shared 96.9% sequence similarity with bovine chymosin,97.8% with porcine chymosin, 89.8% with camel pepsin, and 89.5% with
porcine pepsin. The clone for camel pepsin (EMBL/GenBank accession
number AJ131678) was 1223 bp long, and contained a 5'-untranslated
region of 33 bp, and a 3'-untranslated region of 20 bp. As with chymosincDNA, only a partial consensus region according to Kozak (1989) was found
in front of the translational start, with a purine at -3 bp and cytosines at -1
bp and -2 bp. The open reading frame ranged from A34 to C1203.
Propraepepsin was 390 aa residues long, with a molecular weight of 42.117
kDa and an isoelectric point at pH 3-95. The start site of praepepsin was
determined by similarity as lie-48. The 15 aa signal peptide had 100%
sequence similarity with the signal sequence of human and porcine pepsin.Praepepsin was 375 aa residues long, with a molecular weight of 40.418 kDa
and an isoelectric point at pH 3.92. The start site of mature, activated
pepsin was determined by similarity as Leu1. Mature pepsin was 327 aa
residues long, with a molecular weight of 34.907 kDa and an isoelectric
point at pH 3.16. It shared 98.5% sequence similarity with porcine pepsin.Although the sequences contained possible sites for posttranslational
modification, comparison to other mammalian acid proteases indicated,that camel chymosin and pepsin were not modified, e.g. by phosphorylationor glycosylation.
FunctionalAspects
Wangoh et al. (1993) showed, that the clotting time of camel milk is
significantly reduced, when camel rennet is used instead of calf rennet.
Isolated chymosin and pepsin fractions from camel and calf stomachs were
tested on their respective activity to clot camel milk, and it was found, that
the main clotting activity of calf rennet resided in the pepsin fraction,whereas the main clotting activity of camel rennet originated from the
chymosin fraction. Renneting of camel milk with the calf chymosin fraction
did not result in milk coagulation. We suggest, that the Arg^-Arg94 activator
region of camel milk k-CN is not suitable for release of calf chymosin from
its self-inhibited state. As mentioned before, a considerable variation in
49 Results and Discussion
primary structure was found when camel and bovine k-CNs were compared.Noticeable modifications in camel k-CN were the deletion on the N-
terminal side of the cleavage site (Fig. 4-9), the different localisation of sites
with high probability of glycosylation (Fig. 4.8), the replacement of a
leucine, which was reported to be highly flexible (Plowman & Creamer,
1995), with a rigid proline at P3, and replacement of weakly basic histidine
residues with highly basic arginine residues at P4, P6, and Ps.
The region around the cleavage site, which is proposed to have a p-sheetstructure in extended conformation (Williams et al. 1997), is probably less
flexible in camel k-CN, due to the exchange of leucine to proline. We
assume, that in general, substrate specificity of chymosin is especially highfor k-CN of the same species. The general proteolytic activity of porcine
chymosin, for example, was reported to be about ten times lower than the
activity of bovine chymosin, whereas its cow milk clotting activity was onlyfour times lower. When tested against sow milk, the clotting activity was
about six to eight times greater than that of calf chymosin (Houen et al.
1996). Nevertheless, camel chymosin was found to clot camel and cow milk
equally well (Wangoh, 1993). Specificity pockets of camel chymosin, which
bind more flexible arginine sidechains, may also be suited to host the more
rigid histidine side-chains of bovine k-CN. It can be assumed, that the
protonation status of the histidines will be important for binding to camel
chymosin. In this context, it would be of interest to know the pH optimumof camel chymosin for specific hydrolysis of the cleavage sites in camel and
bovine k-CN. High activity of bovine pepsin in camel milk rennetinghowever can be explained by the high general proteolytic activity of pepsin.The primary structure of bovine pepsin is not yet known, but it can be
assumed, that the protein does contain a bulky residue, which suppresses
self inhibition, as it was found in camel and porcine pepsin with Phe111 (Fig.
4-13). Camel chymosin contained a Val113 at the corresponding site, in the
same way as bovine chymosin. It can be assumed, that camel chymosin is in
a chemical equilibrium of an active an a resting state, in a similar way as
bovine chymosin.
Several studies tried to unveil the mechanism for specific binding of bovine
k-CN and bovine chymosin. Comparative modelling (Gilliland et al. 1991;
Plowman, 1995), kinetic studies (Visser et al. 1987; Strop et al. 1990;
Gustchina et al. 1998) and structural analysis of inhibitor complexes(Groves et al. to be published) showed, that specificity of binding dependson alternating binding of hydrophobic and positively charged residues of
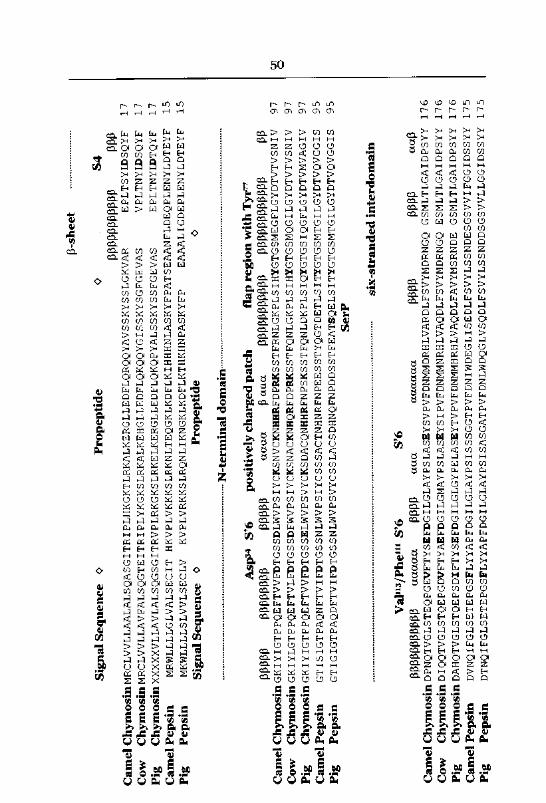
517
DTNQIFGLSETEPGSFLYYAPFDGILGLAYPSISASGATPVFDNLWDQGLVSQDLFSVYLSSNDDSGSVVLLGGIDSSYY
Pepsin
Pig
517
DVNQIFGLSETEPGSFLYYAPFDGILGLAYPSISSSGGTPVFDNIWDEGLISEDLFSVYLSSNDESGSVVIFGGIDSSYY
Pepsin
Camel
176
GSMLTLGAIDPSYY
ChymosinDAHQTVGLSTQEPSDIFTYSEFDGILGLGYPELASEYTVPVFDNMMHRHLVAQDLFAVYMSRNDE
Pig
176
ESMLTLGAIDPSYY
ChymOsinDIQQTVGLSTQEPGDVFTYAEFDGILGMAYPSLASEYSIPVFDNMMNRHLVAQDLFSVYMDRNGQ
Cow
617
GSMLTLGAIDPSYY
ChymosinDPNQTVGLSTEQPGEVFTYSEFDGILGLAYPSLASEYSVPVFDNMMDRHLVARDLFSVYMDRNGQ
Camel
aaP
PPPP
PPPP
aaaaaa
aaa
PPPP
aaaaa
PPPPPPPPPPP
S'6
S'6
Val"VPhem
interdomain
six-stranded
SerP
95
GTIGIGTPAQDFTVIFDTGSSNLWVPSVYCSSLACSDHNQFNPDDSSTFEATSQELSITYGTGSMTGILGYDTVQVGGIS
Pepsin
Pig
95
GTISIGTPAQNFTVIFDTGSSNLWVPSIYCSSSACTNHNRFNPEESSTYQGTDETLSITYGTGSMTGILGYDTVQVGGIS
Pepsin
Camel
97
ChymosinGKIYIGTPPQEFTVVFDTGSSELWVPSVYCKSDACQNHHRFNPSKSSTFQNLDKPLSIQYGTGSIQGFLGYDTVMVAGIV
Pig
97
ChymosinGKIYLGTPPQEFTVLFDTGSSDFWVPSIYCKSNACKNHQRFDPRKSSTFQNLGKPLSIHYGTGSMQGILGYDTVTVSNIV
Cow
Ui
97
CamelChymosinGKIYIGTPPQEFTVVFDTGSSDLWVPSIYCKSNVCKNHHRFDPRKSSTFRNLGKPLSIHYGTGSMEGFLGYDTVTVSNIVpp
pppppppppppp
ppppppppppp
paaa
aaaa
PPPPP
PPPPPPPP
PPPPP
Tyr77
with
region
flap
patch
charged
positively
S'6
Asp3*
domain-
N-terminal
OPropeptide
0Sequence
Signal
15
eaaaligdeplenyldteyf
kvplvrkkslrqnlikngklkdflkthkhnpaskyfp
mkwllllslvvlseclv
Pepsin
Pig
15
hkvplvkkkslrknlteqgklkdflkihhhnlaskyfpatseaanfldeqplenyldteyf
mrwllllglvalsecit
Pepsin
Camel
17
EPLTNYIDTQYF
ChymosinXXXXXVLLAVLALSQGSGITRVPLRKGKSLRKELKERGLLEDFLQKQPYALSSKYSSFGEVAS
Pig
17
VPLTNYIDSQYF
ChymosinMRCLVVLLAVFALSQGTEITRIPLYKGKSLRKALKEHGLLEDFLQKQQYGISSKYSGFGEVAS
COW
17
EPLTSYIDSQYF
ChymosinMRCLVVLLAALALSQASGITRIPLHKGKTLRKALKERGLLEDFLQRQQYAVSSKYSSLGKVAR
Camel
ppp
PPPPPPPPPPP
S4
0Propeptide
OSequence
Signal
p-sheet
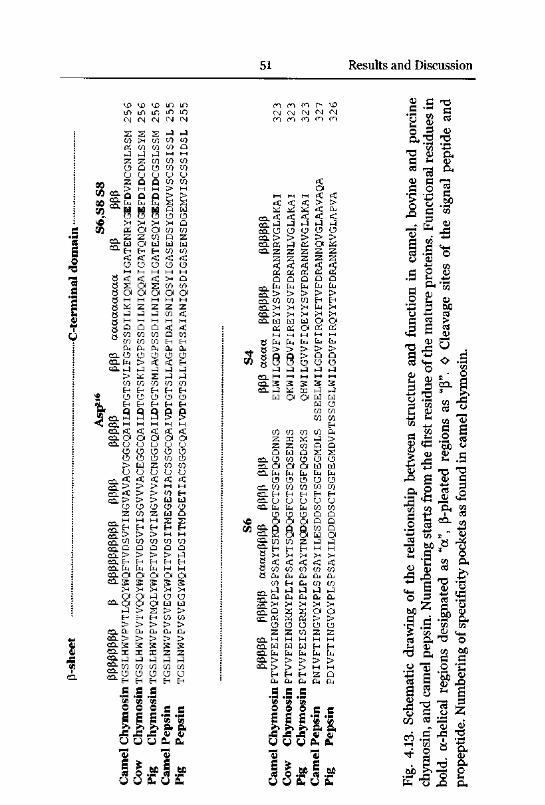
51 Results and Discussion
^D SO so LD IT)
UI tri IT) Ln ui
CM CM CM CM CM
• 2 2 2 hH J
en X en en en
PS en en en a
J J J M M
2 2 en en en
0 Q CJ) en en
U CJ O CJ o
SO g a a en en
M M > M
* go Q a > >
05 Wbu
WCu
ws sa w
~ ej cj o CJ CJSO X X >H >H Q
3 c« os a a en en
• 3—
2 2 en D 2
pp
I
GATEa w W W
H H en en
sC < < <
wcj CJ CJ CJM M H M
9 2 < < < >H Q
a 2 cn en3 8 a a a a a
t 3 8 M
3 8 ^M M hH hH
2 2 2 2- a j hH J en <iu a M M M M M
4a Q Q Q sC sC
tj a m en en Q en» °
en en en H EhCu Cu Cu Cu Cu
ca cj cj CJ O CJea. bu > sC cC Hca j J ^ J hH
> W 2 J J
en en en cn cn
Eh E-i Eh Eh Eh* cj CJ CJ CJ CJ
jS ca.9En Eh H H
9 9 g gM hH M hH
ca < < < < sCca a a a a aca o CJ o cj o
ej cj CJ CJ CJcj cj CJ cn cj> KI 2 cn cn
o o a CJ CJ
ca g< a, < < <
ca ^ > > M M
ca < > > en eh
ca > > > w w
cj u CJ CJ CJ2 en 2 w Q
caM M M S 2
caE"1 H H EH Eh
ca> > > M M
ca " en en cn cn
ca Q a D a a
ca > > > > J
ca En Eh Eh Eh hca fa bu PU M M
ca a a a a aca g s s s s
X X >H X >Ha a hH CJ CJ
ca a a a w w
j > 2 > >H H Eh cn cn
> > > > >ca cu Cu Cu Cu Cu
4.d ca > > > > >t j cas s S s s( j as Bu¬ a 2 2J! S"^ hl hi hH hH
95 £-<n en en cn cn
a
ca ,n2- ca^J
OEh
CJEh
CJ CJ
£ 4g _gc* "S "S0 0 0 c e
III•3 .306 IK
Ot 0.J3 J3 J3 ST u
UUUhh
V V
E S« 0
BO | _B0cj cj tot
oo oo cn r- vo
CN CN] C\] CM CnJ
00 00 00 00 00
SCa
M M M < << < < > >
« « « < Cu
ca < < < < <
ca J hH h^ hH J
ca (J CJ CJ CJ CJ
ca > > > > >ca cc; hH cc; a «ca 2 2 2 2 2
2 2 2 2 2
<PS 6? 3 s
a Q Q D Q
ca ^ bu bu bu bu
ca > > > > >
ca cn en cn H Eh
ca >h X X bu X
ca x X X X X
ca h w a a a
cc; Ch a PC PSl-H hH M M hH
8 fa bu bu 6u 6u
^. 8 >
« §8H-1
> > > >
8 >CJ
a
CJ
a
CJj J hH hH
ca M M M M hH
oaS s S s Sca h3 hu « hi h^
w a a
aass TSSGEcn cn cn cn Cu
2 B3 « hH >2 2 CO Q a
a Cd Q 2 2ca cj en O (J CJ
ca o a a M a
ca bu bu bu bu bu
CJ O CJ CJ CJ
ca on cn cn cn cn
ca Eh frH H Eh Eh
ca cj CJ u CJ uca bu bu bu cn cn
CJ CJ CJ Q a
so a a a Q a
"P a a en Qa a w a
£- " cn 2 hH hH
^3- E"1 Eh H hH hH
2 * X X X X
2 * < < sC <8 cn cn en cn cn
8 cu cu Cu cu cu
cn H Cu cn cn
caJ
ca x
hH hH hH hH
Cu Cu Cu cu
X X X X
5a Q S S a a
ca oS hu OS > >CJ CJ CJ CJ CJ2 2 cn 2 2
ca h M hH M M
ea u W w Eh Eh
ca bu bu bu bu buca > > > > >ca > > > M hH
Eh Eh Eh 2 aCu CU Cu Cm cu
.s .s .s"b '55 'S0 0 0
ci •-
"
%o ^
a >h
§ §
sicu .
1 3TO «^H
ty <u
ft
2 i*
43 30 +j
c «
^ a
a^
rto
43 t3U •«
2coCO
+j
cS «> CU
1 rSCU
*^
-° a
o ca
13c
CU
CU
ft
13cl
0)
-cl
CU
(30ea
c,
o
o
Hi» CO
CJ 0)
O O O &. 0.
V V
H 5 BO
cj u £s BOCO .-
CJ D-
Iff
flM)^
•C -3? co
rt ftu cuT3 ft
•a "5
a s
o a
co .al-H CO
^ p
ta "3
Jft B
co -S
cd y
CO "3
11So «
J^ c
CU d
cd=ft
CO
:» iSo
2 ft
cu cj
CS -rt
•a &T3 O
co M)
a ci
.2 'C
CU -5^ a
.H ^
"o3 cu
S ft.
cu
T3 ft
-3 SX> ft
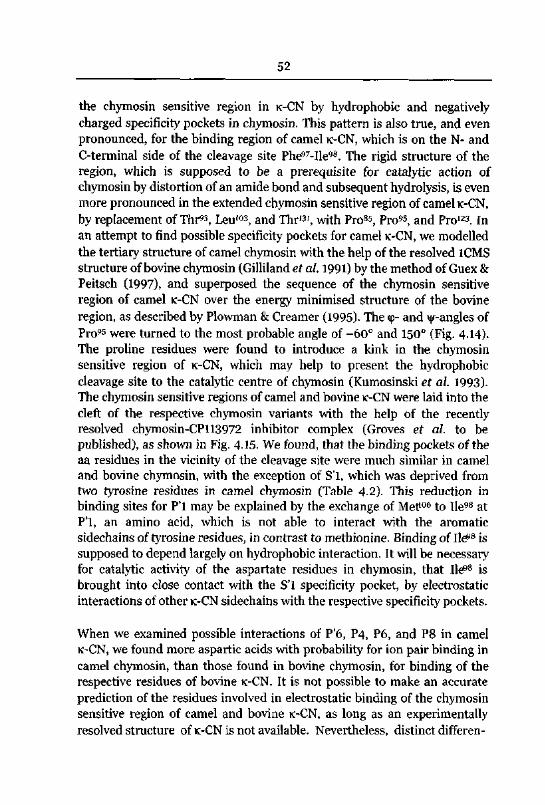
52
the chymosin sensitive region in k-CN by hydrophobic and negatively
charged specificity pockets in chymosin. This pattern is also true, and even
pronounced, for the binding region of camel k-CN, which is on the N- and
C-terminal side of the cleavage site Phe97-Ile98. The rigid structure of the
region, which is supposed to be a prerequisite for catalytic action of
chymosin by distortion of an amide bond and subsequent hydrolysis, is even
more pronounced in the extended chymosin sensitive region of camel k-CN,
by replacement of Thr93, Leu103, and Thr131, with Pro85, Pro95, and Pro123. In
an attempt to find possible specificity pockets for camel k-CN, we modelled
the tertiary structure of camel chymosin with the help of the resolved 1CMS
structure of bovine chymosin (Gilliland et al. 1991) by the method of Guex &
Peitsch (1997), and superposed the sequence of the chymosin sensitive
region of camel k-CN over the energy minimised structure of the bovine
region, as described by Plowman & Creamer (1995). The cp- and \|/-angles of
Pro95 were turned to the most probable angle of -60° and 150° (Fig. 4.14).The proline residues were found to introduce a kink in the chymosinsensitive region of k-CN, which may help to present the hydrophobiccleavage site to the catalytic centre of chymosin (Kumosinski et al. 1993).The chymosin sensitive regions of camel and bovine k-CN were laid into the
cleft of the respective chymosin variants with the help of the recentlyresolved chymosin-CP113972 inhibitor complex (Groves et al. to be
published), as shown in Fig. 4.15. We found, that the binding pockets of the
aa residues in the vicinity of the cleavage site were much similar in camel
and bovine chymosin, with the exception of S'l, which was deprived from
two tyrosine residues in camel chymosin (Table 4.2). This reduction in
binding sites for P'l may be explained by the exchange of Me)?06 to He98 at
P'l, an amino acid, which is not able to interact with the aromatic
sidechains of tyrosine residues, in contrast to methionine. Binding of He98 is
supposed to depend largely on hydrophobic interaction. It will be necessary
for catalytic activity of the aspartate residues in chymosin, that lie98 is
brought into close contact with the S'l specificity pocket, by electrostatic
interactions of other k-CN sidechains with the respective specificity pockets.
When we examined possible interactions of P'6, P4, P6, and P8 in camel
k-CN, we found more aspartic acids with probability for ion pair binding in
camel chymosin, than those found in bovine chymosin, for binding of the
respective residues of bovine k-CN. It is not possible to make an accurate
prediction of the residues involved in electrostatic binding of the chymosinsensitive region of camel and bovine k-CN, as long as an experimentallyresolved structure of k-CN is not available. Nevertheless, distinct differen-
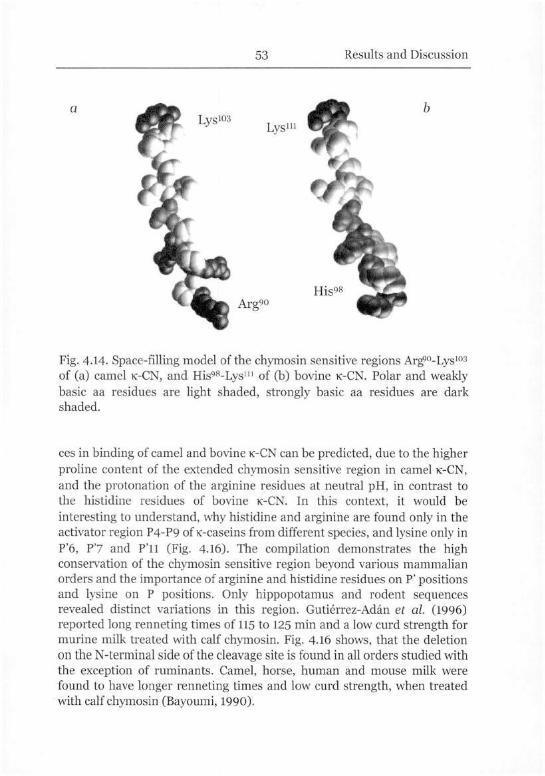
53 Results and Discussion
Lys1
Argw
Fig. 4.14. Space-filling model of the chymosin sensitive regions Arg90-Lys103of (a) camel k-CN, and His98-Lysm of (b) bovine k-CN. Polar and weaklybasic aa residues are light shaded, strongly basic aa residues are dark
shaded.
ces in binding of camel and bovine k-CN can be predicted, due to the higher
proline content of the extended chymosin sensitive region in camel k-CN,
and the protonation of the arginine residues at neutral pH, in contrast to
the histidine residues of bovine k-CN. In this context, it would be
interesting to understand, why histidine and arginine are found only in the
activator region P4-P9 of K-caseins from different species, and lysine only in
P'6, P'7 and P'll (Fig. 4.16). The compilation demonstrates the highconservation of the chymosin sensitive region beyond various mammalian
orders and the importance of arginine and histidine residues on P' positionsand lysine on P positions. Only hippopotamus and rodent sequences
revealed distinct variations in this region. Gutierrez-Adan et al. (1996)
reported long renneting times of 115 to 125 min and a low curd strength for
murine milk treated with calf chymosin. Fig. 4.16 shows, that the deletion
on the N-terminal side of the cleavage site is found in all orders studied with
the exception of ruminants. Camel, horse, human and mouse milk were
found to have longer renneting times and low curd strength, when treated
with calf chymosin (Bayoumi, 1990).
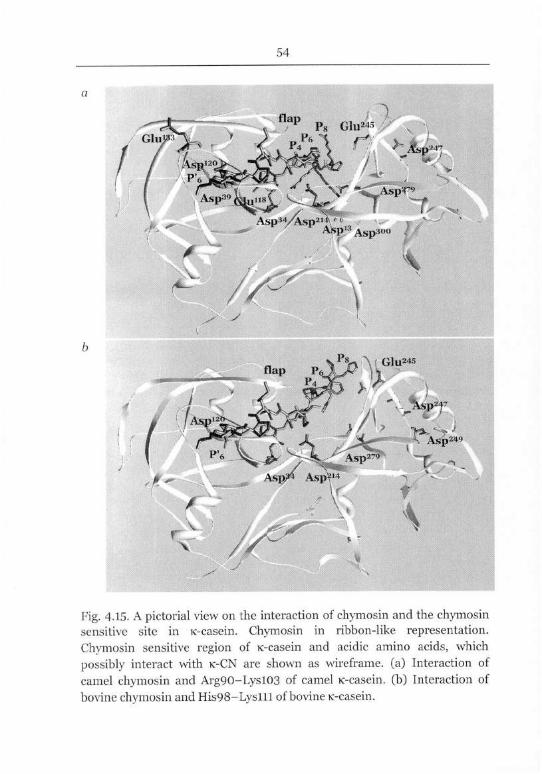
54
flap,1
A*SP24
Pg Glu2«
AspayAsp2'*^
V
•»" •»%•
As^'AspS'
X
^
-/
PV\"\ Glu^s
%sp2f
X ^
Asp2
~l
Fig. 4.15. A pictorial view on the interaction of chymosin and the chymosin
sensitive site in K-casein. Chymosin in ribbon-like representation.
Chymosin sensitive region of K-casein and acidic amino acids, which
possibly interact with k-CN are shown as wireframe, (a) Interaction of
camel chymosin and Arg90-Lysl03 of camel K-casein. (b) Interaction of
bovine chymosin and His98-Lyslll of bovine K-casein.
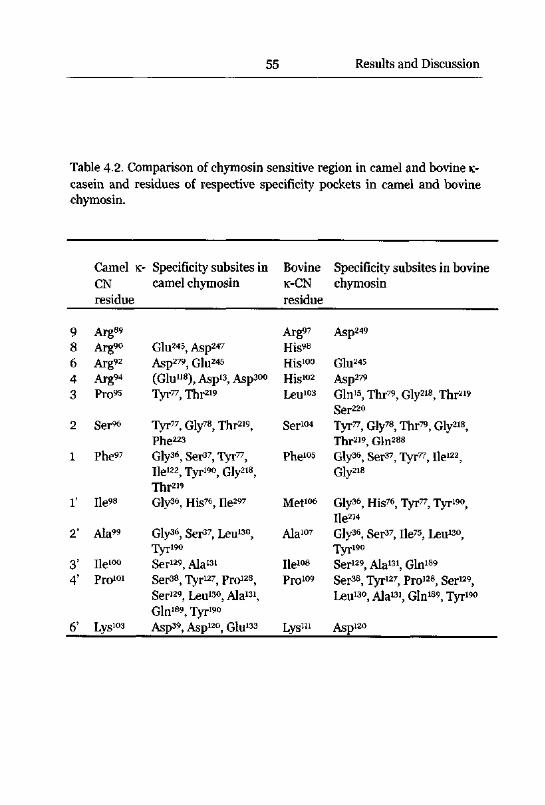
55 Results and Discussion
Table 4.2. Comparison of chymosin sensitive region in camel and bovine k-
casein and residues of respective specificity pockets in camel and bovine
chymosin.
Camel k- Specificity subsites in Bovine Specificity subsites in bovine
CN camel chymosin k-CN chymosinresidue residue
9 Arg89 Arg9? Asp2498 Argoo Glu2«, Asp2<»7 His98
6 Arg92 Asp2?9, Glu2« His100 G1U245
4 ArgM (Glu118), Asp", Aspsoo His102 Asp2?93 Pro^ Tyr77, Thr219 Leu1Q3 Gln^, Thr?9, Gly218, Thr219
Ser220
2 Ser% Tyr77, Gly?8, Thr219,Phe223
Ser"* Tyr??, Gly78, Thr?9, Gly218,Thr219, Gin288
1 Phe9? Gty36, Ser37i Tyr77)He122, Tyr19°, Gly218,Thr219
pne105 Gty3<>, Ser37) Tyr77) He122;
Gly218
1' lie'8 Gly36, His?6, lie29? Met106 Gty36, HiS76, Tyr77) Tyr190)He214
2' Ala99 Gly36, Ser37, Leu"0,
Tyrwo
Ala10? Glyss, Ser37, lle?5, Leu"",
Tyr»o3' He100 Ser129, Alawi He108 Ser129, Ala*1, Gin189
4' Pro101 Ser3«, Tyr12?, Pro128,
Ser129, Leu"0, Ala"1,
Gin189, Tyr190
Pro109 Ser38, Tyr12?, Pro128, Ser129,
Leu"", Ala131, Gin189, Tyr190
6' Lys103 Asp39, Asp120, Glu^s Lys111 Asp120
56
Residues more distant to the cleavage site in k-CN were discussed to be
involved in binding to peripheral sites in chymosin. It was observed, that
the B variant of bovine k-CN was associated with firmer cheese curds,
shorter renneting times, a smaller average micelle size, higher milk casein
and k-CN concentrations, and lower whey protein concentrations, when
compared to the A variant (Jakob, 1994), and the C variant exhibited longerrennet coagulation times, than variants A and B (Jakob, 1993). Sequence
comparison revealed hydrophobic residues in variant B at positions, where
variant A contained a glycosylated Thr136 and an acidic Asp148, and a
histidine in variant C at the position of Arg97. The effects reported for
variant B are likely to result from alterations on the level of gene expression,as well as on enzymatic suitability as a substrate for bovine chymosin.Camel k-CN contained hydrophobic residues at the corresponding sites, in
the same way as bovine k-CN B. Arg97 in bovine k-CN A and B was proposed
to interact with Asp249, in a structural arrangement, where no interaction of
His98 with an acidic chymosin residue was possible (Plowman et al. 1997).
Interaction of His97 in bovine k-CN C with Asp249 was not possible, which
gave explanation for the extended renneting time. It was also shown, that
interaction of Arg97 was not possible, when Asp249 was replaced by Asn249, as
it was the case in camel chymosin. It is possible, that interaction of all
arginines of the camel k-CN chymosin sensitive region is brought about by
replacement of Leu103 with Pro95 at position P3. Williams et al. (1997)
proposed an interaction of Asp244 in the less thermostable bovine chymosinvariant A with His98. Variant A exhibits a 20% higher clotting ability than
chymosin B, which may be explained by stronger interaction of the N-
terminal chymosin sensitive region of k-CN with this variant. In camel
chymosin, a glycine was found at this position, as in bovine chymosin B.
Arg90 at position P8 is likely to interact either with Glu245 or with Asp247 in
camel chymosin, so there is no need for replacement of Gly244. Highconservation of the lysine at position P'll throughout different mammalian
orders point to the importance of this residue for optimal binding to
chymosin (Fig 4-16), although it was shown, that the peptide His98 to Lys112
was sufficient for a hydrolysis rate similar to full-length mature bovine
k-CN.
A pronounced dipole moment was found between the N- and C-terminal
domains of mammalian aspartic proteases. This dipole was found to be
more pronounced and have a different orientation in bovine chymosin, than
in other aspartic proteases, including pepsin. A patch of the positively
charged residues Lys48, Lys53, His55, Arg57, Arg61, and Lys62 on the surface of
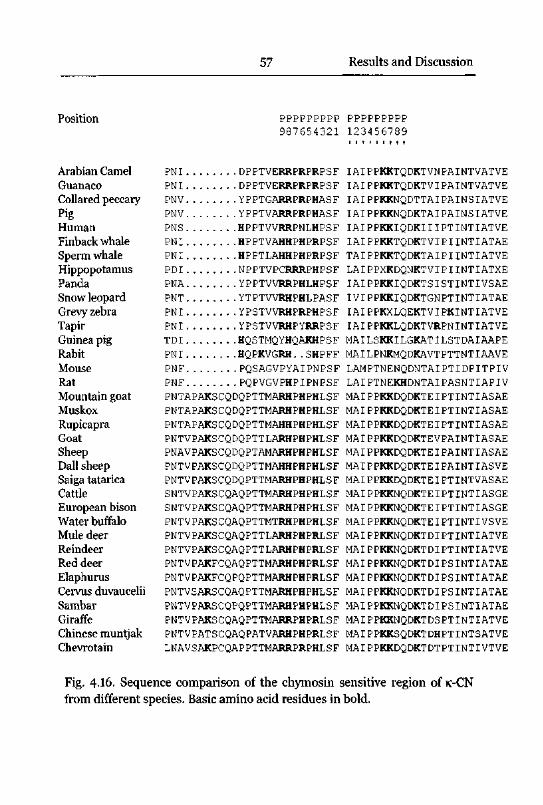
57 Results and Discussion
Position PPPPPPPPP PPPPPPPPP
987654321 123456789
1 I ! I I I I I I
Arabian Camel pni dpptverrprprpsf iaippkktqdktvnpaintvatve
Guanaco pni dpptverrprprpsf iaippkktqdktvipaintvatve
Collared peccary PNV YPPTGARRPRPHASF IAIPPKKNQDTTAIPAINSIATVE
Pig PNV YPPTVARRPRPHASF IAIPPKKNQDKTAIPAINSIATVE
Human PNS HPPTVVRRPNLHPSF IAIPPKKIQDKIIIPTINTIATVE
Finbackwhale PNI HPPTVAHHPHPRPSF IAIPPKKTQDKTVIPIINTIATAE
Sperm whale pni hpptlahhphprpsf taippkktqdktaipiintiatve
Hippopotamus PDI NPPTVPCRRRPHPSF LAIPPXKDQNKTVIPIINTIATXE
Panda pna ypptvvrrphlhpsf iaippkkiqdktsistintivsae
Snowleopard pnt ytptvvrhphlpasf ivippkkiqdktgnptintiatae
Grevyzebra pni ypstvvrhprphpsf iaippkxlqektvipkintiatve
Tapir PNI YPSTVVRHPYRRPSF IAIPPKKLQDKTVRPNINTIATVE
Guinea pig TDI HQSTMQYHQAKHPSF MAILSKKILGKATILSTDAIAAPE
Rabit PNI HQPKVGRH. .SHPFF MAILPNKMQDKAVTPTTNTIAAVE
Mouse PNF PQSAGVPYAIPNPSF LAMPTNENQDNTAIPTIDPITPIV
Rat PNF PQPVGVPHPIPNPSF LAIPTNEKHDNTAIPASNTIAPIV
Mountain goat pntapakscqdqpttmarhphphlsf maippkkdqdkteiptintiasae
Muskox pntapakscqdqpttmarhphphlsf maippkkdqdkteiptintiasae
Rupicapra pntapakscqdqpttmahhphphlsf maippkkdqdkteiptintiasae
Goat pntvpakscqdqpttlarhphphlsf maippkkdqdktevpaintiasae
Sheep pnavpakscqdqptamarhphphlsf maippkkdqdkteipaintiasae
Dallsheep pntvpakscqdqpttmahhphphlsf maippkkdqdkteipaintiasve
Saigatatarica pntvpakscqdqpttmarhphphlsf maippkkdqdkteiptintvasae
Cattle SNTVPAKSCQAQPTTMARHPHPHLSF MAIPPKKNQDKTEIPTINTIASGE
European bison SNTVPAKSCQAQPTTMARHPHPHLSF MAIPPKKNQDKTEIPTINTIASGE
Water buffalo PNTVPAKSCQAQPTTMTRHPHPHLSF MAIPPKKNQDKTEIPTINTIVSVE
Mule deer pntvpakscqaqpttlarhphprlsf maippkknqdktdiptintiatve
Reindeer PNTVPAKSCQAQPTTLARHPHPRLSF MAIPPKKNQDKTDIPTINTIATVE
Red deer pntvpakfcqaqpttmarhphprlsf maippkknqdktdipsintiatae
Elaphurus pntvpakfcqpqpttmarhphprlsf maippkknqdktdipsintiatae
Cervusduvaucelii pntvsarscqaqpttmarhphphlsf maippkknqdktdipsintiatae
Sambar pntvparscqpqpttmarhphphlsf maippkknqdktdipsintiatae
Giraffe pntvpakscqaqpttmarrphprlsf maippkknqdktdsptintiatve
Chinesemuntjak pntvpatscqaqpatvarhphprlsf maippkksqdktdhptintsatve
Chevrotain LNAVSAKPCQAPPTTMARRPRPHLSF MAIPPKKDQDKTDTPTINTIVTVE
Fig. 4.16. Sequence comparison of the chymosin sensitive region of k-CN
from different species. Basic amino acid residues in bold.
58
the N-terminal lobe of bovine chymosin was discussed to have favourable
electrostatic interactions with the negatively charged residues on the
surface of casein micelles (Gilliland et al. 1991). This patch is less
pronounced on porcine chymosin, which may explain the low clottingactivity towards cow milk, but more pronounced in camel chymosin, with
an additional His56, which helps to explain the good renneting properties of
camel chymosin towards cow milk.
Camel pepsin was similar in structure to porcine pepsin. The isoelectric
point of the mature protein was at pH 3-16, and thus slightly higher than
that of porcine pepsin, which was at pH 3.10. The protein was not found to
contain a consensus sequence Ser-Xaa-Glu for mammary gland proteinkinase, whereas the porcine protein was shown to be indeed phosphorylatedat Ser70, which decreases the pH of the isoelectric point additionally. Pepsinis mainly expressed in the mucosa of the highly acidic environment of the
stomach in adult animals, whereas chymosin is usually found in the
stomach of suckling animals. Developmentally regulated expression of
aspartic proteases in the mammalian stomach corresponds to the pHoptima of enzymatic activities, which are at pH 3.8 for bovine chymosin B
and 4.0 for bovine chymosin A, and at a pH below 2.0 for pepsin(Mantafounis & Pitts, 1990; Andreeva & James, 1991). The low pH optimumof pepsin was explained by the ability of pepsin, to maintain negative
charges, e.g. of Asp11, Asp118, and Asp138, at the very low pH values found in
the gastric lumen of mammals. Camel pepsin contains four basic and 41
acidic aa residues, one acidic residue less than porcine pepsin. Since most
charged residues are at similar positions as in porcine pepsin, it seems
likely, that optimal activity is only at a slightly higher pH than in porcine
pepsin. A pronounced structural stability is expected at the extreme acidic
pH, whereas the protein is likely to be denatured at pH greater than 6.5, in a
similar way as porcine pepsin, due to the surplus of negatively chargedresidues at this pH (Andreeva & James, 1991).
Based on structural comparison, we suppose that camel chymosin is better
suited for rennet coagulation of camel milk than calf chymosin, which was
studied elsewhere (Ramet, 1987; Mehaia, 1988). Although firm coagulationof the milk was reported in some studies, a consistent quality was not
obtained in the cheese making process and addition of elevated amounts of
CaCh was a prerequisite. Use of camel chymosin may help to prevent the
formation of bitter peptides during cheese ripening, which impair the taste,
and therefore could help to promote consumer acceptability of cheese
59 Results and Discussion
products in camel keeping countries. Large-scale production of this enzyme,
e.g. by recombinant methods, should be envisaged therefore.
4.3 Major Whey Proteins
Literature
Bovine whey is defined as the supernatant of casein precipitation at pH 4.6.
Major protein components of bovine whey are p-lactoglobulin with 55.0% of
total whey protein, a-lactalbumin with 20.25% and blood serum albumin
with 6.6% (Schlimme, 1990). Although the precipitation point of camel milk
casein was shown to be lower than that of cow milk casein (Wangoh, 1997),
pH 4.6 was chosen for studies on camel whey for better comparison to
bovine whey.
Reversed-Phase Chromatography of Whey Proteins
Whey of acid precipitated camel milk was separated by reversed-phase-Gs
chromatography (Fig. 4.17). Peaks were identified by N-terminal
sequencing. Whey acidic protein (WAP) was eluted at 16.9 min, a-
lactalbumin at 23.3 min to 30.0 min, and lactophorin at 36.3 min to
40.0 min. Absorption of lactophorin at 280 nm was weak. The presumedlow level in tyrosine, tryptophan and cysteine was confirmed by sequence
analysis.
Integration of peak areas was done at 220 nm. a-lactalbumin accounted for
86.6% of total peak area, lactophorin for 11.5%, and whey acidic protein(WAP) for 1.9%. SDS-PAGE revealed, that blood serum albumin and other
proteins coeluted with a-lactalbumin as minor fractions. Minor whey
proteins were not detected by RP-Gs chromatography of total whey. If it is
assumed, that camel milk contains an average of 8,300 mg r1 whey
proteins, the amount of a-lactalbumin, together with coeluted proteins, is
about 7,200 mg l"1, the amount of lactophorin about 954 mg r1, and of WAP
about 157 mg H
The major camel whey proteins a-lactalbumin, lactophorin and WAP were
already sequenced by Beg (1985,1986 b, 1987). In this study, we corrected
the sequence of lactophorin, as presented by Beg (1987), since this protein
may have interesting features to explain some characteristics of camel milk.
In a further study, it would also be of interest to characterise the potential
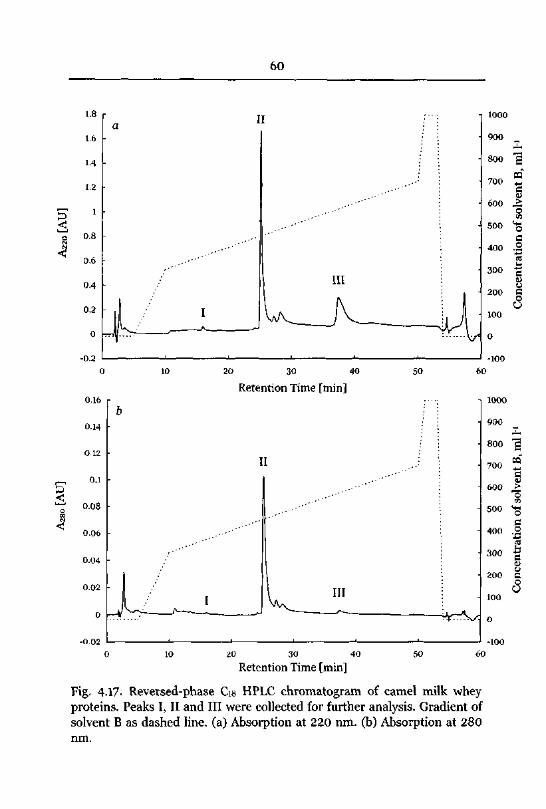
60
18IT
1000
a
16 900
14800
12700
6001
500
08
400
06
300
04 \ 1 i200
02 ^i_J.
W-A—_J 100
^u0
_n o
-i 0
-inn
0 16
0 14
0 12
01
0 08
0 06
0 04
0 02
0
20 30 40
Retention Time [min]
II
50
III
20 30 40
Retention Time [min]
50
60
60
Fig. 4.17. Reversed-phase Cis HPLC chromatogram of camel milk whey
proteins. Peaks I, II and III were collected for further analysis. Gradient of
solvent B as dashed line, (a) Absorption at 220 nm. (b) Absorption at 280
nm.
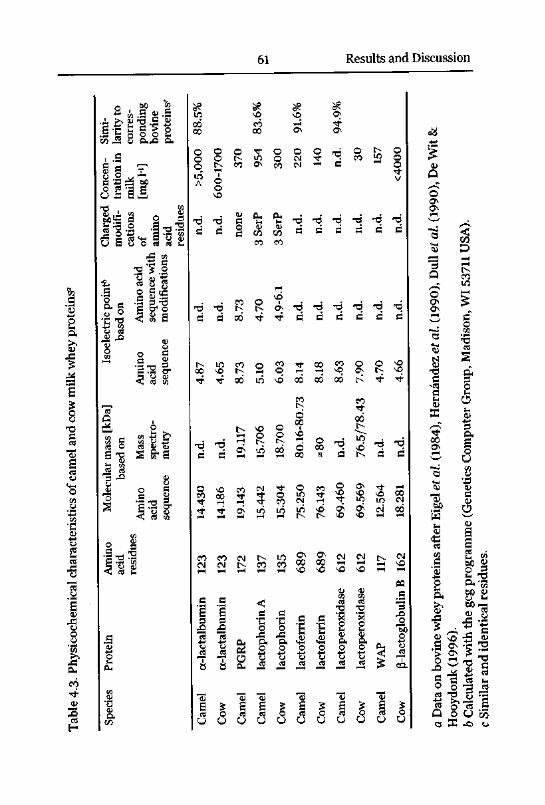
3OGoCO
3SB
Gco
a>
residues.
identical
and
Similar
c
USA).
WI53711
Madison,
Group,
Computer
(Genetics
programme
gcg
the
with
Calculated
b
(1996)
.Hooydonk
&Wit
De
(1990),
al.
et
Dull
(199
0),
al.
et
Hernandez
(1984),
al.
et
Eigel
after
prot
eins
whey
bovine
on
Data
a
94.9%
91.6%
83.6%
88.5%
<4000
157
30
n.d.
140
220
300
954
370
600-1700
>5,000
n.d.
n.d.
n.d.
n.d.
n.d.
n.d.
3SerP
3SerP
none
n.d.
n.d.
n.d.
n.d.
n.d.
n.d.
n.d.
n.d.
4.9-6.1
4.70
8.73
n.d.
n.d.
4.66
4.70
7.90
8.63
8.18
8.14
6.03
5.10
8.73
4.65
4.87
n.d.
n.d.
76.5/78.43
n.d.
=80
80.16-80.73
18.700
15.706
19.117
n.d.
n.d.
18.281
12.564
69.569
69.460
76.143
75.250
15.304
15.442
19.143
14.186
14.430
162
BpMactoglobulin
117
612
612
689
689
135
137
172
123
123
WAP
lactoper
oxid
ase
lactoper
oxid
ase
lactoferrin
lactoferrin
lact
ophori
n
Alactopho
rin
PGRP
a-lactalbumin
oc-lactalbumin
Cow
Camel
Cow
Camel
Cow
Camel
Cow
Camel
Camel
Cow
Camel
proteins0
bovine
ponding
corres¬to
larity
Simi¬
[mgl
-'l
milk
in
tration
Concen¬
residues
acid
amino
of
cations
modifi¬
Charged
modifications
sequence
with
sequence
acid
acid
Amino
Amino
on
basd
point6
Isoelectric
metry
sequence
spectro-
acid
Mass
Amino
on
based
[kDa]
mass
Molecular
residues
acid
Amino
Protein
Spec
ies
prot
eins
3whey
milk
cow
and
camel
of
characteristics
Phys
icochemical
4.3.
Table
62
protease-inhibitor WAP in terms of enzymatic activity and tertiarystructure.
4.3.1 Lactophorin
Literature
Lactophorin is a major protein component of camel whey, which was first
described by Beg et al. (1987) and characterised as cysteine free and with N-
terminal heterogeneity in the amino acid sequence. It is structurally closelyrelated to bovine lactophorin, which is a minor protein component of
bovine whey. Bovine lactophorm was found to be a hydrophobic phospho-glycoprotein with an apparent mass of 28 kDa and a concentration in milk
of about 300 mg l1 (Johnsen et al. 1996). The protein was shown to have
good emulsifying qualities (Courthaudon et al. 1995) and to inhibit
spontaneous lipolysis by lipoprotein lipase (Girardet et al. 1993). Strong
sequence similarities were found to mouse and rat glycosylation dependentcell adhesion molecule GlyCAM-1.
The present investigation aimed to determine the correct structures and
relative amounts of camel lactophorin variants, to compare the gene
structure with the structural organisation of the bovine lactophorin gene
and of the murine GlyCAM-1 gene, and to find indications for the function
of the protein in camel milk. Since the primary structure was not
determined to certainty by Edman sequencing of peptide fragments, we
decided to sequence the corresponding cDNA, which was obtained from
lactating mammary gland.
Bovine lactophorin is the major protein component of proteose peptone
component 3, and is therefore often named proteose peptone component 3
(MPP3, HFPP3). This term was not used for designation of the camel
protein, because the protein was not isolated from proteose peptone, and
because bovine PP3 consisted of several proteins, of which lactophorin was
just the main fraction. Furthermore, the term PP3 is also used for
designation of other proteins than the milk protein. The term "lactophorin"was introduced by Kanno (1989 a) to describe a whey component with
affinity to soluble glycoprotein antiserum. This term was chosen for
designation of the protein studied, since it was used particularly for
description of this protein family. The term "lactoglycophorin", as proposedby Girardet & Linden (1996), could not be used for camel lactophorin,because the protein was not glycosylated.
63 Results and Discussion
Lactophorin Gene Structure
The genomic structure of the lactophorin gene was analysed by sequencingof PCR products, which spanned from exon 1 to exon 4 (EMBL/GenBankaccession number AJ131714). Similarly to the gene structures of bovine
lactophorin and murine GlyCAM-1, the coding sequence of the camel
lactophorin gene was interrupted by three intron sequences at G106, T151, and
G376 (pig. 4.18, 4.19). These positions corresponded to the positions in the
murine GlyCAM-1 gene and the bovine lactophorin gene. Intron I was 686
bp long, intron II 844 bp and intron III 236 bp. The SINE Bov-A2 sequence,
which is present in bovine intron I, the microsatellite sequence (AC)i9,which is present in bovine intron II, and the LINE/LI, which is present in
bovine intron III, were not found in the camel gene (Fig. 4.18). Intron I of
the camel lactophorin gene contained a LINE/L2. A correspondinginterspersed element was found in the bovine lactophorin gene, but not in
the murine GlyCAM-1 gene. Camel intron I was 286 bp shorter than bovine
intron I, camel intron II was 58 bp longer than bovine intron II and camel
intron III was 269 bp shorter than bovine intron III. Compared to the
bovine gene, the camel gene contained few interspersed elements. The
peptide omitted in variant B of the camel protein conferred to the very short
exon II, which was surrounded by two long intron sequences. This
peculiarity may promote the probability of alternative splicing at this site.
Exon II was 45 bp long, which was a multiple of three bp, and was therefore
deleted without frameshift in camel lactophorin B mRNA. Analysis of
intron/exon junctions revealed, that camel exon II had a low splicingprobability of 0.69 at the acceptor site and 0.77 at the donor site, comparedto 0.81 at both corresponding sites of bovine exon II and 0.68 at the
acceptor site and 0.82 at the donor site of murine exon II. This twofold low
splicing probability in the camel gene may promote exclusion of exon II
from the mRNA.
Primary Structure
The N-terminus of RP-Gs-HPLC purified camel lactophorin was sequencedand the amino acid heterogeneity reported by Beg et al. (1987) was
confirmed. N-terminal heterogeneity was found to be the result of
alternative splicing. The sequence, which corresponded to exon2, was
deleted in a minor fraction of camel lactophorin. PCR amplificationproducts of two full length cDNA clones of 632 bp and 587 bp were
sequenced (Fig 4.19). Both cDNA clones contained a 5'-untranslated regionof 42 bp and a 3'-untranslated region of 125 bp. The 5'-untranslated regioncontained a partial Kozak-box (C36CCCACC), with cytosines at -1, -4 and -5
bp, and an adenine at -3 bp in front of the translational start A«TG. The 3'-
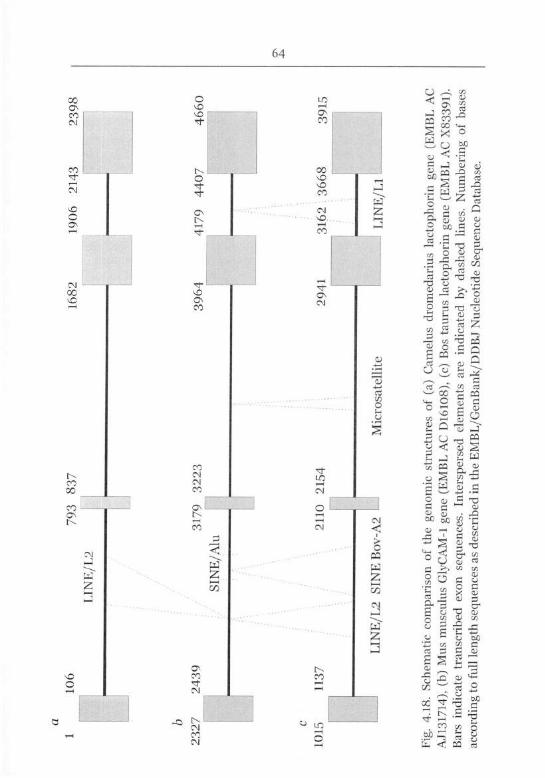
Database.
Sequence
Nucleotide
EMBL/GenBank/DDBJ
the
in
described
as
sequences
length
full
to
acco
rdin
gbases
of
Numbering
line
s.dashed
by
indicated
are
elements
Interspersed
sequences.
exon
transcribed
indicate
Bars
X83391).
AC
(EMBL
gene
lact
opho
rin
taurus
Bos
(c)
D16108),
AC
(EMBL
gene
GlyCAM-1
musculus
Mus
(b)
AJ131714),
AC
(EMBL
gene
lact
opho
rin
dromedarius
Camelus
(a)
of
structures
genomic
the
of
comparison
Schematic
4.18.
Fig.
LINE/LI
Microsatellite
SINEBov-A2
LINE/L2
3915
3668
3162
2941
2154
2110
1137
1015C
4^
Alu
SINE/
4660
4407
4179
3964
3223
3179
2439
2327
LINE/L2
2398
2143
1906
1682
837
793
106
1
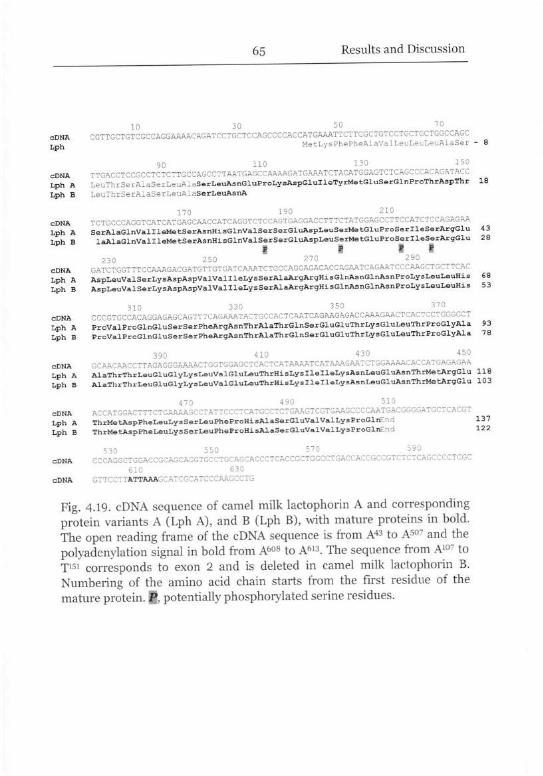
65 Results and Discussion
10 30 50 70
cDNA CGTTGCTGTCGCCAGGAAAACAGATCCTGCTCCAGCCCCACCATGAAATTCTTCGCTGTCCTGCTGCTGGCCAGC
Lph MetLysPhePheAlaValLeuLeuLeuAlaSer- 8
90 110 130 150
cDNA TTGACCTCCGCCTCTCTTGCCAGCCTTAATGAGCCAAAAGATGAAATCTACATGGAGTCTCAGCCCACAGATACC
Lph A LeuThrSerAlaSerLeuAlaSerLeuAsnGluProLysAspGluIleTyrMetGluSerGlnProThrAspThr 18
Lph B LeuThrSerAlaSerLeuAlaSerLeuAsnA
170 190 210
cDNA TCTGCCCAGGTCATCATGAGCAACCATCAGGTCTCCAGTGAGGACCTTTCTATGGAGCCTTCCATCTCCAGAGAA
Lph A SerAlaGlnVallleMetSerAsnHisGlnValSerSerGluAspLeuSerMetGluProSerlleSerArgGlu 43
Lph B laAlaGlnVallleMetSerAsnHisGlnValSerSerGluAspLeuSerMetGluProSerlleSerArgGlu 28
B # 11* m mm
230 230 2^0 290
cDNA GATCTGGTTTCCAAAGACGATGTTGTGATCAAATCTGCCAGGAGACACCAGAATCAGAATCCCAAGCTGCTTCAC
Lph A AspLeuValSerLysAspAspValVallleLysSerAlaArgArgHisGlnAsnGlnAsnProLysLeuLeuHis 68
Lph B AspLeuValSerLysAspAspValVallleLysSerAlaArgArgHisGlnAsnGlnAsnProLysLeuLeuHis 53
CDNA CCCGTGCCACAGGAGAGCAGTTTCAGAAATACTGCCACTCAATCAGAAGAGACCAAAGAACTCACTCCTGGGGC3
Lph A ProValProGlnGluSerSerPheArgAsnThrAlaThrGlnSerGluGluThrLysGluLeuThrProGlyAla 93
Lph B ProValProGlnGluSerSerPheArgAsnThrAlaThrGlnSerGluGluThrLysGluLeuThrProGlyAla 78
333 413 4 iy 433
CDNA GCAACAACCTTAGAGGGAAAACTGGTGGAGCTCACTCATAAAATCATAAAGAATCTGGAAAACAGCATGAGAGAA
Lph A AlaThrThrLeuGluGlyLysLeuValGluLeuThrHisLysIlelleLysAsnLeuGluAsnThrMetArgGlu 118
Lph B AlaThrThrLeuGluGlyLysLeuValGluLeuThrHisLysIlelleLysAsnLeuGluAsnThrMetArgGlu 103
CDNA ACCATGGACTTTCTGAAAAGCCTATTCCCTCATGCCICTGAAGTCGTGAA3CCCCAATGACGGGGATGCTCACGT
Lph A ThrMetAspPheLeuLysSerLeuPheProHisAlaSerGluValValLysProGlnEnd 137
Lph B ThrMetAspPheLeuLysSerLeuPheProHisAlaSerGluValValLysProGlnEnd 122
590
CDNA CCCAGGCTGGACCGCAGCAGGTGCCTGCAGCACCCTCACCGCTGGCCTGACCACCGCCGTCTCTCAGCCCCTCGC610 630
cDNA GTTCCTTATTAAAGCATCGCATCCCAAGCCTG
Fig. 4.19. cDNA sequence of camel milk lactophorin A and corresponding
protein variants A (Lph A), and B (Lph B), with mature proteins in bold.
The open reading frame of the cDNA sequence is from A43 to A507 and the
polyadenylation signal in bold from A608 to A613. The sequence from A10" to
T151 corresponds to exon 2 and is deleted in camel milk lactophorin B.
Numbering of the amino acid chain starts from the first residue of the
mature protein. P, potentially phosphorylated serine residues.
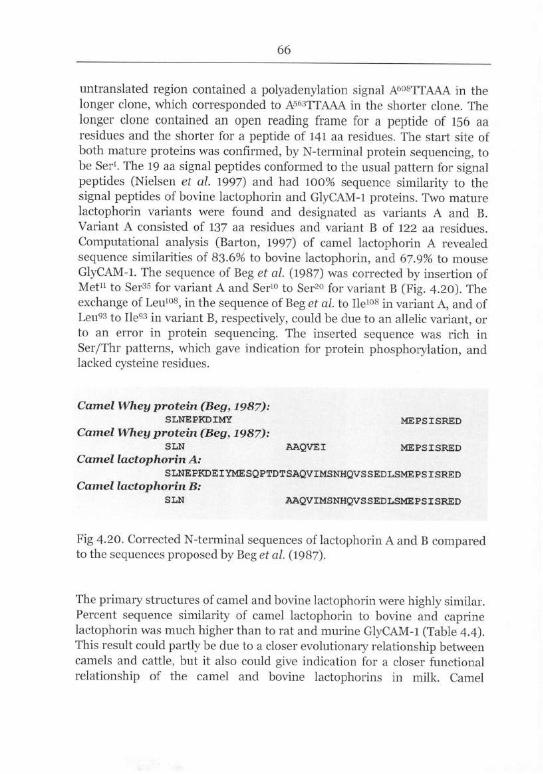
66
untranslated region contained a polyadenylation signal A608TTAAA in the
longer clone, which corresponded to A563TTAAA in the shorter clone. The
longer clone contained an open reading frame for a peptide of 156 aa
residues and the shorter for a peptide of 141 aa residues. The start site of
both mature proteins was confirmed, by N-terminal protein sequencing, to
be Ser1. The 19 aa signal peptides conformed to the usual pattern for signalpeptides (Nielsen et al. 1997) and had 100% sequence similarity to the
signal peptides of bovine lactophorin and GlyCAM-1 proteins. Two mature
lactophorin variants were found and designated as variants A and B.
Variant A consisted of 137 aa residues and variant B of 122 aa residues.
Computational analysis (Barton, 1997) of camel lactophorin A revealed
sequence similarities of 83.6% to bovine lactophorin, and 67.9% to mouse
GlyCAM-1. The sequence of Beg et al. (1987) was corrected by insertion of
Met11 to Seras for variant A and Ser10 to Ser20 for variant B (Fig. 4.20). The
exchange of Leu108, in the sequence of Beg et al. to He108 in variant A, and of
Leu93 to He93 in variant B, respectively, could be due to an allelic variant, or
to an error in protein sequencing. The inserted sequence was rich in
Ser/Thr patterns, which gave indication for protein phosphorylation, and
lacked cysteine residues.
Camel Whey protein (Beg, 1987):SLNEPKDIMY MEPSISRED
Camel Whey protein (Beg, 1987):SLN AAQVEI MEPSISRED
Camel lactophorin A:
SLNEPKDEIYMESQPTDTSAQVIMSNHQVSSEDLSMEPSISREDCamel lactophorin B:
SLN AAQVIMSNHQVSSEDLSMEPSISRED
Fig 4.20. Corrected N-terminal sequences of lactophorin A and B comparedto the sequences proposed by Beg et al. (1987).
The primary structures of camel and bovine lactophorin were highly similar.
Percent sequence similarity of camel lactophorin to bovine and caprinelactophorin was much higher than to rat and murine GlyCAM-1 (Table 4.4).This result could partly be due to a closer evolutionary relationship betweencamels and cattle, but it also could give indication for a closer functional
relationship of the camel and bovine lactophorins in milk. Camel
67 Results and Discussion
lactophorin B exhibited less sequence similarity, due to a gap in the
sequence pile-up, produced by the deletion already mentioned.
Glycosylation accounts for about 17% to 18% of protein mass of bovine
lactophorin (Ng et al. 1970; Kanno, 1989 b; Girardet et al. 1994),
phosphorylation for about 0.5% (Ng et al. 1970) to 1.1% (Paquet et al.
1988). An average of two to four residues of bovine lactophorin are
phosphorylated and two to three residues are glycosylated. Dissimilarly to
the camel protein, bovine lactophorin was originally isolated from proteose
peptone component 3, and was reported to be N- and O-glycosylated.Nevertheless, high similarity of the corrected camel and the bovine primarystructure and common secondary structural features gave indication that
both proteins were true homologues and exerted a similar function in milk.
N-terminal HeterogeneityGlu4 to Ser18, the 15 aa peptide which was not found in variant B and
corresponded to exon 2, was of acidic nature, with an isoelectric point at pH3.70, and with distinct hydrophilicity. Bovine and caprine lactophorin,murine and rat GlyCAM-1, which are the only fully sequenced homologuesfrom other species, were not reported to be expressed in different variants
due to alternative splicing. N-terminal sequences of ovine and llama
lactophorins did not show amino acid heterogeneity either (Fig. 4.21, N-
terminal sequence of the sheep homologue identical to the caprine N-
terminal sequence). Endoplasmatic signal peptidase cuts llama pre-
lactophorin three aa residues prior to the cleavage site of the camel and
bovine counterparts, and both of the sequenced GlyCAM-1 proteins are
cleaved one amino acid beyond this site. The different cleavage sites
additionally demonstrate a high variability of the N-terminal part of the
lactophorin/GlyCAM-1 family. If this variability is the result of a variation in
functionality between the N-termini, or if it results from a prevalent low N-terminal functionality of the proteins could not be decided, because the
tertiary structures are not yet resolved and the functional domains not yetdetermined. Nevertheless, many residues of the N-terminal part were highlyconserved (Fig. 4.21). This gave indication, that this part of the protein wasof functional importance. A function, which depended on the N-terminal
sequence as found in bovine lactophorin and camel lactophorin A, was
expected to be lost or significantly altered in camel lactophorin B.
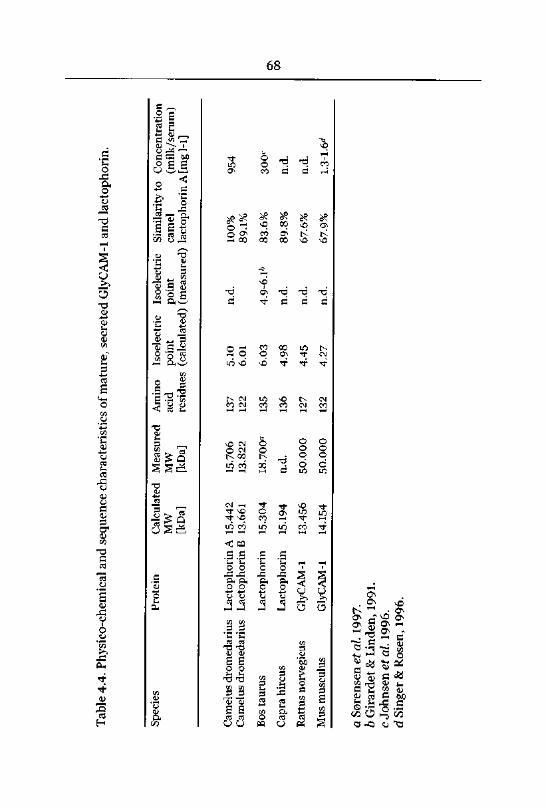
00
1996.
Rosen,
&Singer
d
1996.
al.
et
Johnsen
c
1991.
Linden,
&Girardet
b
1997.
al.
et
Sorensen
a
1.3-1.6d
67.9%
n.d.
4.27
132
50.000
14.154
GlyCAM-1
musculus
Mus
n.d.
67.6%
n.d.
4.45
127
50.000
13.456
GlyCAM-1
norv
egic
usRattus
n.d.
89.8%
n.d.
4.98
136
n.d.
15.194
Lactophorin
Caprahircus
300'
83.6%
4.9-6.1ft
6.03
135
18.700°
15.304
Lactophorin
taurus
Bos
89.1%
6.01
122
13.822
13.661
BLactophorin
dromedarius
Camelus
954
100%
n.d.
5.10
137
15.706
15.442
ALactophorin
dromedarius
Camelus
1-1]
[mg
Alactophorin
(measured)
(cal
cula
ted)
residues
[kDa]
[kDa]
(milk/serum)
camel
point
point
acid
MW
MW
Concentration
to
Simi
lari
tyIsoelectric
Isoelectric
Amino
Measured
Calculated
Protein
Species
lact
opho
rin.
and
GlyCAM-1
secreted
mature,
of
characteristics
sequence
and
Physico-chemical
4.4.
Table
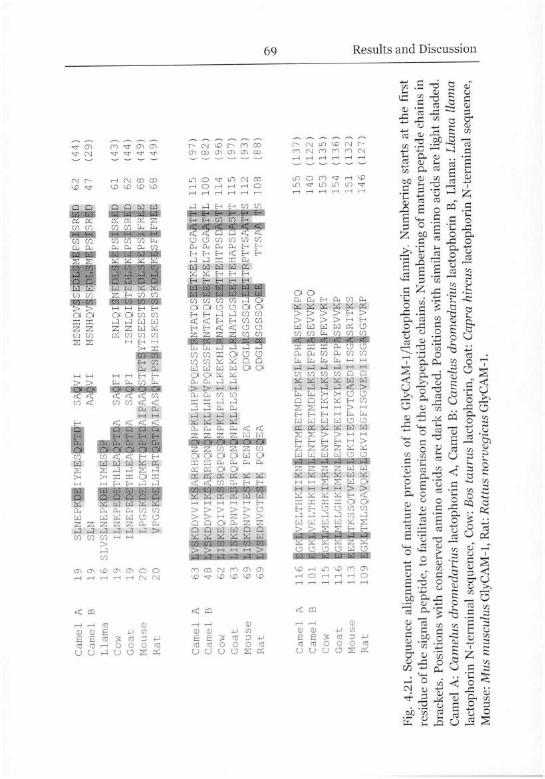
GlyCAM-1.
norvegicus
Rattus
Rat:
GlyCAM-1,
musculus
Mus
Mouse:
sequence,
N-terminal
lact
opho
rin
hircus
Capra
Goat:
lactophorin,
taurus
Bos
Cow:
sequence,
N-terminal
lact
opho
rin
llama
Llama
Llama:
B,la
ctop
hori
ndromedarius
Camelus
B:
Camel
A,
lactophorin
dromedarius
Camelus
A:
Camel
shaded.
ligh
tare
acids
amino
similar
with
Positions
shaded.
dark
are
acids
amino
conserved
with
Positions
brackets.
in
chains
pept
ide
mature
of
Numbering
chains.
poly
pept
ide
the
of
comparison
facilitate
to
pept
ide,
signal
the
of
residue
first
the
at
starts
Numbering
family.
GlyCAM-1/lactophorin
the
of
proteins
mature
of
alignment
Sequence
4-21.
Fig.
(127)
(132)
(136)
(135)
(122)
(137)
146
151
154
153
140
155
SGTVRP
SRITKS
SEVVKP
FEVVKT
SEVVKPQ
SEVVKPQ
GKVIEGFISGVEDIISG
GKIIEGFVTGAEDIISG
ENTVKEIIKYLKSLFPP
ENTVKETIKYLKSLFSH
ENTMRETMDFLKSLFPH
ENTMRETMDFLKSLFPH
TMLSQAVQKE
TKSSQTVEEE
MELGHKIMKN
GK
MELGHKIMRN
VELTHKIIKN
VELTHKIIKN
109
113
116
115
101
116
Rat
Mouse
Goat
Cow
BCamel
ACamel
(88)
108
js
TTSA|
(93)
112
I|S
PTTJ
(97)
115
IT
iHAPS
(96)
114
fT
LHTPE
(82)
100
~LTPCrftT|L
SGSSQC
QDGL
SGSSQI
NATLGSl
NATLGSj
NTATQSl
(97)
115
ELTPGAItIl
NTATQSKl
PQS|EA
|VSLDNVG1ESIK
69
QDGL
PEnIeA
LiSKDNVVILSIK
6
liskepnvjrsprqpqnInpklplsilkekql
6
liskeqivirIsrqpqsInpklplsilkekhl
6
L7SKDDVVIKiARRHQN|NP
KLLH
PVPQ
ESSF
A
1PKLLHPVPQESSF
^RRHCllQ
LVSKDDVVIl
'6
Rat
Mouse
Goat
Cow
BCamel
ACamel
(29)
(44)
HISKEST
ytseestj
ISNLQI
RNLQl!
MSNHQVfj:
.AJVI
MSNHQVJj;
A|VI
ilLRTQPT0AIPASlFTPS|
QMKTQET|AIE
[lLEAQPTIA
HLEAQPTfA
YMESQP
AS
S?
rMESQPTfST
VPGSKDE
LPGSKDEl
ILNEPEDE
ILNKPEDE
SLVSLNEPKDE
SLN
SLNEPKDE
20
20
19
19
16
19
19
Rat
Mouse
Goat
Cow
Llama
BCamel
ACamel
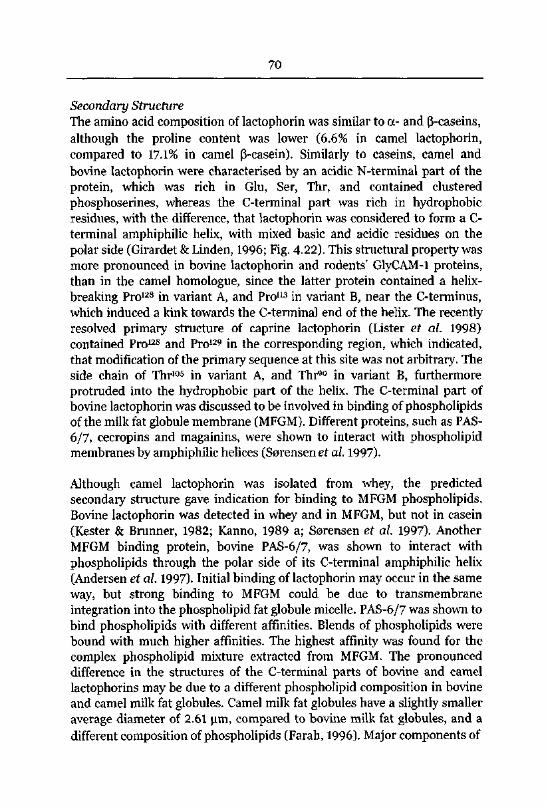
70
Secondary Structure
The amino acid composition of lactophorin was similar to a- and (3-caseins,
although the proline content was lower (6.6% in camel lactophorin,
compared to 17.1% in camel (3-casein). Similarly to caseins, camel and
bovine lactophorin were characterised by an acidic N-terminal part of the
protein, which was rich in Glu, Ser, Thr, and contained clustered
phosphoserines, whereas the C-terminal part was rich in hydrophobicresidues, with the difference, that lactophorin was considered to form a C-
terminal amphiphilic helix, with mixed basic and acidic residues on the
polar side (Girardet & Linden, 1996; Fig. 4.22). This structural property was
more pronounced in bovine lactophorin and rodents' GlyCAM-1 proteins,than in the camel homologue, since the latter protein contained a helix-
breaking Pro128 in variant A, and Pro113 in variant B, near the C-terminus,
which induced a kink towards the C-terminal end of the helix. The recentlyresolved primary structure of caprine lactophorin (Lister et al. 1998)
contained Pro128 and Pro129 in the corresponding region, which indicated,
that modification of the primary sequence at this site was not arbitrary. The
side chain of Thr105 in variant A, and Thr90 in variant B, furthermore
protruded into the hydrophobic part of the helix. The C-terminal part of
bovine lactophorin was discussed to be involved in binding of phospholipidsof the milk fat globule membrane (MFGM). Different proteins, such as PAS-
6/7, cecropins and magainins, were shown to interact with phospholipidmembranes by amphiphilic helices (Sorensen et al. 1997).
Although camel lactophorin was isolated from whey, the predicted
secondary structure gave indication for binding to MFGM phospholipids.Bovine lactophorin was detected in whey and in MFGM, but not in casein
(Kester & Brunner, 1982; Kanno, 1989 a; Sorensen et al. 1997). Another
MFGM binding protein, bovine PAS-6/7, was shown to interact with
phospholipids through the polar side of its C-terminal amphiphilic helix
(Andersen et al. 1997). Initial binding of lactophorin may occur in the same
way, but strong binding to MFGM could be due to transmembrane
integration into the phospholipid fat globule micelle. PAS-6/7 was shown to
bind phospholipids with different affinities. Blends of phospholipids were
bound with much higher affinities. The highest affinity was found for the
complex phospholipid mixture extracted from MFGM. The pronounceddifference in the structures of the C-terminal parts of bovine and camel
lactophorins may be due to a different phospholipid composition in bovine
and camel milk fat globules. Camel milk fat globules have a slightly smaller
average diameter of 2.61 urn, compared to bovine milk fat globules, and a
different composition of phospholipids (Farah, 1996). Major components of
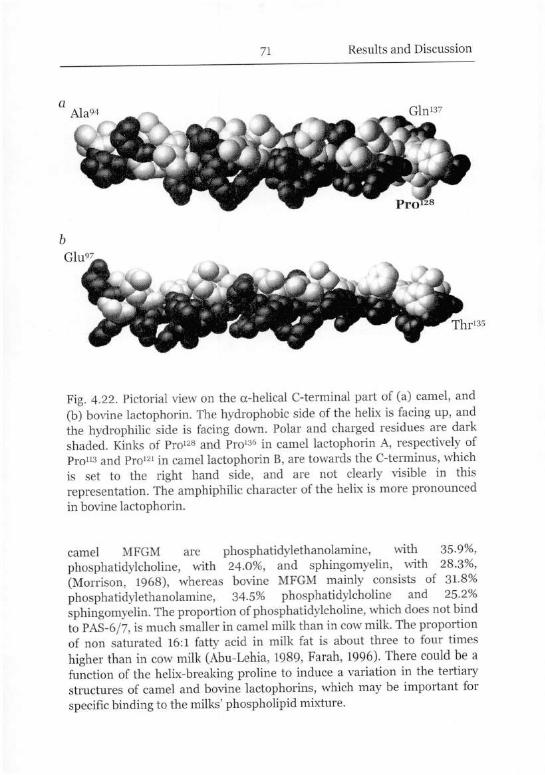
71 Results and Discussion
Fig. 4.22. Pictorial view on the a-hehcal C-terminal part of (a) camel, and
(b) bovine lactophorin. The hydrophobic side of the helix is facing up, and
the hydrophilic side is facing down. Polar and charged residues are dark
shaded. Kinks of Pro128 and Pro136 in camel lactophorin A, respectively of
Pro113 and Pro121 in camel lactophorin B, are towards the C-terminus, which
is set to the right hand side, and are not clearly visible in this
representation. The amphiphilic character of the helix is more pronounced
in bovine lactophorin.
camel MFGM are phosphatidylethanolamine, with 35.9%,
phosphatidylcholine, with 24.0%, and sphingornyelin, with 28.3%,
(Morrison, 1968), whereas bovine MFGM mainly consists of 31-8%
phosphatidylethanolamine, 34.5% phosphatidylcholine and 25-2%
sphingomyelin. The proportion of phosphatidylcholine, which does not bind
to PAS-6/7, is much smaller in camel milk than in cow milk. The proportion
of non saturated 16:1 fatty acid in milk fat is about three to four times
higher than in cow milk (Abu-Lehia, 1989, Farah, 1996). There could be a
function of the helix-breaking proline to induce a variation in the tertiary
structures of camel and bovine lactophorins, which may be important for
specific binding to the milks' phospholipid mixture.
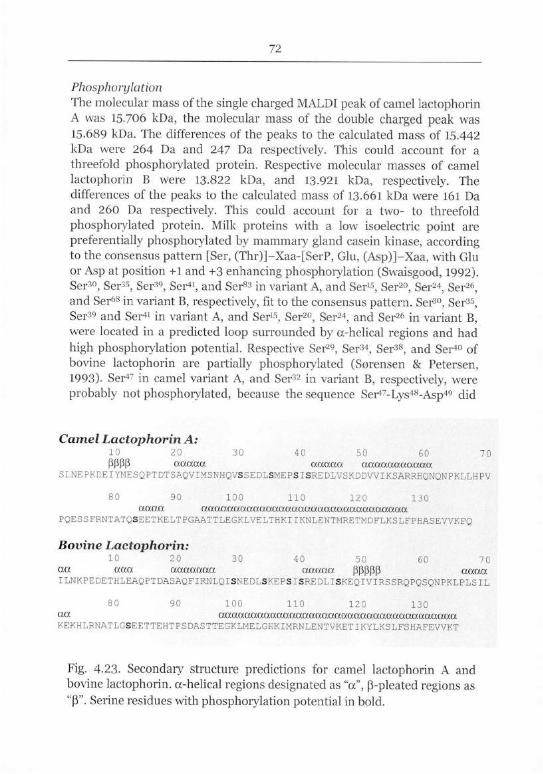
72
PhosphorylationThe molecular mass of the single charged MALDI peak of camel lactophorinA was 15-706 kDa, the molecular mass of the double charged peak was
15.689 kDa. The differences of the peaks to the calculated mass of 15.442
kDa were 264 Da and 247 Da respectively. This could account for a
threefold phosphorylated protein. Respective molecular masses of camel
lactophorin B were 13.822 kDa, and 13.921 kDa, respectively. The
differences of the peaks to the calculated mass of 13.661 kDa were 161 Da
and 260 Da respectively. This could account for a two- to threefold
phosphorylated protein. Milk proteins with a low isoelectric point are
preferentially phosphorylated by mammary gland casein kinase, accordingto the consensus pattern [Ser, (Thr)]-Xaa-[SerP, Glu, (Asp)]-Xaa, with Glu
or Asp at position +1 and +3 enhancing phosphorylation (Swaisgood, 1992).
Ser30, Ser35, Ser39, Ser*1, and Ser83 in variant A, and Ser15, Ser20, Ser2*, Ser26,and Ser68 in variant B, respectively, fit to the consensus pattern. Ser30, Ser35,Ser39 and Ser41 in variant A, and Ser15, Ser20, Ser24, and Ser26 in variant B,were located in a predicted loop surrounded by a-helical regions and had
high phosphorylation potential. Respective Ser29, Ser34, Ser38, and Ser40 of
bovine lactophorin are partially phosphorylated (Sorensen & Petersen,1993). Ser47 in camel variant A, and Ser32 in variant B, respectively, were
probably not phosphorylated, because the sequence Ser47-Lys48-Asp49 did
Camel Lactophorin A:10 20 30 40 50 60 70
PPPP aaacta aaaaa aaaaaaaaaaa
SLNEPKDEIYMESQPTDTSAQVIMSNHQVSSEDLSMEPSISREDLVSKDDVVIKSARRHQNQNPKLLHPV
80 90 100 110 120 130
aaaa aaaaaaaaaaaaaaaaaaaaaaaaaaaaaaaa
PQESSFRNTATQSEETKELTPGAATTLEGKLVELTHKIIKNLENTMRETMDFLKSLFPKASEVVKPQ
Bovine Lactophorin:10 20 30 40 50 60 70
acx aaa aaaaaaa aaaaa PPPPP aaaa
ILNKPEDETHLEAQPTDASAQFIRNLQISNEDLSKEPSISREDLISKEQIVIRSSRQPQSQNPKLPLSIL
80 90 100 110 120 130
act aaaaaaaaaaaaaaaaaaaaaaaaaaaaaaaaaaaaa
KEKHLRNATLGSEETTEHTPSDASTTEGKLMELGHKIMRNLENTVKETIKYLKSLFSHAFEVVKT
Fig. 4.23. Secondary structure predictions for camel lactophorin A and
bovine lactophorin. a-helical regions designated as "a", (3-pleated regions as
"P". Serine residues with phosphorylation potential in bold.
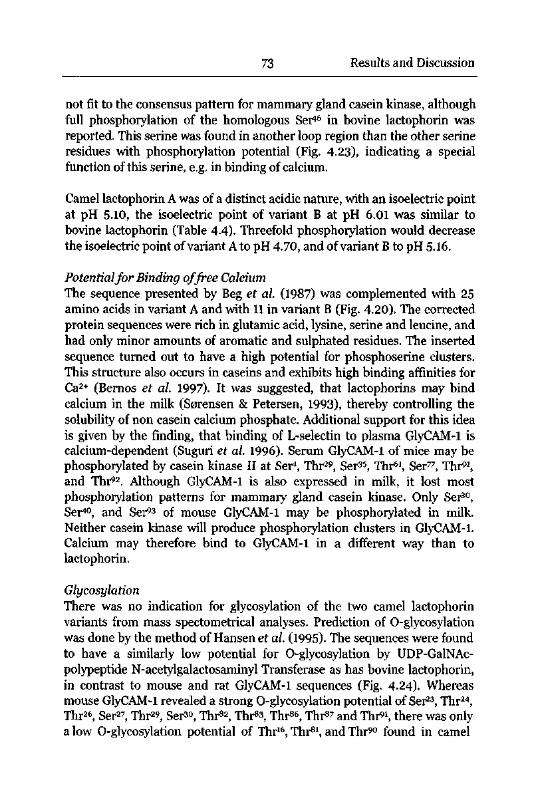
73 Results and Discussion
not fit to the consensus pattern for mammary gland casein kinase, althoughfull phosphorylation of the homologous Ser46 in bovine lactophorin was
reported. This serine was found in another loop region than the other serine
residues with phosphorylation potential (Fig. 4.23), indicating a specialfunction of this serine, e.g. in binding of calcium.
Camel lactophorin A was of a distinct acidic nature, with an isoelectric pointat pH 5.10, the isoelectric point of variant B at pH 6.01 was similar to
bovine lactophorin (Table 4.4). Threefold phosphorylation would decrease
the isoelectric point ofvariant A to pH 4.70, and ofvariant B to pH 5.16.
Potentialfor Binding offree Calcium
The sequence presented by Beg et al. (1987) was complemented with 25
amino acids in variant A and with 11 in variant B (Fig. 4.20). The corrected
protein sequences were rich in glutamic acid, lysine, serine and leucine, and
had only minor amounts of aromatic and sulphated residues. The inserted
sequence turned out to have a high potential for phosphoserine clusters.
This structure also occurs in caseins and exhibits high binding affinities for
Ca2+ (Bernos et al. 1997). It was suggested, that lactophorins may bind
calcium in the milk (Sorensen & Petersen, 1993), thereby controlling the
solubility of non casein calcium phosphate. Additional support for this idea
is given by the finding, that binding of L-selectin to plasma GlyCAM-1 is
calcium-dependent (Suguri et al. 1996). Serum GlyCAM-1 of mice may be
phosphorylated by casein kinase II at Ser4, Thr29, Ser35, Thr61, Ser77, Thr91,
and Thr92. Although GlyCAM-1 is also expressed in milk, it lost most
phosphorylation patterns for mammary gland casein kinase. Only Ser30,
Ser40, and Ser93 of mouse GlyCAM-1 may be phosphorylated in milk.
Neither casein kinase will produce phosphorylation clusters in GlyCAM-1.Calcium may therefore bind to GlyCAM-1 in a different way than to
lactophorin.
GlycosylationThere was no indication for glycosylation of the two camel lactophorinvariants from mass spectometrical analyses. Prediction of O-glycosylationwas done by the method of Hansen et al. (1995). The sequences were found
to have a similarly low potential for O-glycosylation by UDP-GalNAc-
polypeptide N-acetylgalactosaminyl Transferase as has bovine lactophorin,in contrast to mouse and rat GlyCAM-1 sequences (Fig. 4-24). Whereas
mouse GlyCAM-1 revealed a strong O-glycosylation potential of Ser23, Thr24,
Thr26, Ser27, Thr29, Ser30, Thr82, Thr83, Thr86, Thr87 and Thr91, there was onlya low O-glycosylation potential of Thr16, Thr81, and Thr90 found in camel
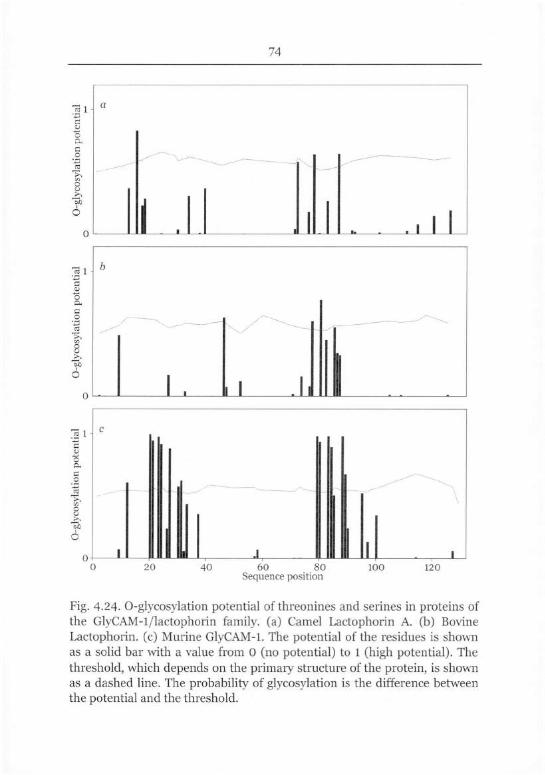
74
a
II i1 ., 1 1
b
1. 1 1 ll
e
1
ll1 -1 1 1
20 40 60 80
Sequence position
100 120
Fig. 4.24. O-glycosylation potential of threonines and serines in proteins of
the GlyCAM-1/lactophorin family, (a) Camel Lactophorin A. (b) Bovine
Lactophorin. (c) Murine GlyCAM-1. The potential of the residues is shown
as a solid bar with a value from 0 (no potential) to 1 (high potential). The
threshold, which depends on the primary structure of the protein, is shown
as a dashed line. The probability of glycosylation is the difference between
the potential and the threshold.
75 Results and Discussion
lactophorin A and of Ser54, Thr86 and Thr89 in bovine lactophorin. The
pattern Asn-Xxx-Ser/Thr, which is a prerequisite for N-glycosylation, and
which occurs and provokes glycosylation in the bovine variant at Asn77
(Girardet et al. 1995), was not found in camel lactophorin.
Relation to the Mucin-type Proteins
GlyCAM-1, a glycosylation dependent cell adhesion molecule found in blood
serum, is a ligand for lymphocyte L-selectin, which is expressed on highendothelial venules in peripheral lymph nodes and at sites of chronic
inflammation (Berg et al. 1998). It mediates the recruitment of lymphocytesfrom blood into these tissues as a soluble, probably multimeric, protein,with highly dynamic adhesion of the cells due to low affinity and rapidkinetics of selectin interactions (Nicholson et al. 1998). L-selectin, a proteinwith a lectin domain, has high affinity for mucins with multiple O-linked
carbohydrates of the lactosamin type. Binding depends on sialylation,sulfation and fucosylation. GlyCAM-1 was found to contain sulfated O-
linked carbohydrates of the type Sia-a(2->3)Gal-p(l-»4)Fuc-
oc(l-»3)GalNac. The same protein is also secreted in mouse milk (Dowbenko
et al. 1993; Nishimura et al. 1993), but with a different glycosylationstructure than in blood serum. GlyCAM-1 has much higher probability of
being glycosylated than lactophorins (Fig. 4.24). O-glycosylation of the
mouse homologue should be expected at 11 residues. Glycosylation of camel
lactophorin A was only expected at Thr16, whereas the bovine protein had
medium high probability of glycosylation at Thr89. Implications of
secondary and tertiary structures may favour or prevent glycosylation of
these sites (Fig 4.23). Bovine lactophorin was reported to be partially O-
glycosylated at Thr16, completely N-glycosylated at Asn77 and completely O-
glycosylated at Thr86 (Sorensen & Petersen, 1993). Camel lactophorin did
not reveal a recognition pattern Asn-Xaa-Thr for N-glycosylation, in
contrast to the bovine homologue. Analysis of mass spectroscopic data did
not give indication of glycosylation. Only two sharp peaks were present,which did not allow for glycosylation of either variant. Absence of
glycosylation rendered camel lactophorin less hydrophilic than other
proteins of the GlyCAM-1/lactophorin family. If lactophorin is bound to
MFGM by the C-terminal part, the glycosylated residues of bovine
lactophorin are likely to protrude into the milk serum and may help to
maintain a hydrophilic covering of the fat globules. This would help to
prevent aggregation of fat globules and binding to alveolar epithelial cells in
the udder by electric charge repulsion. Absence of glycosylation in camel
lactophorin may be compensated by a higher concentration of the protein in
the milk (Table 4.4), as compared to bovine lactophorin, to fulfil this
76
proposed function of lactophorin. Glycosylation of the bovine protein mayalso be part of infant protection against viral or bacterial infection. In a
similar way as the Tamm-Horsfall protein in urine, bovine lactophorin mayhelp to inhibit bacterial adhesion to host tissue (Sorensen & Petersen,
1993). Stimulation of the growth of bifidobacteria by bovine lactophorinwas also demonstrated (Girardet & Linden, 1996). Next to bacterial
infections, rotaviral infection is an important cause of infant diarrhoea,which can lead to death of the animal. The milk mucin complex was shown
to protect the infant by specific interaction with the virus, in a similar way
as intestinal mucins (Yolken et al. 1992, 1994). Lack of glycosylation in
camel milk lactophorin may indicate, that such functionality is not needed
in camel milk, perhaps because the danger of infection is lower in the dryclimate where camels live. To sum up, we suggest that the common function
of camel and bovine lactophorins in milk cannot depend on glycosylation of
the proteins. Camel lactophorin is also not likely to be expressed in blood
serum and to have a function similar to GlyCAM-1 proteins, since specificbinding to L-selectin would depend on glycosylation. It is not known at
present, if camels have a GlyCAM-1 related protein in blood serum with
high probability of glycosylation.
Protein Expression and Concentration in Camel Milk
Lactophorin was found to be the protein present at the second highestconcentration in camel whey. Only a-lactalbumin was found at higherconcentrations. The concentration of the proteins was calculated by peakarea integration at 220 nm. Total lactophorin was detected at a
concentration of about 950 mg l1 throughout the lactation period. The
relative amount of variant B in camel milk was about one quarter of
lactophorin A, as estimated by data from N-terminal sequencing, mass
spectroscopy and PCR products generated from cDNA.
Expression of GlyCAM-1 in milk was shown to depend on regulation by
glucocorticoid receptors and anti-sense RNA (Kawamura et al. 1987).
Furthermore, binding sites for mammary gland specific transcriptionfactors were found on the 5'-flanking region of the bovine lactophorin gene
(Johnsen et al. 1996, Girardet & Linden, 1996). This indicates, that the
expression of bovine lactophorin is regulated in a similar way as caseins.
Bovine lactophorin was found to be expressed specifically in the lactatingmammary gland (Johnsen et al. 1995; Groenen et al. 1995). A proteinconcentration of 300 mg H milk was reported (Johnsen et al. 1996). The
concentration of lactophorin was therefore higher in camel milk than in cow
milk.
77 Results and Discussion
OligomerisationBovine lactophorin was reported to be a complex of about 190 kDa
(Sorensen et al. 1997), which segregated to a complex of about 40 kDa upon
dissolution in 5 M guanidine hydrochloride (Ng et al. 1970). The highmolecular complex would account for a decamer, the low molecular
complex for a dimer. Camel lactophorin was found to have an apparent
mass of 15 kDa by SDS-PAGE and of about 30 kDa by Sephadex G-100
chromatography (Beg et al. 1987). A complex with a higher molecular mass
was not found. The protein was therefore probably dimerised in whey. A
model of GlyCAM-1 forming a dimer by association of the C-terminal helical
parts was proposed by Lasky et al. (1992). Dimerisation of bovine
lactophorin was proposed to occur in a similar way (Girardet & Linden,
1996).
Proteolytic CleavageBovine lactophorin was found to be susceptible for proteolytic cleavage by
plasmin at Arg^-Ser54, producing an 11 kDa and an 18 kDa fragment, as
judged by SDS-PAGE (Kanno & Ogawa, 1989; Sorensen & Petersen, 1993).
Proteolytic fragments of camel lactophorin were found in tiny amounts in
camel whey. A minute peak at 13.7 min (Fig. 4.17) probably contained the
hydrophilic N-terminal parts of both lactophorin variants, as judged by N-
terminal sequencing. Camel milk was shown to be low in plasmin activity(Baer et al. 1994). Either plasmin concentration in camel milk is low, or
plasmin is repressed by serine protease inhibitors, such as the putativetrypsin-type protease inhibitor whey acidic protein (WAP). Camel plasmin
may also have a different turnover rate than bovine plasmin. The amino
acid sequence at the site, where the bovine protein is cleaved, Lys54-Ser55 in
variant A, and Lys^-Ser40 in variant B, respectively, could be a target for
plasmin cleavage, but was found in a a-helical region, whereas the bovine
site was at the C-terminal end of a B-folded structure (Fig. 4.23). This
difference may render the site of camel lactophorin less susceptible for
proteolytic cleavage.
Inhibition ofLipolysisAn important function of lactophorin in milk seems to be the continued
maintenance of the fat dispersion. Early indication that proteose peptone
was the component responsible for milk foaming was given by Jelen (1973).
Strong foaming of whey depleted from main proteins and lactose was
observed, the foam quality was negatively affected by addition of calcium
hydroxide. Shimizu et al. (1989) showed, that the high emulsifying activityof proteose peptone component 3, which mainly consists of lactophorin,
78
was not negatively affected by extended heat treatment at 100 °C.
Emulsions remained stable from pH 3 to pH 9. Addition of 5 mM CaCk or
50 mM NaCl increased the emulsifying activity. The amount of adsorbed
bovine lactophorin was about 3 mg g4 oil in an experimental lipid-wateremulsion. Surface tension was reduced to a level below 25 mN irr1. The C-
terminal proteolytic product formed by plasmin, and probably containingan amphiphilic helix, did not adsorb strongly to the hydrophobic interface.
P-lactoglobulin was not able to reduce the surface tension to a similar level.
Lactophorin showed a much stronger adsorption to the lipid-water interface
than (i-lactoglobulin (Courthaudon et al. 1995). The fact that only intact
lactophorin was able to bind strongly to the lipid-water interface, and not its
proteolytic breakdown product, gave indication, that the N-terminal part of
the protein was important for conformational stabilisation of the
amphiphilic helix. It was interesting, that prolonged heat treatment did not
deteriorate the emulsifying activity of lactophorin. The absence of cysteines
may contribute to the thermostability of the protein. The higher amount of
lactophorin in camel milk, compared to cow milk, could partly be due to the
greater surface area of 2.29 m2 for 1 g of camel milk fat, compared to 1.79
m2 for cow milk fat.
Spontaneous lipolysis by lipoprotein lipase was demonstrated for milk
stored for several days at 4 °C (Girardet et al. 1993). Bovine lactophorin was
found to prevent the lipolytic action of porcine pancreatic lipase (PPL), a
serine lipase similar to lipoprotein lipase, by competitive adsorption to the
hydrophobic phase in a lipid-water emulsion and displacement of lipaseinto the aqueous phase. In this model system, the protein did not interact
directly with the lipase to exert this function (Girardet et al. 1993). PPL
cannot adsorb on a lipid-water interface at a surface tension between 20-30
mN nr1 in the absence of colipase. 50% inhibition of lipolytic activity was
achieved with a 6.7-fold higher (w/v) PP3 concentration compared to the
inhibitory effect of p-lactoglobulin. This would correspond to about a 3.4-
fold higher lactophorin concentration, if it is assumed, that about half of
PP3 consists of this active component. Both adsorptive proteins have
similar molecular masses. In the p-lactoglobulin/PPL-system, lipolytic
activity was fully restored upon addition of colipase, which binds PPL to the
hydrophobic phase, and low concentrations of different bile salts, e.g. 0.5
mM taurodeoxycholate. Lipolytic activity of PPL was only restored in the
lactophorin/PPL-system upon addition of colipase and 2 mM
taurodeoxycholate, reactivation with other bile salts was not possible. It was
concluded, that bovine lactophorin was more difficult to desorb from the
oil-water interface than p-lactoglobulin.
79 Results and Discussion
Lactophorin was shown to prevent lipolysis, in contrast to p-Cn-5P
f(l-105/7) ,also named PP5, a proteolytic breakdown product of (J-CN,
which seemed to activate lipolytic activity (Girardet & Linden, 1996). Since
it is known, that lipoprotein lipase is largely associated to casein micelles in
fresh milk, it can be considered that lactophorin prevents lipolysis of milk
fat in the mammary gland, and looses this function when digested by
plasmin and gut proteases, whereas PP5 stimulates lipoprotein lipase, when
formed during storage or digestion of milk, and accelerates milk fat uptakein this way. Interestingly, not only the potential lipase inhibitor lactophorinis found at higher levels in camel milk than in bovine milk, but also the
potential protease inhibitor whey acidic protein, a 12.5 kDa protein, which
is highly stimulated by glucocorticoids (Beg et al. 1986). A higher level of
natural preserving agents may bring about the longer storage life of raw
camel milk compared to raw cow milk (Farah, 1996).
ApplicationsThe camel protein is a glycosylation free and mono- or dimeric member of
the lactophorin/GlyCAM-1 family, which is easily purified in large
quantities from camel whey. This properties make the protein a goodsubstrate for functional characterisation, crystallisation and X-ray structure
analysis. Furthermore, the protein could be studied for its presumed
qualities as an emulsifying agent and inhibitor of lipolysis in food products,such as butter or ice cream.
4.4 Minor Whey Proteins
In this study, we focused on minor whey proteins with potential for
protection of the milk against microbial spoilage. There is a special interest
in the study of these proteins for prolongation of the storage time, and for
evaluation of the therapeutic potential of camel milk.
Antimicrobial Proteins in Milk
Milk is a foodstuff of high nutritional value. It serves the new-born as its
sole diet at a time when it is rapidly growing. Essential food components,such as vitamins, minerals, fat and proteins are available at high amounts.
This composition makes milk an ideal medium for growth of all sorts of
micro-organisms. The new-born, which does not have a working immune
system yet, has to be protected from infection, but also the udder of the
lactating animal. Contaminated milk would also be a good vector for the
transmission of disease germs from the heifer to the infant. Components are
80
thus required, which prevent or regulate the growth of micro-organisms in
the milk, the udder and the intestine of the new-born. Among others, these
factors may be specific proteins, fats, or minerals. Several antimicrobial
proteins were described in milk, such as lysozyme, immunoglobulins,lactoferrin and lactoperoxidase. Interest in whey proteins for commercial
use as natural antibacterial or antiviral agents in food and cosmetics has
increased during the past years. Different proteins are discussed as
prebiotic food supplements, which could regulate the microbial flora of the
intestine and activate the immune system. New chromatographic methods,
e.g. the Streamline system (Noppe et al. 1996), allow for large scale
purification of minor whey components. Main focus was thrown onto the
already mentioned, well characterised protective proteins. These proteinsare predominantly of basic nature, and are purified in a simple and cost-
effective procedure by cation exchange chromatography.
Camel milk is usually consumed as a raw or sour milk product, and is not
refrigerated or pasteurised. Processing technology, which guarantees a
constant hygienic quality of the milk, cannot be applied due to scarce of
investment capital. Hygienic problems arise from to the specialenvironment and the living conditions in semi arid areas, where camels are
usually kept (Abeiderrahmane & Reed, 1993). Brucellosis, trypanosomiasisand other diseases are latent dangers to the health of the herds, the
pastoralists and the consumers. Hence natural inhibition of pathogengrowth in milk is of importance.
Camel milk was frequently reported to have high antimicrobial activity, and
was shown to inhibit pathogen growth more than bovine milk (Elagamy et
al. 1992). Antimicrobial properties were partially attributed to well
characterised proteins, such as lactoferrin, lactoperoxidase, lysozyme and
immunoglobulin A. These proteins were shown to have higherconcentrations or higher activity in camel milk compared to bovine milk. In
this study we determined the basic physico-chemical and structural
parameters of lactoferrin and lactoperoxidase, of which the relationshipbetween structure and function is well characterised in human and bovine
counterparts. Lysozyme was not found in the milk studied, which may be
due to the fact, that the milk was from the end of the lactation period, and
the lysozyme concentration was shown to depend much on the lactation
stage (Barbour et al. 1984). Furthermore, a cDNA corresponding to
lysozyme was not found by screening with oligonucleotides derived from
conserved regions of the already known C-type lysozymes. We suppose, that
the lysozyme activity measured by other authors (Elagamy et al. 1996) has
81 Results and Discussion
to be assigned to other enzymes, e.g. to the Peptidoglycan RecognitionProtein, which is discussed in this thesis.
4.4.1 Peptidoglycan Recognition Protein
Literature
A novel protein family was described recently, which is involved in primaryimmune response of vertebrates and invertebrates on gram-positivebacteria and other invading organisms, such as nematodes, and works bynon-clonal pattern recognition (Yoshida et al. 1996; Kang et al. 1998).
Inactivation of pathogens probably occurs by binding to peptidoglycanstructures in bacterial cell walls, hence the name was given peptidoglycan
recognition proteins (PGRP). The protein was first described in pigschallenged with nematodes, and was weakly detected in neutrophils(Fornhem et al. 1996). Specific mRNA was detected in organs related to the
immune system of the vertebrate species Homo sapiens and Mus musculus,and of the invertebrate moth Trichoplusia ni, the cabbage looper. mRNA
was also detected in murine adenocarcinoma cell cultures from mammary
gland, whereby a relation to metastasis frequency was reported (Kustikovaet al. 1996). In a recent study, the murine protein was shown to induce
tumour cell apoptosis (Kiselev et al. 1998). The assignment tag7 protein,(tumour associated gene 7 protein), was given in cancer related studies for
PGRP. For ease of reading, we will refer to tag7 protein as PGRP. In this
thesis, we describe a closely related homologue of PGRP, which was isolated
from camel whey by heparin-sepharose chromatography, and probablyserves the same function of specific pathogen inhibition in camel milk. This
protein class was not yet found in milk. PGRP was found in higher amountsin camel milk than concentrations reported for other antibacterial proteins,such as lactoferrin, lactoperoxidase, or lysozyme. It possibly helps in
inactivation of gram-positive bacteria and other pathogens of camels.
Expression of the protein may be an adaptation to the special environment
in arid regions.
Primary Structure
A 19.110 kDa protein was eluted from heparin-sepharose. The N-terminal
sequence of the reverse phase purified protein was determined as Arg-Glu-Asp-
Pro-Pro-Ala-Cys-Gly-Ser-Ile. A full length cDNA clone of 700 bp,
corresponding to the N-terminal sequence was obtained (Fig 4.25;
EMBL/GenBank accession number AJ131676). The length of the 5'-
untranslated region was 24 bp, a partial Kozak-box (Kozak, 1989) in front of the
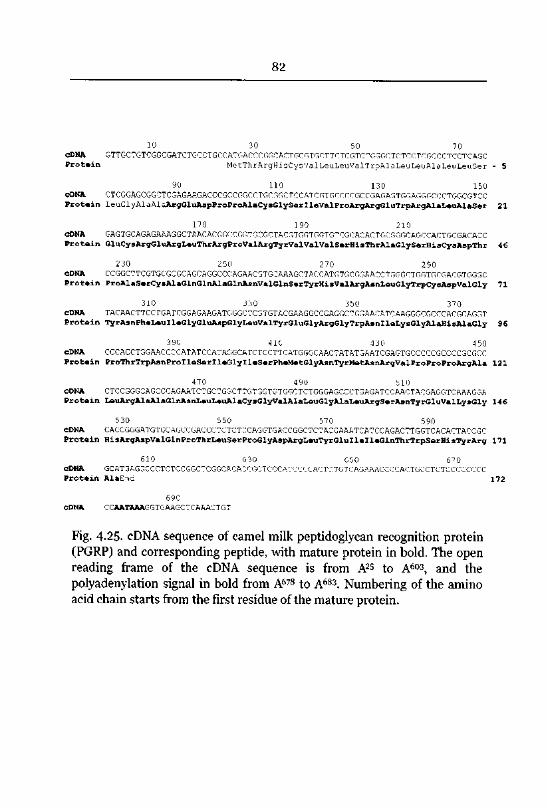
82
10 30 50 70
cDNA uTTGCTGTCGGCGATCTGCCTGCCATGAC^CGGCACTGCGTGCTTCTCGTCTCGGCTCTCCTCGCCCTCCTCAGC
Protein MetThrArgHisCysValLeuLeuValTrpAlaLeuLeuAlaLeuLeuSer - 5
90 110 130 150
cDNA CTCGGAGCGGCTCGAGAAGACCCGCCCGCCTGCGGCTCCATCGTGCCCCGCCGAGAGTGGAGGGCCCTGGCGTCCProtein LeuGlyAlaAlaArgGluAspProProAlaCysGlySerlleValProArgArgGluTrpArgAlaLeuAlaSer 21
170 190 210
cDNA GAGTGCAGAGAAAGGCTAACACGGCCGG-GCGCTACGTGGTGGTGTCGCACACTGL.GGGCAGCCACTGCGACACC
Protein GluCysArgGluArgLeuThrArgProValArgTyrValValValSerHisThrAlaGlySerHisCysAspThr 46
230 250 270 290
CDNA CCGGCTTCGTGCGCGCAGCAGGCCCAGAACGTGCAAAGGTACCATGTGCGGAACCTGGGCTGGTGCGACGTGGGC
Protein ProAlaSerCysAlaGlnGlnAlaGlnAsnValGlnSerTyrHisValArgAsnLeuGlyTrpCysAspValGly 71
310 330 350 370
CDNA TACAACTTCCTGATCGGAGAAGATCGGCTGGTGTACGAAGGCCGAGGCTGGAACATCAAGGGCGCCCACGCAGGT
Protein TyrAsnPheLeuIleGlyGluAspGlyLeuValTyrGluGlyArgGlyTrpAsnlleLysGlyAlaHlsAlaGly 96
390 410 430 450
cDNA CCCACCTGGAACCCCATATCGATACCCATCTCCTTGATGGGCAACTATATGAATCGAGTGCCCCCGCCCCGCGCC
Protein ProThrTrpAsnProIleSerlleGlylleSerPheMetGlyAsnTyrMetAsnArgValProProProArgAla 121
470 490 510
CDNA CTCCGGGCAGCCCAGAATCTGCTGCCT~G^GGTCTGGGTCTGGGAGCCCTGAGATCCAACTACGAGCTCAAAGGA
Protein LeuArgAlaAlaGlnAsnLeuLeuAlaCysGlyValAlaLeuGlyAlaLeuArgSerAsnTyrGluValLysGly 146
530 55C 570 590
CDNA CACCGGGATGTGCAGCCGACCCTClCTrCAGGTGArCGGCmCTACGAAATCACCAGACTTGGTCACACTACCGC
Protein HisArgAspValGlnProThrLeuSerProGlyAspArgLeuTyrGluIlelleGlnThrTrpSerHlsTyrArg 171
610 630 650 670
cDNA GCATGAGGCCCTCTCCGGCTCGGrACACrGGTCCrAT^CCArTCTCTCAGAAACCCCACTGCCTCTCCCCCCCC
Protein AlaEnd 172
690
CDNA CCAATAAAGGTGAAGCTCAAACTG"
Fig. 4.25. cDNA sequence of camel milk peptidoglycan recognition protein(PGRP) and corresponding peptide, with mature protein in bold. The open
reading frame of the cDNA sequence is from A25 to A603, and the
polyadenylation signal in bold from A678 to A683. Numbering of the amino
acid chain starts from the first residue of the mature protein.
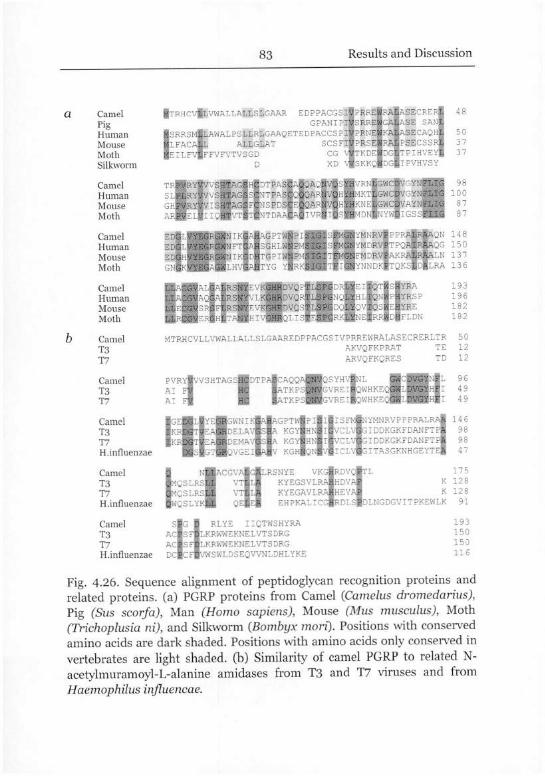
83 Results and Discussion
Camel
PigHuman
Mouse
Moth
Silkwoi m
Camel
Human
Mouse
Moth
Camel
Human
Mouse
Moth
Camel
Human
Mouse
Moth
Camel
T3
T7
Camel
T3
T7
Cimel
T3
T7
H influenzae
Camel
T3
T7
H influenzae
Camel
T3
T7
H influenzae
tJTRHCviLVWALLALLSLGAAR EDPPACGSl|DRRElHAtASECREPGPAN V SE SANl
[kAWALPSLLRLGAAQETEDPACC V ECAQHjALLGLAT SCar jrn o* n* SECSSP
FFVFVTVSGD CG vJJtKDeJdg|JTPIHVEYD XD v|sKKqIdg1i=VH;SY
TRpR*/VSl|AGiHtDTPASlA|QAQ|sup ooar
GH? QA1
ARJS i.V -Jk* a w -^«y Vi
|SR£Ier|h1t i,y
!YRA
HYRSP
HYR
] H DN
PVRYlvVSHTAGsWDTDAlrAOOAlBQSYHVJNLAI Fl HC S QNV REIBQWHKE
A Ff HC S QNV REI|QWHKEi
L0VGY E
LfcfolaY F
50
37
37
"LlG s8
LTG 0
L G 7
|TPQftHftQG 150
|AKRfijfe|ALN 137
!TQKS|D|LRA 136
MTRHCVLLVWALLALLSLGAARED = PACt,S V^RR wRALAStCRERLTR
AKVQFKPRAT TE
ARVQFKQP p TD
193
196
182
182
50
12
12
96
9
9
DG v CPwWNI
DG V <\||DELA'
DG « aHdEMA
OS SgtHqvgeij
:'-=fcNBACG
MQSLR
MQSLRSK
TOSLYK^I y *J
LRSNYE VKG
KYEGSVLRA
KYEGAVLRA
EHPKALICG
RLYE IIQTWSHYRA
ILKRWWEKNELVTSDRGLKRWWEKNELVTSDRG
VWSWLDSEQVVNLDHLYKE
|NYMNRVPPPRALRA| 14 6
iGIDDKGKFDANFTPJ 98
|giddkgkfdanftp| 98
GITASGKNHGEYTEi 47
|RDVQ|TL 175
IhDVaI K 128
IhEVaI K 12 8
|RDLS|DLNGDGVITPKEWLK 91
193
150
150
116
Fig 4 26 Sequence alignment of peptidoglvcan recognition proteins and
related proteins (a) PGRP proteins from Camel (Camelus dromedarius),
Pig (Sus scorfa), Man (Homo sapiens), Mouse (Mus musculus), Moth
(Tiichoplusia m), and Silkworm (Bombyx moif) Positions with conserved
amino acids are dark shaded Positions with amino acids onh conserved in
vertebrates are light shaded (b) Similarity of camel PGRP to related N-
acetylmuramoyl L alanine amidases from T3 and 17 viruses and from
Haemophilus influencae
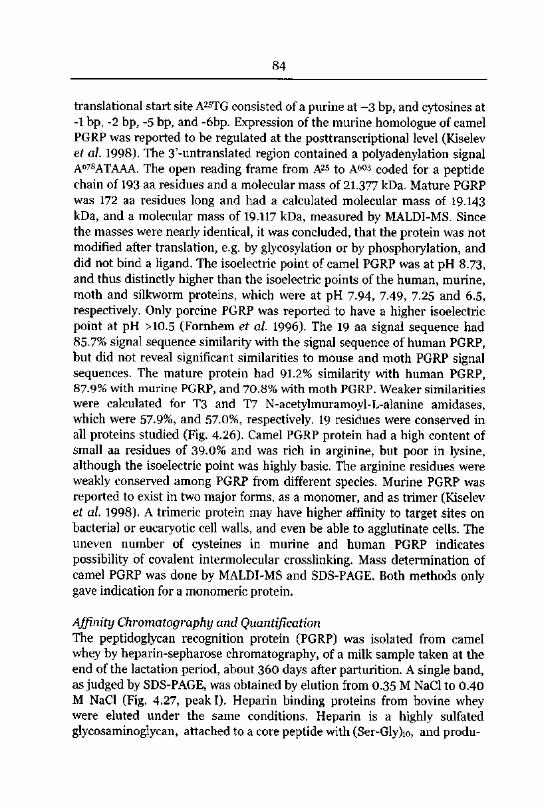
84
translational start site A25TG consisted of a purine at -3 bp, and cytosines at
-1 bp, -2 bp, -5 bp, and -6bp. Expression of the murine homologue of camel
PGRP was reported to be regulated at the posttranscriptional level (Kiselevet al. 1998). The 3'-untranslated region contained a polyadenylation signalA678ATAAA. The open reading frame from A25 to A603 coded for a peptidechain of 193 aa residues and a molecular mass of 21.377 kDa. Mature PGRP
was 172 aa residues long and had a calculated molecular mass of 19.143
kDa, and a molecular mass of 19.117 kDa, measured by MALDI-MS. Since
the masses were nearly identical, it was concluded, that the protein was not
modified after translation, e.g. by glycosylation or by phosphorylation, and
did not bind a ligand. The isoelectric point of camel PGRP was at pH 8.73,and thus distinctly higher than the isoelectric points of the human, murine,moth and silkworm proteins, which were at pH 7.94, 7.49, 7.25 and 6.5,
respectively. Only porcine PGRP was reported to have a higher isoelectric
point at pH >10.5 (Fornhem et al. 1996). The 19 aa signal sequence had
85.7% signal sequence similarity with the signal sequence of human PGRP,but did not reveal significant similarities to mouse and moth PGRP signalsequences. The mature protein had 91.2% similarity with human PGRP,87.9% with murine PGRP, and 70.8% with moth PGRP. Weaker similarities
were calculated for T3 and T7 N-acetylmuramoyl-L-alanine amidases,which were 57.9%, and 57.0%, respectively. 19 residues were conserved in
all proteins studied (Fig. 4.26). Camel PGRP protein had a high content of
small aa residues of 39.0% and was rich in arginine, but poor in lysine,although the isoelectric point was highly basic. The arginine residues were
weakly conserved among PGRP from different species. Murine PGRP was
reported to exist in two major forms, as a monomer, and as trimer (Kiselevet al. 1998). A trimeric protein may have higher affinity to target sites on
bacterial or eucaryotic cell walls, and even be able to agglutinate cells. The
uneven number of cysteines in murine and human PGRP indicates
possibility of covalent intermolecular crosslinking. Mass determination of
camel PGRP was done by MALDI-MS and SDS-PAGE. Both methods onlygave indication for a monomeric protein.
Affinity Chromatography and QuantificationThe peptidoglycan recognition protein (PGRP) was isolated from camel
whey by heparin-sepharose chromatography, of a milk sample taken at the
end of the lactation period, about 360 days after parturition. A single band,as judged by SDS-PAGE, was obtained by elution from 0.35 M NaCl to 0.40
M NaCl (Fig. 4.27, peak I). Heparin binding proteins from bovine wheywere eluted under the same conditions. Heparin is a highly sulfated
glycosaminoglycan, attached to a core peptide with (Ser-Gly)io, and produ-
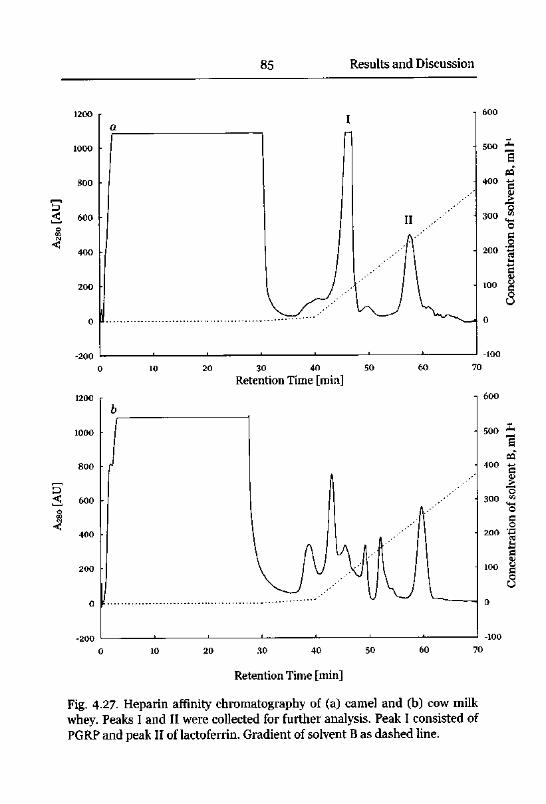
85 Results and Discussion
T 600
-200
20 30 40 50
Retention Time [min]
60
- 100
70
500
30 40 50 60 70
Retention Time [min]
Fig. 4.27. Heparin affinity chromatography of (a) camel and (b) cow milk
whey. Peaks I and II were collected for further analysis. Peak I consisted of
PGRP and peak II of lactoferrin. Gradient of solvent B as dashed line.
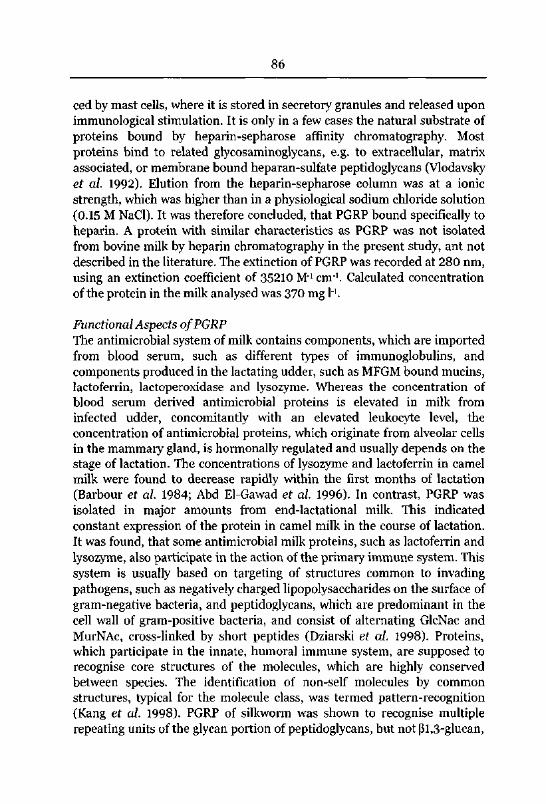
86
ced by mast cells, where it is stored in secretory granules and released upon
immunological stimulation. It is only in a few cases the natural substrate of
proteins bound by heparin-sepharose affinity chromatography. Most
proteins bind to related glycosaminoglycans, e.g. to extracellular, matrix
associated, or membrane bound heparan-sulfate peptidoglycans (Vlodavskyet al. 1992). Elution from the heparin-sepharose column was at a ionic
strength, which was higher than in a physiological sodium chloride solution
(0.15 M NaCl). It was therefore concluded, that PGRP bound specifically to
heparin. A protein with similar characteristics as PGRP was not isolated
from bovine milk by heparin chromatography in the present study, ant not
described in the literature. The extinction of PGRP was recorded at 280 nm,
using an extinction coefficient of 35210 M_1 cm1. Calculated concentration
of the protein in the milk analysed was 370 mg R
FunctionalAspects ofPGRP
The antimicrobial system of milk contains components, which are importedfrom blood serum, such as different types of immunoglobulins, and
components produced in the lactating udder, such as MFGM bound mucins,
lactoferrin, lactoperoxidase and lysozyme. Whereas the concentration of
blood serum derived antimicrobial proteins is elevated in milk from
infected udder, concomitantly with an elevated leukocyte level, the
concentration of antimicrobial proteins, which originate from alveolar cells
in the mammary gland, is hormonally regulated and usually depends on the
stage of lactation. The concentrations of lysozyme and lactoferrin in camel
milk were found to decrease rapidly within the first months of lactation
(Barbour et al. 1984; Abd El-Gawad et al. 1996). In contrast, PGRP was
isolated in major amounts from end-lactational milk. This indicated
constant expression of the protein in camel milk in the course of lactation.
It was found, that some antimicrobial milk proteins, such as lactoferrin and
lysozyme, also participate in the action of the primary immune system. This
system is usually based on targeting of structures common to invading
pathogens, such as negatively charged lipopolysaccharides on the surface of
gram-negative bacteria, and peptidoglycans, which are predominant in the
cell wall of gram-positive bacteria, and consist of alternating GlcNac and
MurNAc, cross-linked by short peptides (Dziarski et al. 1998). Proteins,
which participate in the innate, humoral immune system, are supposed to
recognise core structures of the molecules, which are highly conserved
between species. The identification of non-self molecules by common
structures, typical for the molecule class, was termed pattern-recognition(Kang et al. 1998). PGRP of silkworm was shown to recognise multiple
repeating units of the glycan portion of peptidoglycans, but not (31,3-glucan,
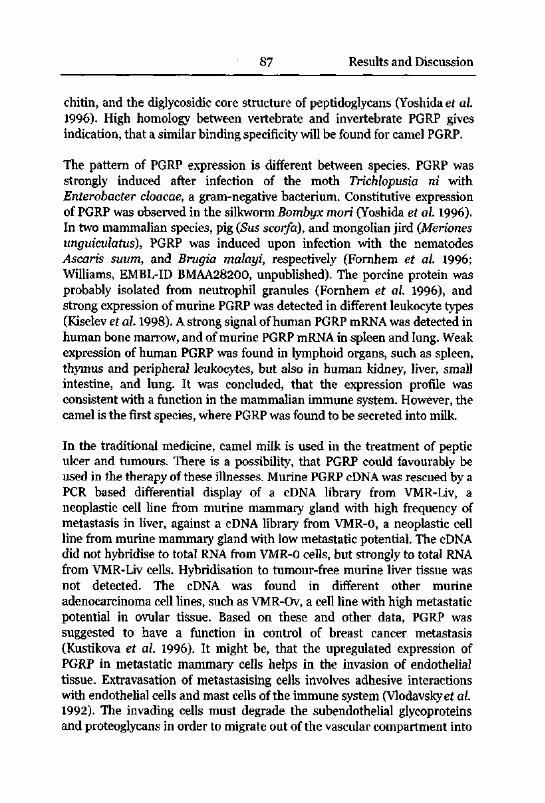
87 Results and Discussion
chitin, and the diglycosidic core structure of peptidoglycans (Yoshida et al.
1996). High homology between vertebrate and invertebrate PGRP givesindication, that a similar binding specificity will be found for camel PGRP.
The pattern of PGRP expression is different between species. PGRP was
strongly induced after infection of the moth Trichlopusia ni with
Enterobacter cloacae, a gram-negative bacterium. Constitutive expressionof PGRP was observed in the silkworm Bombyx mori (Yoshida et al. 1996).In two mammalian species, pig (Sus scorfa), and mongolian jird (Meriones
unguiculatus), PGRP was induced upon infection with the nematodes
Ascaris suum, and Brugia malayi, respectively (Fornhem et al. 1996;
Williams, EMBL-ID BMAA28200, unpublished). The porcine protein was
probably isolated from neutrophil granules (Fornhem et al. 1996), and
strong expression of murine PGRP was detected in different leukocyte types
(Kiselev et al. 1998). A strong signal of human PGRP mRNA was detected in
human bone marrow, and of murine PGRP mRNA in spleen and lung. Weak
expression of human PGRP was found in lymphoid organs, such as spleen,thymus and peripheral leukocytes, but also in human kidney, liver, small
intestine, and lung. It was concluded, that the expression profile was
consistent with a function in the mammalian immune system. However, the
camel is the first species, where PGRP was found to be secreted into milk.
In the traditional medicine, camel milk is used in the treatment of pepticulcer and tumours. There is a possibility, that PGRP could favourably be
used in the therapy of these illnesses. Murine PGRP cDNA was rescued by a
PCR based differential display of a cDNA library from VMR-Liv, a
neoplastic cell line from murine mammary gland with high frequency of
metastasis in liver, against a cDNA library from VMR-O, a neoplastic cell
line from murine mammary gland with low metastatic potential. The cDNAdid not hybridise to total RNA from VMR-0 cells, but strongly to total RNA
from VMR-Liv cells. Hybridisation to tumour-free murine liver tissue was
not detected. The cDNA was found in different other murine
adenocarcinoma cell lines, such as VMR-Ov, a cell line with high metastatic
potential in ovular tissue. Based on these and other data, PGRP was
suggested to have a function in control of breast cancer metastasis
(Kustikova et al. 1996). It might be, that the upregulated expression of
PGRP in metastatic mammary cells helps in the invasion of endothelial
tissue. Extravasation of metastasising cells involves adhesive interactions
with endothelial cells and mast cells of the immune system (Vlodavskyer al.
1992). The invading cells must degrade the subendothelial glycoproteinsand proteoglycans in order to migrate out of the vascular compartment into
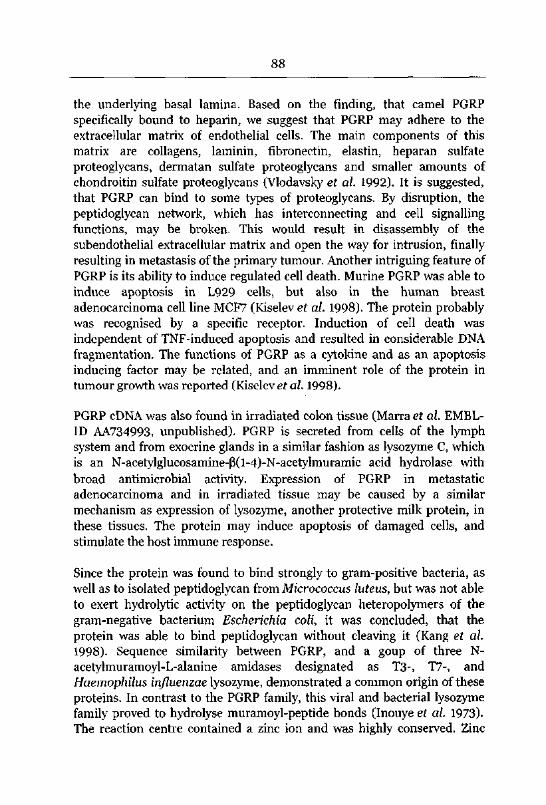
88
the underlying basal lamina. Based on the finding, that camel PGRP
specifically bound to heparin, we suggest that PGRP may adhere to the
extracellular matrix of endothelial cells. The main components of this
matrix are collagens, laminin, fibronectin, elastin, heparan sulfate
proteoglycans, dermatan sulfate proteoglycans and smaller amounts of
chondroitin sulfate proteoglycans (Vlodavsky et ah 1992). It is suggested,that PGRP can bind to some types of proteoglycans. By disruption, the
peptidoglycan network, which has interconnecting and cell signalling
functions, may be broken. This would result in disassembly of the
subendothelial extracellular matrix and open the way for intrusion, finally
resulting in metastasis of the primary tumour. Another intriguing feature of
PGRP is its ability to induce regulated cell death. Murine PGRP was able to
induce apoptosis in L929 cells, but also in the human breast
adenocarcinoma cell line MCF7 (Kiselev et ah 1998). The protein probablywas recognised by a specific receptor. Induction of cell death was
independent of TNF-induced apoptosis and resulted in considerable DNA
fragmentation. The functions of PGRP as a cytokine and as an apoptosisinducing factor may be related, and an imminent role of the protein in
tumour growth was reported (Kiselev et ah 1998).
PGRP cDNA was also found in irradiated colon tissue (Marra et ah EMBL-
ID AA734993, unpublished). PGRP is secreted from cells of the lymph
system and from exocrine glands in a similar fashion as lysozyme C, which
is an N-acetylglucosamine-P(l-4)-N-acetylmuramic acid hydrolase with
broad antimicrobial activity. Expression of PGRP in metastatic
adenocarcinoma and in irradiated tissue may be caused by a similar
mechanism as expression of lysozyme, another protective milk protein, in
these tissues. The protein may induce apoptosis of damaged cells, and
stimulate the host immune response.
Since the protein was found to bind strongly to gram-positive bacteria, as
well as to isolated peptidoglycan from Micrococcus luteus, but was not able
to exert hydrolytic activity on the peptidoglycan heteropolymers of the
gram-negative bacterium Escherichia coli, it was concluded, that the
protein was able to bind peptidoglycan without cleaving it (Kang et ah
1998). Sequence similarity between PGRP, and a goup of three N-
acetylmuramoyl-L-alanine amidases designated as T3-, T7-, and
Haemophilus influenzae lysozyme, demonstrated a common origin of these
proteins. In contrast to the PGRP family, this viral and bacterial lysozyme
family proved to hydrolyse muramoyl-peptide bonds (Inouye et ah 1973).
The reaction centre contained a zinc ion and was highly conserved. Zinc
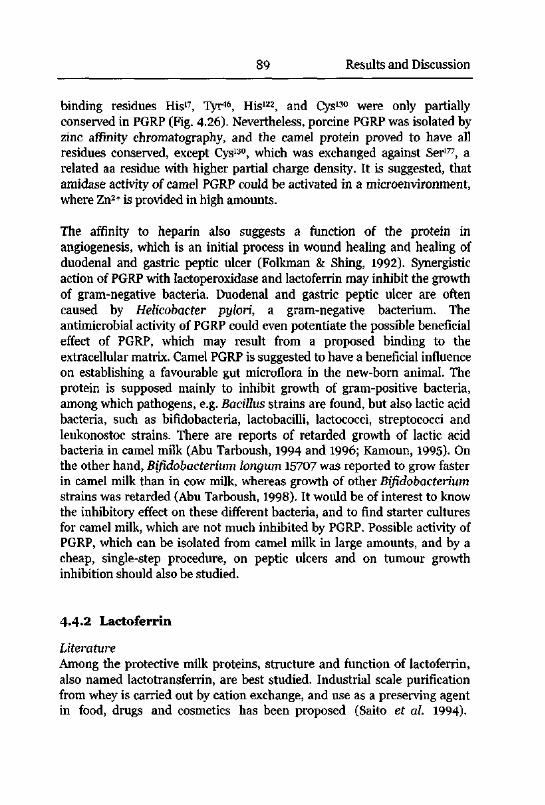
89 Results and Discussion
binding residues His17, Tyr46, His122, and Cys130 were only partiallyconserved in PGRP (Fig. 4.26). Nevertheless, porcine PGRP was isolated byzinc affinity chromatography, and the camel protein proved to have all
residues conserved, except Cys130, which was exchanged against Ser177, a
related aa residue with higher partial charge density. It is suggested, that
amidase activity of camel PGRP could be activated in a microenvironment,
where Zn2+ is provided in high amounts.
The affinity to heparin also suggests a function of the protein in
angiogenesis, which is an initial process in wound healing and healing of
duodenal and gastric peptic ulcer (Folkman & Shing, 1992). Synergisticaction of PGRP with lactoperoxidase and lactoferrin may inhibit the growthof gram-negative bacteria. Duodenal and gastric peptic ulcer are often
caused by Helicobacter pylori, a gram-negative bacterium. The
antimicrobial activity of PGRP could even potentiate the possible beneficial
effect of PGRP, which may result from a proposed binding to the
extracellular matrix. Camel PGRP is suggested to have a beneficial influence
on establishing a favourable gut microflora in the new-born animal. The
protein is supposed mainly to inhibit growth of gram-positive bacteria,
among which pathogens, e.g. Bacillus strains are found, but also lactic acid
bacteria, such as bifidobacteria, lactobacilli, lactococci, streptococci and
leukonostoc strains. There are reports of retarded growth of lactic acid
bacteria in camel milk (Abu Tarboush, 1994 and 1996; Kamoun, 1995). On
the other hand, Bifidobacterium longum 15707 was reported to grow faster
in camel milk than in cow milk, whereas growth of other Bifidobacteriumstrains was retarded (Abu Tarboush, 1998). It would be of interest to know
the inhibitory effect on these different bacteria, and to find starter cultures
for camel milk, which are not much inhibited by PGRP. Possible activity of
PGRP, which can be isolated from camel milk in large amounts, and by a
cheap, single-step procedure, on peptic ulcers and on tumour growthinhibition should also be studied.
4.4.2 Lactoferrin
Literature
Among the protective milk proteins, structure and function of lactoferrin,also named lactotransferrin, are best studied. Industrial scale purificationfrom whey is carried out by cation exchange, and use as a preserving agentin food, drugs and cosmetics has been proposed (Saito et al. 1994).
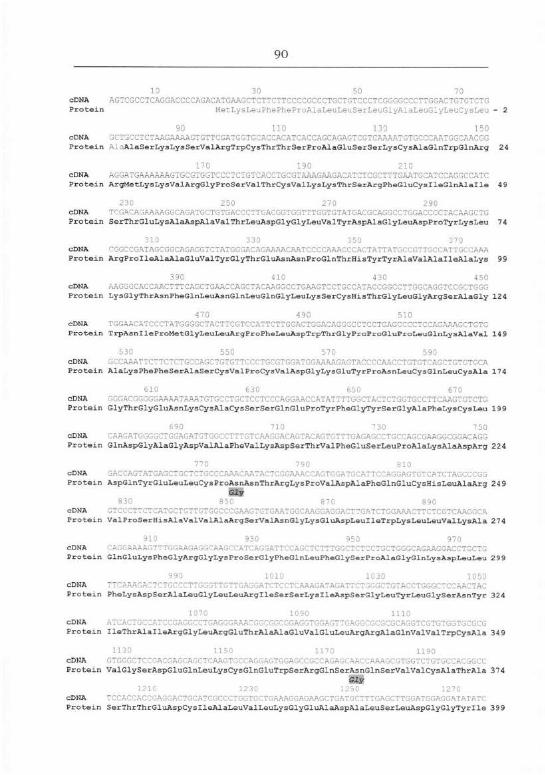
90
10 30 SO 70
cDNA AGTCGCCTCAGGACCCCAGACATGAAGCTCTTCTTCCCCGCCCTGCTGTCCCTCGGGGCCCTTGGACTGTGTCTG
Protein MetLysLeuPhePheProAlaLeuLeuSerLeuGlyAlaLeuGlyLeuCysLeu - 2
90 110 130 150
CDNA GGTGCCTCTAAGAAAAGTGTTCGATCGTGCACCACATCACCAGCAGAGTCGTCAAAATGTGCCCAATGGCAACGG
Protein AlBAlaSerLysLysSerValArgTrpCysThrThrSerProAlaGluSerSerLysCysAlaGlnTrpGlnArg 24
l_u 190 210
CDNA AGGATGAAAAAAGTGCGTGGTCCCTCTGTCACCTGCGTAAAGAAGACATCTCGCTTTGAATGCATCCAGGCCATC
Protein ArgMetLysLysValArgGlyProSerValThrCysValLysLysThrSerArgPheGluCysIleGlnAlalle 49
230 250 270 290
oDNA TCGACAGAAAAGGCAGATGCTGTGACCCTTGACGGTGGTTTGGTGTATGACGCAGGCCTGGACCCCTACAAGCTG
Protein SerThrGluLysAlaAspAlaValThrLeuAspGlyGlyLeuValTyrAspAlaGlyLeuAspProTyrLysLeu 74
jiO 330 J50 3-0
oDNA ^GGCCGATAGCGGCAGAGGTCTATGGGACAGAAAACAATCCCCAAACCCACTATTATGCCGTTGCCATTGCCAAA
Protein ArgProIleAlaAlaGluValTyrGlyThrGluAsnAsnProGlnThrHisTyrTyrAlaValAlalleAlaLys 99
390 410 430 450
cDNA AAGGGCACCAACTTTCAGCTGAACCAGCTACAAGGCCTGAAGTCCTGCCATACCGGCCTTGGCAGGTCCGCTGGG
Protein LysGlyThrAsnPheGlnLeuAsnGlnLeuGlnGlyLeuLysSerCysHisThrGlyLeuGlyArgSerAlaGly 124
470 490 510
oDNA TGGAACATCCCTATGGGGCTACTTCGTCCATTCTTGGACTGGACAGGGCCTCCTGAGCCCCTCCAGAAAGCTGTG
Protein TrpAsnlleProMetGlyLeuLeuArgProPheLeuAspTrpThrGlyProProGluProLeuGlnLysAlaVal 14 9
530 550 570 595
CDNA GCCAAATTCTTCTCTGGCAGCTGTGTTCCCTGCGTGGAIGGAAAAGAGTACCCCAACCTGTGTCAGCTGTGTGCA
Protein AlaLysPhePheSerAlaSerCysValProCysValAspGlyLysGluTyrProAsnLeuCysGlnLeuCysAla 174
610 630 650 670
CDNA GGGACGGGGGAAAATAAATGTGCCTGCTCCTCCCAGGAACCATATTTTGGCTACTCTGGTGCCTTCAAGTGTCTG
Protein GlyThrGlyGluAsnLysCysAlaCysSerSerGlnGluProTyrPheGlyTyrSerGlyAlaPheLysCysLeu 199
cDNA CAAGATGGCGCTGGAGATGTGGCCTTTCTCAACGACAGTACAGTGITTGAGAGCCTGCCAGC&AA&GCGGACAGG
Protein GlnAspGlyAlaGlyAspValAlaPheValLysAspSerThrValPheGluSerLeuProAlaLysAlaAspArg 224
770 790 810
CDNA GACCAGTATGAGGTGCTCTGCCCAAACAATACTCGGAAACCAGTGGATGCATTCCAGGAGTGTCATCTAGGCCGG
Protein AspGlnTyrGluLeuLeuCysProAsnAsnThrArgLysProValAspAlaPheGlnGluCysHisLeuAlaArg 24 9
Glyvj^ O^u 0~u O^C
cDNA GTCCCTTCTGATGCTGTTGTGGCCCGAAGTGTGAATGGCAAGGAGGACTTGATCTGGAAACTTCTCGTCAAGGCA
Protein ValProSerHisAlaValValAlaArgSerValAsnGlyLysGluAspLeuIleTrpLysLeuLeuValLysAla 274
910 930 950 970
oDNA CAGGAAAAGTTTGGAAGAGGCAAGrrATCAGGATTCCAGCTCTTTGGrTr^cCTGCTGGGCAGAAGGACGTGGTG
Protein GlnGluLysPheGlyArgGlyLysProSerGlyPheGlnLeuPheGlySerProAlaGlyGlnLysAspLeuLeu 299
990 1010 1030 1050
cDNA TTCAAAGACTCTGCCCTTGGGTTGTTGAGGATCTCCTCAAAGATAGATTCTGGGCTGTACCTGGGCTCCAACTAC
Protein PheLysAspSerAlaLeuGlyLeuLeuArglleSerSerLysIleAspSerGlyLeuTyrLeuGlySerAsnTyr 324
1070 1090 1110
cDNA ATCACTGCCATCCGAGGCCTGAGGGAAACGGCGGCGGAGGTGGAGTTCAGGCGCGCGCAGGTCGTGTGGTGCGCG
Protein IleThrAlalleArgGlyLeuArgGluThrAlaAlaGluValGluLeuArgArgAlaGlnValValTrpCysAla 349
1130 1150 1170 1190
cDNA GTGGGCTCCGACGAGCAGCTCAAGTGCCAGGAGTGGAGCCGCCAGAGCAACCAAAGCGTGGTCTGTGCCACGGCC
Protein ValGlySerAspGluGlnLeuLysCysGlnGluTrpSerArgGlnSerAsnGlnSerValValCysAlaThrAla 374
OlyitiG 1 „ <C
cDNA TCCACCACCGAGGACTGCATCGCCCTGGTGCTGAAAGGAGAAGCTGAT&CTTTGAGCTTGGATGGAGGATATATC
Protein SerThrThrGluAspCysIleAlaLeuValLeuLysGlyGluAlaAspAlaLeuSerLeuAspGlyGlyTyrlle 399
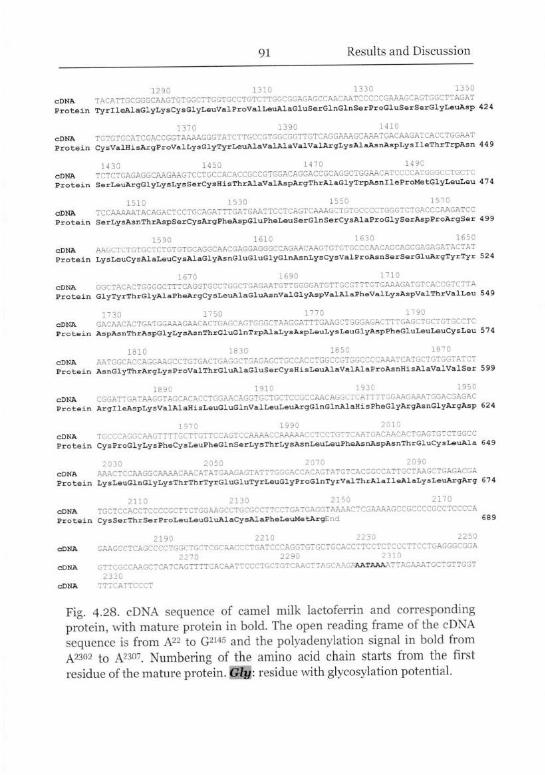
91 Results and Discussion
1290 1310 1330 1350
cDNA TACATTGCGGGCAAGTGTGGCTTGGTGCCTGTCTTGGCGGAGAGCCAACAATCCCCCGAAAGCAGTGGCTTAGATProtein TyrlleAlaGlyLysCysGlyLeuValProValLeuAlaGluSerGlnGlnSerProGluSerSerGlyLeuAsp 424
1370 1390 1410
cDNA TGTGTGCATCGACCGGTAAAAGGGTATCTTGCCGTGGCGGTTGTCAGGAAAGCAAATGACAAGATCACCTGGAATProtein CysValHisArgProValLysGlyTyrLeuAlaValAlaValValArgLysAlaAsnAspLysIleThrTrpAsn449
1430 145C i4^C
cDNA TCTCTCAGAGGCAAGAAGTCCTGCCACACCGCCGTGGACAGGACCGCAGGCTGGAACATCCCCATGCGCCTGCTCProtein SerLeuArgGlyLysLysSerCysHisThrAlaValAspArgThrAlaGlyTrpAsnlleProMetGlyLeuLeu 474
1510 1530 1550 1570
CDNA TCCAAAAATACAGACTCCTGCAGATTTGATGAATTCCTCAGTCAAAGCTGTGCCCCTGGGTCTGACCCAAGATCCProtein SerLysAsnThrAspSerCysArgPheAspGluPheLeuSerGlnSerCysAlaProGlySerAspProArgSer 4 99
1590 161u lojG _„;„
CDNA AAGCTCTGTGCTCTGTGTGCAGGCAACGAGGAGGGCCAGAACAAGTGTGTGCCCAACAGCAGCGAGAGATACTAT
Protein LysLeuCysAlaLeuCysAlaGlyAsnGluGluGlyGlnAsnLysCysValProAsnSerSerGluArgTyrTyr 524
1670 1690 1710
CDNA GGCTACACTGGGGCTTTCAGGTGCCTGGCTGAGAATGTTGGGGATGTTGCCTTTGTGAAAGATGTCACCGTCTTAProtein GlyTyrThrGlyAlaPheArgCysLeuAlaGluAsnValGlyAspValAlaPheValLysAspValThrValLeu 54 9
1730 1750 1770 l^yu
cDNA GACAACACTGATGGAAAGAACACTGAGCAGTGGGCTAAGGATTTGAAGCTGGGAGACTTTGAGCTGCTGTGCCTCProtein AspAsnThrAspGlyLysAsnThrGluGlnTrpAlaLysAspLeuLysLeuGlyAspPheGluLeuLeuCysLeu 574
ldiu 1830 1850 1870
cDNA aATGGCACCAGGAAGCCTGTGACTGAGGCTGAGAGCTGCCACCTGGCCGTGGCCCCAAATCATGCTGTGGTAT'-T
Protein AsnGlyThrArgLysProValThrGluAlaGluSerCysHisLeuAlaValAlaProAsnHisAlaValValSer 599
1890 1910 1930 1950
cDNA CGGATTGATAAGGTAGCACACCTGGAACAGGTGCTGCTCCGCCAACAGGCTCATTTTGGAAGAAATGGACGAGACProtein ArglleAspLysValAlaHisLeuGluGlnValLeuLeuArgGlnGlnAlaHlsPheGlyArgAsnGlyArgAsp 624
cDNA T^-CCCAGGCAA^TTT/TGCTTGTIGCA^TCCAAAnCCAAAAnCCTCCTGTTGAATGACAACACTGACTCTCTCCCCProtein CysProGlyLysPheCysLeuPheGlnSerLysThrLysAsnLeuLeuPh&AsnAspAsnThrGluCysLeuAla 649
2030 2050 2070 2090
CDNA AAACTCCAAGGCAAAACAACATATGAAGAGTATTTGGGACCACAGTATGTCACGGCCATTGCTAAGCTGAGACGA
Protein LysLeuGlnGlyLysThrThrTyrGluGluTyrLeuGlyProGlnTyrValThrAlalleAlaLysLeuArgArg 674
cDNA TGCTCCACCTCCCCGCTTCTGGAAGCCTGCGCCTTCCTGATGAGGTAAAACTCGAAAAGCCGCCCCGCCTCCCCA
Protein CysSerThrSerProLeuLeuGluAlaCysAlaPheLeuMetArgEnd 689
2190 2210 2230 2250
cDNA GAAGCCTCAGCCCCTGGCTGCTCGCAACCCTGATCCCAGGTGTGCTGCACCTTCCTCTCCCTTCCTGAGGGCGGA2270 2290 2310
cDNA GTTCGCCAAGCTCATCAGTTTTCACAATTCCCTGCTGTCAACTTAGCAAGAAATAAAATTAGAAATGCTGTTGGT2330
cDNA TTTCATTCCCT
Fig. 4.28. cDNA sequence of camel milk lactoferrin and corresponding
protein, with mature protein in bold. The open reading frame of the cDNA
sequence is from A22 to G2145 and the polyadenylation signal in bold from
A2302 to A2307. Numbering of the amino acid chain starts from the first
residue of the mature protein. PQf: residue with glycosylation potential.
92
Lactoferrin belongs to the family of transferrins, together with blood
serotransferrin (siderophilin), egg white ovotransferrin (conalbumin),melanotransferrin of malignant melanoms, the porcine inhibitor of carbonic
anhydrase, and other proteins. The common property of this protein familyis the binding of two metal cations, preferably Fe3*, at structurally closelyrelated binding sites. Most proteins of the transferrin type are needed for
storage or transport of iron. Lactoferrin was discussed to serve for iron
scavenging in body secretions (Brock, 1997). It is found in milk and
different other body secretions, and in neutrophil leukocytes (Masson,
1970).
Primary Structure
PCR amplification products of a full length cDNA clone of camel lactoferrin
were sequenced (Fig. 4-28; EMBL/GenBank accession number
AJ131674). The clone was 2336 bp long, and contained a 5'-untranslated
region of 21 bp and a 3'-untranslated region of 191 bp. The 5'-untranslated
region contained a partial Kozak-box (Kozak, 1989) in front of the
translational start site A22TG, with a purine at -3 bp, and cytosines at -1 bp,-5 bp and -8 bp. The 3'-untranslated region contained a polyadenylationsignal A2W2ATAAA. The open reading frame ranged from A22 to G2145, and
coded for a polypeptide of 707 aa residues. The start site of the mature
protein was determined by similarity as Ala1. The 19 aa signal peptide had
94.7% sequence similarity to the signal sequence of bovine lactoferrin, and
84.2% to the signal sequence of human lactoferrin. Mature lactoferrin was
689 aa residues long and the unmodified peptide had a molecular weight of
75.250 kDa (Table 4.3). The isoelectric point of the unmodified peptide wasat pH 8.14. The protein shared 91.6% sequence similarity with bovine and
with human lactoferrin, and 91.3% with porcine lactoferrin. High similarityin primary structures indicated, that there were only small variations in
functional aspects.
GlycosylationN-linked glycans contribute about 4% to 11% (3 to 9 kDa) to the total mass
of bovine lactoferrin, which is about 80 kDa (Spiked al. 1994). Glycosylationenhances the solubility of the secreted protein and may help to bind at
specific cell types, such as liver parenchymal cells (Ziere et al. 1993). Camel
milk lactoferrin was found to contain 6.2% carbohydrates in colostral milk
and 5-6% in milk collected 15 to 30 days after parturition (Mahfouz et al.
1997). The content of N-acetyl-glucosamine in camel milk lactoferrin was
markedly higher than in ruminants' milk lactoferrins (3.35% in colostral
camel milk compared to about 1.75% in colostral ruminants' milk). The
93 Results and Discussion
carbohydrate content of lactoferrin from end-lactational milk was 6.2%-
6.8% of total protein mass, calculated as a difference between the proteinmass measured by MALDI-MS and the protein mass of the amino acid
sequence (Table 4.3). Possible glycosylation sites, based on pattern analysis
(Gavel & Von Heijne, 1990), are Asn233, Asn366, Asn518 and Asn575. In bovine
lactoferrin, three of five sites with N-glycosylation potential, Asn368, Asn476,and Asn545, are glycosylated, and contribute to an overall carbohydratecontent of 11.2%. Glycosylation of bovine lactoferrin was only found at the
C-lobe. Degree of glycosylation in human lactoferrin is about 6.40% (Spikeral. 1994), and thus similar to camel lactoferrin. Human lactoferrin contains
2 glycosylated sites, Asn138 and Asn479, with glycans of the N-
acetyllactosaminic type, which were also found in camel lactoferrin. By
comparison with bovine and human lactoferrin, glycosylation of Asn366, and
Asn518 or Asn575, in camel lactoferrin is proposed (Fig. 4.28).
Concentration in Camel Milk
Colostral camel milk was reported to have an extremely high lactoferrin
content of 5.10 g l"1 on the second day after parturition, compared to about
0.50 g l"1 in bovine colostral milk. After 30 days of milking, the lactoferrin
level in camel milk went down to 0.34 g l"1, whereas in bovine milk, onlyabout 0.06 g H were found (Abd El-Gawad et al. 1996). In our studies, we
used an extinction coefficient of 84540 M_1 cnr1 at 280 nm to calculate a
lactoferrin concentration of 0.22 g 1_1 in a milk sample, which was taken at
the end of the lactation period, 360 days after parturition. In a sample of
pooled cow milk, lactoferrin concentration was 0.14 g r1. If it is assumed,that the main function of lactoferrin in milk is inhibition of bacterial
growth, a differently composed microflora in the gut of the new-born could
be a reason for the apparently higher lactoferrin concentration in camel
milk.
Iron Content
Lactoferrin of colostral camel milk was reported to have a low iron
saturation of 9%, similar to lactoferrin of bovine colostral milk. In milk
taken 15 to 30 days after parturition, camel lactoferrin was nearly
completely iron saturated. Similar results were found for bovine lactoferrin
from milk of the same lactational stage (Mahfouz et al. 1997).
Tertiary Structure and Ligand BindingTransferrins are monomeric, structurally highly conserved proteins, nearlyidentical in secondary and tertiary structure, and with high homology of
disulphide bonding (Schanbacher et al. 1993). Camel and bovine lactoferrin
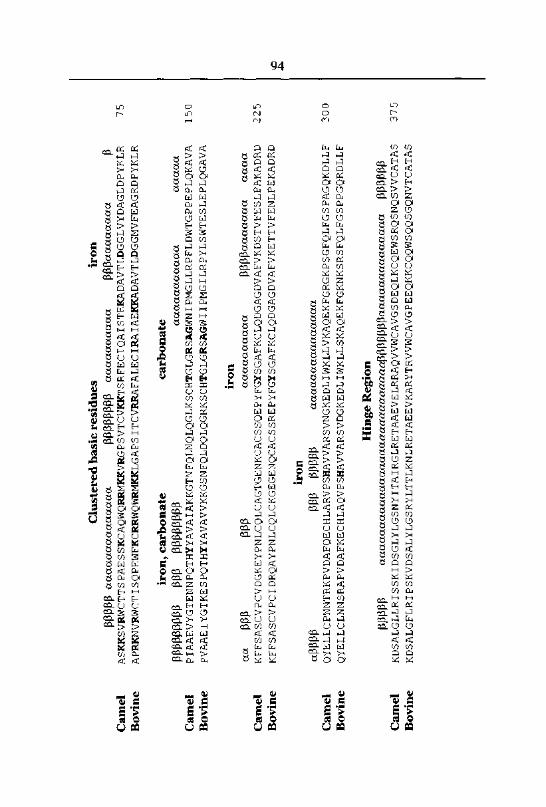
KDSALGFLRIPSKVDSALYLGSRYLTTLKNLRETAEEVKARYTRVVWCAVGPEEQKKCQQWSQQSGQNVTCATAS
537
KDSALGLLRISSKIDSGLYLGSNYITAIRGLRETAAEVELRRAQVVWCAVGSDEQLKCQEWSRQSNQSVVCATAS
PPPPPP
aaaaaaaaaaaaaaaaaaaaoraaaaaaapppppppaaaaaaaaaaaaaa
PPPPP
Region
Hinge
Bovine
Camel
4i
QYELLCLNNSRAPVDAFKECHLAQVPSHAWARSVDGKEDLIWKLLSKAQEKFGKNKSRSFQLFGSPPGQRDLLF
Bovine
030
QYELLCPNNTRKPVDAFQECHLARVPSHAVVARSVNGKEDLIWKLLVKAQEKFGRGKPSGFQLFGSPAGQKDLLF
Camel
aaaaaaaaaaaaaaa
PPPPP
PPP
apppp
iron
KFFSASCVPCIDRQAYPNLCQLCKGEGENQCACSSREPYFGYSGAFKCLQDGAGDVAFVKETTVFENLPEKADRD
Bovine
522
KFFSASCVPCVDGKEYPNLCQLCAGTGENKCACSSQEPYFGYSGAFKCLQDGAGDVAFVKDSTVFESLPAKADRD
Camel
aaaa
ppppaaaaaaa
aaaaaaaaaa
ppp
ppp
aa
iron
PVAAEIYGTKESPQTHYYAVAVVKKGSNFQLDQLQGRKSCHTGLGRSAGWIIPMGILRPYLSWTESLEPLQGAVA
15C
PIAAEVYGTENNPQTHYYAVAIAKKGTNFQLNQLQGLKSCHTGLGRSAGWNIPMGLLRPFLDWTGPPEPLQKAVA
aaaaa
aaaaaaaaaaa
PPPPPPPP
PPP
PPPPPPPPP
carbonate
carbonate
iron,
Bovine
Camel
75
APRKNVRWCTISQPEWFKCRRWQWRMKKLGAPSITCVRRAFALECIRAIAEKKADAVTLDGGMVFEAGRDPYKLR
ASKKSVRWCTTSPAESSKCAQWQRRMKKVRGPSVTCVKKTSRFECIQAISTEKADAVTLDGGLVYDAGLDPYKLRP
pppaaaaaaaa
aaaaaaaaaa
pppppppp
aaaaaaaaaaaaaa
PPPPP
iron
residues
basic
Clustered
Bovine
Camel
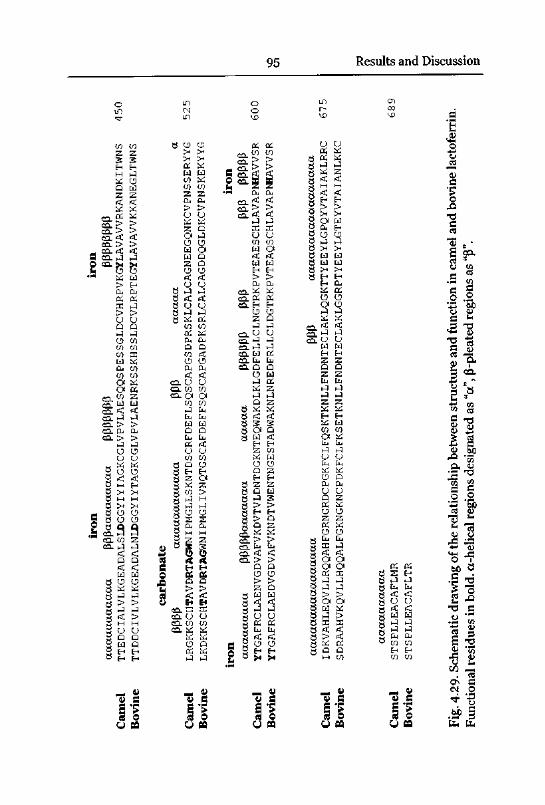
3OGo
"(J"
.as
regi
ons
(3-pleated
"ct",
as
desi
gnat
edregions
a-helical
bold,
in
residues
Functional
lactoferrin.
bovine
and
camel
in
function
and
structure
between
rela
tion
ship
the
of
drawing
Schematic
4.29.
Fig.
a.3CO
689
STSPLLEACAFLTR
Bovine
stsplleacaflmr
Camel
aaaaaaaaaa
675
sdraahvkqvllhqqalfgkngkncpdkfclfksetknllfndnteclaklggrptyeeylgteyvtaianlkkc
Bovine
idkvahleqvllrqqahfgrngrdcpgkfclfqsktknllfndnteclaklqgkttyeeylgpqyvtaiaklrrc
Camel
aaaaaaaaaaaaaaaaa
PPP
aaaaaaaaaaaaaaaa
YTGAFRCLAEDVGDVAFVKNDTVWENTNGESTADWAKNLNREDFRLLCLDGTRKPVTEAQSCHLAVAPNHAVVSR
Bovine
060
YTGAFRCLAENVGDVAFVKDVTVLDNTDGKNTEQWAKDLKLGDFELLCLNGTRKPVTEAESCHLAVAPNHAVVSR
Camel
PPPPP
PPP
PPP
PPPPPP
aaaaa
PPPPPaaaaaaa
aaaaaaaaa
iron
iron
525
LKDKKSCHTAVDRTAGWNIPMGLIVNQTGSCAFDEFFSQSCAPGADPKSRLCALCAGDDQGLDKCVPNSKEKYYG
Bovine
LRGKKSCHTAVDRTAGWNIPMGLLSKNTDSCRFDEFLSQSCAPGSDPRSKLCALCAGNEEGQNKCVPNSSERYYG
Camel
aaaaaa
ppp
aaaaaaaaaaaa
PPPP
carbonate
TTDDCIVLVLKGEADALNLDGGYIYTAGKCGLVPVLAENRKSSKHSSLDCVLRPTEGYLAVAVVKKANEGLTWNS
Bovine
50
4TTEDCIALVLKGEADALSLDGGYIYIAGKCGLVPVLAESQQSPESSGLDCVHRPVKGYLAVAVVRKANDKITWNS
Camel
PPPPPPPP
ppppppfj
PPPaaaaaaaaa
aaaaaaaaaaa
iron
iron
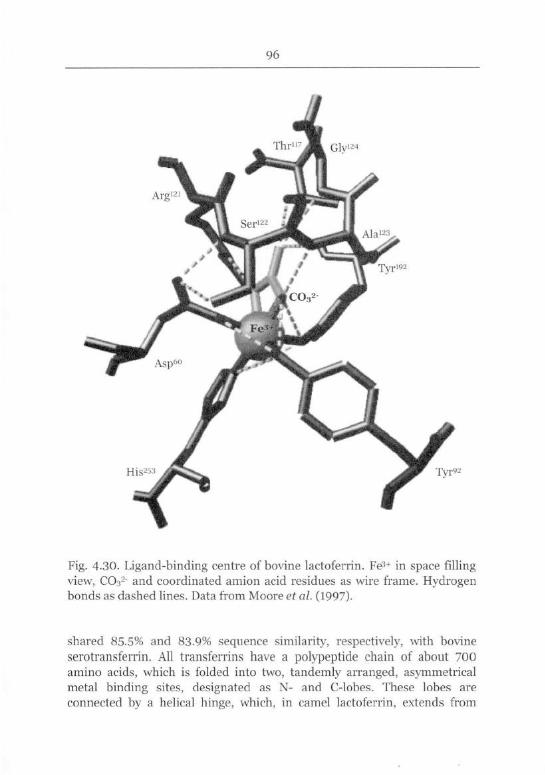
96
Fig. 4.30. Ligand-binding centre of bovine lactoferrin. Fei+ in space fillingview, CO32- and coordinated amion acid residues as wire frame. Hydrogenbonds as dashed lines. Data from Moore et al. (1997).
shared 85.5% and 83.9% sequence similarity, respectively, with bovine
serotransferrin. All transferrins have a polypeptide chain of about 700
amino acids, which is folded into two, tandemly arranged, asymmetricalmetal binding sites, designated as N- and C-lobes. These lobes are
connected by a helical hinge, which, in camel lactoferrin, extends from
97 Results and Discussion
Glu333 to Gin344 (Fig. 4.29). The sequence of the N-lobe, which extends from
Val6 to Arg332, shares 75.7% sequence similarity with the sequence of the C-
lobe, which ranges from Val345 to Arg673, probably as a result of gene
duplication. The two lobes were reported to bind iron synergistically, but
the C-lobe was found to have a lower dissociation constant than the N-lobe
(Baker et al. 1994). Both lobes are folded into two domains, which form a
cleft, where the metal cation is bound. Under physiological conditions,
transferrins bind two Fe3* cations with low dissociation constants of about
10"20 (Brock, 1997). Cation binding requires synergistic binding of a
bicarbonate anion, probably for charge compensation. In bovine and camel
lactoferrin, the side chains of Asp60, Tyr92, Tyr192 and His253 were found to
be involved in binding of the cation in the N-lobe (Fig 4.30). Two oxygens
from the bidentate CO32" anion are suggested to complete a distorted
octahedral geometry (Anderson et al. 1989). In the N-lobe, the side chains
of Tyr92, Thr117, Arg121, and Tyr192, and two backbone hydrogens of Ala123 and
Gly124, were found to be involved in binding of the bicarbonate anion. The
binding sites appeared to be optimised for the binding of Fe34- and CO32",
with respect to size, charge and stereochemistry. The iron affinity of
lactoferrins is about 300 times higher than the affinity of serotransferrins.
Lactoferrin retains its iron binding potential at pH values below pH 5.5, and
even in the presence of citrate, in contrast to the other known transferrins
(Brock, 1997). The binding sites of bovine and camel lactoferrin were found
to be highly similar. Considering the nearly identical structural geometry,
we assume that cations are bound by both, N- and C-lobe of the camel
protein, with similar affinities as in bovine lactoferrin.
Bacteriostatic Activity ofthe N-terminal EndA high amount of Arg and Lys are clustered at the N-terminal end of
lactoferrin, near and between a loop, which is formed by disulphide bondingof Cys19 and Cys36 (Fig. 4.31). The N-terminus of human and bovine
lactoferrin was found to have strong bacteriostatic activity on gram-negativebacteria, as a result of non-specific binding to the negatively charged outer
bacterial membrane, and subsequent release of lipopolysaccharides, therebyaltering the permeability properties. The N-terminal end of human
lactoferrin was shown to be the binding site of heparin, lipid A moiety of
bacterial lipopolysaccharides, human lysozyme and DNA, the latter with
distinct sequence preference (Van Berkel et al. 1997; Furmanski et al. 1997).These binding affinities were equally high for diferric lactoferrin and iron
depleted apolactoferrin. The N-terminal part of camel lactoferrin contained
13 basic residues (Fig. 4.29), at sites more similar to bovine lactoferrin than
to human lactoferrin. The isoelectric point of the N-terminal fragment from
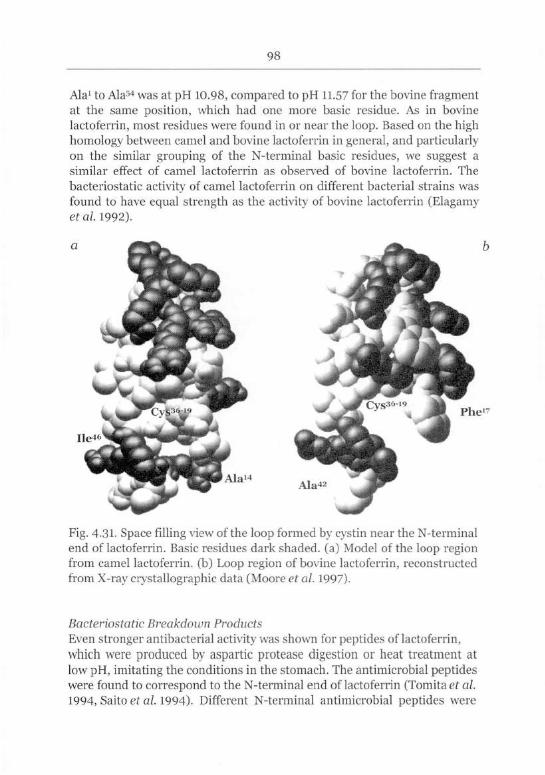
98
Ala1 to Ala54 was at pH 10.98, compared to pH 11.57 for the bovine fragmentat the same position, which had one more basic residue. As in bovine
lactoferrin, most residues were found in or near the loop. Based on the high
homology between camel and bovine lactoferrin in general, and particularlyon the similar grouping of the N-terminal basic residues, we suggest a
similar effect of camel lactoferrin as observed of bovine lactoferrin. The
bacteriostatic activity of camel lactoferrin on different bacterial strains was
found to have equal strength as the activity of bovine lactoferrin (Elagamyera/. 1992).
Fig. 4-31. Space filling view of the loop formed by cystin near the N-terminal
end of lactoferrin. Basic residues dark shaded, (a) Model of the loop regionfrom camel lactoferrin. (b) Loop region of bovine lactoferrin, reconstructed
from X-ray crystallographic data (Moore et al. 1997).
Bacteriostatic Breakdown Products
Even stronger antibacterial activity was shown for peptides of lactoferrin,
which were produced by aspartic protease digestion or heat treatment at
low pH, imitating the conditions in the stomach. The antimicrobial peptideswere found to correspond to the N-terminal end of lactoferrin (Tomita et al.
1994, Saito et al. 1994). Different N-terminal antimicrobial peptides were
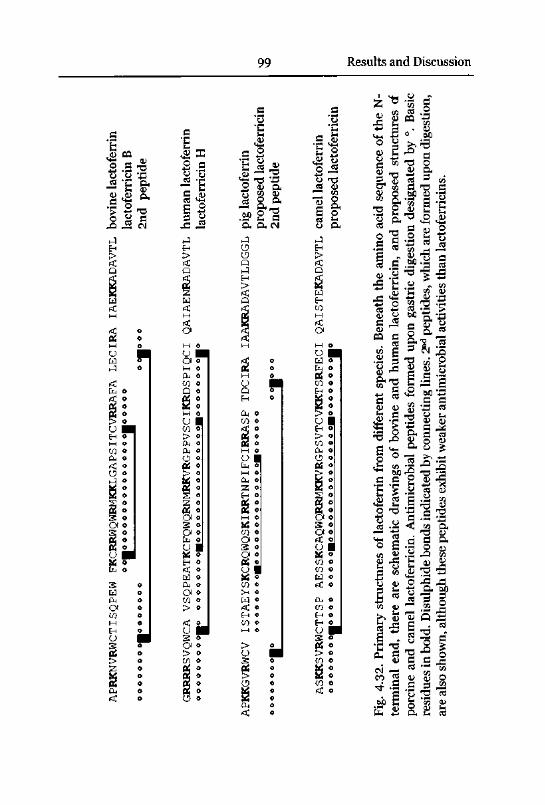
3oglactoferricins.
than
activities
antimicrobial
weaker
exhibit
pept
ides
these
although
shown,
also
are
odigest
ion,
upon
formed
are
which
pept
ides
,2nd
lines.
connecting
by
indicated
bonds
Disulphide
bold.
in
residues
^Basic
°.by
designated
dige
stio
ngastric
upon
formed
pept
ides
Antimicrobial
lactoferricin.
camel
and
porcine
gof
structures
proposed
and
lactoferricin,
human
and
bovine
of
drawings
schematic
are
there
end,
terminal
^N-
the
of
sequence
acid
amino
the
Beneath
species.
different
from
lactoferrin
of
structures
Primary
4.32.
Fig.
\£>
lactoferricin
proposed
°°°°o°|°
°°±°m°°
°°°°
°°°-°°°"°°°°
°°
'I""
0000000
lactoferrin
camel
QAISTEKADAVTL
AESSKCAQWQRRMKKVRGPSVTCVKKTSRFECI
ASKKSVRWCTTSP
pept
ide
2nd
°°
°jj0
|°
OHO
Oo
oo
oo
o
oo
oo
oo^o
000000000000
o|o
oo
oo
oo
ovo
lactoferricin
proposed
lactoferrin
pig
IAAKRADAVTLDGGL
TDCIRA
ISTAEYSKCRQWQSKIRRTNPIFCIRRASP
APKKGVRWCV
T-I
lartnfprriHn
oho
oo
oo
oo
oio
oooooooooooooo
omo
oo
oo
oo
ooho
oooooooo
lactoferrin
human
QAIAENRADAVTL
VSQPEATKCFQWQRNMRKVRGPPVSCIKRDSPIQCI
GRRRRSVQWCA
oo
OHO
OO
OO
OO
OOHO
OO
OO
OO
O
pept
ide
2nd
Blactoferricin
oo
oo
o|oooooo.ooooooooojo
o
lactoferrin
bovine
IAEKKADAVTL
LECIRA
FKCRRWQWRMKKLGAPSITCVRRAFA
APRKNVRWCTISQPEW
100
obtained by digestion of human and bovine lactoferrin, since human
lactoferrin does not contain a hydrophobic dipeptide suited for digestion by
aspartic proteases between Cys37 and Cys46. Antimicrobial peptides were
structurally similar to well characterised, antimicrobial peptides, such as
magainins from frog skin or cecropins from the hemolymph of insects. The
bovine peptide, designated as lactoferricin B (Fig. 4.32), was twelve times
more effective in the inhibition of gram-positive and gram-negativebacterial growth than undigested bovine apolactoferrin. Furthermore,
bifidobacteria, which dominate the neonatal intestinal microflora, were less
inhibited than many opportunistic pathogens. Lactoferrin may therefore
help to promote the establishment of bifidobacteria in the neonatal
microflora. A camel lactoferricin is proposed in analogy to bovine and
human lactoferricin (Fig 4.32), based on probable pepsin cleavage sites.
This lactoferricin would have more similarity to human lactoferricin, where
the N-terminus is not cleaved off, since probability of cleavage between
Cys36 and Cys45 of camel lactoferrin is low. Growth inhibition of this peptidewas assumed to be in the range of human lactoferricin, where 100 mg I1 of
peptide is needed to inhibit growth of E. coli completely, rather than to be
in the range of bovine lactoferricin, where mere 6 mg I"1 are sufficient for
complete inhibition of bacterial growth (Tomita et al. 1994).
Functional AspectsCamel and bovine lactoferrin were highly similar in most structural aspects.
Compared sequences did not reveal sequence insertions or deletions. Amino
acid residues surrounding the ligand binding centres were highly conserved
and clustering of the basic N-terminal residues was largely identical. The
only differences were found in glycosylation potential and sites of
glycosylation, and in the proposed structure of lactoferricin produced upon
gastric digestion. The most prominent difference between the proteins was
the concentration in milk.
It can be assumed, that lactoferrin in colostral milk acts as an iron
scavenger, which depletes the milk from free iron and thereby slows down
microbial growth. Brock (1997) proposed, that the in vivo function of
apolactoferrin is the prevention of iron-mediated lipid peroxidation, a
property, which was already demonstrated with monocytes. This function is
based on the ability of lactoferrin, to bind to cell membranes. The higher
affinity for iron, as compared to other transferrins, would enable it to
function at the reduced pH found in the stomach and upper intestine. The
high resistance of apolactoferrin to proteolysis, compared with other
apotransferrins, would enable it to maintain its iron-binding potential in
101 Results and Discussion
the face of proteolytic activity in the gut. Since diferric lactoferrin was
reported to be even more resistant to proteolysis, it was supposed, that the
iron-lactoferrin complex would resist degradation, and was sequestered by
hepatocytes, or was excreted from the gut. A higher lactoferrin
concentration also could help to prevent lipid peroxidation by free radicals
in an infected udder, which has an elevated iron content.
Iron-saturated lactoferrin, which is found in milk from the second week to
the end of the lactational period, may primarily prevent microbial growth in
the gut. This would help the new-born, which is easily infected, to survive
the first weeks, until its own immune system becomes developed, and the
gut becomes adapted to food digestion. Iron saturated lactoferrin could also
be a source of iron for the suckling, once the protein is degraded in the gut.The much higher concentration in camel colostrum and milk givesindication, that the suckling camel is under greater danger of getting an
infection than the suckling calf. A reason for this could be the harsh
environment, to which these animals are adapted, and differences in
physiological aspects and metabolism.
Food Preservation
Lactoferrin was discussed to be a promising choice for preservation in food
and cosmetics, since it is highly stable towards heat treatment and at low
pH conditions (Saito et al. 1994). Since the protein helps to establish a
favourable microflora, and promotes growth of bifidobacteria, it is
interesting for use in functional food products. The antimicrobial peptidesformed upon gastric digestion of lactoferrin are also an interesting choice
for natural food preservation.
Primary structures of peptides formed from camel lactoferrin should be
studied and activity of such peptides on inhibition of bacterial growthtested, to get better understanding of the action of lactoferrin in camel milk.
The higher amounts of lactoferrin in camel milk are an advantage for
natural preservation of the milk in arid regions, where technology for milk
preservation is often not available.
4.4.3 Lactoperoxidase
Literature
Lactoperoxidase (EC 1.11.1.7) is found in milk, tears and saliva. It
contributes to the non-immune host defence system, exerting bactericidal
102
activity, mainly on gram-negative bacteria. It is supposed that the main
function in milk is the protection of the udder from microbial infections
(Ueda et al. 1996). The finding, that lactoperoxidase remained active in the
gastric juice from a new-born, being fairly resistant towards proteolyticdigestion and acidic pH, led to the assumption, that the enzyme may also be
a key player in the defence of the suckling animal's intestinal system from
bacterial infection in the initial stages of life (Paul & Ohlsson, 1985).
Lactoperoxidase was also reported to have a general growth-promotion and
anti-tumour activity (Ueda et al. 1997). Yet another functional role for
lactoperoxidase may be in the degradation of catecholamines, such as
norepinephrine (Andersson et al. 1996). In contrast to human
lactoperoxidase, which is only present in the colostrum, and becomes
almost undetectable within one week after parturition, bovine
lactoperoxidase activity is maintained at a high level throughout lactation
(Ueda et al. 1997). Lactoperoxidase was only detected in the cDNA librarycreated from mammary gland tissue taken in the second month of lactation,
but could not be isolated, by cation exchange chromatography, from the
camel milk sample studied, which was from the end of the lactation period,whereas the greenish stain of bovine lactoperoxidase was detected in a
pooled cow milk sample.
Camel lactoperoxidase is a monomeric protein, which has 79-3% sequence
similarity to human myeloperoxidase, and 79.2% sequence similarity to
human eosinophil peroxidase. Myeloperoxidase is a dimeric protein,
expressed in primary granules of neutrophilic granulocytes. Eosinophil
peroxidase is also dimeric, and expressed in cytoplasmic granules of
eosinophils. Infectious micro-organisms, which are carried into
phagosomes by endocytosis, are inactivated by oxidative action of
hypochloride on free sulfhydryl groups of bacterial enzymes, by myelo- or
eosinophil peroxidase, prior to degradation. The genes of all three proteinswere found to be located on the same gene locus in the human genome, and
probably have evolved from a common ancestor by gene duplications (Ueda
et al. 1997). Close relation (71.7%) was also found to human thyroid
peroxidase, which is involved in iodination and coupling of the
hormonogenic tyrosines in thyroglobulin, for production of thyroidhormones.
Lactoperoxidase is an antimicrobial enzyme of commercial interest.
Industrial scale isolation from bovine whey is feasible, and use in cosmetics,
dental and wound treatments is under investigation (De Wit & Van
Hooydonk, 1996). In this study, we show that lactoperoxidase is expressed
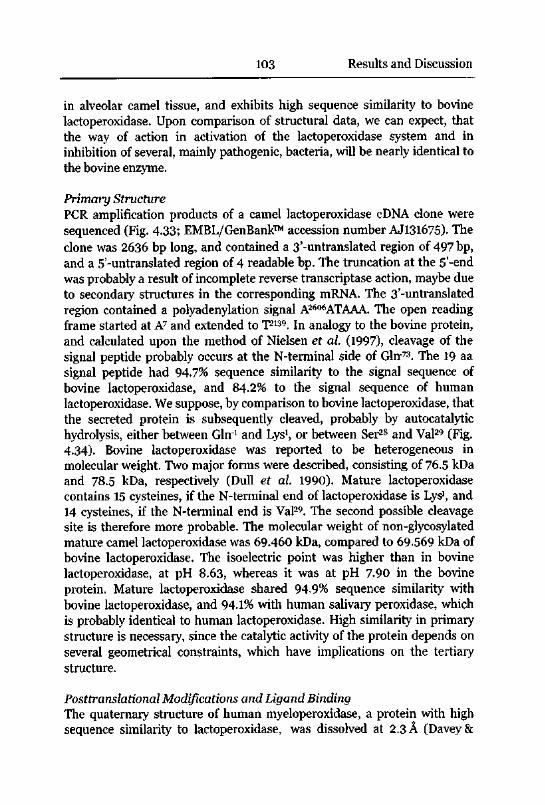
103 Results and Discussion
in alveolar camel tissue, and exhibits high sequence similarity to bovine
lactoperoxidase. Upon comparison of structural data, we can expect, that
the way of action in activation of the lactoperoxidase system and in
inhibition of several, mainly pathogenic, bacteria, will be nearly identical to
the bovine enzyme.
Primary Structure
PCR amplification products of a camel lactoperoxidase cDNA clone were
sequenced (Fig. 4.33; EMBL/GenBank accession number AJ131675). The
clone was 2636 bp long, and contained a 3'-untranslated region of 497 bp,and a 5'-untranslated region of 4 readable bp. The truncation at the 5'-end
was probably a result of incomplete reverse transcriptase action, maybe due
to secondary structures in the corresponding mRNA. The 3'-untranslated
region contained a polyadenylation signal A2606ATAAA. The open readingframe started at A7 and extended to T2139. In analogy to the bovine protein,and calculated upon the method of Nielsen et al. (1997), cleavage of the
signal peptide probably occurs at the N-terminal side of Gin-73. The 19 aa
signal peptide had 94.7% sequence similarity to the signal sequence of
bovine lactoperoxidase, and 84.2% to the signal sequence of human
lactoperoxidase. We suppose, by comparison to bovine lactoperoxidase, that
the secreted protein is subsequently cleaved, probably by autocatalytic
hydrolysis, either between Gin-1 and Lys1, or between Ser28 and Val29 (Fig.
4.34). Bovine lactoperoxidase was reported to be heterogeneous in
molecular weight. Two major forms were described, consisting of 76.5 kDa
and 78.5 kDa, respectively (Dull et al. 1990). Mature lactoperoxidasecontains 15 cysteines, if the N-terminal end of lactoperoxidase is Lys1, and
14 cysteines, if the N-terminal end is Val29. The second possible cleavagesite is therefore more probable. The molecular weight of non-glycosylatedmature camel lactoperoxidase was 69.460 kDa, compared to 69.569 kDa of
bovine lactoperoxidase. The isoelectric point was higher than in bovine
lactoperoxidase, at pH 8.63, whereas it was at pH 7.90 in the bovine
protein. Mature lactoperoxidase shared 94.9% sequence similarity with
bovine lactoperoxidase, and 94.1% with human salivary peroxidase, which
is probably identical to human lactoperoxidase. High similarity in primarystructure is necessary, since the catalytic activity of the protein depends on
several geometrical constraints, which have implications on the tertiarystructure.
Posttranslational Modifications and Ligand BindingThe quaternary structure of human myeloperoxidase, a protein with high
sequence similarity to lactoperoxidase, was dissolved at 2.3 A (Davey&
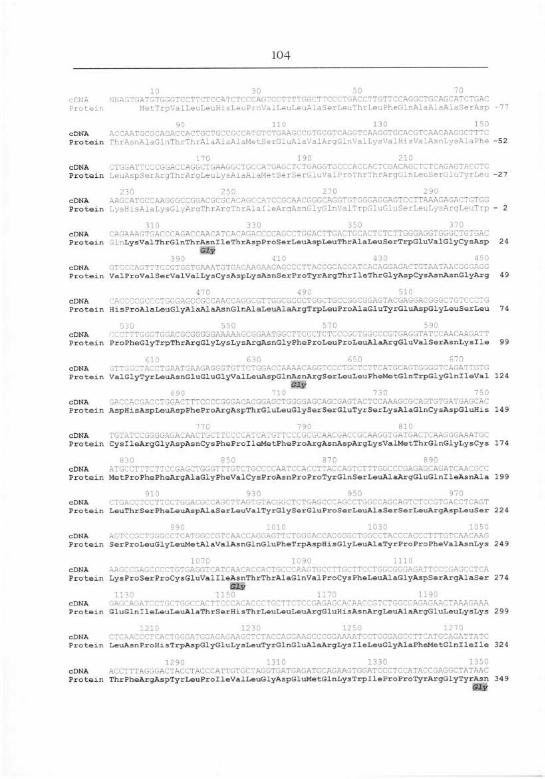
104
10 30 50 70
cDNA NNAGTGATGTGGGTCCTTCTCCATCTCCCAGTCCTTTTGGCTTCCCTGACCTTGTTCCAGGCTGCAGCATCTGAC
Protein MetTrpValLeuLeuHisLeuProValLeuLeuAlaSerLeuThrLeuPheGlnAlaAlaAlaSerAsp -77
90 110 130 150
cDNA ACCAATGCGCAGACCACTGCTGCCGCCATGTCTGAAGCCGTGCGTCAGGTCAAGGTGCACGTCAACAAGGCTTTC
Protein ThrAsnAlaGlnThrThrAlaAlaAlaMetSerGluAlaValArgGlnValLysValHisValAsnLysAlaPhe -52
170 190 210
CDNA CTGGATTCCCGGACCAGGCTGAAGGCTGCCATGAGCTCTGAGGTGCCCACCACTCGACAGCTCTCAGAGTACCTC
Protein LeuAspSerArgThrArgLeuLysAlaAlaMetSerSerGluValProThrThrArgGlnLeuSerGluTyrLeu -27
230 250 270 290
cDNA AAGCATGCCAAGGGCCGGACGCGCACAGCCATCCGCAACGGGCAGGTGTGGGAGGAGTCCTTAAAGAGACTGTGG
Protein LysHisAlaLysGlyArgThrArgThrAlalleArgAsnGlyGlnValTrpGluGluSerLeuLysArgLeuTrp - 2
310 330 350 370
cDNA CAGAAAGTGACCCAGACCAACATCACAGACCCCAGCCTGGACTTGACTGCACTCTCTTGGGAGGTGGGCTGTGAC
Protein_ iLysValThrGlnThrAsnlleThrAspProSerLeuAspLeuThrAlaLeuSerTrpGluValGlyCysAsp 24
390 -1; 430 430
oDNA CTC3CAGTTTCCGTGGTGAAATGTGACAAGAACAGCCCTTACCGCACCATCACAGGAGACTGTAATAACGGGAGG
Protein ValProValSerValValLysCysAspLysAsnSerProTyrArgThrlleThrGlyAspCysAsnAsnGlyArg 49
470 490 510
cDNA CACCCCGCCCTGGGAGCCGCCAACCAGGCGTTGGCGCGCTGGCTGCCGGCGGAGTACGAGGACGGGCTGTCCCTG
Protein HisProAlaLeuGlyAlaAlaAsnGlnAlaLeuAlaArgTrpLeuProAlaGluTyrGluAspGlyLeuSerLeu 74
530 550 570 590
cDNA < ^TTTGGGTGGACGCGGGGGAAAAAGCGGAATGGCTTCCCTCTCCCGCTGGCCCGTGAGGTATCCAACAAGATT
Protein ProPheGlyTrpThrArgGlyLysLysArgAsnGlyPheProLeuProLeuAlaArgGluValSerAsnLysIle 99
610 630 650 67C
cDNA GTTGGCTACCTGAATGAAGAGGGTGTTCTGGACCAAAACAGGTCCCTGCTCTTCATGCAGTGGGGTCAGATTGTG
Protein ValGlyTyrLeuAsnGluGluGlyValLeuAspGlnAsnArgSerLeuLeuPheMetGlnTrpGlyGlnlleVal 124
690 710 730 750
cDNA GACCACGACCTGGACTTTCCCCGGGACACGGAGCTGGGGAGCAGCGAGTACTCCAAAGCGCAGTGTGATGAGCAC
Protein AspHisAspLeuAspPheProArgAspThrGluLeuGlySerSerGluTyrSerLysAlaGlnCysAspGluHis 14 9
cDNA IGTATCGGGGGAGACAAC7GCTTCCCCATCAIGTTGGCGCGCAACGACCGCAAGGTGATGACTCAAGGGAAA7GC
Protein CysIleArgGlyAspAsnCysPheProIleMetPheProArgAsnAspArgLysValMetThrGlnGlyLysCys 174
830 850 870 890
cDNA ATGCCTTTCTTCCGAGCTGGGTTTGTCTGCCCCAATCCACCTTACCAGTCTTTGGCCCGAGAGCAGATCAACGCC
Protein MetProPhePheArgAlaGlyPheValCysProAsnProProTyrGlnSerLeuAlaArgGluGlnlleAsnAla 199
910 930 950 970
cDNA CTGACCTCCTTCCTGGACGCCAGCTTAGTGTACGGCTCTGAGCCCAGCCTGGCCAGCAGTCTCCGTGACCTCAGT
Protein LeuThrSerPheLeuAspAlaSerLeuValTyrGlySerGluProSerLeuAlaSerSerLeuArgAspLeuSer 224
990 1010 1030 1050
cDNA AGTCCGCTGGGCCTCATGGCCGTCAACCAGGAGTTCTGGGACCACGGGCTGGCCTACCCACCCTTTGTCAACAAG
Protein SerProLeuGlyLeuMetAlaValAsnGlnGluPheTrpAspHisGlyLeuAlaTyrProProPheValAsnLys 249
1070 1090 1110
cDNA AAGGCGAGCCCCTGTGAGGTCATCAACACCACTGCCCAAGTGCCTTGCTTCCTGGCGGGAGATTCCCGAGCCTCA
Protein LysProSerProCysGluVallleAsnThrThrAlaGlnValProCysPheLeuAlaGlyAspSerArgAlaSer 274
Giy
cDNA GAGGAGA7CGTGCTGGCCACX.CCCACACCCiGC11C1CGGAGAGGnCAnCCG-dGGCCAGAGAAC7AAAGAAA
Protein GluGlnlleLeuLeuAlaThrSerHisThrLeuLeuLeuArgGluHisAsriArgLeiiAlaArgGluLeuLysLys 299
1210 1230 1250 1270
cDNA CTCAACCCTCACTGGGATGGAGAGAAGCTCTACCAGGAAGCCCGGAAAATCCTGGGAGCCTTCATGCAGATTATC
Protein LeuAsnProHisTrpAspGlyGluLysLeuTyrGlnGluAlaArgLysIleLeuGlyAlaPheMetGlnllelle 324
1290 1310 1330 1350
cDNA ACCTTTAGGGACTACCTACCCATTGTGCTAGGTGATGAGATGCAGAAGTGGATCCCTCCATACCGAGGCTATAAC
Protein ThrPheArgAspTyrLeuProIleValLeuGlyAspGluMetGlnLysTrpIleProProTyrArgGlyTyrAsn 34 9
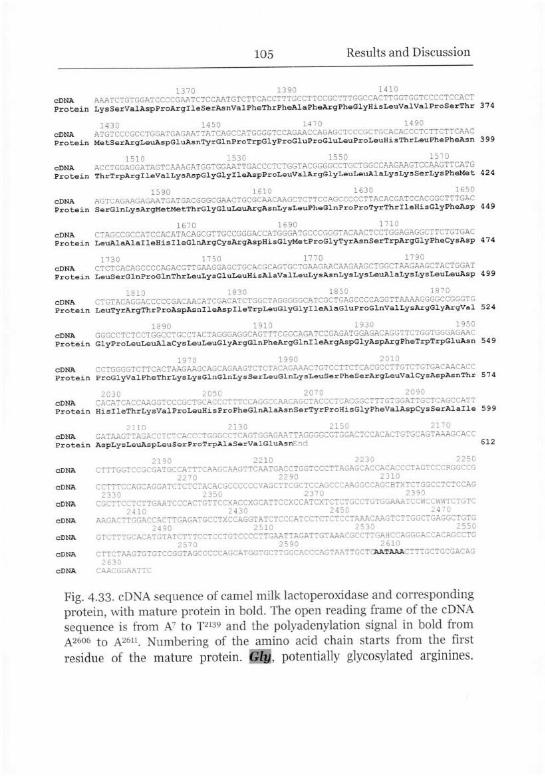
105 Results and Discussion
1370 1390 1410
CDNA AAATCTGTGGATCCCCGAATCTCCAATGTCTTCACCTTTGCCTTCCGCTTTGGCCACTTGGTGGTCCCCTCCACTProtein LysSerValAspProArglleSerAsnValPheThrPheAlaPheArgPheGlyHisLeuValValProSerThr 374
1430 1450 1470 1490
CDNA ATGTCCCGCCTGGATGAGAATTATCAGCCATGGGGTCCAGAACCAGAGCTCCCGCTGCACACCCTCTTCTTCAACProtein MetSerArgLeuAspGluAsnTyrGlnProTrpGlyProGluProGluLeuProLeuHisThrLeuPhePheAsn 399
1510 1530 1550 1570
CDNA ACCTGGAGGATAGTCAAAGATGGTGGAATTGACCCTCTGGTACGGGGCCTGCTGGCCAAGAAGTrCAAGTTCATGProtein ThrTrpArglleValLysAspGlyGlylleAspProLeuValArgGlyLeuLeuAlaLysLysSerLysPheMet 424
1590 1610 1630 ie:>.
CDNA AGTCAGAAGAGAATGATGACGGGCGAACTGCGCAACAAGCTCTTCCAGCCCCCTTACACGATCCACGGCTTTGACProtein SerGlnLysArgMetMetThrGlyGluLeuArgAsnLysLeuPheGlnProProTyrThrlleHisGlyPheAsp 449
1670 1690 1710
CDNA CTAGCCGCCATCCACATACAGCGTTGCCGGGACCATGGGATGCCCGGGTACAACTCCTGGAGAGGCTTCTGTGACProtein LeuAlaAlalleHiSlleGlnArgCysArgAspHisGlyMetProGlyTyrAsnSerTrpArgGlyPheCysAsp 474
1^30 175,. 17-„
CDNA CTCTCACAGCCCCAGACGTTGAAGGAGCTGCACGCAGTGCTGAAGAACAAGAAGCTGGCTAAGA3GCTACTGGAIProtein LeuSerGlnProGlnThrLeuLysGluLeuHisAlaValLeuLysAsnLysLysLeuAlaLysLysLeuLeuAsp 499
1810 1830 1850 1870
CDNA CTGTACAGGACCCCCGACAACATCGACATCTGGCTAGGGGGCATCGCTGAGCCCCAGGTTAAAAGGGGCCGGGTGProtein LeuTyrArgThrProAspAsnlleAspIleTrpLeuGlyGlylleAlaGluProGlnValLysArgGlyArgVal 524
1890 1910 1930 1950
CDNA GGGCCTCTCCTGGCCTGCCTACTAGGGAGGCAGTTTCGGCAGATCCGAGATGGAGACAGGTTCTGGTGGGAGAACProtein GlyProLeuLeuAlaCysLeuLeuGlyArgGlnPheArgGlnlleArgAspGlyAspArgPheTrpTrpGluAsn 54 9
1970 1990 2010
CDNA CCTGGGGTCTTCACTAAGAAGCAGCAGAAGTCTCTACAGAAACTGTCCTTCTCACGCCTTGTCTGTGACAACACCProtein ProGlyValPheThrLysLysGlnGlnLysSerLeuGlnLysLeuSerPheSerArgLeuValCysAspAsnThr 574
2030 2050 2070 2090
CDNA CACATCACCAAGGTCCCGCTGCACCCTTTCCAGGCCAACAGCTACCCTCACGGCTTTGTGGATTGCTCAGCCATTProtein HisIleThrLysValProLeuHisProPheGlnAlaAsnSerTyrProHisGlyPheValAspCysSerAlalle 599
CDNA GATAAGTTAGACCICTCACCCTGGGCCTCAGTGGAGAATTAGGGGCGTGGACTCCACACTGTGCAGTAAAGCACCProtein AspLysLeuAspLeuSerProTrpAlaSerValGluAsnEnd 612
2190 2210 2230 2250
CDHA CTTTGGTCCGCGATGCCATTTCAAGCAAGTTCAATGACCTGGTCCCTTAGAGCACCACACCCTAGTCCCRGGCCG2270 2290 2310
cDNA CCTTTCCAGCAGGATCTCTCTACACGCCCCCCVAGCTTCGCTCCAGCCCAAGGCCAGCBTXTCTGGCCTCTCCAG2330 2350 2370 2390
CDNA CGCTTCCTCTTGAATCCCACTGTTCCXACCXGCATTCCXCCATCXTCTCTGCCTGTGGAAATCCWCCWWTCTGTC2410 2430 2450 2470
CDNA AAGACTTGGACCACTTGAGATGCCTXCCAGGTATCTCCCATCCTCTCTCCTAAACAAGTCTTGGCTGAGGCTGTG2490 2510 2530 2550
CDNA GTCTTTGCACATGTATCTTTCCTCCTGTCCCCTTGAATTAGATTGTAAACGCCTTGAHCCAGGGACCACAGCCTG2570 2590 2610
CDNA CTTCTAAGTGTGTCCGGTAGCCCCCAGCATGGTGCTTGGCACCCAGTAATTGCTCAATAAACTTTGCTGCGACAG2630
CDNA CAACGGAATTC
Fig. 4-33. cDNA sequence of camel milk lactoperoxidase and corresponding
protein, with mature protein in bold. The open reading frame of the cDNA
sequence is from A7 to T2139 and the polyadenylation signal in bold from
A2606 to A2611. Numbering of the amino acid chain starts from the first
residue of the mature protein. Gly, potentially glycosylated arginines.
106
Fenna, 1996). This protein is posttranslationally processed into a heavy and
a light chain, in contrast to lactoperoxidase, which remains as a single chain
peptide. A myeloperoxidase molecule consists of two heavy and two lightchains with near-exact two-fold symmetry, covalently linked by a singledisulfide at Cys155. Residues Ala107 to Gly114 are excised from the mature
chain by posttranslational processing (Fig. 4-34). Although there are
significant modifications in the overall structure of the proteins, the
architecture of the catalytic centre is almost the same. Upon the data from
human myeloperoxidase, assumptions were made, concerning the ligand
binding residues of lactoperoxidase and the catalytic centre. Cys184, which
corresponds to Cys155 in human myeloperoxidase, would be free in
lactoperoxidase, since the molecule is monomeric, and may be disulphidelinked to Cys458, which corresponds to Ser427 in human myeloperoxidase.Nevertheless, the distance between the two residues is large, more than 16
A, and covalent linkage would result in a major alteration in tertiarystructure compared to myeloperoxidase. Furthermore, Cys152, which is free
in myeloperoxidase, and exchanged to the corresponding Gly181 in
lactoperoxidase, is within 13 A distance to Ser427 and may have a similar
function in myeloperoxidase, as a free Cys458 in lactoperoxidase.
Both proteins contain a heme b (protoporphyrin IX) in the catalytic centre.
In contrast to other known peroxidases from bacterial, fungal or plant
origins, mammalian peroxidases bind the heme prosthetic group covalently,which helps to maintain a more rigid tertiary structure (Andersson et al.
1996). The mammalian enzymes work optimally at a broad range in pH and
ionic strength. They are also able to oxidise high potential substrates, such
as pseudohalides, e.g. thiocyanate, in contrast to other peroxidases (DePillis
et al. 1997). In myeloperoxidase, the heme pyrrole ring C methyl group is
covalently attached to Asp96 by ester linkage, the methyl group of the A ringto Glu244 by ester linkage and the vinyl group of the A ring to Met245 bysulfonium ion linkage (Fig. 4.34). Whereas aspartic and glutamic acids are
found at the corresponding positions in lactoperoxidase, methionine is
replaced by glutamine. DePillis et al. (1997) showed, that a heme b group is
covalently bound to lactoperoxidase by autocatalytic processing. Speed of
the reaction and amount of produced twofold ester linked heme were
dependent of the peroxide concentration. Sulfonium ion linkage, as found
in myeloperoxidase, was not observed in lactoperoxidase. Considering the
high conservation of aspartic and glutamic acids in the active centre of the
different enzymes, we suggest, that the prosthetic heme is covalentlyattached to camel lactoperoxidase by the corresponding residues Asp125 and
Glu275 (Fig 4.34), a hypothesis supported by the study of Andersson et al.
107 Results and Discussion
(1996). Asp12s is adjacent to His126 and Glu275 is near Arg272. These two
residues are involved in the catalytic process, on the distal pocket of the
active site (Fenna et al. 1995). In the resting enzyme, the ferric heme has
high-spin pentacoordinate spectral characteristics. The fifth ligand is His338
in myeloperoxidase, which corresponds to His368 in lactoperoxidase. A sixth
ligand was excluded by X-ray crystal structure analysis (Davey & Fenna,
1996).
Enzymes of the mammalian peroxidase family bind one calcium ion in
distal vicinity to the C ring of the heme. In myeloperoxidase, the pentagonalbipyramidal coordinated ion is bound by backbone carbony] oxygens of
Asp'8, Thr170 and Phe172, and side chain oxygens of Asp98, Thr170, Asp174 and
Ser176. The ion is thought to stabilise the overall structure of the protein andmaintain the heme bound ferric ion in the high spin state. There was an
equal ratio of calcium to iron in dialysed lactoperoxidase. Removal of
calcium from bovine lactoperoxidase by dialysis against a buffer with 6 M
guanidium hydrochloride and 10 mM EGTA resulted in partial precipitationof the protein (Booth et al. 1989).
Camel lactoperoxidase revealed four possible N-glycosylation sites at Asn6,
Asn112, Asn258, and Asn349. Possible N-glycosylation sites of bovine
lactoperoxidase are at Asn6, Asn112, Asn222, Asn258, and Asn349. The
carbohydrate content of bovine lactoperoxidase was reported to be about
10% (De Wit & Van Hooydonk, 1996), which corresponds to about 9.0 kDa
(Table 4.3). This could account for four to five glycosylated sites. The
structurally related human myeloperoxidase is glycosylated at Asn191 and at
Asn227 by single N-acetylglucosamines, and at Asn319 by a fucosylated N-
acetyllactosaminic type glycan (Fenna et al. 1995). Based on these data,glycosylation of Asn258 and Asn349 in camel lactoperoxidase is proposed.Nevertheless, glycosylation of Asn6 and Asn112 may also occur.
Tertiary Structure and Catalytic ActivityAntimicrobial activity of lactoperoxidase is performed by a so-called
lactoperoxidase system (LP-system), in which hydrogen peroxide (H2O2) is
reduced and a halide, e.g. iodide (I") or bromide (Br"), or a pseudohalide,e.g. thiocyanate (SCN") is subsequently oxidised (Ferrari et al. 1997).
Complex formation of lactoperoxidase with SCN", a molecule with low
charge density, was reported to be favoured both, thermodynamically and
kinetically. Change in free enthalpy was 0.592 kJ mol1 for the reaction with
CI", which is a good substrate for myeloperoxidase. The value for the
reaction with SCN" was -7.46 kJ moH (Ferrari et al. 1997). The kinetic
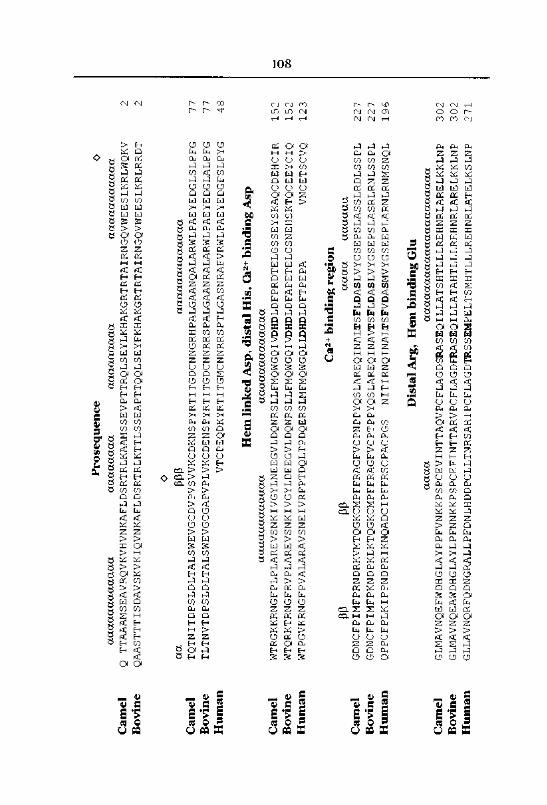
271
gllavnqrfqdngrallpfdnlhddpclltnrsaripcflagdtrssempeltsmhtlllrehnrlatelkslnp
Human
02
3glmavnqeawdhglaylpfnnkkpspcefinttarvpcflagdfraseqillatahtlllrehnrlarelkklnp
Bovine
02
3glmavnqefwdhglayppfvnkkpspcevinttaqvpcflagdsraseqillatshtlllrehnrlarelkklnp
Camel
aaaaaaaaaaaaaaaaaaaaa
aaaa
Glu
binding
Hem
Arg,
Distal
196
nitirnqinaltsfvdasmvygseeplarnlrnmsnql
qppcfplkippndpriknqadcipffrscpacpgs
Human
227
gdncfpimfpkndpklktqgkcmpffragfvcptppyqslareqinavtsfldaslvygsepslasrlrnlsspl
Bovine
227
gdncfpimfprndrkvmtqgkcmpffragfvcpnppyqslareqinaltsfldaslvygsepslasslrdlsspl
Camel
aaaaaa
aaaa
PP
PP
region
binding
Ca2+
00o
123
VNCETSCVQ
wtpgvkrngfpvalaravsneivrfptdqltpdqerslmfmqwgqlldhdldftpepa
Human
152
wtqrktrngfrvplarevsnkivgyldeegvldqnrsllfmqwgqivdhdldfapetelgsnehsktqceeyciq
Bovine
152
wtrgkkrngfplplarevsnkivgylneegvldqnrsllfmqwgqivdhdldfprdtelgsseyskaqcdehcir
Camel
aaaaaaaaaaaaa
aaaaaaaaaaaa
Asp
binding
Ca2+
His,
distal
Asp,
linked
Hem
48
vtcpeqdkyrtitgmcnnrrsptlgasnrafvrwlpaeyedgfslpyg
Human
77
tltnvtdpsldltalswevgcgapvplvkcdenspyrtitgdcnnrrspalgaanralarwlpaeyedglalpfg
Bovine
77
tqtnitdpsldltalswevgcdvpvsvvkcdknspyrtitgdcnngrhpalgaanqalarwlpaeyedglslpfg
Camel
aaaaaaaaaaaaa
PPP
aa
o
qaastttisdavskvkiqvnkafldsrtrlkttlsseapttqqlseyfkhakgrtrtairngqvweeslkrlrrdt
Bovine
ttaaamseavrqvkvhvnkafldsrtrlkaamssevpttrqlseylkhakgrtrtairngqvweeslkrlwqkv
qCamel
aaaaaaaaaaa
aaaaaaaaa
aaaaaaaa
aaaaaaaaaaaa
OProsequence
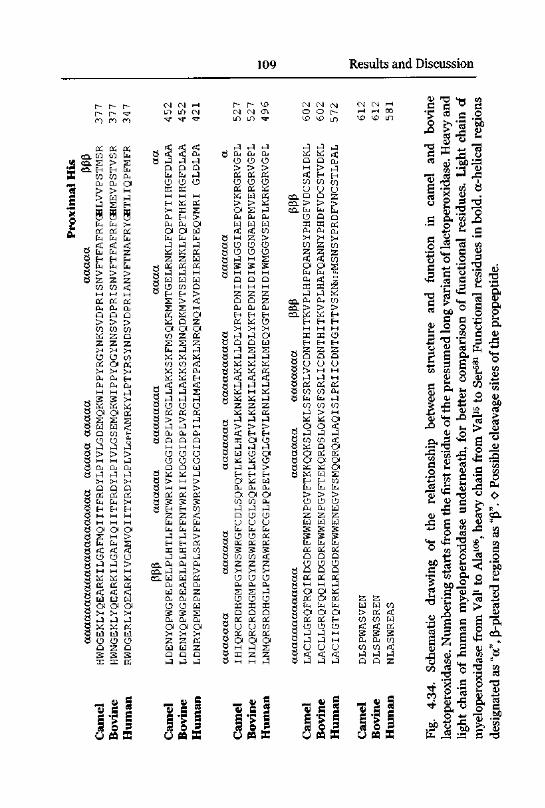
109 Results and Discussion
i> r~~ v~~
\> \> -*r
m m pi
73
•aou0-
osm CO
en. 2CO. H
CO
Cu
>>id
5bjPSfa
<tn
E-itn
>Zoo
M
OHCu
Q
>CO
z>HoPC>HDj
Dj
CO Dj
ODj
>a
2
5 Bbj >hOS OSbj bj
bj bj> >2 Zco scH M
oS OSDj Dj
CO CO
Z Q
O CO
a as>H >JDj E-JDj Dj
K s >HNS ns NSOi <> a>: 2 2W w <() (/) ^
id 3> > >
OS 04bj >h
a aM >bj 2< <
^ >M M
NS «PS OS< <
a o>J >H
NS PSW W
(J OZ Q
S 3DC OS
CM CM rH
LT) Li) CM
^T ^ ^
< < << < Oj
J id J
Q Q Q
tu Cu i-l
CJ O CJ3DC BC
NS OSOB 2H >Dj Oa w
bj bj
id idNS OS2 W
OS OSid M
w w
Q
>>2ns aa za a
co st:NS Dj
be; e-i
<; <J 2j id
u uOS OS> j
id M
Dj 0j
8 OS8 S
*£Dj
bj
i-l
H
ns
ca Pj
CO. id
ca w
0j
w
Dj
U
sDj
a>j
w
Q
id
Cd
id
>>
OS OSBco
<bj
bj
>OSCO
idDj
>W OS<I Dj
U ZDj Dj
O U
2 2Dj Dj
a a>j >j
CM CM en
LD in ^r
id J
Dj Pj
o o o> > >PS OS PSu e> e>os os ns
bj PS>2Oj Dj
W U W
< SC CO
m 2 >O CJ3 U
O U O
ns>OIDj
Oj
NSid
25
Q Q Q
ZZDj
H
OS NS O>h
Dj Dj
E-i H
Dj Dj Dj
a a a"
CO Dj
id id
u u cj
bj bj bj
o a psOS OS OS
s sCO CO
z z>H
uOj
2o
33Q
OSO U
z>J >H
33 33a a
os os
_
CO
PS OSPSa a aH id
'
33 S2zid
CM CM CMO O [^
in io in
S J id a8 a D w
8 J 2 2888
8 J id id
8 « M «
8 NS « PS
8 < < < 8
8 J id id 8M « 8« id 8z z
« bS DS
1-id id
> >Eh E-i 8
a O 8S ^ j •d B
2 u u a 82 « « o 88 J id > BH Eh Eh 8
id
a
M
<CO
u
ca Q
ca >ca bj
u
33Dj
>HCO
z<abjQj
33
vd
ca Oj
ca >ca fc4
H
Q Dj
> idE-i EhCO CO
y uQ Z
Cu
Q
33Dj
>h
ZZ
<abj
<33id XCU CO
> >X, H
Eh H
>bj
Q
DSDj
>HCO
zCO
2
u uM H
id M
DS DSCO Qj
bj id
CO CO
> M
ns aa <id idCO <q aPS PSa oins au 2Eh CO
bj bj
> >
Qu b]
Z Zb] U
OS OSa a
cj oa a
DS osM id
a nsa dstu bj
a aPS H
o oid M
id M
o o
id id
CM CM t-H
rH tH CO
CD CjD LD
z zCO
PS cC>co to M
'
<SDj
sDj
CO CO
id id
CS gb*csco 43CU
g
c*
» M
^. 4 .
•H SP s
6CO
d Oh tn— P £c-i u
_
•"S §
2 §.a
T3
<U
ca
„> <*
ca coo
S cP p
S tn
3 ^3 "C
3 g ft
Sagtn en S
g ft h
8 CD «
<U "t! -O
P
'Soo>
-a
"o>s:
I
a
"oa
tncu
S CUen rrtCU .S
-H ftca cu
d ft
.2 2a »<
d tu
S O
cutn
tn
_
P
d c ta
,2i S
^ £ £
cu^S a
si a cuj5 b tn
fe! P60 b t-
t » &
60 £a cu
•C ^CD
CD .
O CD~
602 ca
^ ca
> _yS
°
o J£
rjen
d tn
'3 t£
CS CO.CD 3
43 en
«ta
2 a
JS P
<, '5b
cau
T3s >
dca
ss43
ca
S "ft
£4CD Vtn o
ca -
T3
CO
X
ca
I"5£~ 3
ca
CD+-t
ca
d.60'tncu
T3
110
preference for SCN" was discussed to be a consequence of shape and amino
acid composition at the distal side of lactoperoxidase heme (De Wit & Van
Hooydonk, 1996). A very low Km value of 170 uM was reported for SCN".
Reaction kinetics are not limited by H2O2, since the Km for this co-substrate
was lower than for SCN" and for halides (Ferrari et al. 1997).
The architecture of the heme pocket of peroxidases is highly conserved. In
mammalian peroxidases, the heme is distorted, as a result from covalent
binding. At the proximal side of the pocket, the ferric ion is coordinated byHis368 in lactoperoxidase, and His338 in myeloperoxidase, which function as
an axial, fifth ligand. The distal side of myeloperoxidase, which provides a
catalytic surface for the reaction cascade, is shown in Fig. 4-35. The channel
of myeloperoxidase is about 12 A in diameter, leading to a much narrower
entrance to the distal pocket near the heme pyrrole ring D. The upper
surface of the distal pocket is composed of Arg241 at the entrance, followed
by His97 and Gin93 at the back. High occupancy binding was found at the
entrance to the distal pocket between pyrrole ring D and Arg241 (Hori et al.
1994). This interaction was presumed to be electrostatic in nature, since
there is an accumulation of four positive charges from the ferric iron atom
of the heme and from Arg241. It is supposed, that Arg241 is involved in initial
binding of negatively charged substrates. Peroxidases undergo a two-
electron oxidation by H2O2 to form an enzyme intermediate named
compound I, which contains an oxoferryl porphyrin 7r-cation radical, which
is readily converted into an oxoferryl protein radical. His97 is thought to
donate a proton in its function as an acid-base catalyst, which promotes
heterolytic cleavage of peroxide, while Arg241 plays a secondary role in
helping to stabilise the resultant oxoferryl center of compound I (Davey &
Fenna, 1996). A nucleophilic substrate, such as SCN", donates an electron
to compound I, which yields the corresponding substrate free radical and an
oxoferryl heme intermediate, Fe4+0, or Fe3+R, which is named compoundII. A subsequent reduction by a second nucleophilic substrate molecule
leads to ferric peroxidase. Peroxidases also react with the superoxide radical
anion to form compund III, a resonance hybrid between Fe3+02~ and
Fe2+(0)2.
Natural substrates of lactoperoxidase in milk are thiocyanate and iodide, of
which milk contains trace amounts. SCN" is provided mainly by
consumption of plants of the family Cruciferae. Kale, a cabbage, contains
up to 5 g kg-1 thioglucosides, which are readily converted into SCN" by
enzymatic hydrolysis (Bibi, 1989). Cow milk content of SCN" was reported
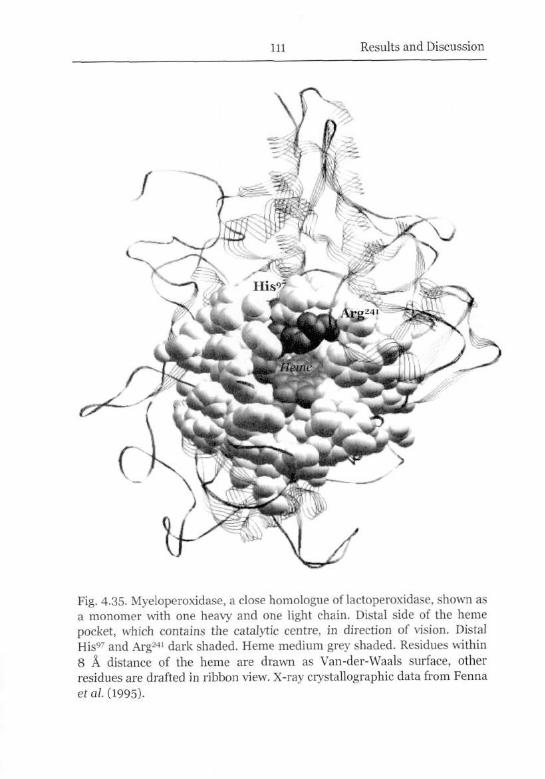
Ill Results and Discussion
Fig. 4.35- Myeloperoxidase, a close homologue of lactoperoxidase, shown as
a monomer with one heavy and one light chain. Distal side of the heme
pocket, which contains the catalytic centre, in direction of vision. Distal
His97 and Arg241 dark shaded. Heme medium grey shaded. Residues within
8 A distance of the heme are drawn as Van-der-Waals surface, other
residues are drafted in ribbon view. X-ray crystallographic data from Fenna
era/. (1995).
112
to vary between 1 mg H and 15 mg W, with much lower concentrations in
winter time, depending on feeding (De Wit & Van Hooydonk, 1996).Concentration of hydrogen peroxide is low in mastitis free milk. It can be
generated by oxidation of xanthine by Xanthine oxidase, or supplied bycatalase-negative bacteria, such as strains of lactobacilli, lactococci or
streptococci, which naturally occur in milk (Bibi, 1989).
The reaction products of thiocyanate oxidation, OSCN~ and HOSCN, are in
chemical equilibrium at pH 5.3, and are able to oxidise free sulphhydridegroups of the cytoplasmic membrane of gram-negative bacteria, similarly to
hypoiodide (01"). The structural damage on bacterial cell membranes
results in diffusion of potassium ions, amino acids and polypeptides out of
the cell, whilst uptake of glucose and other metabolic substrates is inhibited.
Gram-positive bacteria, such as streptococci, are probably better protectedfrom the action of lactoperoxidase by their rigid cell wall. Nevertheless, a
bacteriostatic effect on many gram-positive bacteria was also reported,which was observed in retarded acid production (De Wit & Van Hooydonk,1996).
The advantage of OSCN and HOSCN, compared to other hyperoxidisedsubstrates, is, that they are inert towards mammalian cells and milk
components, due to low charge density. Lactoperoxidase is not able to
oxidise the chloride anion Cl~, which is present at high concentrations in
milk and digestive secretions, in contrast to the other mammalian
peroxidases. It was reported, that the lactoperoxidase-chloride complex has
a high dissociation constant of 1270 mM, whereas complexes with the
preferred substrates thiocyanate and iodide have low Ko-values of 20.3 mM
and 205 mM, respectively (Ferrari et al. 1997). The different substrate
specificity of lactoperoxidase, compared with myeloperoxidase, as well as an
anomalous electronic absorption spectrum relative to those of other heme
b-containing proteins, is thought to be the result of an unusually constraint
heme pocket in lactoperoxidase (Hu et al. 1993). The reason for the low
affinity of lactoperoxidase towards CI" is supposed to be in the protection of
mammalian organs and milk components. Nevertheless it was shown, that
aromatic molecules are able to bind at the distal heme pocket of
myeloperoxidase (Hori et al. 1994)- It was suggested, that the heme pyrrolering D, and the side chains of the distal Phe101, Arg241, Phe368, and Phe409,form a hydrophobic surface at the entrance to the distal cavity, which can
bind aromatic substrate molecules. In this way, mono- or dichlorinated
biphenyls (PCBs), which are accumulated in the body by digestion of animal
fats, are metabolised to dihydroxy compounds and further oxidised to
113 Results and Discussion
reactive metabolites, which can react with cell DNA (Oakley et al. 1996).
Lactoperoxidase and myeloperoxidase may therefore play a crucial role in
the chemical induction of breast cancer (Josephy, 1996).
Lactoperoxidase is easily inhibited by irreversible binding of nitrite, azide,
cyanide and carbon monoxide (Hu et al. 1993, Ferrari et al. 1997).Riboflavin (vitamin B2), found in camel milk at low concentrations of 0.4
mg l1 to 0.8 mg H, was shown to promote light induced inactivation of
lactoperoxidase (Herandez et al. 1990). Photochemical inactivation of
bovine lactoperoxidase in milk was 55% after 4 h irradiation with 6,000 lux,and was inhibited by cysteine, indicating, that riboflavin damaged
lactoperoxidase by oxidative action.
Potentialfor Milk Preservation
The LP-system is active against mainly gram-negative, psychrotrophic and
mesophilic bacteria, but also against a broad range of pathogens, includingviruses and moulds, organisms found in milk of poor hygienic quality (De
Wit & Van Hooydonk, 1996). It was observed, that the keeping quality of
raw cow milk, stored at 4 °C and pasteurised after three to four days, was
much better than that of the same milk pasteurised on the first, or on the
seventh day, when also stored at 4°C, before and after pasteurisation(Ravanis & Lewis, 1995). From these results, it was concluded, that the
natural LP-system in raw cow milk is most effective up to four days.
Thereafter, H2O2 is supposed to be the limiting factor. Maximal
performance of the LP-system is achieved by addition of equimolarconcentrations of hydrogen peroxide and a halide, usually 0.25 mM of each
(Bibi, 1989). The optimal pH range of the LP-system is at pH 5.5 to 6.8.
Gram-negative, catalase-positive bacteria, such as pseudomonads,coliforms, salmonellae, and shigellae, are killed by the LP-system, provided,H2O2 is provided in sufficient concentrations. An activated LP-system was
also shown to be effective against different Listeria strains (Bibi, 1989).Activation of the LP-system extends the storage time of raw cow milk at
10 °C for at least three days. Moderate cooling, e.g. using a leather bag or
clay pot for storage, which allows slow water sublimation, could be a useful
alternative to extend the keeping quality of the milk. A problem could be the
reported light inactivation of lactoperoxidase. Light-sealed containers, such
as clay pots, should be preferred to transparent plastic canisters.
The lactoperoxidase system is of special interest as an alternative method
for the preservation of camel milk, to guarantee a hygienic product under
difficult conditions, such as handling at high ambient temperature, long
114
distance transports and inadequate cleaning of milk handling equipment,
e.g. due to water shortage (Bibi, 1989). Mainly the collection of evening milk
was reported to be problematic, since cooling is often not feasible. To
estimate the potential of the LP-system for camel milk, it would be
necessary, to measure the activity of lactoperoxidase in pooled camel milk.
The SCIST concentration in different feeding areas should also be studied.
Further on, bacterial strains should be found, which promote the formation
of H202 in camel milk. Elagamy et al (1992) reported, that the LP-system of
camel milk was bactericidal against Escherichia coli and Salmonella
typhimurium, but only bacteriostatic towards Lactococcus lactis and
Staphylococcus aureus.
The limited interest in the LP-system for the preservation of milk may be
explained by problems with inhibition of starter cultures and by danger of
milk poisoning, if the concentrations of the added chemicals are surpassed.
115 Conclusions And Outlook
5 CONCLUSIONSAND OUTLOOK
In the course of the study, quantitative and structural aspects of camel milk
proteins were studied. Major variations were found, when the proteins were
compared to well characterised homologues of cow milk, in both,
concentration, and structure of the proteins. These variations were
suggested to have an impact on the technological quality of camel milk, and
on the performance as a food product with antimicrobial activity.
The differences were supposed to originate from the different habitats, to
which the two species are adapted, the distant evolutionary relationship, the
forced breeding selection in cattle, the different lactating and sucklingregime of heifer and calf, and a possible difference in natural pressure for
survival of the infant.
A first aim of the study was to find an explanation for the poor rennetingcapability, and the low heat stability of camel milk. Research done with
focus on the casein fraction and the renneting enzymes gave indication, that
some problems in fermentation, pasteurisation and cheese productionresulted from the low k-CN content of casein micelles, combined with a
high p-CN content, and with structural divergences between camel and
bovine k-CN. Use of recombinant camel chymosin was suggested to be a
promising alternative in camel milk rennet coagulation, with focus on
improvement of curd firmness. The high proportion of p-CN may also giverise to the low heat stability of camel milk. Nevertheless, it has to be
considered, that other factors, which were not examined in the course of
this study, may additionally influence technological properties, such as the
concentration of free and bound calcium phosphate, size of casein micelles
and fat globules, and concentration of total protein, fat and lactose. An
analysis of protein and calcium levels in camel milk, under consideration of
age, stage of lactation, feeding and stress factors, such as dehydration,would be highly desirable, to evaluate the impact of these factors on the
processing quality of the milk.
Camel milk is a rich source of proteins with potential antimicrobial and
protective activity. All proteins isolated from the camel whey fraction in the
course of this study were found to be expressed in the lactating mammarygland, although homologous proteins of other species were reported to
participate in the innate immune system, being secreted e.g. from
116
leukocytes or from the gastric mucosa. Some of these proteins were not
found in cow milk, or only in minor amounts, such as the novel
peptidoglycan recognition protein, the whey acidic protein, or lactophorin.
Peptidoglycan recognition protein was easily isolated from whey and was
presumed to exhibit high capacity in bacterial growth inhibition. It would be
of interest to know the stability of this protein against heat and acid
denaturation, and the potential of synergistic activity in combination with
other milk proteins reported to exhibit antimicrobial activity, such as
lactoferrin, lactoperoxidase, lysozyme, whey acidic protein, lactophorin and
the different immunoglobulin types found in milk. Camel milk is used in the
traditional medicine of camel keeping societies for treatment of wounds and
gastric problems. It would be of interest to study the antimicrobial activityof milk from different breeds, stages of lactation, feeding and husbandry
conditions, on their selective inhibition of bacterial and fungal growth, and
of rotaviral spread. It should be studied, if there is a possible application of
camel whey as a prebiotic additive in food and cosmetics.
The potential of the lactoperoxidase system for extension of the keepingquality of fresh camel milk should be examined by microbial assays and
ABTS measurement of lactoperoxidase activity in milk from different stages
of lactation. There would also be interest in selection of peroxide producinglactobacilli, lactococci and streptococci strains, which could be used for
activation of the LP-s in camel milk. Another interest could be the selection
of lactic acid bacterial strains, which better tolerate the natural protectivesystem of camel milk, and which could help in production of a fermented
product with constant quality.
Due to the lower protein content, and a larger contribution of whey
proteins, camel milk could be an interesting alternative in infant milk
formula. Absence of pMactoglobulin, which may result in intolerance of an
infant towards cow milk (Hambraeus, 1992), a low amount of
lactoperoxidase, which seems to be down-regulated in human milk early in
lactation, a high amount of a-lactalbumin, which has a high nutritional
value, of lactoferrin, which is also found at a high level in human milk, and
of non-protein nitrogen, similarly to human milk, could be of advantage in
utilisation of camel milk in dairy products for infants and people with
allergy against cow milk products.
As a long term goal in camel research, breed classification, and
determination of genetic and nutritional factors, which increase milk yieldand improve consistency of milk quality should be envisaged. Genetic
117 Conclusions And Outlook
characterisation in terms of large-scale cDNA sequence analysis,chromosomal mapping of genes and microsatellite sequences, study of
regulation of gene expression, and detection of markers for breed
classification, could help to find suitable animals for milk and meat
production, as well as for transport, agricultural and racing purposes, and
could be a first step in understanding the genetic and physiologicalreservoir of the camel as the livestock animal, which is best adapted to arid
regions.

118
119 References
6 REFERENCES
Abd El-Gawad, I.A., El-Sayed, E.M., Mahfouz, M.B. & Abd El-Salam, A.M.
(1996) Changes of lactoferrin concentration in colostrum and milk from
different species. Egyptian Journal ofDairy Science, 24, 297-308.
Abeiderrahmane, N.M. & Reed, D.W. (1993) Pasteurizing camel's milk and
making camel's cheese in Mauritania. Spirit of enterprise: The 1993 Rolex
Awards, 72-75.
Abu-Lehia, I.H. (1987) Composition of camel milk. Milchwissenschaft, 42,
368-371.
Abu-Lehia, I.H. (1989) Physical and chemical characteristics of camel
milkfat and its fractions. Food Chemistry, 34, 261-271.
Abu-Tarboush, H.M. (1994) Growth behavior of Lactobacillus acidophilusand biochemical characteristics and acceptability of acidophilus milk made
from camel milk. Milchwissenschaft, 49,379-382.
Abu-Tarboush, H.M. (1996) Comparison of associative growth and
proteolytic activity of yogurt starters in whole milk from camels and cows.
Journal ofDairy Science, 79, 366-371.
Abu-Tarboush, H.M. (1998) Growth, viability, and proteolytic activity of
bifidobacteria in whole camel milk. Journal ofDairy Science, 81,354-361.
Albert, A., Blundell, T.L., Dhanaraj, V., Donate, L.E., Groves, M.,
Guruprasad, K., Nugent, P.G., Orprayoon, P., Pitts, J.E., Rufino, S.,
Srinivasan, N., Williams, M. & Wilsher, J. (1998) Protein engineeringaspartic proteinases. Site-directed mutagenesis, biochemical
characterisation, and X-ray analysis of chymosins with substituted singleamino acid substitutions and loop replacements. Advances in ExperimentalMedicine and Biology, 436,169-177.
Alhomida, A.S. (1996) Total, free, short-chain and long-chain acyl carnitine
levels in Arabian camel milk (Camelus dromedarius). Annals of Nutrition
and Metabolism, 40, 221-226.
120
Al-Saleh, A.A. & Hammad, Y.A. (1992) Buffering capacity of camel milk.
Egyptian Journal ofFood Science, 20, 85-97.
Andersen, M.H., Berglund, L., Rasmussen, J.T., & Petersen, T.E. (1997)Bovine PAS-6/7 binds avPs integrin and anionic phospholipids through two
domains. Biochemistry, 36, 5441-5446.
Anderson, B.F., Baker, H.M., Norris, G.E., Rice, D.W. & Baker, E.N. (1989)Structure of human lactoferrin: crystallographic structure analysis and
refinement at 2.8A resolution. Journal ofMolecular Biology, 209, 711-734-
Andersson, L.A., Bylkas, S.A. & Wilson, A.E. (1996) Spectral analysis of
lactoperoxidase. Evidence for a common heme in mammalian peroxidases.Journal ofBiological Chemistry, 271, 3406-3412.
Andreeva, N.S. & James, N.G. (1991) Why does pepsin have a negativecharge at very low pH? An analysis of conserved charged residues in
aspartic proteinases. In Structure and Function ofthe Aspartic Proteinases.
Genetics, Structures, and Mechanisms, ed. B.M. Dunn, pp. 39-45. Plenum
Press, New York, USA.
Baer, A., Ryba, I. & Farah, Z. (1994) Plasmin Activity in Camel Milk.
Lebensmittel Wissenschaft und Technologie, 27, 595-598.
Baker, E.N., Anderson, B.F., Baker, H.M., Day, C.L., Haridas, M., Norris,
G.E., Rumball, S.V., Smith, C.A. & Thomas, D.H. (1994) Three-dimensional
structure of lactoferrin in various functional states. In Lactoferrin. Structure
and Function, eds T.W. Hutchens, S.V. Rumball & B. Lonnerdal, pp. 21-31.
Plenum Press, New York, USA.
Barbour, E.K., Nabbut, N.H., Frerichs, W.M. & Al-Nakhli, H.M. (1984)Inhibition of pathogenic bacteria by camel's milk: relation to whey lysozymeand stage of lactation. Journal ofFood Protection, 47, 838-840.
Barton, G.J. (1997) SCANPS Version 2.3.1, User Guide. University of
Oxford, UK.
Bayoumi, S. (1990) Studies on composition and rennet coagulation of camel
milk. Kieler milchwirtschaftliche Forschungsberichte, 42, 3-8.
121 References
Beg, O.U., Von Bahr-Lindstrom, H., Zaidi, Z.H. & Jornvall, H. (1985) The
primary structure of a-lactalbumin from camel milk. European Journal of
Biochemistry, 147, 233-239.
Beg, O.U., Von Bahr-Lindstr6m, H., Zaidi, Z.H. & Jornvall, H. (1986 a)Characterisation of a camel milk protein rich in proline identifies a new (}-casein fragment. Regulatory Peptide, 15,55-62.
Beg, O.U., Von Bahr-Lindstr6m, H., Zaidi, Z.H. & Jornvall, H. (1986 b) A
camel milk whey protein rich in half-cystine. Primary structure, assessment
of variations, internal repeat patterns, and relationships with neurophysinand other active polypeptides. European Journal of Biochemistry, 159,
195-201.
Beg, O.U., Bahr-Lindstrom, H., Zaidi, Z.H. & Jornvall, H. (1987)Characterization of a heterogeneous camel milk whey non-casein protein.FEBS Letters, 216, 270-274.
Berg, E.L., Mullowney, A.T., Andrew, D.P., Goldberg, J.E. & Butcher, E.C.
(1998) Complexity and differential expression of carbohydrate epitopesassociated with L-selectin recognition of high endothelial venules.
American Journal ofPathology, 152, 469-477.
Bernos, E., Girardet, J.M., Humbert, G. & Linden, G. (1997) Role of the O-
phosphoserine clusters in the interaction of the bovine milk alpha-sl-, beta-,
kappa-caseins and the PP3 component with immobilized iron (III) ions.
Biochimica et Biophysica Acta, 1337,149-159.
Bibi, W. (1989) Natural activation of the lactoperoxdiase-thiocyanate-hydrogen peroxide (LP) system for preservation of milk during collection
in developing countries. Diss. ETH Nr. 9057, Swiss Federal Institute of
Technology, Zurich, Switzerland.
Booth, K.S., Kimura, S., Lee, H.C., Ikeda-Saito, M. & Caughey, W.S. (1989)Bovine myeloperoxidase and lactoperoxidase each contain a high affinitysite for calcium. Biochemical and Biophysical Research Communications,
160, 897-902.
Brock, J.H. (1997) Lactoferrin Structure - Function Relationships. In
Lactoferrin. Interactions and Biological Functions, eds T.W. Hutchens & B.
Lonnerdal, pp. 3-23. Humana Press, Totowa, NJ, USA.
122
Buchheim, W., Lund, S. & Scholtissek, J. (1989) VergleichendeUntersuchungen zur Struktur und Grofte von Caseinmicellen in der Milch
verschiedener Species. Kieler Milchwirtschaftliche Forschungsberichte, 41,
253-265.
Burgess, T.L. & Kelly, R.B. (1987) Constitutive and regulated secretion of
proteins. Annual Review ofCell Biology, 3, 243-293.
Courthaudon, J.L., Girardet, J.M., Chapal, C, Lorient, D. & Linden, G.
(1995) Surface activity and competitive adsorption of milk component 3 and
porcine pancreatic lipase at the dodecane-water interface. In Food
Macromolecules and Colloids, ed. E. Dickinson, pp. 58-70. Royal Society of
Chemistry, London, UK.
Dalgleish, D.G. (1983) Coagulation of renneted bovine casein micelles:
dependence on temperature, calcium ion concentration and ionic strength.Journal ofDairy Research, 50, 331-340.
Dalgleish, D.G. (1992) The enzymatic coagulation of milk. In Advanced
Dairy Chemistry-1. Proteins, ed. P.F. Fox, pp. 579-619. Elsevier AppliedScience, London, UK.
Davey, C.A. & Fenna, R.E. (1996) 2.3 A resolution X-ray crystal structure of
the bisubstrate analogue inhibitor salicylhydroxamic acid bound to human
myeloperoxidase: a model for a prereaction complex with hydrogen
peroxide. Biochemistry, 35,10967-10973.
Davies, D.R. (1990) The structure and function of the aspartic proteinases.Annual Review ofBiophysics and Biophysical Chemistry, 19,189-215.
DePillis, G.D., Ozaki, S., Kuo, J.M., Maltby, D.A. & Ortiz de Montellano,P.R. (1997) Autocatalytic processing of heme by lactoperoxidase producesthe native protein-bound prosthetic group. Journal of BiologicalChemistry, 272, 8857-8860.
De Wit, J.N. & Van Hooydonk, A.C.M (1996) Structure, functions and
applications of lactoperoxidase in natural antimicrobial systems.Netherlands Milk & Dairy Journal, 50, 227-244-
Dowbenko, D., Kikuta, A., Fennie, C, Gillett, N. & Lasky, L.A. (1993)
Glycosylation-dependent cell adhesion molecule 1 (GlyCAM 1) mucin is
123 References
expressed by lactating mammary gland epithelial cells and is present in
milk. Journal ofClinical Investigation, 92, 952-960.
Dull, T.J., Uyeda, C, Strosberg, A.D., Nedwin, G. & Seilhamer, J.J. (1990)
Molecular cloning of cDNAs encoding bovine and human lactoperoxidase.DNA and Cell Biology, 9,499-509.
Dziarski, R., Tapping, R.I. & Tobias, P.S. (1998) Binding of bacterial
peptidoglycan to CD14. Journal ofBiological Chemistry, 273, 8680-8690.
Eigel, W.N., Butler, J.E., Ernstrom, C.A., Farrell, H.M., Hawalkar, V.R.,
Jenness, R. & Whitney, R. McL. (1984) Nomenclature of proteins of cow
milk: fifth revision. Journal ofDairy Science, 67,1599-1631.
Elagamy, E.I., Ruppanner, R., Ismail, A., Champagne, C.P. & Assaf, R.
(1992) Antibacterial and antiviral activity of camel milk protective proteins.Journal ofDairy Research, 59,169-175.
Elagamy, E.I., Ruppanner, R., Ismail, A., Champagne, C.P. & Assaf, R.
(1996) Purification and characterization of lactoferrin, lactoperoxidase,
lysozyme and immunoglobulins from camel's milk. International Dairy
Journal, 6,129-145.
El-Din M.Z. & Aoki, T. (1993) High performance of gel and ion-exchange
chromatography of buffalo casein. International Dairy Journal, 3,141-147.
FAO, Food and Agriculture Organization of the United Nations (1998)
Statistical Databases of1997, FAO, Rome, Italy.
Farah, Z. (1986) Effect of heat treatment on whey proteins of camel milk.
Milchwissenschaft, 41,763-765.
Farah, Z. & Bachmann M.R. (1987) Rennet coagulation properties of camel
milk. Milchwissenschaft, 42, 689-692.
Farah, Z, & Riiegg, M.W. (1989) The size distribution of casein micelles in
camel milk. Food microstructure, 8, 211-216.
Farah, Z., Streiff, T. & Bachmann, M.R. (1990) Preparation and consumer
acceptability tests of fermented camel milk in Kenya. Journal of Dairy
Research, 57, 281-283.
124
Farah, Z. & Atkins, D. (1992) Heat coagulation of camel milk. Journal of
Dairy Research, 59, 229-231.
Farah, Z. (1996) Camel milk. Properties and Products. SKAT, St. Gallen,
Switzerland.
Fenna, R., Zeng, J., & Davey, C. (1995) Structure of the green heme in
myeloperoxidase. Archives ofbiochemistry and biophysics, 316, 653-656.
Ferranti, P., Malorni, A., Nitti, G., Laezza, P., Pizzano, R., Chianese, L. &
Addeo, F. (1995) Primary structure of ovine cki-caseins: localisation of
phosphorylation sites and characterisation of genetic variants A, C and D.
Journal ofDairy Research, 62, 281-296.
Ferrari, R.P., Ghibaudi, E.M., Traversa, S., Laurenti, E., De Gioia, L. &
Salmona, M. (1997) Spectroscopic and binding studies on the interaction of
inorganic anions with lactoperoxidase. Journal of inorganic biochemistry,
68,17-26.
Folkman, J. & Shing, Y. (1992) Control of angiogenesis by heparin and other
sulfated polysaccharides. In Heparin and Related Polysaccharides, eds
D.A. Lane, I. Bjork & U. Lindahl, pp. 355-364- Plenum Press, New York,
USA.
Fornhem, C, Peterson, C.G., & Alving, K. (1996) Isolation and
characterization of porcine cationic eosinophil granule proteins.International Archives ofAllergy and Immunology, 110,132-142.
Furmanski, P., He, J., Ying, L., Bezault, J., Bhimani, R. & Ho, K. (1997)
Functional Significance of the Binding of Lactoferrin to DNA. In
Lactoferrin. Interactions and Biological Functions, eds T.W. Hutchens & B.
Lbnnerdal, pp. 313-332. Humana Press, Totowa, NJ, USA.
Gavel, Y. & von Heijne, G. (1990) Sequence differences between
glycosylated and non-glycosylated Asn-X-Thr/Ser acceptor sites:
implications for protein engineering. Protein Engineering, 3, 433-42.
Gilliland, G.L., Oliva, M.T. & Dill, J. (1991) Functional implications of the
three-dimensional structure of bovine chymosin. In Structure and Function
of the Aspartic Proteinases. Genetics, Structures, and Mechanisms, ed.
B.M. Dunn, pp. 23-37. Plenum Press, New York, USA.
125 References
Girardet, J.M., Linden, G., Loye, S., Courthaudon, J.L. & Lorient, D. (1993)
Study of mechanism of lipolysis inhibition by bovine milk proteose-peptone
component 3. Journal ofDairy Science, 76, 2156-2163.
Girardet, J.M., Saulnier, F., Driou, A., Linden, G., Coddeville, B. & Spik, G.
(1994) High performance electrophoresis chromatography of bovine milk
component 3 glycoproteins. Journal ofDairy Science, 77,1205-1215.
Girardet, J.M., Coddeville, B., Plancke, Y., Strecker, G., Campagna, S., Spik,G. & Linden, G. (1995) Structure of glycopeptides isolated from bovine milk
component PP3. European Journal ofBiochemistry, 234, 939-946.
Girardet, J.M. & Linden, G. (1996) PP3 component of bovine milk: a
phosphorylated whey glycoprotein. Journal of Dairy Research, 63, 333-
350.
Gorban, A.M.S. & Izzeldin, O.M. (1997) Mineral content of camel milk and
colostrum. Journal ofDairy Research, 64, 471-474.
Graur, D. & Higgins, D.G. (1994) Molecular evidence for the inclusion of
cetaceans within the order artiodactyla. Molecular Biology and Evolution,
11, 357-364.
Groenen, M.A.M., Dijkhof, R.J.M. & Van der Poel, J.J. (1995)
Characterization of a GlyCAMl-like gene (glycosylation-dependent cell
adhesion molecule 1) which is highly and specifically expressed in the
lactating bovine mammary gland. Gene, 158,189-195.
Groves, M.R., Dhanaraj, V., Pitts, J.E., Badasso, M., Nugent, P., Hoover, D.
& Blundell, T.L. The 2.3 A crystal structure of chymosin inhibitor
complexed with a reduced inhibitor shows that the active site beta-hairpin
flap is rearranged when compared to the native structure. To be published.
Guex, N., & Peitsch, M.C. (1997) SWISS-MODEL and the Swiss-PdbViewer:
An environment for comparative protein modelling. Electrophoresis, 18,
2714-2723.
Gustchina, E.A., Majer, P., Rumsh, L.D., Ginodman, L.M. & Andreeva, N.S.
(1998) Post X-ray crystallographic studies of chymosin specificity.Advances in Experimental Medicine and Biology, 436,179-184.
126
Gutierrez-Adan, A., Maga, E.A., Meade, H., Shoemaker, C.F., Medrano, J.F.,
Anderson, G.B. & Murray, J.D. (1996) Alterations of the physicalcharacteristics of milk from transgenic mice producing bovine K-casein.
Journal ofDairy Science, 79, 791-799.
Hagrass, A.E., Hassan, A.A., Soryal, K.A., Mervat, A.S. & El-Shabrawy, S.A.
(1987) Chemical composition of fat and butter of camel's milk. EgyptianJournal ofFood Science, 15,15-25.
Hambraeus, L. (1992) Nutritional Aspects of Milk Proteins. In Advanced
Dairy Chemistry-1. Proteins, ed. P.F. Fox, pp. 470-490. Elsevier AppliedScience, London, UK.
Hansen, J.E., Lund, O., Engelbrecht, J., Bohr, H., Nielsen, J.O., Hansen, J-
E.S. & Brunak, S. (1995) Prediction of O-glycosylation of mammalian
proteins: Specificity patterns of UDP-GalNAc:-polypeptide N-
acetylgalactosaminyltransferase. Biochemical Journal, 308, 801-813-
Hassan, A.A., Hagrass, A.E., Soryal ,K.A. & El Shabrawy, S.A. (1987)
Physico-chemical properties of camel milk during lactation period in Egypt.Egyptian Journal ofFood Science, 15,1-14.
Herandez, M.C.M., Van Markwijk, B.W. & Vreeman, H.J. (1990) Isolation
and properties of lactoperoxidase form bovine milk. Netherlands Milk and
Dairy Journal, 44, 213-231.
Hipp, N.J., Groves, M.L., Custer, J.H. & McMeekin, T.L. (1952) Separationof a-, (3-, and y-Casein. Journal ofDairy Science, 35, 272-281.
Hori, H., Fenna, R.E., Kimura, S. & Ikeda-Saito, M. (1994) Aromatic
substrate molecules bind at the distal heme pocket of myeloperoxidase.Journal ofBiological Chemistry, 269, 8388-8392.
Holt, C. & Home, D.S. (1996) The hairy casein micelle: Evolution of the
concept and its implications for dairy technology. Netherlands Milk and
Dairy Journal, 50, 85-111.
Home, D.S., Parker, T.G. & Dalgleish, D.G. (1989) Casein micelles,
polycondensation and fractals. Food Colloids, 75, 400-405.
127 References
Houen, G., Madsen, M.T., Harlow, K.W., Loenblad, P. & Foltmann, B.
(1996) The primary structure and enzymic properties of porcine
prochymosin and chymosin. International Journal of Biochemistry and
Cell Biology, 28, 667-675.
Hu, S., Treat, R.W. & Kincaid, J.R. (1993) Distinct heme active-site
structure in lactoperoxidase revealed by resonance Raman spectroscopy.
Biochemistry, 32,10125-10130.
Inouye, M., Arnheim, N. & Sternglanz, R. (1973) Bacteriophage T7 lysozymeis an N-acetylmuramyl-L-alanine amidase. Journal of Biological
Chemistry, 248, 7247-7252.
Jakob, E. (1993) Beziehungen zwischen dem genetischen Polymorphismusder Milchproteine und der Labfahigkeit von Milch. Diss. ETH Nr. 10224,
Swiss Federal Institute of Technology, Zurich, Switzerland.
Jakob, E. (1994) Genetic polymorphism of milk proteins. International
Dairy Federation Bulletin, 298,17-27.
Jelen, P. (1973) Whipping studies with partially delactosed cheese whey.Journal ofDairy Science, 56,1505-1511.
Johnsen, L.B., Sorensen, E.S., Petersen, T.E. & Berglund, L. (1995)
Characterization of a bovine mammary gland PP3 cDNA reveals homologywith mouse and rat adhesion molecule GlyCAM-1. Biochimica et BiophysicaActa, 1260,116-118.
Johnsen, L.B., Petersen, T.E. & Berglund, L. (1996) The bovine PP3 gene is
homologous to the murine GlyCAM-1 gene. Gene, 169, 297-298.
Josephy, P.D. (1996) The role of peroxidase-catalyzed activation of aromatic
amines in breast cancer. Mutagenesis, 11, 3-7.
Kamoun, M. (1990) Cheese production from camel's milk. OptionsMediterraneennes, A12,119-124.
Kamoun, M. (1995) Dromedary milk: production, quality and suitability for
transformation. Options Mediterraneennes, B 13, 81-103.
128
Kang, D., Liu, G., Lundstrom, A., Gelius, E. & Steiner, H. (1998) A
peptidoglycan recognition protein in innate immunity conserved from
insects to humans. Proceedings of the National Academy ofSciences of the
USA, 95,10078-10082.
Kanno, C. (1989 a) Characterization of multiple forms of lactophorinisolated from bovine milk whey. Journal ofDairy Science, 72,1732-1739-
Kanno, C. (1989 b) Purification and separation of multiple forms of
lactophorin from bovine milk whey and their immunological and
electrophoretic properties. Journal ofDairy Science, 72, 883-891.
Kanno, C. & Ogawa, H. (1989) Proteolytic degradation of lactophorin from
bovine milk by plasmin and trypsin. Japanese Journal of Zootechnical
Science, 9, 865-873.
Kappeler, S., Farah, Z. & Puhan, Z. (1998) Sequence analysis of Camelus
dromedarius milk caseins. Journal ofDairy Research, 65, 209-222.
Kawamura, K., Satow, H., Do, I.L., Sakai, S., Takada, S. & Obinata, M.
(1987) Modulation of the transferred mouse 26K casein gene in mouse L
cells by glucocorticoid hormone. Journal ofBiochemistry, 101,103-110.
Kester, J.J. & Brunner, J.R. (1982) Milk fat-globule membrane as possible
origin of proteose-peptone glycoproteins. Journal of Dairy Science, 65,
2241-2252.
Kiselev, S.L., Kustikova, O.S., Korobko, E.V., Prokhortchouk, E.B.,
Kabishev, A.A., Lukanidin, E.M. & Georgiev, G.P. (1998) Molecular cloningand characterization of the mouse tag7 gene encoding a novel cytokine.Journal ofBiological Chemistry, 273,18633-18639.
Knoess, K.H., Makhudum, A.J., Rafiq, M. & Hafeez, M. (1986). Milk
production potential of the dromedary with special reference to the
province of Punjab, Pakistan. WorldAnimal Review, 57,11-21.
Kozak, M. (1989) The scanning model for translation: an update. Journal of
Cell Biology, 108, 229-241.
129 References
Kumosinski, T.F., Brown, E.M. & Farrell, H.M. (1993) Three-dimensional
molecular modeling of bovine caseins: a refined, energy-minimizedK-casein
structure. Journal ofDairy Science, 76, 2507-2520.
Kustikova, O.S., Kiselev, S.L., Borodulina, O.R., Senin, V.M., Afanas'eva,A.V. & Kabishev, A.A. (1996) Cloning of the tag7 gene expressed in
metastatic mouse tumors. Russian Journal ofGenetics, 32, 540-546.
Lasky, L.A., Singer, M.S., Dowbenko, D., Imai, Y., Henzel, W.J., Grimley, C,
Fennie, C, Gillett, N., Watson, S.R. & Rosen, S.D. (1992) An endothelial
ligand for L-selectin is a novel mucin-like molecule. Cell, 69, 927-938.
Li, H., Zhang, Y., Dong, Y. & Yang, K. (1998) Functional implications of the
21-24 loop in recombinant prochymosin. Biochimica et Biophysica Acta,
1384,121-129.
Lister, I.M.B., Rasmussen, L.K., Johnsen, L.B., Moller, L., Petersen, T.E. &
Sorensen, E.S. (1998) The primary structure of caprine PP3: amino acid
sequence, phosphorylation, and glycosylation of component PP3 from the
proteose-peptone fraction of caprine milk. Journal of Dairy Science, 81,
2111-2115.
Lozovich, S. (1995) Medical uses of whole and fermented mare milk in
Russia. Cultured Dairy Products Journal, 30,18-21.
Mahfouz, M.B., El-Sayed, E.M., Abd El-Gawad, LA., El-Etriby, H. & Abd El-
Salam, A.M. (1997) Structural studies on colostrum and milk lactoferrins
from different species. Egyptian Journal ofDairy Science, 25,41-53.
Maniatis, T., Sambrook, J. & Fritsch, E.F. (1989) Molecular Cloning, 2nd
edn. Cold Spring Harbor Laboratory Press, New York, USA.
Mantafounis, D. & Pitts, J. (1990) Protein engineering of chymosin;modification of the optimum pH of enzyme catalysis. Protein Engineering,
3, 605-609.
Martinat, N., Huet, J.C., Nespoulous, C, Combarnous, Y. & Pernollet, J.C.
(1991) Determination of the primary and secondary structures of the
dromedary (Camelus dromedarius) prolactin and comparison with
prolactins from other species. Biochimica et Biophysica Acta, 1077, 339-
345.
130
Masson, P.L. (1970) La lactoferrine, proteine des secretions externes et des
leucocytes neutrophiles. Editions Arsca S.A., Brussels, Belgium.
Matsudaira, P.T. (1989) A practical guide to protein and peptide
purificationfor microsequencing. Academic Press, Inc., San Diego, USA.
Mehaia, M.A. (1987) Studies of camel casein micelles: treatment with
soluble and immobilised neuraminidase. Carbohydrate Polymers, 7, 361-
369.
Mehaia, M.A. (1988) Enzymatic coagulation of camel milk. A study usingsoluble and immobilized chymosin. Milchwissenschaft, 43, 438-441.
Mehaia, M.A. (1995) The fat globule size distribution in camel, goat, ewe
and cow milk. Milchwissenschaft, 50, 260-263.
Montet, D. (1997) Proof of pasteurization of camel milk - Lecture held
during a seminar on a project proposal for a joined EU/IGAD programme
on camel husbandry in Eastern Africa.
Moore, S.A., Anderson, B.F., Groom, C.R., Haridas, M. & Baker, E.N. (1997)
Three-dimensional structure of diferric bovine lactoferrin at 2.8 A
resolution. Journal ofMolecular Biology, 274, 222-236.
Mora-Gutierrez, A., Farrell, H.M. & Kumosinski, T.F. (1993) Comparison of
calcium-induced associations of bovine and caprine caseins and the
relationship of asl-casein content to colloidal stabilisation: a
thermodynamic linkage analysis. Journal ofDairy Science, 76, 3690-3697.
Morrison, W.R. (1968) The distribution of phospholipids in some
mammalian milks. Lipids, 3,101-103-
Ng, W.C., Brunner, J.R. & Rhee, K.C. (1970) Proteose-peptone fraction of
bovine milk: lacteum serum component 3 - a whey glycoprotein. Journal of
Dairy Science, 53, 987-996.
Nicholson, M.W., Barclay, A.N., Singer, M.S., Rosen, S.D. & Van-der-
Merwe, P.A. (1998) Affinity and kinetic analysis of L-selectin (CD62L)
binding to glycosylation-dependent cell-adhesion molecule-1. Journal of
Biological Chemistry, 273, 763-770.
131 References
Nielsen, H., Engelbrecht, J., Brunak, S. & von Heijne, G. (1997)
Identification of prokaryotic and eukaryotic signal peptides and predictionof their cleavage sites. Protein Engineering, 10,1-6.
Nishimura, T., Takeshita, N., Satow, H. & Kohomoto, K. (1993) Expressionof the mC26 gene encoding GlyCAM-1 in the lactating mouse mammary
gland. Journal ofBiochemistry, 114, 567-569.
Noppe, W., Hanssens, I. & De Cuyper, M. (1996) Simple two-step procedurefor the preparation of highly active pure equine milk lysozyme. Journal of
Chromatography, 719, 327-331.
Oakley, G.G., Devanaboyina, U., Robertson, L.W. & Gupta, R.C. (1996)
Oxidative DNA damage induced by activation of polychlorinated biphenyls
(PCBs): implications for PCB-induced oxidative stress in breast cancer.
Chemical research in toxicology, 9,1285-1292.
Paquet, D., Nejjar, Y. & Linden, G. (1988) Study of a hydrophobic proteinfraction isolated from milk proteose-peptone. Journal ofDairy Science, 71,
1464-1471.
Paul, K.G. & Ohlsson, P.I. (1985) The chemical structure of lactoperoxidase.In: The Lactoperoxidase System, Chemistry and Biological Significance,
eds K.M. Pruitt, & J.O. Tenovuo, pp. 15-29. Marcel Dekker Inc., New York,
USA.
Pisano, A., Packer, N.H., Redmond, J.W., Williams, K.L. & Gooley, A.A.
(1994) Characterisation of O-linked glycosylation motifs in the glycopeptideof bovine K-casein. Glycobiology, 4, 837-844.
Plowman, J.E. & Creamer, L.K. (1995) Restrained molecular dynamics
study of the interaction between bovine K-casein peptide 98-111 and bovine
chymosin and porcine pepsin. Journal ofDairy Research, 62,451-467.
Plowman, J.E., Creamer, L.K., Smith, M.H. & Hill, J.P. (1997) Restrained
molecular dynamics investigation of the differences in association of
chymosin to K-caseins A and C. Journal ofDairy Research, 64, 299-304.
Ramet, J.P. (1987) Use of bovine calf rennet to coagulate raw camel milk.
WorldAnimal Review, 61,11-16.
132
Ramet, J.P. (1991) Processing camel milk into cheese. Revue Mondiale de
Zootechnique, 61, 21-28.
Ravanis, S. & Lewis, M.J. (1995) Observations on the effect of raw milk
quality on the keeping quality of pasteurised milk. Letters in Applied
Microbiology, 20,164-167.
Rawlings, N.D. & Barrett, A.J. (1995) Families of aspartic peptidases, and
those of unknown catalytic mechanism. Methods in Enzymology, 248,105-
120.
Richardson, T., Oh, S. & Jimenez-Flores, R. (1992) Molecular modelling and
genetic engineering of milk proteins. In: Advanced Dairy Chemistry-1.Proteins, ed. P.F. Fox, pp. 545-577. Elsevier Applied Science, London, U.K.
Rosen, J.M. (1987) Milk protein gene structure and expression. In: The
Mammary Gland, pp. 301-322 (Ed. M.C. Neville, C.W. Daniel). Plenum
Publishing Corporation, London, U.K.
Saito, H., Takase, M„ Tamura, Y., Shimamura, S. & Tomita, M. (1994)
Physicochemical and antibacterial properties of lactoferrin and its
hydrolysate produced by heat treatment at acidic pH. In Lactoferrin.Structure and Function, eds T.W. Hutchens, S.V. Rumball & B. Lonnerdal,
pp. 21-31. Plenum Press, New York, USA.
Salamov A.A. & Solovyev V.V. (1997) Protein secondary structure prediction
using local alignments. Journal ofMolecular Biology, 268, 31-36.
Schanbacher, F.L., Goodman, R.E. & Talhouk, R.S. (1993) Bovine
Mammary Lactoferrin: Implications from Messenger Ribonucleic Acid
(mRNA) Sequence and Regulation Contrary to Other Milk Proteins. Journal
ofDairy Science, 76, 3812-3831.
Schlee, P. & Rottmann, 0.1992 Identification of bovine K-casein C using the
polymerase chain reaction. Journal ofAnimal Breeding and Genetics, 109,
153-155.
Schlimme, E. (1990) {Compendium zur milchwirtschaftlichen Chemie. W-
GmbH Volkswirtschaftlicher Verlag, Miinchen, Germany.
133 References
Schmidt, D.G. & Koops, J. (1977) Properties of casein micelles. 2. Stabilitytowards ethanol, dialysis, pressure and heat in relation to casein
composition. Netherlands Milk and Dairy Journal 31, 342-357.
Schwartz, H.J. & Dioli, M. (1992) The one-humped camel (C. dromedarius)in Eastern Africa: a pictorial guide to diseases, health care, and
management. Verlag Josef Margraf, Weikersheim, Germany.
Shimizu, M., Yamauchi, K. & Saito, M. (1989) Emulsifying properties of the
proteose-peptone fraction obtained from bovine milk. Milchwissenschaft,44,497-500.
Sielecki, A.R., Fujinaga, M., Read, R.J. & James, M.N. (1991) Refined
structure of porcine pepsinogen at 1.8 A resolution. Journal of Molecular
Biology, 219, 671-692.
Singer, M.S. & Rosen, S.D. (1996) Purification and quantification of L-
selectin-reactive GlyCAM-1 from mouse serum. Journal ofImmunologicalMethods, 196,153-161.
Smit, A.F.A. (1996) Origin of interspersed repeats in the human genome.
Current Opinion in Genetics and Development, 6, 743-748.
Solovyev, V.V., Salamov, A.A. & Lawrence, C.B. (1994) Predicting internal
exons by oligonucleotide composition and discriminant analysis of
spliceable open reading frames. Nucleic Acids Research, 22, 5156-5163.
Sorensen, E.S. & Petersen, T.E. (1993) Phosphorylation, glycosylation and
amino acid sequence of component PP3 from the proteose peptone fraction
of bovine milk. Journal ofDairy Research, 60,535-542.
Sorensen, E.S., Rasmussen, L.K., Moller, L. & Petersen, T.E. (1997) The
localization and multimeric nature of component PP3 in bovine milk:
purification and characterization of PP3 from caprine and ovine milks.
Journal ofDairy Science, 80,3176-3181.
Spik, G., Coddeville, B., Mazurier, J., Bourne, Y., Cambillaut, C. &
Montreuil, J. (1994) Primary and three-dimensional structure of
lactotransferrin (lactoferrin) glycans. In Lactoferrin. Structure and
Function, eds T.W. Hutchens, S.V. Rumball & B. Lonnerdal, pp. 21-31.
Plenum Press, New York, USA.
134
Strop, P., Sedlacek, J., Stys, J., Kaderabkova, Z., Blaha, I., Pavlickova, L.,
Pohl, J., Fabry, M., Kostka, V., Newman, M., Frazao, C, Shearer, A., Tickle,I.J. & Blundell, T.L. (1990) Engineering enzyme subsite specificity:preparation, kinetic characterization, and X-ray analysis at 2.0-A resolution
of VallllPhe site-mutated calf chymosin. Biochemistry, 29, 9863-9871.
Suguri, T., Kikuta, A., Iwagaki, H., Yoshino. T., Tanaka, N. & Orita, K.
(1996) Increased plasma GlyCAM-1, a mouse L-selectin ligand, in response
to an inflammatory stimulus. Journal ofLeukocyte Biology, 60, 593-597.
Sukhov, S.V., Kalamkarova, L.I., Il'chenko, L.A. & Zhangabylov, A.K. (1986)
Changes in the microflora of the small and large intestine in patients with
chronic enteritis after dietary treatment with cultured milk products.Voprosy Pitaniya, 4,14-17.
Swaisgood, H.E. (1992) Chemistry of the Caseins. In Advanced Dairy
Chemistry-1. Proteins, ed. P.F. Fox, pp. 63-110. Elsevier Applied Science,
London, UK.
Tomita, M., Takase, M., Wakabayashi, H. & Bellamy, W. (1994)Antimicrobial peptides of lactoferrin. In Lactoferrin. Structure and
Function, eds T.W. Hutchens, S.V. Rumball & B. Lonnerdal, pp. 21-31.
Plenum Press, New York, USA.
Ueda, T., Sakamaki, K., Kuroki, T., Yano, I. & Nagata, S. (1997) Molecular
cloning and characterization of the chromosomal gene for human
lactoperoxidase. European Journal ofBiochemistry, 243, 32-41.
Van Berkel, P.H., Geerts, M.E., Van Veen, H.A., Mericskay, M., De Boer,
H.A. & Nuijens, J.H. (1997) N-terminal stretch Arg2, Arg3, Arg4 and Arg5 of
human lactoferrin is essential for binding to heparin, bacterial
lipopolysaccharide, human lysozyme and DNA. Journal of Biochemistry,
328,145-151.
Visser, S., Slangen, C. J. & Van Rooijen, P.J. (1987) Peptide substrates for
chymosin (rennin). Biochemical Journal, 244, 553-558.
Vlodavsky, I., Ishai-Michaeli, R., Mohsen, M., Bar-Shavit, R., Catane, R.,
Ekre, H.P. & Svahn, CM. (1992) Modulation of neovascularization and
metastasis by species of heparin. In Heparin and Related Polysaccharides,
135 References
eds D.A. Lane, I. Bjork & U. Lindahl, pp. 317-327. Plenum Press, New York,USA.
Wangoh, J., Farah, Z. & Puhan, Z. (1993) Extraction of camel rennet and its
comparison with calf rennet extract. Milchwissenschqft, 48,322-325.
Wangoh, J. (1997) Chemical and Technological Properties of Camel
(Camelus dromedarius) Milk. Diss. ETH Nr. 12295, Swiss Federal Institute
of Technology, Zurich, Switzerland.
Williams, M.G., Wilsher, J., Nugent, P., Mills, A., Dhanaraj, V., Fabry, M.,
Sedlacek, J., Uusitalo, J.M., Penttila, M.E., Pitts, J.E. & Blundell, T.L. (1997)
Mutagenesis, biochemical characterization and X-ray structural analysis of
point mutants of bovine chymosin. Protein Engineering, 10, 991-997.
Wilson, T., Araya, A. & Melaku, A. (1990) The One-Humped Camel. An
Analytical and Annotated Bibliography. UNSO Technical Publication,
Umberleigh, UK.
Yagil, R. & Etzion, Z. (1980) Effect of drought condition on the quality of
camel milk. Journal ofDairy Research, 47,159-166.
Yagil, R. (1987) Camel milk - a review. International Journal of Animal
Science, 2, 81-99-
Yolken, R.H., Peterson, J.A., Vonderfecht, S.L., Fouts, E.T., Midthun, K. &
Newburg, D.S. (1992) Human milk mucin inhibits rotavirus replication and
prevents experimental gastroenteritis. Journal ofClinial Investigation, 90,1984-1991.
Yolken, R.H., Ojeh, C, Khatri, LA., Sajjan, U. & Forstner, J.F. (1994)Intestinal mucins inhibit rotavirus replication in an oligosaccharide-dependent manner. Journal ofInfectious Diseases, 169,1002-1006.
Yoshida, H., Kinoshita, K. & Ashida, M. (1996) Purification of a
peptidoglycan recognition protein from hemolymph of the silkworm,
Bombyx mori. Journal ofBiological Chemistry, 271,13854-13860.
Ziere,G.J., Bijsterbosch, M.K. & Van Berkel, T.J. (1993) Removal of 14 N-
terminal amino acids of lactoferrin enhances its affinity for parenchymal
136
liver cells and potentiates the inhibition of beta- very low density
lipoprotein binding. Journal ofBiological Chemistry, 268, 27069-27075.
137 Curriculum Vitae
CURRICULUM VITAE
1968-07-25 Born, as second child of Robert and Susanne Kappeler-
Mosberger, in Zurich, Switzerland.
1975 - 1980 Primary School, Baden, Switzerland.
1980 - 1984 Secondary School, Baden, Switzerland.
1984-1988 High School, Baden, Switzerland. Completed with a
Matura A.
Autumn 1988 Military Education at the Division for Artillery,Frauenfeld, Switzerland.
Spring 1989 Study of English Language at International House,
Hastings, UK. Completed with Cambridge First
Certificate in English, Arels Higher Certificate in Spoken
English and Comprehension, and Oxford Examination,
Higher Level.
1989 - 1994 Study of General Biology at the Swiss Federal Institute of
Technology, Zurich, Switzerland. Completed with a
Diploma Thesis in Plant Genetics, titled "Circadian
Oscillations ofAtgrp andAfglp transcripts inArabidopsisthaliana and Immunocytochemical Localisation of the
Corresponding Proteins in Sinapis alba", and with a
Diploma in Natural Sciences (Cell Biology, Molecular
Biology, Microbiology, Plant Physiology, Biochemistry,and Biotechnology).
1995 -1998 Assistant Research Work at the Institute of Food
Technology, Swiss Federal Institute of Technology,Zurich, Switzerland.