Embed Size (px)
Citation preview

Comprehending Knowledge-Space Diagrams: Experiments and a Model
Christof Körner University of Graz
ERASMUS Intensive Seminar
Graz 2005
Supported by
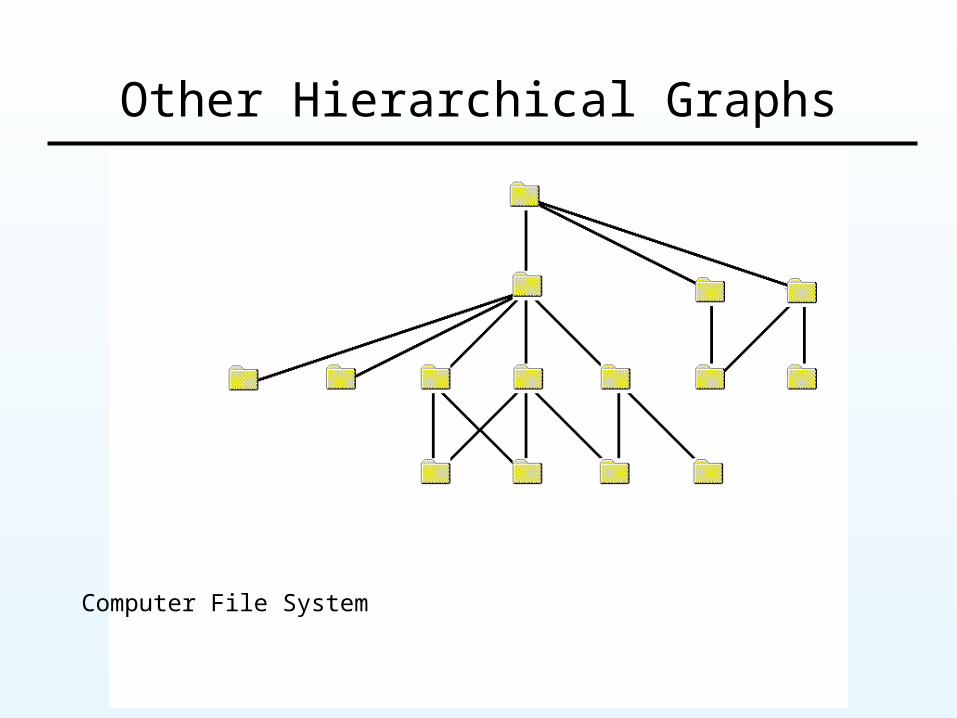
Other Hierarchical Graphs
Computer File System

More Hierachical Graphs
Organisation Chart

More Hierachical Graphs
Preference Graph

Visual Properties: Planarity
Non-crossedcrossed

Visual Properties: Slopes
uprightslanted

Visual Properties: Levels
horizontalnon-horizontal

Visual Properties and Graphs
Crossed, slanted, non-horizontalNon-crossed, upright, horizontal

Early Experiments: Paradigm

Early Experiments: Results
Different Prior Knowledge
PlanaritySlopesLevels

Early Experiments: Results
Number of Comparisons
PlanaritySlopesLevels
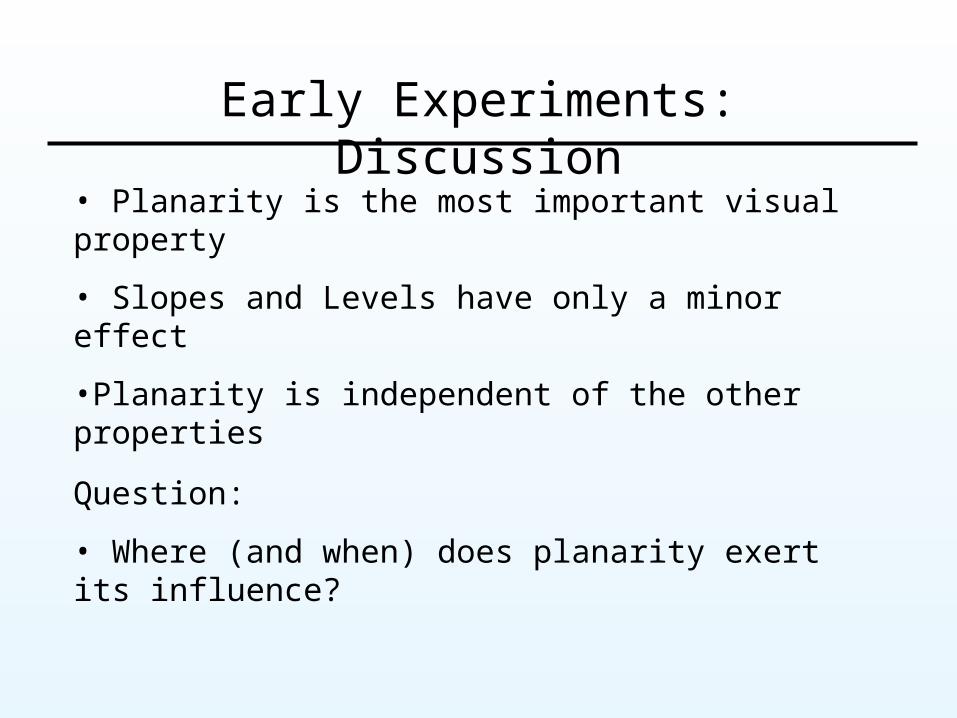
Early Experiments: Discussion
• Planarity is the most important visual property
• Slopes and Levels have only a minor effect
•Planarity is independent of the other properties
Question:
• Where (and when) does planarity exert its influence?
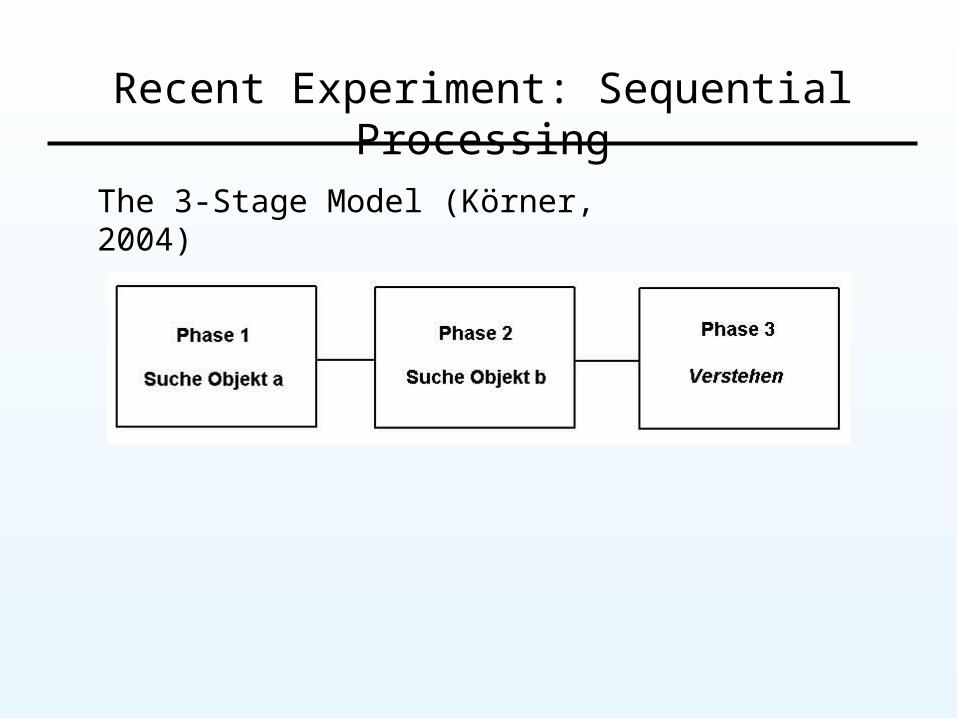
Recent Experiment: Sequential Processing
The 3-Stage Model (Körner, 2004)

Paradigm: Sequence of Events

Results
0
100
200
300
400
Planarity Slopes Levels
Lat
ency
Dif
fere
nce
(m
s)
0
0.5
1
1.5
2
Dif
fere
nce
of
Fix
atio
n N
um
ber

Data Analysis: Scanpath Decomposition
• When was the first object fixated? End of Stage 1
• When was the second object fixated? End of Stage 2
• What happens then? Start of Stage 3 ?
• When does the manual response occur?

Results

Results
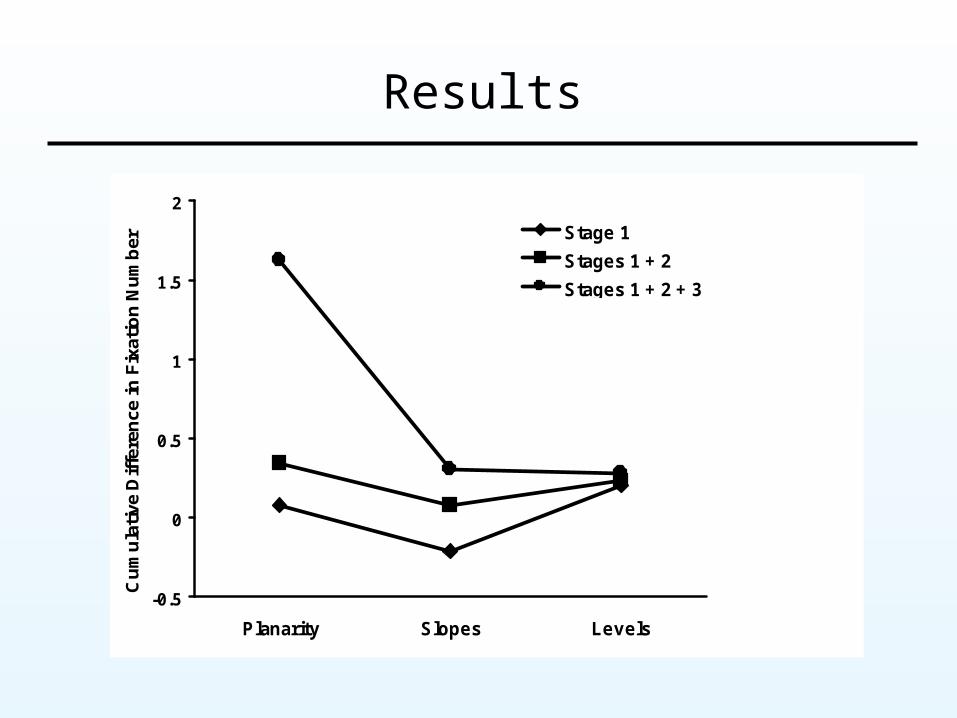
Results
-0.5
0
0.5
1
1.5
2
Planarity Slopes Levels
Cu
mu
lati
ve D
iffe
ren
ce in
Fix
atio
n N
um
ber
Stage 1
Stages 1 + 2
Stages 1 + 2 + 3

Discussion
• Is graph processing in 3 stages a waste of time?
NO!
• Visual search for a target object amongst a set of distractor objects is highly efficient and effortless
• An additional search stage does not slow down graph processing much
• A pure reasoning stage can focus on the relation of the objects located earlier
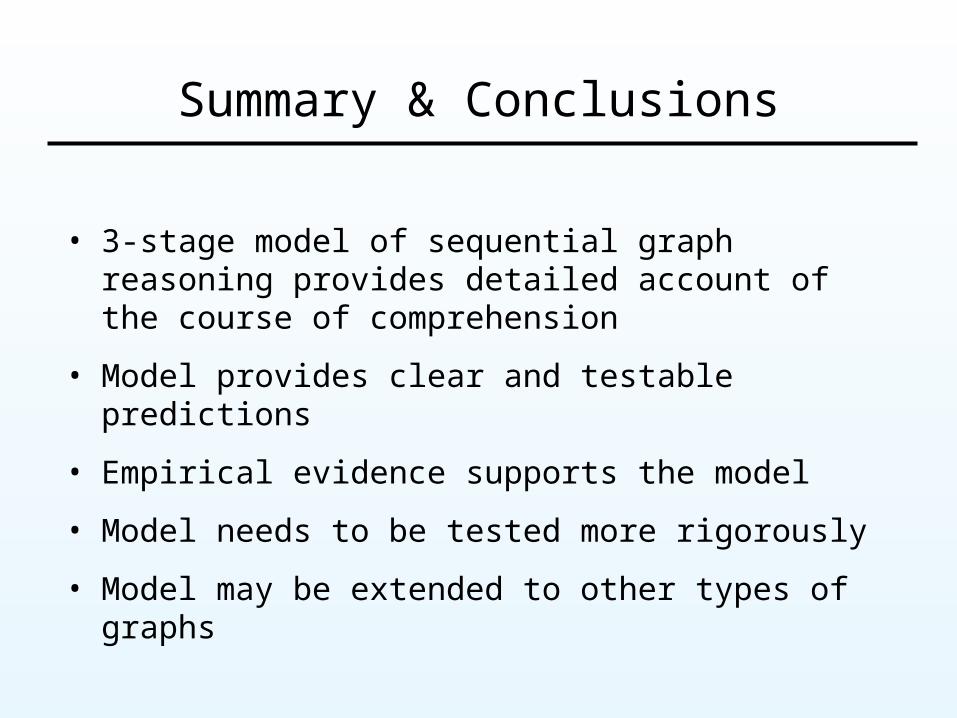
• 3-stage model of sequential graph reasoning provides detailed account of the course of comprehension
• Model provides clear and testable predictions
• Empirical evidence supports the model
• Model needs to be tested more rigorously
• Model may be extended to other types of graphs
Summary & Conclusions

Current: Gaze Contingent Displays

Current: Gaze Contingent Displays

Thank you!
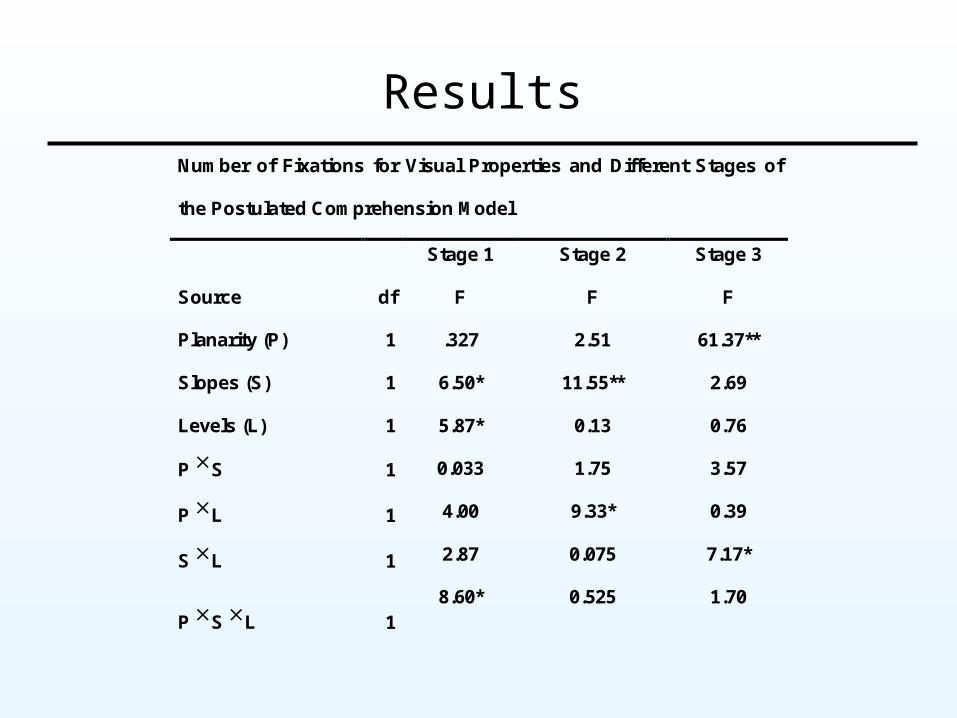
ResultsNumber of Fixations for Visual Properties and Different Stages of
the Postulated Comprehension Model
Stage 1 Stage 2 Stage 3
Source df
Planarity (P) 1
Slopes (S) 1
Levels (L) 1
P S 1
P L 1
S L 1
P S L 1
F
.327
6.50*
5.87*
0.033
4.00
2.87
8.60*
F
2.51
11.55**
0.13
1.75
9.33*
0.075
0.525
F
61.37**
2.69
0.76
3.57
0.39
7.17*
1.70

The Future: Where do we go next?
• Search stages are functionally equivalent

The Future - Results: Pilot Study
0
20
40
60
80
100
120
Planarity Slopes Levels
Tim
e t
o F
ixat
ion
Dif
fere
nce
(m
s)
0
0.1
0.2
0.3
0.4
0.5
0.6
Nu
mb
er
of
Fix
atio
ns
Dif
fere
nce

The Future: Graphs and Visual Search

The Future: Where do we go next?
• Search stages are functionally equivalent
• Reasoning stage is separated