Embed Size (px)
Citation preview

The Republic of South Sudan
Ministry of Agriculture, Forestry, Cooperatives and Rural Development
Ministry of Livestock and Fisheries Industries
Comprehensive Agricultural Development Master Plan
Final Report
Annex IV
Situation Analysis Report 2013/2015
May 2015
Japan International Cooperation Agency
JIN Corporation
15-036JRRD


i
Map of South Sudan
Source: Data from the National Baseline Household Survey 2009. Prepared by NBS/CAMP Task Team.
.

ii
Table of contents
Map of South Sudan ............................................................................................................ i
EXECUTIVE SUMMARY ................................................................................................. xxiv
Part 1: Situation Analysis 2013
1. Introduction ............................................................................................................ 1-1
1.1 Background and objective .................................................................................... 1-1 1.1.1 Background .................................................................................................. 1-1 1.1.2 Justification for CAMP formulation ................................................................ 1-3 1.1.3 Objective of the CAMP process .................................................................... 1-3 1.1.4 Target subsectors and geographic area ........................................................ 1-3 1.1.5 Implementation and collaborating ministries ................................................. 1-3
1.2 Guiding principles ................................................................................................. 1-4
1.3 Coordination mechanism ...................................................................................... 1-5
1.4 Work schedule...................................................................................................... 1-7
1.5 Objectives and methodology of the situation analysis ........................................... 1-8 1.5.1 Objectives ..................................................................................................... 1-8 1.5.2 Methodology ................................................................................................. 1-9
1.6 Progress from August 2012 to July 2013 ............................................................ 1-11
2. South Sudan’s economy and agriculture: an overview ....................................... 2-1
2.1 South Sudan’s economy in a historical context ..................................................... 2-1 2.1.1 Pre-Independence Sudan ............................................................................. 2-1 2.1.2 Independence of Sudan ................................................................................ 2-2 2.1.3 After the Comprehensive Peace Agreement ................................................. 2-9 2.1.4 Independence of South Sudan .................................................................... 2-10
2.2 South Sudan’s economy in a regional context .................................................... 2-11 2.2.1 Comparison of socioeconomic situation with neighbouring countries .......... 2-11 2.2.2 Economic relations with neighbouring countries .......................................... 2-13 2.2.3 Participation in regional economic integration ............................................. 2-15
2.3 Importance of agriculture in the national economy .............................................. 2-16
2.4 Overview and recent performance of the agricultural sector ............................... 2-18
3. Natural conditions and environment .................................................................... 3-1
3.1 Natural conditions ................................................................................................. 3-1 3.1.1 Topography .................................................................................................. 3-1 3.1.2 Climate ......................................................................................................... 3-2 3.1.3 Geology and hydrogeology ........................................................................... 3-5 3.1.4 Soils .............................................................................................................. 3-7 3.1.5 Hydrology and water resources .................................................................... 3-7 3.1.6 Vegetation .................................................................................................. 3-10
3.2 Land resources and land use ............................................................................. 3-11
3.3 Livelihood zones ................................................................................................. 3-14
3.4 Environmental issues ......................................................................................... 3-15 3.4.1 Climate change and disaster risk management ........................................... 3-15 3.4.2 Deforestation and land degradation ............................................................ 3-15 3.4.3 Loss of biodiversity resources ..................................................................... 3-17 3.4.4 Lack of effective environmental governance ............................................... 3-17

iii
4. Policy and legal framework for agricultural development ................................... 4-1
4.1 South Sudan Development Plan (SSDP) .............................................................. 4-1
4.2 Current agricultural policies and strategic plans.................................................... 4-2
4.3 Agriculture-related policies and strategic plans ..................................................... 4-3 4.3.1 Land Policy ................................................................................................... 4-3 4.3.2 Strategy for cooperative development ........................................................... 4-4 4.3.3 Other agriculture related policies and strategies ........................................... 4-4
4.4 Major legal frameworks ........................................................................................ 4-5
4.5 Observations ........................................................................................................ 4-6
5. Institutional framework for agricultural development ......................................... 5-1
5.1 Public sector organisations ................................................................................... 5-1 5.1.1 National government ..................................................................................... 5-1 5.1.2 Lead ministries .............................................................................................. 5-2 5.1.3 State and local governments ......................................................................... 5-4 5.1.4 Objectives of Local Government ................................................................... 5-4 5.1.5 Functions of local government ...................................................................... 5-5 5.1.6 Coordination among lead ministries .............................................................. 5-6 5.1.7 Coordination between levels of government ................................................. 5-6
5.2 Public sector capacity ........................................................................................... 5-7 5.2.1 National government ..................................................................................... 5-7 5.2.2 State ministries and county offices .............................................................. 5-10
5.3 Private sector organizations ............................................................................... 5-17 5.3.1 Farmers organizations ................................................................................ 5-17 5.3.2 Agro-input dealers ...................................................................................... 5-17 5.3.3 Processors and traders ............................................................................... 5-18 5.3.4 Financial institutions .................................................................................... 5-19
5.4 Greater Juba market in the context of regional integration .................................. 5-27 5.4.1 Regional market integration ........................................................................ 5-27 5.4.2 Overview of Juba market ............................................................................ 5-27 5.4.3 Functions of Juba market ............................................................................ 5-28 5.4.4 Market arrivals ............................................................................................ 5-30 5.4.5 Organisation of marketing in Juba ............................................................... 5-33 5.4.6 Market trend and competitiveness .............................................................. 5-33 5.4.7 Conclusions ................................................................................................ 5-37
5.5 Education and Training ....................................................................................... 5-37 5.5.1 Background ................................................................................................ 5-37 5.5.2 Government agricultural training centres ..................................................... 5-38 5.5.3 Non-governmental institutions ..................................................................... 5-41 5.5.4 Higher educational institutions .................................................................... 5-41 5.5.5 Other government institutions and schools ................................................. 5-42 5.5.6 Observations............................................................................................... 5-45
5.6 Civil society organisations .................................................................................. 5-45
5.7 Development partners ........................................................................................ 5-46
6. Public financial management and related institutional capacities ..................... 6-1
6.1 Challenges ........................................................................................................... 6-1
6.2 Legal and institutional framework of PFM system ................................................. 6-2 6.2.1 Constitutions, acts, and regulations .............................................................. 6-3

iv
6.2.2 Definition of PFM .......................................................................................... 6-3 6.2.3 Budget preparation guidelines and circulars ................................................. 6-4 6.2.4 Budget documents ........................................................................................ 6-5 6.2.5 PFM policies ................................................................................................. 6-5 6.2.6 Pooled funding mechanisms ......................................................................... 6-6
6.3 Planning and budget procedures .......................................................................... 6-6 6.3.1 Pre-independence budget preparation procedures ....................................... 6-7 6.3.2 Budget Sector Plan development .................................................................. 6-7 6.3.3 Annual budget development ......................................................................... 6-9 6.3.4 Comparison between budget sector plan 2011-2013 and Annual
Budget 2011 .............................................................................................. 6-10 6.3.5 Post-independence planning and budget preparation procedures............... 6-12 6.3.6 Planning and budget preparation of MAFCRD and MARF .......................... 6-15 6.3.7 Planning and budget preparation of state ministries .................................... 6-16 6.3.8 Observations regarding Budget Sector Plans and Annual Budget
preparation ................................................................................................ 6-19
6.4 Budget execution control and procurement procedures ...................................... 6-19 6.4.1 Budget execution control and monitoring .................................................... 6-19 6.4.2 Procurement procedures ............................................................................ 6-20 6.4.3 Execution capacity of MAFCRD and MARF ................................................ 6-23
6.5 Alignment of aid with GRSS's PFM system ........................................................ 6-25 6.5.1 Aid coordination mechanism ....................................................................... 6-25 6.5.2 Aid coordination structure ........................................................................... 6-26 6.5.3 Natural Resources Sector Working Group .................................................. 6-27 6.5.4 Alignment of aid with MARF’s PFM system ................................................. 6-28
6.6 PFM instruments for CAMP implementation and the alignment of aid ................ 6-28 6.6.1 PFM instruments and government's concern regarding aid flows ................ 6-28 6.6.2 Four aid instruments ................................................................................... 6-29 6.6.3 Pooled funding aid instrument ..................................................................... 6-30
6.7 Planning and budget procedures involving state governments ........................... 6-31
7. Food Security ......................................................................................................... 7-1
7.1 Concept of food security ....................................................................................... 7-1
7.2 Overview of food security in South Sudan ............................................................ 7-3
7.3 Major causes of food insecurity ............................................................................ 7-4
7.4 Categories of food insecure people ...................................................................... 7-6
7.5 Farmer’s food insecurity situation ......................................................................... 7-7
7.6 Food security and the market economy .............................................................. 7-11
7.7 Roles of government organisations and development partners .......................... 7-12
8. Rural Society and Livelihood ................................................................................ 8-1
8.1 Population, Communities and Households ........................................................... 8-1
8.2 Reintegration of Returnees and Internally Displaced Persons into Rural Communities ........................................................................................................ 8-4
8.2.1 Returnees ..................................................................................................... 8-4 8.2.2 Internally Displaced Persons (IDPs) .............................................................. 8-5
8.3 Gender Issues ...................................................................................................... 8-6
8.4 Security and Conflicts ........................................................................................... 8-7

v
8.5 Land Tenure and Access to Land ......................................................................... 8-8 8.5.1 Unequal land access ..................................................................................... 8-9 8.5.2 Large-scale land acquisition ........................................................................ 8-10 8.5.3 Land boundary issues ................................................................................. 8-10
8.6 Access to Basic Services ................................................................................... 8-11
8.7 Livelihoods ......................................................................................................... 8-13
8.8 Assets ................................................................................................................ 8-14
8.9 Observations ...................................................................................................... 8-16
8.10 Infrastructure ...................................................................................................... 8-17
9. Lessons learned from previous investments ....................................................... 9-1
9.1 Cooperation with the government ......................................................................... 9-1
9.2 Coordination with DPs .......................................................................................... 9-2
9.3 Partnership with the private sector........................................................................ 9-2
9.4 Participation of farmers ......................................................................................... 9-2
10. Crop ....................................................................................................................... 10-1
10.1 Overview ............................................................................................................ 10-1
10.2 Key issues and challenges ................................................................................. 10-2
10.3 Policy framework ................................................................................................ 10-4
10.4 Institutions .......................................................................................................... 10-6 10.4.1 Ministry of Agriculture, Forestry, Cooperatives and Rural Development ..... 10-6 10.4.2 State government ....................................................................................... 10-8 10.4.3 Land Commission ..................................................................................... 10-10 10.4.4 Development Partners .............................................................................. 10-11 10.4.5 Cooperatives............................................................................................. 10-13 10.4.6 Private sector ............................................................................................ 10-15 10.4.7 Traditional institutions ............................................................................... 10-16
10.5 Food crop production........................................................................................ 10-16 10.5.1 Livelihood Zones ....................................................................................... 10-16 10.5.2 Trend of food crop production ................................................................... 10-20 10.5.3 Food crop production areas and agricultural practices .............................. 10-22 10.5.4 Types of farmers ....................................................................................... 10-28
10.6 Cash crop production ....................................................................................... 10-38 10.6.1 Overview ................................................................................................... 10-38 10.6.2 Production areas and agricultural practices .............................................. 10-39 10.6.3 Economic considerations for cash crop production ................................... 10-44
10.7 Marketing and trade ......................................................................................... 10-45 10.7.1 Characteristics of markets......................................................................... 10-45 10.7.2 Domestic distribution chain ....................................................................... 10-48 10.7.3 Imported agricultural products ................................................................... 10-49 10.7.4 Product price and cost .............................................................................. 10-51 10.7.5 Taxation .................................................................................................... 10-53 10.7.6 Collection and marketing capacity ............................................................. 10-55
10.8 Services ........................................................................................................... 10-55 10.8.1 Research .................................................................................................. 10-55 10.8.2 Training ..................................................................................................... 10-58 10.8.3 Extension services .................................................................................... 10-58

vi
10.8.4 Rural financial services ............................................................................. 10-63 10.8.5 Mechanisation ........................................................................................... 10-65 10.8.6 Agricultural inputs ..................................................................................... 10-66 10.8.7 Plant protection ......................................................................................... 10-67
10.9 Agricultural infrastructure .................................................................................. 10-67
10.10 Investment ........................................................................................................ 10-69
10.11 Cross cutting issues ......................................................................................... 10-71
11. Livestock ............................................................................................................... 11-1
11.1 Overview ............................................................................................................ 11-1
11.2 Key issues and challenges ................................................................................. 11-4
11.3 Policy framework ................................................................................................ 11-7 11.3.1 Policy review: broader policy context .......................................................... 11-7 11.3.2 Livestock subsector policy context .............................................................. 11-8 11.3.3 Legal Frameworks: Legislative and regulatory contexts ............................ 11-11
11.4 Institutions ........................................................................................................ 11-12 11.4.1 Public Sector Institutions ........................................................................... 11-12 11.4.2 Private sector ............................................................................................ 11-21 11.4.3 Educational and training institutions .......................................................... 11-22 11.4.4 Civil Society and Non-Governmental Organizations .................................. 11-24 11.4.5 Development partners ............................................................................... 11-27 11.4.6 Community and Traditional Institutions ..................................................... 11-28 11.4.7 Stakeholder Coordination ......................................................................... 11-29
11.5 Production Systems and Performance of the Livestock Subsector ................... 11-29 11.5.1 Structure of the Livestock Subsector ......................................................... 11-29 11.5.2 Production systems................................................................................... 11-40 11.5.3 Livestock productivity ................................................................................ 11-53 11.5.4 Contribution to livelihoods ......................................................................... 11-60
11.6 Endemic Animal Diseases and Pests ............................................................... 11-64 11.6.1 Priority diseases ....................................................................................... 11-64 11.6.2 Recent disease outbreaks......................................................................... 11-69 11.6.3 Disease impact ......................................................................................... 11-70
11.7 Animal Health Services .................................................................................... 11-72 11.7.1 Provision of Animal Health Services ......................................................... 11-72 11.7.2 Disease prevention and control services ................................................... 11-73
11.8 Marketing and Trade ........................................................................................ 11-82 11.8.1 Demand and supply .................................................................................. 11-82 11.8.2 Main value chains ..................................................................................... 11-86 11.8.3 Imports and Exports .................................................................................. 11-92
11.9 Services ........................................................................................................... 11-94 11.9.1 Extension Services ................................................................................... 11-94 11.9.2 Research and development ...................................................................... 11-95 11.9.3 Input Delivery Systems ............................................................................. 11-95 11.9.4 Food safety assurance .............................................................................. 11-96 11.9.5 Animal welfare .......................................................................................... 11-97
11.10 Infrastructure .................................................................................................... 11-97 11.10.1 Production facilities ................................................................................... 11-98 11.10.2 Marketing facilities .................................................................................... 11-98
11.11 Investment ........................................................................................................ 11-99

vii
11.11.1 Public sector expenditure and investment ................................................. 11-99 11.11.2 Private investment .................................................................................. 11-100 11.11.3 Development partner investment ............................................................ 11-100 11.11.4 Investment climate .................................................................................. 11-101
12. Forestry ................................................................................................................. 12-1
12.1 Overview ............................................................................................................ 12-1
12.2 Key issues and challenges ................................................................................. 12-1
12.3 Forest resources ................................................................................................ 12-3
12.4 Forest policy and legal framework ...................................................................... 12-4 12.4.1 Background ................................................................................................ 12-4 12.4.2 Major policies affecting the Forest Policy 2013 ........................................... 12-5 12.4.3 Devolution of power and benefit sharing arrangement ................................ 12-5 12.4.4 Forest Policy 2013 and legal framework ..................................................... 12-7 12.4.5 The Forest Policy 2013 ............................................................................... 12-7 12.4.6 Forestry Bill 2009 ........................................................................................ 12-9
12.5 State and local governments engaged in forest management .......................... 12-10 12.5.1 Human and physical resources ................................................................. 12-10 12.5.2 Financial resources and revenue collection .............................................. 12-11 12.5.3 Issues of revenue collection by Directorate of Forestry ............................. 12-12
12.6 Public forest reserves ....................................................................................... 12-14 12.6.1 Categories of public forest reserves .......................................................... 12-14 12.6.2 Community Forests (CFs) and enabling legal environment for their
establishment .......................................................................................... 12-15 12.6.3 Central Forest Reserves ........................................................................... 12-15 12.6.4 Forest plantations in Central Forest Reserves .......................................... 12-21 12.6.5 Field observations of Central Forest Reserves and forest plantations ....... 12-23
12.7 Concession forest management ....................................................................... 12-28 12.7.1 Equatoria Teak Company ......................................................................... 12-29 12.7.2 Blue Lakes Limited ................................................................................... 12-32 12.7.3 Central Equatoria Teak Company - legal problem ..................................... 12-33
12.8 Forestry and agroforestry by out-growers ......................................................... 12-34
12.9 Forest products market, trade, and consumption .............................................. 12-36 12.9.1 Forest products and food security, poverty reduction, and income
growth ..................................................................................................... 12-36 12.9.2 Forest products with regional and global markets ..................................... 12-38 12.9.3 Forest products with domestic and regional market .................................. 12-39 12.9.4 Forest products with subsistence and local markets ................................. 12-40
12.10 Forestry education, research, training, and extension....................................... 12-43 12.10.1 Kagelu Forestry Training Centre ............................................................... 12-43
12.11 Activities of development partners and NGOs .................................................. 12-45
12.12 Investment ........................................................................................................ 12-46
13. Fisheries ............................................................................................................... 13-1
13.1 Overview ............................................................................................................ 13-1
13.2 Key issues and challenges ................................................................................. 13-2
13.3 Policy framework ................................................................................................ 13-3 13.3.1 MARF Policy Framework and Strategic Plans 2012-2016 ........................... 13-3 13.3.2 Fisheries and Aquaculture Policy 2012-2017 .............................................. 13-4

viii
13.3.3 Legal framework ......................................................................................... 13-5
13.4 Fisheries Institutions ........................................................................................... 13-5 13.4.1 GRSS MARF .............................................................................................. 13-5 13.4.2 Areas of competencies ............................................................................... 13-6 13.4.3 Organisation ............................................................................................... 13-6 13.4.4 GRSS MARF Directorate of Fisheries and Aquaculture Development ........ 13-6 13.4.5 Organisation, staffing, and facilities ............................................................. 13-7 13.4.6 Fisheries training ........................................................................................ 13-8 13.4.7 Fisheries research ...................................................................................... 13-9 13.4.8 Fisheries planning ..................................................................................... 13-10 13.4.9 Fisheries extension ................................................................................... 13-10 13.4.10 Investment and marketing ......................................................................... 13-10 13.4.11 States ....................................................................................................... 13-11 13.4.12 Areas of competencies ............................................................................. 13-12 13.4.13 Organisation, staffing, and facilities ........................................................... 13-13 13.4.14 Sectoral development ............................................................................... 13-13 13.4.15 Fisheries management ............................................................................. 13-14 13.4.16 Fisheries Investment by states .................................................................. 13-14 13.4.17 Fisheries associations and co-operatives .................................................. 13-14
13.5 Production ........................................................................................................ 13-15 13.5.1 Capture fisheries ....................................................................................... 13-15 13.5.2 Resources ................................................................................................ 13-16 13.5.3 Existing fishing areas and catches ............................................................ 13-18 13.5.4 Fish consumption and food security .......................................................... 13-19 13.5.5 Potential for the development of fisheries ................................................. 13-20 13.5.6 Economic considerations for fisheries development .................................. 13-21 13.5.7 Aquaculture .............................................................................................. 13-22 13.5.8 Existing aquaculture.................................................................................. 13-23 13.5.9 Potential for the development of aquaculture ............................................ 13-23
13.6 Marketing and trade ......................................................................................... 13-25 13.6.1 The local distribution chains ...................................................................... 13-25 13.6.2 Import and export products and markets ................................................... 13-27 13.6.3 Fish product exports ................................................................................. 13-30 13.6.4 Fish market prices .................................................................................... 13-31 13.6.5 Post-harvest losses................................................................................... 13-32 13.6.6 Potential for the fish trade ......................................................................... 13-32
13.7 Services ........................................................................................................... 13-33 13.7.1 Development partners ............................................................................... 13-33 13.7.2 Educational establishments ...................................................................... 13-34 13.7.3 Private sector ............................................................................................ 13-35 13.7.4 Formal credit institutions ........................................................................... 13-35 13.7.5 Informal credit services ............................................................................. 13-35
13.8 Infrastructure .................................................................................................... 13-36
13.9 Important cross cutting issues .......................................................................... 13-37 13.9.1 HIV and AIDS ........................................................................................... 13-37 13.9.2 Gender and child labour in fisheries in South Sudan ................................. 13-38 13.9.3 Security ..................................................................................................... 13-39 13.9.4 Taxation .................................................................................................... 13-39 13.9.5 Transport and fisheries ............................................................................. 13-40 13.9.6 Private investment .................................................................................... 13-40 13.9.7 Public investment ...................................................................................... 13-41

ix
14. Key issues and challenges in the agriculture sector ......................................... 14-1
14.1 Agricultural service delivery: private sector-led development .............................. 14-1
14.2 Understanding the behaviour of the market and the private sector ..................... 14-2
14.3 Crosscutting and subsector issues and challenges ............................................ 14-3 14.3.1 Crosscutting issues and challenges ............................................................ 14-3 14.3.2 Subsector-wise issues and challenges........................................................ 14-4
Part 2: Situation Analysis 2015
15. Pests and diseases .............................................................................................. 15-1
16. Private sector investment .................................................................................... 16-1
16.1 Situation of private sector investment in South Sudan ........................................ 16-1 16.1.1 Micro, small and medium enterprises .......................................................... 16-1 16.1.2 Business environment and the state of competitiveness of South
Sudan........................................................................................................ 16-2 16.1.3 Legal framework for private sector development ......................................... 16-3 16.1.4 Financial services ....................................................................................... 16-5 16.1.5 Agro-input value chains and output markets ............................................... 16-5 16.1.6 Labour markets and human capital ............................................................. 16-6 16.1.7 Agriculture sector business development services ...................................... 16-7
16.2 Public-private partnerships ................................................................................. 16-7 16.2.1 Case studies ............................................................................................... 16-7 16.2.2 Review of PPPs in Kenya ........................................................................... 16-9
17. Conflict and food security ................................................................................... 17-1
17.1 Situation of current conflict ................................................................................. 17-1
17.2 Historical background and causes of conflict ...................................................... 17-2
17.3 Peace and reconciliation initiatives ..................................................................... 17-3
18. Gender issues....................................................................................................... 18-1
18.1 Gender issues in agricultural production ............................................................. 18-1
18.2 Roles and interests by gender ............................................................................ 18-3 18.2.1 Crop ............................................................................................................ 18-3 18.2.2 Livestock ..................................................................................................... 18-3 18.2.3 Forestry ...................................................................................................... 18-3 18.2.4 Fisheries ..................................................................................................... 18-3
18.3 Policy and legal framework for gender equality................................................... 18-4 References

x
List of tables
Table 1-1: South Sudan’s key indicators ............................................................................ 1-2 Table 1-2: Composition and main functions of the CAMP institutions ................................. 1-6 Table 1-3: Work schedule for CAMP formulation ................................................................ 1-8 Table 1-4: Markets and food security, poverty reduction and economic growth ................ 1-10 Table 2-1: Chronology of South Sudan: from the 19th Century to independence ................ 2-1 Table 2-2: Population and characteristics of economy by district in 1954 ........................... 2-3 Table 2-3: Estimated GDP per capita and output shares by region, 1956 .......................... 2-5 Table 2-4: Planned and realised investment for the Six-Year Development Plan
(1977/78-1982/83) in South Sudan (million Sudanese Pounds) ....................... 2-6 Table 2-5: Population (census of 1955/56, 1973, 1983 and 2008)...................................... 2-7 Table 2-6: South Sudan’s GDP by expenditure method in 2008-2011 ................................ 2-9 Table 2-7: Major socioeconomic indicators of South Sudan and its neighbours (2011) .... 2-12 Table 2-8: Organisations promoting regional economic cooperation and integration
relevant to South Sudan ................................................................................ 2-16 Table 2-9: Profiles of East African Community (EAC) and Common Market for Eastern
and Southern Africa (COMESA) (2011) ......................................................... 2-16 Table 2-10: Shares of agriculture in the national economy ............................................... 2-17 Table 2-11: Estimated cereal area harvested, production, consumption and balance in
Southern/South Sudan in 2009-2012 ............................................................. 2-18 Table 2-12: Livelihood zones of South Sudan .................................................................. 2-19 Table 3-1: Rainfall zones classified by rainfall and moisture regimes ................................. 3-5 Table 3-2: Geology of South Sudan ................................................................................... 3-6 Table 3-3: Area and share of aggregated land use in total land area of South Sudan ...... 3-12 Table 3-4: Share of aggregated land use by state (%) ..................................................... 3-13 Table 4-1: Major acts and laws that align with core components of South Sudan
Development Plan (SSDP)............................................................................... 4-5 Table 4-2: Relevance of major legal frameworks to CAMP ................................................ 4-5 Table 5-1: Ministries in SSDP ............................................................................................ 5-1 Table 5-2: Organization of Ministry of Agriculture, Forestry, Cooperatives and Rural
Development.................................................................................................... 5-2 Table 5-3: Organization of Ministry of Animal Resources and Fisheries ............................. 5-3 Table 5-4: Organization of Ministry of Water Resources and Irrigation ............................... 5-4 Table 5-5: Levels of government and their functions .......................................................... 5-6 Table 5-6: National and state ministries for different subsectors ........................................ 5-7 Table 5-7: Human resources at the former MAFCRD in 2012 ............................................ 5-9 Table 5-8: Education level of officers at the Directorate of Cooperatives and Rural
Development at MAFCRD in 2012 ................................................................. 5-10 Table 5-9: Electricity supply time by state ministry ........................................................... 5-11 Table 5-10: Challenges of physical resources by state ..................................................... 5-12 Table 5-11: Physical resource confirmed from 20 counties visited ................................... 5-13 Table 5-12: Distribution of officers in State Ministry of Agriculture and Forestry, Central
Equatoria State .............................................................................................. 5-14 Table 5-13: Distribution of officers to counties in State Ministry of Agriculture and
Forestry, Central Equatoria State ................................................................... 5-14 Table 5-14: Distribution of officers to counties in State Ministry of Animal Resources
and Fisheries, Central Equatoria State........................................................... 5-15 Table 5-15: An example of officers’ distribution in State Ministry of Animal Resources
and Fisheries, Lakes ...................................................................................... 5-15 Table 5-16: Distribution of officers to counties in State MARF, Lakes .............................. 5-15 Table 5-17: Main challenges of each state in terms of human resources ......................... 5-16 Table 5-18: Financial services by formal and informal providers ...................................... 5-19 Table 5-19: Formal financial institutions in South Sudan .................................................. 5-20

xi
Table 5-20: Annual loan interest rates, loan applicants and authorized loans .................. 5-22 Table 5-21: Major Commodities traded in Juba markets and their major origin ................ 5-30 Table 5-22: Monthly incoming commodities to Juba in 2011 (tonnes) .............................. 5-30 Table 5-23: Government Agricultural Training Centres related to Agriculture in South
Sudan ............................................................................................................ 5-38 Table 5-24: Key Information about Yei Agricultural Training Centre (YATC) .................... 5-41 Table 5-25: Universities Offer Courses of Bachelor’s Degrees in the four Agricultural
Subsectors ..................................................................................................... 5-42 Table 5-26: Number of Bachelor’s Students at University of Juba in College of Natural
Resources and Environmental Studies .......................................................... 5-42 Table 5-27: Key Information about Other Government Institutions that provide
Agricultural Education and/or Training Courses ............................................. 5-43 Table 5-28: List of civil society organizations ................................................................... 5-46 Table 5-29: List of major development partners supporting agriculture in South Sudan .. 5-47 Table 6-1: Challenges of financial capacity by state ........................................................... 6-1 Table 6-2: Schedule for Budget Sector Plan development ................................................. 6-7 Table 6-3: Schedule for annual budget 2011 development .............................................. 6-10 Table 6-4: Overview of Natural Resources Sector budget 2011-2013 and Annual
Budget 2011 .................................................................................................. 6-11 Table 6-5: Budget calendar for 2012/13 budget ............................................................... 6-13 Table 6-6: Budget of Ministry of Agriculture and Forestry (2011/12 and 2012/13),
Lakes State .................................................................................................... 6-17 Table 6-7: Budget of Ministry of Agriculture, Cooperatives and Environment (2012/13),
Western Equatoria ......................................................................................... 6-18 Table 6-8: Budget per professional staff in 2010 and 2011 budget, and 2010
expenditure .................................................................................................... 6-24 Table 6-9: SSLDP's per professional annual expenditure for the period of 2011-2012 ..... 6-25 Table 6-10: Characteristics and preferred use of aid instruments ..................................... 6-28 Table 6-11: Pooled funding mechanisms (as of 2011) ...................................................... 6-31 Table 7-1: Four dimensions of food security ....................................................................... 7-1 Table 7-2: Key characteristics of three types of food insecurity .......................................... 7-2 Table 7-3: Number of refugees, returnees, and IDPs in 2012-2013.................................... 7-4 Table 7-4: Numbers of conflict incidents reported in 2012 (January to November 2012) .... 7-5 Table 7-5: Types of Food Insecure People and their Conditions ........................................ 7-6 Table 7-6: Characteristics of Subsistence Farmers’ Food Security Situation in Each
State ................................................................................................................ 7-8 Table 7-7: DPs involved in food security issues in South Sudan ...................................... 7-13 Table 8-1: Population related data of South Sudan ............................................................ 8-1 Table 8-2: Key indicators on gender disparity .................................................................... 8-6 Table 8-3: Type of farmland tenure and acquisition of farmland ......................................... 8-9 Table 8-4: Proportion households owning specific animals by State (%) .......................... 8-16 Table 8-5: Major road projects funded by MDTF .............................................................. 8-18 Table 8-6: List of Road Projects based on Road Section in South Sudan ........................ 8-21 Table 10-1: Summary of Agriculture Sector Policy Framework 2012-2017 ....................... 10-4 Table 10-2: Subsector policies as of July 2013 ................................................................ 10-5 Table 10-3: Crop related directorates and departments ................................................... 10-7 Table 10-4: Budget of MAFCRD and crop related directorates (SSP) .............................. 10-8 Table 10-5: Vision, Mission, Values and Mandate of the Ministry of ................................. 10-8 Table 10-6: Estimated revenue and expenditures 2013/14 of Western Bahr el Ghazal
State (SSP) .................................................................................................... 10-9 Table 10-7: Estimated budget 2013/14 of Ministry of Agriculture and Forestry, .............. 10-10 Table 10-8: Donor support to crop subsector ................................................................. 10-11 Table 10-9: Major NGOs assisting in the areas related to crop production ..................... 10-13 Table 10-10: Type of cooperative societies .................................................................... 10-14 Table 10-11: Nationwide cooperative structure (proposed) ............................................ 10-15

xii
Table 10-12: Agro dealers in South Sudan ..................................................................... 10-15 Table 10-13: Livelihood zones and characteristics ......................................................... 10-18 Table 10-14: Cereal area harvested, population and cereal area harvested by capita in
South Sudan ................................................................................................ 10-21 Table 10-15: Yields (t/ha) of selected cereals ................................................................ 10-22 Table 10-16: Number of households producing major staple crops by state in 2009 ...... 10-23 Table 10-17: Consumption of sorghum in 2009 .............................................................. 10-25 Table 10-18: Number of crop(s) harvested by households ............................................. 10-28 Table 10-19: Number of plots cultivated by household ................................................... 10-28 Table 10-20: Proportion of households by status of owning agricultural land and
livestock by state in 2009 ............................................................................. 10-30 Table 10-21: Number of farmer interviewees for situation analysis................................. 10-31 Table 10-22: Issues of subsistence farmers ................................................................... 10-34 Table 10-23: Origins and prices of selected crops at major markets (April-June, 2013) . 10-38 Table 10-24: Constraints for cash crop production ......................................................... 10-44 Table 10-25: Characteristics of major markets in each state .......................................... 10-45 Table 10-26: Key players in market and their roles ........................................................ 10-46 Table 10-27: Identified local products and major distribution chains for ten states ......... 10-48 Table 10-28: Origins of imported agricultural products by state ...................................... 10-49 Table 10-29: Selling prices of locally grown and imported maize in Wau, Western Bahr
el Ghazal State ............................................................................................ 10-51 Table 10-30: Market fees at major markets .................................................................... 10-52 Table 10-31: List of costs for domestic trade from Morobo to Yei River County, CES .... 10-53 Table 10-32: Simulated impact of lower transport prices on maize and sorghum prices
in South Sudan (USD/ton)............................................................................ 10-53 Table 10-33: Type of taxes that merchants need to pay ................................................. 10-54 Table 10-34: Formal and informal payments during transit between border and Juba .... 10-54 Table 10-35: Profile of YARC ......................................................................................... 10-56 Table 10-36: Major achievements and current research activities of YARC ................... 10-57 Table 10-37: Specialities of researchers recently recruited by MAFCRD........................ 10-57 Table 10-38: Total numbers of AEOs and their deployment situation (as of June 2013) . 10-58 Table 10-39: Total numbers of CDOs by State ............................................................... 10-60 Table 10-40: Number of COs by state ............................................................................ 10-61 Table 10-41: Key information about extension workers of the FARM Project in CES ..... 10-62 Table 10-42: Number of household borrowed money last 12 months in 2009 ................ 10-63 Table 10-43: Percentage (%) of households that borrowed money last 12 months by
the main reason for borrowing money in 2009 ............................................. 10-64 Table 10-44: Percentage (%) of households with main reasons for not borrowing
money in 2009 ............................................................................................. 10-64 Table 10-45: Tractor services in different places ............................................................ 10-65 Table 10-46: Approved budget 2012/13 ......................................................................... 10-70 Table 10-47: Tax concessions and incentives regime .................................................... 10-71 Table 11-1 Livestock population in selected African countries in 2011 ............................. 11-2 Table 11-2: MARF Policy Framework 2012- 2016 ............................................................ 11-9 Table 11-3: A comparison of the focus, outlook and strategies of the PFSP 2012-2017
and the ARSP 2006-2011 ............................................................................ 11-11 Table 11-4: National MARF structure (Fisheries Directorate excluded) .......................... 11-12 Table 11-5: Key facets of the state strategic plans ......................................................... 11-15 Table 11-6: Directorates of the national and state ministries .......................................... 11-18 Table 11-7: MARF and SMARF technical personnel as of December 2012 ................... 11-18 Table 11-8: Budget allocation of the Animal Production and Range Management
Directorate to model farms ........................................................................... 11-20 Table 11-9: Statistics of enrolment and graduation from the Faculty of Veterinary
Medicine, Upper Nile University for Academic Year 2012/2013 ................... 11-22 Table 11-10: NGOs operating in Animal Production and Animal Health in South Sudan 11-25

xiii
Table 11-11: Livestock population in South Sudan: a comparison of data sets used by different stakeholders ................................................................................... 11-31
Table 11-12: Livelihood Zones ....................................................................................... 11-41 Table 11-13: Breeds of South Sudan ............................................................................. 11-55 Table 11-14: Cattle herd structure .................................................................................. 11-59 Table 11-15: Number of cattle owned per household ..................................................... 11-61 Table 11-16: Important endemic livestock diseases in South Sudan .............................. 11-64 Table 11-17: Cattle disease prioritization by different methods ...................................... 11-67 Table 11-18: Goat disease prioritization by different methods ........................................ 11-68 Table 11-19: Sheep disease prioritization by different methods ..................................... 11-68 Table 11-20: Poultry disease prioritisation by different methods ..................................... 11-68 Table 11-21: Cost of treatment in SSP of common livestock diseases in South Sudan .. 11-73 Table 11-22: Comparison of disease outbreaks: South Sudan and neighbouring
countries ...................................................................................................... 11-74 Table 11-23: States submission of reports to MARF in 2012 .......................................... 11-76 Table 11-24: Summary of samples received and analyzed, January - December 2012 .. 11-77 Table 11-25: Completed and on-going projects in animal health .................................... 11-78 Table 11-26: Lessons learnt in project implementation ................................................... 11-79 Table 11-27: On-going regional disease control programmes ........................................ 11-80 Table 11-28: Vaccination coverage in 2012 ................................................................... 11-80 Table 11-29: Consumption of meat, milk and other livestock products in South Sudan .. 11-83 Table 11-30: Consumption of meat and milk in selected African countries ..................... 11-84 Table 11-31: Prices of Commonly used Veterinary Medicines and Products .................. 11-96 Table 12-1: Summary of the legal and policy framework for forestry in South Sudan ....... 12-6 Table 12-2: Structure of policy statements of Forest Policy 2013 ..................................... 12-8 Table 12-3: Strength and opportunities and challenges identified in the Forest Policy
2013 .............................................................................................................. 12-9 Table 12-4: Summary of Forestry Bill 2009 ...................................................................... 12-9 Table 12-5: Human and physical resources of state Forestry Directorates interviewed .. 12-11 Table 12-6: Budget sources of and revenue collection by Directorates of Forestry ........ 12-12 Table 12-7: Conditional transfers from GRSS to state ministries of agriculture ............... 12-12 Table 12-8: Rates schedule for forestry products in Western Equatoria State ................ 12-13 Table 12-9: Categories of permanent forest estates (PFEs) ........................................... 12-14 Table 12-10: Reserved Forests within the category of Central Forest Reserve .............. 12-17 Table 12-11: Under Reservation forests within the category of Central Forest Reserve . 12-19 Table 12-12: Forest plantations established in the Central Forest Reserves .................. 12-22 Table 12-13: Management status of Northern and Southern CFR Groups visited .......... 12-26 Table 12-14: Concessionaires and CFRs and plantations under their management ...... 12-28 Table 12-15: Organization and staffing of Equatoria Teak Company (ETC) ................... 12-30 Table 12-16: Volume and average height and diameter in teak plantations managed by
ETC ............................................................................................................. 12-31 Table 12-17: Estimated allowable production from teak plantations managed by ETC ... 12-31 Table 12-18: Forest products and food security, poverty reduction, and income growth . 12-36 Table 12-19: Major domestic actors for production and trade of forest products ............. 12-38 Table 12-20: Estimated annual charcoal consumption in urban and rural areas in 2009 12-39 Table 12-21: Average charcoal prices by state and urban and rural areas ..................... 12-40 Table 12-22: Fuelwood consumption and sources in urban and rural areas in May-
June 2009 .................................................................................................... 12-42 Table 12-23: Expenditure and budget of KFTC for fiscal year 2010/11 and 2011/12 ...... 12-44 Table 13-1: Number of fisheries associations set up by the site (2009-2013) ................. 13-15 Table 13-2: Fish consumption South Sudan ................................................................... 13-20 Table 13-3: Constraint and effect of fisheries commercialisation .................................... 13-21 Table 13-4: Number of fish ponds in 2013 ...................................................................... 13-22 Table 16-1: Micro, small and medium enterprises definition ............................................. 16-1 Table 16-2: Ease of doing business indicators ................................................................. 16-2

xiv
Table 16-3: Main reforms for agribusiness development - Kenya ................................... 16-10 Table 18-1: Access to and control, ownership of productive/economic assets ................. 18-1 Table 18-2: Access to market by gender .......................................................................... 18-2
List of figures
Figure 1-1: Coordination mechanism of the CAMP process ............................................... 1-5 Figure 1-2: Progress of the CAMP process ...................................................................... 1-11 Figure 2-1: Ecological regions of South Sudanas of 1954 .................................................. 2-5 Figure 2-2: Major crops area harvested in Southern Sudan in 1960/61-2004/05 (1,000
feddans) ........................................................................................................... 2-8 Figure 2-3: CPI Annual changes (%) ................................................................................ 2-10 Figure 2-4: GDP and GDP per capita of South Sudan and its neighbours in 2011 ........... 2-12 Figure 2-5: GDP of South Sudan’s neighbours in 2001-2012 (constant 2005 USD
billion) ............................................................................................................ 2-13 Figure 2-6: Imports from and exports to Uganda and Kenya (USD million) ...................... 2-14 Figure 2-7: Imports from Uganda and Kenya by commodity ............................................. 2-15 Figure 2-8: Livelihood Zones of South Sudan .................................................................. 2-19 Figure 2-9: Estimated cereal area harvested and production in 2005-2012 ...................... 2-21 Figure 2-10: Agricultural value added and growth in 2008-2011 ....................................... 2-21 Figure 3-1: Topographic map of South Sudan .................................................................... 3-1 Figure 3-2: Rainfall regimes at eight locations in South Sudan ........................................... 3-2 Figure 3-3: Rainfall contour maps: Annual and July (mm) (created by IDMP) .................... 3-4 Figure 3-4: Geological map of South Sudan ....................................................................... 3-6 Figure 3-5: Hydrogeological map of South Sudan .............................................................. 3-6 Figure 3-6: Soil map of South Sudan (created by IDMP) .................................................... 3-7 Figure 3-7: Main basins of South Sudan ............................................................................ 3-8 Figure 3-8: Annual evaporation map of the Sudd basin (mm/year) ..................................... 3-9 Figure 3-9: Vegetation zones of South Sudan .................................................................. 3-10 Figure 3-10: Aggregated land use/cover map .................................................................. 3-12 Figure 3-11: Combination of roads, agricultural potential zones and cropland areas ........ 3-13 Figure 3-12: Land productivity potential map of South Sudan (prepared by IDMP) .......... 3-14 Figure 3-13: Livelihood zones of South Sudan ................................................................. 3-15 Figure 3-14: Deforestation and expansion of rain-fed agriculture in Yambio ..................... 3-17 Figure 5-1: The Equity Bank, Consolidated Income statement and Balance Sheet .......... 5-24 Figure 5-2: Monthly price of maize flour in Juba Market ................................................... 5-34 Figure 5-3: Monthly price of agricultural commodities in Juba market, 2011 ..................... 5-34 Figure 5-4: Trends of prices of major agricultural commodities from 2010 to 2013 ........... 5-34 Figure 5-5: Maize retail prices in Juba, Nairobi, and Kampala April 2012-March 2013 ..... 5-36 Figure 6-1: Aid coordination structure .............................................................................. 6-27 Figure 7-1: Food security status by state in 2012 and 2013 ............................................... 7-3 Figure 7-2: Percentages of negative factors impacted on household food security ............ 7-5 Figure 8-1: Literacy rate (above 15 years old) by state and location (%) ............................ 8-2 Figure 8-2: Net attendance rate and Gross enrolment rate in primary education by
state (%) .......................................................................................................... 8-2 Figure 8-3: Judicial system and community level dispute settlement system ...................... 8-3 Figure 8-4: Cumulative number of the returnees (2007- May 2013) ................................... 8-4 Figure 8-5: Returnees and State average cereal yield (t/ha) ............................................. 8-4 Figure 8-6: Cumulative numbers of conflicts ...................................................................... 8-7 Figure 8-7: Female marital status by age group ............................................................... 8-10 Figure 8-8: Main source of drinking water (%) .................................................................. 8-12 Figure 8-9: Gross attendance rates in primary and sedoncary school (%) ........................ 8-12

xv
Figure 8-10: Main source of energy for cooking (%) ......................................................... 8-13 Figure 8-11: Health care facility most visit (%).................................................................. 8-13 Figure 8-12: Proportion of monthly expenditure ................................................................ 8-14 Figure 8-13: Type of transportation owned (%) ................................................................ 8-15 Figure 8-14: Type of dwelling (%)..................................................................................... 8-15 Figure 8-15: Type of items owned (%) ............................................................................. 8-15 Figure 8-16: Type of animal owned (%)............................................................................ 8-15 Figure 8-17: Roads maintained by the Southern Sudan Roads Maintenance Project ....... 8-19 Figure 8-18: Roads opened by the WFP since 2004 in South Sudan ............................... 8-20 Figure 8-19: Completed Road Projects ............................................................................ 8-25 Figure 8-20: On-going Road Projects (as of October 1, 2013) .......................................... 8-26 Figure 10-1: Organogram of MAFCRD ............................................................................. 10-7 Figure 10-2: Organogram of the Ministry of Agriculture and Forestry, Lakes State ........... 10-9 Figure 10-3: Livelihood zones in South Sudan ............................................................... 10-17 Figure 10-4: Annual precipitation of South Sudan .......................................................... 10-18 Figure 10-5: Cereal net production and deficit ................................................................ 10-20 Figure 10-6: Cereal area harvested, net yield and net production .................................. 10-20 Figure 10-7: Trend of area harvested for cereal ............................................................. 10-21 Figure 10-8: Number of households harvesting crops (Top 10) in 2008/2009 ................ 10-23 Figure 10-9: Main areas of sorghum production ............................................................. 10-24 Figure 10-10: Main areas of maize production ............................................................... 10-26 Figure 10-11: Main areas of cassava production ............................................................ 10-27 Figure 10-12: Main areas of rice production ................................................................... 10-27 Figure 10-13: Proportion of households by status of owning agricultural land and
livestock ....................................................................................................... 10-29 Figure 10-14: Crop calendar of subsistence farmers in Rumbek, Lakes State
(Ironstone Plateau zone) .............................................................................. 10-32 Figure 10-15: Crop calendar of subsistence farmers in Yambio, Western Equatoria
State (Greenbelt zone) ................................................................................. 10-33 Figure 10-16: Crop calendar of large-scale farmers in Renk, Upper Nile State (Flood
Plains zone) ................................................................................................. 10-37 Figure 10-17: High potential vegetable Production Areas ............................................... 10-39 Figure 10-18: Price trend of coffee in the international market ....................................... 10-42 Figure 10-19: Production of coffee beans (green) by country ......................................... 10-42 Figure 10-20: Producer price trend of sesame seed by country ..................................... 10-43 Figure 10-21: Production of sesame seed by country..................................................... 10-43 Figure 10-22: Price trend of sunflower oil in the international market ............................. 10-43 Figure 10-23: Production of sunflower seeds by country ................................................ 10-43 Figure 10-24: Key players and relationships .................................................................. 10-47 Figure 10-25: Major flows of imported agricultural products in South Sudan .................. 10-51 Figure 10-26: Agricultural infrastructure established by public and private sectors ......... 10-69 Figure 11-1: Key areas of intervention of NGOs working in the livestock subsector ....... 11-27 Figure 11-2: Cattle populations at state level in South Sudan ........................................ 11-34 Figure 11-3: Areas of concentration of cattle in South Sudan ......................................... 11-35 Figure 11-4: Goat population across South Sudan states .............................................. 11-36 Figure 11-5: Goat concentration ..................................................................................... 11-37 Figure 11-6: Sheep population across South Sudan states ............................................ 11-38 Figure 11-7: Areas of concentration of honey production ............................................... 11-39 Figure 11-8: Areas where pigs are currently being reared in South Sudan ..................... 11-40 Figure 11-9: Main cattle production systems in South Sudan ......................................... 11-41 Figure 11-10: Importance of livestock as a main source of livelihood ............................. 11-61 Figure 11-11: Main coping strategies employed by households affected by shock ......... 11-63 Figure 11-12: How households coped with different shocks experienced ....................... 11-64 Figure 11-13: Disease outbreaks reported in 2012 ......................................................... 11-70 Figure 11-14: Benefits derived from cattle in South Sudan (%) ...................................... 11-71

xvi
Figure 11-15: Cattle disease impact on livelihood benefits (%) ...................................... 11-72 Figure 11-16: Disease outbreaks between 2008 and 2012 ............................................ 11-74 Figure 11-17: Disease outbreaks investigated, 2008-2012 ............................................. 11-75 Figure 11-18: Live animal and red meat value chain ...................................................... 11-86 Figure 11-19: Poultry value chain ................................................................................... 11-87 Figure 11-20: Milk value chain ....................................................................................... 11-89 Figure 11-21: Hides and skins value chain ..................................................................... 11-91 Figure 11-22: Honey value chain ................................................................................... 11-92 Figure 12-1: Forest cover (trees closed-to-sparse) in South Sudan .................................. 12-4 Figure 12-2: Organogram of Directorate of Forestry, Western Equatoria State
Government ................................................................................................. 12-11 Figure 12-3: Locations of Central Forest Reserves in South Sudan ............................... 12-16 Figure 12-4: Teak plantation established by an out-grower in Yei River County ............. 12-35 Figure 12-5: Spatial distribution of perceived fuelwood prices in May-June 2009 ........... 12-43 Figure 12-6: Organization of Kagelu Forestry Training Centre ....................................... 12-44 Figure 13-1: Organogram of the Directorate of Fisheries and Aquaculture Development . 13-8 Figure 13-2: Organogram of the Fisheries Department, Northern Bahr el Ghazal State . 13-13 Figure 13-3: Fishing season of South Sudan ................................................................. 13-16 Figure 17-1: IDP and refugee map ................................................................................... 17-2
List of boxes
Box 4-1: Objective of SSDP ............................................................................................... 4-1 Box 4-2: Vision and Mission of MAFCRD ........................................................................... 4-2 Box 4-3: Vision and mission of MARF ................................................................................ 4-3 Box 4-4: Draft land policy ................................................................................................... 4-4 Box 5-1: Objectives of local government ............................................................................ 5-4 Box 5-2: Principles of local governance ............................................................................. 5-5 Box 5-3: Case study - Equity Bank: successful management of a foreign-own
commercial bank ............................................................................................ 5-23 Box 5-4: Case study - Nile Commercial Bank: unsuccessful management of a
commercial bank ............................................................................................ 5-24 Box 5-5: Case study - Agricultural Bank of South Sudan: government-owned bank to
provide specialised finance to agriculture ....................................................... 5-25 Box 5-6: Case study - Co-operative bank of South Sudan: a newly established bank to
assist co-operatives and farmers ................................................................... 5-26 Box 6-1: Procurement Procedure of MARF ...................................................................... 6-21 Box 6-2: Criteria for procurement ..................................................................................... 6-21 Box 6-3: Procurement procedure of SMARF, Upper Nile ................................................. 6-22 Box 6-4: Criteria for procurement ..................................................................................... 6-23 Box 7-1: Types of Coping Strategies .................................................................................. 7-8 Box 10-1: Cases of subsistence farmers ........................................................................ 10-33 Box 10-2: Case of progressive farmer in Eastern Equatoria State .................................. 10-36 Box 10-3: Case of a large scale farmer in Lakes State ................................................... 10-37 Box 11-1: Key policy and strategy documents that contain policy for the sector ............... 11-7 Box 12-1: A case of out-growers in Yei River County ..................................................... 12-34 Box 13-1: Ministerial mandate for fisheries in Northern Bahr el Ghazal .......................... 13-11 Box 13-2: CAMP Fisheries Report on Field trip to Upper Nile State ............................... 13-12 Box 13-3: Example of a misconception about fisheries in South Sudan ......................... 13-18 Box 13-4: IAA explained ................................................................................................. 13-23 Box 13-5: Four major constraints to fresh fish marketing ................................................ 13-31 Box 13-6: Case study - AIDS Lake Victoria .................................................................... 13-37

xvii
Box 13-7: Case study of informal taxation ...................................................................... 13-39 Box 15-1: Environmental impacts of quelea control in Africa ............................................ 15-3 Box 16-1: Coca-Cola: Localising and aggregating supply, Kenya ..................................... 16-7 Box 16-2: PPPs in contract farming .................................................................................. 16-8 Box 16-3: Smallholder Cash and Export Crops Development Project .............................. 16-8 Box 16-4: Kenyan PPPs review ....................................................................................... 16-9

xviii
Abbreviations ACF Action Contre la Faim/ Action Against Hunger ACORD Agency for Coordination of Research and Development ACTED Agency for Technical Cooperation and Development ADESCO African Development Solutions AEC African Economic Community
AECOM A commercial company, which operates in South Sudan as an NGO providing development services, usually funded by USAID.
AEO Agricultural Extension Officer AfDB African Development Bank AGRA Alliance for a Green Revolution in Africa AHA Animal Health Auxiliary AIMS Aid Information Management System AIRS Aweil Irrigation Rice Scheme Amadi RDI Amadi Rural Development Institute ANLA Annual Needs and Livelihood Analysis
ASARECA Association for strengthening Agricultural Research in Eastern and Central Africa
ASPF Agriculture Sector Policy Framework AU African Union AU-IBAR African Union Inter-African Bureau Animal Resources AusAID Australian Government Overseas Aid Program AWODA Aweil Window of Opportunities and Development Agency AWPB Annual Work Plan and Budget BLL Blue Lakes Limited BOU Bank of Uganda BPS Budget Planning System BRAC Bangladesh Rural Advancement Committee BSF Basic Services Fund BSP Budget Sector Plan BXW banana xanthomonas wilt CA Competent Authority CAADP Comprehensive Africa Agriculture Development Programme CAFOD Catholic Agency for Overseas Development CAHW Community Animal Health Worker CAMP Comprehensive Agricultural Development Master Plan CANS Civil Authority of New Sudan CAR Central African Republic CARE Cooperative for Assistance and Relief Everywhere CASI Community Agriculture and Skills Initiative CBEW Community Based Extension Worker CBS Central Bureau of Statistics CBSD cassava brown streak disease CBSV cassava brown streak virus CBTF Capacity Building Trust Fund CCIA Chamber of Commerce, Industry and Agriculture CCU County Coordination Unit CDO Community Development Officer CES Central Equatoria State CESVI Cooperazione E Sviluppo CETC Central Equatoria Teak Company CF Community Forest CFA Central Forest Act CFR Central Forest Reserve

xix
CFSAM Crop and Food Security Assessment Mission CHF Common Humanitarian Fund CIA Central Intelligent Agency CIDA Canadian International Development Agency CM Carbon Monoxide CMD Christian Mission for Development CMV cassava mosaic virus CO Cooperative Officer CoM Council of Ministers COMESA Common Market for Eastern and Southern Africa COMSTAT COMESA’s database Cordaid Catholic Organisation for Relief & Development Aid CPA Comprehensive Peace Agreement CPC County Project Coordinator CRADA Christian Recovery and Development Agency CTA Civil Transaction Act CTC Yei Crop Training Centre Yei
DAFED Directorate of Animal and Fisheries Research (of Ministry of Animal Resources and Fisheries)
Daga’a Dried Rastrineobola argentea, the silver cyprinid, imported in dried form from Uganda.
DCA Dan Church Aid DD Deputy Director DDR Disarmament Demobilization and Reintegration DFID Department for International Development DG Director General DLCO-EA Desert Locust Control Organization for Eastern Africa DoFAD Directorate of Fisheries and Aquaculture Development DoLFE Directorate of Livestock and Fisheries Extension (of MARF) DoPSD Directorate of Planning, Statistics and Documentation (of MARF) DP Development Partner DPSD Directorate of Planning, Statistics, and Documentation DRC Democratic Republic of Congo DRC Danish Refugee Council EAC East African Community EC European Commission ECA Economic Commission for Africa EES Eastern Equatoria State EMIS Education Management Information System ESAMI East-South Africa Management Institute ESIA Environmental and social impact assessment ETC Equatoria Teak Company EU European Union FA Forest Act FAO Food and Agriculture Organization of the United Nations FAPF Food and Agriculture Policy Framework FARM Food, Agribusiness and Rural Markets Project FERA UK Food and Environment Research Agency FEWS NET
Famine Early Warning Systems Network
FFA Food for Asset FNC Forests National Corporation FNCA Forests national Corporation Act FPMP Fisheries Production and Marketing Project (part of SPRCP) FR Forest reserve

xx
FRTC Feeder Road Technical Committee FSC Forest Stewardship Certificate FSLC Food Security and Livelihood Cluster FY Financial/Fiscal Year GDP Gross Domestic Product GER Gross Enrolment Rate
GIZ Deutsche Gesellschaft für Internationale Zusammenarbeit (German Agency for International Development)
gms grammes GoJ Government of Japan GoSS Government of Southern Sudan GRS Government of the Republic of the Sudan GRSS Government of the Republic of South Sudan
HACCP Hazard analysis and critical control points, is a systematic preventive approach to food safety
HDC Humane Development Council HH High production potential and high population density HIV/AIDS Human Immunodeficiency Virus/Acquired Immune Deficiency Syndrome HL High production potential and low population density HM Her Majesty (of the United Kingdom & North Ireland) HPF Health Pooled Fund HWSD Harmonized World Soil Database IAA Integrated Agriculture Aquaculture ICB international competitive bidding ICCO Inter-Church Organisation for Development Cooperation
ICRAF World Agroforestry Centre (aka International Centre for Research in Agroforestry)
IDA International Development Association IDMP Irrigation Development Master Plan IDP Internally Displaced Person IFAD International Fund for Agricultural Development IFC International Finance Corporation IFDC International Fertilizer Development Centre IFMIS Financial Management Information System IFPRI International Food and Policy Research Institute IGAD Intergovernmental Authority on Development IGs Interest Groups IIASA International Institute for Applied Systems Analysis IMAC Inter-Ministerial Appraisal Committee IMF International Monetary Fund IOM International Organisation for Migration IQF Individually Quick Frozen IRC International Rescue Committee IRW Islamic Relief Worldwide ISC Inter-Ministerial Steering Committee ISRIC International Soil Reference and Information Centre ISSCAS Institute of Soil Science - Chinese Academy of Sciences IUSS International Union of Soil Sciences JAM Joint Assessment Mission JICA Japan International Cooperation Agency JRC Joint Research Centre of the European Commission JRIEP Juba Rapid Impact Emergency Project KATTC Kapuri Agricultural and Technology Transfer Centre KCB Kenya Commercial Bank KFTC Kagelu Forestry Training Centre
xxi
kg Kilogramme KNBS Kenya National Bureau of Statistics LC Land Commission LCB Local Competitive Bidding LGP Length of Growing Period LRSIC Land Resource Survey and Information Centre LSS local services support MACE Ministry of Agriculture, Cooperatives and Environment MAERD Ministry of Agriculture, Environment and Rural Development MAF Ministry of Agriculture and Forestry MAFCRD Ministry of Agriculture, Forestry, Cooperatives and Rural Development MAFI Ministry of Agriculture, Forestry and Irrigation MAFTARF Ministry of Agriculture, Forestry, Tourism, Animal Resources and Fisheries MARF Ministry of Animal Resources and Fisheries MCII Ministry of Commerce, Industry and Investment MCMV maize chlorotic mottle virus MCRD Ministry of Co-operatives and Rural Development MDTF Multi-donor Trust Fund MFI micro-financial institution MH Medium production potential and high population density ml millilitre MLLTC Marial Lou Livestock Training Centre MLND maize lethal necrosis disease MLPSHRD Ministry of Labour, Public Service and Human Resource Development MoCA Ministry of Cabinet Affairs MoE Ministry of Education MoEnv Ministry of Environment MoFAIC Ministry of Foreign Affairs and International Cooperation MoFEP Ministry of Finance and Economic Planning MoGC&SW
Ministry of Gender, Child and Social Welfare
MoH Ministry of Health MoHADM Ministry of Humanitarian Affairs and Disaster Management MoLPS Ministry of Labor and Public Service MoT Ministry of Transport MoU Memorandum of Understanding MPI Ministry of Physical Infrastructure MPIPU Ministry of Physical Infrastructure and Public Utilities MPIRD Ministry of Physical Infrastructure and Rural Development MPS Ministry of Public Service MRB Ministry of Roads and Bridges MRDA Mundri Relief and Development Association MRDI Ministry of Rural Development and Irrigation MSME micro, small and medium sized enterprise MSY Maximum sustainable yield MT Metric Tonne MTRB Ministry of Transport, Roads, and Bridges MWRI Ministry of Water Resources and Irrigation MWRRDC Ministry of Water Resources, Rural Development and Cooperatives N North NALEP National Agriculture and Livestock Extension Policy NATTC Nzara Agricultural Technology Training Centre NBG Northern Bahr el Ghazal State NBS National Bureau of Statistics NCA Norwegian Church Aid

xxii
NDDRC National Demobilisation, Disarmament, and Reintegration Commission NEAT National Effort for Agricultural Transformation NEPAD New Partnership for Africa’s Development NFA Nzara Farmer Association NFR National Forest Reserve NGO Non-governmental Organization NHDF Nile Hope Development Forum NLA National Legislative Assembly NPA Norwegian Peoples Aid NRC Norwegian Refugee Council NRSWG South Sudan Natural Resources Sector Working Group OCHA United Nations Office for the Coordination of Humanitarian Affairs ODA Official Development Assistance OECD Organisation for Economic Cooperation and Development OIE World Organization for Animal Health OLS Operation Lifeline Sudan OoP Office of President P4P Purchase for Progress PBG Producer Business Group PFA Provincial Forest Act PFE Permanent Forest Estate PFM public financial management PFMAA Public Financial Management and Accountability Act 2011 PFR Provincial Forest Reserve PFTC Padak Fisheries Training Centre PMU Project Management Unit PPS public-private partnership QGDF Quarterly Government-donor Forum RAAH Rural Action Against Hunger RAI Rural Accessibility Index RAPID Response Assistance for Priority Infrastructure Development ROSS Republic of South Sudan SAFDP Support to Agriculture and Forestry Development Project SAs Spending Agencies SDG Sudanese Pound SE South east SEA Strategic environmental assessment SEL Sercham Equatoria Limited SICBP Sudan Infrastructure Capacity Building Program SIDA Swedish International Development Cooperation Agency SMARF State Ministry of Animal Resources and Fisheries SMART Specific, Measurable, Achievable, Relevant and Timebound SMEs Small and Medium Sized Enterprises SNV Netherlands Development Organization SPCRP Sudan Productive Capacity Recovery Programme SPLA Sudan People’s Liberation Army SPLM Sudan People's Liberation Movement SSARP Southern Sudan Agricultural Revitalization Program SSCCSE Southern Sudan Centre for Census, Statistics and Evaluation SSDP South Sudan Development Plan 2011-2013 SSDP-TWG
South Sudan Development Plan Technical Working Group
SSLA South Sudan Legislative Assembly SSLC Southern Sudan Land Commission SSLDP Southern Sudan Livelihoods Development Project

xxiii
SSP South Sudanese pound SSPF South Sudan Partnership Fund SSRA Southern Sudan Roads Authority SSRF South Sudan Recovery Fund SSRRC South Sudan Relief and Rehabilitation Commission SSRRP South Sudan Rural Roads Project SSTCM South Sudan Transition Conflict Mitigation (project) SWG Sector Working Group TC Technical Committee TT Task Team UBOS Uganda Bureau of Statistics UK The United Kingdom of Great Britain and Northern Ireland ULA Unregistered Land Act UMCOR United Methodist Committee on Relief UN United Nations UNDP United Nations Development Programme UNEP United Nations Environment Programme UNHCR United Nations High Commissioner for Refugees UNMISS United Nations Mission in South Sudan UNOCHA United Nations Office for the Coordination of Humanitarian Affairs UNOPS United Nations Office for Project Services UNS Upper Nile State USA United States of America USAID United States Agency for International Development USD United States Dollar USOB Uganda Bureau of Statistics VSF Vétérinaires Sans Frontières WB World Bank WBGS Western Bahr el Ghazal State WES Western Equatoria State WFP World Food Programme WHO World Health Organisation WRB World Reference Base for Soil Resources YATC Yei Agricultural Training Centre YMCA Young Men Christian Association ZEAT Zonal Effort for Agricultural Transformation

xxiv
EXECUTIVE SUMMARY
About CAMP Background
South Sudan became independent on 9 July 2011, following the signing of the Comprehensive Peace Agreement in 2005 and after decades of civil war. Endowed with oil wealth, it is the richest country, in terms of GDP per capita, in East Africa. Over 95% of the total area (658,842 km2) is considered suitable for agriculture, 50% of which is prime agricultural land. Yet, the counrty remains one of the least developed in the world and faces formidable challenges. While a majority of the population is dependent on subsistence farming and pastoralism as sources of livelihoods, a considerable number of people continue to rely on relief assistance to meet their needs.
With increased focus on the potential of agriculture, the Government of the Republic of South Sudan (GRSS) realized the need to formulate a comprehensive master plan to guide the agricultural development of the country. The then Ministry of Agriculture, Forestry, Cooperatives and Rural Development (MAFCRD) and the then Ministry of Animal Resources and Fisheries (MARF) 1 took the decision to formulate the Comprehensive Agricultural Development Master Plan (CAMP) and formally requested technical assistance from the Japan International Cooperation Agency (JICA) in November 2011. They signed a technical cooperation agreement with JICA in June 2012, which was later joined by other development partners (DPs), e.g., the Canadian International Development Agency (CIDA) and the Deutsche Gesellschaft für Internationale Zusammenarbeit (GIZ). Objectives
The objectives of the CAMP process are as follows.
1) Formulate a comprehensive agricultural development master plan that will identify the potential of different products all over the country, priority programmes/projects and the resources required to implement them.
2) Recommend a feasible institutional setup for the implementation of potential priority programmes/projects and spell out the roles of different stakeholders participating in agricultural development activities in the country.
3) Strengthen the capacity of the national task team members2 through the process of formulating related policies and plans of the respective ministries in a number of key areas to be prioritized by government and other stakeholders.
Once formulated, the GRSS will ensure that all public and private investments and programmes supported by development partners (DPs) in the sector are aligned with CAMP. The implementation of all programmes/projects will be directed, coordinated, monitored and reviewed by the government in collaboration with the stakeholders. Target Subsectors and Geographic Area
CAMP covers the subsectors of agriculture, forestry, livestock and fisheries, while the geographic coverage is, in principle, the whole area of South Sudan. Implementing Ministries
1 The two ministries, together with the Directorate General of Tourism from the former Ministry of Wildlife
Conservation and Tourism, were merged into the Ministry of Agriculture, Forestry, Tourism, Animal Resources and Fisheries (MAFTARF) in August 2013. 2 The CAMP Task Team has national members and international members (consultants and experts).

xxv
The following two ministries are responsible for the CAMP formulation:
1) Ministry of Agriculture, Forestry, Tourism, Animal Resources and Fisheries (MAFTARF) 2) Ministry of Electricity, Dams, Irrigation and Water Resources (MEDIWR). Guiding Principles
CAMP formulation is guided by the following principles:
1) Government-led formulation
2) Capacity development through the formulation process
3) Formulation of an implementable plan
4) Alignment with existing policies, plans and institutional arrangements
5) Coordination with other stakeholders. Coordination Mechanism
A mechanism has been set up to ensure a harmonized and coordinated framework for effective and efficient management of activities and resources for CAMP formulation. The central driving and coordinating force of the mechanism is the CAMP Task Team, consisting of the staff of the two implementing ministries and experts deployed by DPs. The national Task Team members carry out all the tasks required for the master plan formulation in cooperation with the experts. The Technical Committee composed of Undersecretaries and Directors General of the implementing and collaborating ministries supervises the Task Team’s activities and reports to the Inter-Ministerial Steering Committee, the highest decision-making body for CAMP. The Task Team consults with various stakeholders such as government and private institutions, universities, DPs and NGOs. Workflow
The overall flow of major activities to formulate CAMP is as follows:
1) Stakeholder consolidation 2) Situation analysis 3) Framework formulation and priority identification 4) Preparation of investment plans 5) Proposing implementation framework.
The CAMP process is roughly divided into two periods, a 6-month preparation period (July 2012-December 2012) and a 24-month formulation period (January 2013-December 2014). In each activity, the CAMP Task Team will build consensus among the stakeholders by discussing the results at a stakeholder meeting and then move on to the next activity. Important characteristics of the CAMP process are that the master plan formulation is based on the situation analysis and that it clarifies the roles and responsibilities of various actors, funding mechanisms and M&E systems through designing an implementation framework. About this Report This report presents preliminary results of the situation analysis conducted from February 2013 to July 2013. Part I contains findings on cross-subsectoral and cross-cutting issues including the economy, policy and institutional frameworks, public financial management and rural society and livelihoods. Part II reports on the crops, livestock, forestry and fisheries subsectors and Part III on preliminary discussions of key issues and challenges in the agricultural sector. A complete situation analysis report, together with a framework of the master plan and priority programmes, will be included in the Interim Report to be prepared by December 2013.

xxvi
Key Issues and Challenges in the Agriculture Sector The following is a summary of key issues and challenges in the agricultural sector identified through the situation analysis. The framework of CAMP, including objectives, timeframe, targets, strategies, priority pillars and programmes, etc., will be developed based on these issues. Overall
Preliminary conclusions on overall issues and challenges presented below are mainly regarding the first two of the four objectives of the situation analysis: 1) to understand the issues and challenges in agricultural service delivery; 2) to understand the issues and challenges in the agriculture sector; 3) to analyse the mechanisms and processes of agricultural transformation; and 4) to identify information useful to estimate the expected impact of public service delivery on the sector. The third and fourth objectives will be dealt with in the Interim Report.
1) Private sector-led development: The formulation and implementation of CAMP should be guided by the principle of “small-government and private sector- and market-led development”. The government’s roles should be confined to policy formulation, the establishment of a regulatory framework and the provision of public goods and safety nets for the socially vulnerable. Public sector institutional capacity and financial resources are extremely limited compared to the huge demand for support services, though a substantial amount of oil revenues could be utilised upon the resumption of oil production. There are also a number of issues external to the agricultural sector but that shape it, such as macroeconomic management, basic infrastructure development (e.g., road transport, electricity, water supply, ICT, etc.) and social development (e.g., re-integration, health, education, etc.), which are mainly the responsibility of the government. To realise effective and efficient service delivery under the existing constraints, it is essential for the government to recognise and support the efforts of the private sector.
2) Understanding the private sector: To design mechanisms to deliver agriculture services which could encourage private sector- and market-led development with minimum public sector resources, an in-depth understanding of the behaviour of private sector actors, including farmers, is needed. The present situation analysis has revealed that vibrant rural-to-rural and rural-to-urban market economies exist despite poor road conditions, lack of support services and competition with products imported from neighbouring countries. The majority of the rural population is resilient to erratic climatic conditions, engaging in various activities to cope with food insecurity. The situation analysis has also proved that the government needs to: 1) regulate private sector activities for fair competition in the market; 2) ensure the supply of safe and sanitary foods for consumers; and 3) build trust with the private sector for reciprocity.
Cross-cutting Issues
1) Access to land: Access to land and land use is a key factor of agricultural development, but land rights are not secured for many people in South Sudan, particularly for returnees, IDPs and women. Procedures for large-scale land acquisition have not been clarified nor properly followed. The absence of an audit and monitoring system reduces transparency and accountability in statutory land administration. As a result of decades of civil war, customary laws were weakened and are not effective in securing equal land rights for every community member.
2) Food security: The food security situation has deteriorated in recent years due to a large number of returnees, refugees from Sudan and IDPs, natural population growth, a reduced harvest (in 2011) and food price inflation caused by greater demand and tight

xxvii
foreign reserves following the oil shutdown. The GRSS and DPs have been providing food assistance to vulnerable groups, and it could be necessary to continue such services for some time. The impact of food assistance should be examined within the context of long-term agricultural development in terms of linkages with markets and behaviour changes of food aid recipients.
3) Coping mechanisms: The diet becomes insufficient and less nutritious during the period of seasonal food insecurity, especially in dry lands. Household food security in the country traditionally depends on a complex system of food production, livestock, seasonal migration, informal trade, fishing and the collection of wild fruits, which was severely disrupted by the war. Activities to cope with this seasonal food scarcity might include selling livestock, charcoal and other homemade products and providing labour for cash or food. Introducing an appropriate number of livestock would be particularly helpful since they are more drought-resilient than crops and can supply food as well.
4) Support to returnees and IDPs: The influx of over two million returnees and IDPs since the signing of the CPA3 has placed pressure on communities across the country and has increased competition over scarce resources and worsened living conditions among vulnerable groups. The agricultural production of returnees and IDPs is considerably smaller than that of non-returnee farmers. More systematic support regarding access to land, farming and other income generating activities is needed to facilitate the reintegration process and thus to ensure their long term economic independence.
5) Gender equality: There are significant gender disparities in ownership of land and other property, education, health and human rights protection. Since women play important roles in agricultural production and marketing, it is essential to improve their living and work environment and enhance their capacity for agricultural development. Equal land rights should be given to women by strengthening land administration and accelerating implementation of the land laws. Support to female-headed households, who are among the poorest, is urgently required.
6) Security: The legacy of insecurity and violence significantly undermines steady development of the agricultural sector. Further disarmament is expected to reduce armed incidents, mitigate conflict damage and contribute to agricultural development, as demonstrated in the attempts by the GRSS and DPs. Since conflicts over scarce resources tend to occur during the dry season, a drought management system could be established as a conflict mitigating measure.
Institutional Development
1) Institutional and human capacity building: Public sector capacity for administration and financial management is weak, particularly at the state and local levels. Inadequate professional knowledge and skills and poor coordination between the GRSS and the state governments hinder performance at all levels. Low governance, accountability and transparency are reported throughout the system. Many of the issues identified by the four subsectors are also directly or indirectly linked to the weak public sector capacity for service delivery. Capacity development should be an integral part of CAMP for its effective and efficient implementation.
2) Funding: Inadequate funds for operating costs and capital investment, together with limited institutional capacity, severely affect public investment and service delivery, especially at the lower levels of government. It would be necessary to secure external funds for CAMP implementation, through project support, earmarked funding, pooled funding or budget support. Whatever the funding modality may be, the ministries concerned at the national and state levels would be required to follow properly prescribed procedures for budget execution, control and monitoring. This also implies a
3 International Organization for Migration South Sudan. 2013 Country Programme. Juba: IOM South Sudan. p. 6.

xxviii
need to strengthen their management capacity.
3) Service delivery: Public services are not effectively and efficiently delivered to target groups with respect to location, timing, size and content. Among these, timeliness is critical to agricultural support services because of the seasonality of production activities. The government relied heavily on NGOs for service delivery and failed to establish sound service delivery systems during the CPA period. It is vital to design a simple but effective system for agricultural service delivery through the CAMP formulation and deliver it in CAMP implementation.
Crop Subsector
1) Agricultural production: Low yield per unit area and small harvested area per capita lead to low cereal production, causing food insecurity in South Sudan. Even farm households face food insecurity. Despite favourable natural conditions (e.g., rainfall, temperature, soils, etc.) for various cash crops (e.g., vegetables, fruits, tea, coffee and oil seeds), the potential has not been fully exploited.
2) Costs of production: Compared to neighbouring countries, South Sudan’s costs of production, particularly labour costs and input prices, are larger due to higher commodity prices brought about by poor infrastructure and strong currency from oil exports. The higher costs of production reduce the competitiveness of agricultural products, resulting in large food imports from Uganda, Kenya, Ethiopia, etc.
3) Infrastructure: Infrastructure for transportation, irrigation, storage and processing is underdeveloped and electricity services are not available in rural areas. In particular, the poor infrastructure for road transport leads to very high transportation costs and long transit time, which impedes collection of products from production areas.
4) Security: Insecurity and conflicts disrupt crop cultivation and displace farmers, casing serious food insecurity in many areas. Livestock accompanied by armed pastoralists often destroys crops. Most farmers cannot afford preventive measures such as fencing.
5) Service delivery: Public sector service delivery to farmers is very limited. Agricultural Extension Officers (AEOs) are deployed at the payam level, but their number remains negligible. While NGOs provide some short-term training and extension, most farmers have no access to such services. The public sector has also yet to provide other support services such as agricultural research, control of migratory pests and diseases, and financial services.
6) Farmer organisations: There are few active farmer organisations, such as cooperatives and Farmer Based Organisations (FBOs). Farmers lack the capacity to organise themselves for marketing (e.g., gather crops into a larger volume for sale), which is one of the reasons why traders purchase products in bulk from neighbouring countries.
7) Environment for investment: The policy environment is not favourable for private sector activities in general and investment in particular. The uncertainty of land acquisition is a factor adversely affecting investors’ decision about agricultural investment. Multiple taxation and infrastructure deficiencies increase costs of operation and hinder all kinds of economic activity.
Livestock Subsector
1) Policy, legal and strategic framework: There is a lack of a comprehensive sector policy framework and subsectoral policies and lead institutions for the development of livestock-related industries. Current strategic frameworks are more focused on public sector issues than on the needs of the subsector. There is need to review the existing acts and bills and to institute mechanisms for their enforcement. An unclear and incomplete legal, policy and regulatory framework for land tenure has resulted in

xxix
inconsistencies in implementation, adversely affecting land for livestock production, migration, marketing and processing in both rural and urban areas.
2) Conceptual framework: The sub-sector potential is poorly understood and articulated as a result of lack of reliable livestock population data which has undermined strategy development, planning, investment and coordination at all levels and across the stakeholders. Areas of comparative advantage at the state, national and regional levels have not been identified. Mutually beneficial linkages to the crop sector are not harnessed for an integrated approach.
3) Institutional framework: Public sector institutions at the national and state levels do not have the necessary levels of staffing, in terms of number, qualification and capacity; neither do they have infrastructure and budgets to carry out their mandates. Coordination and communication within the public sector and with other stakeholders are poorly defined and resourced. Institutional arrangements to address natural resource issues are poorly developed; issues include water for production, rangeland management, drought and flooding, resource-based conflict, protection of key production and trade migration routes, and shared transboundary resources.
4) Production and productivity: The subsector is dominated by subsistence producers who rely on indigenous breeds, knowledge and technologies and aim to produce for household consumption. There is scope for making initial substantial gains in filling the large production and productivity gaps and eliminating seasonality of production by using low-level technologies already in existence in the region and by organization of producers. There is also scope for diversifying both the species and production systems to utilise a broader range of resources and strategies.
5) Animal health and food safety assurance: The prevalence of diseases due to the lack of facilities, human resources and investment impedes the delivery of animal health services. The impact of the 13 priority diseases is the largest on food security with losses in meat and milk production and related costs of treatment, amounting to hundreds of millions of USD. Hygiene standards for food of animal origin are inadequate and unenforceable due to lack of legal and regulatory frameworks, deterring private investment in meat and milk processing.
6) Market development: Around 60-90% of livestock production is consumed within producing households, i.e., low integration into value chains. Domestic value chains are faced with stiff competition from regional and global actors and encumbered by high transaction costs due to poor transport infrastructure, conflict and insecurity, low product quality and poor sanitary and phytosantiary standards. Neighbouring countries might benefit from adding value to cheaper raw materials from South Sudan for their domestic markets or re-exporting to more lucrative markets.
7) Taxation: Livestock and livestock products suffer from the multiple formal and informal taxes due to the lack of an integrated taxation framework with proper supervision on the ground. Production inputs such as day old chicks and feeds attract high taxes, which deters the growth of livestock inputs businesses and results in farmers and organisations purchasing them only on an ad hoc basis. Exports of hides and skins also attract high taxes.
8) Investment: Public sector expenditure on the subsector is far below the stipulated Maputo Declaration allocation of 3% of the national budget, needed to improve food security, reduce poverty and stimulate economic growth. Development assistance to the subsector has been minimal and mostly short-term and/or emergency funding. Subsidies by NGOs and some government initiatives have a mixed effect on ownership, growth of business acumen and sustainability. Financing for the majority of sector value chain actors is not forthcoming, and they are unable to get access to innovative financing opportunities in the region.

xxx
9) Training, research and extension: The four public universities offering training in animal production, animal health and veterinary sciences suffer from inadequate funding, limited qualified staff and weak capacity for practical training, and are not linked to regional university consortiums. Only one institution offers short-term training and refresher courses for those who deliver services on the ground. There are no dedicated public livestock research facilities, with only minimal research being conducted by the universities. Without effective public extension services, farmers and other actors rely on NGOs, radio broadcasts, farmer-to-farmer exchange and the Internet for information, but the information is often not appropriate or complete.
10) Security: Conflict and insecurity, including cattle raiding and rustling, disrupt livestock activities, resulting in loss of human lives and livestock, displacement of communities, inaccessibility to grazing and water resources and underutilisation of stock routes for production and marketing. In some counties, insecurity has reduced livestock populations and deprived people of their livelihoods; this has aggravated food insecurity and poverty.
Forestry Subsector
1) Commercial forestry: While some agroforestry and small-scale plantations have been developed in the Greater Equatoria region, teak plantations and woodlots for sustainable production are not fully exploited. Traditional and micro- and small-scale enterprises oriented to marketing forest products and services dominate the subsector. Large-scale private investment can be found only in forest management under concession arrangements. A limited volume of a few specific products, i.e., teak timber and gum acacia, are exported to regional and global markets. This can be attributed to the lack of a legal framework, poor infrastructure, inadequate government technical and regulatory support and a speculative market environment. Further investment is necessary to explore market opportunities for other forest products and services.
2) Community forestry and agroforestry: Although the concept of community forestry is defined in the Forest Policy 2013, the government does not have a legal framework consistent with varying customary laws and has insufficient expertise to deliver technical services for community forestry and agroforestry. The same issues arise with the collaborative management of Central Forest Reserves (CFRs) and other types of public forestry reserves involving forestry communities, private concessionaires, processors and traders. The legal framework and government expertise must be established to realise a community management regime.
3) Conservation: The country has experienced rapid degradation of biodiversity resources due to the widespread illegal and uncontrolled exploitation of such resources. The current management of CFRs is extremely weak and its strengthening is urgently needed to avoid further uncontrolled exploitation of forest resources, and encroachment. The public sector is unable to implement conservation measures in an effective manner because of weak collaboration among authorities at the national and state levels to manage and conserve forest resources, and due to the inadequacy of legal frameworks, expertise and resources for communication and transportation.
4) Institutional arrangements: A legal framework to clarify responsibilities and financial modalities of the national, state and local governments is under development. Coordination within the public sector is lacking, and low accountability, both upwards and downwards, is causing serious reporting and supervision problems. The viability of the South Sudan Forest Commission and Forest Development Consultative Forum, proposed in the Forest Policy 2013, in promoting private investment and decentralised forest management needs to be thoroughly analysed.
5) Policy implementation: The government’s delineation of responsibilities is inadequate for the implementation of the Forest Policy 2013. Key legal instruments such as the Forestry

xxxi
Law, related acts and other legal instruments are not in place or only partially implemented. Completeness, fairness and efficiency of forest revenue collection are neither achieved nor can be achieved due to unrealistic administrative provisions with respect to the human and financial resources allocated. Impediments to forestry development include corrupt practices, distrust between the public and private sectors, poor coordination within the public sector and with the private sector and DPs, and insufficient fund allocation for human resource development, application of science and technology and knowledge creation activities.
Fisheries Subsector
1) Management: This is mainly the responsibility of the government at the national and state levels. The key issue to be tackled by the government is the lack of skills, coordination and finance within the administrations involved in fisheries. Currently most government bodies involved in fisheries are not sufficiently active, and do not contribute to the good management nor development of fisheries in South Sudan. Until this lack of capacity is addressed, it will be difficult for the government to carry out its role, and implement necessary legal and regulatory obligations, as recognised in its own policies and strategies.
2) Production and marketing: This is mainly the responsibility of the private sector. The private sector is capable of improving production and post harvest in fisheries by itself, without government assistance (but necessarily under government regulatory supervision). The private sector however faces several challenges, greatest amongst them being poor transport and communications, the high cost of energy and utilities and informal taxation. All of these could be alleviated by direct government interventions.
3) Crosscutting issues: Major cross cutting issues, not only affecting fisheries, impact the whole sector, such as general health provision, education in fishing communities and poor security. As an example, the upcoming HIV epidemic is a hidden threat to fisheries and will hit the sector badly unless action is taken quickly.

Part 1: Situation Analysis 2013


1-1
1. Introduction
1.1 Background and objective
1.1.1 Background
South Sudan became independent on 9th July 2011, following a referendum in January 2011 and after decades of civil war. The total population was 8.26 million at the time of the Population Census 2008, 83% of which was living in rural areas (Table 1-1). Endowed with oil wealth, it is the richest country, in terms of GDP per capita, in East Africa. Oil exports accounted for 70% and 64% of GDP in 2010 and 2011, respectively, and provided 97% of government revenue.4 Yet, the counrty remains one of the least developed in the world, as characterized by a high poverty incidence (particularly in rural areas), low social indicators and virtually non-existent infrastructure. While a majority of the population is dependent on subsistence farming and pastoralism as sources of livelihoods, a considerable number of people continue to rely on humanitarian relief assistance to meet their needs.5 Faced with a declining trend in oil production, attention has been increasingly focused on the potential of its agriculture. Over 95% of the total area of South Sudan (658,842 km2) is considered suitable for agriculture, 50% of which is prime agricultural land where soil and climatic conditions allow for production of a variety of crops and livestock.6 The country has the sixth largest livestock herd and the highest livestock per capita holding in Africa with an estimated livestock population of 11.7 million cattle, 12.4 million goats and 12.1 million sheep.7 Dense forests occupy about 25% of the total land area, mainly in the Greater Equatoria, Greater Bahr el Ghazal and Upper Nile States. 8 The potential sustainable fisheries production from the River Nile, the Sudd and Bahr el Gazel and Sobat rivers and floodplains has variously been estimated to range between 100,000 and 300,000 tons per annum, though the higher of these historical estimates is probably optimistic. Despite such enormous potential in the agricultural sector, South Sudan has been suffering from low agricultural performance, high food insecurity and pervasive poverty, particularly in rural areas. This is due mainly to the following.9
Recurrent natural and man-made disasters
Insignificant public and private investments in agriculture
Absence of productive rural infrastructure
Inadequate access to improved agricultural technologies and inputs
Inadequate research and extension services
Inadequate access to animal health and veterinary services
Low level of human development
4 South Sudan National Bureau of Statistics (NBS). 2012. Release of new South Sudan Gross Domestic Product
(GDP) estimates for 2011, and revised figures for 2008-2010. Press release 02 October 2012. Juba: NBS 5 Baseline Technical Team. 2010. Joint Baseline Survey Report on the Agriculture and Animal Resources in
Southern Sudan. Juba: Government of Southern Sudan. p. 40. 6 World Bank. 2007. Final Proposal for a Multi Donor-Trust Fund Grant to the Government of Southern Sudan for
the Support to Agriculture and Forestry Development Project (SAFDP). Washington D.C.: World Bank. p. 30. (Government of the Republic of the Sudan, Sudan People’s Liberation Movement, World Bank and UNDP. 2005. Joint Assessment Mission: Framework for Sustained Peace, Development and Poverty Eradication. Volume III Cluster Reports; Tothill, J.D. ed. 1948. Agriculture in the Sudan. London: Oxford University Press; and Craig, G.M. ed. 1991. The Agriculture of the Sudan. London: Oxford University Press) 7 FAO. October 2009. Livestock Population Estimates.
8 World Bank. 2007. Final Proposal for a Multi Donor-Trust Fund Grant to the Government of Southern Sudan for
the Support to Agriculture and Forestry Development Project (SAFDP). Washington D.C.: World Bank. p. 32. 9 Kanisio, John O. 2012. “Overview of CAMP Formulation Process.” Presentation at the preparatory workshop for
the formulation of the Comprehensive Agricultural Development Master Plan (CAMP). Slide 2.

1-2
Effects of over-reliance of the economy on oil revenues.
Table 1-1: South Sudan’s key indicators
Number % Source
Land use (km2) 646,883 100.0 World Bank. 2012. Strategic Choice for Realizing South Sudan’s
Agricultural Potential (Table 1, p. 4) (Aggregated from FAO.
2009. Land Cover Database)
Cropland 24,777 3.8
Grass with crops 3,251 0.5
Trees with crops 17,073 2.6
Grassland 96,338 14.9
Tree land 405,269 62.6
Flood land 94,976 14.7
Water and rock 4,827 0.7
Urban 370 0.1
Population (2008) 8,260,490 SSCCSE. 2010. Southern Sudan Counts: Tables from the 5th
Sudan Population and Housing Census 2008 (Table 1-1, p. 9) Urban 1,405,186 17.0
Rural 6,855,304 83.0
Male 4,287,300 51.9 SSCCSE. 2010. Southern Sudan Counts: Tables from the 5th
Sudan Population and Housing Census 2008 (Table 1-1, p. 9) Female 3,973,190 48.1
Population density (person/km2) 13 NBS. 2012. Key Indicators for South Sudan
Population growth rate (2012) (%) 4.7 NBS Projection. NBS. 2012. South Sudan Statistical Year Book
2011 (p. 17)
Natural increase (%) 2.7
Net migration rate (per 1,000 pop.) 20.5
Mid-year population (2012) 10,386,101 NBS Projection. ditto.
Population below poverty line (%) 50.6 SSCCSE. 2010. Poverty in Southern Sudan: Estimates from
NBHS 2009 (p. 44). Poverty is defined as persons with the
value of monthly total consumption below SDG 72.9 in 2009.
Rural 55.4
Urban 24.4
Returnees (Oct. 2010 - July 2012) 407,239 OCHA. 2012. Cumulative No. of returnees
IDPs (Status 15/08/2012) 164,331 OCHA. 2012. Cumulative figures of new conflict related
displacement in 2012. People at risk of food insecurity (June
2012) (million)
4.7 UNHCR, OCHA and IOM, 2012
HHs using improved drinking water (%) 69 MoH. 2011. Sudan Household Health Survey 2010
Under-five mortality rate (2010) (1,000 live
births)
105 MoH. 2011. Sudan Household Health Survey 2010
Maternal mortality rate (2006) (100,000 live
births)
2,054 MoH. 2007. Sudan Household Health Survey 2006
Literacy rate (15-24 years) (2009) (%) 40 NBS. 2012. National Baseline Household Survey 2009
Male 55
Female 28
Primary school gross enrolment rate
(GER) (2010) (%)
69 MoE. 2010. Education Management Information System (EMIS)
Report Male 81
Female 55
Main source of livelihood (2009) (%) NBS. 2012. National Baseline Household Survey (NBHS) 2009
Crop farming and animal husbandry 76
Households (%) SSCCSE. 2010. Southern Sudan Counts: Tables from the 5th
Sudan Population and Housing Census 2008 (Table 9-1, p. 109) Engaged in cultivation 81
Engaged in fishery 22
Owing livestock 74
GDP (2011) (SSP million*) 54,249 NBS. 02 October 2012. Press release
GDP per capita (2011) (SSP*) 5,481 ditto.
Oil exports’ share of GDP (2011) (%) 64 ditto.
GDP (2008) (USD million) 15,274 ditto. SSP 31,923 million, calculated at SSP 2.09/USD
Value of agricultural production (2008)
(USD million)
808 World Bank. 2012. Strategic Choice for Realizing South Sudan’s
Agricultural Potential (Estimated based on SSCCSE. 2009.
NBHS)
GRSS revenue and expenditure 2011/12 Government of the Republic of South Sudan. 2012. Approved
Budget 2012/13 Revenue (SSP billion*) 10.18
Oil revenue (SSP billion*) 9.88 97.1
Expenditure (SSP billion*) 10.14
Annual rainfall in Juba (mm) 1,028.7 NBS. 2012. South Sudan Statistical Year Book 2011 (p. 3)
Note*: The official rate has been set by the Bank of South Sudan at SSP 2.95/USD since September 2009 while the market exchange rate was around SSP 4.00/USD in May 2013.

1-3
1.1.2 Justification for CAMP formulation
In the light of the above-mentioned situation, the Government of the Republic of South Sudan (GRSS) realized the need to formulate a comprehensive master plan to guide agricultural development at the national and state levels in order to:10
1) Address hunger and food insecurity through increased food production; 2) Leverage the agricultural sector to improve rural livelihoods and generate income; 3) Diversify the economy through a modernized, competitive agricultural sector; and 4) Harmonize and streamline public and private investments and development assistance in
the sector through enhanced capacity for planning and implementation. The then Ministry of Agriculture, Forestry, Cooperatives and Rural Development (MAFCRD) and the then Ministry of Animal Resources and Fisheries (MARF)11 took the decision to formulate the Comprehensive Agricultural Development Master Plan (CAMP) and formally requested technical assistance from the Japan international Cooperation Agency (JICA) in November 2011. Following a scoping mission in March-May 2012, the two ministries signed a technical cooperation agreement with JICA in June 2012.
1.1.3 Objective of the CAMP process
The objectives of the CAMP process are as follows.12
1) Formulate a comprehensive agricultural development master plan that will identify the potential of different products all over the country, priority programmes/projects and the resources required to implement them
2) Recommend a feasible institutional setup for implementation of potential priority projects and spell out the roles of different stakeholders participating in agricultural development activities in the country
3) Strengthen the capacity of the national task team members through the process for formulating related policies and plans of the respective ministries in a number of key areas to be prioritized by government and other stakeholders
Once formulated, the GRSS will ensure that all public and private investments and programmes supported by the development partners (DPs) in the sector are aligned with CAMP. The implementation of all the programmes will be directed, coordinated, monitored and reviewed by the government in collaboration with all stakeholders.
1.1.4 Target subsectors and geographic area
The master plan covers the subsectors of agriculture, forestry, livestock and fisheries, while the geographic coverage is, in principle, the whole area of South Sudan.
1.1.5 Implementation and collaborating ministries
The following two ministries are responsible for CAMP formulation.
1) Ministry of Agriculture, Forestry, Tourism, Animal Resources and Fisheries (MAFTARF) 2) Ministry of Electricity, Dams, Irrigation and Water Resources (MEDIWR)
10
Kanisio, John O. 2012. “Overview of CAMP Formulation Process.” Presentation at the preparatory workshop for the formulation of the Comprehensive Agricultural Development Master Plan (CAMP). Slide 3. 11
The two ministries, together with the Directorate General of Tourism, the Ministry of Wildlife Conservation and Tourism, were merged into the Ministry of Agriculture, Forestry, Tourism, Animal Resources and Fisheries (MAFTARF) in August 2013. 12
Udo, Mathew Gordon. 2012. “Overview of CAMP Formulation Process.” Presentation at the South Sudan Agriculture Conference. Slide 5.

1-4
MAFTARF is the lead ministry in the process. MEDIWR is formulating the Irrigation Development Master Plan (IDMP) as a sub-component of CAMP, also assisted by JICA. Collaborating ministries and agencies include:
1) Ministry of Finance, Commerce and Economic Planning 2) Ministry of Petroleum, Mining, Industry and Environment 3) Ministry of Interior and Wildlife Conservation 4) Ministry of Transport, Roads and Bridges 5) Ministry of Lands, Housing and Physical Planning 6) South Sudan Land Commission 7) National Bureau of Statistics (NBS) 8) State Governments.
1.2 Guiding principles
CAMP formulation is guided by the following principles. (1) Government-led formulation While supported by the DPs, MAFTARF leads the entire process. The national CAMP Task Team will carry out all the tasks required for the master plan formulation in cooperation with experts and consultants deployed by DPs. The process is also expected to advance through government-led stakeholder coordination. Special emphasis is placed on the GRSS’s leadership in and ownership of the CAMP process. (2) Capacity development throughout the formulation process Government-led formulation, and later implementation, will demand a greater capacity of the ministries concerned and their staff. To build capacity, it is essential for the CAMP Task Team members, including experts and consultants, to work collaboration. Master plan formulation associated with capacity development is expected to be more time-consuming, but it is indispensable for bringing about lasting results. (3) Formulation of an implementable plan To ensure the effective implementation of CAMP, it is crucial to formulate a master plan with:
Attainable goals and targets;
Realistic timeframe for implementation;
Concrete programmes, projects and activities;
Roles and responsibilities of various actors, especially national and state governments;
Feasible funding mechanisms; and
Appropriate M&E systems. (4) Alignment with existing policies, plans and institutional arrangements CAMP will be consistent and fully aligned with the national agenda of agriculture and rural development, such as South Sudan Vision 2040, the South Sudan Development Plan (SSDP) 2011-2013 and the Comprehensive Africa Agriculture Development Programme (CAADP), government policies (including policy frameworks, sub-sector policies, strategic plans, etc.) and government systems in the agricultural sector of South Sudan. (5) Coordination with other stakeholders MAFTARF will coordinate with other stakeholders, such as other government agencies, DPs, NGOs and the private sector to ensure the successful formulation and implementation of CAMP. Communication, information sharing, consultation, collaboration and maintaining transparency and accountability are all important elements of coordination. CAMP formulation is currently supported by experts of JICA, CIDA and GIZ.

1-5
1.3 Coordination mechanism
The wide range of stakeholders involved in the CAMP process requires a harmonized and coordinated framework for effective and efficient management of activities and resources for the master plan formulation. A coordination mechanism has thus been set up for CAMP formulation as illustrated in Figure 1-1. Table 1-2 summarises the composition and functions of the institutions involved in the CAMP coordination mechanism. In addition to the above-mentioned ministries, the CAMP Task Team will consult with various government and private institutions, universities, DPs and NGOs to solicit their technical advice and any information necessary for the master plan formulation. It may be necessary to maintain the coordination mechanism throughout the implementation period to prepare annual plans and budgets and monitor the performance of the master plan. The mechanism should be revised as a need arises.
Figure 1-1: Coordination mechanism of the CAMP process
Source: Prepared by the CAMP Task Team and approved by the Technical Committee on 24 September 2012. Notes: 1) The names of institutions are as of April 2013. 2) Abbreviations are as follows. FAO = Food and Agriculture Organization; DP = Development Partner;
IDMP = Irrigation Development Master Plan; ISC = Inter-Ministerial Steering Committee; JICA = Japan International Cooperation Agency; LC = Land Commission; MAFCRD = Ministry of Agriculture, Forestry, Cooperatives and Rural Development; MARF = Ministry of Animal Resources and Fisheries; MCII = Ministry of Commerce, Industry and Investment; MoEnv = Ministry of Environment; MoFAIC = Ministry of Foreign Affairs and International Cooperation; MoFEP = Ministry of Finance and Economic Planning; MRB = Ministry of Roads and Bridges; MoT = Ministry of Transport; MWRI = Ministry of Water Resources and Irrigation; NBS = National Bureau of Statistics; TC = Technical Committee; TT = Task Team.
Inception Report
10
4. Coordination Mechanism
The wide range of stakeholders that will be involved in the CAMP process requires a harmonized and coordinated framework for effective and efficient management of activities
and resources for the master plan formulation. Thus, this chapter presents the coordination
mechanism required for the CAMP formulation. The roles and responsibilities of each institution relating to CAMP are described in detail in Appendix II. The coordination
mechanism should be flexible and is envisaged to integrate current development activities in
the sector gradually into, and guide new investments towards, the CAMP process.
Figure 1: Coordination Mechanism of the CAMP Process
Source: Prepared by the CAMP Task Team based on the Record of Discussions signed between GRSS and JICA in June 2012
and discussions on the coordination mechanism during the Preparatory Workshop held in August 13-15, 2012, and
through a series of discussions in Task Team meetings thereafter. Notes: 1) See the notes of Table 4 below for Abbreviations and acronyms. 2) The details of the Irrigation Development Maser Plan (IDMP) are under discussion as of September 25, 2012.
Table 4 summarizes the composition and functions of the institutions involved in the CAMP
coordination mechanism as illustrated above. In addition to the CAMP institutions (including
Technical Committee (TC)
· Chair: Undersecretary, MAFCRD
· Co-chair: Undersecretary, MARF
· Moderator for IDMP: U-Secretary, MWRI
· Members: Undersecretaries and key
technical DGs of MAFCRD, MARF,
MWRI, MoT and MRB
Feedback Report
CAMP Task Team (TT)
· Team leader: Appointed from MAFCRD or MARF members
· Co-team leader: Provided by JICA · Secretaries: Appointed from MAFCRD,
MARF, MWRI and JICA consultant members
· Members: Staff of MAFCRD, MARF and MWRI, JICA consultants and experts deployed by FAO and other DPs
Inter-Ministerial Steering Committee (ISC)
· Chair: Minister, MAFCRD · Co-chair: Minister, MARF · Moderator for IDMP: Minister, MWRI · Members: Ministers of MWRI, MCII,
MoFEP, MoFAIC and MoEnv, Chairpersons of LC and NBS, State Ministers of Agriculture and Parliament Chair of Natural Resources
Feedback Report
Feedback Report
Stakeholder
Meeting
Invited
Focal
Points of
the States
Input
Input
Input
Input
IDMP Task Team (TT)
· Staff of MWRI,
MAFCRD and MARF
· JICA consultants

1-6
Table 1-2: Composition and main functions of the CAMP institutions13
Name Composition Main Functions
Inter-Ministerial Steering Committee (ISC)
- Chair: Minister, MAFCRD - Co-chair: Minster, MARF - Moderator for IDMP: Minister,
MWRI Members: Ministers of MWRI,
MCII, MoFEP, MoFAIC and MoEnv, Chairpersons of LC and NBS, State Ministers of Agriculture and Animal Resources and Parliamentary Chair of Natural Resources
The highest decision-making body for CAMP (including IDMP as its sub-plan).
Provide political support and policy directives to CAMP formulation.
Approve budgets for CAMP formulation.
Approve the final drafts of CAMP and IDMP.
Present the final drafts to the Council of Ministers and pass them to Parliament.
ISC meets biannually.
Technical Committee (TC)
- Chair: Undersecretary, MAFCRD - Co-chair: Undersecretary, MARF - Moderator for IDMP:
Undersecretary, MWRI - Members: Undersecretaries of
MWRI, MoFEP and MoEnv and DGs of key technical DGs of MAFCRD, MARF, MWRI, MoFEP, MRB, MoT and MHPP
- Secretariat: CAMP TT Secretariat
Supervise the work of CAMP-TT and IDMP-TT and give technical and strategic advice to TTs.
Monitor the progress of CAMP formulation by reviewing minutes of meetings, progress reports, draft plans, etc. and give feedback to TTs.
Report the progress of CAMP formulation to ISC and make recommendations to ISC on the compliance of CAMP (including IDMP) with national policies and strategies.
Review and submit budgets to ISC.
Submit the final drafts of CAMP and IDMP to ISC.
TC meets three times a year and as required.
CAMP Task Team (CAMP-TT)
- Team leader: Appointed from MAFCRD or MARF members in consultation with TC
- Co-team leader: Provided by JICA
- Secretary: Appointed from MAFCRD, MARF, MWRI and JICA consultant members in consultation with TT
- Assistant Secretary: ditto. - Members: Staff of MAFCRD and
MARF, two members of MWRI, JICA consultants and experts deployed by FAO and other DPs
Undertake all activities and tasks necessary for CAMP formulation (e.g., plan and budget for all activities, coordinate and communicate with the stakeholders, organize meetings and workshops, prepare minutes of the meetings, collect and analyse data, conduct field visits, disseminate information, draft and write up CAMP documents, submit drafts to TC, etc.).
Report the progress of CAMP formulation to TC regularly and obtain feedback from TC.
Formulate and submit budgets to TC.
CAMP-TT meets weekly and as required.
State Focal Points
- Two staff members of each state ministry concerned with agricultural development (including crop production, forestry, animal resources and fisheries)
- One staff member of each state directorate of rural water and sanitation
Bridge between national and state governments.
Coordinate with government staff of each state.
Create awareness of CAMP in each state.
Provide information on the present situation of the agricultural sector of each state.
Facilitate data collection at the state level.
Participate in workshops on planning, M&E and implementation to be organized by the two TTs.
They meet CAMP-TT biannually on the occasions of stakeholder meetings.
Stakeholder Meeting
- Representatives of national government institutions, state focal points, DPs, NGOs, the private sector, universities, etc.
Be consulted by the two TTs and provide input useful for CAMP formulation.
The meetings are held biannually.
Source: Prepared by the CAMP Task Team and approved by the Technical Committee on 24 September 2012. Notes: TT = Task Team; DP = Development Partner; IDMP = Irrigation Development Master Plan; ISC = Inter-Ministerial Steering Committee; JICA = Japan International Cooperation Agency; LC = Land Commission; M&E = Monitoring and Evaluation; MAFCRD = Ministry of Agriculture, Forestry, Cooperatives and Rural Development; MARF = Ministry of Animal Resources and Fisheries; MCII = Ministry of Commerce, Industry and Investment; MoEnv = Ministry of Environment; MoFAIC = Ministry of Foreign Affairs and International Cooperation; MoFEP = Ministry of Finance and Economic Planning; MRB = Ministry of Roads and Bridges; MoT = Ministry of Transport;
13
The roles and responsibilities of each institution relating to CAMP are described in detail in the GRSS.
December 2012. Coordination Mechanism and Terms of Reference (TOR) for Institutions concerned with the Formulation of the Comprehensive Agricultural Development Master Plan (CAMP).

1-7
MWRI = Ministry of Water Resources and Irrigation; NBS = National Bureau of Statistics; TC = Technical Committee.
1.4 Work schedule
Table 1-3 describes tasks of each activity and the work schedule for CAMP formulation. The CAMP process is roughly divided into two periods, a 6-month preparation period (July 2012 - December 2012) and a 24-month formulation period (January 2013 – December 2014). In each activity, the CAMP Task Team will build a consensus among the stakeholders by discussing the results at a stakeholder meeting and then move on to the next activity. An important characteristic of the CAMP process is that the master plan formulation is fully based on the past experience, current situation and issues for development to be identified through the situation analysis. No less important in the process is the designing of an implementation framework that clarifies the roles and responsibilities of various actors, funding mechanisms and M&E systems.

1-8
Table 1-3: Work schedule for CAMP formulation
Source: Originally prepared by the CAMP Task Team in August 2012 and revised in August 2013.
1.5 Objectives and methodology of the situation analysis
1.5.1 Objectives
Situation analysis is an important step of the CAMP process to achieve its overall objectives described in Section 1.1.3. The objectives of the situation analysis are:
1) To understand the past and present status, issues and opportunities of agricultural service delivery for designing the CAMP implementation framework;
2) To understand the past and present status, issues and opportunities of the agriculture sector from cross-cutting and subsector perspectives, and local, national, and regional market perspectives for the development of investment plans;
3) To analyse the mechanisms and processes of agricultural transformation to determine future sector development scenarios for the period of 2015-2040; and
4) To identify information useful to estimate the expected impact of public service delivery to determine the priority, location, timing and size of public interventions in the form of programmes and projects.
J A S O N D J F M A M J J A S O N D J F M A M J J A S O N D
Activity 1: Stakeholder consolidation
Preparation/finalization of Inception Report and Work Plan
Activity 2: Situation analysis of the agricultural sector
[Review of agriculture development policies]
Review of policy frameworks
Review of sub-sector policies
Review of relevant legal frameworks
[Analysis of present conditions]
Collection of existing data
Review of overall performance of the agricultural sector
Analysis of present conditions of the agricultural sector
[Review of institutional arrangements]
Review of institutional arrangements and capacity of the institutions
concerned
Review of challenges facing stakeholders in agricultural investment
Review of existing implementing bodies for programmes/projects
Preparation of Progress Report 1
Clarification of key issues and challenges in agricultural development
Formulation of a framework for agriculture development (e.g., objectives,
timeframe, targets, strategies, etc.)
Identification of priority pillars to achieve development targets
Identification of priority programmes by pillar
Formulation of medium- and long-term targets by pillar/programme
Preparation of Interim Report
Activity 4: Preparation of investment plansFormulation of investment plans by programme (institutional and physical)
Cost estimation for projects/activities
Formulation of implementation plans for projects/activities with quick impact
and higher priority by programme
Preparation of Progress Report 2
Clarification of roles of national and state governments and the private sector
Modelling of the implementation arrangements for projects to be managed by
state governments
Identification of appropriate funding mechanisms for projects/activities by
national and state governments
Identification of measures to promote public-private partnership (PPP) in the
agriculture sector
Identification of appropriate systems of monitoring and evaluation by the
national and state governments
Preparation of Final Report (master plan document)
Activity 5: Proposing the implementation framework to materialize the
master plan
Activities and Tasks2012 2013 2014
Activity 3: Formulation of a framework for agriculture development and
identification of priority areas

1-9
The first and second objectives are tightly interlinked and are set to answer the questions of i) how CAMP can be integrated into the government system, ii) how a devolved CAMP implementation mechanism can be designed, and iii) how changes in behaviour of beneficiaries such as producers, traders and investors can be promoted. To develop the CAMP implementation framework and investment plans, it is necessary to understand the past and current status, issues and opportunities of both public sector interventions and private sector activities, and interactions between them in the agriculture sector. Gaps between the current and expected institutional arrangements and capacity are to be examined to develop public sector capacity development components. The establishment of a government-led stakeholder coordination mechanism, together with a funding mechanism for CAMP implementation, is to be an important element of the CAMP process. Investment plans with cross-cutting and subsector programmes and projects in support of farmers, traders and agro-businesses will also be developed based on issues and opportunities identified. The third and fourth objectives are necessary to facilitate discussions on 25-year agriculture sector development scenarios for and prioritisation of cross-cutting and subsector public interventions. To define private sector-led agriculture development scenarios for food security, poverty reduction and economic growth and sector transformation, it is important to understand the mechanisms of agriculture sector development involving private and public sector actors. The scenarios will include long-, medium-, and short-term targets. To develop investment plans consistent with the scenarios, it is necessary to specify priorities, locations, timing and size of programmes and projects based on preliminary assessment of impacts, assuming that public services are delivered at optimal efficiency and effectiveness with respect to public resources. The required level of public sector capacity and time to achieve that level will influence the development scenarios. The concept of agricultural transformation within the context of CAMP is to be defined. Transformation is demonstrated by changes in agricultural production, distribution and consumption modes plus increases in labour productivity and returns on capital. It is also manifested by the development of commercial farming, agro- and export businesses, formalisation of informal sectors, increase in tax revenues from the formal sector and accumulation of commercial and industrial capital derived from agricultural activities. It is further shown by factors external to the agriculture sector, such as road networks, rural-urban migration, increase in off-farm employment, demographic change, and the availability of healthier and better-educated labour in rural areas.
1.5.2 Methodology
Micro-level in-depth case studies in 10 states were conducted using various study tools such as questionnaires, focus group discussions and thematic interviews. For macro-level studies, analysis of the existing national framework datasets was conducted in collaboration with the National Bureau of Statistics (NBS). Information collected through these micro- and macro-level studies was summarised and analysed by applying the following analytical framework and methodologies. (1) Efficiency of service delivery by the GRSS and state governments To achieve the first objective of the situation analysis in-depth case studies, interviews, and literature surveys were conducted to describe cross-cutting issues regarding policy and legal frameworks, institutional frameworks, and public financial management and related institutional capacities. Each subsector investigated its own legal and institutional arrangements. It is assumed that counties are responsible for on-the-ground and front-line service delivery whereas the GRSS and state governments are responsible for providing technical and financial support to counties and supervision of their activities.

1-10
(2) Markets, food security, poverty reduction and agricultural transformation To achieve the second objective of the situation analysis, cross-cutting and subsector oriented situation analysis was conducted. The private sector was identified as the driving force of agricultural transformation. Subsector micro-level in-depth case studies and macro-level analysis of existing national framework datasets and studies of crosscutting issues were conducted. At the same time, a simple analytical framework focusing on the location and socioeconomic extent of the market for each product and its value chain was adopted. As shown in Table 1-4, markets are categorised into: 1) subsistence production; 2) local market (rural-rural transaction); 3) domestic market (rural-urban transaction); 4) regional market; and 5) global market. The contributions of agricultural activities in each category to food security, economic growth (i.e., poverty reduction and income increase) and agriculture sector transformation are summarised in the table. The type of market is defined by the length of value chains and extent of movement of products. It is assumed that a product’s contribution to food security, economic growth and sector transformation comes from market transactions that add value in its value chain. The addition of value equates to additional income. This discussion implies that the additional income can be used to purchase food in times of food insecurity and, so have a positive impact on food security. (3) Mechanisms and processes of agricultural transformation To achieve the third objective of the situation analysis, it is assumed that the private sector is the main agent of change for agricultural transformation. Analysis was conducted at the micro- and macro-level for each subsector, as well as of cross-cutting and overarching issues. The aim was to describe the historical dynamism of the sector, coping mechanisms, market integration of farmers, movement of goods and services through value chains, and the agents involved. Areas analysed included the historical background of the agriculture sector, macro- and regional economies, food security, rural society and livelihoods, land tenure and the rural labour market. The situation analysis also identified obstacles to market and private sector development, and private investment in the sector plus the government's role in the market to address issues of market efficiency. (4) Collection and compilation of data for preliminary project impact assessment To achieve the fourth and last objectives of the situation analysis, the existing national framework datasets are examined. Since CAMP is a national master plan with a set of programmes and projects with timelines and locations designed for optimal impact, a national scope analysis and comparison of the expected impacts of candidate programmes and projects needs to be performed. For this reason, population distribution, road networks, land-use and other datasets with a national scope were identified and compiled for a preliminary impact assessment.
Table 1-4: Markets and food security, poverty reduction and economic growth
Extent of market Characteristics of value chain and value
added*
Expected impacts on food security, poverty reduction and economic growth
(1) Subsistence production
• No value chain • Intra household value
transfer • Substitution of market
goods by own production
• No significant effect on food security except substitute effects on availability of food items
• Labour productivity diminishes as population density increases due to closed economy. Limited room to increase labour productivity.
• Little or no capital accumulation by the informal sector and no room to increase capital returns.
(2) Local market (rural-rural
• Short value chain with small value added
• Household-wide food insecurity can be addressed through inter household value transfers.

1-11
transaction) • Inter household value transfer within a locality
• Labour productivity can be increased by education. • Small-scale capital accumulation mainly by the
informal sector, and limited room to increase capital returns.
(3) Domestic market (rural-urban transaction)
• Medium value chain with medium value added
• Inter local value transfer within South Sudan
• Local-wide food insecurity can be addressed through domestic value transfers.
• Labour productivity can be increased by education and technology investment from accumulated capital.
• Medium-scale capital accumulation mainly by the formal sector and increase in capital returns through adoption of advanced technologies.
(4) Regional market • Long value chain with high value added
• International value transfer in the region
• Nation-wide food insecurity can be addressed through regional value transfers.
• Labour productivity can be increased by education and technology investment from accumulated capital.
• Large-scale capital accumulation by the formal sector and increase in capital returns though adoption of advanced technologies and scale of economy.
(5) Global market • Long value chain with high value added
• International value transfer in the world
• Region-wide food insecurity can be addressed through global value transfers.
• Labour productivity can be increased by education and technology investment from accumulated capital.
• Large-scale capital accumulation by the formal sector and increase in capital returns though adoption of advanced technologies and scale of economy.
Note (*): Opportunity costs for capital and labour inputs should be accounted for in the estimate of value added.
1.6 Progress from August 2012 to July 2013
Figure 1-2 indicates progress made by the CAMP Task Team for the period from August 2012 to July 2013. Major achievements during the period are that the current situation and key issues of the agricultural sector have been identified through data collection and analysis at the national, state, county, payam and farm levels. The Task Team visited all 10 states and 47 counties, about 60% of the total 79 counties. In addition, issues and opportunities were preliminarily identified and discussed at a Technical Committee meeting.
Figure 1-2: Progress of the CAMP process
Source: Prepared by the CAMP Task Team.
8 9 10 10 11 12 1 2 3 4 5 6 7 8 9 10 11 12 1 2 3 4 5 6 7 8 9 10 11 12
Stakeholder consolidation ▲▲▲▲▲▲▲▲▲
Situation analysis
Literature survey/interviews/field visits ▲▲▲▲▲
Inception report/work plan development ▲▲▲▲▲▲
Field study in 10 states ▲▲▲▲
Report on situation analysis ▲▲▲▲▲▲
Stakehoder meeting ▲
Progress report ▲
Interim report ▲
CAMP framework formulation and priority identification ▲▲▲▲▲▲▲▲▲▲▲
Preparation of investment plans ▲▲▲▲▲▲
Proposing implementation framework ▲▲▲▲▲▲
Initiation of resource mobilization ▲▲▲▲▲▲▲▲
2012 2013 2014

1-12
This report presents preliminary results of the situation analysis conducted from August 2012 to July 2013. Part I contains findings on cross-subsectoral and cross-cutting issues including the economy, policy and institutional frameworks, public financial management and rural society and livelihoods, Part II reports on the crops, livestock, forestry and fisheries subsectors and Part III on preliminary discussions and a work plan for the master plan formulation. A complete situation analysis report, together with a framework of the master plan and priority programmes, will be included in the Interim Report to be prepared by December 2013. Challenges ahead in the CAMP process include: completion of the situation analysis, consensus building among the stakeholders on key issues and the framework for agricultural development, further involvement of the state and local governments in the process and continuous capacity development for master plan formulation and implementation.

2-1
2. South Sudan’s economy and agriculture: an overview
2.1 South Sudan’s economy in a historical context14
The current economic situation of South Sudan is deeply rooted in Sudan’s modern economic system that emerged during the colonial era and that was established around cotton-based irrigated agriculture. It is also a result of the longest civil war in African history. As pointed out by the Joint Assessment Mission in 2005, “the bureaucracy, infrastructure and services were all geared towards this economy and did not enable broad-based development for the vast majority of the population in the rain-fed regions, most notably the South.”15 This section presents a historical overview of economic development in South Sudan. Table 2-1 shows major historical events related to South Sudan from the early 19th century to independence.
Table 2-1: Chronology of South Sudan: from the 19th Century to independence
Date Event
1821-1885 Turco-Egyptian regime
1885-1898 Mahdist regime
1899-1955 Anglo-Egyptian Condominium
1955-1972 First Civil War
February 1953 Anglo-Egyptian Accord signed for Sudan’s self-government
January 1956 Independence of Sudan from Britain and Egypt
February 1972 Addis Ababa Accords signed between the Southern Sudan Liberation Movement (SSLM) and the Government of the Sudan Southern Sudan Autonomous Region established
1978 Oil discovered in the Bentiu area
June 1983 Addis Ababa Accords abrogated by a Presidential decree
July 1983 Southern People’s Liberation Movement/Army (SPLM/SPLA) founded
1983-2005 Second Civil War
1999 Advent of oil
January 2005 Comprehensive Peace Agreement (CPA) singed between SPLM/SPLA and the Government of the Sudan, followed by the Joint Assessment Mission (JAM)
January 2011 Referendum on independence
July 2011 Independence of Southern Sudan as the Republic of South Sudan
Sources: World Bank. 1973. Sudan - Economic Development of Southern Sudan. Washington, DC: World Bank. Yongo-Bure, B. 2007. Economic Development of Southern Sudan. Lanham: University Press of America. SPLM. 2008. The Manifesto of the Sudan People’s Liberation Movement. http://en.wikipedia.org/wiki/History_of_Sudan.
2.1.1 Pre-Independence Sudan
In the 19th century, the southern region of the Sudan was physically isolated from the north and the rest of the world due to limited accessibility caused by the Sudd. Military expeditions from the north aimed at establishing control over the south and other invasions for collecting slaves and ivory continued. Throughout the colonial period, the region remained isolated and largely an area of a subsistence economy. The development of a cash economy was hindered by the distance from potential markets, coupled with poor transport and marketing
14
Unless otherwise noted, this section is largely based on: 1) Southern Development Investigation Team. 1955.
Natural Resources and Development Potential in the Southern Provinces of the Sudan. A Preliminary Report 1954. London: Sudan Government; 2) World Bank. 1973. Sudan - Economic Development of Southern Sudan. Washington, DC: World Bank; 3) World Bank. 2003. Sudan - Stabilization and Reconstruction: Country Economic Memorandum. Washington D.C.: World Bank; and 4) Yongo-Bure, B. 2007. Economic Development of Southern Sudan. Lanham: University Press of America. 15
Government of the Republic of the Sudan, SPLM, World Bank and UNDP. 2005. Joint Assessment Mission:
Framework for Sustained Peace, Development and Poverty Eradication. Volume III Cluster Reports. p. 80.

2-2
facilities, by lack of interest and incentives, by shortage of capital and the limited supply of labour. The isolation was reinforced by the separate development policy for the south, the Closed Districts Ordinances created by the British in the 1920s which restricted northern Sudanese from entering or working in the south. The so-called Southern Policy, while it was intended to allow the south to develop along indigenous lines, contributed to the isolation and became the root of north-south discord in later years.16 British interest in the south was closely linked to the control of the whole Nile Valley so as to maintain a favourable position over the use of the Suez Canal. With no resource base in the south to generate revenue, the British colonial administration paid no serious attention to the economic development of the south until the late 1930s. In 1938, the then Director of Agriculture in Sudan, Dr J. D. Tothill, proposed a ten-year development plan for the south, but the outbreak of World War II prevented its implementation. In 1945, the government approved a proposal for the Zande Scheme, including the establishment of the Equatoria Agricultural Projects Board.17 The board promoted the cultivation and manufacturing of such products as cotton, sugar cane and oil palm (for soap) mainly for the needs of local people, while private entrepreneurs developed limited quantities of coffee, tobacco and tea. Other activities of the Zande Scheme included: 1) the establishment of an agricultural research institute and a training institute for agricultural workers in Yambio; 2) the establishment of a small industrial complex in Nzara; 3) fisheries development with the export of dried fish to Uganda and the former Belgian Congo; and 4) a forest plantation programme, principally hardwoods. However, the overall impact of the scheme was insignificant, and the economic gap between the south and the north became evident by the end of the colonial period.
2.1.2 Independence of Sudan
(1) First civil war period (1955-1972) In 1953, Britain and Egypt agreed to grant independence to Sudan, and during the three-year transition period to self-government, the new Sudanese government started to replace British colonialism with Arab/Islamic colonialism and increasingly moved away from commitments to create a federal system to give the south autonomy. “Sudanisation in the administrative, political and industrial fields”18 had already outraged southerners, but two events in 1955 became an immediate trigger for the first civil war that would continue till 1972. The first was the dismissal of 300 workers in the Zande Scheme and a demonstration by them, which the police and army quelled by gunfire. The second was the more serious mutiny of the Equatoria Corps (the battalion established in 1917 consisting entirely of southerners) in Torit and other southern towns, which soon led to a general revolt. The mutinies were suppressed, but survivors fled the towns and began an uncoordinated insurgency in rural areas, and gradually developed a secessionist movement. The characteristics of the southern economy towards the end of the colonial era are vividly described in the Southern Development Investigation Team’s study,19 conducted in 1954 and perhaps the most comprehensive multi-disciplinary study of South Sudan till today. The study indicates that the mainstay of the southern economy was subsistence agriculture, including animal husbandry, fisheries and forestry (Table 2-2). Most of the 2.4 million southerners lived in rural areas and residents in urban areas, such as Malakal, Bor, Rumbek Aweil and Torit, were mainly traders and government employees. The Investigation Team
16
Mayo, D. N. 1994. The British Southern Policy in Sudan: An Inquiry into the Closed District Ordinances (1914-
1946). Northeast African Studies, Volume 1, Numbers 2-3, 1994 (New Series). pp. 165-185. East Lansing: Michigan State University Press. 17
Wyld, J. W. G. 1949. The Zande Scheme. Sudan Notes and Records, Volume XXX, 1949. pp. 47-57. 18
The Report of the Commission of Enquiry. 1955. (As cited in World Bank. 1973. Sudan - Economic
Development of Southern Sudan. Washington, DC: World Bank. p. 5.) 19
Southern Development Investigation Team. Natural Resources and Development Potential in the Southern
Provinces of the Sudan. A Preliminary Report 1954. London: Sudan Government.

2-3
concluded that in the initial stage the economic development of the south would “have to depend largely on the financial resources of the North, and capital must be made available.”20
Table 2-2: Population and characteristics of economy by district in 1954
District (HQ)
Ethnic Group Estimated Population
Ecological Region
(Figure 2-1)
Characteristics of Economy
Est. Animal Pop.
Cattle Sheep &
Goats
Upper Nile Province 868,185 1,079,150 559,100
Renk (Renk)
Abialang Dinka, Paloich Dinka, Maban, Ta’aisha, Malakia, etc.
52,350 Central Rainlands and Flood
In Renk, originally mainly pastoralists, now predominantly cultivators with surplus of grains. In other areas, mainly sedentary cultivators with some livestock.
21,000 17,500
Malakal (Malakal) and Shilluk (Kodok)
Dunjol Dinka, Ngok Dinka, Shilluk
141,380 Flood and Central Rainlands
In Malakal, originally mainly pastoralists, turning to dura cultivation. In other areas, mixed economy with emphasis on crop production and fisheries (Kodok).
46,000 127,000
Eastern Nuer (Nasir)
Eastern Jikaing Nuer, Koma
101,040 Flood Predominantly pastoral, with adequate grain supplies.
97,000 100,000
Lau Nuer (Akobo)
Lau Nuer 74,750 Flood Predominantly pastoral. Occasionally surplus of grain.
152,000 30,000
Zeraf Valley (Fangak)
Lak Nuer, Thiang Nuer, Gaweir Nuer, Ruweng Dinka, etc.
120,860 Flood Mixed pastoral economy or predominantly pastoral with seasonal movements.
132,000 31,000
Western Nuer (Bentiu)
Bul Nuer, Leik Nuer, Western Jikaing Nuer, Jagey Nuer, Dok Nuer, Nuong Nuer, Ruweng Dinka
193,935 Flood and Central Rainlands
Predominantly pastoral with seasonal movements. In Central Rainlands Region (Ruweng Dinka areas), mixed economy in permanent settlements.
257,000 111,000
Bor (Bor) Bor Gok Dinka, Bor Athoich Dinka, Monythany Dinka, Twi Dinka, Nyareweng and Ghol Dinka, etc.
148,155 Flood Predominantly pastoral; cultivations liable to extremes of flooding. Monythany Dinka - predominantly fishermen on small islands of Sudd area.
274,150 92,600
Pibor (Akobo)
Anuak, Murle 35,715 Flood Anuak - predominantly sedentary cultivators; Murle - predominantly pastoral.
100,000 50,000
Bahr el Ghazal Province 896,887 1,078,200 1,323,000
Lakes (Rumbek, Yirol)
Agar Dinka, Gok Dinka, Jur (Beilli), Aliab Dinka, Chich Dinka, Atwot Dinka
268,670 Flood and Ironstone Plateau
Dinka groups - mixed economy with emphasis on animal husbandry or predominantly pastoral. Jur - settled cultivators on the Ironstone Plateau.
280,000 480,000
Jur River (Tonj, Gogrial)
Rek Dinka, Luac Dinka, Bongo, Twu Dinka
325,140 Flood and Ironstone Plateau
Mixed economy with emphasis on animal husbandry. Permanent settlers mainly on the Ironstone Plateau.
540,000 648,000
Aweil (Aweil)
Malwal Dinka, Abiem Dinka, Palioping Dinka,
217,105 Flood and Ironstone Plateau
Mixed economy. People are more progressive cultivators than in most other areas.
251,000 190,000
20
Southern Development Investigation Team. Natural Resources and Development Potential in the Southern
Provinces of the Sudan. A Preliminary Report 1954. London: Sudan Government. p. 1.

2-4
District (HQ)
Ethnic Group Estimated Population
Ecological Region
(Figure 2-1)
Characteristics of Economy
Est. Animal Pop.
Cattle Sheep &
Goats
Baliet Dinka
Western (Wau, Raga)
Jur, Rek Dinka, Balanda Bor, Balanda Bviri, Golo, etc.
85,972 Ironstone Plateau
Occupied by a large number of small tribes of mixed origin, but all are settled cultivators.
7,200 5,000
Equatoria Province 647,801 239,800 680,000
Juba (Juba)
Bari, Mandari, Fajulu, Nyangwara, Lokoiya and Luluba
94,030 Central Hills, Ironstone Plateau, and Flood
Predominantly settled cultivators or mixed economy, with some sections owing fair numbers of cattle (Juba - Terakeka).
35,000 68,000
Torit (Torit-Katire)
Latuka-Lango, Madi, Acholi, Lokoro (Pari)
122,409 South-Eastern Hills and Mountains
Mixed economy with emphasis on crop production or predominantly settled cultivators (grain and cotton).
66,200 118,000
Eastern (Kapoeta)
Toposa, Didinga, Boya
89,726 South-Eastern Hills and Mountains
Toposa and Boya -Predominantly pastoral; Didinga - mixed economy.
131,000 319,000
Moru (Amadi)
Moru, Madi, Mundu, Avokoiya, Makaraka, Baka, Jur
64,555 Central Hills, Green Belt and Ironstone
Now predominantly settled cultivators with scarcely any cattle owing to tsetse fly.
1,600 --
Yei (Yei) Kakwa, Kaliko, Fajulu, Moru, Avokoiya, Baka, Makaraka, Kuku, Ngepo
107,862 Green Belt and Central Hills
Settled cultivators with some sheep and goats and a few cattle (mainly Kuku). Tribes mainly of the Bari group.
6,000 175,000
Zande (Yambio, Tembura, Ibba)
Zande 169,219 Green Belt Primarily cultivators with a few subsidiary activities (fishing, hunting, honey extraction).
-- --
Total 2,412,873 2,397,150 2,562,100
Note: Spellings of ethnic groups and places are as cited in the source and may be different from those common at present. Sources: Southern Development Investigation Team. 1955. Natural Resources and Development Potential in the Southern Provinces of the Sudan. A Preliminary Report 1954. London: Sudan Government. pp. 77-98.
The Sudanese government, while interfering in various ways in the affairs of the south, failed to take any major initiatives in the economic field. For the period of 1955-1972, there was hardly any significant economic development in the south. The overall economic situation in 1973 was more or less the same as that in 1954, i.e., “a predominantly agrarian economy based on subsistence-oriented production.”21 Even the limited development that had taken place before Sudan’s independence was mostly destroyed during the first civil war. The estimated GDP and output shares by region in 1956 show that the south was much weaker economically (Table 2-3). The GDP per capita of Southern Sudan was less than half of the average GDP per capita of other parts of Sudan. The southern provinces, which accounted for 27% of the total population, contributed only 13% of GDP of the whole Sudan, while generating 15% of the country’s agricultural output, 18% of industrial output and 8% of services. Agriculture was even a more important economic activity in the south, accounting for about 70% of the southern GDP, as compared to 60% for the whole Sudan. 21
World Bank. 1973. Sudan - Economic Development of Southern Sudan. Washington, DC: World Bank. p. 7.

2-5
Figure 2-1: Ecological regions of South Sudanas of 1954
Source: Southern Development Investigation Team. 1955. Natural Resources and Development Potential in the Southern Provinces of the Sudan. A Preliminary Report 1954. London: Sudan Government. Figure D.
Table 2-3: Estimated GDP per capita and output shares by region, 1956
Region Province Population share (%)
GDP per
capita (USD)
Share of total
GDP (%)
Share of agricultural output (%)
Share of industrial
output (%)
Share of services
(%)
Northeast Northern, Kassala, Khartoum
23 92 29 14 38 48
Blue Nile Blue Nile 20 118 29 37 23 20
Northwest Kordofan, Darfur
30 76 29 34 21 23
Total excluding southern provinces
73 93a 87 85 82 91
Southern provinces
Bahr el Ghazal, Equatoria, Upper Nile
27 39 13 15 18 9
Sudan Total 100 78b 100 60
c 5
d 35
e
Source: A. A. G. Ali, I. A. Elbadawi and A. El-Batahani. 2002. On the Causes, Consequences and Resolution of Civil War in Sudan. (As cited in World Bank. 2003. Sudan - Stabilization and Reconstruction: Country Economic Memorandum. Washington D.C.: World Bank. p. 5). a Average GDP for Sudan excluding southern provinces.
b GDP for Sudan.
c Share of agriculture in total GDP.
d Share of industry in total GDP.
e Share of services in total GDP.

2-6
(2) Peace period (1972-1983)
Following the Addis Ababa Accords signed in 1972, the Southern Regional Government was established in Juba and became responsible for undertaking and coordinating development efforts in Southern Sudan until the peace agreement was abrogated by Khartoum in June 1983. The period from 1972 to 1983 marked the only period where serious efforts to develop Southern Sudan were made before the Comprehensive Peace Agreement (CPA) was signed in 2005. In 1977, the Regional Government embarked on the implementation of the Six-Year Plan for Economic and Social Development of the South as an integral part of the national six-year plan. This was a period of positive economic growth in Sudan as a whole due to relative peace associated with large inflows of funds from the oil-exporting Arab countries,22 but the realised investment for the six-year plan was far below that planned (Table 2-4) and most of the planned projects did not materialise. The central government was reportedly more interested in the implementation of the Jonglei Canal and Bentiu oil projects.
Table 2-4: Planned and realised investment for the Six-Year Development Plan (1977/78-1982/83) in South Sudan (million Sudanese Pounds)
Year Original Revised Realised Original Revised (%)
1977/78 32.49 32.49 6.13 18.9 18.9 1978/79 39.45 22.50 7.82 19.8 34.8 1979/80 41.59 20.50 10.31 24.8 50.0 1980/81 38.14 20.50 12.80 33.6 62.0 1981/82 36.60 16.00 13.40 36.6 83.7 1982/83 43.04 16.00 8.13 18.9 50.6
Total 231.31 127.99 58.57 25.3 45.8 Source: B. Yongo-Bure. 1985. The First Decade of Development in the Southern Sudan.
Institute of African and Asian Studies, University of Khartoum. pp. 386-387. (As cited in Yongo-Bure, B. 2007. Economic Development of Southern Sudan. Lanham: University Press of America. p. 32.)
In addition to government projects, there were a number of development activities and projects supported by international organisations and foreign governments, such as Canada, Denmark, Germany, the United States, the then European Community, UN agencies, the World Bank, etc. Although substantial resources were obtained, they were earmarked for specific project and programmes, not necessarily priorities for the south nor complementary to those the Southern Regional Government. The lack of basic infrastructure and trained personnel also severely constrained development activities that took place during this period. Although the overall growth target of the six-year plan ranging from 4.5% to 7.0% was not achieved,23 there seems to have been some economic growth during the peace period. Estimates of southern macroeconomic variables, undertaken by the then Bank of Sudan, indicate that the GDP of Southern Sudan, at market prices, was about 20% of that of the whole Sudan (the average GDP was estimated at about 2,920 million Sudanese Pounds) for the period 1976-1980. 24 The southern share of total GDP can be compared with the southern share of Sudan’s total population (19.9%) in 1973 (Table 2-5). The 1973 census was reportedly conducted before the resettlement of the returnees of the civil war had been
22
World Bank. 2003. Sudan - Stabilization and Reconstruction: Country Economic Memorandum. Washington,
DC: World Bank. p. 14. 23
Yongo-Bure, B. 2007. Economic Development of Southern Sudan. Lanham: University Press of America. p.
32. 24
Bank of Sudan. Annual Report 1981. Khartoum: Bank of Sudan. p. 7. (As cited in Yongo-Bure, B. 2007.
Economic Development of Southern Sudan. Lanham: University Press of America. pp. 9-10.)

2-7
completed25 and, therefore, the southern population in the latter half of the 1970s might be significantly bigger than 2.95 million. Primary sector activities accounted for 48.8% of southern GDP (crop production 17.7%, animal husbandry 15.5%, forestry 10.6%, fishing 3.5%, and hunting 1.5%), while industrial activities and tertiary activities accounted for 12.7% and 38.5%, respectively. The increased share of tertiary activities (including trade and transport) as compared to that of 1956 is presumably due to the population growth and larger demand for trade and services during this period.
Table 2-5: Population (census of 1955/56, 1973, 1983 and 2008)
Province 1955/5
6 1973 Province 1983
State 2008
Upper Nile 889 761 Upper Nile 674
Upper Nile 964 Unity 586
Jonglei 797 Jonglei 1,35
9
Bahr el Ghazal 991 1,32
2 Bahr el Ghazal
1,493
Northern Bahr el Ghazal
721
Western Bahr el Ghazal
333
Warrap 973 Lakes 773 Lakes 696
Equatoria 904 722
Western Equatoria
359 Western Equatoria 619
Eastern Equatoria
1,047
Central Equatoria 1,10
4 Eastern Equatoria 906
Total (1,000) 2,783
2,805
5,223
8,260
SSCCSE 2010 (million)* 2.76 2.95
5.54
8.26
Sudan Total (million) 10.3 14.8 19.1 39.2 Southern Sudan (%) 27.0 19.9 28.9 21.1 Sources (Second-hand citations): 1955/56: Government of the Republic of the Sudan. Department of Statistics. 1961. First Population Census of Sudan 1955/1956 Final Report. Khartoum: Central Bureau of Statistics. 1973: Government of the Republic of the Sudan. Department of Statistics. 1977. Second Population Census of Sudan 1973 Final Report. Khartoum: CBS (CBS. 2009. Statistical Year Book for the Year 2009. Khartoum: CBS) 1983: Government of the Republic of the Sudan, Ministry of Finance and Economic Planning, Population Census Office, Department of Statistics. 1989. Population and Housing Census of the Sudan, 1983. Khartoum: CBS (Operation Lifeline Sudan. 1996. OLS Southern Sector Needs Assessment. Nairobi: OLS). 2008 (South): Southern Sudan Centre for Census, Statistics and Evaluation. 2010. Southern Sudan Counts: Tables from the 5th Sudan Population and Housing Census, 2008. Juba: GOSS/SSCCSE. 2008 (Sudan Total): Sudan Central Bureau of Statistics. Fifth Population and Housing Census 2008 Priority Results Sudan Total for 1955/56-1983: Ahmed, A. H. Ali. 2008. The Fifth population census in Sudan: A census with a full coverage and a high accuracy. UN Statistics Division Note (*): Since several adjustments were made after each census was taken, these (final) numbers for South Sudan were taken from SSCCSE 2010, Southern Sudan Counts: Tables from the 5th Sudan Population and Housing Census. p. 2.
(3) Second civil war period (1983-2005)
Upon the abrogation of the Addis Ababa Accords in 1983, civil war resumed and intensified, and the southern economy fell into decline once again. 26 For the following 22 years, southern economic growth was probably amongst the lowest of Sudan's states. In 1999 oil exports started and significantly boosted the Sudanese economy,27 but the wealth was not adequately shared with the south. The situation was worsened by the lack of transport and
25
Yongo-Bure, B. 2007. Economic Development of Southern Sudan. Lanham: University Press of America. p. 8. 26
World Bank. 2003. Sudan - Stabilization and Reconstruction: Country Economic Memorandum. Washington,
DC: WB. pp. 14-16. 27
Oil exports rose from zero in 1998 to USD3,948 million in 2005, accounting for 82% of total exports. (Central
Bank of Sudan. 2007. Annual Report No. 47. Khartoum: Central Bank of Sudan.)

2-8
communications. However, trade and economic activity slowly recovered, especially in areas free from major fighting for some time. Economic growth was therefore unequally distributed in favour of the stable zones in Eastern and Western Equatoria, Lakes, and Bahr el Ghazal. Economic growth had benefited some people more than others, notably those engaged in trading larger quantities of goods and who had access to means of transportation. The impact of the civil war is reflected in the crop acreage statistics (Figure 2-2). Although the reliability of data collected during the war period may be questioned, the graph illustrates the tendency that crop production reduced drastically when the civil war intensified, particularly from the mid-1980s to the mid-1990s. It is also shown that sorghum acreage in the government-controlled Renk (mechanised rain-fed) area did not decline as much as in traditional rain-fed areas in the south. Household food security traditionally depends on a complex system of food production, livestock, seasonal migration, trade, fishing and the collection of wild fruits, but it was severely disrupted by the war.28 In 1988-89 and 1998-99, famine caused by the war killed an estimated 250,000 and 50,000-100,000 respectively.29
Figure 2-2: Major crops area harvested in Southern Sudan in 1960/61-2004/05 (1,000 feddans)
Data sources: 1960/61-1968/69 - Ministry of Agriculture. Bulletin of Agricultural Statistics of the Sudan 1968/69. Khartoum: Ministry of Agriculture (as cited in World Bank. 1973. Sudan - Economic Development of Southern Sudan. Washington, DC: World Bank. p. 13) 1970/71-2004/05 - Ministry of Agriculture and Forests. 2007. Time Series of Area, Production & Yield Data of the Main Food & Oil Crops by States & Mode of Irrigation (70/1971-04/2005) Volume 2. Khartoum: Ministry of Agriculture and Forests. Note: 1 feddan = 0.42 hectares = 1.038 acres
Despite the prolonged war, the SPLM started socio-economic development, especially after the National Convention of New Sudan in 1994. The convention established three branches of government (legislative, executive and judiciary) and a five-tier decentralised system (central, regional, county, payam and boma), and in 1996 created the Civil Authority of New Sudan (CANS) separate from the SPLA. Many areas under the control of the SPLM/SPLA, e.g., Western Equatoria, Lakes and the southern parts of Central Equatoria, Jonglei and
28
FAO/WFP. 2004. Crop and Food Security Assessment Mission to Sudan. 11 February. Rome: FAO/WFP. p.
29. 29
Natsios, A. S. 2012. Sudan, South Sudan, and Darfur. Kindle Edition. New York: Oxford University Press.
0
200
400
600
800
1,000
1,200
1,400
1,600
1960
/61
1962
/63
1964
/65
1966
/67
1968
/69
1970
/71
1972
/73
1974
/75
1976
/77
1978
/79
1980
/81
1982
/83
1984
/85
1986
/87
1988
/89
1990
/91
1992
/93
1994
/95
1996
/97
1998
/99
2000
/01
2002
/03
Cotton
Sorghum: South total
Sorghum: Rainfed
Sorghum: Renk
Millet/Finger millet
Maize
Sesame
Groundnuts

2-9
Warrap, reached almost a post-war stage of development by 2005.30 Some international organisations, particularly USAID, initiated development activities from the mid-1990s in the south. Among those, the most notable is the USAID Southern Sudan Agriculture Revitalization Project that aimed at increasing the capacity for agricultural production and marketing by spending $22.5 million for a five-year period from 2002 to 2007.31
2.1.3 After the Comprehensive Peace Agreement
The Comprehensive Peace Agreement (CPA), signed in January 2005, ended the long civil war and established an autonomous government for Sothern Sudan. In a short period after the signing of CPA, the south made substantial progress.32 A large number of returnees resettled and the former militia were largely integrated into the SPLA. A central government with ten state governments and counties was formed. To overcome the lack of physical and institutional infrastructure rapidly, a significant number of roads and other structures were constructed and/or rehabilitated, and education and health facilities were established across Southern Sudan. Essential institutions were established such as commercial banks, court assemblies and civil society groups. Macroeconomic indicators show the growth achieved during the period 2008-2011 (Table 2-6). Accounting for around 60% of GDP, oil revenues mainly brought about the growth in GDP, which, therefore, slowed down when oil GDP declined. Meanwhile, the spending of the Government of Southern Sudan (GOSS) substantially increased, which, together with greater demand for imported food and other goods due to a massive influx of returnees (over 1.8 million in 2004-200833), led to high inflation, particularly food price inflation (Figure 2-3). This situation would worsen in the post-independence period, when oil production was closed down in January 2012 and the South Sudanese Pound (SSP) continued to depreciate in the parallel market.
Table 2-6: South Sudan’s GDP by expenditure method in 2008-2011
2008 2009 2010 2011
GDP (current - SSP million) 31,923 27,379 34,507 54,249 Oil GDP 19,550 14,792 20,000 32,666 Non-oil GDP 12,373 12,587 14,506 21,582
GDP (constant 2009 price - SSP million) 26,247 27,379 28,533 29,084 Oil GDP 13,313 14,792 14,475 14,325 Non-oil GDP 12,934 12,587 14,059 14,759
Real GDP growth (annual %)
4.3 4.2 1.9
Oil GDP
11.1 -2.1 -1.0
Non-oil GDP
-2.7 11.7 5.0
Share of GDP (%) 100.0 100.0 100.0 100.0 Oil GDP 61.2 54.0 58.0 60.2 Non-oil GDP 38.8 46.0 42.0 39.8
Nominal GDP per capita (current USD) 1,700.4 1,246.7 1,504.9 1,858.8 Nominal GNI per capita (current USD) 1,044.6 923.2 967.4 1,513.4
Inflation, consumer prices (annual %, end of year) 12.8 2.2 12.8 65.6 Inflation, consumer prices (annual %, period average) .. 5.0 1.2 47.3
Official exchange rate: LC/USD (period average) 2.09 2.31 2.30 2.83 Parallel exchange rate: LC/USD (period average) .. .. .. 3.78 Sources:
30
Yongo-Bure, B. 2007. Economic Development of Southern Sudan. Lanham: University Press of America. p.
197-199. 31
Reliefweb. http://reliefweb.int/report/sudan/usaid-southern-sudan-agriculture-revitalization-project 32
World Bank. 2009. Sudan - The Road toward Sustainable and Broad-based Growth. Washington D.C.: World
Bank. p. 121. 33
SSCCSE. 2011. Statistical Yearbook for Southern Sudan 2010. Juba: SSCCSE. p. 103.

2-10
GDP at SSP - NBS. 2012. Release of new South Sudan Gross Domestic Product (GDP) estimates for 2011, and revised figures for 2008-2010. Press release 02 October 2012. Juba: NBS Other data - IDA and IFC. 2013. Interim Strategy Note (FY2013-2014) for the Republic of South Sudan
Washington D.C.: World Bank. p. 8. Note: Local Currency refers to Sudanese Pounds until July 2011 and to South Sudanese Pounds (SSP) from that date.
Agricultural development was widely recognised as a key to attaining food security, poverty alleviation and economic growth as expressed in the SPLM’s vision for the post-war era published in 200434. In October 2005, GOSS quickly established the Ministry of Agriculture and Forestry (MAF) and the Ministry of Animal Resources and Fisheries (MARF) as the successor to the SPLM’s Secretariat of Agriculture and Animal Resources.35 To promote agricultural development, MAF prepared the Food and Agriculture Policy Framework 2007-2011 and Strategic Plan 2007-2011; and MARF the Animal Resources Sector Policy and Strategic Plan 2006-2011 and Fisheries Sector Policy and Strategic Plan 2006-2011.
Figure 2-3: CPI Annual changes (%)
Sources: NBS. http://ssnbs.org/storage/CPI website May 2013.xlsm
After the CPA, Southern Sudan became a major recipient of development assistance. Total committed official development assistance (ODA) to Southern Sudan in 2010 was approximately USD1,152 million.36 During the period 2005-2010, ODA averaged 30-40% of the approved government budget. The share of the natural resources sector (including agriculture, forestry, animal resources and fisheries) in total assistance gradually declined from more than 30% in 2007 to around 5% in 2011, while support to social and humanitarian needs steadily rose towards independence. Rather than using it to build government capacity, development partners (DPs) provided their assistance mainly by employing NGOs and project implementation units to deliver services directly to beneficiary communities.37
2.1.4 Independence of South Sudan
South Sudan became independent in July 2011 as determined by the referendum in January 2011. Independence was followed by the events that have seriously affected South Sudan’s economy, namely, the closure of the border with Sudan in July 2011, an increased influx of returnees, the shutdown of oil production in January 2012, the execution of an austerity budget from February 2012, a decline in food production in 2011 and accelerated inflation.
34
SPLM Economic Commission. 2004. Strategic Framework for War-to-Peace Transition. New Site: SPLM. 35
World Bank. 2007. Final Proposal for a Multi Donor-Trust Fund Grant to the Government of Southern Sudan
for the Support to Agriculture and Forestry Development Project (SAFDP). Washington D.C.: World Bank. p. 30. 36
This amount includes reported humanitarian funds. (OECD. 2011. 2011 Report on International Engagement
in Fragile States: Republic of South Sudan. Paris: OECD Publishing. pp. 20-21.) 37
International Development Association and International Finance Corporation. 2013. Interim Strategy Note
(FY2013-2014) for the Republic of South Sudan. Washington D.C.: World Bank. p. 12.
-20.0
0.0
20.0
40.0
60.0
80.0
100.0
Jan
2010
Mar
2010
May
2010
July
2010
Sep
2010
Nov
2010
Jan
2011
Mar
2011
May
2011
July
2011
Sep
2011
Nov
2011
Jan
2012
Mar
2012
May
2012
July
2012
Sep
2012
Nov
2012
Jan
2013
Mar
2013
May
2013
All item index Food and non-alcholic beverages

2-11
The oil shutdown has had an unfavourable influence on the development activities planned for the post-independence period (e.g., those of the South Sudan Development Plan 2011-2013) since the country is highly dependent on oil revenues, which previously accounted for 98% of its public expenditure and 99% of foreign currency export earnings.38 Thus, there is growing concern over possible consequences for the economy, poverty and food security. As imports of food and other essential goods from Uganda and Kenya rapidly increased, the depreciation of the SSP has led to higher inflation, immediately after independence and again after the shutdown of oil production (Figure 2-3). Other key drivers of inflation are deemed to be: on the supply side, trade restrictions on the northern border, import bottlenecks on the southern border, poor road infrastructure and security challenges within the country and the decline in food production; and, on the demand side, a larger number of returnees and increased government spending.39 The high inflation appears to have hit most severely the poor through reduced purchasing power and the northern states where price increases have been generally larger than in the southern states due to their distance and inaccessibility from the south. Even in rural areas, many households do not produce enough and rely on imported food and, therefore, have been affected by inflation. Following the oil shutdown, the national government has adopted an austerity budget, reducing government consumption, transfers to the states and the development budget, while maintaining salaries for staff.40 South Sudan did not inherit any of the official external debt of Sudan, but the government has started borrowing funds from external sources to pay salaries and operating expenditures. Even if oil exports are resumed, the oil-based economy will continue to be vulnerable to changes in international oil prices and oil production levels. The oil sector generates little employment and does not significantly contribute to broad-based development. Furthermore, oil production has peaked and is projected to decline sharply over the next ten years.41
In pursuit of non-oil economic growth, the government has placed increasingly greater emphasis on agricultural development as the main key to food security, poverty reduction and economic growth in the country as discussed in Section 2.3.
2.2 South Sudan’s economy in a regional context
To formulate a realistic strategy for South Sudan’s agricultural development, it is essential to take into account the situation of the international and regional markets, particularly that of neighbouring countries such as Uganda and Kenya. South Sudan’s agricultural potential can be realised only through enhancing its competitiveness to the levels of those countries from which South Sudan is currently importing food and other agricultural products that can be grown domestically. This section compares the socioeconomic situation of South Sudan, as one of the factors affecting its competitiveness, with that of other countries in the region and reviews South Sudan’s economic relations with them, focusing on trade of goods and services. Product-specific competitiveness analyses vis-à-vis major exporting countries to South Sudan can be found elsewhere in this report.
2.2.1 Comparison of socioeconomic situation with neighbouring countries
The comparison of major socioeconomic indicators with its East African neighbours reveals that South Sudan has a relatively modest size of GDP and much higher GDP per capita because of oil incomes but a significantly lower level of human development as a legacy of the protracted conflict (Table 2-7 and Figure 2-4). It is also known that the country’s physical and institutional development is far behind its neighbours.
38
GRSS. 2012. 2011/2012 Budget Speech to the National Legislative Assembly by Hon. Kosti Manibe Ngai,
Minister of Finance and Economic Planning. p. 1. 39
World Bank. 2012. Inflation in South Sudan. South Sudan Economic Brief Issue No. 1. Washington D.C.: WB. 40
MoFEP Office of the Minister. 2012. Guidelines for compiling budgets for 2012/13. Juba: GRSS. 41
GRSS. 2011. South Sudan Development Plan 2011-2013. Juba: GRSS. pp. 24-25.

2-12
Table 2-7: Major socioeconomic indicators of South Sudan and its neighbours (2011)
Indicator Burundi
Ethiopia
Kenya
Rwanda
Tanzania
Uganda
South Sudan
Sources for SS
Land area (km2)
25,680
1,000,000
569,140
24,670
885,800
199,810
658,842
NBS1
Arable land (% of land area)* 35.8 14.6 9.7 49.5 13.1 33.8 4.2 NBS1
Population, total (million) 9.5 89.4 42.0 11.1 46.4 35.1 10.4
Population growth (annual %) 3.3 2.6 2.7 2.8 3.0 3.4 4.3
Rural population (% of total population) 89 83 76 81 73 84 82
Poverty headcount ratio at national poverty line (% of population)
674)
30 465)
45 333)
252)
51 NBS2
School enrolment, primary (% gross) 165 106 1132)
142 1021)
113 691)
MoE
Male 164 111 1152)
140 1011)
112 811)
MoE Female 165 101 112
2) 143 103
1) 114 55
1) MoE
Literacy rate (% of ages 15 and above) 671)
393)
871)
711)
731)
731)
272)
NBS2 Male 73
1) 49
3) 91
1) 75
1) 79
1) 83
1) 40
2) NBS2
Female 621)
293)
841)
681)
671)
651)
162)
NBS2 Mortality rate, under-5 (per 1,000 live births)
139 77 73 54 68 90 1051)
NBS1
Maternal mortality ratio (national estimate, per 100,000 live births)
5001)
680 4882)
4801)
4501)
440 2,0544)
MoH
Improved water source (% of pop. w/ access)
721)
441)
591)
651)
531)
721)
691)
NBS1
GDP (current USD million) 2,35
6 31,70
9 33,6
21 6,35
4 23,8
74 16,8
22 19,173
GDP per capita (current USD) 247 355 800 570 530 479 1,847
GDP growth (annual %) 4.2 7.3 4.4 8.2 6.4 6.6 1.9
GDP per capita growth (annual %) 0.8 4.5 1.6 5.3 3.3 3.1 -2.4
Agriculture, value added (% of GDP) 34.7 46.4 28.5 32.1 27.7 23.4 15.0
1) WB
Agriculture, value added (annual % growth)
4.4 5.2 1.6 4.7 3.4 2.7 -48.0
Data sources: World Bank. World Development Indicators. http://databank.worldbank.org/ (accessed 10 July 2013) For South Sudan, data sources indicated in the table are as follows. Other data are from the World Development Indicators. NBS1 = National Bureau of Statistics. 2012. South Sudan Statistical Year Book 2011. Juba: NBS. NBS2 = National Bureau of Statistics. 2012. National Baseline Household Survey 2009. Juba: NBS. MoE = Ministry of Education. 2010. Education Management Information System (EMIS) Report. Juba: GOSS. MoH = Ministry of Health and SSCCSE. 2007. Sudan Household Health Survey. Juba: GOSS. WB = IDA and IFC. 2013. Interim Strategy Note (FY2013-2014) for the Republic of South Sudan Washington D.C.: World Bank. Notes: Data for years other than 2011 are indicated as 1) 2010, 2) 2009, 3) 2007, 4) 2006 and 5) 2005. *: Defined by FAO as land under temporary crops (double-cropped areas are counted once), temporary meadows for mowing or for pasture, land under market or kitchen gardens, and land temporarily fallow. South Sudan’s data is for “agriculture.”
Figure 2-4: GDP and GDP per capita of South Sudan and its neighbours in 2011
Data sources: World Bank. World Development Indicators http://databank.worldbank.org/ (accessed 10 July 2013)

2-13
Figure 2-5: GDP of South Sudan’s neighbours in 2001-2012 (constant 2005 USD billion)
Data sources: World Bank. World Development Indicators. http://databank.worldbank.org/ (accessed 10 July 2013)
Note: GDP at constant 2005 USD for South Sudan are not available in the World Bank database. For example, South Sudan’s adult literacy rate (27%), critical to agricultural transformation, is the lowest in the region and the maternal mortality rate (2,054 per 100,000 live births), according to the 2006 survey, is one of the highest in the world. Gender inequality is more evident as implied by large differences in literacy and school enrolment rates. Education and health related indicators are not only lower than those of the neighbours but also have remained constant or deteriorated after notable improvement in the post-CPA period.42 While South Sudan has been heavily dependent on oil revenues and its agriculture remains at bare subsistence level, its neighbours have achieved relatively steady growth in the last decade even though they were also adversely affected by the global food price crisis and the global financial crisis during this period (Figure 2-5). However, South Sudan is still endowed with oil resources that can be used to develop an institutional and infrastructure base and is expected to contribute to the regional economy through expansion of trade and investment.
2.2.2 Economic relations with neighbouring countries
Trade statistics for South Sudan are not available, but according to the Ministry of Finance and Economic Planning (MoFEP), the country’s self-sufficiency rate in agricultural products is low and imports of these products accounted for around 12% of GDP in 2010.43 Even before the civil war, the region was a net importer of food and other essential items while exporting various agricultural products to the north and its neighbours. The policy during the late colonial period was to promote agricultural production and processing for import substitution, as exemplified by the Zande Scheme.44 During the civil war, both agricultural and industrial goods were supplied mainly from the northern region through northern Sudanese traders and partially across the southern borders. A major change after CPA was a substantial increase in imports from the East African neighbours, particularly Uganda. Total imports (including informal) from Uganda dramatically increased from USD41 million in 2005 to USD641 million in 2009 (Figure 2-6). The increase
42
World Bank. 2013. Public Expenditures In South Sudan: Are They Delivering? South Sudan Economic Brief
Issue No. 2, Washington D.C.: World Bank. pp. 10-15. 43
Government of the Republic of South Sudan. 2012. Approved Budget 2012/13. Juba: GRSS. p. 12. 44
World Bank. 1973. Sudan - Economic Development of Southern Sudan. Washington, DC: World Bank. p. 18.
For the Zande Scheme, see Section 2.1.1 above.

2-14
was driven by the consumption and the construction booms during this period.45 The exports to Southern Sudan accounted for more than a quarter of Uganda’s total exports in 2009. After imports slowed in 2010 due to Southern Sudan’s decreased foreign exchange earnings from oil exports, imports started increasing again during 2011, presumably affected by the closure of the northern border with Sudan after independence. Imports from Kenya also increased after CPA, but not to the extent observed in imports from Uganda (Figure 2-6) and South Sudan’s share of Kenya’s total exports is not so significant, ranging from 3% to 4%.46
Figure 2-6: Imports from and exports to Uganda and Kenya (USD million)
Data sources: Imports from Uganda - Bank of Uganda (BOU). http://www.bou.or.ug/ Exports to Uganda - Uganda Bureau of Statistics (USOB). 2010, 2011 and 2012. Statistical Abstract 2010, 2011 and 2012. http://www.ubos.org/ (both accessed 7 July 2013).
Trade with Kenya - COMESA COMSTAT Data Portal. http://comstat.comesa.int/ (accessed 8 July 2013). Notes: The trade data of BOU and UBOS classify the destination/origin as “Sudan”, but the exports were directed mainly to Southern/South Sudan (Bank of Uganda and Uganda Bureau of Statistics. 2012. The Informal Cross Border Trade Survey Report 2011. Kampala: BOU/UBOS.). The Kenyan trade is also with Sudan except 2012 for
which separate date are available for South Sudan whose imports from and exports to Kenya were USD213.5 million and USD178.7 million, respectively.
Imports from Uganda are mainly food (e.g., sugar, beer, water, cooking oils, maize grains, maize/wheat flour, etc.), vehicles and construction materials (e.g., cement, iron sheets) (Figure 2-7). South Sudan used to export a range of products such as hides and skin, honey, groundnuts, sesame, beans, gum acacia and forestry products, but after independence there are virtually no exports to Uganda.47 The major informal imports from Uganda are similar to formal exports.48 It is reported that imports of food items from Uganda has reduced since 2011 because South Sudan is realising its agricultural potential,49 but the Bank of Uganda
has attributed the decline in late 2012 to a shortage of foreign currency in South Sudan.50 Imports from Kenya consist of a wider range of good, including vegetable oils, beverages, cements, vehicles, machinery and equipment, pharmaceutical products, etc. (Figure 2-7).
45
Yoshino Y., G. Ngungi, and E. Asebe. 2012. Enhancing the Recent Growth of Cross-border Trade between
South Sudan and Uganda. In Brenton, P. and G. Isik eds. De-fragmenting Africa: Deepening regional trade integration in goods and services. Washington D.C.: World Bank. p. 43. 46
COMESA COMSTAT Data Portal http://comstat.comesa.int/ 47
Information obtained from the Nimule Customs Office by the CAMP Task Team on 8 March 2013. 48
Bank of Uganda (BOU) and Uganda Bureau of Statistics (UBOS). 2012. The Informal Cross Border Trade
Survey Report 2011. Kampala: BOU/UBOS, Appendix IV. 49
World Bank. 2013. Uganda Economic Update: Bridges across Borders Unleashing Uganda’s Regional Trade
Potential. Washington, D.C.: World Bank. p. 42. 50
Mugume, A. Executive Director of Research, Bank of Uganda. (As cited in M. L. Oketch. 2013. Uganda’s exports to South Sudan decline by 80 per cent. Daily Monitor. 7 January 2013 http://www.monitor.co.ug))
0
50
100
150
200
250
300
350
2004 2005 2006 2007 2008 2009 2010 2011 2012
Imports Exports
2012: Sum of South Sudan and
0
100
200
300
400
500
600
700
2004 2005 2006 2007 2008 2009 2010 2011 2012
Formal imports Informal imports Total exports
Uganda Kenya
2012: Sum of South Sudan and Sudan

2-15
South Sudan has also been providing new business opportunities for the regional economy in the service sector, such as banking, hotels and restaurants, transport and communications, engineering and construction, and education. 51 For example, Kenyan-based banks, already leading regional integration in the banking sector, have established subsidiaries in South Sudan. Kenya Commercial Bank (KCB) and Equity Bank are the two largest commercial banks and had started operating in South Sudan before independence. Commercial Bank of Ethiopia has also been operating since 2009 in Juba. The planned but as yet funded construction of a railway line to join the East African railway system and construction of a pipeline to Lamu for oil exports from South Sudan are expected to boost the regional economy and benefit the country.
Figure 2-7: Imports from Uganda and Kenya by commodity
Uganda (2011: Total USD316.8 million) Kenya (2012: Total USD213.5 million)
Data sources: COMESA COMSTAT Data Portal. http://comstat.comesa.int/ (accessed 9 July 2013) Notes: 1) The 2-digit number of each commodity is a HS2007 code.
2) Uganda’s exports include those to Sudan (though mostly to South Sudan), while Kenya’s are only to South Sudan.
2.2.3 Participation in regional economic integration
Regional organisations promoting economic cooperation and integration among African countries and with partners from outside the continent have been facilitating South Sudan in establishing physical and institutional grounds for international trade and investment. Table 2-8 lists the most relevant to South Sudan among such organisations. South Sudan’s potential membership in the East African Community (EAC) and the Common Market for Eastern and Southern Africa (COMESA) is generally considered to be beneficial for the country’s economic development because it will enable access to these free trade areas (Table 2-9). Prior to independence, GOSS expressed its intention to seek membership of EAC, and in November 2011 GRSS applied to join the community. In November 2012, however, the summit of EAC Heads of State directed its Council of Ministers to “commence negotiations with South Sudan”, deferring South Sudan’s membership. 52 The reason for the decision is not clearly stated in the summit’s communiqué, but further institutional strengthening seems to be required to meet EAC’s admission criteria. South Sudan has also been invited to the COMESA summits since 2011. On the other hand, there is concern in
51
Kenyan Export Promotion Corporation. 2012. Market Survey Report for South Sudan (Presentation slides).
http://epckenya.org/images/stories/Reports/south sudan survey presentation.pdf) 52
EAC Secretariat. 2012. Communiqué of the 14th Ordinary Summit of EAC Heads of State. Arusha: EAC. p. 3.
09 Coffee, tea,
and spices
19%
17 Sugars and
sugar
confectionery
16%
87 Vehicles,
parts and
accessories
9%
15 Animal or
vegetable fats
and oils
8%
22 Beverages
and spirits
7%
25 Salt, lime
and cement
7%
72 Iron and
steel
7%
73 Articles of
iron or steel
4%
84 Machinery
& mechanical
appliances
3%
24 Tobacco
and substitutes
3%
19
Preparations of
vegetables,
fruit, etc.
2%
10 Cereals
2%
34 Soap,
washing
preparations,
etc.
2%
Others
11% 15 Animal or
vegetable fats
and oils
15% 25 Salt, lime and
cement
8%
22 Beverages
and spirits
8%
24 Tobacco and
substitutes
6%
84 Machinery &
mechanical
appliances
5% 63 Textile and
clothing
5%
85 Electrical
machinery &
equipment
5%
30
Pharmaceutical
products
5%
72 Iron and steel
4%
87 Vehicles, parts
and accessories
4%
73 Articles of iron
or steel
4%
94 Furniture
3%
39 Plastics, etc.
3%
49 Printed
products
3%
20 Preparations
of vegetables,
fruit, nuts, etc.
3%
Others
19%

2-16
South Sudan that the country has not been sufficiently developed to compete with other member states of these free trade areas.53
Table 2-8: Organisations promoting regional economic cooperation and integration relevant to South Sudan
Organisation Acronym Established1)
Number of
member states South Sudan’s membership
African Union AU 2002 502)
Joined in 2011
African Economic Community
AEC 1991 (by the then Organization of African Unity)
(AU members) --
Intergovernmental Authority on Development
IGAD 1996 8 Joined in 2011
Common Market for Eastern and Southern Africa
COMESA 1994 19 --
East African Community EAC 2000 5 Applied in 2011 Sources: AU http://www.au.int; IGAD http://www.igad.org: COMESA http://www.comesa.int: EAC http://www.eac.int/ Notes:1) The year of establishment of current form. Most of these organisations evolved from their predecessors.
2) Four countries have been suspended as of July 2013.
Table 2-9: Profiles of East African Community (EAC) and Common Market for Eastern and Southern Africa (COMESA) (2011)
Regional bloc
Area (1,000 km²)
Population (million)
GDP (current USD) Member states
(million) (per
capita)
EAC 1,817.7 135.4 84,699 732.3 Burundi, Kenya, Rwanda, Tanzania, Uganda
COMESA 11,603.0 443.9 518,793 1,168.9
Burundi, Comoros, D.R. Congo, Djibouti, Egypt, Eritrea, Ethiopia, Kenya, Libya, Madagascar, Malawi, Mauritius, Rwanda, Seychelles, Sudan, Swaziland, Uganda, Zambia, Zimbabwe
Source: EAC Secretariat. 2012. East African Community Facts and Figures - 2012. Arusha: EAC; and COMESA. COMESA at glance. http://comstat.comesa.int/Documents/COMESA at a glance.pdf
2.3 Importance of agriculture in the national economy
Although official estimates of GDP by production (sector) and recent employment data are not yet available, the importance of agriculture in the national economy is widely recognised by the government and the international community. Some available estimates indicate the importance of agriculture quantitatively (Table 2-10). For example, the 2008 Population Census indicates that 63% of those aged 15 and above, who are working or who worked previously, were employed in agriculture, animal husbandry, forestry, fisheries and mining, though employment patterns are likely to have changed since 2008 due to the large influx of returnees.54 A strategy note recently published by the World Bank proclaims, “subsistence agriculture and pastoralism, which account for less than 15% of GDP but engage about 78% of the population”.55 In view of the projected decrease in oil
53
Amos, Michael. 2011. South Sudan delays membership in regional bloc. Daily Nation. 17 September 2011.
http://www.nation.co.ke) 54
GRSS. 2012. Approved Budget 2012/13. Juba: GRSS. p. 4 55
IDA and IFC2013. Interim Strategy Note (FY2013-2014) for the Republic of South Sudan. Washington D.C.:
World Bank. p. 6. The sources of these numbers are not shown in the document.

2-17
production, future economic growth in South Sudan is expected to be mainly dependent on the agriculture sector.
Table 2-10: Shares of agriculture in the national economy
Indicator Estimate Date Source
GDP 15% of GDP 2010 World Bank
Employment 63% of working population (aged 15 and above) 2008 SSCCSE
78% of total population Unknown World Bank
Trade Imports: 12% of GDP Exports: Less than 1% of GDP Trade deficit: 11-12% of GDP (SSP3.5 billion)
2010 MoFEP
Rural population 83% of total population 2008 SSCCSE Households
Engaged in cultivation 81% of total households; 89% of rural households 2008 SSCCSE Engaged in fisheries 22% of total households; 24% of rural households ditto. ditto. Owing livestock 74% of total households; 80% of rural households ditto. ditto.
Main source of livelihood
Crop farming 69% of total population; 78% of rural population 2009 NBS Animal husbandry 7% of total population; 8% of rural population 2009 NBS
Sources: World Bank - IDA and IFC, 2013. Interim Strategy Note (FY2013-2014) for the Republic of South Sudan.
Washington D.C.: World Bank. p. 6 and p. 36. SSCCSE - Southern Sudan Centre for Census, Statistics and Evaluation. 2010. Southern Sudan Counts: Tables from the 5th Sudan Population and Housing Census, 2008. Juba: GOSS/SSCCSE. pp. 85-86 and p. 109. MoFEP - Government of the Republic of South Sudan. 2012. Approved Budget 2012/13. Juba: GRSS. p. 12. NBS - National Bureau of Statistics. 2012. National Baseline Household Survey 2009. Juba: NBS. pp. 32-33.
Furthermore, the food balance estimated annually by the FAO/WFP Crop and Food Security Assessment Mission (CFSAM) suggests the importance of agriculture to South Sudan in terms of food production and foreign exchange earnings (Table 2-11). Although cereal production increased to 761,000 tons in 2012 from 563,000 tons in 2011 due to favourable rains and no outbreaks of pests and diseases, the overall cereal deficit is estimated to be nearly 371,000 tons and about 4.1 million people, nearly 40% of the total population, to be facing food insecurity in 2013. 56 The large food deficits in recent years are caused by a combination of factors such as the continued influx of returnees and associated urbanisation, natural population growth and unstable production affected by natural disasters. The shortfall has been supplemented with food imports and food aid. Following the oil shutdown, the President, Parliament and the government began to address agriculture, food production in particular, as a top priority for the country. For example, the MoFEP has highlighted the potential for increased agricultural production in the budget book for 2012-13 and declared that the government would seek financing of SSP 5 billion to promote agriculture over a five-year period from September 2012.57 In his opening address at the Second Governors’ Forum in November 2012, the President announced the following two key objectives in the War on Poverty.58
1) South Sudan will achieve food security by 2014. 2) South Sudan will produce for export as a regional breadbasket by 2020.
56
FAO/WFP. 2013. Crop and Food Security Assessment Mission to South Sudan Special Report. 22 February.
Rome: FAO/WFP. p. 5. 57
GRSS. 2012. Approved Budget 2012/13. Juba: GRSS. p. 12. 58
GRSS. 2012. Final Resolutions of the Second Governors’ Forum 26-29 November 2012, Freedom Hall, Juba.
Juba: GRSS.

2-18
In response to the President’s call, the Second Governors’ Forum adopted a resolution, “Immediately produce a highly prioritised Rapid Action Plan for Food Security by the end of 2014, ready for implementation in the financial year 2013/14 to serve as an interim ‘good enough’ measure to guide actors until the Comprehensive Agricultural [Development] Master Plan is ready in 2014, and to work on rapidly implementing the relevant resolutions of the Second Governors’ Forum”.59 In early 2013, MAFCRD has launched the National Effort for Agricultural Transformation (NEAT) and, as a component of NEAT, started the Zonal Effort for Agricultural Transformation (ZEAT) which will serve as a prioritised rapid plan to meet the national food security goal by 2014 while awaiting the longer term CAMP to be completed.60
Table 2-11: Estimated cereal area harvested, production, consumption and balance in Southern/South Sudan in 2009-2012
Year Area
harvested Net
production
Mid-year population in the
following year
Requirement in the following
year
Surplus/deficit in the following
year
(1,000 ha) (1,000 tons) (1,000 persons) (1,000 tons) (1,000 tons)
2009 851.6 541.0 8,973.6 951.0 - 410.0
2010 920.8 695.2 9,157.7 986.2 - 291.0
2011 859.6 562.6 9,634.4 1,036.3 - 473.7
2012estimate
1,084.1 761.4 10,368.9 1,132.4 - 371.0 Sources: FAO/WFP. 2010. Crop and Food Security Assessment Mission to Southern Sudan Special Report. Rome:
FAO/WFP. p. 22. FAO/WFP. 2011. Crop and Food Security Assessment Mission to Southern Sudan Special Report. Rome: FAO/WFP. pp. 8-14; FAO/WFP. 2012. Crop and Food Security Assessment Mission to South Sudan Special Report. Rome: FAO/WFP. p.19. FAO/WFP. 2013. Crop and Food Security Assessment Mission to South Sudan Special Report. Rome: FAO/WFP. p. 24. Note: FAO/WFP’s crop and food security assessments conducted prior to the 2009 mission were based on their own population estimates and, therefore, the cereal consumption and surplus/deficit estimates were inconsistent with those by the 2009 mission that started using the results of the 2008 Population Census.
2.4 Overview and recent performance of the agricultural sector
South Sudan has a huge but largely unrealised agricultural potential. Over 95% of the total area (658,842 km2) is considered suitable for agriculture, 50% of which is prime agricultural land where soil and climatic conditions allow for production of a variety of crops and livestock.61 A large part of the country, particularly the southern part, has high rainfall for 8-9 months a year, ranging from 500-600 mm/year to more than 1,500 mm/year.62 Despite the abundant water resources, 97% of the lands used for farming are not irrigated,63 which implies a potential for irrigated agriculture equipped with appropriate facilities and technology.
59
GRSS. 2012. Final Resolutions of the Second Governors’ Forum 26-29 November 2012, Freedom Hall, Juba.
Juba: GRSS. p. 3. 60
GRSS. 2013. The National Effort for Agricultural Transformation (NEAT), Draft Integrated Zonal
Transformations in South Sudan, Juba, South Sudan, February 2013 (Presentation slides) 61
World Bank. 2007. Final Proposal for a Multi Donor-Trust Fund Grant to the Government of Southern Sudan
for the Support to Agriculture and Forestry Development Project (SAFDP), Washington D.C.: World Bank. p. 30. (Based on Tothill, J.D. ed. 1948. Agriculture in the Sudan. London: Oxford University Press; and Craig, G.M. ed. 1991. The Agriculture of the Sudan. London: Oxford University Press.) 62
Salih, A. 2010. Southern Sudan: Preliminary Water Resources Assessment Study. Draft Final Report.
Washington D.C.: World Bank. p. 5. 63
Baseline Technical Team. 2010. Joint Baseline Survey Report on the Agriculture and Animal Resources in
Southern Sudan. Juba: GOSS. p. 101.

2-19
Figure 2-8: Livelihood Zones of South Sudan
Source: Southern Sudan Centre for Census, Statistics and Evaluation. 2007. Southern Sudan Livelihood Profiles. 2
nd Edition. Juba: SSCCSE, p.19.
South Sudan has the sixth largest livestock herd and the highest livestock per capita holding in Africa with an estimated livestock population of 11.7 million cattle, 12.4 million goats and 12.1 million sheep.64 These vital resources have an asset value estimated at SSP 7 billion65 and account for 15% of GDP.66 Considering the vast land suitable for livestock rearing, the country has a great potential to meet the domestic demand for livestock products, export surpluses and improve the livelihoods of the population that depend on the sector, particularly pastoralists and agro-pastoralists predominating in the dry lands of the country. Dense forests occupy about 25% of the total land area, mainly in the Greater Equatoria, Greater Bahr el Ghazal and Upper Nile state.67 The economic potential of forest resources is deemed significant, though data on the resources are not available as records were lost during the war. In addition to teak plantations of an estimated area from 5,000 to 8,000 ha, there are large areas of natural indigenous forest with mahogany and other commercial species. Non-wood natural products include medicinal plants, spices, gum, rubber and silk. The potential sustainable fisheries production from the River Nile, Sudd region, and Bahr el Gazel and Sobat rivers and floodplains has variously been estimated to range between 100,000 and 300,000 tons per annum. Catches are currently less than the lower estimates, so there is probably some room for expansion. A very large potential for aquaculture development exists particularly in the Greenbelt zone (Figure 2-8), which has permanent water and an ideal climate. Both large-scale commercial farming near the main population centres and subsistence type agriculture/aquaculture systems hold great promise.
Table 2-12: Livelihood zones of South Sudan
64
FAO. 2009. Livestock Population Estimates. (As cited in AO/WFP. 2013. Crop and Food Security Assessment
Mission to South Sudan Special Report. 22 February. Rome: FAO/WFP. p. 29.) 65
Musinga, M., J. Gathuma, O. Engorok and T. Dargie. 2010. The Livestock Sector in Southern Sudan: Results
of a Value Chain Study of the Livestock Sector in Five States of Southern Sudan Covered by MDTF with a Focus on Red Meat. Draft. Juba: GOSS. p. iv. 66
FAO South Sudan. 2012. Common Programming Framework (CPF) to End Drought Emergencies in the Horn
of Africa Country Programme Paper for South Sudan. Draft 23 March 2012. p. 2. 67
World Bank. 2007. Final Proposal for a Multi Donor-Trust Fund Grant to the Government of Southern Sudan
for the Support to Agriculture and Forestry Development Project (SAFDP), Washington D.C.: World Bank. p. 32.

2-20
Zone State Major Food and Income Sources
Greenbelt Western Bahr el Ghazal, Western Equatoria, Central Equatoria, Eastern Equatoria
Households in the wetter south-western areas of the zone rely almost exclusively on agriculture to meet their food needs. Surplus production is common and households cope with dry years by increasing their dependence on root crops and exchange (barter).
Ironstone Plateau
Northern Bahr el Ghazal, Western Bahr el Ghazal, Warrap, Lakes, Western Equatoria, Central Equatoria, Eastern Equatoria
Households are heavily dependent on crop production and well placed to access surpluses in the neighbouring Greenbelt.
Hills and Mountains
Central Equatoria, Eastern Equatoria, Jonglei
This zone falls somewhere between the Greenbelt zone (agriculture) and the Arid/Pastoral zone (pastoralism) with reliance on cattle, trade and root crops increased in difficult years.
Arid/Pastoral Jonglei, Eastern Equatoria This zone occupies the south-eastern tip of the country, households practice a nearly pure form of pastoralism and there is almost exclusive reliance on livestock and livestock trade for food. Seasonal migrations in search of both water and pasture provide opportunities for substantial trade and exchange with neighbouring communities.
Nile and Sobat Rivers
Jonglei, Unity, Upper Nile Apart from crops and livestock, wild foods and fish contribute significantly. Fish and wild foods are collected in varying quantities depending on the season and the location.
Western Flood Plains
Northern Bahr el Ghazal, Lakes, Warrap
Livestock and agriculture, supplemented by fish and wild foods, are the main food sources.
Eastern Flood Plains
Jonglei, Upper Nile Similar food sources are available, but with an additional option of game hunting.
Source: Southern Sudan Centre for Census, Statistics and Evaluation. 2007. Southern Sudan Livelihood Profiles. 2
nd Edition. Juba: SSCCSE. pp. 21-22.
After CPA, GOSS classified the country into seven livelihood zones according to livelihood patterns determined by physical geography, agro-ecology, market access, etc. with assistance of the European Commission Humanitarian Organisation (ECHO), USAID Famine Early Warning Systems Network (FEWS NET) and Save the Children UK (Figure 2-8). The seven livelihood zones range from areas normally producing surpluses to areas suffering from chronic food shortages (Table 2-12). This zoning is intended for use in policy formulation and development planning as well as an introductory guide to livelihoods and food security in South Sudan and for use in early warning and response planning.68 This implies the importance of taking into consideration the diversity in agricultural development planning. Despite such an enormous potential as described above, South Sudan has been suffering from low agricultural performance, high food insecurity and pervasive poverty, particularly in rural areas, but it is difficult to grasp the performance of the agricultural sector precisely due to the lack of reliable data. Partial evidence has suggested that agricultural activities have expanded somewhat since the signing of CPA but seemingly not to such an extent that it has a significant impact on the economy.
68
Southern Sudan Centre for Census, Statistics and Evaluation. 2007. Southern Sudan Livelihood Profiles. 2nd
Edition. Juba: SSCCSE. pp. 10-12.

2-21
Figure 2-9: Estimated cereal area harvested and production in 2005-2012
Data source: FAO/WFP. 2010. Crop and Food Security Assessment Mission to Southern Sudan. Rome: FAO, p.
23; and FAO/WFP. 2013. Crop and Food Security Assessment Mission to South Sudan. Rome: FAO/WFP, p. 25.
Figure 2-10: Agricultural value added and growth in 2008-2011
Data sources: World Bank. World Development Indicators.
http://databank.worldbank.org/ (accessed 11 July 2013) Note: The annual growth rate for agricultural value added is based on constant local currency.
According to the FAO/WFO CFSAM, for example, the cereal area harvested increased from 751,000 ha in 2005 to about 1.1 million ha in 2012, though there were fluctuations from year to year and the quantities produced are on an upward trend (Figure 2-9). Cereal yield remains low, which was estimated at 0.88 tons/ha (gross) on average and ranged from 0.4 tons/ha in Unity State to 1.25 tons/ha in Western Equatoria State in 2012.69 Livestock numbers are reported to be increasing, though no official estimate is available. Based on its observations on death, reproduction and retention of cattle, the FAO/WFP CFSAM has concluded that the cattle population growth rate used in Ethiopia, 0.06% per annum, can be applied to South Sudan.70 However, the growth rate is much lower than
69
FAO/WFP. 2013. Crop and Food Security Assessment Mission to South Sudan Special Report. 22 February.
Rome: FAO/WFP. p. 21. 70
FAO/WFP. 2013. Crop and Food Security Assessment Mission to South Sudan Special Report. 22 February.
Rome: FAO/WFP. p. 28.

2-22
those of other neighbouring countries, for example, Uganda’s rate of 3% per annum between 2008 and 2011.71 Agricultural value added estimated by the World Bank shows negative growth in 2009 and 2011 (Figure 2-10). Although these numbers should be taken into account, the sector’s performance has yet to be studied since GRSS is in the process of estimating GDP and other indicators by sector. Moreover, some areas and people of South Sudan have demonstrated significant growth in producing and marketing agricultural products, which may not be officially recorded but is reported in other chapters of this report.
71
Uganda Bureau of Statistics. 2012. Statistical Abstract 2012. Kampala: USOB. p. 162.

3-1
3. Natural conditions and environment
This chapter describes the natural conditions and water and land resources of South Sudan based on data prepared by the Irrigation Development Master Plan (IDMP) Task Team and some other information additionally collected by the CAMP Task Team. Environmental issues relevant to agricultural development in the country are also discussed.
3.1 Natural conditions72
3.1.1 Topography
South Sudan lies between latitudes 3°N and 13°N, and longitudes 24°E and 36°E. It is covered in tropical forest, swamps and grassland. The While Nile, locally known as the Bahr el Jabel, traverses the country from south to north, passing through major cities, such as Juba, Bor and Malakal. The river forms the Sudd, a vast swamp whose area varies from 30,000 km2 to 40,000 km2. The country inclines gently toward the north-east from the south-west (Figure 3-1). The highest peak in South Sudan is Mt. Kinyeti, 3,187 m above sea level, located in Eastern Equatoria State near the border with Uganda. The lowest part is around 400 m above sea level, near Renk, Upper Nile State.
Figure 3-1: Topographic map of South Sudan
Source: Irrigation Development Master Plan Task Team. September 2013. Irrigation Development Master Plan (IDMP): Progress Report (1) Draft. GRSS: Ministry of Electricity, Dams Irrigation and Irrigation and Water
Resources and Ministry of Agriculture, Forestry, Tourism, Animal Resources and Fisheries, Cooperatives and Rural Development; and Japan International Cooperation Agency (JICA). p. 2-1.
72
Unless otherwise noted, this section relies on information from: Irrigation Development Master Plan Task
Team. September 2013. Irrigation Development Master Plan (IDMP): Progress Report (1) Draft. GRSS: Ministry of Electricity, Dams Irrigation and Irrigation and Water Resources and Ministry of Agriculture, Forestry, Tourism, Animal Resources and Fisheries, Cooperatives and Rural Development; and Japan International Cooperation Agency (JICA).

3-2
3.1.2 Climate
The climate of South Sudan ranges from Tropical Semi-Humid climate with a short rainy season in the north to Tropical Wet-Dry and Tropical Rainy climates with progressively longer wet seasons in the south.73 There is much more rainfall in the south and strong seasonal annual variations. Mean annual rainfall ranges between 500 mm in the north to 1,500 mm in the south (Figure 3-2). The country can be broadly classified into two major rainfall regimes, unimodal and bimodal. The unimodal rainfall regime occurs in the north (e.g., Renk, Aweil and Wau), with a 6-month wet season from May to October; the bimodal rainfall regime in the south (e.g., Yambio and Juba) has a 7-8-month wet season from March/April to October/November with a few drier weeks in June-July.
Figure 3-2: Rainfall regimes at eight locations in South Sudan
73
Walsh, R. P. D. 1991. Climate, hydrology, and water resources. In Craig, G. M. ed. The Agriculture of the
Sudan. New York: Oxford University Press. pp. 19-21.

3-3
Data source: Worldclimate.Com (http://www.worldclimate.com) (accessed 13 October 2013). Data were derived from The Global Historical Climatology Network, version 1 (GHCN 1) for the following periods. Aweil: 368 months between 1950 and 1984 Bor: 889 months between 1906 and 1984 Juba: 1,045 months between 1901 and 1988 Kapoeta: 362 months between 1951 and 1981 Renk: 976 months between 1906 and 1987 Rumbek: 857 months between 1908 and 1985 Wau: 1,008 months between 1904 and 1987 Yambio: 687 months between 1921 and 1979
AR = Mean annual rainfall The IDMP Task Team has estimated the average rainfall for the last 30 years at each rainfall observation station and created contour maps for annual and monthly rainfall. Figure 3-3 shows the contour maps of annual and July rainfall. Major trends discovered are: 1) annual rainfall decreases from southwest to northeast with the exception of the Sudd which has relatively higher rainfall compared to surrounding areas; 2) the south-eastern part has lower rainfall; and 3) the north-western part has extremely high rainfall in July and August.

3-4
Figure 3-3: Rainfall contour maps: Annual and July (mm) (created by IDMP)
Source: Irrigation Development Master Plan Task Team. September 2013. Irrigation Development Master Plan (IDMP): Progress Report (1) Draft. GRSS: Ministry of Electricity, Dams Irrigation and Irrigation and Water Resources and Ministry of Agriculture, Forestry, Tourism, Animal Resources and Fisheries, Cooperatives and Rural Development; and Japan International Cooperation Agency (JICA). p. 4-34. According to rainfall and moisture regimes, the IDMP Task Team has classified South Sudan into three major rainfall zones: 1) high rainfall zone; 2) pastoralist zone; and 3) moisture deficit zone, as shown in Table 3-1.

3-5
Table 3-1: Rainfall zones classified by rainfall and moisture regimes
Zone Annual
rainfall
Characteristics
High rainfall
zone
> 1,500 mm The south-western part of the country and far southeast and Kapoeta
Hills, known as the Green Belt. Although rainfall is significant, it only
occurs for a limited period (7-8 months) of the year and is highly
variable. Irrigation would be supplementary to the rainfall to produce a
second crop and increase productivity.
Pastoralist
zone
< 1,000 mm Most areas of the country in the central, eastern and western parts.
Irrigation would provide livelihood options and increase food
production.
Moisture
deficit zone
< 500 mm The north-eastern part of the country. Rainfall is highly variable.
Irrigation could secure and increase food production and improve
livelihoods. Source: Elaborated by the CAMP Task Team based on: Irrigation Development Master Plan Task Team. September 2013. Irrigation Development Master Plan (IDMP): Progress Report (1) Draft. GRSS: Ministry of
Electricity, Dams Irrigation and Irrigation and Water Resources and Ministry of Agriculture, Forestry, Tourism, Animal Resources and Fisheries, Cooperatives and Rural Development; and Japan International Cooperation Agency (JICA). p. 4-34.
Temperature varies little over the country or with the seasons, although it is generally higher in the north and during the dry season. The most significant meteorological variables are rainfall and the length of the dry season. Variations in the length of the dry season depend on the dominance of airflows: dry north-easterly winds or humid south-westerly winds.
Diurnal ranges of temperatures are generally low, averaging 13.7C at Malakal, 12.7C at
Juba and 13.1C at Yambio; diurnal ranges are less than 10C in the wettest months and higher in the cloud-free dry season.74 Humidity is generally high throughout the year with a minimum of around 40% and a maximum of 80%. The least humid months are January and February in the middle of the dry season all over the country. The temporal pattern of the average monthly evaporation correlates with the monthly mean maximum temperature distribution. The average monthly maximum evaporation occurs from February to May and the minimum from June to September. Potential evapo-transpiration is lowest over the highlands and increases progressively towards the lowlands. Rates of 1,450 mm/year occur in the southern mountains and increase northwards to 2,500 mm/year.
3.1.3 Geology and hydrogeology
The geological setting of South Sudan is simple; the Pre-Cambrian Basement Complex, mainly consisting of granites and gneiss, occurs throughout the country. It outcrops in the south-western third of the country and along its northeast edge. In the Sudd basin it is overlain by Nubian Sandstone in the northwest, and by the Umm Ruwaba Formation elsewhere. There are alluvial deposits along the major rivers. The Sudd basin is a rift basin or depression, which owes its existence to the rifting activities of the Western, Central and East African Rift Systems. It was formed by the sinking of a land-surface made of the Basement Complex.75 The depression was at one time covered by continental deposits of the Nubian Sandstone and later by alluvial deposits of the Umm Ruwaba Formation. On the south-eastern edge of the depression thick lava flows were poured out, now forming the highest areas in South Sudan composed mainly of basalt. The geological features of South Sudan are presented in Table 3-2 and Figure 3-4.
74
Walsh, R. P. D. 1991. Climate, hydrology, and water resources. In Craig, G. M. ed. The Agriculture of the
Sudan. New York: Oxford University Press. p. 31. 75
Southern Development Investigation Team. 1955. Natural Resources and Development Potential in the
Southern Provinces of the Sudan. A Preliminary Report 1954. London: Sudan Government. p. 4.

3-6
The Sudd basin is also a closed groundwater basin with 3 major aquifers generally corresponding to the underlying geological formation – alluvial, Nubian Sandstone and Umm Ruwaba. Where the Basement Complex outcrops there is a small aquifer system but in other places it is the impervious base (bottom) of all other aquifers (see Figure 3-5).
Table 3-2: Geology of South Sudan
Era Period Common name in
Africa Local name
Class in Figure 3-4
Cenozoic
Quaternary Alluvium Alluvium Q
Tertiary Continental Terminal Umm Ruwaba Formation QT
Tertiary-Quaternary
Volcanic Volcanic, mainly basalts Ti
Mesozoic Paleozoic
Cretaceous Continental Intercalary Nubian Sandstone Qe
Proterozoic Precambrian Basement Complex Basement Complex pC Sources: 1) Irrigation Development Master Plan Task Team. September 2013. Irrigation Development Master Plan
(IDMP): Progress Report (1) Draft. GRSS: Ministry of Electricity, Dams Irrigation and Irrigation and Water Resources and Ministry of Agriculture, Forestry, Tourism, Animal Resources and Fisheries, Cooperatives and Rural Development; and Japan International Cooperation Agency (JICA). p. 4-42.
2) Geological and Mineral Resources Department, Sudan. 1991. Geological Map of the Sudan. Government of
the Sudan. 3) Mitchell, C. W. 1991. Physiography, geology, and soils. In Craig, G. M. ed. The Agriculture of the Sudan. New
York: Oxford University Press. pp. 4-5.
Figure 3-4: Geological map of South Sudan
Source: Irrigation Development Master Plan Task Team. September 2013. Irrigation Development Master Plan (IDMP): Progress Report (1) Draft. GRSS: Ministry of Electricity, Dams Irrigation and Irrigation and Water
Resources and Ministry of Agriculture, Forestry, Tourism, Animal Resources and Fisheries, Cooperatives and Rural Development; and Japan International Cooperation Agency (JICA). p. 4-44.
Figure 3-5: Hydrogeological map of South Sudan
Q: Quaternary
QT: Quaternary-Tertiary
Qe: Quaternary eolien
Ti: Tertiary extrusive and intrusive
pC: Precambrian

3-7
Source: Irrigation Development Master Plan Task Team. September 2013. Irrigation Development Master Plan (IDMP): Progress Report (1) Draft. GRSS: Ministry of Electricity, Dams Irrigation and Irrigation and Water Resources and Ministry of Agriculture, Forestry, Tourism, Animal Resources and Fisheries, Cooperatives and Rural Development; and Japan International Cooperation Agency (JICA). p. 4-44.
3.1.4 Soils76
There are 34 soil types in South Sudan as illustrated in Figure 3-6. Major soil types in descending order of area are vertisols, fluvisols, leptosols, lixisols, regosols, and cambisols. The area of other soil types is not large. Vertisols are dark, cracking, montmorillonitic clay known as “black cotton soils” and widespread on the detrital plains derived from the Ethiopian uplands and Basement Complex outcrops. In South Sudan, they are found mainly in the eastern part. Fluvisols are soils on recent alluvium and distributed along rivers, lakes and alluvial plains. Leptosols are very shallow soils over hard rock or highly calcareous materials and found in the south-western part. Lixisols are soils with subsurface accumulation of low activity clays and high base saturation and distributed in the western part. Regosols are soils with no significant profile development and distributed from northwest toward to the central area. Cambisols are soils composed of medium and fine-textured materials derived from a wide range of rocks and distributed partly in the southern and central areas.
3.1.5 Hydrology and water resources
(1) Surface water South Sudan is rich with surface water resources, with four main river basins: Bahr el Jebel, Bahr el Ghazal, River Sobat, and White Nile as illustrated in Figure 3-7.
Figure 3-6: Soil map of South Sudan (created by IDMP)
76
Besides the above-cited IDMP report, this section is based on: 1) Mitchell, C. W. 1991. Physiography, geology,
and soils. In Craig, G. M. ed. The Agriculture of the Sudan. New York: Oxford University Press. pp. 11-15; 2) FAO, IIASA, ISRIC, ISSCAS and JRC. February 2012. Harmonized World Soil Database Version 1.2; and 3) IUSS Working Group WRB. 2007. World Reference Base for Soil Resources 2006. First update 2007. World Soil
Resources Report No. 103. Rome: FAO.

3-8
Source: Irrigation Development Master Plan Task Team. September 2013. Irrigation Development Master Plan (IDMP): Progress Report (1) Draft. GRSS: Ministry of Electricity, Dams Irrigation and Irrigation and Water Resources and Ministry of Agriculture, Forestry, Tourism, Animal Resources and Fisheries, Cooperatives and Rural Development; and Japan International Cooperation Agency (JICA). p. 4-13. Note: The IDMP Task Team used a digital atlas with the spatial resolution of 1 km
2 for their soil mapping and
analysis. The atlas was produced in 2009 by NBS based on the Harmonized World Soil Database (HWSD), developed by the Land Use Change and Agriculture Program of the International Institute for Applied Systems Analysis (IIASA) and FAO.
Figure 3-7: Main basins of South Sudan
Source: Irrigation Development Master Plan Task Team. September 2013. Irrigation Development Master Plan (IDMP): Progress Report (1) Draft. GRSS: Ministry of Electricity, Dams Irrigation and Irrigation and Water Resources and Ministry of Agriculture, Forestry, Tourism, Animal Resources and Fisheries, Cooperatives and Rural Development; and Japan International Cooperation Agency (JICA). p. 2-30. (Originally prepared by the Ministry of Water Resources and Irrigation) The total average annual supply of the Bahr el Jebel basin is 28 billion m
3 at Mongalla (45 km north of Juba), but
due to the large volumes of water being lost in the Sudd wetlands, the volume reaching Malakal (over 550 kms north of Juba) is only 14 billion m
3, or half the total inflow. Similarly, the total average annual supply of the Bahr el
Ghazal basin is around 14.0 billion m3, out of which only about 0.5 billion m
3 reaches the White Nile; again water
is lost in the Sudd. The total average annual supply of the River Sobat basin at Hillet Dolieb (15 km south of

3-9
Malakal) is 13.5 billion m3,
with the daily discharge fluctuating between 8.7 million m3 in April and 64.7 million m
3
in November.
The average total annual supply of the White Nile at Malakal is from these three basins and hence calculated at 28.0 billion m3. Due to high losses in the Sudd for the Bahr el Ghazal, the White Nile essentially comes from two sources: the Bahr el Jebel/Zeraf with a constant flow and the River Sobat with a considerable annual fluctuation. On average, the daily discharge of the White Nile, being the sum of these two, varies from 46 million m3 to 106 million m3. The minimum discharge is in March or April and the maximum discharge is in October or November.
The Sudd wetland is one of the main hydrological features of South Sudan. It is located in the middle of the country and is created by the overflow of the Nile over an extensive area (30,000 to 40,000 km2), composed of permanent and seasonal swamps. 77 The annual rainfall estimate is around 800-900 mm. The average evaporation over the Sudd wetland is around 1,800 mm and due to uneven rainfall distribution, evaporation is lower in the northern part of the image (600-700 mm/year), as well as on the south-eastern corner (Figure 3-8).
Figure 3-8: Annual evaporation map of the Sudd basin (mm/year)
Source: Mohamed, Y.A., Bastiaanssen, W.G.M., and Savenije, H.H.G. 2004. "Spatial variability of evaporation and moisture storage in the swamps of the upper Nile studied by remote sensing techniques". Journal of Hydrology Volume 289, Issues 1-4, pp. 145-164. Figure 7.
(2) Groundwater As explained in section 3.1.3, there are four major aquifers, namely, Alluvial, Umm Ruwaba, Nubian Sandstone, and Basement Complex in South Sudan. The Sudd basin is the only groundwater basin in the country. (3) Rainfall Rainfall is the ultimate source of water in many parts of South Sudan, with surface water, groundwater, and other water sources all fed by rain. South Sudan has relatively significant rainfall as described in section 3.1.2. Based on rainfall contour maps, the mean annual
77
Salih, A. 2010. Southern Sudan: Preliminary Water Resources Assessment Study. Draft Final Report.
Washington D.C.: World Bank. pp. 25-26.
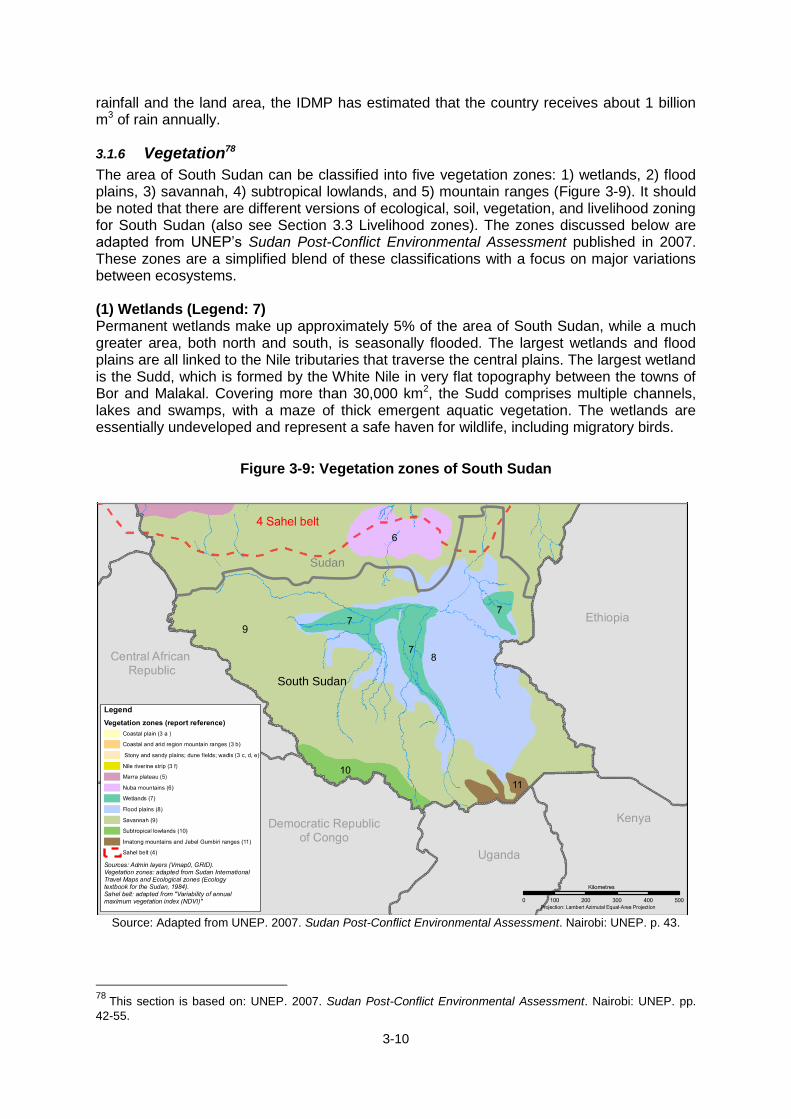
3-10
rainfall and the land area, the IDMP has estimated that the country receives about 1 billion m3 of rain annually.
3.1.6 Vegetation78
The area of South Sudan can be classified into five vegetation zones: 1) wetlands, 2) flood plains, 3) savannah, 4) subtropical lowlands, and 5) mountain ranges (Figure 3-9). It should be noted that there are different versions of ecological, soil, vegetation, and livelihood zoning for South Sudan (also see Section 3.3 Livelihood zones). The zones discussed below are adapted from UNEP’s Sudan Post-Conflict Environmental Assessment published in 2007. These zones are a simplified blend of these classifications with a focus on major variations between ecosystems. (1) Wetlands (Legend: 7) Permanent wetlands make up approximately 5% of the area of South Sudan, while a much greater area, both north and south, is seasonally flooded. The largest wetlands and flood plains are all linked to the Nile tributaries that traverse the central plains. The largest wetland is the Sudd, which is formed by the White Nile in very flat topography between the towns of Bor and Malakal. Covering more than 30,000 km2, the Sudd comprises multiple channels, lakes and swamps, with a maze of thick emergent aquatic vegetation. The wetlands are essentially undeveloped and represent a safe haven for wildlife, including migratory birds.
Figure 3-9: Vegetation zones of South Sudan
Source: Adapted from UNEP. 2007. Sudan Post-Conflict Environmental Assessment. Nairobi: UNEP. p. 43.
78
This section is based on: UNEP. 2007. Sudan Post-Conflict Environmental Assessment. Nairobi: UNEP. pp.
42-55.
9
Sudan
South Sudan
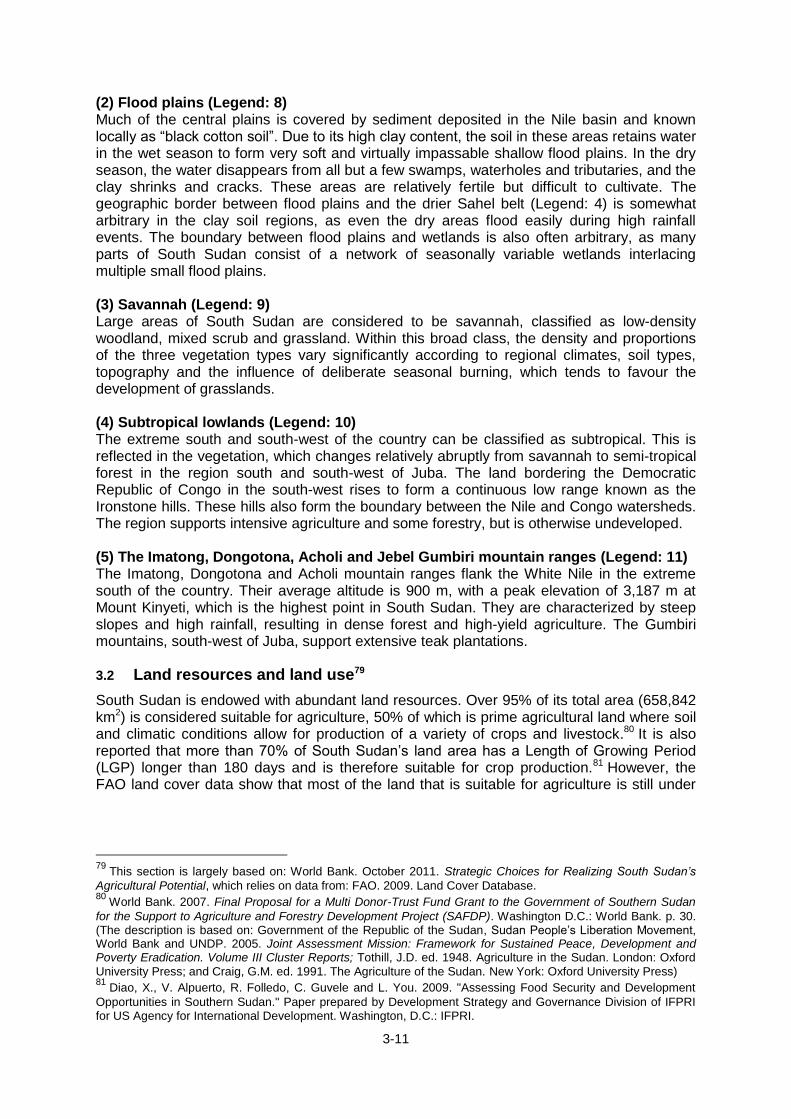
3-11
(2) Flood plains (Legend: 8) Much of the central plains is covered by sediment deposited in the Nile basin and known locally as “black cotton soil”. Due to its high clay content, the soil in these areas retains water in the wet season to form very soft and virtually impassable shallow flood plains. In the dry season, the water disappears from all but a few swamps, waterholes and tributaries, and the clay shrinks and cracks. These areas are relatively fertile but difficult to cultivate. The geographic border between flood plains and the drier Sahel belt (Legend: 4) is somewhat arbitrary in the clay soil regions, as even the dry areas flood easily during high rainfall events. The boundary between flood plains and wetlands is also often arbitrary, as many parts of South Sudan consist of a network of seasonally variable wetlands interlacing multiple small flood plains. (3) Savannah (Legend: 9) Large areas of South Sudan are considered to be savannah, classified as low-density woodland, mixed scrub and grassland. Within this broad class, the density and proportions of the three vegetation types vary significantly according to regional climates, soil types, topography and the influence of deliberate seasonal burning, which tends to favour the development of grasslands. (4) Subtropical lowlands (Legend: 10) The extreme south and south-west of the country can be classified as subtropical. This is reflected in the vegetation, which changes relatively abruptly from savannah to semi-tropical forest in the region south and south-west of Juba. The land bordering the Democratic Republic of Congo in the south-west rises to form a continuous low range known as the Ironstone hills. These hills also form the boundary between the Nile and Congo watersheds. The region supports intensive agriculture and some forestry, but is otherwise undeveloped. (5) The Imatong, Dongotona, Acholi and Jebel Gumbiri mountain ranges (Legend: 11) The Imatong, Dongotona and Acholi mountain ranges flank the White Nile in the extreme south of the country. Their average altitude is 900 m, with a peak elevation of 3,187 m at Mount Kinyeti, which is the highest point in South Sudan. They are characterized by steep slopes and high rainfall, resulting in dense forest and high-yield agriculture. The Gumbiri mountains, south-west of Juba, support extensive teak plantations.
3.2 Land resources and land use79
South Sudan is endowed with abundant land resources. Over 95% of its total area (658,842 km2) is considered suitable for agriculture, 50% of which is prime agricultural land where soil and climatic conditions allow for production of a variety of crops and livestock.80 It is also reported that more than 70% of South Sudan’s land area has a Length of Growing Period (LGP) longer than 180 days and is therefore suitable for crop production.81 However, the FAO land cover data show that most of the land that is suitable for agriculture is still under
79
This section is largely based on: World Bank. October 2011. Strategic Choices for Realizing South Sudan’s
Agricultural Potential, which relies on data from: FAO. 2009. Land Cover Database. 80
World Bank. 2007. Final Proposal for a Multi Donor-Trust Fund Grant to the Government of Southern Sudan
for the Support to Agriculture and Forestry Development Project (SAFDP). Washington D.C.: World Bank. p. 30. (The description is based on: Government of the Republic of the Sudan, Sudan People’s Liberation Movement, World Bank and UNDP. 2005. Joint Assessment Mission: Framework for Sustained Peace, Development and Poverty Eradication. Volume III Cluster Reports; Tothill, J.D. ed. 1948. Agriculture in the Sudan. London: Oxford
University Press; and Craig, G.M. ed. 1991. The Agriculture of the Sudan. New York: Oxford University Press) 81
Diao, X., V. Alpuerto, R. Folledo, C. Guvele and L. You. 2009. "Assessing Food Security and Development
Opportunities in Southern Sudan." Paper prepared by Development Strategy and Governance Division of IFPRI for US Agency for International Development. Washington, D.C.: IFPRI.

3-12
natural vegetation. Only 3.8% (2.5 million ha) of the total land area (64.7 million ha)82 is currently cultivated, while the largest part of the country (62.6%) is under trees and shrubs (Table 3-3). The ratio of cropland to total land is very low in South Sudan compared to Kenya and Uganda, where despite less favourable LGPs, cropland accounts for 28.3% and 7.8% of total land area. Most of the cropland in South Sudan is rain-fed. The irrigated area is limited to only 32,100 ha, mainly in Upper Nile State. Flood land used for rice production is also limited, at about 6,000 ha, and is located primarily in Northern Bahr el Ghazal (Figure 3-10).
Table 3-3: Area and share of aggregated land use in total land area of South Sudan
Land use Area (ha) Share of total land (%)
Cropland 2,477,700 3.8
Grass with crops 325,100 0.5
Trees with crops 1,707,300 2.6
Grassland 9,633,800 14.9
Tree land 40,526,900 62.6
Flood land 9,497,600 14.7
Water and rock 482,700 0.7
Urban 37,000 0.1
Total 64,688,300 100.0 Source: World Bank. October 2011. Strategic Choices for Realizing South Sudan’s Agricultural Potential. p. 4. (Aggregated from FAO. 2009. Land Cover Database) Note: In the World Bank study, a two-step sequential process was used to derive land use/cover data from a 295 land use types depicted in the FAO land cover map for South Sudan. First, the 295 land use types were resampled and aggregated into 22 land use types, 13 of them agriculture-related (including trees and tree crops). In the second step, the 13 agriculture-related land use types were further aggregated into the six categories shown above.
Figure 3-10: Aggregated land use/cover map
Source: World Bank. October 2011. Strategic Choices for Realizing South Sudan’s Agricultural Potential. p. 4. (Modified from FAO. 2009. Land Cover Database)
82
In the World Bank study, the total land area of South Sudan is estimated at 64.7 million ha, using the data from
FAO’s Land Cover Database. (World Bank. October 2011. Strategic Choices for Realizing South Sudan’s Agricultural Potential.)

3-13
Most cropland is concentrated in five states: Upper Nile, Warrap, Jonglei, Western Equatoria, and Central Equatoria (Table 3-4). These five states account for 70% of national cropland and 56% of national territory. Almost all irrigated crops (mainly rice) are in Upper Nile; rice on flood land is all in Northern Bahr el Ghazal. Fruit trees and tree plantations are exclusively in Western, Central, and Eastern Equatoria, most probably due to the suitable climatic conditions in these states. As shown in Figure 3-11, the World Bank study has identified areas with high agricultural (crops) potential in terms of favourable climate and population density and suggested that they should be prioritised for earlier investments to provide the fastest stimulus to agricultural growth in the country. High potential areas are found mainly in the three Equatorial states and Jonglei, which together account for nearly 80% of the road network of the country (as of 2011).
Table 3-4: Share of aggregated land use by state (%)
State Cropland Grass with
crops
Trees with
crops Grassland
Tree land
Flood land
Water and rock
Urban Total
Upper Nile 19.0 26.0 7.1 27.1 7.8 9.0 9.5 25.8 11.4
Jonglei 14.3 25.2 7.3 14.8 19.7 26.7 17.3 8.8 19.5
Unity 4.5 16.1 2.5 7.7 3.7 14.9 6.4 17.1 6.0
Warrap 15.3 8.1 14.9 5.2 3.5 11.4 1.8 0.9 5.6
Northern Bahr el Ghazal
9.8 1.1 4.2 1.0 4.7 7.3 15.3 3.2 4.7
Western Bahr el Ghazal 2.0 4.0 12.9 4.2 18.6 13.5 18.5 10.4 14.9
Lakes 9.9 0.6 2.7 5.6 7.1 9.0 4.3 5.1 7.0
Western Equatoria 11.4 7.5 19.9 9.0 15.7 1.4 17.5 3.7 12.5
Central Equatoria 11.2 8.6 21.4 4.5 7.7 2.4 3.7 22.1 6.9
Eastern Equatoria 2.6 2.7 7.1 21.0 11.6 4.4 5.6 2.8 11.4
National average 3.8 0.5 2.6 14.9 62.6 14.7 0.7 0.1 100.0
Source: World Bank. October 2011. Strategic Choices for Realizing South Sudan’s Agricultural Potential. p. 5. (Estimates based on FAO. 2009. Land Cover Database)
Figure 3-11: Combination of roads, agricultural potential zones and cropland areas
Source: World Bank. October 2011. Strategic Choices for Realizing South Sudan’s Agricultural Potential. p. 28. Note: HH = High production potential and high population density; HL = High production potential and low population density; MH = Medium production potential and high population density The IDMP Task Team has developed a land productivity map based on an assessment of irrigation development potential in terms of: 1) land productivity potential (temperature,

3-14
slopes, and soils), 2) water resources potential (land cover, wetness, river accessibility, grazing areas, and water bodies), and 3) socio-economic potential (road accessibility, population density, protected areas, oil and gas concessions, and market accessibility). Figure 3-12 indicates that areas circled by black dotted lines have higher irrigation development potential, though this map is to be finalised later.
3.3 Livelihood zones
There are seven livelihood zones in South Sudan: 1) Greenbelt, 2) Ironstone Plateau, 3) Hills and Mountains, 4) Arid/Pastoral, 5) Nile-Sobat Rivers, 6) Western Flood Plains, and 7) Eastern Flood Plains, as shown in Figure 3-13. These zones were developed along livelihood patterns (crop production, livestock rearing, off-farm income generation, etc.) determined by physical geography, agro-ecology, market access, etc. and are therefore more often called “livelihood zones”. For the characteristics of each zone, see Table 2-12 presented in Chapter 2 and Table 10-13 in Chapter 10.
Figure 3-12: Land productivity potential map of South Sudan (prepared by IDMP)
Source: Irrigation Development Master Plan Task Team. September 2013. Irrigation Development Master Plan (IDMP): Progress Report (1) Draft. GRSS: Ministry of Electricity, Dams Irrigation and Irrigation and Water Resources and Ministry of Agriculture, Forestry, Tourism, Animal Resources and Fisheries, Cooperatives and Rural Development; and Japan International Cooperation Agency (JICA). p. 4-23.

3-15
Figure 3-13: Livelihood zones of South Sudan
Source: Prepared by NBS/CAMP Task Team based on data from NBS. 2012. National Baseline Household Survey 2009.
3.4 Environmental issues
3.4.1 Climate change and disaster risk management
The Agriculture Sector Policy Framework 2012-2017 acknowledges that climate change is one of the environmental issues to address and policy measures are needed to mitigate the adverse effects of climate change in the medium and long-term.83 The country is heavily dependent on rain-fed agriculture and has limited institutional and infrastructure capacity to cope with natural variability. Climate change will increase the frequency and intensity of extreme weather events such as droughts, floods and heat waves. Although no vulnerability and adaptation studies have been conducted, prolonged and severe droughts are known to have caused severe water shortage and crop failure. Climate change can also lead to outbreaks of human diseases as well as outbreaks of pests and emergence of new crop pests and diseases. It is necessary to identify risks and recognise and minimise obstacles to risk management through public and private action.84
3.4.2 Deforestation and land degradation
South Sudan has lost much of its forests since the 1950s and deforestation is ongoing.85 There are several underlying causes of deforestation including: fuelwood and charcoal
83
Ministry of Agriculture, Forestry, Cooperatives and Rural Development. 2012. Agriculture Sector Policy
Framework (ASPF): 2012-2017. Juba: GRSS. p. 61. 84
The World Development Report 2014 focuses on managing of various kinds of risks including natural
disasters, pandemics, financial crises and crime. World Bank. 2013. World Development Report 2014: Risk and Opportunity - Managing Risk for Development. Washington, DC: World Bank. 85
UNEP. 2007. Sudan Post-Conflict Environmental Assessment. Nairobi: UNEP. pp. 206-209.

3-16
extraction, mechanized agriculture, rain-fed and shifting agriculture, drought and climate
change, overgrazing and fires, and conflict impacts. Among these, fuelwood and charcoal
extraction is considered one of the major causes due to the country’s high dependence on fuelwood and charcoal as the main sources of energy. Therefore, deforestation is worst
around major towns such as Malakal, Wau and Juba. A general trend of intensification of traditional rain-fed agriculture and associated land degradation has been reported across Sudan including the regions of the present South Sudan.86 The stress on the land is evidenced by the gradual replacement of harig (slash-and-burn) patterns of vegetation with large areas that remain permanently cleared of forest. Fieldwork and satellite image analysis conducted jointly by UNEP and ICRAF in 2006 indicated such a pattern of deforestation and growth in rain-fed agriculture in Yambio, Yei, Wau, Aweil and Bor. In certain areas such as Yei and Yambio counties, population pressure has reduced the fallow period from an estimated average of 20 years to 5 years or less. Such short turnover periods are insufficient for forest regeneration or restoration of soil fertility. In Yambio, cleared agricultural land increased from 6.8% of the UNEP-ICRAF study area to 27.7%, mainly at the expense of closed forest and wooded grasslands, between 1973 and 2006 (Figure 3-14). In Wau, forests have been replaced largely by expanding traditional slash-and-burn agriculture and rangeland and degraded land has appeared in previously forested areas.87 Land degradation due to cattle-rearing has also been widely observed in South Sudan. Though it is difficult to distinguish between bare earth caused by overgrazing and bare earth associated with tilled and empty fields for crops, the UNEP-ICRAF fieldwork and analysis estimated that in Renk, Upper Nile State, the proportion of bare and degraded land increased from 0.8% of the total studied area (2,500 km2) in 1973 to 15.4% in 2006.88 Some of the abandoned cultivated land has reverted to bushland and could potentially be used for grazing, but it has major access constraints. While land degradation is generally limited to strips alongside watercourses in the southern clay plains, it is severe in the drier south-east. Particularly in the Imatong region in Eastern Equatoria State, where the low valleys receive 25-50% less rainfall than the plains to the north, soil erosion is occurring and bare subsoil is visible.89 The primary cause of this degradation is overgrazing of pastures that are naturally vulnerable to erosion due to poor soil quality and low rainfall.
86
UNEP. 2007. Sudan Post-Conflict Environmental Assessment. Nairobi: UNEP. pp. 169-171. 87
UNEP. 2007. Sudan Post-Conflict Environmental Assessment. Nairobi: UNEP. p. 208. 88
UNEP. 2007. Sudan Post-Conflict Environmental Assessment. Nairobi: UNEP. p. 180. 89
UNEP. 2007. Sudan Post-Conflict Environmental Assessment. Nairobi: UNEP. p. 182.

3-17
Figure 3-14: Deforestation and expansion of rain-fed agriculture in Yambio
Source: UNEP. 2007. Sudan Post-Conflict Environmental Assessment. Nairobi: UNEP. p. 171.
These warning signs of land degradation indicate that any expansion of farming areas and increase in cattle numbers would constitute a risk of significant damage to lands which are already worked close to or over their sustainable yield. Agricultural development projects should therefore include land sustainability and, in degraded areas rehabilitation, components to avoid exacerbating the existing problems and creating new problems.
3.4.3 Loss of biodiversity resources
The country has also experienced rapid degradation of biodiversity resources due to the widespread illegal and uncontrolled exploitation of such resources.90 The public sector is unable to implement conservation measures in an effective manner because of weak collaboration among authorities at the national and state levels to manage and conserve forest resources, and due to the inadequacy of legal frameworks, expertise and resources for communication and transportation. It is urgent that the management of Central Forest Reserves (CFRs) be strengthened to avoid further uncontrolled exploitation of forest resources, and encroachment.
3.4.4 Lack of effective environmental governance91
The key environmental issue for agricultural development in South Sudan is the lack of effective governance including legislation, policy, institutions, and implementation framework for environment management. The establishment of environmental assessment, e.g.,
90
For details about this issue, see Chapter 12 Forestry. 91
Environmental governance has been severally defined and one adapted by UNEP is: multi-level interactions
(i.e., local, national, regional and international) among three main actors, i.e., state, market, and civil society, which interact with one another, whether in formal and informal ways; in formulating and implementing policies in response to environment-related demands and inputs from the society; bound by rules, procedures, processes, and widely-accepted behavior; possessing characteristics of “good governance”; for the purpose of attaining environmentally-sustainable development. (Original source: http://ecogov.blogspot.com/2007/04/definition-of-environmental-governance.html [Accessed 20 October 2013]).
James
Nzara
NgereYambio
Sakure
Nginda
Limbia
Gangura
Timbiro
Rimenze
Li-rangu
BazinguaLi rangu
Mangondi
Mbarizanga
River musangani
James
Nzara
NgereYambio
Sakure
Nginda
Limbia
Gangura
Timbiro
Rimenze
Li-rangu
BazinguaLi rangu
Mangondi
Mbarizanga
River musangani
19/01/1973 07/01/2001
This map shows land use changes that have occurred during the last 30 years in the main land use classes.
It is the result of a satellite image classification process combined with ground truth data collected during several field missions in
2006.
Classification was performed by ICRAF.Datum: WGS 84.
Projection: UTM Zone 35N.
0 5 10 15 20 25
KilometresLand types
Closed forest
Planted forest
Bushland, shrubland, grassland and wooded grassland
Built-up areas
Burnt areas
Rain-fed agriculture
Riverine vegetation
River
Road

3-18
strategic environmental assessment (SEA) and environmental and social impact assessment (ESIA), is also one of the areas that require immediate attention. The lack of effective governance will leave the environment highly vulnerable to unplanned and unmanaged exploitation of resources such as land, forest and fish. The ministries concerned with agricultural development are currently under strong pressure to provide policies and projects that will rapidly increase food security. This may result in a tendency to promote agricultural development projects that will be environmentally unsustainable. Therefore, it is important for the CAMP to incorporate institutional and technical capacity building to improve environmental governance within its framework.

4-1
4. Policy and legal framework for agricultural development
The purpose of this chapter is to explain that CAMP supports the existing policy and legal frameworks for agricultural development in South Sudan; and, that CAMP and these frameworks will mutually strengthen each other. To do so, major policies, strategic plans and Acts are discussed in relation to CAMP. Subsequent chapters about more specific topics of CAMP (public financial system, natural conditions and environment, sub-sectors, etc.) will further investigate them.
4.1 South Sudan Development Plan (SSDP)
SSDP 2011-13 was delivered in response to major challenges for development during the first three years of the South Sudan’s independence. The following are the overall objective of SSDP and its four core components to achieve that objective.
Box 4-1: Objective of SSDP
Overall Objective
To ensure that by 2014 South Sudan is a united and peaceful new nation, building strong foundations for good governance, economic prosperity and enhanced quality of life for all.
Four Core Components
Improving governance: Institutional systems including government organizations’ accountability, transparency and coordination mechanisms need to be improved. This is especially important when it comes to the issue of redistribution of the oil revenues for development of the nation. Capacity building of government members is necessary to improve the system. Achieving economic development (particularly rural development) to improve
livelihoods and expand employment opportunities: This requires various measures such as development of transport infrastructure to promote trade; clarification of land issues to enhance utilization of the abundant natural resources of South Sudan; improvement of access to extension, basic farming tools and markets. Also, the regulatory environment needs to be developed and access to finance should be promoted in order to encourage private activities and investment. Accelerating social and human development: Universal access to basic social services (education and health care) needs to be improved for social and human development. Preventing conflict and enhance security: In order to promote peace building, sovereignty and territorial integrity should be protected through provisions of access to justice and maintenance of laws. At the same time, government institutions need to improve their transparency and accountability. Source: GRSS. 2011. SSDP 2011-2013. Juba: GRSS. (Partially modified by the CAMP Task Team)
CAMP will align with SSDP, and directly covers the first and second components mentioned above. The third and fourth components will be addressed during the implementation of CAMP. For instance, economic development achieved through agricultural development will

4-2
promote provision of social services including education and healthcare; increasing opportunities for employment and income will reduce the risks of conflicts such as cattle raids.
4.2 Current agricultural policies and strategic plans
The CAMP process is primarily led by MAFCRD and MARF. Therefore, CAMP must align its framework (including objectives and strategies) with their policies and strategic plans. MAFCRD’s Agriculture Sector Policy Framework (ASPF): 2012-2017 states the ministry’s vision, mission and policies as follows.
Box 4-2: Vision and Mission of MAFCRD
Vision of MAFCRD
Food security for all the people of the Republic of South Sudan, enjoying improved quality of life and environment
Mission
To create an enabling environment for the transformation of agriculture from a subsistence system into a modern, socially and economically sustainable system through science-based, market-oriented, competitive and profitable farming while maintaining the natural resources for the benefit of future generations of South Sudanese people.
Key Policies
1) Policies on crops sub-sector: Yields of food crops both as nutritional sources and cash crops are targeted to double. R&D and infrastructure development should be encouraged to support this.
2) Policies on agricultural production support services: Smallholders, commercial farmers, processors and agribusiness operators need to be supported through extension services and agricultural education training.
3) Policies in support of agricultural markets, value chain development and finance Commercial farming and agribusiness requires well-developed agricultural markets for both inputs and produce.
4) Policies on food security and nutrition: Food security has been a key issue for South Sudan and it is mentioned in the National Food Security Action Plan (NAFSAP) 2008-2011.
5) Policies on forestry development and management: Sustainable development of forest resources needs to be reinforced.
6) Policies on the role of agriculture and forestry for socio-economic change and social justice: Young people will be provided with access to training, credit, information technology, etc.
7) Policies on sustainable agriculture, environment and climate change: In order to cope with the risks of climate changes, the ministry will support diversification of crops, environmental conservation, etc.
8) Policy coordination and monitoring and evaluation: Since agricultural development requires coordination of different central ministries, different tiers of government and other stakeholders at all levels, an Inter-Ministerial Committee will monitor and evaluate the implementation of the ASPF.
Source: MAFCRD/GRSS. 2012. ASPF 2012-2017. Juba: GRSS. (Partially modified by the CAMP Task Team)

4-3
MARF’s Policy Framework and Strategic Plans 2012-2016 states the Vision, Mission and Strategic Goals as follows. In the formulation of CAMP, the Crop and Forestry subsectors of the CAMP Task Team will largely address MAFCRD’s policies, while CAMP’s Livestock and Fisheries subsectors will cover the strategic goals of MARF.
Box 4-3: Vision and mission of MARF
Vision
Productive livestock and fisheries sectors contributing 5% annually to improvement in food security, household income, job creation and the national Gross Domestic Product.
Mission
To accelerate socio-economic development of the South Sudanese and enhance the livelihoods and food security of livestock and fisheries producers.
Strategic goals
1) Key national data, legislation, regulations, policies, strategic plans and standards in support of the sustainable development and commercialization of the animal and fisheries resources of the Republic of South Sudan, researched, formulated, endorsed and operational.
2) Service-oriented, professional and accountable Ministry of Animal Resources and Fisheries developed, integrated and effectively collaborating with and building capacity of State MARFs, and providing quality and cost-effective services to the livestock and fishery sectors.
3) Investment opportunities identified and private investment expertise and capital realized for the sustainable development of private and public-private commercial enterprises in the livestock and fishery sectors.
4) An effective national livestock epidemio-surveillance and control system operational and meeting the requirements of the OIE92 and potential livestock and livestock product export markets.
5) Significant and documented improvements in consumer protection achieved through improvements in the quality of marketed livestock and fisheries products resulting from improved processing infrastructure, hygiene, handling, processing and inspection.
Source: MARF/GRSS. 2012. Policy Framework and Strategic Plans 2012-2016. Juba: GRSS. (Partially modified by the CAMP Task Team)
4.3 Agriculture-related policies and strategic plans
CAMP will help meet the objectives of other agriculture-related policies of South Sudan. The following policy and strategic plan documents are waiting to be approved by the Council of Ministers and finally by the National Legislative Assembly.93
4.3.1 Land Policy
A major agriculture-related policy is the Draft land policy.
92
OIE: World Organization for Animal Health 93
GRSS, MAFCRD and the FARM Project; interviewed by the CAMP Task Team, Juba, June 2013, CAMP
Situation Analysis

4-4
Box 4-4: Draft land policy
Vision
To provide secure land rights for all South Sudanese.
Policy goal
Strengthening land tenure security for all citizens.
The benefits of promoting tenure security
1) Peace building: Conflicts over land rights will be reduced. Those include issues over grazing rights and water-use rights, and competitions over territories between counties and between payams.
2) Economic development: Securing property rights facilitates farmers and investors investing in cultivation of their land. This is a key for agricultural development.
3) Unification of the nation
Current issues need to be tackled to improve tenure security
1) Dislocations due to civil war or natural calamities; post-war conflict over land rights (after decades of civil war, social, economic and political disorder deepened the conflicts over land)
2) Weak land administration and management 3) Lack of transparency and accountability 4) Gender bias and discrimination 5) Informal settlements in cities and towns 6) Conflicts over access to land with pasture and water 7) Land-grabbing; the acquisition of land without regard for the interests of existing land
rights holders 8) Disagreements regarding boundaries between counties and payams Source: SSLC. 2011. Draft Land Policy. Juba: SSLC. (Partially modified by the CAMP Task Team)
4.3.2 Strategy for cooperative development
CAMP will also take into consideration a strategic plan document with high relevance to agriculture called the National Strategy for Cooperative Development 2012-2015 drafted by MAFCRD. The document mentions that cooperatives have been used globally to achieve community development goals.
4.3.3 Other agriculture related policies and strategies
All the above agriculture related policies and strategic plans were drafted after independence; the following were drafted prior to independence:
Forestry Policy 2007
The National Agriculture and Livestock Extension Policy (NALEP)
Aid Strategy
Government Capacity Building Strategy
The Medium-Term Capacity Development Strategy (MTCDS).
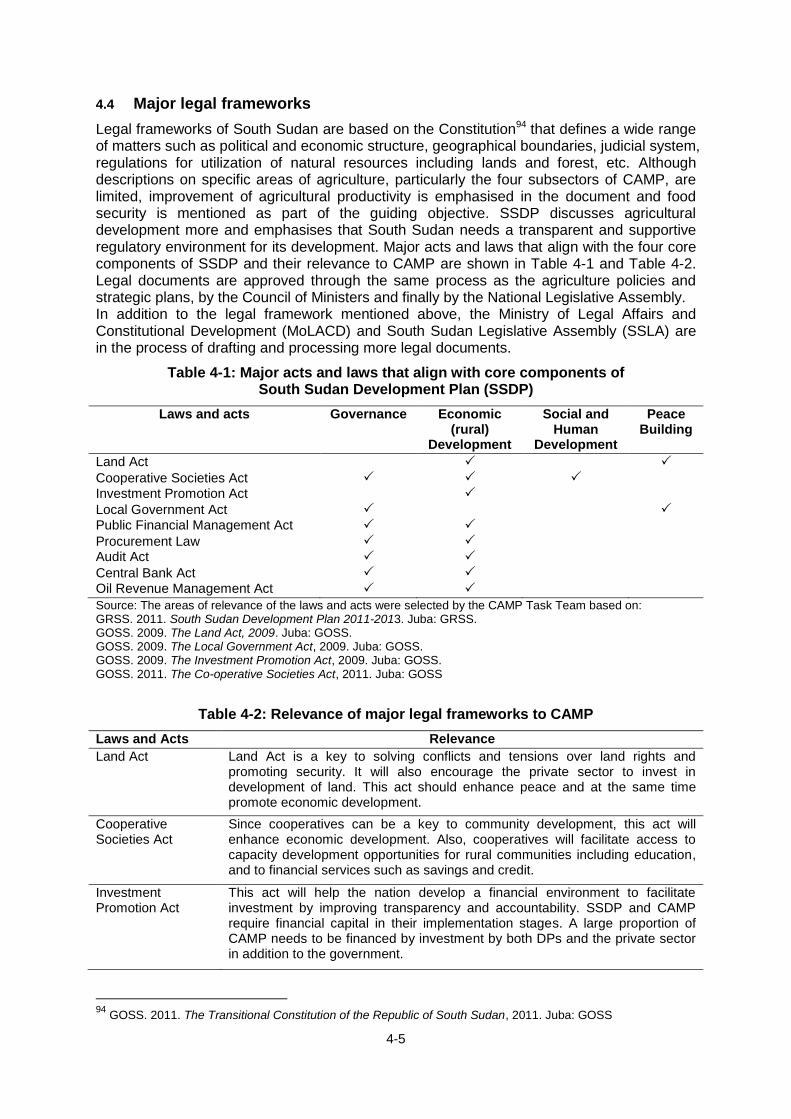
4-5
4.4 Major legal frameworks
Legal frameworks of South Sudan are based on the Constitution94 that defines a wide range of matters such as political and economic structure, geographical boundaries, judicial system, regulations for utilization of natural resources including lands and forest, etc. Although descriptions on specific areas of agriculture, particularly the four subsectors of CAMP, are limited, improvement of agricultural productivity is emphasised in the document and food security is mentioned as part of the guiding objective. SSDP discusses agricultural development more and emphasises that South Sudan needs a transparent and supportive regulatory environment for its development. Major acts and laws that align with the four core components of SSDP and their relevance to CAMP are shown in Table 4-1 and Table 4-2. Legal documents are approved through the same process as the agriculture policies and strategic plans, by the Council of Ministers and finally by the National Legislative Assembly. In addition to the legal framework mentioned above, the Ministry of Legal Affairs and Constitutional Development (MoLACD) and South Sudan Legislative Assembly (SSLA) are in the process of drafting and processing more legal documents.
Table 4-1: Major acts and laws that align with core components of South Sudan Development Plan (SSDP)
Laws and acts Governance Economic (rural)
Development
Social and Human
Development
Peace Building
Land Act
Cooperative Societies Act Investment Promotion Act
Local Government Act Public Financial Management Act
Procurement Law Audit Act
Central Bank Act Oil Revenue Management Act
Source: The areas of relevance of the laws and acts were selected by the CAMP Task Team based on: GRSS. 2011. South Sudan Development Plan 2011-2013. Juba: GRSS. GOSS. 2009. The Land Act, 2009. Juba: GOSS. GOSS. 2009. The Local Government Act, 2009. Juba: GOSS. GOSS. 2009. The Investment Promotion Act, 2009. Juba: GOSS. GOSS. 2011. The Co-operative Societies Act, 2011. Juba: GOSS
Table 4-2: Relevance of major legal frameworks to CAMP
Laws and Acts Relevance
Land Act Land Act is a key to solving conflicts and tensions over land rights and promoting security. It will also encourage the private sector to invest in development of land. This act should enhance peace and at the same time promote economic development.
Cooperative Societies Act
Since cooperatives can be a key to community development, this act will enhance economic development. Also, cooperatives will facilitate access to capacity development opportunities for rural communities including education, and to financial services such as savings and credit.
Investment Promotion Act
This act will help the nation develop a financial environment to facilitate investment by improving transparency and accountability. SSDP and CAMP require financial capital in their implementation stages. A large proportion of CAMP needs to be financed by investment by both DPs and the private sector in addition to the government.
94
GOSS. 2011. The Transitional Constitution of the Republic of South Sudan, 2011. Juba: GOSS

4-6
Laws and Acts Relevance
Local Government Act
This act defines the roles and responsibilities of customary institutions including their roles in administering community land rights.
Public Financial Management Act, Procurement Law, Audit Act, Central Bank Act
These acts are all related closely to the functions of the government’s financial management. The Public Financial Management Act promotes efficient and effective use of limited public resources. Other acts strengthen public financial management.
Oil Revenue Management Act
This act regulates and manages oil revenues through monitoring, auditing and reporting mechanisms. Since well-over 90% of the total national revenue of South Sudan is from oil revenues, this act will help the country redistribute the revenues efficiently for its development.
Source: Elaborated by the CAMP Task Team based on: GRSS. 2011. SSDP 2011-2013.
4.5 Observations
While analysing the documents described above, especially MAFCRD and MARF’s, the CAMP Task Team found that government policies and strategic plans, and processes can be improved further. Policies were sometimes formulated in a short time with minimal resources. The government was not fully involved in the development process of policies and strategic plans. As mentioned later in Chapter 9, various development partners and implementing organizations found challenges in cooperating with the government. Therefore government involvement was minimized in previous interventions. The government gained no expertise in managing budgets and executing projects, nor in using its own financial system; nor was the capacity of its staff in performing these activities improved. Based on these experiences, the CAMP formulation process is designed so it is led and owned by the government. This will lead to creating good governance that is emphasised in SSDP. It is also very important for all phases of CAMP; it requires ownership by both central and local governments plus capacity development of government officers at all levels. These officers need to cooperate with various actors not only at the central and state levels but also at county, payam, boma and community levels. The government will also need to coordinate various DPs that will be involved in the implementation of CAMP. The government needs to distribute and audit financial capital efficiently and effectively in order to maximize agricultural productivity. Additionally, government institutions will have to tackle numerous challenges such as potential armed conflicts and limited regulatory frameworks. In order for the government to fulfil those numerous roles, CAMP will identify the areas of capacity that need to be enhanced and design institutional development strategies. The Draft Land Policy and Land Act are keys for economic development in South Sudan and will be supported by CAMP. Based on analysis conducted by the CAMP Task Team, land issues are a hindrance to agricultural development in South Sudan. Various agricultural activities including irrigation and cultivation need clarity of land property rights. However, property rights and property owners are not always clearly defined, especially in rural areas; legal procedures on how to settle disputes over land property issues are also vague. As a result, violations of land rights and conflicts over land have hindered various development efforts. The government authority to utilize natural resources over certain lands is also undermined. The probability of conflict will increase when the government tries to implement agricultural development plans. Therefore, the successful implementation of CAMP requires the resolution of land issues. Cooperatives can be an effective tool for agricultural development as mentioned above. They can facilitate financial services such as savings and credits which would help the

4-7
government redistribute financial capital for rural development. Such potential will be analysed further in the CAMP formulation process.

5-1
5. Institutional framework for agricultural development
5.1 Public sector organisations
The roles of public sector organizations will be a critical factor when CAMP is implemented. It is important to understand how national and state ministries function and their relationships with lower levels of government, such as counties, payams and bomas. CAMP focuses on 4 subsectors; crop, forestry, livestock and fisheries. The Ministry of Agriculture, Forestry, Cooperatives and Rural Development (MAFCRD), Ministry of Animal Resources and Fisheries (MARF) and Ministry of Water Resources and Irrigation (MWRI) will manage the CAMP implementation process while the lower levels of government will be the actual implementers. In this section, the institutional framework of the public sector is described; this needs to be understood both to know how government works and to propose realistic implementation mechanisms.
5.1.1 National government
The Comprehensive Peace Agreement (CPA), 2005 was a significant milestone for the current Government of South Sudan. After the CPA, the autonomous Government of Southern Sudan (GOSS) was established. On 9 July 2011, Southern Sudan became independent and a national government was formed with 10 state governments. After the CPA, ministries were created, including the Ministry of Agriculture and Forestry (MAF), Ministry of Cooperatives and Rural Development (MCRD), Ministry of Animal Resources and Fisheries (MARF), and Ministry of Water Resources and Irrigation (MWRI). The functions of GOSS were restricted in terms of allocation of human resources, policy planning and implementation, and budget. The Interim Constitution of Southern Sudan, 200595, which was revised in 2011 as the Transitional Constitution of the Republic of South Sudan, 2011, defined the original functions and mandates of the ministries. Additionally, a Presidential96 Decree in July 2008 further defined the functions of the ministries. Table 5-1 lists the ministries found in the South Sudan Development Plan 2011-2013 (SSDP). As of 30 June 2013, there were 28 ministries.
Table 5-1: Ministries in SSDP
GRSS Ministries
• Cabinet Affairs
• Labour and Public Service
• Human Resource Development
• Parliamentary Affairs
• Regional Cooperation
• Finance and Economic Planning
• Agriculture and Forestry
• Animal Resources and Fisheries
95
The function of MAF was defined in Chapter IV, Interim Constitution of Southern Sudan, 2005 96
This is the President of Southern or South Sudan.

5-2
GRSS Ministries
• Cooperatives and Rural Development
• Wildlife Conservation and Tourism
• Environment
• Housing and Physical Planning
• Transport and Roads
• Water Resources and Irrigation
• Commerce and Industry
• Energy and Mining
• Information and Broadcasting
• Investment
• Telecommunication and Postal Services
• Health
• Education
• Higher Education, Research, Science and Technology
• Gender, Child and Social Welfare
• Culture and Heritage
• Youth, Sport and Recreation
• Humanitarian Affairs and Disaster Management
• Legal Affairs and Constitutional Development
• Internal Affairs
• Peace Building and CPA Implementation Source: South Sudan Development Plan 2011-2013
Note: Ministry of Cooperatives and Rural Development merged into Ministry of Agriculture and Forestry and became Ministry of Agriculture, Forestry, Cooperatives and Rural Development.
5.1.2 Lead ministries
The CAMP is a government-led initiative and there are three lead ministries involved in this process, which are listed below.
5.1.2.1 MAFCRD
In 2011, the Ministry of Cooperatives and Rural Development (MCRD) was merged with the Ministry of Agriculture and Forestry (MAF), and became the Ministry of Agriculture, Forestry, Cooperatives and Rural Development (MAFCRD). As of June 30, 2013, MAFCRD had 7 directorates as shown in Table 5-2, but it is still in the process of restructuring.
Table 5-2: Organization of Ministry of Agriculture, Forestry, Cooperatives and Rural Development
Minister
Deputy Minister
Undersecretaries (2)
Directorate of Agriculture and Extension Services
Directorate of Forestry
Directorate of Cooperatives
Directorate of Finance and Administration
Directorate of Planning and Agricultural Economics
Directorate of Rural Development
Directorate of Research and Training
Source: Agriculture Sector Policy Framework (ASPF): 2012-2017. P.10

5-3
MAFCRD has broad functions including developing policies and legislation, setting up the necessary standards for agriculture and forestry as well as the promotion and regulation of cooperatives and coordinating various activities which contribute to poverty alleviation and promoting food security. In addition, coordination between national and state governments is important; MAFCRD is to support the state governments as they implement policy.
5.1.2.2 MARF
MARF remains as a single ministry which deals with the fields of animal resources and fisheries. MARF has 9 directorates as shown in Table 5-3, and it is also in the process of restructuring.
Table 5-3: Organization of Ministry of Animal Resources and Fisheries
Minister
Deputy minister
Undersecretary
Directorate of Planning, Statistics and Documentation
Directorate of States and Special Projects Coordination
Directorate of Administration, Finance and Human Resources Development
Directorate of Investment, Marketing and Supplies
Directorate of Animal Production and Range Management
Directorate of Fisheries and Aquaculture Development
Directorate of Veterinary Services
Directorate of Livestock and Fisheries Extension
Directorate of Animal and Fisheries Research and Development
Source: MARF Policy Framework and Strategic Plan 2012–2016, p3, p5.and MARF information.
According to the MARF Policy Framework and Strategic Plan 2012-2016, the functions of MARF include the formulation of legislation, regulations, policies and standards for the development of animal resources and fisheries; development of policy guidance; monitoring/documenting the performance of the livestock and fisheries sectors; provide technical advice on animal health and disease control policies and the development and implementation of plans to improve livestock health and production; monitoring and investigation of the prevalence, spread and impact of animal diseases; promotion of improved fishing, fish handling and fish processing technologies to improve the quality and quantity of fish catches; ensuring the sustainability of the fisheries sector through the development and enforcement of policies and regulations governing the exploitation of fish stocks; and promotion and development of aquaculture fish production.
5.1.2.3 MWRI
MWRI has the regulatory mandate for urban water provision and rural water facilities as well as controlling water resources development, conservation and management. MWRI has 6 directorates as shown in Table 5-4. It has broad functions such as developing policies, strategies, frameworks, guidelines and standards. Also MWRI plays an important role in coordinating various stakeholders such as state, donors and other ministries. In all, MWRI ensures development and management of water resources, and provision as well as sustainability of water and sanitation services.

5-4
Table 5-4: Organization of Ministry of Water Resources and Irrigation
Minister
Deputy minister
Undersecretary
Administration and Finance
Planning and Programming
Water Resource Management
Irrigation and Drainage
Rural Water Supply and Sanitation
Hydrology and Survey
Source: MWRI, Water, Sanitation & Hygiene (WASH) Strategic Framework, June 2011, p. 38.
5.1.3 State and local governments
Local government ceased in the southern part of Sudan in 1983 on the outbreak of the second civil war. The majority of skilled human resources joined the SPLA, became refugees or were internally displaced. Sudan became a federal state in 1992, when a three-tier system of government was created (the federal government, states, and local communities)97. A five-tier decentralized system (national, state, county, payam and boma) was established by the SPLM’s National Convention of New Sudan in 1994 in Chukudum, with special emphasis on the formal separation of civil and military powers. This five-tier system is unique to South Sudan and was introduced all over Southern Sudan in 2005. The county, payam and boma levels are considered as local government and the boma is the lowest level. It is the domain of traditional authority, with the boma chief holding the position of Boma Administrator. The Local Government Act, 2009 articulates this decentralization of authority and power. After CPA in 2005 and before independence, state level services were provided by the former garrison towns of Southern Sudan as these towns had the capacity to do so. Hence, this system was only found in Central Equatoria, Western Bahr el Ghazal, Northern Bahr el Ghazal, Upper Nile and Unity. However, other states (the former SPLM/A liberated areas) did not have this capacity and were mainly supported by NGOs and United Nations agencies. The Republic of South Sudan consists of ten states which were formerly the provinces of Equatoria (Central Equatoria, Eastern Equatoria, and Western Equatoria); Bahr el Ghazal (Northern Bahr el Ghazal, Western Bahr el Ghazal, Lakes, and Warrap); and Upper Nile (Jonglei, Unity, and Upper Nile)98.
5.1.4 Objectives of Local Government
The objectives of local government are clearly stated in the Local Government Act 2009, as are the principles of local governance.
Box 5-1: Objectives of local government
The objectives of the Local Government shall be to: (1) promote self governance and enhance the participation of people and communities in maintaining law and order and promoting democratic, transparent and accountable local government; (2) establish the local government institutions as close as possible to the people;
97
World Bank, Country Economic Memorandum, 2003, p63 98
http://www.goss.org/

5-5
(3) encourage the involvement of communities and community based organizations in local governance and promote dialogue among them on matters of local interest; (4) promote and facilitate civic education; (5) promote social and economic development;
(6) promote self‐reliance amongst the people through mobilization of local resources to ensure the provision of services to communities in a sustainable manner;
(7) promote peace, reconciliation and peaceful co‐existence among the various communities; (8) ensure gender mainstreaming in local government; (9) acknowledge and incorporate the role of traditional authorities and customary law in the local government system; (10) consult and involve communities in decision making relating to the exploitation of natural resources in their areas; (11) create and promote safe and healthy environment; and (12) encourage and support women and youth activities and the training of local cadres. GOSS. 2009. The Local Government Act. Juba: GOSS.
Box 5-2: Principles of local governance
The following principles of local governance shall be the basis for decentralization and democratisation of the Local Government Authority system in Southern Sudan: (1) Principle of subsidiarity, where decisions and functions shall be delegated to the lowest competent level of Government; (2) Self governance and democracy; (3) Participation of all citizens in the exercise of their rights to express their opinions in the process of decision making in public affairs; (4) Rule of law, maintain law and order and its enforcement in a fair and impartial manner while respecting and honouring the norms, virtues and values of the society; (5) Transparency, to build mutual trust between government and citizens through the provision of information and guaranteed access to information; (6) Equity, to provide an equitable distribution of resources throughout the Local Government Council; (7) Equality, to provide equal services and opportunities for all members of the local community with the aim of improving their welfare; (8) Responsiveness, to increase the sensitivity of the employees of government and non‐governmental organisations to the aspirations of the people in service delivery and meeting public demands; (9) Accountability, to ensure accountability of decision‐makers to the people in all matters of public interest; and (10) Efficiency and effectiveness, to ensure good public service delivery through optimum and responsible use of resources. GOSS. 2009. The Local Government Act. Juba: GOSS
5.1.5 Functions of local government
The Interim Constitution of Southern Sudan stated that the state governments had the authority to deliver various public services such as education, health, public works, water, agricultural extension services and security services. Therefore, state governments had the responsibility to plan and programme the establishment, development, construction and maintenance of schools, hospitals, water supply plants, inter-county road networks, agricultural training centres etc., and sustain them. However, under the Local Government Act 2009 it is the local governments that should now deliver these services. Table 5-5 shows the different levels of government and their functions as envisaged by the Local Government Framework for Southern Sudan 2006 and the Local Government Act

5-6
2009. However the Local Government Act 2009 has not been fully implemented due to financial and capacity issues and reality is somewhat different.
Table 5-5: Levels of government and their functions
Level Description Functions
National Policy development
National coordination of policy
implementation
Prioritization and planning
Resource mobilization
Monitoring and Evaluation
Technical support and backstopping
Capacity building
State Actual:
10 states with number of ministries
Functional policy development
Policy implementation
Legislation
Regulation
coordination
Monitoring and evaluation of policy implementation
County Actual:
79 counties in 10 states Envisaged:
70,000-100,000 people in county
Service delivery planning
Programming and implementation
Payam Actual:
Each county has 4-7 payams
302 payams in total Envisaged:
3-4 payams in a county
Service delivery
Programme implementation
Boma Actual:
Each payam has 6-7 bomas
Boma has 3-5000 people Envisaged:
3-4 bomas in a payam
Boma has 5,000-10,000 people
Service delivery
Programme implementation (neither functioning)
Note: Actual data is from the CAMP situation analysis. Envisaged is from Government of Southern Sudan. 2006. The Local Government Framework for Southern Sudan. Juba: GoSS.
5.1.6 Coordination among lead ministries
In order to develop feasible policies, the ministries need to develop strong institutional relationships at the national level. There are a number of working groups where ministries can discuss issues of mutual interest such as the Policy Working Group, Food Security Working Group, Budget Working Group, and Natural Resources Sector Working Group. CAMP promotes coordination and planning between MAFCRD, MARF and MWRI using technical committees and stakeholder meetings.
5.1.7 Coordination between levels of government
From policy making to its implementation, South Sudan faces many difficulties since the functions of ministries at the national level do not always align with those of the state. The reason for this is that the authority to set up ministries is given to each state government who may choose to divide responsibilities differently. This situation often causes confusion about the chain of command and misallocation or non-allocation of block grants from national

5-7
ministries to state ministries for their budgets. Table 5-6 shows the various different state ministries established.
Table 5-6: National and state ministries for different subsectors
Crop Forestry Cooperatives
Rural Development Livestock Fishery Irrigation
National Ministry MAFCRD MARF MWRI
Sta
te M
inis
try
Central Equatoria MAF MCRD MARF MPI
Eastern Equatoria MAFCRD MARF MPIPU
Western Equatoria MACE MPI
Jonglei MAF n/a MLF MPI
Lakes MAF MCRD MARF MPI
Upper Nile MAF n/a MARF MPI
Unity MAFCRD MARF MPI
Warrup MAF MCRD MARF MCRD
NBG MAF MWRRDC MARF MWRRDC
WBG MAFI MARF MAFI
MAFCRD: Ministry of Agriculture, Forestry, Cooperatives and Rural Development
MARF: Ministry of Animal Resources and Fisheries
MWRI: Ministry of Water Resources and Fisheries
MAF: Ministry of Agriculture and Forestry
MCRD: Ministry of Cooperatives and Rural Development
MPIPU: Ministry of Physical Infrastructure and Public Utilities
MPI: Ministry of Phsical Infrastructure
MRDI:Ministry of Rural Development and Irrigation
MWRRDC: Ministry of Water Resources, Rural Development and Cooperatives
MACE: Ministry of Agriculture, Cooperatives and Environment
MAFI:Ministry of Agriculture, Forestry and Irrigation
MLF: Ministry of Livestock and Fisheries
MPIRD: Ministry of Physical Infrastructure and Rural Development Source: Interviews with state officers
Table 5-5 shows the functions of the various levels of government but reality is different. Some of the reasons are:
(i) Due to the austerity budget, there is no budget available for policy implementation. (ii) Resources are not provided in a timely manner. (iii) Operations at the county level face even more difficulties and the situation at payam
and boma level is worse. (iv) Communication between the different levels of government is not well established. (v) Purposes of the policies are not fully shared and understood.
5.2 Public sector capacity
The CAMP Task Team carried out a capacity assessment of the main agriculture sector public institutions, namely the national government ministries and the state ministries and county offices.
5.2.1 National government
The CAMP Task Team conducted a rapid organizational scan of the Ministry of Agriculture, Forestry, Tourism, Animal Resources, Fisheries, Cooperatives and Rural Development

5-8
(MAFTARFCRD). The IDMP Task Team has gathered similar capacity information for the Ministry of Electricity, Dams, Irrigation and Water Resources. It should be noted that at the time the CAMP Institutional Development Subsector Team conducted the organizational scan, MAFTARFCRD was in the process of re-structuring and incorporating several former ministries.
5.2.1.1 Physical resources at national government
The main MAFTARFCRD office building is located in the government ministries complex in Juba with the Animal Resources and Fisheries Sector (AR&F) located in Gudele on the outskirts of Juba at the former Ministry of Animal Resources and Fisheries site and the forestry sector at the former Ministry of Electricity and Dams site in the Balu area of Juba. The buildings are of moderate to good construction and condition with the main buildings being permanent; the AR&F Sector also has some pre-fabricated temporary buildings. With the exception of the building housing the forestry sector which is privately owned and rented by the government, the rest of the buildings are owned by GRSS. The Ministry also operates several research and training centres in the states. These facilities are described in subsector specific chapters of this report. Both Task Team observations and interview results show that office space in the main MAFTARFCRD building and for the forestry sector is not adequate to properly house all officers in a good working environment. Most officers felt the space allocation in the animal resources and fisheries sector was sufficient. Office furniture, e.g., desks, chairs and cabinets, are mostly in poor condition and of poor quality; due to some being damaged and not replaced, there is insufficient furniture for all officers in the main building to function well in their work. The same is found at the forestry sector. At AR&F some units, e.g., planning, have adequate office furniture, whereas other units do not. In all sectors, much of the office equipment, such as photocopiers, computers, printers and scanners, are of good quality but not all are functioning and should be repaired. The Task Team was told that there were no funds available for their operation and maintenance. The quantity of office equipment is insufficient for the number of staff. Internet is available, but not connected to all offices, e.g., the forestry sector, nor is it always reliable. Electricity is provided by generators which usually operate for seven hours per day but depends on fuel availability. Water is supplied by privately-owned tanker trucks. Toilets are inadequate for the number of staff as several have been closed due to lack of funds to repair them. The Ministry has a transportation policy that officers of grades 1-5 are entitled to have a vehicle and driver to transport them between home and work, as well as for work-related transportation. For grades 7 and lower, a bus should provide a similar service. However the bus has been broken-down for a number of months and there is no maintenance or repair funds available. The exception appears to be the forestry sector where the Task Team was told that each department has a vehicle, with a small maintenance budget, strictly for work purposes. There is no standard fleet management system operating at the Ministry.
5.2.1.2 Organizational resources at national government
The former ministries each had vision, mission and goals statements which appeared in their policy documents. The statements are not displayed in a prominent place, such as the main entrance to the ministries, for the employees and public to see. The officers interviewed by the Task Team knew that such statements existed but could not recall what they were. While the strategic plans and departmental work plans exist, due to austerity measures and the resulting lack of funding, little implementation is taking place. MAFTARFCRD is in the process of developing a new organizational structure and organogram. Both MAFCRD and MARF established monitoring and evaluation units within their planning directorates and some staff were trained in M&E. Again, due to lack of funds, the units are not active.

5-9
Management at MAFTARFCRD is hierarchical with officers receiving their orders from their immediate supervisor, who has received them from above. Little individual initiative is encouraged by the management system in place. Data management is basic with hard and soft copies being stored within departments and some also placed in the library at MAFTARFCRD. Interviewees said staff turnover was “moderate”. The staff recruitment procedure involves job advertisement, board interviews, and confirmation by the Ministry of Labour, Public Service and Human Resources Development (MLPSHRD). However, interviewees mentioned that some new staff are hired based on personal recommendations, i.e., political appointments, sometimes without advertising the vacancy. Job descriptions are available for some but not all positions. The Ministry is in the process of reviewing current and developing new job descriptions. There is an ongoing civil service reform programme within GRSS, headed by MLPSHRD. They have developed a new staff performance appraisal system and trained various ministry managers on its use. MAFTARFCRD has yet to implement the system. Due largely to the austerity measures and the coming implementation of the civil service reform programme, promotion within the Ministry does not reflect a consistent system. In the past progression to a higher grade was nearly automatic after a few years of good performance; board interviews were used, similar to the recruitment process. Currently, an individual can make their case to their manager who may make a recommendation to the undersecretary. It appears there has been little promotion of officers in the past few years. The Task Team was told that, in some cases, individuals have been promoted based on political influence rather than qualifications or performance. Within the hierarchical setting, communication is taking place through circulars and memos from the top down, announcements being made during Monday prayer meetings, addresses by the undersecretary and periodic directorate or department meetings. More informally, face-to-face discussions are common amongst staff and with supervisors. Although direct service to the public, e.g., farmers, is mainly taking place at the state, county and payam levels, service to the public by national ministry officers takes several forms. Common activities are: information broadcast via the media, participation in field activities with state officers, conducting training events, conducting community meetings, and receiving the public in the officer’s office. However, several interviewees mentioned that these activities have been limited by lack of funds to carry them out. Many such activities are funded through donor projects or NGOs. Table 5-7 and Table 5-8 provide an indication of the human resources and their level of education available to the new Ministry of Agriculture, Forestry, Tourism, Animal Resources, Fisheries, Cooperatives and Rural Development. Complete information was not available due to the on-going restructuring and reorganization. Table 5-7 shows the number of staff and officers employed by the former MAFCRD in 2012. MAFTARFCRD was unable to provide the number of current vacancies at the new Ministry.
Table 5-7: Human resources at the former MAFCRD in 2012
Directorate Classified Unclassified Total
Minister’s Office 7 9 16
Administration and Finance 60 23 83
Agriculture Headquarters 38 103 141
- Department of Plant Protection 14 - 14 - Department of Agriculture Engineering 21 - 21 - Department of Post-harvest and Home Economics 11 - 11 - Department of Horticulture 12 - 12
Forestry Headquarters 60 15 75
Planning and Programming 28 10 38

5-10
Directorate Classified Unclassified Total
Research, Training and Extension Headquarters - Plataka Centre - Yei Research Basic Seed Centre - Halima Research Basic Seed Centre - Yei Crop Centre - Kagelu Forest Training Centre - ATTC Yambio - Department of Training - Department of Extension
32 3 4 3 -
16 15 19 18
9 25 25 22 23 23 21 - -
41 28 29 25 23 39 36 19 18
Totals 361 308 669 Source: MAFTARFCRD
Table 5-8 provides an example of qualifications of officers within the largest directorate in the former MAFCRD – the Directorate of Cooperatives and Rural Development, in 2012.
Table 5-8: Education level of officers at the Directorate of Cooperatives and Rural Development at MAFCRD in 2012
Directorate PhD MSc Post-Grad
Bachelor Diploma SSC Other Total
Cooperatives and Rural Development Male = 63 Female = 43
0 7 1 22 31 43 2 106
Source: MAFTARFCRD
5.2.1.3 Human resources development at national government
This section of the report deals with the in-service human resources development (HRD) situation at the national level. For a discussion of pre-service education and training available to potential ministry employees see subsection 4.4 - Education and Training. MAFTARFCRD has a training department which is responsible for conducting training needs assessments, coordinating training, setting the annual training budget, and following-up, monitoring and evaluating training that has taken place. With a limited budget, it is not considered to be very effective by the officers interviewed. Interviewees were not clear on whether or not there was a formal orientation programme for new staff. It was said that new employees are introduced to the various directorates and departments over a two week period, but then are left on their own to become familiar with the Ministry and where they fit within it. Most training and professional development activities, participated in by ministry officers, are sponsored by a donor country as a consequence of a bilateral relationship, or by an NGO. Government sponsored HRD is limited due to a shortage of funds.
5.2.2 State ministries and county offices
The CAMP Task Team visited all 10 states plus 20 counties, which were located close to the capitals of each state, to survey physical, organizational and human resources development capacities. The objectives of the visits to state ministries and county offices were to measure their capacity to carry out their work as public service providers and to determine their potential capacities to implement the Comprehensive Agricultural Development Master Plan in the future.
5.2.2.1 Physical resources at state ministries and county offices
The condition of the physical resources is more or less similar between states. The team focused on facilities and equipment used for regular work activities, such as office buildings, space allocation, utilities, office furniture and office equipment. Basic office furniture, e.g., desks, chairs and cabinets, was found to be allocated to the majority of government officers,

5-11
but officer equipment, such as computers and printers, is only allocated to a few high ranking officers, e.g., the Ministers, Director Generals and some Directors. As an overall observation of the 20 counties the CAMP Task Team visited, counties in the Equatoria states are better equipped in terms of offices and office facilities. These counties had their own office buildings, whereas in other states, there are counties that do not have offices at all. In some of the states and counties, e.g., Lakes State, the office buildings were constructed and equipped by donor-funded projects. Transportation is an issue in all states. Most state ministries have at least three vehicles for the Ministers and DGs use and are not usually available for ministry officers to use. Some of the vehicles are broken down and cannot be repaired due to a lack of budget for parts. Lack of electricity is another debilitating factor. The austerity budget had a significant impact on operating generators at all state ministries. The usual duration of generator operation is three hours per day, which means a large part of the officers’ work is done without electricity or not at all (Table 5-9). This lack of electricity reduces the efficiency and effectiveness of their regular work. In some cases, while the generator is not operating, the officers gather outside the office building, under trees or other shade. Over-sized generators were operating in some state ministries, leading to reduced fuel efficiency.
Table 5-9: Electricity supply time by state ministry
State Ministry Electricity Supply
Period/Day
Central Equatoria MAF Less than 4-5 hours
MARF Less than 4-5 hours
Eastern Equatoria MAFCRD Less than 3 hours
MARF Less than 3 hours
Western Equatoria MACE Less than 3 hours
Jonglei
MAFCRD Less than 4 hours
MARF Less than 4 hours
Lakes
MAF Less than 2 hours
MARF Less than 2 hours
Upper Nile MAERD Less than 4 hours
MARF Less than 4 hours
Unity
MAFCRD Less than 2 hours
MARF Less than 2 hours
Warrap
MAF Less than 2 hours
MARF Less than 2 hours
Northern Bahr el Ghazal
MAF Less than 4 hours
MARF Less than 4 hours
Western Bahr el Ghazal MAFI Less than 4 hours
MARF Less than 4 hours
Source: interviews with officers in each state ministry
Table 5-10 summarises the results of the capacity assessment of physical resources at the state level. All states have difficulties acquiring office infrastructure such as office buildings and equipment. In most states laboratories, demonstration farms, veterinary offices all lack infrastructure, equipment and consumables, as well as qualified staff. Technical equipment such as tractors and ox ploughs lack spare parts and maintenance. Transportation is a critical issue both for attending to daily work and monitoring and evaluation activities in the field. Since office furniture and equipment is not provided to all officers, knowledge products, statistical information and administrative documents are not adequately stored, retrieved or managed at state ministries and county offices.

5-12
Table 5-10: Challenges of physical resources by state
State Challenges
Central Equatoria
Lack of office equipment such as computers and printers.
Lack of transportation for daily commuting of officers.
Eastern Equatoria
Lack of infrastructure (office building and equipment).
Luck of transportation for daily commuting of officers.
Western Equatoria
Lack of infrastructure (office building and equipment).
Luck of transportation for daily commuting of officers and facilitation of existing projects
Jonglei Lack of infrastructure (office building and equipment).
Lack of transportation for daily commuting of officers.
Lakes
Lack of county office buildings (4 counties).
Inadequate skilled staff in counties due to the lack of training opportunities.
Lack of equipment.
Lack of transportation which causes difficulties in commuting of officers, and facilitation of the work in the state/counties/payams.
Although some agricultural equipment is delivered by the national ministries, there is no plan of supplying spare parts and distributors.
Upper Nile
Lack of infrastructure (office building and equipment).
Lack of transport to facilitate supervision of projects.
Lack of spare parts for vehicles and agricultural machinery such as tractors.
Unity Lack of infrastructure (office building and equipment).
Lack of transportation for daily commuting of officers.
Warrap The ministries have their own buildings but office space is limited.
Lack of office tools such as computers, printers and photocopiers.
Lack of transportation for daily commuting of officers.
Lack of office space in counties.
Northern
Bahr el
Ghazal
MARF does not have a ministry building.
MARF has only one computer donated by GIZ, and MAF has eight computers in total.
MAF has an office block with a limited capacity to accommodate all its staffs.
Very limited office space at the state and county levels.
Limited transport capacity which may affect facilitation of projects, e.g., there is only one car used by DG of MAF.
Lack of laboratories and cold storage.
Counties visited do not have office space. One is provided by a NGO.
Western Bahr el Ghazal
Various types of tractors provided by the national ministry, which lead to high cost for maintenance. For example, six out of seven Mahindra tractors are not functioning since such tractors are not suitable for the type of soil predominant in the state.
Lack of spare parts is a serious challenge.
Lack of office space except Raja County.
Lack of transportation for daily commuting of officers, e.g., only two out of six vehicles are working.
Source: Interviews with state officers
As shown in Table 5-11, few of the county offices have an appropriate amount of offices, desks, chairs, transportation and utilities. Regarding access to a sufficient amount of electricity, during the Task Team’s visits there was not one county office observed to have electricity. Lack of electricity is also causing communication problems between state ministries and county officers, a mobile phone being the only communication tool. To overcome the difficulty of exchanging information, states and counties schedule regular face-to-face meetings.

5-13
Table 5-11: Physical resource confirmed from 20 counties visited
State County Physical Capacity
Central Equatoria
Juba Office, desks, chairs, few computers, no regular electricity, a few vehicles
Yei Office, desks, chairs, few computers, no regular electricity, motorbike
Eastern Equatoria
Torit Office, desks, chairs, few computers, no regular electricity, no transport for activities
Western Equatoria
Nzara No office, desks, chairs, no regular electricity, bicycles
Jonglei
Bor South Office, desks, chairs, no regular electricity Twic East No office, no vehicle
Lakes
Rumbek Center Office, desks, chairs, no regular electricity, no vehicle Rumbek East No office, no vehicle
Upper Nile
Malakal Office, desks, chairs, few computers, no regular electricity, one vehicle
Panyikang No office, one desk and chair, no vehicle Baliet No office, one desk and chair, one computer, no regular
electricity, no vehicle
Akoka No office, one desk and chair, no regular electricity, no vehicle
Unity
Koch No office, no vehicle Leer No office, no vehicle
Warrap
Twic No office, no vehicle Gogrial West No office, no vehicle
Northern Bahr el Ghazal
Aweil South No office, no vehicle Aweil Center No office, no vehicle
Western Bahr el Ghazal
Jur River No office, vehicle
Wau No office, no vehicle Source: Interviews with state officers in each ministries and observations
5.2.2.2 Organizational resources at state ministries and county offices
Austerity measures at the national and state levels have affected organizational activities at the county level. Even if the state approves an operating budget for a county, often not all the amount is distributed. Hence, activities at the county level are reduced or postponed to the following year. County officers stressed that if this situation continues, it could lead to a decline of yields of agricultural and livestock products. Similarly, policy interventions are inefficient. If this is repeated over the whole country, there could be a negative impact on the volume of crop and animal production. It is not clear if the current situation of the lack of physical resources, as described in subsection 5.2.2.1 above, is due to the national austerity measures. The purchase of new equipment was suspended at the majority of state ministries since operating budgets were cut or decreased in their 2012/2013 budget. However, it appears that even before the austerity measures were introduced, the state ministries did not plan to upgrade their physical resources. A reason given was that the state Ministry of Finance and Economic

5-14
Planning approves budget items that have already been purchased (for example, chairs) but is less likely to approve items not previously asked for (so called ‘repeat budgeting’). Even oil producing states, which receive 2% of the revenues from oil, have not upgraded their physical resources. While some revenue is generated through the renting of, for example, tractors, to farmers for ploughing, the income is typically delivered to the state Ministry of Finance and does not usually or directly assist in the operation and maintenance of the equipment. Several states have taken to seconding staff to NGOs as a means of reducing salary costs, thus further weakening government service provision. Some states have limited awareness of standard financial management practices with neither detailed annual plans to execute the budget or to account or report. There are weak procurement procedures and audits are rare. The state ministries do not have adequate staff. The CAMP Task Team confirmed that most posts are occupied by officers sitting at the state headquarters. There are not enough officers assigned at the county level due to the inadequate number of officers as a whole. For example, the Ministry of Agriculture and Forestry, Central Equatoria State, has a total of 131 officers (Table 5-12). Of these only 42 officers are dispatched to 6 counties. This means roughly 7 officers are allocated to one county. Table 5-13 shows how many payams are in each county and the number of officers allocated to each county in the agriculture and forestry sectors. One of the officers in each county is the assistant commissioner, and the other officers look after the activities of the county and the payams they are responsible to. For example, in Terekeka County, one officer covers three payams, which is a challenge for him. Due to transportation issues, some state ministry officers do not come to their office or come late. There are other officers on the payroll who have either resigned or retired (ghost workers) who are still collecting their salaries.
Table 5-12: Distribution of officers in State Ministry of Agriculture and Forestry, Central Equatoria State
Directorate/Department No. of Officers
Plant Protection 4 Mechanization 5 Horticulture 4 Planning and Statistics 16 Extension 22 Administration 9 Administration and Finance 22
Total HQ (Juba) 89 Dispatched to Six Counties 42 Total 131 Source: Strategic Plan for the Year 2012-2014, State Ministry of Agriculture and Forestry, CES
Table 5-13: Distribution of officers to counties in State Ministry of Agriculture and Forestry, Central Equatoria State
County No of officers Payams
Lainya 4 5
Morobo 6 5
Yei 6 5
Terekeka 5 10
Kajokeji 8 5
Juba 13 16
Total 42 46
Source: Strategic Plan for the Year 2012-2014, State Ministry of Agriculture and Forestry, CES

5-15
The same situation is observed in the livestock and fisheries sectors. As shown in Table 5-14, the number of officers dispatched to the counties is less than for the state MAF. This means these officers are expected to look after more payams with a smaller number of officers. In addition, some counties, such as Kajokeji have only assistant commissioners whose job descriptions are different from other officers. Kajokeji has no officers to perform on-the-ground activities. Terekeka is considered as a county with high potential for animal production but there is no officer assigned as livestock officer or veterinary assistant.
Table 5-14: Distribution of officers to counties in State Ministry of Animal Resources and Fisheries, Central Equatoria State
County No of officers Payams
Lainya 3(2) 5
Morobo 2(1) 5
Yei 2(1) 5
Terekeka 4(2) 10
Kajokeji 2(2) 5
Juba 15(2) 16
Total 42 46
Note: the number in bracket is the number of commissioners Source: Strategic Plan for the Year 2012-2014, State Ministry of Animal Resources and Fisheries, CES
The distribution of officers assigned to counties in Lakes State is similar. Table 5-15 shows that there are 136 officers, but that only 70 are dispatched to the six counties. Counties near the state capital, Rumbek receive a relatively large number of officers with various educational backgrounds, but counties located far from the capital have fewer officers (Table 5-16).
Table 5-15: An example of officers’ distribution in State Ministry of Animal Resources and Fisheries, Lakes
Directorate/Department No. of Officers
Finance, Planning & Administration 32
Animal Production 21
Fisheries 13
Extension N/A
Total HQ (Rumbek) 66
Dispatched to Six Counties 70
Total 136
Source: Strategic Plan for the Year 2012-2014, State Ministry of Agriculture and Forestry, CES
Table 5-16: Distribution of officers to counties in State MARF, Lakes
County No of officer Payams
Rumbek Centre 13 5
Rumbek East 12 7
Wulu 8 4
Yirol West 6 7
Awerial 3 8
Yiron East 7 6
Rumbek North 10 6
Cueibet 11 6
Total 70 47
Source: Strategic Plan for the Year 2012-2014, State Ministry of Agriculture and Forestry, CES

5-16
Interviews with officers of MAFCRD in Upper Nile, Western Bahr el Ghazal and Lakes States revealed that younger officers were employed at grade 9 99 after South Sudan’s independence in July 2011. These officers are qualified in terms of educational background and most of them have bachelor degrees or diplomas in specific subjects relating to agriculture, forestry, livestock or fisheries. However, they have no practical work experience. The CAMP ID Subsector Team observed that although these young officers, were given job descriptions for their positions as soon as they joined the ministry, they had difficulty in understanding and performing their major duties and regular activities. Their underperformance leads to inefficiency in overall performance in state governments. Some officers raised the issues of political appointments being made, instead of being based on qualifications or merit, as well as that of the lack of experience among younger officers. They said that support by the state to the public was hampered by the lack of agricultural extension workers, office space and well trained staff. Table 5-17 shows the main challenges of each state ministry in terms of human resources as determined through interviews with state officers.
Table 5-17: Main challenges of each state in terms of human resources
State Challenges
Central Equatoria Inadequate skilled staffs in counties due to lack of training opportunities.
Large proportion of budget is used for salaries and wages.
No external audit conducted
Eastern Equatoria Inadequate skilled staffs in counties due to lack of training opportunities.
Western Equatoria Inadequate skills and knowledge of officers at the state and country levels due to lack of training.
Jonglei Inadequate skills and knowledge at the state and county levels due to lack of training.
Lakes Many officers seconded to national or international NGOs in the State in order to reduce the payment of salaries to officers.
Current officers do not have adequate skills due to political recruitment.
Inadequate number of officers in counties
Upper Nile Inadequate number of officers assigned to counties or assigned officers not taking his/her post due to severe conditions at the county level.
Inadequately skilled officers due to the lack of training.
Inadequate number of professional agriculture/livestock officers with appropriate educational background.
Interference by political leaders in the process of recruitment.
Unity Inadequate skills and knowledge due to lack of training.
Warrap Lack of skilled officers at the state and county levels, e.g., no officers with a background in plant protection, mechanization, horticulture, research or agronomy.
No training provided by the state ministry.
Northern Bahr el Ghazal
Limited number of officers in state ministries and more than half are aged over 60.
Lack of skilled officers at the state and county levels.
99
New graduates after university or college are recruited at grade 9 after joining the ministry.

5-17
State Challenges
Western Bahr el Ghazal
Lack of skilled officers at the state and country levels
Many officers seconded to national or international NGOs in the State in order to reduce the payment of salaries to officers.
Source: Interviews with state officers
No state had an M&E system in operation to provide evidence of the effectiveness of government programming. The lack of an effective M&E system is also a contributing factor to the lack of coordination between state/county governments and NGOs working in the state/county. In many cases, NGOs are operating without regard to the local government plans or priorities. When speaking of coordination, many interviewees stated that there was a lack of communication, information sharing and coordination throughout the hierarchy of the national ministries: to/from the state ministries, to/from the county offices, to/from the payam offices. Other issues mentioned by interviewees in the states, counties and payams, that hinder the proper delivery of services to the public include: lack of skills in the communities to fabricate basic parts such as ox ploughshares; uncontrolled roaming of livestock herds; lack of access to some productive areas; inter-tribal conflict; and political interference.
5.2.2.3 Human resources development at state ministries and county offices
It can be seen from the discussion in subsection 5.2.2.2 above, that little human resources development, particularly training, is taking place for the government officers at the state ministries and county offices. In addition, the austerity budget has reduced funds available for training and professional development through the state and county budgets. Most training, that has recently taken place, has been provided by NGOs operating in the vicinity of a state or county. Interviewees indicated that the lack of training was the greatest contributor to inadequate skills and knowledge of government officers at the state and county levels. There are no new-staff orientation programmes being delivered at the states or counties.
5.3 Private sector organizations
5.3.1 Farmers organizations
In some areas of South Sudan there was a tradition of farmers forming groups for land preparation and harvesting, but in many communities affected by the civil war, traditional social relationships have broken down, making such cooperation more challenging. Group formation and cooperation provides an important base to develop more commercially oriented farmer associations and cooperatives. Much work has been done by NGOs to form farmer associations, groups and cooperatives, but these groups have received little training on moving from subsistence farming to farming as a commercial business. Building the capacity of these groups to move towards a more commercial approach will require several years.
5.3.2 Agro-input dealers
Fertilizers and pesticides are rarely used and soil fertility is maintained by applying manure or leaving land fallow for some years.100 As part of their joint commitment to promote food security, USAID, the Netherlands, International Fertilizer Development Centre (IFDC) and Alliance for a Green Revolution for Africa (AGRA), agreed to provide agricultural inputs through commercial agro-input dealers.
100
According to an IFDC staff-member, interviewed by CAMP team, Dec 6, as part of CAMP Situation Analysis,
fertilizer use in South Sudan is virtually non-existent.

5-18
IFDC and AGRA are supporting the Seeds for Development programme, which provides seeds to agro-input dealers. The programme is currently funded by USAID through AGRA. In South Sudan, there is no formal body responsible for quality checks on the seeds being produced locally or imported. Both the government and DPs lack capacity to supervise and control seed quality. Additionally, there is no seed processing facility for grading, seed treatment (addition of a coating to reduce disease and protect against pests), and packing seeds. Most seed growers only clean and sort their seeds. In the absence of a reliable source of seeds, farmers often buy food grains to be used as seeds as it is difficult to distinguish between seeds and food grains in the market. In general, farmers prefer to use local varieties, while modern high-yielding varieties are introduced almost exclusively through emergency seed distributions and from imports in border areas.
Although the agro-input business is only just beginning, some forward looking private companies are assisting farmers to increase their productivity and incomes by educating them about the benefits of high quality seeds and modern fertilizer technologies and training them in their proper use. Some private companies have taken the initiative to broadcast educational radio programmes on crop cultivation and soil management.
5.3.3 Processors and traders
Historically, until independence the food trade was dominated by Arab traders and most traders obtained loans from financial institutions based in Sudan. However, after independence, Uganda has been South Sudan’s largest trading partner for imports. The new market system in South Sudan is dominated by the private sector; trade is driven by the individual trader’s desire to make a profit. Distribution channels from seller to buyer of agricultural products are not well defined neither is the role of the different stakeholders; the same people often fulfil the role of middleman, transporter, wholesaler, retailer, importer and exporter simultaneously. Traders play a critical role in facilitating the regular, year-round supply of major commodities which are sourced in Uganda and the major production areas in South Sudan. The cross-border traders are concentrated in major urban markets, particularly in Juba. They are predominantly Ugandans living in South Sudan who have good business connections enabling them to source produce from markets in Uganda. They can use large-capacity trucks which can import more produce and minimize overall costs. The main transaction costs for traders are for searching, assembling and purchasing produce and then moving the produce to markets in South Sudan. The perishable imported commodities are mainly bananas, white or Irish potatoes and onions. The volume of cross-border trade is not readily available, but the CAMP Task Team saw substantial imports of maize and cassava flour from Uganda, packed in different sizes and ready for consumption, in trucks in various markets. During harvest periods, the traders buy from farmers in Uganda and transport the produce in trucks across the border to markets in South Sudan; the retailers and consumers buy directly from the trucks. The Chamber of Commerce, Industry and Agriculture (CCIA) is currently the only business organisation of national importance. It was established in 2009 and still does not fulfil all the functions required of a Chamber of Commerce. Membership is not mandatory and few processors and traders have joined. However, in the main market in Juba, the traders have formed a branch which is active in voicing their needs.

5-19
5.3.4 Financial institutions
5.3.4.1 Providers of financial services
(1) Finance to agriculture before Independence101
Many banks neglected agriculture because of farmers’ lack of liquid assets and property to be used as collateral, the risky nature of their business such as drought or floods, the volatile prices of agricultural products, the shortage of farmers’ business skills and few loan applications. It is estimated that not more than 1% of loans went to agricultural businesses. Before independence in 2011, the main source of specialized credits for agriculture was the Agricultural Bank of Sudan (ABS). It was established by the then Sudanese Government. Approximately three quarters of the total ABS funds were provided for large scale farmers cultivating farms of 1,000-1,500 feddans in the areas demarcated under the Mechanised Farming Cooperation. Most of the remaining ABS funds went to irrigated agriculture and only a small part, 6-7%, to rain-fed agriculture. ABS estimated that its credits covered only 3% of the “rain-fed” farmers’ financial needs, compared to 20 and 50 % of the irrigated and mechanized farmers’ needs. (2) Providers of financial services
In South Sudan, there is no direct finance, where individual or institutional investors directly invest in businesses through instruments such as stocks or bonds. All finance is indirect; financial institutions collect customer deposits and lend or make an investment with the customers’ money. There are both formal and informal financial institutions. Currently, formal financial institutions involved in agriculture consist of commercial banks, the Agricultural Bank of South Sudan (ABSS) and microfinance institutions. The commercial banks, the largest loan lenders, are dominated by foreign owned banks. ABSS is the only source of specialised finance for agriculture. There are several microfinance institutions, some founded by NGOs. The institutions founded by NGOs were donor initiated; they have demonstrated that success can be achieved in rural areas, but that sustainable operations require sound management and banking practices. Additionally there are many informal financial institutions and arrangements, e.g. traders, moneylenders and families, which provide financial services to individual households. They are often the only source of financial services in the most geographically isolated areas. These informal arrangements are mainly built on trust, social and family relations. These informal institutions function among people who know each other and this knowledge is used to screen the transactions and to enforce informal agreements. Financial services provided by the above suppliers are summarised in Table 5-18.
Table 5-18: Financial services by formal and informal providers
Suppliers Financial services provided
Formal financial providers
Commercial Banks Deposit facilities (current accounts, saving accounts)
Business financing (letters of credit, guarantees)
Remittances (local, international)
International banking
Foreign currency exchange
Loans and advances
101
Craig, G. M., ed. 1991. The Agriculture of the Sudan. New York: Oxford University Press. pp. 117-120.

5-20
Suppliers Financial services provided
Business loan: loans to fund capital requirements for business Development loan: loans to help pay for personal or business development projects Educational loan: loans to help pay for further education Agricultural loan: loans that enable farmers to buy farm inputs until they can sell crops (Large loans for commodity processing firms, trading companies. A few loans for individual large farmers)
Use of warehouse receipts, bonded warehouses, chattel and real estate mortgages, third party guarantees.
Leasing of vehicles and equipment.
Checking, savings and deposit services for firms and households in rural towns.
Saving services for saving groups and richer farm households in close proximity to bank branches.
Banking service for NGOs
Agricultural Bank of South Sudan (ABSS)
Banking: receiving deposits, money transfers and establishing correspondence and others
Short term lending: maturity does not exceed 15 months
Long term lending: maturity is from 15 months to 5 years
Procurement of agricultural machinery (tractors, accessories), inputs (improved seeds, jute bags, fertilizers) and provision of cash loans for microfinance to support smallholder farmers
Provision of credit for the above machinery, inputs and others (farmers will pay in instalments)
NGOs Small group guaranteed and individual loans largely granted to small-scale traders in urban areas.
Compulsory savings for borrowers.
Experimental insurance linked to loans and remittance services.
Financial services linked with other development activities.
Small loans and savings services for farmers, rural traders, and non-farm businesses and households in rural towns and villages
Informal financial providers
Processing companies, traders, input suppliers,
In-kind loans and suppliers’ credits for buyers, sellers and farmers throughout the production/ marketing chain.
Moneylenders Loans to any rural or urban business or household needing quickly disbursed, emergency or business loans.
Holds small amounts of savings for others
Family and friends Loans for emergencies and start-up of business activities.
Source: Financial Institutions, interviewed by CAMP team, February-March 2013 and September 2013, CAMP Situation Analysis
(3) Formal financial institutions in South Sudan
Formal financial institutions could play an important role in the development of agriculture through offering loans and investments. These institutions are summarised in Table 5-19.
Table 5-19: Formal financial institutions in South Sudan
Institution Type of Company,
staff
Type of Business Number of active
borrowers Coverage
Remarks
KCB Bank South Sudan Ltd.
Company limited by shares
100 % subsidiary of KCB group
400 staff
Established in 2005 20 branches including Juba, Bentiu, Rumbek, Yei, Yambio. Bor, Torit, Wau, Kuajok
Planning to open 20 new branches.
Equity Bank South Sudan
Company limited by shares
100% subsidiary of the Equity Bank Group
300 staff
Established in 2008
Loans, foreign currency exchange
Value chain partnership with GIZ
3509 people (2011)
Wau, Yambio, Wau, Nimule, Kaya
Buffalo Bank Less than 100 Established in 3 branches: 2 in

5-21
Institution Type of Company,
staff
Type of Business Number of active
borrowers Coverage
Remarks
employees 2008 Juba, 1 in Wau
Nile Commercial Bank
50-60 staff Established in 2003
Started to offer loans in 2006-8
10 branches (one in each State)
Some borrowers defaulted. Currently under government supervision
Agricultural Bank of South Sudan
Government owned
100 staff
Established in 2013
the source of institutionalized finance for agriculture
4 branches: Juba, Wau, Malakal, and Renk
Planning to open in Bentiu, Awell and Yambio
Cooperative Bank of South Sudan
Company limited by Shares
120 staff
Planning to start business in 2013
Juba, etc.
120 staff: 52 staff in head office/ main branch, 68 staff under training in Kenya (Sept. 2013)
Bangladesh Rural Advancement Committee (BRAC) South Sudan
NGO (locally incorporated INGO)
Major microfinance institution
Expanding exponentially since establishment in 2007
3389 people (2011)
Upper Nile
Jonglei
Lakes
Warrap
Eastern Equatoria
Central Equatoria
Western Equatoria
Sudan Microfinance Institution
Company limited by guarantee
Major microfinance institution
Established in 2003
8489 people (2011)
Lakes
Western Equatoria
Finance Sudan Limited
Company limited by guarantee
Established in 2006
5623 people (2011)
Upper Nile
Central Equatoria
Amurt South Sudan
Program of locally incorporated INGO
Number was unidentified
Established in 2006
Northern Bahr el Ghazal
Aweil East
Mundri Relief and Development Association (MRDA)
Program of MRDA Unidentified Western Equatoria
Rural Finance Initiative
Company limited by shares
Unidentified Central Equatoria
Source: Financial Institutions, interviewed by CAMP team, Feb-March 2013, CAMP Situation Analysis.
5.3.4.2 Financial practices by formal financial institutions
(1) Financial size of formal financial institutions
The commercial banks have an enormous potential for financing agriculture in terms of loan amounts. Current annual new loans by all commercial banks are estimated to be approximately SSP2,000 million. Less than 1%, SSP20 million, goes to agriculture. Among the commercial banks, seven offer loans. The remaining banks mainly deal with the foreign currency exchange business which generates a substantial profit, as will be mentioned later.

5-22
KCB South Sudan 102 finances one half of loans, SSP1,000 million, and the remaining 6 banks, such as Equity Bank and Buffalo Commercial Bank, the other half. They offer loans at annual interest rates of 15-20% with a maximum maturity of 3 years, while their annual customer deposit rates are 1-2%. These commercial banks enjoy a substantial profit (14-19%) from the spread between lending and deposit rates. Not all banks have been successful.
ABSS offers short-term (less than 15 months) and long-term (between 15 months and 5 years) loans at annual interest rates of 1.5% and 2.5%. The main loan applicants are agribusiness companies and cooperatives. However, ABSS has never made any loan due to a lack of government budget. It is waiting for its first capital, SSP250 million, from the government. (2) Limited finance to agriculture
There are limited loan applications to the commercial banks from agribusiness. Equity Bank receives 80-100 loan applications every year, totalling approximately SSP120 million. The bank usually authorises one half, SSP60 million. Applicants are mainly companies involved in commercial activities. Only one or two are agribusiness companies. From January to September 2013, 38 companies applied to the Buffalo Bank for loans totalling SSP35 million. Applicants were primarily importers, hotels and guesthouses. Similarly KCB received limited loan applications from agribusiness, only 1% of applicants. In 2013, there were 36 applications to ABSS, for loans totalling SSP100 million. Applicants included companies, co-operatives and individual farmers; 80% of these companies were agribusiness companies, involved in cultivation, seed selling and production. Since these companies cannot afford loans at the higher rates charged by commercial banks, they apply for loans at ABSS. However, ABSS has not yet made any loans.
Table 5-20: Annual loan interest rates, loan applicants and authorized loans
Annual loan interest rates and lending
duration
Number of loan
applicants in 2013
Loan application amount in
2013
Portion of Agribusiness
(number of loan applications)
Authorized loans
KCB South Sudan Ltd.
15%, max. 3 years 1% SSP1,000 million
Equity Bank South Sudan
18%, max. 3 years 80-100 SSP120 million
0.5% SSP60 million
Buffalo Commercial Bank
18%, max. 1 year 38 SSP35 million
1.0% SSP19 million
All commercial banks total
1% (estimate) SSP2,000 million (estimate)
ABSS 1.5% (less than 15 months), 2.5% (more than 15month-5 years)
36 SSP100 million
80% Zero
Source: Financial Institutions, interviewed by CAMP team, Sep.-Oct. 2013, CAMP Situation Analysis.
(3) Customer deposits
The absence of direct financial markets is to the advantage of the commercial banks. The banks obtain customer deposits at lower rates and lend them at higher rates. Current bank deposit rates are approximately 1-2% per annum. The main depositors are managers of private companies. They tend to open current accounts which do not earn any interest,
102
KCB Bank Ltd, the parent company of KCB Bank South Sudan Ltd, was renamed from Kenya Commercial
Bank in 2003. (http://ke.kcbbankgroup.com/about/history/)

5-23
rather than saving accounts which generate interest. Their businesses are so profitable that they do not need to earn such low rates of interest103. They use their current accounts to pay suppliers and salaries. (4) Foreign currency exchange
The Bank of South Sudan allocates US dollars from oil revenues for foreign currency exchange to each bank. For example, a commercial bank can currently withdraw, from the Central Bank, USD300,000 every week, at the official exchange rate of 2.96 SSP/USD with a 2% fee. The commercial bank spends SSP905,760 and sells the USD300,000 to their customers at 3.16 SSP/USD to obtain SSP948,000. The margin is: SSP948,000 - 905,760 = SSP42,240 (42,240/948,000=4.5%). As mentioned before, some commercial banks mainly deal with the foreign currency exchange business to obtain a substantial profit. (5) Credit analysis
Loan applicants have to provide: registration certificates of incorporation, import and export licenses, tax identification numbers, tax clearance, collateral, financial reports including balance sheets and income statements. The bank conducts a credit analysis by: evaluation of character of the loan applicants, their ability to pay, management ability, collateral value and financial reports. KCB will only take owned land with land title as collateral. Community land farmed by most subsistence farmers has no land title and so cannot be used as collateral. If a commercial bank requests lawyers to register collateral, it takes only one or two days. They would, however, charge 2% of the asset value. The bank registers the collaterals themselves which takes a week. This takes four or five visits to the registration office. The total registration expenses would be less than SSP1,000, including any bribe, which is less than lawyers charge.
Box 5-3: Case study - Equity Bank: successful management of a foreign-own commercial bank
Overview of the Equity Bank: establishment
Equity Bank was first incorporated in 1984 in Kenya, later transformed into a microfinance institution and eventually into a commercial bank. In 2008, the bank obtained regulatory approval to open a subsidiary in South Sudan. In addition to the Juba head office, the bank now maintains a network of 5 branches across the country (Yei, Yambio, Wau, Kaya and Nimule). Financial analysis of Equity Bank
In financial analysis, the rate of return on assets (ROA) and rate of return on equity (ROE) are often used to evaluate profit ratios of the firm’s assets and equity. The Equity Bank Group operates in Kenya, South Sudan, Rwanda, Tanzania and Uganda. The consolidated financial reports of the Equity Bank Group show why it is very profitable for foreign-owned banks to operate subsidiary banks in South Sudan.
103
A credit officer of a commercial bank, interviewed by CAMP team, Sep.-Oct. 2013, CAMP Situation Analysis

5-24
Figure 5-1: The Equity Bank, Consolidated Income statement and Balance Sheet
Source: the Equity Bank, Oct. 2013.
Financial analysis shows: 1) The rate of return on assets (ROA) is:
9,311+1,828 / 115,200 = 9.669%. and the ROE after taxes is:
7,554 / 25,822 = 29.254%. On average, private equity funds, targeting investment in Africa, posted an 11.2% annualized return for the 10 years ending September 30, 2012.104 Thus, the Equity Bank ROE after taxes of 29% is extremely high. 2) In Juba, the bank can obtain deposits at 1-2 % per annum and lend at 18%. The average interest income ratio for all Equity Bank assets, including loans/ bonds/ stocks, is 11.815% (12,885/115,200). It is much more profitable to lend in Juba which is an incentive for foreign-owned banks to open subsidiary banks in South Sudan. 3) In Juba, the bank can earn a substantial profit from the foreign currency exchange business because of the oil revenues. This is another incentive for a foreign-owned bank to operate in South Sudan. Considering all these incentives, a bank would not be interested in business offering lower returns.
Box 5-4: Case study - Nile Commercial Bank: unsuccessful management of a commercial bank
Nile Commercial Bank is an example of unsuccessful management in a commercial bank due to poor credit analysis. Nile Commercial Bank was established in 2003. The bank has currently 50-60 staff and 10 branches, one in each state. After the Comprehensive Pease Agreement (CPA) in 2005, the bank started to operate. The interest rate was 20%. Loan duration was a maximum of 48 months. In April 2009, it was reported that the bank had ran out of cash, as a result of defaults made by GoSS officials105 and the bank was temporarily closed. The bank received a capital injection of SDG102 million106 by GoSS. Since then, the
104
www.avca-africa.org/product/new-benchmark-for-african 105
http://www.sudantribune.com/spip.php?article30971 106
http://en.wikipedia.org/wiki/Nile_Commercial_Bank
unit: million Kenyan shilling
Income statement Jan.-Dec. 2010 Jan.-Dec. 2009 Balance sheetDec.31,
2010
Dec.31,
2009
Average
balanceInterest incomes Total assets 133,889 96,511 115,200
Loan and advances 10,497 8,286Others 2,388 1,405 Liability
Interest incomes total 12,885 9,691 customer deposit 95,203 65,824 80,514
Interest expenses Others 10,379 7,350
Customer deposit 1,270 675 Liability total 105,582 73,174 89,378
Others 558 738
Interest expenses total 1,828 1,413 Shareholders' fund 1,851 1,851
Retained earning 11,940 7,394
Net interest incomes 11,057 8,278 Others 14,516 14,092
Shareholders' fund total 28,307 23,337 25,822
Other operating incomes 9,137 5,995
Other operating expenses 10,883 8,704 Liability and Shareholders' fund 133,889 96,511 115,200
Profit or loss before taxes 9,311 5,569
Profit or loss after taxes 7,554 4,563

5-25
bank has not given any new loans. The loan assets are valued at approximately SSP30 million, including SSP6 million of non-performing loans (NPL).
Box 5-5: Case study - Agricultural Bank of South Sudan: government-owned bank to provide specialised finance to agriculture
Overview of ABSS
On 6 June 2012, the President of GRSS issued provisional order no/25 to stipulate ABSS’s roles for agricultural development:
1. Provision of necessary technical and financial services for agricultural development 2. Promotion, development and implementation of the agricultural sector of South Sudan 3. Alleviation of poverty and attainment of the Millennium Development Goals in relation to agriculture 4. Encouragement of cooperatives societies within the agricultural sector 5. Offering other services associated with current deposits and investment deposits 6. Promotion of agricultural activities that can contribute effectively towards the achievement of food security in South Sudan 7. Increasing productivity, production and raising the standard of small producers 8. Supporting family income generating activities and rural women activities as being principle cases for rural development and poverty reduction 9. Realisation of financial independence 10. Promotion of agricultural activities from hand tools to mechanized ones The ABSS has currently 100 staff and four branches, Juba, Wau, Malakal, and Renk. The ABSS will move to counties and payams, making villages the places for distribution of bank services to the residents. In addition, the ABSS plans to build big silos in state capitals and to open new branches in Bentiu, Awell, and Yambio. The ABSS has an authorized capital of SSP500 million. The bank is waiting for the first paid-in-capital, SSP250 million, from the government. In the future, another SSP250 million will be coming. Actual practices
1) Procurement and selling of agricultural machinery In 2010, the Agricultural Bank of Sudan (ABS) procured 110 sets of tractors and their accessories and distributed 44 sets to Greater Equatoria, 33 sets to Greater Bahr el Ghazal, and 33 sets to Greater Upper Nile (SDG84,000 x 110 = SDG9.24 million ). They also purchased 150 water pumps and distributed 100 to the Juba branch, 25 to the Malakal and Renk branches and 25 to the Wau branch (SDG2,700 x 150 = SDG0.4 million ). Farmers had to pay for these tractors and pumps in instalments with 2% interest annually. In addition, the ABS provided cash loans totalling SDG11 million for microfinance. However, the ABSS has not yet distributed any agricultural machinery. 2) Collateral ABSS accepts as collateral:
a) Real estate (buildings) which is registered under land laws b) Movable assets c) Irrevocable letters of guarantee d) Personal guarantees e) Letters of guarantee.
As community land has no land title many smallholder farmers cannot offer any collateral. The then ABS had attempted to reach these farmers by various other arrangements, through

5-26
co-operatives, farmers’ unions, local councils, village councils and farmers’ groups.107 ABSS is continuing this practice. Issues
ABSS faces lack of funds, weak marketing techniques and lack of infrastructure.
Box 5-6: Case study - Co-operative bank of South Sudan: a newly established bank to assist co-operatives and farmers
Overview of the Co-operative Bank of South Sudan
The Co-operative Bank of South Sudan is a member of the Co-operative Bank Group, headquartered in Nairobi with subsidiaries in Kenya and South Sudan. The bank is a commercial bank licensed to operate in South Sudan. However, they have not started their banking business yet (as of September 2013). The bank has its roots in the cooperative movement in Kenya and was established in 1965 by agricultural cooperative marketing societies. Over the last 15 years, the bank has been transformed into a strong international bank providing services to all market segments including the public sector, small and medium enterprises (SMEs), and cooperative sectors. In South Sudan, the bank will provide banking services to individuals and to SMEs, as well as large corporate customers. It will support cooperative societies and credit unions, where farmers can access funds.
Capital and shareholders
The current capital is USD30 million: USD15.3 million, 51% share by the Co-operative Bank of Kenya and USD14.7 million, 49% share by GRSS. In the future, the bank will take over the 49% share of the GRSS and sell it to farmers. In addition, the bank will sell 10% of their share to farmers. The farmers will then have a 59% share and become the majority shareholders. New branch plans
The bank intends to open 4 branches before the third quarter of 2014 in Juba Town. Later, 15 branches will open in all state capitals; then, the bank will expand its business to major county towns.
5.3.4.3 Constraints on finance to agriculture
People interviewed saw the following as constraints on finance to agriculture: (1) Unstable rates of return on agribusiness
There are limited loan applications to the commercial banks from agribusiness because many agribusinesses cannot always achieve high rates of return on their investment. They are not necessarily able to pay the high rates of interest charged on loans due to the risky nature of agricultural production, volatile prices of agricultural products and lack of infrastructure. It is essential to ensure an increase in the productivity of agribusiness by an integrated strategy of transforming the existing agriculture in terms of infrastructure, marketing, finance and technology. (2) Non-advisability of regulatory measures for commercial banks108
107
Craig, G. M. ed. 1991. The Agriculture of the Sudan. New York: Oxford University Press. p. 121-122. 108
Craig, G. M., ed. 1991. The Agriculture of the Sudan. New York: Oxford University Press. pp. 117-120.
5-27
Most foreign-owned commercial banks would not be interested in business offering lower returns, such as agriculture. It would not be advisable to enact regulatory measures promoting loans to agribusiness, such as obligations to supply loans at lower interest rates, to earmark a specific percentage of credits for agriculture, or to open branches in rural areas. (3) ABSS fund and management capacity shortage
ABSS could play an important role in finance to agriculture, because ABSS is the only source of specialised finance for agriculture, offering soft loans. However, ABSS has not made any loans due to lack of government funding. In addition, ABSS staff does not enough management capacity, such as accounting and marketing. 109 (4) Limitation of using land as loan collateral
Ownership of land is problematic in South Sudan, with regard to land title, registration, transfers, security of tenure and others. This problem is especially serious for agriculture. Currently policy and legal frameworks for land rights are still being drafted. These will include clear land title and facilitate the seizure and liquidation of land pledged as collateral for loans.
5.4 Greater Juba market in the context of regional integration
5.4.1 Regional market integration
It is a general trend worldwide that countries in close proximity to each other and with similar economic conditions and needs are merging into regional trade blocs. The reasons for this vary with the countries and blocs, but members normally seek to gain political and economic benefits. These blocs provide access to a wider and larger market, offering possibilities of diversification in production, processing and marketing for members. As a result, market participants are able to increase their business opportunities. Since independence, South Sudan has made efforts to participate in the global economy involving various commodities. Easy travel between countries, formation of personal relationships, regional agreements and treaties have strengthened relationships with neighboring countries. Significant market opportunities for agricultural commodities exist both within South Sudan and in neighboring countries. The East African Community (EAC) is a market of 130 million people with a GDP of USD75 billion. East African countries are already responsible for 80% of South Sudan’s trade, and merchants from Uganda and Kenya have been coming to Juba in large numbers. Juba can assist in strengthening regional integration, which will help local and foreign companies participate in the regional economy.
5.4.2 Overview of Juba market
Juba is the capital and largest city of South Sudan. It also serves as the capital of Central Equatoria State (CES). It is comprised of three of the 16 payams of Juba County: Juba, Kator and Munuki. The border of the city is not clearly defined; the city has expanded into the surrounding rural payams of Northern Bari and Rajaf. Population density tends to be much higher in undemarcated areas than in the demarcated areas in Juba and Kator payams in the town centre. The urbanized area of Juba (Greater Juba110) is estimated to be approximately 52 km2. Juba is the showcase of South Sudan’s economic, political and social transformation.
109
A manager of ABSS, interviewed by CAMP team, Sep.-Oct. 2013, CAMP Situation Analysis 110
Ellen Martin and Irina Mosel. 2011. City limits: urbanisation and vulnerability in Sudan, Juba case study. UK
aid and ODI.

5-28
Although there are no exact population figures for Juba, Juba’s expansion has accelerated since the CPA. The NBS estimated it to be 230,195 in 2009; the Ministry of Physical Infrastructure was working on the basis of a population figure of between 500,000 and 600,000 in 2010. During the civil war, Juba was considered to be the only secure town within Central Equatoria State, making it a refuge for IDPs from other parts of the country as well as for people fleeing neighbouring countries. IDPs were organised into camps according to ethnicity and allowed to settle temporarily on the land of people who had fled Juba, with the understanding that they would have to leave once the original owners came back. After the CPA, Juba continued to attract large numbers of people such as returnees, former IDPs, and foreigners from neighbouring countries in search of better livelihoods and economic opportunities. The presence of economic opportunities, as well as an increasing number of private businesses, attracts many people to Juba in search of employment. The opening of regional roads, especially the Juba-Nimule road, and the resulting boost in trade meant that many foreigners, mainly but not exclusively from neighbouring countries, are also moving to Juba to take advantage of the more promising business environment. Whereas jobs in Uganda and Kenya are often difficult to get and remuneration is low, in Juba many are able to find work in the expanding trade and retail business, especially in the section of agricultural commodities. Collectively the markets in Juba are the largest in South Sudan, and are referred to in this report as the Juba market. The larger markets in Juba include Konyokonyo, Custom, Jebel, Munuki and Gudele which were part of the Juba market survey. There are many smaller markets. Juba market plays a role in both the:
East African regional market (long value chain with high value added, international value transfer in the region)
South Sudan domestic market (rural-urban, medium value chain with medium value added, local value transfer within South Sudan).
It is an urban market that provides a variety of agricultural products as well as non-agricultural commodities. As Juba market is part of the East African regional market, its merchants commonly collect commodities from all over East Africa.
5.4.3 Functions of Juba market
Juba market collects products from all main production areas, both inside and outside South Sudan, to be sold in Juba. Poor infrastructure is currently limiting such transactions. Most products coming from Uganda are traded via Juba even when they are consumed in areas other than Juba, which emphasises the importance of Juba as a waypoint in the East African regional market. This regional market is dominated by large scale actors working with small and medium traders. Juba market is, in economic terms, a large market where the major actors are mostly engaged in non-farm occupations, in the government and commercial sectors. Juba market receives imported consumable goods from neighbouring countries and distributes them to smaller markets all over South Sudan. It is also a centre for pooling and bulking. The volume of commodities arriving in Konyokonyo market is significantly larger than those in the other markets. The supply at Juba market is more stable than at markets in other South Sudanese towns, even though temporary shortages of commodities may occur during the year. Producers may come to the markets to sell their products but most trade is run by professional traders who collect commodities from both inside and outside South Sudan (either at the farm gates or at collection points). The markets surveyed are relatively well

5-29
organised and regulated, and the traders must register at the payam to be granted permission to trade at the market. The large-scale traders sell various kinds of products including staple foods and vegetables from different regions. They travel far to get products and hire other people to attend their business while they go to buy products. For example, in the Konyokonyo market, vegetable wholesalers’ turnover varies from SSP300 to SSP2,000 per day 111 . The large-scale wholesalers buy from known producers and are often able to get credit from the producers based on their long term working relationships. The medium- and small-scale wholesalers buy their products mainly from the large scale traders or local producers and trade quite a limited number of goods. They are more vulnerable to price fluctuations than the large-scale traders due to lack of capital to absorb a minor decrease in revenue. Usually wholesalers perform their activities individually because they are unable to identify common objectives and instruments. The scale of their activities is only a few products, such as maize flour, beans, rice and vegetables. Payment for transactions in the Juba market is in most cases immediate and cash, for traders as well as wholesalers and retailers. They are paid within a day after a transaction. The majority of domestic traders report paying immediately for transactions. Agricultural trading in Juba is largely in cash, with almost none of the transactions settled by checks or alternative means of payment. The cross-border trader plays a critical role in facilitating a regular, year-round supply of major commodities sourced in Uganda. The main transaction costs entailed at this level include searching, assembling, purchasing and moving goods to the respective markets in Juba and neighbouring markets. Searching and assembling extend beyond the markets in Kampala and reach major production areas in Uganda. They commonly deal with perishable commodities and cereals, mainly bananas, Irish potatoes, onions, and maize and cassava flour. The volume and type of agricultural border trade is not readily available on the South Sudan side, but substantial imports of maize and cassava flour from Uganda, packed in different sizes and ready for consumption, are apparent. According to interviews with traders, imports for the army alone are 10,000-15,000 tons annually. During the harvest periods of commodities, they buy from farmers and transport them across the border to the markets in Juba. The trucks, loaded with commodities, arrive and are positioned at designated places from where the retailers and consumers can buy. Large-capacity trucks are particularly important for large-scale traders to transport stock as well as to minimize transaction costs. Because of the long distance travelled, large-scale traders commonly procure large volumes of commodities per trip as a way of minimizing transaction costs. The flows to the markets in Juba entail large volumes of food commodities per procurement trip. Shipment by road involves large-capacity trucks ranging from 8 to 50 metric tons. Off-loading the trucks, as well as into-store delivery of the loads, is done manually. This demands heavy labour that is provided by porters. The off-loaders/porters are well-organised and have substantial control over off-loading and porterage services, as well as substantial bargaining status. They set service fees and organise offloading of all trucks arriving in the markets with goods. Their conduct is such that a trader cannot make off-loading arrangements independent of the organised porters.
111
In the Konyokonyo market, there are around 40 traders who deal with vegetables. About 90% are of Ugandan
nationality. Wholesalers. April to June 2013. Interviewed by CAMP team, Kyonokonyo Market. CAMP Situation Analysis.

5-30
At least in the Konyokonyo market, traders, porters, and retailers set up a committee to manage the market. The county owns the markets and collects fees from traders for use of the market.
5.4.4 Market arrivals
With the exception of locally grown fresh vegetables, some crops and livestock, the Juba market, particularly Konyokonyo, Custom and Jebel, is heavily dependent on imports as shown in Table 5-21. The merchants interviewed generally identified Kampala as their major source of supply, with less seasonal variation compared with domestic supply. Procurement from Kampala accounts for the bulk of maize flour, wheat flour, sorghum, rice, Irish potatoes and onions. This flow of goods to Juba from Kampala is part of the larger volume of cross-border trade which is well organised for its scale and impacts regional economic development. The monthly incoming volume to Juba has been partially recorded by the Directorate of Commerce and Supply, Central Equatoria State since 2011, as presented in Table 5-22.
Table 5-21: Major Commodities traded in Juba markets and their major origin
Commodities Origin
Konyokonyo Market Custom Market Jebel Market
Sorghum Uganda, Renk Uganda Uganda Maize grain and Maize flour Uganda Uganda Uganda Rice Uganda Uganda Uganda Wheat flour Uganda Uganda Uganda Groundnuts Terekeka Terekeka Terekeka Sesame Uganda Uganda Uganda Cassava flour Uganda Uganda Uganda Okura Rajaf, Yei Rajaf Rajaf Beef Uganda, Kapoeta Uganda, Bor, Jonglei Uganda Goat meat Uganda Uganda Uganda Chicken Uganda Uganda Uganda Milk Uganda, Juba Uganda Juba Egg Uganda Uganda Uganda Fresh fish Bor, Uganda Bor, Uganda Uganda Dried/ Smoked fish Jonglei, Lakes, Unity Terekeka Terekeka Charcoal Terekeka, Yei Lainya Lainya Soft timber 2*3m - Uganda, DRC Uganda, DRC Hard mahogany (Timber) 2*6m - DRC, Uganda DRC, Uganda Teak pole Yei Yei Yei Bamboos Uganda Uganda Uganda
Source: CAMP Market Survey, Directorate of Commerce and Supply, CES, Monthly report on wholesale and retail prices
Table 5-22: Monthly incoming commodities to Juba in 2011 (tonnes)
2011
Items Jan Feb Mar Apr May Jun Jul Aug Sep Oct Nov Dec Total
W/flour 605 1,176 850 563 285 367 862 1,069 260 - - 155 6,191
Sorghum - 75 56 50 220 137 197 1 2 17 10 30 795
M/flour 984 1,076 207 900 21,048 1,413 1,733 3,791 26 - - - 31,177
M/grain 39 32 75 53 497 - - 5 1 - - - 702
Cas/flour 173 19 19 35 9 25 32 7 17 - - - 337
Rice 25 283 329 256 192 286 253 723 - - 3 28 2,376
G/Nut 103 271 388 323 226 7 133 5 6 3 549 - 2,014
Beans 17 8 2,539 221 203 67 133 74 - - - - 3,262
Charcoal 218 428 432 421 49 651 597 1025 1932 168 122 976 7,017

5-31
Source: CAMP Market Survey, Directorate of Commerce and Supply, CES, Monthly report on wholesale and retail prices
The incoming volume of agricultural commodities to the Juba market fluctuates from month to month. The incoming volume tends to decrease in October and November. In 2011, maize flour was the biggest in volume (31,177 tonnes), followed by wheat flour (6,191 tonnes). As estimated by CAMP, the volume of imports accounts for over 80% of the agricultural commodity trade, implying a decidedly one-way trade to South Sudan. There is great potential for replacing imported agricultural commodities with domestic products in the Juba market, especially if transport and transaction costs of domestic products are equal to or lower than those of imported products. The market situation of major commodities by subsector is described below.
i. Crops Major staple crops, including a variety of cereals, pulses, vegetables and processed products, can be seen in all the markets in Juba. Cereals are the most important crops and the staple element in the diet of the South Sudanese. The principal cereals are maize, sorghum, millet and rice. Pulses are the second most important staple food and a principal protein source. The consumption of vegetables and fruits is relatively limited, largely because of their high costs. Common vegetables include tomatoes, okra, onions, jew’s mallow and cabbage. Konyokonyo market is the largest agricultural market selling to consumers in Juba; the supply is more reliable here than that at other markets in Juba. The CAMP market survey112 estimated that the total volume of Irish potatoes and onions brought from Uganda to the Konyokonyo market in September 2013 was approximately 3,840 tonnes, which was then transported by road to all the markets in Juba and other areas. There are around 80 cereal traders in the Konyokonyo market; on average 1,920 tonnes of cereal were brought from Uganda to Konyokonyo every week in September 2013 for similar onward distribution. However, demand is not stable and very different by season. According to the traders interviewed in the Konyokonyo market, their main strategy is to move a higher volume faster from Uganda rather than to sell at higher prices and gain larger profit margins. In the market, traders supply cereal year round which is enough to meet the demand of Juba and the other major cities of the country. A large amount of green leafy vegetables is not imported into the Juba market from other countries. Since leafy vegetables are highly perishable, farmers sell them by themselves at smaller markets. Increased demand for vegetables has stimulated horticulture farming around the main urban areas, in places such as Rajaf and Jebel Lado
ii. Forestry In Juba, Gudele and Jebel are the main terminal markets for forestry products. The demand for charcoal in Juba has increased due to its economic development after CPA. It is also because of the lower transport and handling costs compared to firewood. While information on charcoal use in Juba is sparse, available trade volume records in Central Equatoria State indicate that charcoal provides energy for the majority of urban households. The charcoal trade significantly contributes to the economy by providing rural incomes. However, charcoal sold in Juba is mainly produced domestically in Central Equatoria State, in Juba itself and Lainya County. It is recorded that a total of 7,017 tonnes of charcoal was traded in 2011 in Juba markets113. One of the major factors affecting the supply of charcoal is the price difference between the dry and rainy seasons. According to traders, the price during the rainy season is linked to the increase in transportation cost, which is passed on to consumers.
iii. Fisheries 112
Wholesalers. April to June 2013. Interviewed by CAMP team, Kyonokonyo Market. CAMP Situation Analysis 113
This CAMP charcoal trade data is calculated based on Directorate of Commerce and Supply data although
there is a similar estimated volume by the NBS in 2009.

5-32
The size of the sun dried fish trade114 to the Juba wholesale market is estimated to be approximately 450 tonnes per year. The fish comes by boat to Juba and is then distributed by road across the Greater Equatoria region, although a large proportion is consumed within the greater Juba area and adjoining counties. The fish is processed by the fishing households and sold to consolidators (collectors) who transport it first to Bor and then to Juba markets. No figures are available for the total production of dried fish from Jonglei and adjacent areas. The trade is very diverse with many producing areas, many traders and many destinations. Dried fish comes to Juba from as far away as Nassir in Upper Nile State (UNS). Fresh fish is also available in the Juba market. Fresh fish is transported in large insulated boxes by boat from Bor to Juba and sold to hotels and in the Juba markets. Additionally 10 trucks are carrying approximately 800 kg/load, up to 3 times a week by road to Juba markets. The trade by boat is no more than 2 tonnes per week, or 100 tonnes per year (2013), but the trade by road can be up to 25 tonnes a week for short periods at the peak season (Dec-April) and is normally 7-10 tonnes a week, or, perhaps, 1,000 tonnes/year.115 The origin of smoked fish sold in Juba markets is mainly Terekeka. This heavily smoked fish is well preserved and keeps for several months. The size of the smoked fish trade to Juba is not officially recorded, but it is probably significantly smaller than that of the dried fish trade, partly due to a shortage of firewood in the northern region. The price in Juba retail markets is SSP19-62, depending on the species and quality. Wholesalers sell to retailers at a price roughly 20% less than the retail price.
iv. Livestock Livestock is highly important in many parts of the country, the main species being cattle, goats and sheep. Most cattle are kept for social reasons and as a traditional form of wealth and status; a relatively small proportion enters the market. On average, more than 70 cattle are traded from Uganda and 30-80 local cattle are supplied to the market every day; 100-150 cattle are slaughtered in Juba. Also 300-400 sheep and goats are slaughtered on a daily basis at the 5 slaughter facilities in Juba. The Nyankole breed and Luguwara breed constituted more than 80% of the total cattle arrivals in the retail cattle markets of Juba.116 The Toposa breed is the major domestic species coming from Eastern Equatoria State (EES), while other species are mainly supplied by cattle traders. Marketing agencies experience seasonal variations in the total arrivals in the market because of the difference in road accessibility between the dry and rainy seasons. Poor road conditions affect cattle supply to the market during the rainy season. The major cattle species sold in the markets are the Nyankole breed and Luguwara breed from Uganda, followed by the Toposa breed from Eastern Equatoria and the Nilotic breed from Jonglei, Lake and Unity States. The Mangalla breed from Terekeka is also sold in some markets in Juba but is in short supply compared to market demand. Transportation costs from Uganda to Juba are about SSP350 per head while that from EES to Juba are SSP200 per head. According to the traders interviewed in Juba, this year (2013) they have seen more poultry in the Juba market. Small scale local commercial poultry production has increased; the main constraint is the limited availability of feed and day-old chicks.
114
The estimate is based on a market survey done in Juba by CAMP in 2013. 115
Information from interviews with fish traders in Juba markets 116
Interview with A/commissioner, Juba Veterinary clinic.

5-33
5.4.5 Organisation of marketing in Juba
In the Juba markets, traders are predominantly composed of non-South Sudanese, including a high proportion of Ugandan nationals who may not own land in South Sudan. Observation in the Juba market shows that participation of South Sudanese women in agricultural marketing is relatively low; they are active mainly in small-scale trade of non-agricultural goods. The use of rented shops or storage space is common and sharing of shop space among several traders is practised. Generally in the Juba market, the businesses are still in their early stages. In view of the poor transport, storage is crucial in determining Juba’s abilities to minimize the variability in the agricultural commodity trade. Agricultural commodity supply in Juba is closely linked to transportation. As the roads connecting Juba market to other smaller markets can be impassable during the rainy season, commodity procurement by road tends to be concentrated in the dry season. Although imported agricultural commodities are dominant in Juba, domestic agricultural commodities are also an important component of the trade. Juba receives sorghum, groundnuts, okra and other local vegetables from Central Equatoria State (CES) or neighbouring states. Crops from CES are generally collected at the harvest site from the farmer by local traders and shipped to Juba markets. The domestic supply is at a significant disadvantage because of poor roads. Sourcing sorghum and groundnuts from local farmers involves assembling small quantities from many different farmers at the farm gate. The local trader travels to the production areas and spends several days organising and supervising the assembling activities, involving commodity collection and transport from several farms to central collection points. In some cases farmers have taken over the administration of collection stations and manage their own wholesale stores at the Juba markets.
5.4.6 Market trend and competitiveness
Seasonal price changes are observed in most of the agricultural commodities, where production is seasonal. Between 2011 and 2012, the maximum monthly prices were approximately 2 times the minimum monthly prices. As shown in Figure 5-2, the price of maize flour is cheaper from November to February, which is the crop’s main harvest season in the Greenbelt zone. The price of maize flour in October 2012 was 40 to 50% more than in October 2011. The prices of most products increased during the period May to August 2012.

5-34
Figure 5-2: Monthly price of maize flour in Juba Market
Source: Directorate of Commerce and Supply, CES, Juba
Figure 5-3: Monthly price of agricultural commodities in Juba market, 2011
Source: Directorate of Commerce and Supply, CES, Juba
Figure 5-4: Trends of prices of major agricultural commodities from 2010 to 2013
Source: Ministry of Agriculture and Forestry, CES, Juba
-
50
100
150
200
250
300
Jan
uar
y
Feb
ruar
y
Mar
ch
Ap
ril
May
Jun
e
July
Au
gust
Sep
tem
be
r
Oct
ob
er
No
vem
be
r
De
cem
ber
SSP
/ 5
0kg
Year 2011
Year 2012
0
2
4
6
8
10
12
Jan
uar
y
Feb
ruar
yM
arch
Ap
ril
May
Jun
eJu
ly
Au
gust
Sep
tem
be
r
Oct
ob
er
No
vem
be
rD
ece
mb
er
SSP
Brown SorghumbucketMaize grain bucket
Maize Flour bucket
Rice cup
White wheat flourpacketGroundnuts(shelled) cupSesame cup
02468
1012141618
wee
k1
wee
k16
wee
k31
wee
k46
wee
k8
wee
k23
wee
k38
wee
k53
wee
k15
wee
k30
wee
k45
wee
k7
2010 2011 2012 2013
SSP
Brown Sorghumbucket
Maize grain bucket
Maize Flour bucket
Rice cup
White wheat flourpacket

5-35
In general, price trends are not very different by commodity. Prices are relatively stable except for some seasonal fluctuations (Figure 5-3 and Figure 5-4). Because of the heavy dependence on imports, cereal prices in South Sudan’s urban markets are significantly influenced by external forces. Import prices have set local prices in many markets. An event in Uganda can have an adverse effect on consumer markets in Juba. The price differentials that exist between Juba market and other domestic markets can be primarily attributed to high transport costs, given the long distances between them and poor transport infrastructure. In addition, internal factors such as rising fuel costs due to the oil shutdown, the closure of the border and currency depreciation further contributed to the escalation of prices. Through the marketing process, a number of items (marketing costs) significantly influence the prices of agricultural commodities. The most important are agricultural inputs, transportation and multiple taxes. Transportation costs are by far the largest cost component in the markets studied in Juba, accounting for 15 to 50% of the marketing costs, depending on the commodity. This is attributable to the long distances travelled on poor roads. Generally, cereal procurement is planned to coincide with the dry seasons, which increases demand for trucks, and hire rates. Road density in South Sudan is among the lowest in East African countries and road conditions are very poor, especially in the rainy season, forcing trucks to carry small loads over long distances, which directly increases the unit cost of transportation. One set of data indicates that the price of cereal in the Juba market is three times more expensive than in Ugandan cities both at the retail and wholesale levels.117 Traders believe that the competitive nature of the Ugandan transport industry resulted in the improved roads found in Uganda. Limited competition in all commercial activities in Juba, high fuel prices and high risk factors also contribute to the high unit cost of transportation to the Juba market. Multiple taxes are the next highest marketing cost. They account for between 5 and 15% of the marketing costs118. The CAMP market survey revealed that there are a large number of taxes and charges in the Juba markets. Some examples follow:
State development tax, CES
Business profit tax, CES
Tax identify card, CES
Capital gains tax, CES
Tax clearance certificate, CES
Stamp duty, CES
Advance stamp duty, CES
Market entrance tax, Payam There is also a daily fee to be paid to the respective market organisations for cleaning and security. To some extent, they appear to be reasonably coherent and follow a similar pattern in all the markets visited. Apart from the transport and taxation marketing costs, the process of commodity procurement and transportation from Uganda entails 4-5 days, which increases labour costs. In an interview with a cereal trader it was found that the cost of labour (for off-loading) in South Sudan is around 3.5 times that (for loading) in Uganda119. This demonstrates one of
117
Yoshino, Yutaka, Grace Ngungi and Ephrem Asebe. June 2011. Africa Trade Policy Notes #21. Enhancing
the Recent Growth of Cross-Border Trade between South Sudan and Uganda. Washington, DC: World Bank. 118
Information from interviews with traders in Juba markets 119
Unit cost is per bag of labour. Information from interviews with cereal traders at the Nimule border point,
March 2013, CAMP situation analysis.

5-36
the constraints in enhancing South Sudan’s competitiveness in business with neighbouring countries. In addition, a more competitive business environment would increase the efficiency of both marketing and production; it would reduce transaction costs and ensure more competitive pricing. However, the current business environment is not efficient. Most traders do not purchase grains within South Sudan, rather they prefer to import from Uganda. They can set prices given the lack of competitive options and can pass on additional transport costs to end consumers in Juba.
According to the NBS data in Figure 5-5, between April 2012 and March 2013 inflation peaked at 79.5% in May 2012, mainly due to high food prices and currency depreciation following the oil shutdown. On a monthly basis, the inflation rate declined from 41.5% in December 2012 to 25.2% in January 2013 due to a reduction in the price of staple foods.
Figure 5-5: Maize retail prices in Juba, Nairobi, and Kampala April 2012-March 2013
Source: NBS, Directorate of Commerce and Supply, CES, Juba and www.ratin.net.
The comparison of data from Juba, Nairobi and Kampala shows that retail prices of maize in Juba are higher (Figure 5-5). In particular, there is a significant gap in the maize retail price between Juba and Kampala. Ugandan maize prices are the lowest among the three countries and very competitive. The price gap between Kampala and Juba reached almost USD 400 per ton in August 2012. One factor for the large gap is the high marketing costs between South Sudan and Uganda. In addition, rising fuel costs in South Sudan contributed to the escalation of prices in 2011/2012. The NBS 120 reported that the price of fuel approximately doubled in most markets between January and November 2011. This increase added considerably to inflation. The depreciation of the SSP also added inflationary pressure during 2011/2012. Another inflationary factor is the multiple unofficial road blocks and check points, which add to overall costs by collecting informal (illegal) taxes and increase delivery times. The challenges121 facing marketing domestic products are varied and numerous. The strong economic relationship with the East African regional markets further discourages the marketing of local produce.
120
Press release in January 2012. 121
1) Infrastructure; 2) institutional framework, especially taxation and customs; 3) production capacity; 4)
capacity of domestic traders, are raised as main challenges in the CAMP Juba market survey.
50.9 29.6 79.5 74.1 60.9 43.3 42.9 21.5 41 25.2 35 24.1
0
100
200
300
400
500
600
700
800
USD
/To
n South Sudan
Inflation ratio(%)
Nairobi
Kampala
Juba

5-37
5.4.7 Conclusions
The CAMP market survey found that because of high dependence on imported agricultural produce, food prices in Juba are strongly influenced by external factors. An event in a major source country has a large (favourable or adverse) effect on Juba market. This suggests that measures to develop the Juba market should be examined in a broader context. Efforts to develop the marketing network should take into consideration the situation of supply of and demand for agricultural commodities in South Sudan and also in neighbouring countries. There is great potential in the East African region for increased trade opportunities for South Sudan’s agricultural products. Effective and fully functioning infrastructure, as well as efficient government institutions to enhance trade, is the key to South Sudan’s ability to gain benefits from the East African regional market.
5.5 Education and Training
5.5.1 Background
In the 1940s, the Government of Sudan established an agricultural training centre in Yambio. It was the first agricultural training centre in the southern part of Anglo-Egyptian Sudan.122 Yambio Agricultural Training Centre was the only agricultural training centre in the southern part of Sudan until other training centres were established in the 1970s and 1990s. 123 The University of Juba was established in 1977; it was the only university where agricultural university degrees could be obtained in this part of Sudan until other universities were established in the 1990s.124 Thus, for a long time, efforts made by the Government of Sudan in the southern part of Sudan, for training and education in agriculture, were limited. In 2002, some relief agencies initiated a programme called the Southern Sudan Agriculture Revitalization Program (SSARP).The main objectives of the SSARP were to increase access to agricultural skills and technology, and to capital for agricultural enterprises, plus to increase the capacity of commodity networks to facilitate expanded trade.125 SSARP also promoted training to improve agricultural production and marketing. To achieve SSARP’s objectives, six training centres were selected to provide training and outreach to those who needed improved skills and knowledge. These centres were: Crop Training Centre Yei (CTC Yei), Kagelu Forestry Training Centre (KFTC), Marial Lou Livestock Training Centre (MLLTC), Padak Fisheries Training Centre (PFTC), Nzara Agricultural Technology Training Centre (NATTC) and Boma Wild Life Training Centre126. USAID was the main donor for the SSARP; in 2006, they announced the end of their support. The training centres were handed over to the Ministry of Agriculture, Forestry, Cooperatives, and Rural Development (MAFCRD) and Ministry of Animal Resources and Fisheries (MARF) in 2007.127 Consequently, the Government of Southern Sudan took over salary payments for
122
Sudan Government. 1955. Natural Resources and Development Potential in the Southern Provinces of the
Sudan: A Preliminary Report by the Southern Development Investigation Team 1954. London. 123
Crop Training Centre Yei was established in 1977. Kagelu Forestry Training Centre was established in 1990.
Marial Lou Livestock Training Centre was established in 1996. Source: footnote 88 124
WikiPedia. University of Juba. http://en.wikipedia.org/wiki/University_of_Juba#History 125
Chemonics International Inc. 2003. Agricultural Enterprise Finance Program: A Component of the Southern
Sudan Agricultural Revitalization Program (SSARP). Second Annual Workplan October 1, 2003 – September 30, 2004. Unpublished. 126
SSARP included construction of MLLTC and NATTC as new establishments while CTC Yei, KFTC, and
PFTC were renovated. 127
USD 200,000 were provided to each centre for operation during the transitional period.

5-38
the training centres while responsibility for the operation of the centres remained in each training centre.128 Major government and non-governmental agricultural training institutions and other educational institutions, such as universities and vocational training centres, are reviewed to give an overview of the situation of South Sudan’s agricultural education and training.
5.5.2 Government agricultural training centres
There are five government training centres related to agriculture in South Sudan.129 Current conditions and characteristics of these centres are illustrated in Table 5-23.
Table 5-23: Government Agricultural Training Centres related to Agriculture in South Sudan
Name of training centre
Location Number of staff
Training courses and major contents offered
Number of trainees finishing courses
1 Crop Training Centre Yei
Yei, Central Equatoria State
1 Principal, 9 instructors, 11 management, 45 labourers
3 month agribusiness extension course and some other tailored courses based on demands.
29 trainees finished 3 months course in 2010. 25- 30 trainees finished 3 months course in the prior 5 years.
2 Kagelu Forestry Training Centre
Kagelu, Central Equatoria State
7 trainers, 20 administrative staff
Refresher courses. Agroforestry, apiculture/bee keeping, wood work/carpentry, business skills, and biomass energy courses. 2 year Forestry Technician course and 1 year forestry diploma course
280 trainees completed the available courses in 2012 and 5,000 received outreach training in 2012.
3 Marial Lou Livestock Training Centre
Marial Lou, Warrap State
11 staff, All of them teach and do administration.
There are 6 types of training courses. (1) 4 month Animal Health Auxiliary (AHA), (2) 5 month Stock person’s Certificate, (3) General Livestock Extension Worker Certificate , (4) Short courses on demand basis, (5) 1 to 2 week Refresher course, (6) Outreach training programme. 3 new certificate courses will be implemented soon.
In 2012, 22 trainees completed 4 month AHA course. In 2011, 8 completed AHA, 18 completed 5 month Stockperson’s Course.
128
Nuffic. April 2010. ALFFAT Education, NICHE support for Agricultural Development in Southern Sudan.
ALFFAT: Agriculture, Livestock, Fishery, Forestry & Agric. Technology. Final Report Assessment Agricultural TVET centres in Southern Sudan. Consultant’s report. Unpublished. 129
Boma Wildlife Training Centre is operated under the supervision of the Ministry of Wildlife and Conservation
and Tourism and focuses on wildlife conservation. It is not part of the CAMP Situation Analysis.

5-39
Name of training centre
Location Number of staff
Training courses and major contents offered
Number of trainees finishing courses
4 Padak Fisheries Training Centre
Bor, Jonglei State
5 senior staff and 16 support staff
Offers two types of training courses. One is in-house training and the other is outreach training for fishermen. Course contents are fish processing and preservation modalities, fish extension education and community development, fish farming, business management, fisheries management, quality smoked fish techniques, boat building and repair, fish gear technology, net making and catching techniques, and fish data collection
In 2013, 20 trainees completed 3 months training course.
5 Nzara Agriculture Technology Training Centre
Nzara, Western Equatoria State
N/A In the past, the centre offered training courses such as animal power utilisation and management, tractor operation and management, fabrication and repair of farm tools, operation and management of agro-processing equipment, post-harvest handling, preservation and packaging, small scale business management, product costing and pricing, etc.
Since 2007, training is not organised.
Sources: CTC Yei, Crop Sector Questionnaire for CTC Yei. Yei, 8 April 2013, CAMP Situation Analysis. Padak Training Centre, Visit to Padak Training Centre. 29 May 2013. CAMP Situation Analysis. Nuffic. April 2010. ALFFAT Education, NICHE support for Agricultural Development in Southern Sudan. ALFFAT: Agriculture, Livestock, Fishery, Forestry & Agric. Technology. Final Report Assessment Agricultural TVET centres in Southern Sudan. Consultant’s report. Unpublished., Nuffic. October 2011.Support to CTC Yei, CTC Yei assessment C-report. Consultant’s report. NICHE/SDN/096. Unpublished., Marial Lou Livestock Training Centre. Marial Lou Livestock Training Centre (MLLTC) Background. Unpublished. Mott MacDonald, Interviewed by CAMP Task Team, Juba, 22 June 2013, CAMP Situation Analysis. Marial Lou Livestock Training Centre, interviewed by CAMP Task Team, Juba. 1 July 2013. CAMP Situation Analysis.
5.5.2.1 Crop Training Centre Yei (CTC Yei)
Staff salaries at CTC Yei are provided by the Ministry of Agriculture, Forestry, Cooperatives and Rural Development (MAFCRD), but all other running costs are generated through its own efforts. The main course is a three month agribusiness extension course, but it is provided only once a year. Remaining courses are tailored based on demand. Sometimes they collaborate with NGOs to organise training courses. However, considering the number of staff at CTC Yei, the number of trainees graduating from the main training course is small. CTC Yei has the capacity to provide more training courses which would allow them to become more self-sufficient; this is one of their major challenges. Currently, many trainees enrol in the three months course, but it does not necessarily provide sufficient knowledge. To improve the situation, the Dutch government is trying to establish a 9-12 months certificate accredited course at CTC Yei. The new curriculum will include not only crop production components but also livestock production and scientific

5-40
knowledge of agriculture. CTC Yei does not have a livestock training component in their courses so this would strengthen a weak part of the curriculum. The Dutch government also provides technical support to improve teaching skills. A training component about rice was added to the training courses through support by JICA. These efforts may increase the number of trainees. With limited funds it is challenging to improve the quality of courses and to increase their number. State governments should send their staff to CTC Yei for training but have limited budgets to do so. CTC Yei currently has nine instructors, six of whom have recently joined. Keeping qualified instructors is another challenge. Nevertheless, considering the need to improve AEOs’ knowledge and skills and increase their number, CTC Yei’s role is important for bettering crop production.
5.5.2.2 Kagelu Forestry Training Centre (KFTC)
KFTC has been active in conducting outreach training while providing extension services to the public. The variety of their activities, such as providing training, consultation, carpentry work, research activities and accommodation, is their strength. However, even though the centre carries out a variety of activities to fund their running costs, it is a major challenge to meet these costs, especially as they lost their major funding source in 2008. There are insufficient trainers for the current training courses. Another challenge is that very few students enrol in the diploma course. They want to improve course quality, including accreditation of their diploma and certificate by a higher educational institution or the Ministry of Higher Education.
5.5.2.3 Marial Lou Livestock Training Centre (MLLTC)
Currently, the Dutch government is supporting MLLTC to improve the contents of their training curriculum. For example, the General Livestock Extension Provider and Animal Health Auxiliary certificate courses will start in July 2013. However, MLLTC has some challenges. Limited budget to provide training is a major challenge. The main reason is that MLLTC has to rely on outside funding to meet its running costs to continue providing courses. Another reason is the high cost of the courses and an insufficient number of trainees. The courses are not attractive to trainees because employment opportunities are limited after completing the course. For example, even if a community animal health worker (CAHW) completes a course which improves their capacity in animal health, it is difficult for them to find employment afterwards. Another reason is the location of MLLTC which is far from large towns130. During the rainy season, access to MLLTC becomes even more difficult.
5.5.2.4 Padak Fisheries Training Centre (PFTC)
PFTC provides practical training, but there is no applied research conducted. PFTC has to rely on outside funding to meet its running costs. The centre was transferred from the Ministry of Animal Resources and Fisheries (MARF) to the John Garang Memorial University of Science and Technology in Bor. Despite the transfer, the salaries of PFTC are still paid by MARF; but there is no longer a strong linkage between the centre and MARF which means it is difficult for the centre to reflect the policy and plans of MARF. Lack of training opportunities for PFTC staff is another challenge as they try to improve the quality of training. Each state is supposed to send staff to the centre, but training is not equally provided to staff of each state.
130
For example, it is 294 kilometres from Rumbek.

5-41
5.5.2.5 Nzara Agriculture Technology Training Centre (NATTC)
NATTC used to function as an agricultural training institution. It provided some courses that are not available at the currently functioning training centres such as food processing and post-harvest handling. The presence of NATTC was unique and important for agricultural development. However, since 2007, no training has been organised due to the withdrawal of USAID from SSARP.
5.5.3 Non-governmental institutions
Various NGOs also provide training in different agricultural (technical/activity) areas. Since it is difficult to collect information about all NGOs’ training activities in South Sudan, information about the Yei Agricultural Training Centre (YATC) is provided as an example of a non-governmental institution’s activity. YATC was established in 1999 in Yei. The Norwegian People’s Aid has been supporting them financially since then. Currently, much of their funds are generated through their own activities. Training is a major source of funds. The centre offers four training courses as shown in Table 5-24.
Table 5-24: Key Information about Yei Agricultural Training Centre (YATC)
Name of the
training centre
Location Number of staff
Training courses and major contents offered
Number of trainees finishing
courses 1999-2010
YATC Yei, Central Equatoria State
Seven staff (All of them are able to be trainers)
(1) Basic agriculture training course, (2) Specialised agriculture course, (3) Participatory agriculture course, (4) Short courses on demand basis. (Livestock training component is available for the courses.)
Basic Agriculture: 674, Participatory Methodologies: 124, Specialised Agriculture: 129, Short courses: 239
Sources: Yei Agricultural Training Centre, Crop Sector Questionnaire for YATC, Yei, 10 April 2013, CAMP
Situtation Analysis. Nuffic, October 2011. Mission Report for Inception phase of project: “Upgrading Crop Training Centre Yei to offer accredited programmes in agriculture management and production with special emphasis on agricultural extension services.” Consultant’s report. NUFFIC/NICHE/SDN/096. Unpublished.
YATC actively tries to improve farmers’ agricultural skills and knowledge through providing extension activities. YATC also provides animal traction services to some target communities as part of their efforts to generate funds; animal traction has been well received by target farmers. Increased funding based on its own effort is a major challenge that YATC has to overcome. To achieve this, YATC is collaborating with other NGOs. In the past, when an NGO participated in training at YATC, YATC took all responsibility for providing the training which was costly for the NGO. Now, venue and accommodation are provided by YATC; then most of the sessions are instructed by the NGO and others by YATC. This is beneficial for both parties. If the cost of training is reduced, NGOs can organise more training which means more business and funds for YATC. This kind of effort to expand business opportunities is necessary for the government training centres to improve their financial situation.
5.5.4 Higher educational institutions
5.5.4.1 Universities
Higher educational institutions such as universities play an important role in human resource development in the agriculture sector. There are five universities in the country which offer courses related to agriculture. They are listed by subsector in Table 5-25.

5-42
Table 5-25: Universities Offer Courses of Bachelor’s Degrees in the four Agricultural Subsectors
Subsector Names of University
1 Crop
Production
University of Juba, Upper Nile University, John Garang Memorial University,
Catholic University of South Sudan
2 Livestock University of Juba, Upper Nile University, John Garang Memorial University,
Western Bahr El Ghazar University
3 Forestry University of Juba, Upper Nile University
4 Fisheries University of Juba, Upper Nile University
Sources: University of Juba. 2013. College of Natural Resources and Environmental Studies. Revised
Curriculum. Unpublished. University of Juba. College of Natural Resources and Environmental Studies.
Department of Animal Production. Unpublished. Catholic University of South Sudan. 2012-2013. Handbook and
Student Guide Fifth Academic Year. Wau. Nuffic, 2010. Support to CTC Yei. Final Report Assessment
Agricultural TVET centres in South Sudan. CTC Yei assessment A report. Consultant’s report. NICHE/SDN/096.
Unpublished. University of Juba, College of Natural Resources and Environmental Studies, interviewed by CAMP
Task Team. June-July 2013. CAMP Situation Analysis.
The University of Juba University is given as an example of higher education in South Sudan. Under the College of Natural Resources and Environmental Studies, there are the following departments related to agriculture: (1) Agricultural Science, (2) Animal Production, (3) Forestry and (4) Fisheries. All the departments offer 5 year undergraduate programmes. The number of enrolled students in each bachelor’s programme is indicated in Table 5-26.
Table 5-26: Number of Bachelor’s Students at University of Juba in College of Natural Resources and Environmental Studies
Agricultural
Science
Animal Production Forestry Fisheries Grand Total
172 139 106 73 490
Source: University of Juba. 2013. College of Natural Resources and Environmental Studies Registrar’s Office.
Juba. Unpublished.
Due to a shortage of teaching staff for postgraduate programmes, there are no postgraduate students except for a few in the Fisheries Department. The university provides mainly theoretical classes as there is limited land to practice or experiment in agriculture on campus. Many graduates find employment opportunities at NGOs and government institutions at national and state levels. Funding sources of the university are the government, support from DPs and students’ tuition fees.131 Lack of demonstration farms and laboratories and the limited number of teaching staff are major challenges for the College of Natural Resources and Environmental Studies. Other major universities offer similar programmes although some offer only one or two agricultural subsector areas. Considering the number of students who study agriculture, the impact of higher education on the agricultural sector is large.
5.5.5 Other government institutions and schools
There are other training centres and schools which provide classes and/or courses related to
agriculture. Basic information about these is presented in Table 5-27.
131
Assistant Professors of Soil and Water Science, Professor of Forestry, Assistant Professor of Fisheries
Science, College of Natural Resources and Environmental Studies, University of Juba. Juba. 27 June 2013. CAMP Situation Analysis.

5-43
Table 5-27: Key Information about Other Government Institutions that provide Agricultural Education and/or Training Courses
Name of the training centre
Location Major courses/subjects offered
related to agriculture
Number of
trainees/students
finishing in 2012
1 Amadi Rural
Development
Institute
(Amadi RDI)
Amadi, Western
Equatoria State
1-2 weeks and 3, 6, and 9 month
courses related to rural
development are available, such
as community development, social
work, cooperative development,
leadership, communication,
budgeting and planning, vegetable
gardening, food processing,
agricultural extension, bee
keeping.
Every year, about 30
Community
Development Officers
and 30 Cooperative
Officers are trained.
22 trainees
participated in two
short training courses
in 2012.
2 Kapuri
Agricultural
and
Technology
Transfer
Centre
(KATTC)
Juba, Central
Equatoria State
(About 12
kilometres from
Juba town)
In the past 2 years, training has
not been organised due to limited
budget. 3 month training for tractor
operation was provided in 2009,
2010, and 2011 (only once a year).
21 to 33 trainees
attended each course
in 2009, 2010, and
2011.
3 Vocational
Training
Centres
Juba, Wau,
Malakal, and
Rumbek (centre in
Rumbek is
available only for
women.)
3 months, 6 months, and 1 year
agricultural training courses, 3
months training covers
agroforestry and livestock
subjects. 6 month training covers
fish farming as well. The school in
Malakal offers a course for tractor
operation and maintenance.
No information is
available.
4 Public and
private
primary
schools
Across the
country, there are
more than
300,000 primary
schools in the
country.
Basics about water, soil, farm tools
and equipment, land preparation,
crop production, farm structures,
farm animals, animal products,
agricultural business
Precise information is
not available. Fourth
to eighth year
students are
targeted132
5 Public and
private
secondary
schools
Across the
country, there are
about 230
secondary schools
in the country.
General introduction to agriculture,
crop production, soil fertility, farm
tools and equipment, animal
production, animal health,
agricultural mechanisation and
engineering, agricultural
economics
Precise information is
not available. All
students are
targeted133
Sources: Amadi Rural Development Institute, interviewed by CAMP Task Team. Juba. 1 July 2013. CAMP
Situation Analysis. Inspector for Mechanisation of Department of Agricultural Mechanisation and Kapuri
Technology Transfer Centre, interviewed by CAMP Task Team. Juba. 28 June 2013. CAMP Situation Analysis.
JICA Skills Vocational Training project, interviewed by CAMP Task Team. Juba. 24 June 2013. CAMP Situation
Analysis. UN/RSS Joint Programme on Creating Opportunities for Youth Employment in South Sudan. 2011.
Standard and Harmonised Draft Vocational Training Programmes. Juba. Senior Curriculum Development Officer
132
Primary school years consist of eight years in total. 133
Secondary school year consists of four years. There are some optional classes available for the third and
fourth year students.

5-44
of Department of Curriculum Department, Ministry of General Education, interviewed by CAMP Task Team. Juba.
2 July 2013. CAMP Situation Analysis.
Director General of Education-New Sudan. Chairperson; National Curriculum Development Committee. 2002.
Syllabus for Primary Schools. Volume 2: Primary 6-8. Government of Southern Sudan. Ministry of Education,
Science and Technology. 2007. Secondary Education. Syllabus for Southern Sudan Certificate of Secondary
Education. Volume 1.
5.5.5.1 Amadi Rural Development Institute (Amadi RDI)
AMADI RDI is a government training institution which mainly provides training courses concerning rural development, but it also provides management and leadership skills as well as agricultural extension courses. Three, six, and nine month courses are available. Depending on the needs of trainees, the institute can arrange training courses flexibly. Currently, they are preparing to start two nine month certificate courses on: 1) water and sanitation, and 2) water and irrigation with the support of the Dutch government.134 AMADI RDI receives not only staff salaries but also some operational funds from MAFCRD which means they can provide some cost-free short term courses but not cost-free longer term courses. Currently, Amadi RDI is not providing any training due to the construction of new buildings for the new courses and renovation of the existing buildings. Staff training for the new training courses is another reason. As soon as these activities are completed, operations will resume.
5.5.5.2 Kapuri Agricultural and Technology Transfer Centre (KATTC)
KATTC is under the Department of Mechanisation of MAFCRD. It is located about thirty minutes away from Juba. Three management staff, eighteen operators and eleven labourers are working at the centre. Their salaries and some operational budget are funded by MAFCRD. Because of the austerity measures, training in tractor operation has not been provided since 2012. They do not receive any support from donors. Thus, currently their only activity is lending tractors.135 There is no demonstration farm or accommodation facility available at the centre. Hence, it is difficult to provide practical training at KATTC, even if there are sufficient funds available for tractor operation training.
5.5.5.3 Vocational Training Centre
There are three vocational training centres in the nation, Juba, Wau, and Malakal. The Aluakluak Women’s Vocational Training Centre located in Rumbek will soon start operation.136 The curriculums of vocational training centres contain not only crop production but also livestock and agroforestry; students can gain a broader knowledge of agriculture. A course for tractor operation and maintenance is available at the vocational training centre in Malakal which is beneficial; in other areas, such as Yei, there are no training courses that focus on tractor operation and maintenance. Tractor hire companies employ trained tractor operators from Uganda.
5.5.5.4 Primary and secondary schools
Primary and secondary schools have classes about agriculture. Therefore, South Sudanese who completed primary school after 2000 have basic knowledge of farming and animal
134
The water and irrigation course focuses on the technical aspects of borehole drilling. It is not an agricultural
irrigation course. 135
Currently, KATTC owns six tractors, but only three of them are operational. Spare parts are not available in
the country nor is there any budget to purchase spare parts. 136
JICA Skills and Vocational Training Project, interviewed by CAMP Task Team. Juba. 24 May 2013. CAMP
Situation Analysis.

5-45
husbandry. Key information about primary and secondary school classes related to agriculture is illustrated in Table 5-27. The school curriculum is standardised for both public and private schools across the country.137 Especially, in secondary schools, agriculture is a separate subject. Considering the large number of schools using the standard curriculum, primary and secondary schools are contributing to laying a foundation for the nation’s agriculture.
5.5.6 Observations
One of the challenges in the agricultural sector is the limited technical skills and knowledge of government employees, especially at county, payam and boma levels. In the case of crop production these include agriculturally specialised skills such as agricultural production, extension, post-harvest, agribusiness and how to organise farmers’ groups. Additionally, in crop production’s case, not enough Agricultural Extension Officers (AEOs) are deployed in county and payam offices. In order to increase the number of AEOs with appropriate skills and knowledge, provision of training to prospective AEOs is necessary. The other challenge is farmers’ lack of knowledge and skills in agriculture. Since the number of AEOs is limited, leading farmers in the community could be trained to lead and support other farmers. Existing training centres could play an important role in ameliorating this situation. Limited funding is a major common challenge for the government training centres; they need to find ways to cover their running costs. For example, if they could lower the cost of training courses, so as be more affordable, they could increase the number of trainees and improve their financial situation. Lack of qualified teachers is another major challenge for these centres. Training curriculums should be standardised at all institutions. Collaboration between research centres and training centres is minimal meaning that new knowledge and skills are not included in training courses and then put into practice. Similarly, the University of Juba could consider how to collaborate with existing training institutions to provide practical field experience for its students. Considering the growing demand for tractor use by farmers across the country, a training course on tractor operation could be beneficial for tractor hire companies and farmers.
5.6 Civil society organisations
There are a number of civil society organizations operating in South Sudan. As thecountry has experienced several decades of civil war, most organizations focus on humanitarian emergency aid, particularly for food security and livelihood improvement. Some organizations also target supporting returnees and peace building, reflecting the fact that the country is still vulnerable in its reconstruction stage. Other common activities focus on education, health care and gender issues. Table 5-28 is a list of civil society organizations and types of activities that each of them focuses on.
137
The current curriculum for primary schools became effective in 2000 and that for secondary schools in 2006.

5-46
Table 5-28: List of civil society organizations
Organization Common activities
Fo
od
secu
rity
Su
pp
ort
retu
rnees
Peace
bu
ild
ing
Ed
ucati
on
Healt
h
care
Gen
der
Action Against Hunger-International (ACF) International Agency for Technical Cooperation and Development (ACTED)
African Development Solutions (ADESCO) Aweil Window of Opportunities and Development Agency (AWODA)
Banga International Catholic Agency for Overseas Development (CAFOD) Cooperative for Assistance and Relief Everywhere (CARE) Community Agriculture and Skills Initiative(CASI)
Cooperazione E Sviluppo (CESVI) Christian Mission for Development (CMD) Concern Worldwide Catholic Organisation for Relief & Development Aid (Cordaid)
Christian Recovery and Development Agency (CRADA) Dan Church Aid (DCA) Danish Refugee Council (DRC) GOAL Humane Development Council (HDC) Inter-Church Organisation for Development Cooperation (ICCO)
Intermon Oxfam International Rescue Committee (IRC) Islamic Relief Worldwide (IRW) Joint Aid Managemet International Mani Tese Mercy Corps Norwegian Church Aid(NCA)
Nile Hope Development Forum (NHDF) Norwegian People's Aid (NPA) Nutrition Cluster/ACF Oxfam Canada
Oxfam GB People in Need Plan International Samaritans Purse Save the Children Suatainet East Africa Tearfund Vétérinaires Sans Frontières(VSF) Belgium Vétérinaires Sans Frontières (VSF) Germany
Vétérinaires Sans Frontières (VSF) Suisse World Concern World Vision International Sources: The areas of relevance were selected by the CAMP Task Team based on the information obtained through each organization’s website.
5.7 Development partners
There are at least 17 development partners (DPs) operating in South Sudan for agricultural development138. Table 5-29 is a list of major DPs139in the agricultural sector of South Sudan
138
The number of DPs is based on a survey conducted by the CAMP team.

5-47
with a brief description of their areas of assistance, and projects/programmes conducted by them. Projects/programmes that do not seem to have a direct/strong relation to South Sudan’s agricultural development have been omitted, such as those that improve the judicial system, primary education system and health care facilities. It can be observed from the table that most projects/programmes target a major CAADP Pillar used by the South Sudan Natural Resources Sector Working Group (NRSWG), namely Food Supply, Security, and Access & Hunger. This reflects the position of the Government of the Republic of South Sudan (GRSS) that stresses the importance of food security as repeatedly stated in MAFCRD’s Agriculture Sector Policy Framework (ASPF) 2012-2017 and MARF’s Policy Framework and Strategic Plans 2012-2016. JICA’s Technical Cooperation in the formulation of CAMP will take all five CAADP pillars into consideration: a) Food Supply, Security, Access & Hunger, b) Land & Water Management, c) Market Access (including roads), d) Framework for Agricultural Productivity, e) Institutional Development of Ministries.
Table 5-29: List of major development partners supporting agriculture in South Sudan
DPs Focus areas Projects/programmes Period
BMZ/ GIZ
Promoting institutional development (training administrative officers, establish state and municipal revenue and expenditure systems, etc.)
Promoting conflict transformation and peace building (reintegrating former combatants, etc.)
Improving water supply and sanitation (constructing dams, etc.)
Improving food security and promoting market-oriented agricultural development (developing value chains, etc.)
Developing transport infrastructure (roads)
Development-oriented Emergency and Transitional Aid (DETA)
Unidentified
Food Security and Agricultural Development
2010-2012
Food Security and Rural Development 2010-2012
Regeneration and Stabilisation of the Livelihoods of Returnees and the Local Population in Central and Eastern Equatoria / Western Equatoria
2008-2013 / 2011-2014
Rehabilitation and Upgrading of the Lui Water Supply System
2011-2012
Transboundary Water Cooperation in the Nile Basin
2002-2013
Basic Service Provision and Recovery Unidentified
Building Community Resilience 2011-2014
Emergency Assistance to Displaced Populations in South Sudan - UNHCR 2009
2009-2009
CIDA
Promoting health of children and youth including maternal, nNew-born and child health (increasing access to healthcare services such as vaccinations, etc.)
Improving food security (increasing access to seeds and tools, establishing community based saving groups, etc.)
Improving governance (prison reform, capacity building of the Land Commission, training government officials, etc.)
Promoting humanitarian assistance
Emergency Support for Returnees in South Sudan - World Vision Canada 2008
2008-2010
Food Security Through Community-Based Livelihood Development and Water Harvesting (FAO Food Security - South Sudan)
2011-2014
Health Support for Blue Nile State in Sudan - World Vision Canada 2008
2008-2010
Peace and Livelihoods in South Sudan Unidentified
Reintegration of Ex-Combatants into Agricultural Livelihoods (REAL)
2010-2010
Return and Reintegration to South Sudan - UNHCR Appeal 2008
2008-2008
South Sudan Emergency Nutrition Project - Save the Children 2009
2009-2010
South Sudan Water and Sanitation 2009-2011
139
The major Development Partners were selected by the CAMP team out of the projects identified by the team
based on number of projects conducted and volume of funds budgeted by each organization. Those that are not listed here include international organizations such as UNDP and the World Bank.

5-48
DPs Focus areas Projects/programmes Period
Project - Oxfam Canada 2009
Sustainable Livelihoods and Mine Action (SLAM)
Unidentified
African Enterprise Challenge Fund 2011-2015
Capacity Building Trust Fund Phase II 2009-2014
Protective Safety Nets Programme 2012
DFID
Improving primary education (increasing access to education, distributing text books, etc.)
Promoting access to healthcare and nutrition (prevention of malaria, etc.)
Improving food security Improving governance and
security (promoting women's access to security and justice services, etc.)
South Sudan Food Security and Livelihoods
2012-2015
South Sudan Rural Feeder Roads Project
2011-2015
Strengthening Economic Governance in South Sudan
2012-2015
Aweil Irrigation Rehabilitation project (AIRP) - STABEX 03
Unidentified
Bahr El Ghazal Livestock Production and Marketing Project - STABEX 02
Unidentified
Environmental Protection and Sustainable Development: Building Local Capacities on Solid Waste Management in South Sudan
Unidentified
EU
Improving justice/rule of law Increasing access to education
and health Improving water management Promoting assistance for food
security, feeder roads, extension and capacity building
Promoting international trade (ensuring duty-free and quota-free access to EU markets under 'Everything But Arms', as soon as conditions are met)
Food Security Thematic Program (FSTP) 2007-2013
Integrated and Environmentally Sound Livestock-crops Production and Marketing
Unidentified
Livestock Epidemio-Surveliance Project (LESP) South Sudan
Unidentified
Nyal-Shambe-Terakeka Fisheries Production and marketing Project - STABEX 04
Unidentified
South Sudan Rural Development Programme (SORUDEV)
Unidentified
Sudan Institutional Capacity Programme: Food Security Information for Action (SIFSIA)
Unidentified
Sudan Productive Capacity Reconstruction Program (SPCRP)
Unidentified
Agriculture Extension Expert Unidentified
Project for Livelihood Improvement in and around Juba for Sustainable Peace and Development (LIPS)
2009-2012
Support to Irrigation Master Plan Development
Unidentified
Technical Assistance in support of Agriculture Extension services and Training for Rice Production
Unidentified
JICA
Promoting state building (developing infrastructure, improving governance, etc.)
Improving support for basic human needs
Improving food security
Technical Cooperation in the Formulation of the Comprehensive Agricultural Development Master Plan of the Republic of South Sudan
2012-2014
The Project for Capacity Development on Solid Waste Management in Juba
2011-2014
The Project for Irrigation Development Master Plan
2012-2014
Support to Agriculture and Forestry Development Project
Unidentified
Food security and Livelihoods Program Unidentified
Food security and Livelihoods Program Unidentified
IFAD SSLDP South Sudan Livelihood Unidentified

5-49
DPs Focus areas Projects/programmes Period
Development Project
Nether lands
Improving security and the rule of law (promoting capacity and accountability mechanisms within and outside the army, promoting governance and gender equity, etc.)
Promoting food security and access to water (organizing farmers and providing training to strengthen their productive capacity, increasing access to inputs such as seeds and fertilizer, etc.)
Livestock Training Center (Marial Lou) Unidentified
Rural Drinking Water and Sanitation Unidentified
Support to Crop Training Centre (Yei) Unidentified
Water Program Unidentified
Food, Agribusiness and Rural Markets (FARM)
Unidentified
International Small Group and Tree Planting Program (TIST)
Unidentified
Rebuilding Higher Education in Agriculture – RHEA
Unidentified
Seeds for Development Unidentified
USAID
Mitigating conflicts Strengthening effective,
Inclusive, and accountable governance
Develop essential services including health, education, nutrition, and water/sanitation
Expand agricultural based economic opportunities (promoting public-private partnership for commercial agriculture, etc.)
Sudan Rural Land Governance Project Unidentified
Conservation of Biodiversity Across the Boma-Jongeli Landscape in Southern Sudan
Unidentified
Source: Information on the names of DPs, Projects/Programmes, and Periods was obtained from NRSWG. The focus areas are based on the information obtained through:Each DP’s website; JICA. 2012. Detailed Planning Survey for the Projects for the Comprehensive Agricultural Development Master Plan and the Irrigation Development Master Plan of the Republic of South Sudan – Preliminary Findings. Juba: JICA

6-1
6. Public financial management and related institutional capacities
Public Financial Management (PFM) supports the effective and accountable use of public resources to implement government policies. Since the signing of the Comprehensive Peace Agreement (CPA) in 2005 and independence in 2011, the coordination mechanisms between government and development partners (DPs) have evolved rapidly. The government’s PFM system has to accommodate and manage resource contributions from the DPs, in addition to the oil and non-oil based national revenues. CAMP formulation requires careful examination of the PFM practices of the Government of the Republic of South Sudan (GRSS), including state governments, in order to design implementation mechanisms consistent with these practices. Without well-planned financial coordination, external interventions make a country's PFM system complex, incurring high transaction costs in the process of planning, budget preparation, execution, and monitoring and evaluation (i.e. PFM cycle). Under the situation of resource constraints and external interventions, the adoption of a well-designed master plan implementation mechanism, consistent with the existing PFM system, is important to ensure CAMP is cost effective and has maximum impact. To make CAMP feasible, the mobilization of financial resources must be part of the CAMP process. CAMP will contain sub-sector projects with priorities, schedules and preliminary costs for implementation within a determined timeframe. CAMP also will capture current on-going projects under its agriculture development framework. To mobilize financial resources of the government and DPs in a coordinated and planned manner, the CAMP process should be aligned with the PFM system of the national and state governments. Provided that CAMP is a well-defined master plan supported by robust analyses of the agriculture sector, the CAMP process and the medium-term and annual planning cycles of all levels of government will need to be integrated to secure resources for CAMP implementation. This chapter explains the current situation of PFM at national and state levels based on field visits to the 10 states of South Sudan. The capacities of state ministries and counties were assessed by interviewing key officers such as directors and county officers. Due to the time and financial limitations, the team visited 10 states and 20 counties.
6.1 Challenges
The field survey conducted by CAMP TT member reveals the lack of capacity of state ministries and counties. Table 6-1 shows the challenges as views obtained from state ministry officers. One of the major challenges is the absence of audits, internal and external. A number of officers said that there were many fraud cases during budget execution and procurement. As the operating budget is inadequate, regular operations are adversely affected. Additionally, the capacity of counties and other lower levels is very limited for budget execution and procurement due to the lack of accountants.
Table 6-1: Challenges of financial capacity by state
State Challenges
Upper Nile Weak procedure for procurement of goods and services.
No external audit conducted

6-2
State Challenges
Unity No external audit conducted.
Lack of detailed annual budget execution plans by each ministry.
Large proportion of budget is used for salaries and wages.
Warrap State
Due to the financial condition, No projects are under way
Mismanagement of assets and funds.
No existence of procurement department in SMAF and SMARF.
There is no clear PFM in both state ministries and counties.
WBG State
No external audit conducted.
No existence of procurement department in SMAF and SMARF.
Procurement of goods and services is conducted by SMoFEP.
Large proportion of budget is used for salaries and wages.
NBG State
There is no funding for county activities although they are listed in the budget.
Constant delay in releasing of funds from SMOFEP.
No existence of procurement department in SMAF and SMARF.
Large proportion of budget is used for salaries and wages.
Lakes State
No external audit conducted, internal audit rarely conducted.
No clear organogram for PFM in State Ministries.
Weak procedures for procurement of goods and services.
Jonglei State
No external audit conducted.
Lack of detailed annual budget execution plan by each ministry.
Large proportion of budget is used for salaries and wages.
CES Lack of detailed annual budget execution plan by each ministry, counties.
Large proportion of budget is used for salaries and wages.
No external audit conducted
EES No external audit conducted.
Lack of detailed annual budget execution plan by each ministry.
Large proportion of budget is used for salaries and wages.
WES No external audit conducted.
Lack of detailed annual budget execution plan by each ministry.
Large proportion of budget is used for salaries and wages. Source: Interviews with state officers
Issues and challenges are summarized as follows:
Inadequate or insufficient human resources for planning, budgeting, procurement, accounting and auditing.
Due to these reasons, cash flow and procurement is not transparent and accountable. There are many cases where a budget amount specified for a specific purpose is used for a different purpose.
Limited funds for operating costs and investment.
A large proportion of the budget is used for salaries and wages for officers employed by the ministries.
Very limited or no capacity at the payam and boma levels.
Very few counties and payams have any ongoing activities. Human, financial and physical resources are not distributed to counties and payams.
No clear PFM procedures at state ministries and counties.
Mismanagement of assets and funds.
6.2 Legal and institutional framework of PFM system
It is important to design CAMP so that it aligns with the current legal and institutional framework of the PFM system. In this section to facilitate discussion on the linkages between the government's PFM system and CAMP, the legal and institutional framework of the PFM system are described from the points of view of the medium-term and annual PFM cycles,

6-3
harmonization of government and DP resource allocations, and pooled funding mechanisms. The documents representing the legal and institutional framework published during the period between the establishment of the CPA signed in January 2005 and the country's independence in July 2011, and the period after independence, were examined. In this report the former period is called the pre-independence period and the latter is called the post-independence period.
6.2.1 Constitutions, acts, and regulations
Under the terms of the CPA the Government of Southern Sudan (GOSS) was formed as a governmental body in 2005, and relevant line ministries were established based on the provisions of the Interim Constitution of Southern Sudan. In July 2011 the Transitional Constitution of the Republic of South Sudan 2011 (the Constitution) was enacted and South Sudan became an independent country. Both constitutions provide basic provisions for the establishment of a PFM system including a financial calendar. During the pre-independence period, a Budget Call Circular setting the commencement of Annual Budget preparation was issued according to the provisions of the Interim Constitution, because no PFM acts were in place in this period. On the other hand, in the post-independence period a Budget Call Circular is issued under the provisions of the Public Financial Management and Accountability Act 2011 (PFMAA). Most of the other key regulations laying the foundation of the PFM system are of pre-independence origin. The following is a list of relevant regulations presented in chronological order of enactment:
Interim Public Procurement and Disposal Regulations 2006
The Local Government Act, 2009
The Transitional Constitution of the Republic of South Sudan 2011
Public Financial Management and Accountability Act 2011
6.2.2 Definition of PFM
The Framework on State Public Financial Reform140 defines:
Public Financial Management (PFM) supports the effective and accountable use of public resources and helps to underpin fiscal discipline.
In addition, it also explains the meaning of ‘fiscal discipline’ as well as the objectives of PFM as follows:
Fiscal discipline means that there is effective control of the budget by setting ceilings on expenditure. It requires overall expenditure control, without which it is impossible to achieve effective prioritisation and implementation of policy priorities and programmes.
The basic objectives of public financial management are:
1. To collect sufficient resources from the economy in an efficient and effective manner that minimises harm to economic activity 2. To allocate resources in accordance with government priorities 3. To utilise resources in an effective and efficient manner to ensure that services are delivered, and programmes implemented, cost-effectively.
140
Ministry of Finance and Economic Planning (MoFEP), Framework on State Public Financial Reform, page 4,
June 2010, Juba

6-4
6.2.3 Budget preparation guidelines and circulars
The national and state governments' medium-term plan (three-year plan) and annual budget preparation exercises have been guided by a number of guidelines issued by the national Ministry of Finance and Economic Planning (MoFEP). In terms of medium-term planning, the guidelines for Budget Sector Plans targeting all Spending Agencies (National Ministries and other government bodies) and DPs are followed. Although the inadequate level of alignment of planning and implementation is still an issue, detailed procedures for the alignment of DPs' interventions with the PFM system are defined by the guidelines. The medium-term planning is an annual recursive exercise where three year plans are reviewed and amended. The Budget Call Circular includes the resource envelopes (or budget ceilings) of all the Spending Agencies, detailed cost estimation principles, unit costs including salary tables, and various budget formats; it is issued annually to facilitate organized budget compilation. The Circular assumes that Budget Sector Plans are a three-year planning and budget framework, and dictates that the Spending Agencies follow the framework for the formulation of the Annual Budget. For the allocation of the government's revenues, the concept adopted in the Budget Sector Plan and Annual Budget preparation is a top-down approach where resource envelopes are given from the higher authority for disaggregation into activities and expenditure items by lower authorities. Detailed discussion on this approach will be given in a later section. The governments of states and counties (the local governments) follow a set of budget preparation guidelines to develop medium-term plans and budgets. The guidelines set out the local governments’ planning and budget preparation cycles. The cycles are closely linked with the national cycle due to the fact that a large part of their financial resources are provided by the national government in the forms of unconditional and conditional transfers. For this reason, state governments start budget preparation in January for the following financial year (July-June). The guidelines also promote a participatory and bottom-up planning and budget preparation approach. Currently, it is perceived that the administrative and PFM capacity of the local governments is a challenging issue. Because the constitution provides high autonomy for the state governments, control over, for example, the conditional transfers by the national government is not well-secured or not transferred to the state governments. Local governments' inadequate PFM accountability, compounded by high fiscal risks, is a challenging issue to be addressed in the course of CAMP development. For CAMP implementation, state and county governments are the key players in the delivery of on-the-ground public services to rural communities and farmers. Without the engagement of the local governments, CAMP cannot be implemented, and therefore the capacity building of the local governments should be highlighted in CAMP. The following is a list of examples of major guidelines and circulars issued by MoFEP: Budget Sector Plans (National medium-term/three-year planning)
Guidelines for drafting Budget Sector Plans 2011-2013, June 2010 (pre-independence)
Development Partner guidelines for drafting Budget Sector Plans 2011-2013, June 2010 (pre-independence)
Guidelines for drafting Budget Sector Plans 2012-2015, November 2011 (post-independence)
Annual Budget (National annual planning)
Budget call circular for 2011 Budget preparation, October 2010 (pre-independence)
Guidelines for compiling budgets for 2012/13, 2012 (post-independence)
Budget call circular for 2012/13 Budget preparation, April 2012 (post-independence) State and County Budget (Local governments' medium-term and annual planning)

6-5
Guidelines for integrated state and county planning and budgeting, May 2010 (pre-independence)
Participatory planning and budgeting guide for Local Governments in Southern Sudan, January 2011 (pre-independence)
6.2.4 Budget documents
The annually recursive Budget Sector Plan and Annual Budget preparation exercises produce a number of budget documents. Each Budget Sector produces a Budget Sector Plan, and thus ten Budget Sector Plans are developed annually. Every year one Consolidated National Annual Budget associated with a summary document are approved by the National Legislative Assembly (NLA) and published. Regarding the committed and disbursed DP contributions, Donor Book and other sector based documents are created. The Donor Book is created by the Aid Information Management System in South Sudan which is maintained by MoFEP. These documents are widely distributed in an effort to maintain upward and downward accountability of the application of public funds. The following is a list of budget documents issued by MoFEP (examples of Budget Sector Plans are only for the Natural Resources Sector): Budget Sector Plan for Natural Resources Sector
Natural Resources Sector Budget Sector Plan 2011-2013 (July 2010; pre-independence)
Natural Resources Sector Budget Sector Plan 2012/13-2014/15 (to be obtained; post-independence)
National Annual Budget
Approved budget 2011 (pre-independence)
2012/13 approved budget (August 2012; post-independence)
National budget plan financial year 2012/13 (a summary of the approved budget; post-independence)
2013/14 approved budget (Under processing; post-independence)
National Budget Plan financial year 2013/14 (Under processing; post-independence) Indicative financial contributions for DP supported projects
South Sudan Donor Book 2011 (pre-independence)
South Sudan Donor Book 2012/13 (post-independence)
Natural Resources Sector Aid financing plan FY2012/13-FY2014/15 (post-independence)
6.2.5 PFM policies
To guide the improvement of legal instruments and resource appropriation laws (i.e. budgets) for planning and budget preparation, the establishment of a development policy with priority areas and indicative costing, and strategies for improvement of the country's PFM is essential. Since the country receives a large amount of externally sourced aid financing, a strategy to integrate the aid with the PFM system is also needed. Currently the highest level development policy of GRSS is the South Sudan Development Plan 2011-2013 (SSDP). To define partnership principles, mechanisms for aid coordination, benchmarks for aid delivery, design of aid operations, and implementing the aid strategy, the Aid Strategy for the Government of South Sudan was adopted by the government in November 2011. The following is a list of development policies, aid strategies and PFM policies developed by MoFEP:

6-6
Development policy and aid strategy
Government of Southern Sudan Aid Strategy 2006-2011 (November 2007; pre-independence)
South Sudan Development Plan 2011-2013 (August 2011; post-independence)
Aid Strategy for the Government of the Republic of South Sudan (November 2011; pre-independence)
PFM policies
Fiscal challenges and progress in public financial management (April 2008; pre-independence)
Framework on state public financial management reform (June 2010; pre-independence)
6.2.6 Pooled funding mechanisms
To finance activities in the post-conflict country six pooled funding mechanisms were in operation in 2013. The largest pooled fund named MDTF expired in May 2013. They were established during the pre-independence period except one which was established in the end of 2012. A new pooled fund named the South Sudan Partnership Fund (SSPF) is now under discussion for establishment as of June 2013. The pooled funding mechanism is one of the four types of aid instruments, namely, 1) standalone project support, 2) pooled projects, 3) local services support, and 4) budget support. Among these four instruments the level of alignment with the PFM system increases in the order above. However, local services support and budget support are not implemented in South Sudan. Since the CAMP process is government-driven, CAMP should prefer a higher level of integration, and therefore, the current pooled funding mechanism needs to be revisited to consider, for example, application of budget support and measures to increase accountability of the PFM system. The following is a list of pooled funding mechanisms:
Multi-Donor Trust Fund (MDTF) established in 2005 and expired in May 2013
South Sudan Recovery Fund (SSRF) established in 2008
Capacity Building Trust Fund (CBTF) established in 2004
Common Humanitarian Fund (CHF) established in 2005
Basic Services Fund (BSF) established in 2005
Health Pooled Fund (HPF) in 2012
South Sudan Partnership Fund (SSPF) under discussion for establishment as of July 2013.
6.3 Planning and budget procedures
In this section the planning and budget procedures in the pre- and post-independence periods are introduced in order to assess the questions of 1) how the government's PFM mechanism and government-DP coordination arrangements and their evolution can be described, and 2) how the CAMP process will be able to align with the PFM mechanism and coordination arrangements in order to secure allocation of financial resources for an effective and efficient implementation of CAMP. Prior to independence in 2011 the financial year of the Government of Southern Sudan began on January 1, and ended on December 31 each year. Following the independence of the Republic of South Sudan in 2011, the financial year was shifted to the period beginning July 1 and ending on June 30 the following year. In this section, before discussing the current post-independence budget procedures, the procedures of the pre-independence period will be introduced for comparison. It should be noted that the post-independence

6-7
budget procedures have only been followed for one year since independence and under the unusual circumstances of the oil shutdown which forced the government to produce the austerity 2012/13 budget. During the period of January 1 to June 30, 2012 the half-year austerity budget was developed to manage the transition stage between pre-independence and post-independence PFM cycles. Since the half-year austerity budget was an irregular administrative arrangement, it will not be discussed in this report.
6.3.1 Pre-independence budget preparation procedures
To describe the pre-independence budget preparation procedures the 2011 budget preparation was selected for examination. The Government of Southern Sudan (GOSS) commenced the budget planning in June 2010 when MoFEP issued two sets of Budget Sector Plan guidelines. The budget planning lasted for six months until the National Legislative Assembly (NLA) approved an Annual Budget in December of the same year. This six-month budget planning period was divided into two stages: the stage of Budget Sector Plan development, and the stage of Annual Budget development. The Budget Sector Plan was a three-year medium-term plan defining sector priorities and projection of resource allocations for identified Directorate-level activities. The priority activities and their objectives had to be consistent with the relevant sectorial policies. Although Budget Sector Plans were three-year medium-term plans (for DPs' investment), revisions and modifications were done every year prior to the development of an annual Budget which is developed within the framework of Budget Sector Plans.
6.3.2 Budget Sector Plan development
In case of the 2011 budget planning, the Budget Sector Plan development stage commenced in June 2010 when MoFEP issued 1) Guidelines for Drafting Budget Sector Plans 2011-2013 and 2) Development Partner Guidelines for Drafting Budget Sector Plans 2011-2013 to all the Spending Agencies and DPs concerned. The former Guidelines indicated the NLA approved resource envelopes for all Spending Agencies. As shown in Table 6-2 the stage lasted for two months up until late July 2010. The Budget Sector Planning Process commenced with a Training Week for all Budget Sector Working Groups from May 31 to June 4, 2010. The groups then had six weeks of sessions from June 7 to July 16, 2010 in which the groups drafted their Budget Sector Plans and met once a week. July 16, 2010 was the deadline for completion of the Budget Sector Plans. Each Sector presented its draft plans to MoFEP during a Review Week July 19 to 23, 2010. MoFEP sent final Budget Sector Plans to the Ministry of Labor and Finance Committee of the Southern Sudan Legislative Assembly, and development partners. Finally, MoFEP presented the Plans to the Council of Ministers.
Table 6-2: Schedule for Budget Sector Plan development
Week in 2010 Responsibility of:
To be completed and agreed upon by MoFEP
Training Week: May 31
to June 4
GOSS • Sector objectives and targets
• Major programme areas and main activities
DPs • Development Partner reporting begins
Week 1: June 7 to 11
GOSS • 2010 Half-year Performance Report
• Sector overview
• Finalize sector targets
Week 2: June 14 to 18
GOSS • Finalize roles and responsibilities of GoSS and Development Partners
• Finalize sector overview

6-8
Week in 2010 Responsibility of:
To be completed and agreed upon by MoFEP
Week 3: June 21 to 25
GOSS • Spending Agencies compile: • Overall costing for 2011 • Existing contractual obligations • Breakdown of state transfers
• Individual institutions’ additional top 2 priorities • Revenue collection
DPs • The deadline for submission of development partner templates
Week 4: June 28 to July 2
GOSS • Main activities by Spending Agencies
DPs • Draft donor reporting presented by Development Partner Co-Chair and discussed
Week 5: July 6 to 10
GOSS • Consolidated sector activities
DPs • Finalize donor reporting
Week 6: July 12 to 16
GOSS • Sector reviews of Draft Budget Sector Plan
Review Week: July 19 to 23
GOSS • Review week and incorporation of clarifications and amendments requested by MoFEP and Ministry of Labor and Public Service.
GOSS • MoFEP sends final Budget Sector Plans to Ministry of Labor and Public Service, Ministry of Parliamentary Affairs, Ministry of Cabinet Affairs, the Economy, Development, and Finance Committee of the Southern Sudan Legislative Assembly, and development partners, and they are presented to the Council of Ministers.
Source: MoFEP. June 2010. Guidelines for Drafting Budget Sector Plans 2011-2013. Juba. p.15. CAMP Task Team assembled the source information.
DPs were also involved in the process of Budget Sector Plan development due to the large resource contributions committed and planned by DPs. As indicated in Table 6-2 DPs were requested to attend the Training Week where their reporting began; they submitted development partner templates in Week 3; the DP Co-Chair presented the draft donor reporting in Week 4, and finalized the donor reporting in Week 5. While each Budget Sector Working Group met once a week during the six weeks from June 7 to July 16, 2010, they also organized intra-ministerial discussions in their respective Ministries to draft contents of Budget Sector Plans. In the case of MARF the officers of Planning, Statistics and Documentation Directorate attended the Training Week, and then organized intra-ministerial meetings with the Undersecretary and DGs of MARF. At the meetings disaggregation of MARF's resource envelope into envelopes for Directorates and priority areas were discussed in line with the polities of the Ministry. From these discussions, a focal person from each Directorate compiled the budget estimate using these envelopes. Drafts of the half-year Performance Report, sector overview, sector targets, overall costing for 2011, existing contractual obligations, breakdown of state transfers, and MARF's additional top 2 priorities were compiled by the focal persons. The drafts were consolidated by the officers of Planning, Statistics and Documentation Directorate, and presented by the Minister, Undersecretaries, DGs, and officers of the Directorate at the Natural Resources Sector Budget Working Group meetings. The working group finalized the draft of the Natural Resources Sector Budget Sector Plan 2011 which was sent to the Ministry of Public Service (MPS) which verified the budget allocations as to personnel costs. Then, the draft was sent to MoFEP for verification and submission to the NLA for its approval.

6-9
6.3.3 Annual budget development141
The formulation of the Annual Budget 2011 commenced when MoFEP and the National Ministry of Labour and Public Service (MoLPS) collectively issued the Budget Call Circular for 2011 Budget Preparation in October 2010 to all Spending Agencies. MoFEP revised the resource envelopes of all Spending Agencies based on the 2011 Budget Sector Plans, and informed the Agencies of the NLA approved resource envelopes by the Circular. As shown in Table 6-3 the drafting of the Annual Budget was done within a week in October 2010. Spending Agencies were given a relatively short period of time because the justifications and cost estimates had already been discussed by the Agencies during the period of 2011 Budget Sector Plan formulation. In this way, Budget Sector Planning enhanced the link between planning and budget preparation across GOSS, and provided a foundation for Annual Budget preparation. An example of 2011 Annual Budget preparation by MARF follows. A ministerial focal officer was assigned by the Director General (DG) of Directorate of Planning, Statistics, and Documentation (DPSD) at the time of 2011 Sector Budget Plan development. The one-day Annual Budget preparation training on October 25, 2010 organized by MoFEP was attended by the focal officer, all DGs expect DG of State Affairs and Special Project Directorate, all professional officers of DPSD and the focal officer of each Directorate. During the training the attendees were provided with the ministerial and directorate resource envelopes stored in an Excel file, and guidelines and formats for budget preparation and execution management. At the workshop MoFEP explained the financial position of the government and budget preparation procedures to be followed by all Spending Agencies. Following the workshop, the focal officers of MARF called several meetings within MARF to discuss and agree the resource envelopes given each Directorate; each Directorate disaggregated its envelope into cost items under a matrix of activities and expenditure items. The ministerial focal officer consolidated disaggregated budget estimates of all Directorates and compiled MARF's budget within a week as stipulated by MoFEP. This process was followed for government resources which did not include donor contributions.
141
The budget process is the same in all GRSS ministries.

6-10
Table 6-3: Schedule for annual budget 2011 development
Date in 2010
Responsibility of:
Activities
Training Day: October 25
GOSS • MoFEP and Ministry of Public Service hold a budget preparation workshop for all Spending Agencies
• Electronic versions of the forms for budget preparation were given out at the workshop.
October 25-29
GOSS • To ensure that Spending Agencies include all known expenditure commitments within their budget submissions, and fit within their ceilings, they are requested to adopt the following approach during their budget preparations:
• Update the Agency’s 2010 performance table, as compiled in their Budget Sector Plan, to indicate the activities which are expected to be completed by the end of December 2010.
• Update GOSS salary and allowance obligations for 2011, in line with the Public Service pay scale indicated by the Ministry of Labor and Public Service as a part of the Circular.
• Update conditional transfers to states (for salaries, operating and capital). It is expected that Agencies should leave these at the same level as contained in their Budget Sector Plan.
• Update planned contractual payments: Agencies set out all their contractual commitments in their Budget Sector Plans.
• Allocate the remaining balance to other salary (overtime, incentives, etc.), operating and capital items. It is important to note that no vehicle purchases can be made in 2011.
• Update the detailed activity descriptions in line with the final budget allocations.
• Calculate Agency estimated revenue collections in 2011 according to each type of revenue to be collected.
October 29 GOSS • The deadline for submission of budget estimates to MoFEP
Source: MoFEP and Ministry of Labor and Public Service. July 2010. Budget Call Circular for 2011 budgetpreparation. Juba. pp. 10-11 and 19. CAMP Task Team assembled the source information.
6.3.4 Comparison between budget sector plan 2011-2013 and Annual Budget 2011
The Spending Agencies were grouped into four Pillar Working Groups which were further divided into ten Budget Sector Working Groups. The Ministry of Agriculture and Forestry (MAF), Ministry of Cooperatives and Rural Development (MCRD), and Ministry of Animal Resources and Fisheries (MARF) were members of Natural Resources Budget Sector Working Group consisting of the following Spending Agencies:
Ministry of Agriculture and Forestry
Ministry of Animal Resources and Fisheries
Ministry of Co-operatives and Rural Development
Ministry of Wildlife Conservation and Tourism
Southern Sudan Land Commission
Ministry of Environment

6-11
Table 6-4: Overview of Natural Resources Sector budget 2011-2013 and Annual Budget 2011
Annual/ Sector Budget
GOSS/ DPs
Central/State Government
No of Staff
Expenditure categories ('000 SSP or '000USD)
Wages Operating Capital Total Total in USD
*1
2010 Revised Annual Budget
GOSS National government
6,298 (TBD) (TBD) (TBD) 130,235
State transfers (TBD) (TBD) (TBD) 106,869
Sub-total 144,137 40,261 52,706 237,104
DPs 108,319 45,133
Total 345,423
2010 Revised Annual Budget Expenditure (provisional)
GOSS National government
5,014 52,206 29,853 13,544 95,603
State transfers 79,381 7,677 2,685 89,743
Sub-total 131,587 37,529 16,230 185,346
Execution rate 91% 93% 31% 78%
DPs (tbd) (tbd)
Total (tbd)
2011 Natural Resources (NR) Sector Budget
GOSS Ceiling 253,367
National government
6,327 66,526 31,275 48,608 146,209
State transfers 12,651 79,381 9,047 20,441 108,869
Sub-total 18,978 145,907 40,321 69,049 255,078
DPs 69,234 28,848
Total 324,312
DPs medium-term projections
2012 51,734 21,556
2013 46,920 19,550
2011 Annual Budget
GOSS Ceiling 267,454
National government
5,143 60,363 49,217 50,288 159,869
State transfers 12,651 79,381 6,727 29,770 115,878
Sub-total 17,794 139,745 55,944 80,058 275,747
DPs 118,006 49,169
Total 393,753
DPs medium- term projections
2012 57,102 23,792
2013 37,200 15,500
% change from 2011 NR Sector Budget to 2011 Annual Budget
GOSS Ceiling 6%
National government
-19% -9% 57% 3% 9%
State transfers 0% 0% -26% 46% 6%
Sub-total -6% -4% 39% 16% 8%
DPs 70% 70%
Total 21%
DPs medium- term projections
2012 10% 10%
2013 -21% -21%
Note: 1) Exchange rate applied is SSP2.4/USD Source: 1) GOSS. July 2010. Natural Resources Sector Budget Sector Plan 2011-2013. Juba. pp. 46-76. 2)
GOSS. March 2011. Approved Budget 2011. Juba. pp. 174-252.

6-12
6.3.5 Post-independence planning and budget preparation procedures
6.3.5.1 Implementation structure of South Sudan Development Plan 2011-2013
The post-independence planning and budget preparation procedures are characterized by the implementation structure of the South Sudan Development Plan 2011-2013 (SSDP) approved by the NLA in August 2011. The procedures are based on the provisions in the Public Financial Management and Accountability Act 2011 (PFMAA). The overall technical responsibility is vested in the South Sudan Development Plan Technical Working Group (SSDP-TWG) which is chaired by the Undersecretary of MoFEP and supported by the MoFEP Secretariat. Under the SSDP-TWG are four Pillar Working Groups, Context Working Group, and Cross Cutting Working Group. Each Pillar Working Group consists of several Sector Working Groups. As introduced before SWGs are the main vehicles of the development of Budget Sector Plans. CAMP is a master plan integrating the service deliveries of three ministries: MAFCRD (former Ministry of Agriculture and Forestry and Ministry of Cooperatives and Rural Development), MARF, and MWRI. These ministries belong to two Sector Working Groups. MAFCRD and MARF are members of the Natural Resources Sector Working Group, and MWRI is a member of the Infrastructure Sector Working Group. Both SGWs are members of Economic Development Pillar Working Group which is chaired by the Undersecretary, Forestry, and Co-chaired by the World Bank and African Development Bank.
6.3.5.2 Post-independence budget calendar
Following the independence of the Republic of South Sudan on July 9, 2011 the financial year had shifted from the period January/December of the same calendar year to July 1 of one year to June 30 of the following year. The shift in timing of the financial year has caused a change in the budget calendar. In the case of the pre-independence process, the timings of Budget Sector Plan formulation (end May to end July) and Annual Budget development (October) were clearly separated. However, as shown in Table 6-5, Budget planning (three-year medium-term planning) began in November 2011 and ended May 2012, and annual budgeting began in March 2012 and ended in June the same year. The two processes overlapped in the period March to May 2012. However, if only Budget Sector Plans, which are a subset of the budget planning process, are considered there was no overlap since budget sector plan development was completed by the end of February 2012. The Budget Planning (three-year medium-term planning) process includes the development of the Preliminary National Budget Plan, Budget Sector Plans, and finally the National Budget Plan which consists of consolidated Budget Sector Plans approved by the NLA. Although the new budget calendar includes several new terminologies and different arrangements of timings, the basic procedure of updating medium-term planning followed by Annual Budget preparation remains the same. The 2012/2013 Annual Budget development was the first annual budget preparation after the independence of the Republic of South Sudan. It is noted that the budget preparation exercise for 2013/2014 should be better organized than the formulation of the 2012/2013 Annual Budget. Deadlines set out in the 2012/2013 budget calendar were not always met, maybe due to the transition period of pre- and post-independence.
6.3.5.3 Formulation of National Budget Plan 2012/13-2014/15 (three-year medium-term planning)
As shown in Table 6-5, the National Budget Plan 2012/13-2014/15 (i.e. three-year medium-term planning) commenced November 15, 2011 when MoFEP submitted the Preliminary National Budget Plan (Pre-Budget Statement) to the Council of Ministers for its approval.

6-13
The Preliminary National Budget Plan included estimates of available resources and revenues consistent with the fiscal and monetary plans for economic and social development. The Plan also included indicative Medium Term resource envelopes. Then on November 23, 2011 MoFEP issued Guidelines for drafting Budget Sector Plans 2012-2015 to all Spending Agencies to commence Budget Sector Plan formulation.
Table 6-5: Budget calendar for 2012/13 budget
Deadline (Month/Day)
Budget Planning (3 year
medium- term
planning)
Annual Budget
preparation
Budget Performance Reporting
(Budget execution monitoring)
Administrative procedure for approval
(CoM: Council of Ministers)
(NLA: National Legislative Assembly)
(SAs: Spending Agencies)
2011
Sep.
Oct. Short fiscal outturn reports/BPS reports
*9 From CoM to NLA and public
Nov. 15 23
Preliminary National Budget Plan*1
Issuance of Guidelines for drafting Budget Sector Plans 2012-2015
From MoFEP to CoM From MoFEP to SAs
Dec. Semi Annual Budget Performance Report
*10 From CoM to NLA and public
2012
Jan. 9-13
Short fiscal outturn reports/BPS reports
*9 From CoM to NLA and public
20 27
(Annual planning process Phase I) One-week planning and budget planning system training
• Planning Call Circular for Budget Sector Plans
• DPs input aid operation planned allocations in AIMS
• Spending Agencies complete budget planning system input
• Lead sector DP complete draft Aid Financing Strategy
Organized by MoFEP
Feb. 10 13-17 24 End
(Annual planning process Phase II) SWGs prepare Budget Sector Plan sector-wide sections 1-4 Review week for Budget Sector Plans Final Budget Sector Plan
*2 submission
Preliminary National Budget Plan*1
Draft Medium Term Fiscal Framework formed based on BSPs Medium Term Expenditure Framework formed based on BSPs
From CoM to NLA From CoM to NLA
Mar. Consultations with Special Committee on Economy Development Finance of the Assembly
Apr. Draft Annual Budget Plan laid before Council Annual Budget Call Circular for 2012/13 Budget State budget/PFM consultations
From MoFEP to SAs
Short fiscal outturn reports/BPS reports*9
From CoM to NLA and public
May 1 National Budget Plan*3
From MoFEP to CoM 1 Draft Budget Book
*4 From MoFEP to CoM
15 National Budget Plan*3
From CoM to NLA and public 15
15 Draft Budget Book
*4
Donor Book*5
Preparation of Annual Budget Report Citizens Budget (no legal deadline)
*6
From CoM to NLA From CoM to NLA From CoM to public
Jun. By 30 Appropriation Bill/Act*7
Budget speech Publication of the Annual Budget Report
From CoM to NLA
Jul. Approved Budget Book*8
(30 days after NLA From NLA to public

6-14
Deadline (Month/Day)
Budget Planning (3 year
medium- term
planning)
Annual Budget
preparation
Budget Performance Reporting
(Budget execution monitoring)
Administrative procedure for approval
(CoM: Council of Ministers)
(NLA: National Legislative Assembly)
(SAs: Spending Agencies)
approval) Short fiscal outturn reports/BPS reports
Annual Budget Performance Report*10
From CoM to NLA and public From CoM to NLA and public
Aug.
Sep.
Oct. Short fiscal outturn reports/BPS reports
*9
From CoM to NLA and public
Nov. Note: 1) Preliminary National Budget Plan (Pre-Budget Statement): Preliminary estimates of resources and revenues,
consistent with the fiscal and monetary programs and plans for economic and social development, together with indicative Medium Term resource envelopes.
2) Budget Sector Plans: Three year budget plans prepared by Sector Working Groups to achieve SSDP and sectoral Objectives.
4) Draft Budget Book (Budget Proposal): Draft detailed budget estimates for revenue and expenditure. 5) Donor Book (Report on loans and grants): Overview of donor grants and loans; performance of grants and
loans vs objectives; and total indebtedness. 6) Citizens Budget (Newspaper Pamphlet): No legal deadline. A simplified presentation of the budget proposal
for wide dissemination to the public. 7) Appropriation Bill/Act: The legal basis on which the government raises revenue and spends funds; 8) Approved Budget Book: Approved Detailed Budget Estimates. 9) Short fiscal outturn reports/BPS reports including narrative on performance: Within 30 days of the end of each
quarter interim quarterly revenue and expenditure reports are issued to the NLA and public. 10) Annual and semi Annual Budget Performance Reports: The report without legal deadline is a half yearly
information on agency budget performance in terms of outputs and expenditure. Source: CAMP Task Team based on MoFEP. June 2012. National Budget Plan Financial Year 2012/13. Juba. p.4.
and MoFEP. November 2011. Guidelines for drafting sector plans 2012-2015. Juba. p.6.
Sector Working Groups (called Budget Sector Working Group in the pre-independence period) began working on their plans. By the end of February 2012, formulation of the Preliminary National Budget Plan and Budget Sector Plans were completed and submitted by the Council of Ministers to the NLA for approval. On May 1, 2012 MoFEP completed the formulation of the National Budget Plan and submitted it to the Council of Ministers for approval. Finally, on May 15, 2012 Council of the Ministers presented the National Budget Plan to the NLA for final approval.
6.3.5.4 Formulation of Annual Budget 2012/13
Prior to the issuance of the Budget Call Circular for 2012/13 Budget in April 2012, one-week budget preparation training (Budget Preparation Training) was held from January 9 to 13; it was attended by officers from all Spending Agencies. The Budget Preparation Training was held at the Government Accountancy Training Centre, Juba. It was particularly organized to introduce and familiarize attendees with the Budget Planning System (BPS) which is a database application program used by national and state governments. BPS allows government officers to handle budget preparation in a simple and coherent manner. For the 2012/13 Annual Budget preparation the resource envelopes were made known in April 2012 by the Budget Call Circular. The Natural Resources (and Rural Development) SWG meeting, chaired by MAFCRD and co-chaired by the EU, was held in the same month. Although the resource envelopes are imposed, an increase in the amount of the envelope can be considered by MoFEP if requested with adequate justification. In this case a Minister level negotiation is arranged to settle the request. MoFEP assessed and consolidated the draft annual budget 2012/13, which is called the "Draft Budget Book," and submitted it to the Council of Ministers on May 1, 2012.

6-15
Once the Draft was submitted to the Council of Ministers, Spending Agencies were called in and the Draft was presented and defended by them at Cluster Committees consisting of members of the NLA. The process of modification of the draft budget was handled by the Spending Agencies and MoFEP. Once consent was given by the Cluster Committees, the draft budget was presented on May 15, 2012 to a full session of the NLA by the Minister of MoFEP. The minister conducted a first reading (line-by-line reading of the draft budget by a Minister) followed by second and third readings to complete presentation and discussion on the Draft Budget. During these readings, concerned DGs and their focal officers were on standby ready to deal with queries and to defend their part of the Draft Budget. DGs can be called to explain the budget in front of the NLA. The NLA approved the Annual Budget 2012/13 in August 2012. The approval which was meant to take place sometime in June 2012 was delayed for two months due to the lengthy process of budget negotiation and approvals at various levels of the administration.
6.3.5.5 Annual Budget 2012/13 is considered an austerity budget
The oil shutdown in July 2012 sent the country into a fiscal emergency, and the government responded by formulating an austerity budget for the three-month period April-June 2012. The budget was submitted to the NLA. The Annual Budget 2012/13 is also considered an austerity budget, and thus, special rules have been applied to budget estimation. They are, for example, 1) no vehicle purchase, 2) no domestic travel expenses (international travel budget was allowed to be estimated), 3) no overtime compensation, 4) no incentives, and 5) no housing allowances. Tight control of budget execution was also implemented by imposing monthly ceilings on expenditures. Since oil revenues consisted of 95% of government revenues in 2011, MoFEP considers that diversification of revenue sources is urgently needed.
6.3.5.6 Annual Budget 2013/14 is also considered an austerity budget
However, Sudan and South Sudan reached agreement to resume the oil flow, H.E. President Salva Kiir stated ‘It is not possible to leave austerity away. We must pay our dues. We have incurred debts to those who kept us afloat and enabled us to keep core services running.’ and ‘our next budget will retain many elements of austerity and we must keep our belts tight until the end of the year’ This is the clear statement that GRSS will continue with an austerity budget for the year 2013/2014 and MoFEP instructed spending agencies accordingly. The same restrictions as in the previous year were imposed.
6.3.6 Planning and budget preparation of MAFCRD and MARF
In the following paragraphs, intra-ministry coordination of planning and budget preparation within MARF and MAFCRD will be described in order to articulate 1) function of the Planning Directorate, and 2) top-down nature of the resource allocation process.
6.3.6.1 Formulation of 2012/13 Annual Budget: MAFCRD
The Deputy Director (DD) of Planning and Statistics Division, MAFCRD is the budget focal person of the Ministry. The role of the DD in the budget preparation is to coordinate among Directorates of MAFCRD and between the Ministry and MoFEP. The DD did not attend the Budget Preparation Training. Offers of the Accounts Department and IT section attended the training. In MAFCRD two computers in the office of the Accounts Department were assigned to run the budget-database system (or BPS). The NLA approved resource envelopes were made known in the Budget Preparation Circular for 2012/13 Annual Budget issued by MoFEP in April 2012. The resource envelope of MAFCRD was discussed at regular DG bimonthly meeting to determine Directorate envelopes. If it was necessary ad-hoc DG meeting were held. Each Directorate selected a focal officer to form a budget working group

6-16
in the Ministry. The working group met every two weeks during the period of April-May 2012 to form disaggregated activity and expenditure category based budget estimates within the resource envelopes decided by the DGs' meeting. Budget working group discussions were organized by the Planning and Statistics Division which had the budget to arrange meetings at outside rented venues to avoid interference. These meetings were also held at Cassava Hall of the Ministry. The budget working group is active throughout the fiscal year working on budget preparation, monitoring of budget execution and disbursement, and minor budget adjustment. For the 2012/13 Annual Budget MAFCRD succeeded to obtain an additional budget of SSP 20 million on top of the imposed resource envelope to finance the lending capital of the Agriculture Bank of South Sudan. This Bank is intended to provide soft loans to commercial farmers for their production activities. One of the arguments presented in the NLA by the Ministry was that the lending and interest rate of the additional resources would be assessed by the bank case-by-case; they would use a commercially based appraisal of the agricultural production plan proposed by a potential borrower (i.e. a farmer or a group of farmers). Thus, the resources are likely to be applied for productive and value-added ends. If the Ministry financed subsidies, at the end of the program there would be no resources remaining; in contrast, financing agricultural loans would be a better option for the generation of economic gains. This argument of the Ministry was based on the lessons learned from past experience. For example, a politically motivated program had distributed 200 tractors at a subsidized price, but the government neither received payments from the beneficiaries nor was sure if the tractors had been used productively. It was also noted that to reduce production risks and thus assessed interest rates, the government's technical support to the borrower needed to be considered.
6.3.6.2 Formulation of 2012/13 Annual Budget: MARF
In the case of MARF, one focal officer was assigned by the Director General of Planning, Statistics, and Documentation to handle the formulation of the 2012/2013 Annual Budget. All the DGs of the Ministry, the focal officer, and a BPS operator attended the Budget Preparation Training. BPS requires the Windows 7 operating system which was only available on one computer at the Undersecretary’s office. There was consensus in the Ministry that provision of vaccinations and veterinary services were priority areas.
6.3.7 Planning and budget preparation of state ministries
In each state, the state Ministry of Finance and Economic Planning (SMoFEP) plays an important role in planning and budget preparation. The preparation of budget by state ministries is linked to the national budget preparation. After MoFEP informs SMoFEP of the ceilings for their budget, SMoFEP requests each Spending Agency to formulate their annual budget based on the ceilings provided. The NLA approves the national budget in either July or August depending on the schedule of the budget process. The major source for budgets in states is the block grant. The budget for 2012/2013 was delayed and was only approved by the NLA in August 2012. The 2013/2014 budget is also delayed and still has to be approved by the NLA. Through the field survey conducted by the ID subsector team, it is confirmed that the planning and budgeting procedures at the state level are very similar to the national government procedures. In the following paragraphs two cases of planning and budget preparation procedures, within 2 states, Lakes and Western Equatoria, are described.142
142 The Director of Animal Production, MARF, Upper Nile State, stressed that the budgetary situation of the state
was similar to other states. The majority of ministries spend a large proportion of their budget for salaries and wages of officers and workers.

6-17
6.3.7.1 Formulation of 2012/13 Annual Budget: cases in Lakes and Western Equatoria states
The initial step of budget formulation started in January 2012 when the Annual Budget Planning Session, Phase I started in the GRSS. In February when the Preliminary National Budget Plan was formulated, the DG of SMAF requested the Director of Planning and Administration to nominate two officers as budget planning officers. In case of SMAF, two Deputy Directors (DDs) were selected. The role of the DDs in budget preparation is to coordinate among the Directorates of SMAF and between SMAF and SMoFEP. The DDs did not attend any of the budget preparation training. Their main activities started when the budget preparation circular with the resource ceilings was received from SMoFEP in August 2012143; the DDs requested each Directorate to prepare their own budget. After receiving the budget information from each Directorate, the DDs compiled all the information prepared and submitted the draft budget of SMAF to the Director of Planning and Administration, who submitted the draft budget to the DG and later the Minister for his/her approval. The Minister submitted the draft budget to the State Governor for his/her information and the Council of Ministers for discussion and defence. After the approval of the Council of Ministers, the draft budget was submitted to the State Legislative Assembly for final approval. Finally, the State Governor signed the budget. As shown in Table 6-6, due to the austerity budget, the major spending item is salaries for officers, which accounted for 68% in the 2011/2012 budget and increased to 86% in the 2012/2013 budget. The reason for the significant increase in percentage was the reduction of the total budget, i.e., operating expenditures were cut while salaries were maintained. This resulted in suspending activities in some Directorates. Once this budget is decreased, the activities of counties are automatically suspended which may have a negative impact on crop and animal production. In fact, in Lakes, Upper Nile State and Western Equatoria, austerity budget measures squeeze the implementation of agriculture- and livestock-related projects.
Table 6-6: Budget of Ministry of Agriculture and Forestry (2011/12 and 2012/13), Lakes State
Category 2011/2012 Budget
2012/2013 Budget
Total 1. Salary 1.1 Wages and Salaries 1.2 Incentives and Overtime 1.3 Pension Contributions 1.4 Social Benefits 2. Operating 2.1 Travel 2.2 Staff Training 2.3 Contracted Services 2.4 Repairs and Maintenance 2.5 Utilities and Communications 2.6 Supplies, Tools and materials 2.7 Other operating expenses 2.8 Oil production cost 3. Transfers 3.1 Transfers Conditional Salary 3.2 Transfers Operating 3.3 Transfers Capital
4,036,891 (100%) 2,757,398 (68%)
Unknown Unknown Unknown Unknown
295,158 (7%) 51,427 50,000 74,422 10,000 6,000
78,309 25,000
0 0 (0%)
0 0 0
3,208,654 (100%) 2,757,398 (86%)
2,356,389 423
400,586 0
41,319 (1%) 10,000 20,000
0 5,349
0 5,970
0 0
0 (0%) 0 0 0
143
The approval of National Budget Plan was originally scheduled in June 2012. Due to austerity measures and
the newly introduced financial year (July-June), the procedure was delayed.

6-18
Category 2011/2012 Budget
2012/2013 Budget
3.4 Transfer Other Oil 3.5 Transfers to International Organizations 3.6 Transfers to Service Delivery Units 4. Other 4.1 Interest 4.2 Subsidies 4.3 Grants and Loans to Businesses 4.4 Donations 4.5 Social assistance benefits 5. Capital 5.1 Infrastructure and land 5.2 Vehicles 5.3 Specialized Equipment
0 0 0
10,000 (1%) 0 0 0
10,000 0
974,335 (24%) 306,409 428,000 239,926
0 0 0
0 (0%) 0 0 0 0 0
409,937 (13%) 0
409,937 0
Source: Approved Budget 2012/2013, MAF, Lakes State
Table 6-7 shows the budget of the state Ministry of Agriculture, Cooperatives and Environment (SMACE), Western Equatoria State. The austerity budget significantly affected the operating budget which now accounts for only 5% of the total. SMACE is responsible for Agriculture, Forestry, Livestock, Fishery and Irrigation. The needs for those five sectors cannot be met with such a small operating budget.
Table 6-7: Budget of Ministry of Agriculture, Cooperatives and Environment (2012/13), Western Equatoria
Category 2012/2013 Budget
Total 1. Salary 1.1 Wages and Salaries 1.2 Incentives and Overtime 1.3 Pension Contributions 1.4 Social Benefits 2. Operating 2.1 Travel 2.2 Staff Training 2.3 Contracted Services 2.4 Repairs and Maintenance 2.5 Utilities and Communications 2.6 Supplies, Tools and materials 2.7 Other operating expenses 2.8 Oil production cost 3. Transfers 3.1 Transfers Conditional Salary 3.2 Transfers Operating 3.3 Transfers Capital 3.4 Transfer Other Oil 3.5 Transfers to International Organizations 3.6 Transfers to Service Delivery Units 4. Other 4.1 Interest 4.2 Subsidies 4.3 Grants and Loans to Businesses 4.4 Donations 4.5 Social assistance benefits 5. Capital
3,712,168 (100%) 3,252,168 (88%)
3,244,226 7,942
0 0
180,000(5%) 0 0 0 0 0 0 0 0 0 0 0 0 0 0
0 0 0 0 0 0 0
280,000 (7%)

6-19
5.1 Infrastructure and land 5.2 Vehicles 5.3 Specialized Equipment
0 0 0
Source: Approved Budget 2012/2013, MACE, Western Equatoria State
6.3.8 Observations regarding Budget Sector Plans and Annual Budget preparation
The budget preparation process adopted by the government seems to be a top-down process where resource envelopes are determined at the national, ministry, directorate, and finally the division level. These envelopes are decided by referencing, for example, the previous fiscal year's expenditure performances. Activity and expenditure category disaggregation is performed after the division level envelopes are determined. This may be appropriate if resource requirements by each government activity are small. However, in case of a large project, application of bottom-up resource estimation may be required for effective allocation decision-making. Finally, the work of the Project Management Units of DP supported projects and government funded activities should be compared. Information regarding the work and lessons learnt from MDTF operations would be beneficial for the development of CAMP implementation mechanisms.
6.4 Budget execution control and procurement procedures
6.4.1 Budget execution control and monitoring
6.4.1.1 Budget execution control and monitoring by MoFEP
Once a letter of execution is issued by an Undersecretary, if there is no budget allocated to the requested item, the letter is rejected. The current PFM system (a database system) maintained by MoFEP does not allow payment transfer if there is no budget registered in the system. Transfers of budget between items within sector are allowed whereas transfers across sectors (chapters in the annual budget book) are not allowed. If a budget transfer is necessary and can be justified, a Spending Agency submits a Budget Transfer Form to MoFEP for its consideration. The form indicates justification, and amount and timing of the transfer concerned. For the adjustment of estimated monthly expenditure a Spending Agency is required to submit an Expenditure Limit Adjustment Form to MoFEP for its approval. MoFEP introduced an Integrated Financial Management Information System (IFMIS) with support from the IMF and World Bank in 2012. IFMIS is an Access based database system developed by a Canadian company. IFMIS is able to handle budget preparation and processing, budget execution control, payment transfers, procurement control, revenue management, and asset management. To train government officers on using IFMIS, the World Bank provided a series of training courses in, for example, Kigali, Luanda. It was felt that the introduction of IFMIS made MoFEP more productive and a better performing institution than before when it had always been overspending due to inefficient budget execution monitoring and control.
6.4.1.2 Budget execution control and monitoring in MAFCRD
In the case of MAFRCD, monitoring of budget execution is primarily a responsibility of the Directorate of Planning and Agricultural Economics. However, the monitoring procedures are

6-20
under development and no ministry-wide monitoring activities have been organized. There is a monitoring method temporarily adopted by each Directorate where the six-month-work plan is used to monitor activities of each Directorate within the framework of Annual Budget and activities.
6.4.2 Procurement procedures
6.4.2.1 Capacity development of government procurement officers
The government's procurement capacity seems to have developed rapidly due to the priority given to selective investment in the officers involved in procurement. Their capacity has been improved through the implementation of a capacity development program financed by the Multi-Donor Trust Fund (MDTF). For example, a French consultant assisted with on-the-job training of procurement officers and conducted structured training of the officers. MARF's procurement officer attended a two-week seminar/training in Juba, a three-month introductory training course organized by and implemented at the East-South Africa Management Institute (ESAMI) in Dar es Salaam, Tanzania, a two-month intermediate procurement training course in Malawi organized by ESAMI, and a three-month advanced level procurement training course in Swaziland also organized by ESAMI. The World Bank supported capacity development programs in the region, frequently obtaining the training services of ESAMI. MoFEP organized procurement training sessions in Juba in May 2012. The government of Norway financed the sessions and the Crown Agent, a UK based international supplier, provided procurement training.
6.4.2.2 Procurement procedures: an overview
Due to the early stage of private sector development in South Sudan, local competitive bidding (LCB) is offered to suppliers and contractors based in Ethiopia, Kenya, Tanzania, and Uganda in addition to South Sudan. The procurement procedures differ according to funding sources, and two major procedures are the government procedure and the World Bank procedure. The basic steps of both procedures are identical with minor differences. The basic steps conform to international standards. The World Bank procedure involves obtaining 'no objection' from the Bank between important procurement steps, whereas the government procedure includes scrutiny of a draft contract by the Ministry of Legal Affairs before signing of the contract. Although Interim Public Procurement and Disposal Regulations 2006 are observed for government financed procurement, the World Bank procedure is followed for utilization of MDTF due to the absence of procurement law. Currently, MoFEP is drafting a procurement bill.
6.4.2.3 Internal procedure of budget execution and procurement at national level
Detailed intra-ministerial and inter-ministry procedures for budget execution in the case of MARF are presented below:
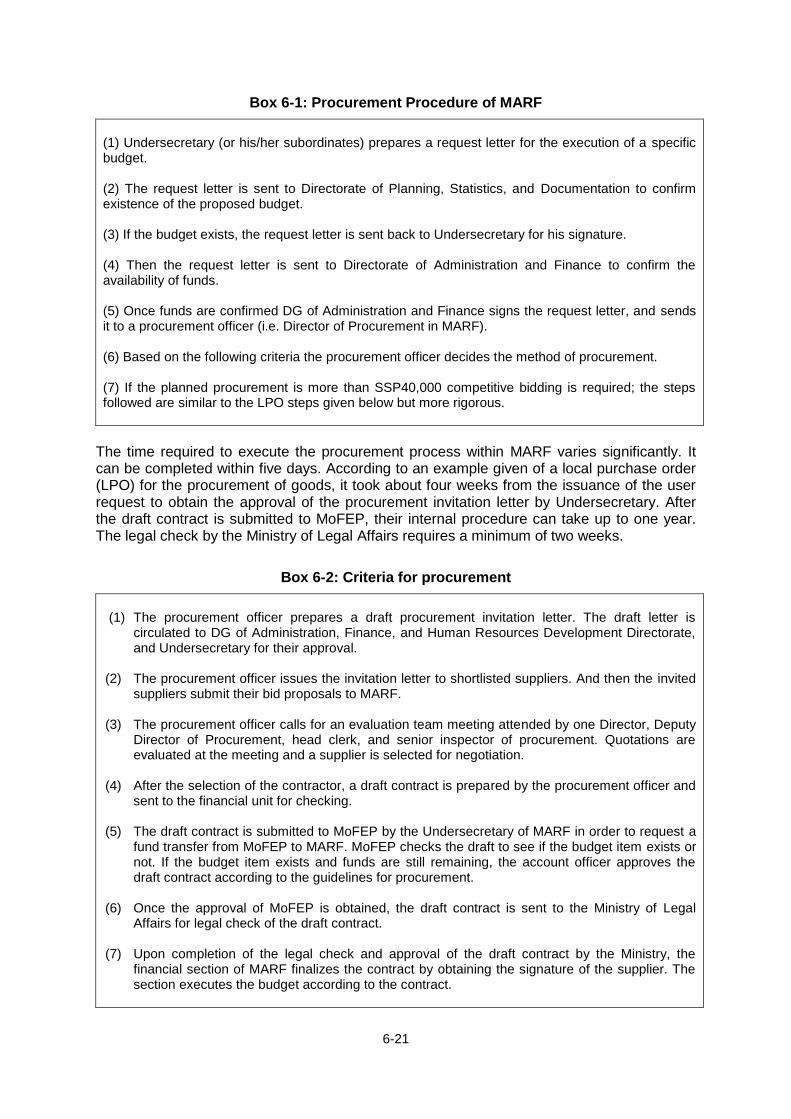
6-21
Box 6-1: Procurement Procedure of MARF
(1) Undersecretary (or his/her subordinates) prepares a request letter for the execution of a specific budget. (2) The request letter is sent to Directorate of Planning, Statistics, and Documentation to confirm existence of the proposed budget. (3) If the budget exists, the request letter is sent back to Undersecretary for his signature. (4) Then the request letter is sent to Directorate of Administration and Finance to confirm the availability of funds. (5) Once funds are confirmed DG of Administration and Finance signs the request letter, and sends it to a procurement officer (i.e. Director of Procurement in MARF). (6) Based on the following criteria the procurement officer decides the method of procurement. (7) If the planned procurement is more than SSP40,000 competitive bidding is required; the steps followed are similar to the LPO steps given below but more rigorous.
The time required to execute the procurement process within MARF varies significantly. It can be completed within five days. According to an example given of a local purchase order (LPO) for the procurement of goods, it took about four weeks from the issuance of the user request to obtain the approval of the procurement invitation letter by Undersecretary. After the draft contract is submitted to MoFEP, their internal procedure can take up to one year. The legal check by the Ministry of Legal Affairs requires a minimum of two weeks.
Box 6-2: Criteria for procurement
(1) The procurement officer prepares a draft procurement invitation letter. The draft letter is
circulated to DG of Administration, Finance, and Human Resources Development Directorate, and Undersecretary for their approval.
(2) The procurement officer issues the invitation letter to shortlisted suppliers. And then the invited
suppliers submit their bid proposals to MARF. (3) The procurement officer calls for an evaluation team meeting attended by one Director, Deputy
Director of Procurement, head clerk, and senior inspector of procurement. Quotations are evaluated at the meeting and a supplier is selected for negotiation.
(4) After the selection of the contractor, a draft contract is prepared by the procurement officer and
sent to the financial unit for checking. (5) The draft contract is submitted to MoFEP by the Undersecretary of MARF in order to request a
fund transfer from MoFEP to MARF. MoFEP checks the draft to see if the budget item exists or not. If the budget item exists and funds are still remaining, the account officer approves the draft contract according to the guidelines for procurement.
(6) Once the approval of MoFEP is obtained, the draft contract is sent to the Ministry of Legal
Affairs for legal check of the draft contract. (7) Upon completion of the legal check and approval of the draft contract by the Ministry, the
financial section of MARF finalizes the contract by obtaining the signature of the supplier. The section executes the budget according to the contract.

6-22
(8) Payment is not from petty cash. In the case of payments made against MDTF, payment is made from its account hosted by the World Bank, the custodian of MDTF.
6.4.2.4 Internal procedure of budget execution and procurement at state level
Once a letter of execution is issued by the Director General, if there is no budget allocated to the requested item, the letter is rejected by SMoFEP. The current PFM system maintained by SMoFEP only allows a payment transfer if there is a budget registered and available. If a budget transfer is necessary and can be justified, a Spending Agency submits a Budget Transfer Form to SMoFEP for its approval. The form indicates justification, and amount and timing of the transfer concerned.
Box 6-3: Procurement procedure of SMARF, Upper Nile
(1) The Director General (or his/her subordinates) prepares a request letter for the execution of a
specific budget. (2) The request letter is sent to the Directorate of Planning and Budgeting to confirm existence of
the proposed budget. (3) If the budget is in existence, the request letter is sent back to the Director General for his
signature within 2-3 days. (4) Then the request letter is sent to the Directorate of Administration and Finance to confirm the
availability of funds. (5) Once funds are confirmed, the Director of Administration and Finance signs the request letter,
and sends it to a procurement officer. (6) Based on the following criteria, the procurement officer decides the method of procurement.
Concerning budget allocation to counties and lower levels, other than salaries and wages of county and payam officers, only a few cases of funds being made available were observed. In the case of Juba and Yei River counties, a letter is issued by the assistant commissioner. If there is budget allocated to the requested item, the letter is approved by the executive director of the county. According to interviews by CAMP TT members, the procedure for budget execution is similar at all county offices they visited. However, there are many cases of budget transfers for items which were not in the budget, for example high ranking officers diverting funds to pay for vehicles not in the budget. Detailed procurement procedures for budget execution in the case of the State Ministry of Animal Resources and Fisheries (SMARF), Upper Nile are presented below:

6-23
Box 6-4: Criteria for procurement
(1) The procurement officer obtains three quotations based on the procurement invitation letter. The
draft letter is shared with DG, and the Director of Administration and Finance and the Director of Planning and Budgeting for their approval. This is called the Procurement Committee.
(2) The procurement officer issues an invitation letter to shortlisted suppliers. Then the invited
suppliers submit their bid proposals to SMARF. (3) The procurement officer calls for the Committee and quotations are evaluated at the meeting
and a supplier is selected for negotiation. (4) Usually, the price is considered as the most important element and they tend to choose the
company offering the second lowest price144. (5) After the selection of the contractor, a draft contract is prepared by the procurement officer and
sent to the financial unit for checking. (6) The draft contract is submitted to SMoFEP by the Director General in order to request a fund
transfer from SMoFEP to SMARF. SMoFEP checks the draft to see if the budget item exists. If the budget item exists and funds still remain, the account officer approves the draft contract according to the guidelines for procurement.
(7) Once the approval of SMoFEP is obtained, the draft contract is sent to the State Ministry of
Legal Affairs for legal check of the draft contract. (8) Upon completion of the legal check and approval of the draft contract by the Ministry, the
financial section of SMARF finalizes the contract by obtaining a signature from the supplier. The section executes the budget according to the contract.
6.4.2.5 Budget distribution to county, payam and boma
Theoretically each state ministry allocates budgets to the counties based on activities at the county level. Similarly the county offices plan activities and budgets for the payams but the county manages the funds on behalf of the payam. Activities are implemented by the payam whose primary role and responsibility are to supervise the implementation of projects and report on their progress. If there are no projects in a payam, there is no budget. At the boma level, no specific activities were observed except for seeds and fertilizer distribution in collaboration with the payam. Therefore, no budget is distributed to bomas.
6.4.3 Execution capacity of MAFCRD and MARF
In this section the results of a simple examination of budget execution capacity of MAFCRD and MARF are presented. The Southern Sudan Livelihoods Development Project (SSLDP) was selected as the reference for comparison. Since MAFCRD was created in 2012 by the merger of the Ministry of Agriculture and Forestry (MAF) and the Ministry of Cooperatives and Rural Development (MCRD) the capacity of MAFCRD is represented by those of MAF and MCRD due to very short history of MAFCRD. The analytical framework employed in this section is simple. Assuming that realization of officers' capacity is constrained due to insufficient budget allocation per staff, an estimate is made of additional financial resources the current government would be able to absorb,
144
Officers believe that lowest price is like to be the lowest quality. However, there is high possibility of fraud in
the selection process if they chose the second cheapest one.

6-24
without compromising accountability, effectiveness, and efficiency. In the course of the CAMP development, the Task Team members will have to answer to the question of how much additional financial resources, generated as part of CAMP implementation, can be managed by the current human resources, or will extra human resources be required. To answer to this question, the Team will need to develop methods to determine potential capacity; simple analysis may provide some clue to such discussions. Estimated budget allocation and expenditure per professional staff of the three Ministries is presented in Table 6-8, and the same estimates for SSLDP are shown in Table 6-9. Due to the limited data availability, the number of professional staff in the three Ministries in 2011 was applied to 2010 budget and expenditure data. Because the SSLDP's estimates in Table 6-9 include wages, operating costs, and capital costs, similar Ministry totals are used for comparison (refer to the numbers with bold letters in Table 6-8 and Table 6-9).
Table 6-8: Budget per professional staff in 2010 and 2011 budget, and 2010 expenditure
Budget Central Government/ State budget
Total no. of
Staff
No. of Prof. staff
*1
in 2011
Expenditure categories ('000 SSP)
Total budget by expenditure categories
Budget per professional staff
Wa
ge
s
Op
era
-
tin
g
Ca
pit
al
To
tal
Wa
ge
s
Op
era
-
tin
g
Ca
pit
al
To
tal
Ministry of Agriculture and Forestry
2010 Revised Budget
National government
668 (tbd) (tbd) (tbd) 35,415 155
State transfers (tbd) (tbd) (tbd) 15,095 66
Total 668 18,919 9,965 21,626 50,510 83 44 95 222
2010 Expenditure (provisional)
National government
650 12,392 5,681 4,797 22,870 54 25 21 100
State transfers 7,265 2,706 9,970 32 12 44
Total 650 19,657 8,387 4,797 32,841 86 37 21 144
Execution rate 104% 84% 22% 65%
2011 Annual Budget
National government
669 228 13,860 13,119 20,221 47,200 61 58 89 207
State transfers 676 7,265 2,706 5,124 15,095 32 12 22 66
Total 1,345 21,125 15,825 25,345 62,295 93 69 111 273
% change of total from 2010 budget 12% 59% 17% 23%
Ministry of Cooperatives and Rural Development
2010 Revised Budget
National government
268 (tbd) (tbd) (tbd) 8,890 79
State transfers (tbd) (tbd) (tbd) 2,000 18
Total 268 4,904 2,672 3,313 10,890 43 24 29 96
2010 Expenditure (provisional)
National government
224 4,279 2,319 1,102 7,699 38 21 10 68
State transfers 1,000 1,000 9 9
Total 4,279 2,319 2,102 8,699 38 21 19 77
Execution rate 224 87% 87% 63% 80%
2011 Annual Budget
National government
268 113 5,094 3,204 2,092 10,390 45 28 19 92
State transfers 7,000 7,000 62 62
Total 268 5,094 3,204 9,092 17,390 45 28 80 154 % change of total from 2010 budget 4% 20% 174% 60%
Ministry of Animal Resources and Fisheries
2010 Revised Budget
National government
282 (tbd) (tbd) (tbd) 16,374 66
State transfers (tbd) (tbd) (tbd) 15,000 60
Total 282 10,538 6,965 13,871 31,374 42 28 56 127

6-25
Budget Central Government/ State budget
Total no. of
Staff
No. of Prof. staff
*1
in 2011
Expenditure categories ('000 SSP)
Total budget by expenditure categories
Budget per professional staff
Wa
ge
s
Op
era
-
tin
g
Ca
pit
al
To
tal
Wa
ge
s
Op
era
-
tin
g
Ca
pit
al
To
tal
2010 Expenditure (provisional)
National government
203 5,192 4,423 3,875 13,490 21 18 16 54
State transfers 3,342 2,571 1,024 6,937 13 10 4 28
Total 8,534 6,994 4,899 20,426 34 28 20 82
Execution rate 203 81% 100% 35% 65%
2011 Annual Budget
National government
282 248 6,923 9,770 8,130 24,823 28 39 33 100
State transfers 260 3,342 1,621 14,046 19,009 13 7 57 77
Total 542 10,265 11,391 22,176 43,832 41 46 89 177
% change of total from 2010 budget -3% 64% 60% 40%
Note: 1) Staff grade of 1 to 14. Source: 1) GRSS. July 2010. Natural Resources Sector Budget Sector Plan 2011-2013. Juba. pp. 46-76. 2) GRSS. March 2011. Approved Budget 2011. Juba. pp. 174-252.
Estimates for per professional staff for the 2010 Budget, 2010 Expenditure, and 2011 Budget of MAF (national government) are SSP155,000, SSP100,000, and SSP207,000, respectively. Considering that the staff only executed actual expenditures, SSP100,000 can be selected for the MAF estimate. By the same reasoning, SSP68,000 and SSP54,000 are selected for MCRD and MARF's estimates, respectively. These indicate that expenditure per professional staff, including his/her own salary and benefits, is in the rage of SSP54-100,000 being equivalent to USD23,000-42,000 at the rate of SSP2.4/USD; this should be considered small. The similar professional staff expenditure in SSLDP is SSP343,000 which is equal to USD143,000, about three to six times higher than those of the Ministries. Although these are the results of a simple examination, three to six times higher absorption capacity of the national government can be expected for the CAMP development provided that its accountability, efficiency, and effectiveness are equal to those of the PMU of SSLDP. This approach needs to be further refined and verified and results will be included in the Interim Report.
Table 6-9: SSLDP's per professional annual expenditure for the period of 2011-2012
Category Value Unit
Items
Number of professional staff
a) PMU at MAFCRD 5 Staff
b) State Technical Desk Office in three States 9 Staff
c) Total (c = a + b) 14 Staff
Annual average project outturn during 2011-2012
d) In USD (d = USD4 million/2 years) 2,000 USD ('000)/year
e) In SSP (e = d * 2.4SSP/USD) 4,800 SSP ('000)/year
f) Annual average expenditure per professional staff (f = e/c) 343 SSP ('000)/staff
Source: Interviews with South Sudan Livelihood Development Project
6.5 Alignment of aid with GRSS's PFM system
6.5.1 Aid coordination mechanism
In the previous sections, the PFM system of the national government was introduced to consider the mobilization of resources for CAMP implementation through alignment with the Budget Sector Plan and Annual Budget processes. In this section the work of Sector Working Groups (SWGs), particularly that of the Natural Resources Sector Working Group,

6-26
is described to facilitate the discussion that the CAMP process should be part of the donor coordination platform in the Natural Resources Sector. The discussion should also be constructed on the recognition that the country's PFM system is and will evolve. A motto "one dollar-two dollars" had been adopted by the government during the pre-independence period for the financing of DP supported projects and programs. The motto means that when a DP contributes a dollar the government contributes two dollars to finance a project. Although it was said that the principle was followed by the government, as seen in the case of contributions to Multi Donor Trust Fund (MDTF) where the World Bank is the custodian of the Fund, the spirit and practice of mutual responsibility remain valid. The mutual accountability associated with the combined resource mobilization of the government and DPs is also the other most important principle of the alignment of aid to the PFM system. However, the reality is that the capacity to maintain such accountability by the national, state, and county governments is reported to be inadequate; thus, it should be noted that high-level efforts to strengthen the governments' accountability mechanism must be incorporated in CAMP to secure its financing.
6.5.2 Aid coordination structure
Figure 6-1 shows the current aid coordination structure defined in SSDP. The structure consists of 1) the High-level Partnership Forum (HPF) which is to provide an opportunity for senior members of the GRSS and development partners to discuss key strategic policy issues of interest to both groups; 2) the Quarterly Government-donor Forum (QGDF) which will be the central mechanism for coordination and information exchange between the GRSS and development partners; 3) the Inter-Ministerial Appraisal Committee (IMAC) which is to play a more strategic role, reviewing and approving overall donor country strategies, sectoral aid financing strategies and major aid operations (over USD10 million); 4) Sector Working Groups (SWGs) which will be central to aid coordination being enhanced through the introduction of a more strategic Sector-based Approach, with a 'lead donor' for each sector. In order for CAMP to be an officially recognized master plan, a draft CAMP should be processed through this aid coordination structure prior to submission of the draft to the Council of Ministers by MoFEP; the Council will then send the draft for final approval to the NLA. SSDP envisages that SWGs play the central role of aid coordination. SWGs are the forum where government and DP commitment to project implementation and resource allocation are facilitated and coordinated based on examination of, for example, project rationale, sector and sub-sector priority of project sets, capacity assessment of key implanting agencies particularly those of state and county governments, implementation and monitoring mechanisms, and resource requirements of the sets of projects defined in the draft CAMP document. Therefore, to secure the implementation of CAMP, its process should be managed so as to integrate with the government's SWG mechanism.

6-27
Figure 6-1: Aid coordination structure
Source: GOSS, 2011, South Sudan Development Plan 2011-2013, Juba, p.405 (hard copy)
6.5.3 Natural Resources Sector Working Group
The SWG approach is a part of the budget preparation mechanism involving the sector Ministries and DPs supporting the sector; it is organized and managed by the Sectoral Planning Department, MoFEP. Currently, 29 ministries, 10 commissions, and other types of Spending Agencies are classified into 10 Sector Working Groups in order to avoid duplication in segmented public investment and delivery of services. MoFEP envisages that the Sector Working Group (previously the Budget Sector Working Group) concept enables the Group to oversee all public financial management phases, including planning, budget preparation, execution, and evaluation of outcomes and impacts in order to secure effective feedback to the next PFM phase. It is expected that the Sector Working Group approach will enhance the mutual accountability of the government and DPs. The Natural Resources Sector does not include the Ministry of Water Resources and Irrigation (MWRI), and this arrangement may hinder effective coordination between the Ministries within the Sector and MWRI; this is critical because of the importance of water resources for the Sector. Therefore, it is necessary to consider a broader coordination arrangement inclusive of MWRI. MoFEP intends to further the integration of the DP coordination mechanism with the PFM system. With the technical support of the EU, MoFEP convened a Natural Resources SWG Meeting on October 10, 2012 to 1) review recent sector performance and 2) explore how to further develop systematic arrangements for the Sector to promote higher levels of public investment integration. Since the pre-independence period the EU has supported the transformation of the Natural Resources Budget SWG into the Natural Resources Sector Working Group. The EU has been the Co-chair of the Working Group and facilitated, for example, the compilation of "Natural Resources Sector: Sector Aid Financing Plan FY2012/13-FY2014/15" which sets out the plans for external aid to the natural resources sector. For the compilation of the document, information on the ongoing and planned contributions of DPs to the sector was gathered and consolidated. The information was also fed into the Aid Information Management System (AIMS) which was eventually used to produce "South Sudan Donor Book" by MoFEP.
Sector Working Groups (SWGs)
Heads of missionHigh-Level
Partnership Forum
(HPF)
Minister of Finance
and Economic
Planning
Quarterly
Government-Donor
Forum (QGDF)
Inter-Ministerial
Appraisal
Committee (IMAC)
Lead donor
representatives
Lead sector donors

6-28
6.5.4 Alignment of aid with MARF’s PFM system
Primary responsibility for DP coordination to achieve effective allocation of public resources rests on the government, and thus, its effort to improve the coordination capacity through the day-to-day operation of the government is very important. In this section MARF's Directorate of Special Projects is briefly introduced as an example of the government's effort to coordinate DP supported projects for their efficiency and effective implementation. The Directorate of Special Project staffed by the DG are coordinating five projects supported by the EU, one project by GIZ, one project by FAO, and three animal health projects supported by the governments of Germany, Belgium and Switzerland. The projects supported by GIZ and FAO will end soon. The procedures to initiate coordinated implementation of a DP supported project from the signing of an implementation agreement with a DP are as follows:
The Undersecretary and DP sign a project implementation agreement once an approval of the assisted project is received from the Minister and Deputy Minister of MARF.
The agreement is forwarded to DG of the Directorate of Special Projects with all the necessary information.
The DG facilitates the process of intra-ministerial coordination to assign relevant Directorates responsibility for project implementation.
At the same time each relevant Directorate appoints project focal officers who are also technical counterparts of the DP.
6.6 PFM instruments for CAMP implementation and the alignment of aid
6.6.1 PFM instruments and government's concern regarding aid flows
In the CAMP process the Task Team will justify, design, and cost sets of sub-sector projects with priorities and timelines. The Team will also examine, in consultation with the national and state governments and DPs, the application of PFM instruments for the implementation the projects. The examination will be carried out with respect to the nature and magnitude of public investment of the project concerned. The PFM instruments include the government's activity-based planning and budget preparation modality and various types of aid instruments. For the Task Team’s discussion, four aid instruments are presented in Table 6-10. They are: 1) standalone project support, 2) pooled funding, 3) local services support, and 4) budget support. Although it not in the scope of this study, appropriate choice and management of institutional instruments are also important. The Task Team will examine options of institutional arrangements such as national government's direct operation, decentralized or autonomous operation by state and/or county governments, and semiautonomous or autonomous operation by public or private sector agencies for effective and efficient implementation of CAMP.
Table 6-10: Characteristics and preferred use of aid instruments
Instrument Characteristics of instruments Preferred use of instrument
Standalone project support
• Project support is funding which is kept separate from mainstream Government expenditures
• Any aid separately identifiable from expenditures in GRSS plans, budgets and reports are considered by GRSS as project support
• Project support can use GSS planning, budget preparation, procurement and financial management systems
• The preferred use of project support in support of service delivery is for large-scale public infrastructure projects and humanitarian aid
• Project support is also an effective vehicle for the provision of time-bound technical assistance and capacity building, when the Government leads in the process
• Where project funding funds the operational costs of service delivery and/or

6-29
Instrument Characteristics of instruments Preferred use of instrument
Pooled funding
• Pooled funding is a form of project support but is jointly funded by multiple donors, providing a more coordinated implementation mechanism
small-scale infrastructure development • As they are strengthened, projects should
use Government procurement and financial management systems and processes
• Pooled project support is preferred to standalone projects
Local services support (LSS)
• LSS is where DPs disburse their funds directly to the Government Treasury and uses government PFM system s for planning and implementation
• LSS is earmarked for specific conditional state and county transfers
• LSS funded expenditures will be separately identifiable in the expenditure budget
• LSS may be jointly funded by multiple donors, or by a single donor
• The preferred use of LSS is for state- and county- level service delivery and community development through conditional transfers
• Specific and temporary safeguards may be put in place where there are significant weaknesses in GRSS systems, until such a time as those weaknesses are addressed
• The objectives of LSS should be linked to the achievement of sectoral outcomes set out in the SSDP and elaborated in Budget Sector Plans. In doing so, it can strengthen sectoral systems for service delivery at both GRSS and state levels
Budget support
• Budget support is where DPs disburse their funds directly to the Treasury and use government PFM systems for planning and implementation
• General budget support is un-earmarked and allocated through the Government budget
• Sector budget support which is earmarked to specific sectors or sectoral state transfers
• Expenditures funded by budget support will not be separately identifiable in the budget
• Budget support is the preferred mechanism for funding overall Government service delivery at GRSS and state level in support of Government expenditure priorities
• Provision should be linked to overall achievement of GRSS priorities set out in its development plan and elaborated in BSPs
• Budget support also can support improvements in systems for PFM, public service management and decentralized service delivery
Source: GRSS, 2011, South Sudan Development Plan 2011-2013, Juba, pp. 414-415 (hard copy)
MoFEP considers that the rationale for the government's aid coordination effort is to ensure efficient public investment and maximize impacts; it will achieve this by coordinating national and external sources of funds. Involvement of all levels of government in the process of resource-allocation decision-making concerning inflows of external resources should result in better outcomes, provided that appropriate accountability and fiducial risk management mechanisms are in place. The Ministry also considers that direct cash injection to the national economy is better than in-kind contributions to the economy from DPs; thus, the Ministry prefers direct budget support and engagement of local and regional consultants. For example, the Ministry of Information receives DP support amounting to USD six million. A large proportion of the contribution was used for the engagement of advisers and procurement of goods from outside the country. It is perceived that procurement of goods and services in east African countries is beneficial to the regional economy, and that untied assistance rather than tied projects is preferred. The Ministry also recognizes the necessity of institutional capacity development in order to secure an enabling environment for the realization of budget support.
6.6.2 Four aid instruments
Table 6-10 shows the four aid instruments likely to be considered for implementation of CAMP proposed projects. From the point of view of the alignment of aid instruments to the

6-30
PFM system, the least aligned is standalone project support, second least is pooled funding, third least is local services support, and the most aligned is budget support. Standalone project support and pooled funding aid instruments have been adopted in South Sudan. The former is commonly applied for external support to projects in South Sudan where funding for project operation is kept separately from mainstream government expenditures. Although the standalone project support instrument is financially isolated from the government system, it can use GRSS planning, budget preparation, procurement and financial management systems with special arrangements. The pooled funding is a form of project support but is jointly funded by the government and multiple donors, providing a more coordinated implementation mechanism. The pooled funding mechanisms currently in operation in South Sudan are listed in Table 6-11. A well-known example is the Multi-donor Trust Fund (MDTF) hosted by the World Bank. As presented in the next section, the procurement of goods and services finance by MDTF is done through the government procurement mechanism but with international standards, i.e. the World Bank's, followed. The other two instruments, namely, the local service support instrument and the direct budget support instrument have not yet been adopted in South Sudan. This may be linked with the perceived inadequate PFM capacity of all levels of government and the under-development of DP coordination mechanisms and their alignment to the PFM system. The local services support instrument is characterized by the disbursement of DP earmarked funds directly to the Government Treasury. For the application of the earmarked funds the PFM system is used for planning, budget preparation, and execution. The budget support instrument is where DP un-earmarked funds are disbursed directly to the Treasury and use the PFM system for planning and budget preparation, and execution. The budget support instrument also includes sector budget support which is earmarked to specific sectors or sectoral state transfers. Since the government of South Sudan intends to achieve a higher level of aid alignment with the PFM system and aid coordination, higher priority should be given to instruments such as pooled funding, local services support, and budget support instruments whenever their adoption is deemed to be appropriate. On the other hand, the usefulness and effectiveness of the standalone project instrument will continue to be recognized and DPs will still opt to employ it given the current PFM capacity of the government. Therefore, management and institutional capacity development components must be incorporated into the CAMP.
6.6.3 Pooled funding aid instrument
Currently, the most advanced form of aid instrument in terms of the alignment to the PFM is pooled funding. Table 6-11 presents seven currently operational pooled funding mechanisms which are worth examining for the designing of the CAMP projects' implementation mechanisms. It is recommended the Task Team carries out an investigation of the mechanism.

6-31
Table 6-11: Pooled funding mechanisms (as of 2011)
Name of pooled fund
Description Supporting sector/projects
The Multi-Donor Trust Fund (MDTF)
• Establishment: 2005 and closed in June 2012. • Total funds managed: USD700m funded by
GOSS (USD200m), Netherlands, Norway, UK, Canada, EC, etc.
• Host: World Bank as Technical Secretariat.
• All sectors • Infrastructure • Health • Water and sanitation • Accountability
The South Sudan Recovery Fund (SSRF)
• Establishment: 2008 • Total funds managed: USD111.8m funded by UK
and the Netherlands • Host: Multi-Partner Trust Fund Office, UNDP
• Short-term emergency aid
• Income generation • Stabilization of conflict-
affected areas
The Capacity Building Trust Fund (CBTF)
• Establishment: 2004 and to be closed in 2013. • Total funds managed: USD28m by 2011 funded
by Canada, Denmark, Netherlands, Norway, Spain, Sweden and the United Kingdom
• Host: (to be confirmed)
• Government's capacity development needs
The Common Humanitarian Fund (CHF)
• Establishment: 2005 • Total funds managed: Over USD900 by 2010 • Host: Multi-Partner Trust Fund Office, UNDP
• Humanitarian projects implemented by UN agencies in North and South Sudan
The Basic Services Fund (BSF)
• Establishment: 2005 and to be closed at the end of 2012
• Total funds managed: USD40m by 2011 funded by DFID, Netherlands, Norway, SIDA, and EC
• Host: (to be confirmed)
• Primary education, • Primary health, and • Water and sanitation
services in the conflict areas
The Health Pooled Fund (HPF)
• Establishment: late 2012 • Total funds managed: £150m for 5 years funded
by DFID, SIDA, CIDA, AusAID, and EC • Host: (to be confirmed)
• Primary health services in six states
South Sudan Partnership Fund (SSPF)
• Establishment: under discussion • Host: to be confirmed
• To be confirmed
Source: MoFEP, 2011, South Sudan Donor Book 2011, Juba, pp. 4-5. Modified by CAMP Task Team.
6.7 Planning and budget procedures involving state governments
In this section the involvement of state governments in the Budget Sector Plans and Annual Budget preparation processes of the national government is briefly described. Because a large part of the responsibilities for on-the-ground CAMP implementation is expected to be taken by state and county governments, further discussion on the relationships between national, state, and county governments needs to be carried out. According to the provisions of the Transitional Constitution of the Republic of South Sudan 2011 a wide range of powers is given to the state governments. Therefore, the designing of CAMP implementation across all levels of government will require extensive investigation and analysis of national-state governance. In the process of budget preparation, a SWG is required to prepare a breakdown of the proposed fund transfers to the states, identifying salaries of state staff, operating expenditure, and capital expenditure of the 10 states. After the approval of the budget by the NLA, fund transfer to the states as conditional block grants is considered as one of the priority actions for the national Ministries. In the case of MARF there are a number of state-level projects to be identified by the Undersecretary and DG of Planning, Statistics, and Documentation. The projects are to be implemented by designated states for the period of 3 years. The project period can be extended based on performance evaluation by MARF. If it is appropriate, the extension and budgets are proposed by MARF at the SWG for discussion. To finance such

6-32
projects, budgets for conditional transfer to implementing states have to be estimated and justified.

7-1
7. Food Security
7.1 Concept of food security
Food security is a term widely used in South Sudan, but the term is used differently by the various stakeholders. The concept of food security originated in the 1930s. The Health Division of the League of Nations145 conducted a survey about nutrition and public health. In the report, acute food shortage in low income countries was identified as giving rise to hunger and malnutrition.146 After the establishment of FAO and WFP, these United Nations organisations made efforts to reduce food shortages worldwide. Until the 1980s food security was perceived as the availability of an adequate food supply at all times. Thus, an increase in food production would improve food security.146 During the 1980s, food production increased in many parts of the world through development assistance, etc. but there were still shortfalls of food in different parts of the world. Low purchasing power for food is considered as one cause of food insecurity.147 Therefore, food security cannot be achieved only by increasing food production, but by considering appropriate distribution mechanisms. In the World Food Summit organised by FAO in 1996, participants made a commitment to reduce famine and hunger and to improve access to safe and nutritious food as a fundamental right of people. For this situation analysis the definition of food security agreed at the World Food Summit is adopted:
When all people at all times have access to sufficient, safe, nutritious food to maintain a healthy and active life.148
There are four dimensions to food security: availability, accessibility, utilisation and stability. All four must be fulfilled simultaneously to achieve food security as defined above. 149 Detailed descriptions of these four dimensions are presented in Table 7-1.
Table 7-1: Four dimensions of food security
Dimensions Descriptions
Physical availability of
food
Food availability addresses the “supply side” of food security and is determined by the
level of food production, stock levels and net trade.
Economic and
physical access to
food
An adequate supply of food at the national or international level does not in itself
guarantee household level food security. Concerns about insufficient food access
have resulted in a greater policy focus on incomes, expenditure, markets and prices in
achieving food security objectives.
Food utilisation Utilisation is commonly understood as the way the body makes the most of various
nutrients in the food. Sufficient energy and nutrient intake by individuals is the result of
care and feeding practices, food preparation, and diversity of the diet and distribution
of food in a household. Combined with good biological utilisation of food consumed,
this determines the nutritional status of individuals.
145
The League of the Nations was an intergovernmental organisation founded as a result of the Paris Peace Conference that ended the First World War. http://en.wikipedia.org/wiki/League_of_Nations 146
University of Rome Tre, Faculty of Economics, Master in Human Development and Food Security. Food Security: Definition, Four Dimensions, History. Basic readings as an introduction to Food Security for students from IPAD Master, SupAgro, Montpellier attending a joint training programme in Rome from 19
th to 24
th, March
2012. 147
Rainer Gross Hans Schoeneberger, Hans Pfeifer, Hans-Joachim A. Preuss: April 2010. The Four Dimensions of Food and Nutrition Security: Definitions and Concepts. European Union, FAO. 148
World Health Organisation. Trade, foreign policy diplomacy and health: http://www.who.int/trade/glossary/story028/en/ 149
FAO 2008. The EC-FAO Food Security Programme. Food Security Information for Action: Practice Guides. An Introduction to the Basic Concepts of Food Security.

7-2
Dimensions Descriptions
Stability of the other
three dimensions
over time
If access to food is not stable, the situation is still food insecure. Adverse weather
conditions, political instability, or economic factors such as unemployment and rising
food prices may have an impact on the food security status.
Source: The EC-FAO Food Security Programme. 2008. Food Security Information for Action: Practice Guides. An
Introduction to the Basic Concepts of Food Security.
If any of the four dimensions regarding food security is not satisfied, food security is considered to be unstable. Food insecurity can be categorised into three types: long-term, short-term and seasonal food insecurity.149 This report calls long-term food insecurity “chronic food insecurity” and short-term food insecurity “transitory food insecurity.” Seasonal food insecurity only happens during a specific period of time in a year. Key characteristics of these three types of food insecurity are described in Table 7-2.
Table 7-2: Key characteristics of three types of food insecurity
Type food insecurity
Chronic food insecurity Transitory food insecurity Seasonal food insecurity
Character (Duration)
Long term Short term Period is limited but can be recurrent
Causes When people are unable to meet their minimum food requirements over a sustained period of time. It is often the result of extended periods of poverty, lack of assets and inadequate access to productive or financial resources.
When there is a sudden drop in the ability to produce or access enough food to maintain a good nutritional status. It normally causes fluctuations in food availability and food access, including year to year variations in domestic food production, food prices and household incomes.
When people are unable to meet their minimum food requirements in a seasonal pattern primarily due to depletion of food from the previous harvest..
Results It results in extended periods of poverty, lack of assets and inadequate access to productive or financial resources.
It results in short-term shocks and fluctuations in food availability and food access, food prices and household incomes.
It results in shocks to farmers whose food stocks are depleted. People who face seasonal food security need coping strategies for survival.
Source: FAO 2008. The EC-FAO Food Security Programme. Food Security Information for Action: Practice
Guides. An Introduction to the Basic Concepts of Food Security. FAO 2008. EC-FAO Food Security Information
for Action Programme. Distance Learning to Support Capacity Building and Training for National and Local Food
Security Information Systems and Networks. Food Security Concepts and Frameworks. Lesson 1. What is Food
Security.
In South Sudan, seasonal food insecurity is very common among farmers and pastoralists; chronic food security and transitory food insecurity also occur. Regardless of the type of food insecurity, there are four levels of food security: severely food insecure, moderately food insecure, mildly food insecure, and food secure. FAO takes hunger as one of the important indicators to measure levels of food security. They developed 8 questions to categorise hunger into these four levels.150 This report does not strictly follow these scales but respects them when degrees of food security are described. Historically nutrition is considered an important element of food security. In 1992, at the International Conference on Nutrition, jointly organised by FAO and WHO, participants declared:
……determination to eliminate hunger and to reduce all forms of malnutrition. Hunger and malnutrition are unacceptable in a world that has both the knowledge and the resources to end this human catastrophe.146
150
FAO. New metric to be launched on hunger and food insecurity: FAO in Emergencies. http://www.fao.org/emergencies/fao-in-action/stories/stories-detail/ru/c/171861/

7-3
Since then, access to nutritiously adequate and safe food is acknowledged as an important right for people and has become a more widely known component of food security. Some organisations use the term “food and nutrition security”, but in this report, the term “food security” includes the element of nutrition. The scope of the present report focuses on the availability and accessibility dimensions of food security.
7.2 Overview of food security in South Sudan
Sixty per cent of South Sudanese do not consume sufficient, nutritious food. In 2009, the average person consumed 1,318 kilocalories (kcal) per day, which is about 400 kcal lower than FAO’s minimum recommended intake per day.151 In October 2012, about 40% of the population, or about 4,121,000 people, was either severely food insecure or moderately food insecure.152 In February 2013, about 48% of the population fell into these categories.153 It can be seen that the proportion of people in these two categories increased between these two dates. Western Bahr El Ghazal State, Northern Bahr El Ghazal State and Upper Nile State have higher ratios of people facing food insecurity to food secure people while Central Equatoria State, Western Equatoria State and Unity State have lower ratios.153
Figure 7-1: Food security status by state in 2012 and 2013
Source: WFP. March 2013. Annual Needs and Livelihood Analysis (ANLA) 2012/2013: South Sudan. Juba.
The net cereal production in 2012 was estimated at 761,000 tonnes (an increase of 35% from 2011) while the cereal requirement in 2013 is expected to be 1,132,000 tonnes (increased by 9% from 2012). Thus, 371,000 tonnes of food deficit are expected in 2013.152 Even though production volumes have increased, food availability is still a challenge. In 2013, refugees from Sudan might increase due to conflicts in Sudan, in South Kordofan and Blue Nile.154 In Jonglei State, inter- and intra- ethnic conflicts also continue. These two factors could create about 750,000 refugees and internally displaced persons (IDPs),154
151
VAM Food Security Analysis, 2012. Report on Food Security and Nutrition in South Sudan: how a new country can feed its people. Juba. 152
FAO/WFP. February 22, 2013. Special Report: FAO/WFP Crop and Food Security Assessment Mission to South Sudan. Juba. 153
VAM Food Security Analysis. Round 9, February 2013. South Sudan Food Security Monitoring: A Collaborative Activity of FSTS, RRC, MAF, MoH, FAO, WFP, UNICEF, and UNHCR. Juba. 154
FAO and WFP. 22 February 2013. Special Report. FAO/WFP Crop and Food Security Assessment Mission to South Sudan. p. 47

7-4
even though the numbers of returnees from Sudan have decreased from 449,433 in 2009 to 160,303 in 2012.155 Other factors causing an increase in returnees and IDPs in 2013 could be floods and inter- and intra-ethnic conflicts in and along the border of South Sudan. The total number of beneficiaries for WFP food assistance in 2013 is expected to be 2,858,000, requiring 224,000 tonnes of food.152 These factors also weaken availability of food in South Sudan.
7.3 Major causes of food insecurity
In South Sudan, there are several key causes of food insecurity: 1) overall national food deficit, 2) border closure with Sudan, 3) refugees156, returnees157 and IDPs158, 4) conflicts and insecurity, 5) high price of food, and 6) natural hazards. Sufficient food is not produced to feed the total population of the country leading to a food deficit. In 2012, the cereal deficit was 475,000 metric tonnes.159 The border between South Sudan and Sudan used to be a major supply route for cereals and other types of food. However, it has only been intermittently open. The northern states, such as Northern Bahr el Ghazal, Western Bahr el Ghazal, Warrap, Unity and Upper Nile, are significantly impacted by the border closure as they lose their major supply routes for food. Currently, food is mainly brought from other parts of South Sudan or from Uganda, Kenya and Ethiopia, which raises the cost of transportation and leads to higher prices for food. This impacts both the availability and accessibility dimensions of food security. Additionally, numerous refugees and returnees have been re-settling in various parts of South Sudan. Refugees, returnees and IDPs are contributing to the increase in population of the country; they are vulnerable people who need assistance. The total number of refugees, returnees and IDPs in 2012 is shown in Table 7-3.
Table 7-3: Number of refugees, returnees, and IDPs in 2012-2013
Refugees Returnees IDPs
Total Number 221,303 1,867,009 430,000a
a Total number of IDPs is from 2012. Out of 430,000 IDPs, 170,000 people are affected by cross-border and
domestic conflicts. 260,000 IDPs are dislocated due to floods across the country. Sources: UNHCR. Refugees in South Sudan, Information Sharing Portal, http://data.unhcr.org/SouthSudan/country.php?id=251. International Organisation for Migration (IOM). 2013. Returnees to South Sudan. Juba: IOM. (Internal document based on IOM Tracking and Monitoring Database.), IOM South Sudan 2013. Annual Report 2012. p. 5. Juba. FAO and WFP. 22 February 2013.
The number of returnees who came back to South Sudan was 449,433 in 2009 and 160,303 in 2012.159 However, it is a significant number and they generally returned with minimal possessions and are vulnerable. Hence, the impact of returnees on food security is large.
155
International Organisation for Migration (IOM). 2013. Returnees to South Sudan. Juba: IOM. (Internal document based on IOM Tracking and Monitoring Database.) 156
The 1951 Refugee Convention defines a refugee as someone who "owing to a well-founded fear of being persecuted for reasons of race, religion, nationality, membership of a particular social group or political opinion, is outside the country of his nationality, and is unable to, or owing to such fear, is unwilling to avail himself of the protection of that country." United Nations High Commissioner for Refugees (UNHCR), http://www.unhcr.org/pages/49c3646c125.html. 157
A returnee is a South Sudanese national who came back to South Sudan from another country. This includes South Sudanese who returned from Sudan. 158
According to the United Nations, IDPs are defined as "persons or groups of persons who have been forced or obliged to flee or to leave their homes or places of habitual residence, in particular as a result of or in order to avoid the effects of armed conflict, situations of generalized violence, violations of human rights or natural or human-made disasters, and who have not crossed an internationally recognized State border" Source: Representative of the Secretary-General, Mr. Francis M. Deng. UN Commission on Human Rights. 1998. Guiding Principles on Internal Displacement. 159
WFP, March 2013. Annual Needs and Livelihood Analysis 2012/2013. South Sudan. Juba.

7-5
Food insecurity caused by refugees, IDPs, and returnees is categorised as transitory (or short term). Aside from the above mentioned causes, 267 conflict incidents occurred in the country, which were caused mainly by inter- and intra-ethnic/communal conflicts in 2012. Forty four per cent of the conflicts occurred in Jonglei State, the highest percentage in the country. Numbers of conflict incidents (including civilian/civilian clashes, armed forces/civilian clashes, cross-international boundary attacks and other armed incidents) are shown in Table 7-4 for part of 2012. These conflicts caused displacement of people and are causing transitory food insecurity which is serious in South Sudan.
Table 7-4: Numbers of conflict incidents reported in 2012 (January to November 2012)
Jonglei Unity Lakes Upper
Nile
Warrap Eastern
Equatoria
Northern
Bahr el
Ghazal
Central
Equatoria
Western
Bahr el
Ghazal
Western
Equatoria
118 47 40 22 20 11 6 2 2 0
Source: WFP. March 2013. Annual Needs and Livelihood Analysis Report 2012/2013 South Sudan. Juba. p. 41.
Internal conflicts create IDPs which affect farmers and pastoralists negatively. They have to limit or stop their agricultural activities, which significantly affects their area cultivated, yields, output and incomes. This situation leads to unstable food security. In 2011, high food prices ranked first amongst seven factors for food insecurity as shown in Figure 7-2.
Figure 7-2: Percentages of negative factors impacted on household food security
Source: WFP. March 2013. Annual Needs and Livelihood Analysis Report 2012/2013 South Sudan. Juba. p. 18.
In 2012, high food prices were the second most important negative factor influencing household food security. High food prices make food inaccessible. An assumption can be made that there is enough food available in the markets, but that people do not have enough money to buy it. Prices of food at markets are generally high, especially imported agricultural products. Domestic agricultural products are relatively reasonable compared to imported ones, but still not very low. Many agricultural producers have low incomes. This means that accessibility to food is restricted due to high food prices. Lower prices would lead to improved accessibility. Production volumes, production functions and conditions of the market are analysed in details in the section on production and marketing and trading in each subsector chapter.

7-6
7.4 Categories of food insecure people
People facing food insecurity are categorised into groups shown in Table 7-5.
Table 7-5: Types of Food Insecure People and their Conditions
Type of
people
Assistance they receive and life
after receiving assistance
Conditions and potential needs
for support
1 Refugee At a refugee camp, refugees are provided shelter, food, shelter materials, transportation, and water sanitation and hygiene facilities. They receive assistance for up to
360 days160
, but if necessary, they
could extend the period until they
find out the next step to take.161
Refugees are supported by humanitarian agencies until they change their status by relocating to other countries. Rehabilitation support is necessary only when they decide to stay in South Sudan and find a place to resettle because they have limited livelihoods including land and houses. Degrees of their food security range from severe to mild because long term refugees may be well-established.
2 Returnee Shelter, food162
, non-food package
163, shelter materials,
transportation and water sanitation and hygiene facilities. SSRRC finds a host community for returnees. After that period, the returnees have to be independent and make their living by some means such as farming or employment regardless the places they settle in.
164
When they arrive in South Sudan, their belongings and assets are very limited. During the period of humanitarian aid assistance, it is difficult to improve their skills and means to be self-sufficient. In the reintegration process, returnees need support in the areas of housing, skills for employment, means of transportation, land, tools for and skills and knowledge of agricultural production and some funds to survive with until the harvest period in the first year. Degrees of their food security range from severe to moderate.
3 IDP IDPs are provided shelter, food, shelter materials, transportation and water sanitation and hygiene facilities. When natural hazards and conflicts cease, they have to return to their hometowns and villages. Then, they are responsible for making their normal livelihood without assistance.
In their hometown and villages, they own houses, lands and other livelihoods including means for agricultural production. However, if their areas are badly damaged by floods, they may need technical support to rehabilitate the areas or prevent further natural hazards. Also, if conflicts in their areas happen repeatedly, peace building activities may be necessary. Degrees of their food security range from severe to moderate.
4 People
affected by
natural
hazards
and
insecurity
These people do not need to move to other places such as IDPs, but are still affected by drought and flood damage to their livelihood. They sometimes receive assistance by aid organisations, but normally, they have to survive without any external support.
These people face constraints on agricultural
activities,165
reduction of yields and limitation of areas
to raise their livestock. They have basic means of making their living such as houses, land, livestock and tools for agricultural activities, but their production levels are low, considering the required amount of food for the household. Their knowledge and skills related to production and marketing are often limited for improvement of their status. Often these people reside in disadvantaged locations. Degrees of their food security range from severe to mild, because it depends on how serious was the natural hazard affecting them.
160
FAO and WFP. 22 February 2013. Special Report. FAO/WFP Crop and Food Security Assessment Mission to
South Sudan. Rome: FAO and WFP. 161
The next step could be a return to their home country or transfer to a third country for re-settlement, or transfer to a different place in South Sudan for re-settlement. 162
3 month food package includes 500 grams of cereals per day/person, 50 grams of pulses per day/person, 30 grams of oil per day/person, and 5 grams of salt per day/person. World Vision, interviewed by CAMP task team, Juba, 5 July 2013, CAMP Situation Analysis. 163
It includes plastic sheets, blankets, mats, utensils, mosquito nets, etc. UNOCHA, interviewed by CAMP task team, Juba, June 2013, CAMP Situation Analysis. 164
Some returnees move to semi-urban or urban areas by themselves after the three month re-integration period. World Vision, interviewed by CAMP task team, Juba, 5 July 2013, CAMP Situation Analysis. 165
As examples, there are armed groups which are harmful for farmers and pastoralists’ activities in Upper Nile State and Jonglei State. State government office, Crop Subsector questionnaire, Upper Nile State. 28 May 2013. CAMP Situation analysis. World Vision, interviewed by CAMP task team, Malakal, 1 July 2013, CAMP Situation Analysis.

7-7
Type of
people
Assistance they receive and life
after receiving assistance
Conditions and potential needs
for support
5 Low-
income
people
Normally, these people do not
receive any assistance from either
the government or humanitarian aid
agencies. However, sometimes,
some of them receive support by
NGOs and DPs through
implementation of development
projects.
For most of those who are involved in agriculture, the size of their lands, numbers of livestock and amount of yields and knowledge of effective agricultural practices are limited. Due to their low income, they suffer from food shortage during the period of seasonal food insecurity; they have several types of coping strategies such as reduction of eating volume, engaging in non-agricultural income generating activities, and hunting and collecting wild animals, fish and fruits. Degrees of their food security range from moderate to mild.
6 Socially
vulnerable
people
These are disabled people, widows,
orphans, children under five years
old, elderly people, school children
and HIV/AIDS patients. They
receive food and other types of
assistances from NGOs and DPs.
These people lack ability to produce agricultural
products or earn money to obtain food by themselves.
Since these people are not core players in the
national economy, they tend to be marginalized from
society and have disadvantage in getting access to
food. They obtain food assistance through various
projects of WFP and NGOs.166
Degrees of their food
security range from moderate to mild.
Sources: Farmers, WFP, FAO, UNOCHA, and World Vision, interviewed by CAMP task team, ten states, April to
June 2013, CAMP Situation Analysis.
7.5 Farmer’s food insecurity situation
The CAMP Task Team attempted to identify the food security situation of ordinary subsistence farmers, who would seem to be either moderately or mildly food insecure. However, information regarding the detailed food security situation of these of farmers is not available. Therefore, in the situation analysis, the CAMP crop subsector team conducted 37 focus group discussions (FGDs), targeting subsistence farmers at various locations, both near and far from the main market(s) of a town, to understand the food security situation in the ten states.167 Between four and ten farmers participated in each FGD; participants discussed key questions concerning food security. The team found that, for subsistence farmers in all of South Sudan, seasonal food insecurity is common and that it is the most frequent type of food insecurity. Seasonal food insecurity occurs when stocks of produce from the previous harvest are depleted causing a potential food shortage. Households have to find alternative sources of food using coping mechanisms (or strategies). The types of food insecurity previously described are long term and caused by extended periods of poverty, lack of assets, natural disasters, conflicts and inadequate access to productive or financial resources. On the other hand, seasonal food insecurity is a normal occurrence that is part of the farming calendar. It can occur regardless of the distance from the main markets. Seasonal food insecurity is more severe, and more common, in the northern states. There are six coping strategies used during the period of seasonal food insecurity as shown in Box 7-1.
166
World Vision South Sudan provides food assistance under the project titled “General Food Distribution Program,” “Targeted Supplementary Feeding Program”, “Blanket Supplementary Feeding Program, “Food for Asset” and School Feeding programs in Upper Nile state, Unity State, Northern Bahr el Ghazal State, Western Bahr el Ghazal State, Warrap State, and Central Equatoria State. World Vision, interviewed by CAMP task team, Juba, 5 July 2013, CAMP Situation Analysis. 167
Two to five FGDs were conducted in each state, in different payams or counties. Male and female participants were included.

7-8
Box 7-1: Types of Coping Strategies
1. Reduction of volume and number of meals in a day
2. Selling agricultural related products at the market to buy food
3. Engaging in non-agricultural income generating activities
4. Hunting and collection of wild animals, fish and fruits
5. Use of mutual support systems among families, relatives and community
members
6. Others (e.g., food assistance)
Source: Groups of farmers, interviewed by CAMP crops subsector team, ten states, April to June 2013, CAMP
Situation Analysis.
Examples of characteristics of subsistence farmers’ food security and their common coping strategies during a period of seasonal food insecurity are described in Table 7-6.168 Farmers typically sell livestock and vegetables to make money. They will sell goats and chickens to buy food, but not cattle since the number of cattle a man owns defines his social status, especially in the northern parts of the country. Examples of income generating activities are grass cutting, charcoal making, and alcohol making, etc. Mutual support systems include sharing labour amongst neighbouring farmers and supporting vulnerable groups in the community. “Other” strategies are receiving food assistance or other types of assistance from NGOs and donors. These strategies were commonly identified through the FGDs, but not necessarily all of them were used in each state; the first three coping strategies described in Box 7-1 were commonly applied in all ten states. Commonly, seasonal food insecurity occurs from June to July, but in Lakes, Northern Bahr el Ghazal, Warrap and Unity States it lasts longer. Coping strategies are very similar in all ten states, and selling agricultural products is an effective approach to coping with food shortage. Livestock and vegetables are key for farmers to survive seasonal food insecurity; water points such as rivers, streams, ponds and boreholes are crucial to practice these coping strategies. Hunting is another common method to obtain food. It is found that fish is an important protein source across the country. Selling charcoal and firewood is currently common across the country, but overexploitation of forestry resources may diminish the future usefulness of this coping strategy.
Table 7-6: Characteristics of Subsistence Farmers’ Food Security Situation in Each State
State Period Common food
consumed
Common coping strategies
Category Descriptions
Western Equatoria
June to
July
Cassava tubers,
maize, finger
millet, groundnuts,
rice, beans, meat,
fish, bananas,
papayas,
mangoes, honey,
white ants, sugar
canes, pumpkins,
sweet potatoes,
yam, abu kamira
(wild fruit), joko
Meals - Reduce number of meals in a day
- Eat the food stored from the previous season
Sell
agricultural
products
- Catch fish to sell
- Sell cassava leaves
- Collect firewood and make charcoal to sell
Off farm
activities
- Brew beer to sell
- Make bricks, mats, and tea to sell
- Bake cakes to sell
Hunting and
gathering
- Hunt wild animals (deer, buffalo, bush rats)
- Collect wild fruits, wild yams, and wild honey
Support - Provide labour to each other and community
supports vulnerable groups
168
Information collected from the crop subsector team of CAMP TT members is used as one of the examples of
food security of this county.
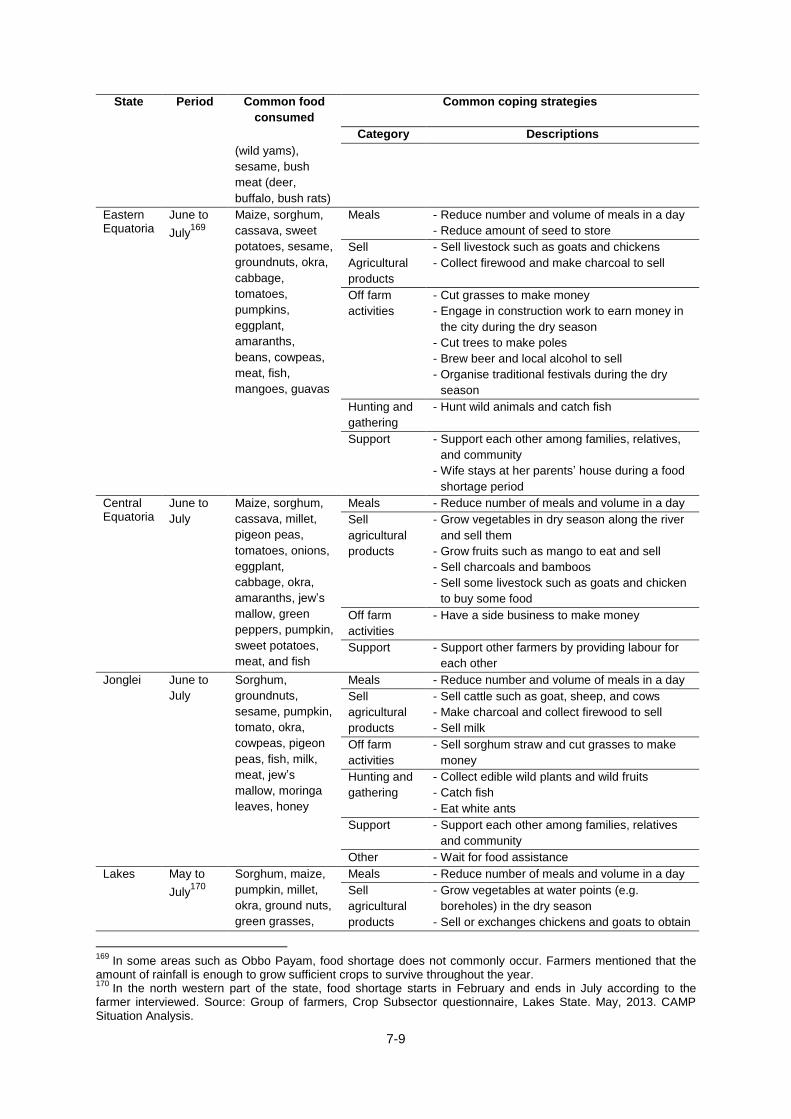
7-9
State Period Common food
consumed
Common coping strategies
Category Descriptions
(wild yams),
sesame, bush
meat (deer,
buffalo, bush rats)
Eastern Equatoria
June to
July169
Maize, sorghum,
cassava, sweet
potatoes, sesame,
groundnuts, okra,
cabbage,
tomatoes,
pumpkins,
eggplant,
amaranths,
beans, cowpeas,
meat, fish,
mangoes, guavas
Meals - Reduce number and volume of meals in a day
- Reduce amount of seed to store
Sell
Agricultural
products
- Sell livestock such as goats and chickens
- Collect firewood and make charcoal to sell
Off farm
activities
- Cut grasses to make money
- Engage in construction work to earn money in
the city during the dry season
- Cut trees to make poles
- Brew beer and local alcohol to sell
- Organise traditional festivals during the dry
season
Hunting and
gathering
- Hunt wild animals and catch fish
Support - Support each other among families, relatives,
and community
- Wife stays at her parents’ house during a food
shortage period
Central Equatoria
June to
July
Maize, sorghum,
cassava, millet,
pigeon peas,
tomatoes, onions,
eggplant,
cabbage, okra,
amaranths, jew’s
mallow, green
peppers, pumpkin,
sweet potatoes,
meat, and fish
Meals - Reduce number of meals and volume in a day
Sell
agricultural
products
- Grow vegetables in dry season along the river
and sell them
- Grow fruits such as mango to eat and sell
- Sell charcoals and bamboos
- Sell some livestock such as goats and chicken
to buy some food
Off farm
activities
- Have a side business to make money
Support - Support other farmers by providing labour for
each other
Jonglei June to
July
Sorghum,
groundnuts,
sesame, pumpkin,
tomato, okra,
cowpeas, pigeon
peas, fish, milk,
meat, jew’s
mallow, moringa
leaves, honey
Meals - Reduce number and volume of meals in a day
Sell
agricultural
products
- Sell cattle such as goat, sheep, and cows
- Make charcoal and collect firewood to sell
- Sell milk
Off farm
activities
- Sell sorghum straw and cut grasses to make
money
Hunting and
gathering
- Collect edible wild plants and wild fruits
- Catch fish
- Eat white ants
Support - Support each other among families, relatives
and community
Other - Wait for food assistance
Lakes May to
July170
Sorghum, maize,
pumpkin, millet,
okra, ground nuts,
green grasses,
Meals - Reduce number of meals and volume in a day
Sell
agricultural
products
- Grow vegetables at water points (e.g.
boreholes) in the dry season
- Sell or exchanges chickens and goats to obtain
169
In some areas such as Obbo Payam, food shortage does not commonly occur. Farmers mentioned that the amount of rainfall is enough to grow sufficient crops to survive throughout the year. 170
In the north western part of the state, food shortage starts in February and ends in July according to the farmer interviewed. Source: Group of farmers, Crop Subsector questionnaire, Lakes State. May, 2013. CAMP Situation Analysis.

7-10
State Period Common food
consumed
Common coping strategies
Category Descriptions
sesame, jew’s
mallow, pumpkins,
beans, cow milk,
meat, and fish
some food
Off farm
activities
- Make local beer and tea to sell
Hunting and
gathering
- Fishing for their own consumption during the
dry season171
- Collect wild fruits, wild vegetables, and honey
Support - Support each other through providing labours
for farming172
Upper Nile
June to
July
Sorghum, maize,
jew’s mallow,
sesame, tomato,
beans,
groundnuts, okra,
milk, meat, eggs,
fish, cowpeas,
watermelon, peer
millet, wild fruits,
wild green leaves
Meals - Reduce number of meals in a day
Sell
agricultural
products
- Sell cattle such as goats and sheep
- Sell crop products at a market
- Make charcoal and collect firewood to sell
Off farm
activities
- Sell grasses for house thatching
- Cut grasses and clean farms to make money
Hunting and
gathering
- Collect wild fruits and wild leaves
Support - Community supports vulnerable people
Western Bahr el Ghazal
July to
Sept.
Sorghum, maize,
cassava, okra,
cassava leaves,
pumpkin,
groundnuts,
sesame, beans,
onion, meat, fish,
fruits such as
mango and guava
Meals - Reduce number and volume of meals in a day
- Prioritize children to eat food while adults eat
less or skip meals
Sell
agricultural
products
- Make and sell charcoal to make money
Off farm
activities
- Cut grasses to make money
Other - Seek an opportunity for food assistance
Northern Bahr el Ghazal
July to
Sept.
Sorghum,
groundnuts,
beans, cowpeas,
sesame, jew’s
mallow, okra, rice,
wild green leaves,
meat, fruits
Meals - Reduce number of meals in a day
- Reduce volume of meal in a day
Sell
agricultural
products
- Sell cattle such as cow - Make firewood to sell - Make charcoal to sell
Off farm
activities
- Cut grasses
Hunting and
gathering
- Catch fish to sell
Other - Receive food aid from WFP and FAO
Warrap July to
Sept.
Sorghum, meat,
milk, fish, some
vegetables
Meals - Reduce volume of meals
Sell
agricultural
products
- Make and sell charcoal
- Catch fish to sell
- Sell goats and cows to buy food
- Grow vegetables during the dry season
Off farm
activities
- Cut grasses to make money
- Sell assets and home properties to buy food
Support - Support each other among families and
farmers in case of emergency
Unity May to
part of
August
Sorghum, maize,
pumpkin,
cowpeas, okra,
Meals - Reduce the number and volume of meals in a
day
- Eat pumpkins
171
In some areas, fishing is not a common coping strategy for food deficiency. 172
Some farmers mentioned that they do not support each other since they do not have extra energy and resources to provide labour for each other. Source: Groups of farmers, Crop Subsector questionnaire, May 2013, CAMP Situation Analysis.

7-11
State Period Common food
consumed
Common coping strategies
Category Descriptions
tomatoes,
cucumber, beans,
groundnuts, cow
milk, meat, and
fish
- Take cow blood to drink and use it for cooking
Sell
agricultural
products
- Collect firewood to sell
- Sell livestock to buy foods
Off farm
activities
- Earn some money through grass cutting and
charcoal making
- Brew local beer to sell
Hunting and
gathering
- Collect wild vegetables such as jew’s mallow
and potatoes
- Catch fish
- Collect wild honey and wild fruits to eat
Source: Groups of farmers, interviewed by CAMP crops subsector team, ten states, April to June 2013, CAMP
Situation Analysis.
In some states, especially in the northern parts of the country, food choices are limited. Even though farmers grow vegetables during the dry season in many parts of the country, it does not necessarily mean that everyone can eat vegetables throughout the year. Based on the results of FGDs and observations made during the CAMP situation analysis, more vegetables are available in the southern parts of the country than in the northern parts.
All coping strategies are either substituting another edible food for a staple food or generating income to purchase food. Strengthening subsistence farmers’ capacity for crop production and/or increasing their incomes are effective approaches to improving their food security.
7.6 Food security and the market economy
Almost all the farmers, who were interviewed or participated in FGDs during the CAMP situation analysis, said that they engage in income generating activities, including selling their agricultural products and engaging in off farm activities to generate income, regardless of their farm size. This means that farmers have access to markets to engage in commercial activities to supplement their income. They do this primarily during periods of seasonal food insecurity but also to generate income to pay for expenses such as school fees for their children. The FGDs showed that when they face seasonal food insecurity, many subsistence farmers consider coping strategies such as hunting wild animals, reducing the number and volume of meals, and engaging in income generating activities such as providing their labour. They do this in preference to selling their agricultural products and/or livestock. Farmers may have access to a market, but they try to cope with food insecurity without engaging in economic activities at a market. Farmers may not have enough surpluses to sell their agricultural products at market due to the limited size of their cultivated land; most of their harvest is for home consumption not for generating income. For pastoralists’, livestock is considered as an asset. Inadequate means for marketing and poor road conditions could affect farmers’ decisions to increase production as well as their selection of coping strategies. In the FGDs and interviews, it was found that most subsistence farmers did not receive food aid from donors. As explained in Section 6.4, it is refugees, IDPs and returnees who receive food aid. However, food aid does affect food security and markets. Food aid is provided to vulnerable groups such as refugees, returnees, and IDPs. The volume of food aid (or rations) is determined based on required calorie intake and nutritional balance for adults and children. However, some refugees engage in agriculture, growing

7-12
food. Land is provided by the host community, and farming tools by the government and NGOs. This means they have surplus food which can be sold at a market or to a middleman. They can sell either rations or harvested food, whichever is more advantageous. For example, one retailer in Central Equatoria State mentioned that she buys lentils from a refugee through a middleman at a nearby refugee camp and then sells them at a market in Yei town.173 The same situation is identified in Maban County in Upper Nile State.174 As rations are free to refugees, they can make more profit than other farmers or merchants; rations can be sold at a lower price than food grown locally or imported from foreign countries. It is understandable that surplus food is sold at a market, but this distortion of the market should be carefully examined; subsistence farmers are at a disadvantage. Nevertheless, markets should be an instrument to improve food security. However, the current situation does not fully utilise markets as instruments to improve food security. Subsistence farmers have started to enter the market economy but need to be encouraged to participate further. Markets should provide a place and an opportunity for farmers to sell their surplus. For that purpose, the following issues need to be addressed: increasing farmers’ production volumes, improvement of access to markets, creation of more opportunities for marketing of farmers’ products especially in rural areas, minimize market distortions created by food aid.
7.7 Roles of government organisations and development partners
The Ministry of Humanitarian Affairs and Disaster Management (MoHADM) is the main ministry responsible for resettlement of refugees and returnees and internally displaced persons (IDPs) and food distribution to vulnerable people. MoHADM coordinates relief repatriation, rehabilitation, resettlement and reintegration activities in collaboration with UN agencies at the national level. The South Sudan Relief and Rehabilitation Commission (SSRRC) is another governmental entity which coordinates relief activities in collaboration with UN agencies at the state level.175 SSRRC has a network at county and payam levels to identify food insecure people and/or vulnerable groups who need assistance.176 The South Sudan Food Security Council (SSFSC)177 is a government body responsible for coordinating resources, supervising, planning and conducting monitoring and evaluation of activities regarding food security. However, as of June 2013, SSFSC was not established and had yet to start its activities. Its function will be to coordinate the activities planned by different ministries to improve the food security situation. MAFTARFCRD is responsible for supporting people engaged in agriculture to improve the food security situation of these people plus the country as a whole. There are a large number of DPs and NGOs involved in food security issues. Some key DPs engaging in food security are introduced in Table 7-7.
173
Retailers, interviewed by CAMP crop subsector team, Yei, April 2013, CAMP Situation Analysis 174
Better off households surprisingly also sell a proportion of their rations. Solidarities International, The Food
Economy Group. 2013. Livelihood Baseline Profile: Refugee CAMPS, Maban County Upper Nile State, South Sudan, 2013. Household Economy Approach. Paris. 175
South Sudan Relief and Rehabilitation Commission (SSRRC), http://www.goss-online.org/magnoliaPublic/en/Independant-Commissions-and-Chambers/Relief-Rehabilitation.html 176
World Vision Malakal Office, crop subsector questionnaire, Malakal, 1 June 2013, CAMP Situation Analysis. 177
It is a council directly under the President of South Sudan. The Ministers of MAFCRD, MARF, Health, Minister of Cabinet Affairs, Finance and Economic Planning, the Office of the President and Wildlife Conservation and Tourism are members of the council. The Republic of South Sudan Food Security Council: Establishment, mandate and composition, John Ogoto Kanisio. Secretary General, RSSFSC. Unpublished.

7-13
Table 7-7: DPs involved in food security issues in South Sudan
Organisation Roles Main activities
International
Organisation
for Migration
(IOM)
- Facilitate peace-building
and conflict mitigation
- Coordinate hosting
refugees and manage a
camp and a way station
for returnees and IDPs
- Strengthen functions of
border management
- Identify numbers of returnees and IDPs to register
- Secure transportation for returnees and IDPs
- Provide water sanitation and hygiene promotion support to
returnees and refugees
- Provide emergency shelter to returnees and IDPs
- Provide household supplies and shelter materials to
returnees and IDPs
United Nations
Office for the
Coordination
of
Humanitarian
Affairs (OCHA)
Coordinate all the aspects
of humanitarian affairs to
be implemented including
management of the
Common Humanitarian
Fund (CHF)178
- Identify needs for humanitarian aid
- Coordinate and assist all the areas of humanitarian aid
planning and implementation of activities
- Provide updated information to humanitarian aid
organisations and the public
- Manage CHF for effective humanitarian aid
World Food
Programme
(WFP)
Manage food provision to
people in food insecure
- Identify needs of food distribution (volume and locations)
- Coordinate food distribution processes including
subcontracting and monitoring and evaluation of food
distribution, Food for Assets (FFA)179
, Purchase for Progress
(P4P)179
programmes and School Feeding programme.
- Assess, monitor, and report food security issues and updates
of food distribution status
Food and
Agriculture
Organisation
of the United
Nations (FAO)
Provide support to people
who are related to
agriculture
- Implement projects to provide seeds and agricultural tools to
farmers
- Implement projects to provide fishing gear to farmers and
fishers
- Coordinate and subcontract NGOs to implement projects
related to food security
Source: IOM South Sudan 2013. Annual Report 2012. Juba, WFP, FAO, and World Vision interviewed by CAMP
task team, Juba, April to July 2013, CAMP Situation Analysis, Common Humanitarian Fund South Sudan. 2013.
2012 Annual Report. Juba.
The Food Security and Livelihood Cluster (FSLC) is a network of DPs and NGOs, whose main objective is to share information about food security and discuss issues. The FSLC was created by the government and any organisation interested in food security can attend its monthly meetings to exchange information and discuss selected issues. There are also state level FSLCs which hold meetings. WFP is moving from direct food aid to rehabilitation and long-term economic development through food assistance. This shift in strategy has been ongoing for the past fifteen years. Food provided should be used as a tool for broader and more effective humanitarian food assistance. A main reason for this shift is the recognition of the importance of local agricultural production to improve food security. 180 WFP has implemented a variety of programmes reflecting this shift of strategy. For example, under the Food for Asset (FFA) programme, WFP distributes food to farmers who provide labour. Labour can be for their own farming purposes or communal labour.181 The Purchase for Progress (P4P) programme
178
The fund was established in 2012 and seven donors contributed funds totalling over USD 118 million. Common Humanitarian Fund South Sudan. 2012. 2012 Annual Report. Juba. 179
WFP and World Vision interviewed by CAMP task team, Juba, June to July 2013, CAMP Situation Analysis. 180
Harvey, Paul, Karen, Proudlock, Edward Clay, Barry Riley and Susanne Jaspers. 2010. Food aid and food
assistance in emergency and transitional contexts: a review of current thinking. London: Humanitrian Policy Group, Overseas Development Institute. 181
As a criterion, the target household should have someone who is able to provide physical labour and be over 18 years old. Communities receiving assistance from FFA must include vulnerable people such as widow, disabled person, elderly person, or orphans.

7-14
is designed to purchase domestic food in bulk to encourage agricultural production in the country. WFP has constructed food storage facilities to match traders and farmers in several areas of the three Greater Equatoria states. It is still in a pilot stage and is only implemented in these three states. Attempts such as FFA and P4P could be more common among DPs to support farmers to be self-sufficient. FAO is also trying to shift its activities from distribution of seeds and tools to more economic development oriented activities. Although some DPs have actively provided food security assistance to vulnerable groups, the impact of their activities is not clear, partially because there has been no impact assessment of food distribution neither by DPs nor GRSS. How food assistance has impacted vulnerable people and market are not closely monitored and evaluated. For example, refugees sell some of their rations to a broker, who sells it to a retailer at a market. As explained in Section 6.6, rations distributed to refugees were identified in a public market in Yei during the CAMP situation analysis. The same situation was reported by another study in Maban County, Upper Nile State.182 However, these facts are neither examined nor written in reports on food security.
Numerous NGOs implement projects to support people engaging in agriculture in different states, which improve food security. More information about their activities is presented in the subsector chapters of this report.
182
Solidarities International, The Food Economy Group, 2013. Livelihood Baseline Profile: Refugee CAMPS, Maban County Upper Nile State, South Sudan, 2013. Household Economy Approach. Paris.

8-1
8. Rural Society and Livelihood
8.1 Population, Communities and Households
The population of South Sudan was projected to be more than 10 million in 2013 (Table 8-1). This projected population is an increase of 25.5% compared with the 2008 census data. The number of returnees influenced this growth. For example, in Unity State, the increase is 49% because of the large number of returnees. The projected population density, which is 15.7 people /km2, is relatively low for East African countries.183,184 Since only 0.1% of the land in South Sudan is urban, 185 real population density would be higher than 15.7 people /km2 in urban areas. Villages are thinly spread across the country making rural and agricultural development more difficult. In the rainy season, access to rural areas becomes more difficult. The percentage of rural population (83%) has not been updated since the 2008 census. Although urbanization is occurring in the major cities such as Juba and Wau, the 2008 rates were applied for calculating the rural population in 2013; it was 8,592,706. Jonglei State contains 18% of South Sudan’s rural population and Warrap State 13%. These are two states where conflicts frequently occur and that have the first and third largest populations. This means that large numbers of the rural population are living in conflict areas.
Table 8-1: Population related data of South Sudan
State
Population 5 years
growth
rate
(2008-
2013)
2013
Projected
population
Density
(ppl./km2)c
Rural
population
rate a
Rural
population b
Proportion
of rural
population
2008 a 2013
b
(Projection
Including
returnees)1
Upper
Nile
964,353 1,160,458 20.3% 14.8
75% 870,344 10%
Jonglei 1,358,602 1,659,070 22.1% 13.4 90% 1,501,013 18%
Unity 585,801 872,734 49.0% 23.0 79% 692,780 8%
Warrap 972,928 1,193,365 22.7% 26.8 91% 1,089,245 13%
NBG 720,898 971,243 34.7% 32.6 92% 896,607 10%
WBG 333,431 446,123 33.8% 4.3 57% 254,866 3%
Lakes 695,730 879,012 26.3% 19.9 91% 796,847 9%
WES 619,029 731,098 18.1% 9.2 84% 612,954 7%
CES 1,103,557 1,395,905 26.5% 31.8 65% 912,250 11%
EES 906,161 1,059,862 17.0% 14.3 91% 965,801 11%
Total 8,260,490 10,368,871 25.5% 15.7 83% 8,592,706 100% a Data from Sudan Centre for Census, Statistics and Evaluation (SSCCSE). 2010. Southern Sudan counts:
Tables from the 5th Sudan population and housing census. Juba: SSCCSE. B Data from World Food Programme of the United Nations (WFP). 2013. Annual Needs and Livelihood Analysis (ANLA) 2012/2013. South Sudan. Juba: WFP.
c Land
scale data applied from Food and Agriculture Organization of the United Nations (FAO). 2011. Land Cover
Attars of the Republic of South Sudan. Juba: FAO
183
Kenya has 66 people /km2
see Kenya National Bureau of Statistics (KNBS). 2009. Kenya 2009 Population
and Housing Census Highlight. Nairobi: KNBS. 184
Uganda 141 people /km2
see Uganda Bureau of Statistics (UBOS). 2012. Statistical Abstract. Kampala:
UBOS. 185
World Bank. 2011. Strategic Choices for Realizing South Sudan’s Agricultural Potential. Juba: World Bank

8-2
The literacy rate in South Sudan is one of the lowest in the world 186 due to low investment in education during the civil war. 187 During the war, most education was given by non-governmental organisations. In contrast, there was little public education. Figure 8-1 shows literacy rates by state and urban and rural areas. The rate is only 22% in rural areas, which has a large influence on the effectiveness and efficiency of rural and agricultural development. Distributing information by written materials is not effective; audio and visual distribution is a better approach. The literacy rate varies amongst the states. The rates in Upper Nile and Central Equatoria States are 45% and 44%; whereas, those of Jonglei, Warrap, Lakes and Eastern Equatoria States are 16%, 16%, 18% and 19%. There is a similar gap in net attendance rates in primary education, although gross enrolment rates in primary education do not show the same gap (Figure 8-2). Net attendance rate could be influenced by insecurity, the poverty resulting from this insecurity and the harsh natural environment. There are a number of pupils who enrolled but do not attend schools. Basic education is one of the important factors for economic development. Along with low literacy, low numeric ability negatively affects agricultural production; for example, when farmers are required to apply fertilizer to farmlands and to keep account books.
Figure 8-1: Literacy rate (above 15 years old) by state and location (%)
Figure 8-2: Net attendance rate and Gross enrolment rate in primary education by
state (%)
Source: National Bureau of Statistics (NBS). 2012. National Baseline Household Survey 2009. Juba: NBS.
Source a
NBS. 2012. National Baseline Household Survey
2009. Juba: NBS. b Ministry of Education (MoE). 2010. Education
Management Information System (EMIS). Juba. MoE.
A boma is the lowest level of local government and can be considered as a grouping of villages normally with a total population of 2-10,000 people. When South Sudanese refer to a community they normally mean a boma or village. The head of a boma is a boma chief. Generally, a payam consists of three or four bomas and is headed by a head chief. Three to four payams normally make up a county, headed by a paramount chief. There were 2,111 bomas in South Sudan in 2009. 188 There is not a more recent official count; bomas are often merged and/or created by the government.
186
Central Intelligent Agency (CIA). 2013. The World Fact Book. https://www.cia.gov/library/publications/the-
world-factbook/ (accessed on 9 June 2013) 187
World Bank. 2012. Education in the Republic of South Sudan: Status and Challenges for a New System.
http://documents.worldbank.org/curated/en/2012/01/16439140/education-republic-south-sudan-status-challenges-new-system (accessed on 9 June 2013) 188
NBS. 2012. National Baseline Household Survey 2009. Juba: NBS.
0
10
20
30
40
50
60
0
10
20
30
40
50
60
70
80
90
100Net attendance rate a
Gross enrolment rate b

8-3
The chiefs are the traditional leaders. They work as chairpersons and/or members of customary law courts at county and payam level, and resolve issues arising in the community (Figure 8-3). It is said that the civil war has weakened the power and status of traditional leaders. The degree of their influence varies among communities; however, they still have an influential and pivotal position in some communities. 189 The boma chief is normally elected by the older community members (usually older than 35 years old) from amongst their members; the head chief for a payam is elected from the boma chiefs in the payam: and the paramount chief is elected from the head chiefs. According to the Local Government Act (2009), there should be customary law courts at the boma level. At present, due to financial and capacity issues, there are no customary law courts in the bomas. Instead, headmen (heads of clan), sub-chiefs and boma chiefs deal with disputes in the bomas. In South Sudan, it is expected that 90% of criminal and civil cases will be dealt with by the chiefs based on customary laws. 190 Customary law-based dispute resolution by the chiefs does not always function well especially when there is a tendency to solve issues by force, such as guns. When a serious case such as homicide occurs, statutory laws are applied; however, customary laws are still applied to such cases in some rural areas. There are a number of precedents for homicide cases based on customary laws.
Figure 8-3: Judicial system and community level dispute settlement system
Source: Juba local government office, interviewed by CAMP Task Team. June 2013, Camp Situation Analysis. GOSS. 2009. The Local Government Act. Juba: GOSS.
189
Norwegian Refugee Council (NRC). 2012. Customary law and land rights in South Sudan. Juba: NRC. 190
World Vision International. 2004. A study of customary law in contemporary Southern Sudan. Juba: World
Vision International.
Statutory law
courts Customary law
courts
Boma level
dispute
settlement

8-4
A household is defined as a person or group of people, related or unrelated, who live together in the same dwelling unit or separate dwelling but share same food or income source. 188 It was assessed that the farming households occupied 75% of the total household number in 2012. 191 They are mainly subsistence farmers and household members carry out the farming activities in most cases. The household size in rural areas is 6.4 people which is smaller than that in urban areas.192 The number of farming households as of the middle of 2012 was 1,210,001.
8.2 Reintegration of Returnees and Internally Displaced Persons into Rural Communities
Responsibility for the returning and reintegration process of returnees and Internally Displaced Persons (IDPs) lies with two government entities: at the state and county level, the South Sudan Relief and Rehabilitation Commission (SSRRC); and at the national level, the Ministry of Humanitarian Affairs and Disaster Management (MoHADM). They coordinate their activities and work with DPs to assist returnees and IDPs.
8.2.1 Returnees
The civil war and insecurity in South Sudan caused the displacement of a large number of people from their homes. After the Comprehensive Peace Agreement (CPA), there was a large influx of returnees and their return still continues. After the independence of South Sudan in 2011, the number of returnees from the north (hereafter referred to as the North) of the previous country of Sudan increased; the government of the new country of Sudan obliged all South Sudanese to return to South Sudan. As of May 2013, the accumulated number of returnees is 1,905,245 (Figure 8-4). This is 18% of the 2013 projected population. The majority of the returnees had no means of livelihood193 when they arrived in South Sudan to restart their lives in a new environment.
Figure 8-4: Cumulative number of the returnees (2007- May 2013)
Figure 8-5: Returnees and State average cereal yield (t/ha)
Source: International Organisation for Migration (IOM).2013. Returnees to South Sudan. Juba: IOM. (Internal document based on IOM Tracking and Monitoring Database)
Source: FAO and WFP. 2013. CFSAM. Juba: FAO and WFP.
191
FAO and WFP. 2013. Crop and food security assessment mission (CFSAM). Juba: FAO and WFP. 192
Average 6.5 people/household, 6.4 people /household in rural area, and 7.1people /household in urban area.
Source: NBS. 2012. National Baseline Household Survey 2009. Juba: NBS. 193
United Nations Office for the Coordination of Humanitarian Affairs (OCHA). Mid-Year Review of the
Consolidated Appeal for South Sudan 2012. Juba: OCHA
162,076347,518
449,433418,877
328,802
160,303
38,236
162,076
509,594
959,027
1,377,904
1,706,7061,867,009
1,905,245
0
200,000
400,000
600,000
800,000
1,000,000
1,200,000
1,400,000
1,600,000
1,800,000
2,000,000
2007 2008 2009 2010 2011 2012 2013
People
Returnees
Accumulatedtotal
0
0.2
0.4
0.6
0.8
1
1.2
1.4
1.6
t /h
a
Returnees average
State average

8-5
On their return from the North, returnees can stay several days or months at one or more facilities called “transit sites” and “way stations” in South Sudan, before finally returning to their home community (boma or village) from where they originally came. In the case of returnees that do not have a home community, DPs and the government organisations, such as the SSRRC, find host communities for them to move to. On arrival in the community, IOM provides three months food support and a non-food package including plastic sheets, blankets, mats, utensils, mosquito nets, etc. The returnees are considered as residents after 3 months. At this stage further support is dependent on their location since further support is not mandatory. Only if there is a humanitarian aid agency or programme in the area will returnees get further support. As a result, most returnees remain vulnerable. Figure 8-5 shows average cereal yield for returnees and states. Except for Unity State, the average yield for returnees is approximately 30 to 64% lower than the state average. These results indicate the disadvantages that returnees face in agricultural production. In the reintegration process, there are several issues. Returnees who settle in their home communities will be allocated land as they are from the community. However, the returnees who go to a host community often face problems with land access. Although the community agreed to host them, sometimes they refuse to allocate land to the returnees. In some cases, the communities ask for monetary compensation from the government. Although the Land Act 2009194 specifies the importance of reintegration for returnees and IDPs, there is no clear procedure for allocating land to these people. The average area of cereal cultivated by the returnee households in 10 states is from 13 to 56% smaller than the state average. The majority of returnees later move to urban and sub-urban areas from their home or host communities because they have no agricultural experience. Many of them worked in non-agricultural jobs in Khartoum. The influx of returnees to these areas causes a deterioration in both public and food security. Some live with their relatives; meanwhile, others live on illegally occupied land. The urban areas cannot provide enough jobs. Some returnees from the North face a language barrier since their first language is Arabic which further decreases their employment opportunities. In contrast, most returnees from East Africa do not have this language problem and tend to have more capital.
8.2.2 Internally Displaced Persons (IDPs)
There are two types of IDPs: one is internally displaced due to the civil war and the other is displaced due to insecurity and natural disasters. At present, most IDPs are of the latter type. In 2012 there were over 430,000 IDPs.195 Since the number of IDPs is affected by conflict, the majority of IDPs are from Jonglei State where inter- and intra-communal conflicts frequently occur. When a conflict or natural disaster occurs, DPs and the SSRRC assess the situation and relief goods are provided. The period of evacuation for IDPs tends to be short; they go back to their homes when the situation improves. They can re-settle in other communities if the insecurity continues. Although some IDPs are accepted by host communities and allocated farm land by the chiefs or by consensus among community members, the settlement process tends to be more difficult than for returnees. Communities can refuse to allocate land to IDPs as they are not community members. In addition, if the IDPs are pastoralists attempting to settle in an area of sedentary farming, there can be tension between the two parties. There are also IDPs who move to urban areas where there are better opportunities. If they want to cultivate
194
GOSS. 2009. The Land Act. Juba: GOSS. 195
IOM. 2012. South Sudan Annual Report. 2012. Juba: IOM. Approximately, over 260,000 people are displaced
due to floods; over 170,000 are also displaced due to either cross-border or internal conflicts. .

8-6
in nearby rural areas, usually they are required to pay rent and will commute between the urban and rural areas.
8.3 Gender Issues
The percentage of women in the population is 48%. The Transitional Constitution of Southern Sudan assures women of equal rights 196 ; however, there still remain gender disparities as shown in Table 8-2. The gross enrolment rate (GER) of primary education, net attendance rate of primary education and literacy rate show that there are fewer educational opportunities for women in South Sudan. Women’s net attendance rate is 28% lower than that of men; the female literacy rate (above 15 years old) is less than half of men’s. The maternal mortality rate is one of the highest rates in the world due to insufficient medical and health services.
Table 8-2: Key indicators on gender disparity
Indicator Women Men Total
Gross enrolment rate (GER) of primary education in 2010a 54.5% 81.4% 68.8%
Net attendance rate of primary education in 2009b 36% 64% 40%
Literacy rate (15-24 years) in 2009b 28% 55% 40%
Literacy rate (above15 years old) in 2009b 16% 40% 27%
Maternal mortality rate (per 100,000 live births) c 2,054 - -
a MoE. 2010. EMIS. Juba. MoE.
b Data from NBS. 2012. National Baseline Household Survey 2009. Juba: NBS.
c Data from Ministry of Health (MoH). 2006. Sudan Household Health Survey I. Khartoum: MOH.
In addition, it is estimated that women rarely have ownership of land, dwellings or livestock. 197 The issue of women’s land ownership is pointed out as a high-priority challenge in an African Union report.198 Land is an important means of livelihood in rural areas. Regarding households living under the poverty line,199 the percentage headed by females (57%) was 9% higher than the percentage headed by males (48%). This result indicates that households headed by females have less food than male headed households. The issue of female headed households is also addressed in the South Sudan Development Plan 2011-2013 (SSDP) as a vulnerable group living under poor conditions. 200
In the National Baseline Household Survey 2009, there were no significant differences by gender in tenure status or type of dwelling or in access to health care facilities. However, other results indicate that female headed households have fewer assets such as transport items (e.g. vehicle, motorcycle and bicycle) and mosquito nets in comparison with male headed households. In addition, the female headed households spend less money on food per month; their toilet facilities are poorer. These results may be partly influenced by household size. The average female headed household size was 6.0 people while that of a male headed household was 6.8 people. This could represent less male workforce in these households. Meanwhile, the survey indicates that female headed households have more access to improved drinking water.
196
GRSS. 2011. The Transitional Constitution of Southern Sudan. Juba: GRSS. 197
Ministry of Gender, Child and Social Welfare (MoGC&SW). 2012. Comprehensive Country Gender
Assessment. Juba: MoGC&SW. 198
African Union (AU). Economic Commission for Africa (ECA) and African Development Bank (AfDB). 2010.
Framework and guidelines on land policy in Africa. Addis Abeba: AU, ECA and AfDB. 199 The poverty line is calculated using 2400 calories per person per day as the daily energy intake threshold, in
addition to a minimal nonfood component. The poverty line was calculated to be 73 SDG per person per month. NBS. 2012. National baseline household survey 2009. Juba: NBS.(p. 59)
200 GRSS. 2011. South Sudan Development Plan (SSDP) 2011-2013. Juba: GRSS.

8-7
The status and situation of women in South Sudan vary amongst the communities; gender disparity does not always show up in the mean values of the survey. In some villages, the right of women to speak is observed and they have influence in their villages’ decision making; they also have more access to assets. The majority of women engage in agricultural activities. Approximately 75% of households headed by females engage in either crop farming or animal husbandry, which is almost the same as male headed households.
8.4 Security and Conflicts
South Sudan achieved independence in 2011 after a long civil war that was fought mostly in South Sudan; however there are still security issues. Figure 8-6 shows the number of conflicts that happened in the last 3 years which includes both internal conflicts, such as inter- and intra-communal conflicts, and cross-border conflicts. Since the recording periods in 2010, 2011 and 2012 are different, it is difficult to compare years. The data, however, show that more conflicts occur in Jonglei, Lakes and Unity States.
Figure 8-6: Cumulative numbers of conflicts
Source OCHA. 2010. Cumulative figure of conflict incidents reported in 2010 (As of 30
th Oct.). Juba: OCHA
OCHA. 2011. Cumulative figure of conflict incidents reported in 2011 (As of 31st Jul.). Juba: OCHA OCHA. 2012. Cumulative figure of conflict incidents reported in 2012 (As of 30
th Nov.). Juba: OCHA
According to the United Nations Department of Safety and Security in South Sudan, approximately 460 conflicts occurred between January 2009 and June 2011. The types of conflict were: cattle raiding (44%), armed skirmishes involving rebel militia groups (25%), attacks by the Lord’s Resistance Army (16%) and tribal fighting (15%). Attacks by the Lord’s Resistance Army have displaced people but have decreased over this period. Other conflicts are mainly about competition for natural resources, especially when natural resources become scarce in the dry season. Pastoralists move looking for water and pasture, and conflicts arise between other pastoralists and sedentary agriculturalists. In 2012, 63% of the conflicts happened between January and May. 201 Conflicts in this period decrease agricultural production as land preparation and planting are interrupted. Cultural traditions also cause and prolong conflicts. When cows are stolen by pastoralists in a cattle raid, the original owners take back their cows in another cattle raid, plus extra cows
201
WFP. 2013. ANLA 2012/2013. South Sudan. Juba: WFP.
0
20
40
60
80
100
120
140
160
180
2010
2011
2012

8-8
as payment for the period they were without their cows. For some tribes, cattle raiding has a ritual meaning: it demonstrates a boy’s transition from adolescent to adult. 202 These conflicts become more serious because small arms are carried by the pastoralists. This issue is prioritised in the SSDP. The National Demobilisation, Disarmament, and Reintegration Commission (NDDRC) attempts to disarm civilians with DP support, but with limited success. People still want firearms to protect their property and themselves; therefore, new firearms have been supplied from outside. Exceptionally, in Northern Bahr el Ghazal State, cattle are looked after by children and women using only sticks after successful disarmament.
8.5 Land Tenure and Access to Land
Land in South Sudan is classified as public, community or private land194. Public land is owned by the national, state or local government. Public land includes roads, railways and airports as specified by laws; it also includes rivers, lakes, canals, wetlands and other areas of water where ownership cannot be identified. Moreover, all forest and wildlife areas which are officially gazetted as national reserves or parks are public land. If there is no private or customary ownership, the land can be considered public land. Community land is the land held by communities (boma or village) which includes most rural areas. It includes residential areas, community forests, farmland and grazing areas. Finally, private land is land formally registered and held under leasehold or freehold tenure. The concept of ownership of community land must be understood. It involves the right to use a piece of land in a community (boma or village) which is given or revoked by the boma chief or community consensus. The land can be inherited by the owner’s children but the owner can neither sell nor lease it. Land can be leased to outsiders by the community. If a farmer clears community land, he is considered to own the land. Most private land is in urban areas, especially in gazetted areas. For private land, a land survey and registration are required for acquiring land tenure which are dealt with by the appropriate State Ministry and five Land Registry Offices (part of the Judiciary) in Unity (Bentiu), Upper Nile (Malakal and Renk), WBG (Wau), and Central Equatoria (Juba) States. In the other six states, the appropriate State Ministry is in charge of both land survey and registration. Once a piece of land is registered, the leasehold deed is issued and given to the owner. Since the renewal process of leasehold tenure is not fully established, the tenure could be thought as freehold, i.e. as an indefinite lease. Private land can be inherited and sold or sub-leased. Table 8-3 shows the types of farmland tenure and acquisition of farmland. Farmland is presumed to be community land. More than 90% of farmers own their land in both urban and rural areas but in the sense that they own community land. The majority of land is inherited; 15% of the farmers in urban areas and 21 % of the farmers in rural area acquire their land by clearing it. Nearly 90% of farmers in rural areas obtain their land either by inheritance or clearing land. In urban areas 7% of land is purchased. Land acquisition is becoming more complicated due to urbanisation and the increased value of land values in urban areas.189
202
T. Richardson. 2011. Pastoral Violence in Jonglei. www1.american.edu/ted/ICE/jonglei.html
(accessed on 1 July 2013)
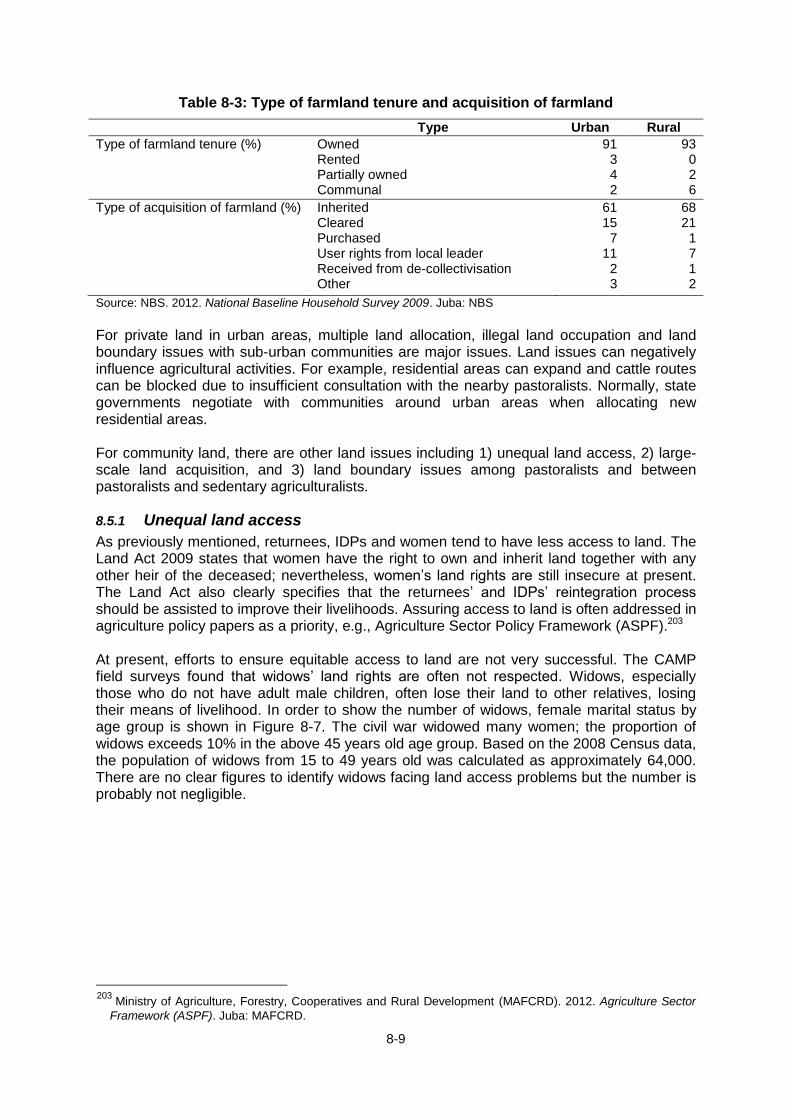
8-9
Table 8-3: Type of farmland tenure and acquisition of farmland
Type Urban Rural
Type of farmland tenure (%) Owned Rented Partially owned Communal
91 3 4 2
93 0 2 6
Type of acquisition of farmland (%) Inherited Cleared Purchased User rights from local leader Received from de-collectivisation Other
61 15
7 11
2 3
68 21
1 7 1 2
Source: NBS. 2012. National Baseline Household Survey 2009. Juba: NBS
For private land in urban areas, multiple land allocation, illegal land occupation and land boundary issues with sub-urban communities are major issues. Land issues can negatively influence agricultural activities. For example, residential areas can expand and cattle routes can be blocked due to insufficient consultation with the nearby pastoralists. Normally, state governments negotiate with communities around urban areas when allocating new residential areas. For community land, there are other land issues including 1) unequal land access, 2) large-scale land acquisition, and 3) land boundary issues among pastoralists and between pastoralists and sedentary agriculturalists.
8.5.1 Unequal land access
As previously mentioned, returnees, IDPs and women tend to have less access to land. The Land Act 2009 states that women have the right to own and inherit land together with any other heir of the deceased; nevertheless, women’s land rights are still insecure at present. The Land Act also clearly specifies that the returnees’ and IDPs’ reintegration process should be assisted to improve their livelihoods. Assuring access to land is often addressed in agriculture policy papers as a priority, e.g., Agriculture Sector Policy Framework (ASPF).203 At present, efforts to ensure equitable access to land are not very successful. The CAMP field surveys found that widows’ land rights are often not respected. Widows, especially those who do not have adult male children, often lose their land to other relatives, losing their means of livelihood. In order to show the number of widows, female marital status by age group is shown in Figure 8-7. The civil war widowed many women; the proportion of widows exceeds 10% in the above 45 years old age group. Based on the 2008 Census data, the population of widows from 15 to 49 years old was calculated as approximately 64,000. There are no clear figures to identify widows facing land access problems but the number is probably not negligible.
203
Ministry of Agriculture, Forestry, Cooperatives and Rural Development (MAFCRD). 2012. Agriculture Sector
Framework (ASPF). Juba: MAFCRD.

8-10
Figure 8-7: Female marital status by age group
Source: SSCCSE. 2010. Southern Sudan counts: Tables from the 5th Sudan population and housing census. Juba: SSCCSE.
8.5.2 Large-scale land acquisition
Large-scale land acquisition can be a problem. In order to prevent such acquisition, the Investment Promotion Act 2009 204 sets out the lease period for agricultural and forest land. The Land Act 2009 also specifies the maximum lease period for land as 99 years and requires the community to report to the state government through the local government when more than 250 feddans of community land is allocated for commercial or agricultural purposes to a person or company, national or foreign. The state is also required to consult with community members. Next, the investors must negotiate with the community and submit the leasehold contract with the community to the state government. Finally, the decision made by the community will be approved by the state government. The consultation process is not clearly described in the two Acts and there are no penalties for violation; it is possible that a number of large-scale land lease agreements might be made without sufficient consultation with community members. As a result, community members perceive that their lands were grabbed; land grabbing is a South Sudanese term used to describe the illegal acquisition of community or private land generally by well-connected people. Between 2007 and 2010, total 26,400km2 of land was either acquired or planned to be acquired, mainly by foreign companies.205
8.5.3 Land boundary issues
There is tension among pastoralists and between sedentary agriculturalists and pastoralists. Among pastoralists, tensions arise when pastoralists compete for scarce natural resources such as pasture and water points in communal areas or when cattle enter other pastoralists’ territory. Within a community, in the rainy season, cattle move to highland to avoid humidity and dangerous creatures such as crocodiles and poisonous snakes. Then, in the dry season, the
204
GOSS. 2009. The Investment Promotion Act. Juba: GOSS. 205
Norwegian People’s Aid. 2011. The New Frontier: A baseline survey of large-scale land-based investment in
Southern Sudan. Oslo: Norwegian People’s Aid.
0%
10%
20%
30%
40%
50%
60%
70%
80%
90%
100%
Divorced
Widowed
Married
Never Married

8-11
cattle move to lower land and eat the pasture that grew during the rainy season. This kind of migration involves short distances and generally does not lead to problems. In the dry season, or to escape conflict, some pastoralists migrate longer distances to areas where there is more water and pasture. This migration causes tension between pastoralists and sedentary agriculturalists. The pastoralists pass through agricultural villages and damage crops. In some areas, the chiefs mediate; they estimate the amount of damage and the pastoralists compensate the agriculturalists. In other cases, the pastoralists resort to force. In order to minimise conflict, the government and DPs try to define migration routes for effective land use. Some communities erect fencing around their farmland as a self-defence measure. Land boundary issues in sedentary farming areas are not confirmed but are probably less. Livestock are carefully looked after to avoid damaging crops. Along with urbanisation, in urban and sub-urban areas, land survey and registration have been conducted. This will prevent land boundary conflicts in the future. In some states, there are charges for land survey and registration; farmers in urban and sub-urban areas are subsistence farmers and sometimes cannot afford to pay these charges. Apart from large-scale land acquisition, customary law plays an important role in resolving land issues. Customary law, however, faces challenges from many directions especially statutory law. Since customary law is undocumented, it can be interpreted differently by different chiefs. Therefore, the Draft Land Policy 2013206 proposes to enact the Community Land Act which will document customary law, improve land tenure and ensure equal land rights for every community member. The policy also addresses land grabbing and land boundary issues. One of the big challenges will be capacity development of government staff involved in land administration, including practical rules for land management.
8.6 Access to Basic Services
For basic services analysis, water, education, energy and health related data are used as indicators. The majority of the population, approximately 55%, have access to improved water (Figure 8-8). In rural areas, the percentage is much lower than urban areas. The sources are mainly hand pumps, boreholes and shallow wells. These are mainly installed with DPs’ support. Others in rural areas are taking water from running open water sources such as rivers. This can negatively influence the health of these people. Additionally, fetching water is done by women increasing their workload. The gross attendance rate for primary education is 98% in urban areas; the rate is 59% in rural areas (Figure 8-9). The gross attendance rate is higher than the net attendance rate in Figure 8-2 because it includes children of all ages attending primary school. The gap is wider in secondary education. In South Sudan, even in public primary schools, the pupils are required to pay school fees. This will reduce the attendance rate especially in rural areas, where the majority of subsistence farmers live.
206
South Sudan Land Commission (SSLC). 2013. Draft Land Policy. Juba: SSLC.

8-12
Figure 8-8: Main source of drinking water (%)
Source: NBS. 2012. National Baseline Household Survey 2009. Juba: NBS.
Figure 8-9: Gross attendance rates in primary and sedoncary school (%)
Source: NBS. 2012. National Baseline Household Survey 2009. Juba: NBS.
There is almost no public energy supply such as electricity and gas. Electricity is provided individually mainly by generators and occasionally by solar panels. For cooking, firewood is used especially in rural areas where 94% use firewood (Figure 8-10). Firewood collection is done by women, which is time consuming for women in rural areas. Much charcoal is made in rural areas especially as land is cleared; however, it is not fully utilized due to high transport costs. Some charcoal is transported to markets in urban areas where many people use it for cooking. There are mainly three types of health care facilities; primary health care units, primary health care centres and public hospitals. In total, 70% of the population have access to health care facilities; however, the quality of the services delivered is different between urban and rural areas (Figure 8-11). Primary health care units have only health trained personnel, there are no doctors or nurses. In primary healthcare centres, there are a number of doctors and nurses or assistant doctors with or without a nurse. In rural areas, 43% of the people use primary health care units, followed by primary health care centres and public hospitals. This order is reversed in urban areas; 55% use public hospitals, while primary health care units are used by only 8%. The low availability of health care in rural areas could result in health issues and reduction of agricultural production. There are no toilet facilities for 80% of the population and the percentage is higher in rural areas.188
0
5
10
15
20
25
30
35
40
Hand pumps Deepboreholes
Running openwater
Shallow wells Others
Urban
Rural
Total
0
10
20
30
40
50
60
70
80
90
100
Gross attendance ratein primary school(6-13 years old )
Gross attendance ratein secondary school
(14-16 years old)
Urban
Rural
Total

8-13
Figure 8-10: Main source of energy for cooking (%)
Figure 8-11: Health care facility most visit (%)
Source: NBS. 2012. National Baseline Household Survey 2009. Juba: NBS.
Source: NBS. 2012. National Baseline Household Survey 2009. Juba: NBS.
8.7 Livelihoods
Most of the population of South Sudan engage in agricultural activities. About three quarters of the population rely on crop farming or animal husbandry as their main source of livelihood.188 Their faming style is largely subsistence. They sell extra agricultural produce to obtain cash which is used for buying food items. Sometimes they have to buy staple foods such as maize and sorghum during the period of seasonal food insecurity. Breakdown of household expenditures is shown in Figure 8-12. Most income is spent on food reaching 81% in rural areas. Utilities expenditure (water, waste, energy for lighting and cooking) is 6%, housing 4%, health 3% and clothing 3%. People in rural areas have very little spare money. In rural areas, breakfast tends to be light. Lunch and dinner consist of a staple food (e.g., sorghum, maize, and cassava) and a sauce made of vegetables, beans, meat or fish. Food variety and intake vary between the livelihood zones. The natural environment (e.g., rainfall, vegetation and natural food resources) heavily influence daily diet. The Greenbelt and Hills and Mountains zones have greater food intake and variety due to higher rainfall and a more favourable growing environment. Honey and fruits are more available. Milk consumption is not high since most people do not keep cattle.
0
10
20
30
40
50
60
70
80
90
100
Firewood Charcoal Grass Others
Urban
Rural
Total
0
10
20
30
40
50
60
Primary healthcare unit
Primary healthcare centre
Public hospital Privtehospital/Clinic
Others
Urban
Rural
Total

8-14
Figure 8-12: Proportion of monthly expenditure
Source: NBS. 2012. National Baseline Household Survey 2009. Juba: NBS.
People’s livelihoods are harder in the northern zones. Due to low rainfall and poor vegetation (e.g., semi-arid zone), agricultural production is low and natural resources scarce. Subsistence farmers in the Western Flood Plains and Nile-Sobat Rivers eat twice a day; however, the volume and quality are poorer than in the Greenbelt and Hills and Mountains zones. Sometimes they eat only sorghum and milk, especially in the dry season, when vegetables are not available. Fish is an important source of protein in most areas especially in the rainy season. Chickens, goats and sheep are eaten occasionally and kept for periods of food shortage and for unexpected expenses. Selling cattle is the last resort for farmers. Farmers rarely slaughter cattle but will eat cattle that die of natural causes; when they eat beef, they usually buy it from the market. With the expansion of a cash economy, the value farmers place on cattle is changing, especially in urban areas. People are not so reluctant to sell them as before. Hunting of wild animals is prohibited by the national government; however, rural people occasionally hunt especially during the period of seasonal food insecurity.
8.8 Assets
For assets owned by households, transportation, dwelling, ownership of selected items and livestock are used as indicators. Bicycles are the most popular transportation (Figure 8-13). More than 20% of households in rural areas own bicycles meaning that the bicycle is the most common means of transport in rural areas. In Western Equatoria and Western Bahr Ghazal States, transportation of agricultural produce by bicycle is common. Farmers and purchasers of produce use bicycles even for comparatively long distances. The ownership of motorcycles and motor vehicles is low in rural areas due to people’s lack of funds. Canoes and boats are owned by only 2% of the people, mainly in Upper Nile, Jonglei, and Unity States which have rivers and flood plains. 188 The majority of the population (82%) live in traditional dwellings called tukuls which are grass thatched houses with walls of mud and/or sticks (Figure 8-14); in rural areas 86% live in tukuls. Although the quality of the dwellings was not part of the survey, it can be assumed that the quality in rural areas is fair, since building materials are easily available. Rural people spend much time building and maintaining their houses in the dry season. Tukuls have poor ventilation due to limited holes for ventilation in the mud walls. Normally there is one door and some small windows. If the walls are made of sticks, there are no ventilation problems but the houses are often attacked by termites, especially in the dry season.
0% 20% 40% 60% 80% 100%
Urban
Rural
Total
Food
Education
Health
Clothing
Utilities
Transportation/CommnicationPersonal care
Housing
Recreation
Others

8-15
Figure 8-13: Type of transportation owned (%)
Figure 8-14: Type of dwelling (%)
Source: NBS. 2012. National Baseline Household Survey 2009. Juba: NBS.
Source: NBS. 2012. National Baseline Household Survey 2009. Juba: NBS.
Shoes are most commonly owned item, but ownership is only 56% (Figure 8-15). Sandals are the most common footwear. Mobile phones are a widespread communication tool; ownership was 65% in urban areas and 10% in rural areas in 2009. The rate may have increased since then. The gap in phone ownership shows both the income gap between urban and rural areas, and the lack of service and electricity in rural areas. The gap in ownership of a radio could be for the same reasons. Mobile phones and radios are not affordable for some subsistence farmers. Despite the low ownership rates of mobile phones and radios, these communication tools are important for rural and agricultural development as they are used to exchange agricultural and market information.
Figure 8-15: Type of items owned (%)
Source: NBS. 2012. National Baseline Household Survey 2009. Juba: NBS.
Figure 8-16: Type of animal owned (%)
Source: NBS. 2012. National Baseline Household Survey 2009. Juba: NBS.
Animals are important assets for farmers. Goats (69% of households), cattle (63%), poultry (57%) and sheep (38%) are owned by households (Figure 8-16). Donkeys are commonly used for carrying water and goods in towns, but ownership is low at 5%. The ownership rates by state are shown in Table 8-4. The states where sedentary agriculturalists are dominant such as Western Equatoria and Western Bahr Ghazal States
0
5
10
15
20
25
30
35
MotorVehicle
Motor cycle/Motor
Rickshaw
Bicycle Canoe/boat
Animal usedfor
transportation
Urban
Rural
Total
0
10
20
30
40
50
60
70
80
90
100
Tukul/gottiyamud/sticks
One floor-mud
Made fromstrawmats
Madeof wood
Onefloor brick/concrete
Others
Urban
Rural
Total
0
10
20
30
40
50
60
70
80
90
100
Television/Satellite dish
Radio Phone Pair ofshoes
Blanket
Urban
Rural
Total
0
10
20
30
40
50
60
70
80
90
100
Cattle Donkeys/Mules
Sheep Goats Poultry
Urban
Rural
Total

8-16
have the highest ownership of poultry at 83% and 82%. In contrast, their ownership of cattle was the lowest among the 10 states. Since cattle can enter farmland and damage crops, these farmers tend not to integrate livestock into their farming.
Table 8-4: Proportion households owning specific animals by State (%)
State Cattle Donkeys/ Mules
Sheep Goats Poultry
Upper Nile 57 3 36 57 50
Jonglei 84 0 36 67 29
Unity 93 1 35 57 39
Warrap 79 2 49 73 64
NBG 47 5 32 65 80
WBG 24 3 27 53 82
Lakes 74 1 40 78 56
WES 12 0 12 52 83
CES 25 0 27 82 70
EES 74 24 54 78 55
Source: NBS. 2012. National Baseline Household Survey 2009. Juba: NBS.
In the other 8 states, there are not such clear patterns of ownership. Probably agriculturalists, pastoralists and agro-pastoralists coexist together. A large proportion of households own livestock, which are eaten by household members or sold for cash for unexpected expenditures or to purchase food in times of shortage.
8.9 Observations
More support for returnees and IDPs is required. Their cereal yield and areas of cereal cultivated are considerably smaller than those of other farmers. Support to returnees and IDPs will contribute to national economic growth. Their land rights need to be assured especially in rural areas. Training on farming techniques, provision of farming tools, vocational training etc. could facilitate their reintegration and develop their farming ability. The improvement of women’s lives is essential for agricultural development in South Sudan. Issues include equal land rights, educational opportunities, access to health care services etc. Equal land rights could be ensured by ensuring land laws are implemented by trained governmental officials. More support to female headed households is required. Disarmament could significantly reduce conflicts and contribute to agricultural development. Efforts by NDDRC and DPs have potential. Procedures for land tenure, urban planning, land survey and registration etc. are not clearly formulated nor fully implemented. These procedures need to be transparent and accountable. Additionally, since customary law is not documented, equal land rights are not available to all community members. Natural vegetation and climate affects the livelihoods of the people of South Sudan. In dry areas, their daily diet is restricted and sometimes does not meet their nutritional needs. Livestock, which can be used as food or sold, could have an important role as they are more drought resilient than crops. However, there would need to be a change in the value placed on cattle. The preferences of pastoralists and agriculturalists, which are different, would need to be considered in selecting livestock when agricultural development plans are formulated.

8-17
8.10 Infrastructure
Infrastructure is the foundation of agricultural development and economic activities. Infrastructure development fosters economic growth. For agriculture, infrastructure could be roads; facilities for storage, drying, processing, marketing and irrigation; slaughter houses, ports, etc. Subsector specific infrastructure is described in the chapters for each subsector, while this chapter focuses on road infrastructure. Adequate roads are critical for: transporting agricultural products; and enhancing farmers’ access year round to local and regional markets plus agriculture related services such as extension and veterinary health. 207 Improvement of roads helps facilitate the flow of agricultural inputs and outputs between farmers and markets.208 There are about 15,764 kilometres of roads in South Sudan and most of them are in poor condition. Moreover, about 65% of these roads are located in areas with high agricultural potential.209 According to the South Sudan Development Plan (SSDP), the objective of the infrastructure sector is to maintain, rehabilitate, provide and operate infrastructure to enhance poverty reduction, economic growth and service delivery in a sustainable manner. Roads and road transport development is one of the key priorities for the infrastructure sector.207 However, road infrastructure in South Sudan is extremely underdeveloped because roads were largely destroyed or left in disrepair during the civil war.208 Current poor road conditions impede agricultural development and economic growth. There are several categories of road: trunk (interstate) roads connect the major towns and regions. Feeder roads connect small towns and villages with medium sized towns. Collector roads ensure the connectivity of the priority feeder roads to trunk roads. Less than 2 per cent of the primary road network was paved when research was conducted in 2011.210 Due to poor road conditions, transportation is time consuming and so becomes more costly. This means transport and trade services are not competitive so that the volume of marketed products is small. Improved roads will reduce transport and marketing costs significantly in the short-term.208 Agricultural economy activities are constrained by the limited availability of paved, rehabilitated, or all season roads. Seasonality also affects the effectiveness of transportation. During the rainy season, many unpaved feeder roads become inaccessible; even the condition of some trunk roads becomes poor. As an example, the lack of a well-constructed road between Juba and Malakal affects the volume of products sent from Juba to Malakal. This road becomes difficult to pass during the rainy season. Then, traders use boats to bring smaller volumes, especially in the rainy season. While transport by boat is one way to transport products, it would be beneficial to have an all season road network to provide more options for efficient transportation. Many trunk roads and feeder roads need to be constructed or rehabilitated. The Ministry of Transport, Roads, and Bridges (MTRB) has tried to improve the current situation, but its resources are limited. DPs are supporting MTRB to construct, rehabilitate, and maintain roads in different parts of the country. The Southern Sudan Roads Authority (SSRA) was established in January 2011. SSRA is an autonomous corporate body responsible for planning, construction, rehabilitation and maintenance of all inter-state and international trunk roads.210
207
Government of the Republic of South Sudan. August 2011. South Sudan Development Plan 2011-2013
Realizing freedom, equality, justice, peace and prosperity for all. Juba. 208
African Development Bank Group. Temporary Relocation Agency. 2013. South Sudan: An Infrastructure
Action Plan. A Program for Sustained Strong Economic Growth. Tunisia. 209
World Bank. May 23, 2013. Agricultural Potential, Rural Roads, and Farm Competitiveness in South Sudan.
Report No. 68399-SS. Washington D.C.

8-18
One of the recommendations of the Joint Assessment Mission (JAM) in 2005 was that South Sudan focus on road construction and rehabilitation. The MTRB developed a Transport Sector Policy and Road Sector Strategy Plan in October 2006. These were approved by the Southern Sudan Legislative Assembly (SSLA) and adopted as framework for the sector development programme.210 Since CPA in 2005, various road projects were implemented. Significant construction and rehabilitation projects were implemented such as the Emergency Road Repair Program and Emergency Transport Infrastructure Development Project, which linked major towns and regions.208 The aim of these road projects was to deliver aid products and services to vulnerable people. Details of key road projects funded or implemented by major DPs follow. The Multi-Donor Trust Fund (MDTF) is a major fund supported by 24 international donors and administered by the World Bank. The MDTF has funded several major road and bridge projects (Table 8-5) through WFP and MTRB. 211 These projects focus mainly on the rehabilitation and maintenance of major trunk roads
Table 8-5: Major road projects funded by MDTF
Project names Implemented periods
Major achievements and characteristics
Emergency Transport and Infrastructure Development Project
2005 to 2012 Project reopened 1,030 kilometres of key interstate and regional roads.
Juba Rapid Impact Emergency Project
2007 to 2012 Project’s main objective was to provide basic pharmaceutical stocks and learning materials. One of the components was road and bridge construction of critical government infrastructure at national and state level.
Southern Sudan Road Maintenance Project
2010 to 2012 Project aimed to improve the quality of targeted roads and strengthen the capacity for strategic and project planning for construction and maintenance of roads.
South Sudan Rural Roads Project (SSRRP)
2012-Current Objective of the project is to enhance all season road connectivity to agricultural services for rural communities in high agricultural potential areas.
Source: Japan International Cooperation Agency. September 30, 2013. Supporting Document for the Project for Capacity Development on Sustainable Road Maintenance and Management in Juba. Unpublished., Rupa Ranganathan, Cecilia M. Briceno-Garmendia. September 2011. Policy Research Working Paper 5814. South Sudan’s Infrastructure: A Continental Perspective. The World Bank. Washington D.C.
Major achievements of the Southern Sudan Road Maintenance Project (Figure 8-17) were improvements of the major trunk roads in the south and west of the country, including roads to Uganda and Kenya, and the road between Wau and Rumbek
210
Rupa Ranganathan, Cecilia M. Briceno-Garmendia. September 2011. Policy Research Working Paper 5814.
South Sudan’s Infrastructure: A Continental Perspective. The World Bank. Washington D.C. 211
Japan International Cooperation Agency. September 30, 2013. Supporting Document for the Project for Capacity Development on Sustainable Road Maintenance and Management in Juba. Unpublished.

8-19
Figure 8-17: Roads maintained by the Southern Sudan Roads Maintenance Project
Source: The World Bank. February 15, 2013. Implementation Completion and Results Report on a Multi Donor Trust Fund-South Sudan (MDTF-SS) Grant in the Amount of US $40 Million to the Republic of South Sudan for a Southern Sudan Roads Maintenance Project. Report No: ICR2564.
WFP has been one of the major road project implementing agencies since 2004 (Figure 8-18). They have repaired 2,600 kilometres of trunk roads. WFP has implemented road projects on behalf of the Government of Republic of South Sudan (GRSS). Initially, WFP targeted trunk roads connecting state capitals. After this, they went on to construct and rehabilitate feeder roads. Both these activities were to enable the distribution of relief goods and humanitarian services.. An on-going project implemented by WFP involves construction of 500 kilometres of feeder roads.211

8-20
Figure 8-18: Roads opened by the WFP since 2004 in South Sudan
Source: Japan International Cooperation Agency. September 30, 2013. Supporting Document for the Project for Capacity Development on Sustainable Road Maintenance and Management in Juba. Unpublished.
UNOPS has partnered with MDTF, UNDP, USAID and the Japanese Government to implement several road projects in remote areas and conflictive areas such as Jonglei, Warrap and Eastern Equatoria states. UNOPS initiated the repair and construction of important trunk and feeder roads to allow more efficient delivery of humanitarian supplies. So far, they have constructed, rehabilitated or repaired 475 kilometres of roads in 25 road projects in ten states.211 The World Bank (WB) has implemented many road projects through the MDTF. They also prioritized rehabilitating and maintaining national and rural roads that would improve delivery of relief goods and peace-keeping operations. Currently, the WB has 14 road projects. The South Sudan Rural Roads Project (SSRRP) is one of the current projects. Its main objective is to provide all season roads which could transport agricultural products to and from rural communities in areas with high agricultural potential, so improving access to markets. It includes components for improving feeder roads and collector roads, which are connected to critical interstate trunk roads. Additionally, SSRRP has a component to enhance the capacity of state and national governments to manage their rural infrastructure.211 USAID has engaged in infrastructure projects in South Sudan since 2003. Construction of roads and bridges, and capacity building for infrastructure are major components. The Sudan Infrastructure Capacity Building Program (SICBP), Rehabilitation, Reconstruction and New Construction of Roads and Bridges, and Response Assistance for Priority Infrastructure Development (RAPID) Program are major transport projects funded or implemented by USAID. In the RAPID Program, road maintenance, road rehabilitation, and construction of feeder roads are undertaken.

8-21
The Japanese government funded road maintenance between Yei, Central Equatoria State and Farasika, Western Equatoria State and road construction between Farasika and Rumbek, Lakes State. JICA funds UNOPS to rehabilitate roads between Meilut and Buni in Upper Nile state which are described in Figure 8-19. The Japanese Self-Defence Force is also rehabilitating a part of the trunk road between Yei and Juba. Completed and on-going, or planned road projects by all DPs in South Sudan are listed in Table 8-6.
Table 8-6: List of Road Projects based on Road Section in South Sudan
No. Road Section Duration Length (km)
Amount Status Funding agency
Implementing agency
1 Yei-Juba (rehabilitation) 2005-2006
160 Opening of the main roads corridor was funded by donors mainly USAID, UK, Norway, and others which is totalled of US $ 285 million.
Completed MDTF WFP
2 Juba-Nimule (rehabilitation)
2005-2007
192 Completed MDTF WFP
3 Nedapal-Torit-Nesitu (rehabilitation)
2004-2007
337 Completed MDTF WFP
4 Kaya-Yei-Rumbek (rehabilitation)
2004-2005
567 Completed MDTF WFP
5 Rumbek-Yirol-Shambe (maintenance)
2005-2008
177 Completed MDTF MTRB
6 Juba-Bor (rehabilitation) 2006-2008
190 Completed MDTF WFP
7 Rumbek-Tonj-Wau (rehabilitation)
2006-2008
230 Completed MDTF WFP
8 Wau-Gorgial-Abyei (rehabilitation)
2006-2008
140 Completed MDTF WFP
9 Juba-Mundri 2007-2009
186 Completed GRSS MTRB
10 Torit-Kapoeta 2010-2011
150 No data Completed MDTF WFP
11 Akobo-Pochala 85 No data On-going UNDP UNOPS
12 Pagak-Mathium 100 No data On-going USAID UNOPS
13 Baraf-Massharaf 100 No data On-going UNDP UNOPS
14 Dabio-Exo (emergency repair)
2011 75 No data Completed USAID UNOPS
15 Yambio-Dabio (rehabilitation)
2009-2010
80 No data Completed USAID UNOPS
16 Yei-Farasika (maintenance)
2009-2010
165 No data Completed GoJ WFP
17 Farasika-Rumbek 2009-2010
200 No data Completed GoJ WFP
18 Dabio-Tambura 2009-2010
105 No data Completed USAID UNOPS
19 Kaya-Yei 2010-2011
85 SSP 9,222,499 Completed MDTF MDTF
20 Yei-Ras Olo 2010-2011
150 SSP 5981,184 Completed MDTF MDTF
21 Karich-Amok Piny 114 No data On-going WFP WFP/GIZ
22 Aluakaluak-Akuoc Cok 114 No data On-going WFP WFP/GIZ
23 Juba-KajoKeji-Keriwa (rehabilitation)
2008-2011
240 US $ 6.69 million Completed MDTF/GRSS WFP
24 Loming Junction-Imehejeck (rehabilitation)
2010-2011
85 US $ 1.3 million On-going MDTF WFP/GIZ
25 Kayila-Ikwotos-Tseretenya
2008-2010
100 SSP 18 million Completed GRSS MTRB
26 Juba-Lebank-Moli (construction)
2008-2011
138 SSP 44,059,310 Completed GRSS MTRB
27 Lainya-Jumbo 2008-2010
110 SSP 24,964,209 Suspended GRSS MTRB
28 Mvolo-Aluakluak (construction)
2008-2010
65 SSP 14 million Suspended GRSS MTRB
29 Wau-Warrap (construction)
2008-2010
90 SSP 43 million Completed GRSS MTRB
30 Thiet-Luonyaker & Tonj Internal road
2008-2012
11 SSP 39 million On-going GRSS MTRB
31 Ayod-Waat-Akobo 2009-2011
215 US $ 22 million Suspended GRSS MTRB
32 Faraksika-Maridi-Yambio 2008- 176 US $ 21 million Completed MDTF UNOPS

8-22
No. Road Section Duration Length (km)
Amount Status Funding agency
Implementing agency
(rehabilitation) 2010
33 Yambio-Tambura 2008-2010
151 US $ 17 million Completed USAID UNOPS
34 Meriam-Wanjok-Aweil 2006-2007
167.93 US $ 288 million Completed GRSS MTRB
35 Marol-Deing 16.7
36 Mayan-Waddweil 11.5
37 Madol-Ameth 21
38 Aweil Ring Road 7.35
39 Wanjok-Mayn-Aryat-Gokmachar-Kiir
145.5
40 Wanjok-Akon-Tiaraliat-Mallek alel-Kom
135
41 Aweil-Waddweil-Nyamlail-Marial Bai
84
42 Nyamlail-Adol 12
43 Aweil-Wau 2008 136.2 SSP 80 million Completed GRSS MTRB 44 Ameth-Abyei 2008 88.8 SSP 108 million Completed
45 Mayan Abon-Wun Rock 2008 26 Completed
46 Gorgial-Akon 2008 45 Completed
47 Wau-Deium Zubeir-Raja (rehabilitation)
2008 320 SSP 387 million 280 km completed
GRSS MTRB
48 Wau-Luonyaker Lietnhom (construction)
2008 145 SSP 122 million 132 km completed
49 Tonj-Thiet-Mauac-Aguer-Maper
2008 180 SSP 90 million 115 km completed
50 Rumbek-Maper-Mayendit 2008 160 SSP 204 million Completed
51 Wau-Tambura 2008 275 SSP 271 million 200 km completed
52 Juba-Terekeka-Yirol-Leer (construction)
2008 512 SSP 469 million 350 km completed
53 Malakal-Nssir-Jekou 2008 250 SSP 311 million On-going
54 Malakl-Renk 2010-2014
345 US $ 222 million Suspended GONU MTRB
55 Terekeka-Tindilo-Tali-Kamande & Tindilo-Rokon
2012 285 US $ 33 million On-going GRSS MTRB
56 Buni-Paloich-Meilot, Upper Nile (rehabilitation)
2013-2014
No data US $ 6.5 million On-going Japan UNOPS
57 Refugee camp site in Maban County (Gedrassa, Doro, Jamman, Yusuf Batil camps), Upper Nile
2012-2013
No data US $ 1.5 million On-going OCHA UNOPS
58 Morobo-Kajokeji 2012-2013
No data US $ 1.3 million On-going USAID UNOPS
59 Yambio-Sakure 2012-2013
No data US $ 0.86 million On-going USAID UNOPS 60 Nzara-Sakure No data US $ 0.45 million On-going USAID UNOPS 61 Yambio-Nabiabai No data US $ 2.6 million On-going USAID UNOPS 62 Yei-Morobo trunk road
(rehabilitation) 2012-2013
No data US $ 2.3 million On-going USAID UNOPS
63 Juba-Nimule road (routine maintenance)
2012-2013
192 US $ 3.09 million On-going USAID UNOPS
64 Yei-Morobo road (rehabilitation)
2012-2014
No data No data On-going USAID UNOPS
65 Pagak-Ulen road 2012-2014
No data No data On-going USAID UNOPS
66 Magwi-Labone road (via Parajok)
2013-2015
89 No data On-going WB MTRB
67 Amadi-Tali road 2014-2015
65 No data On-going WB MTRB
68 Tali-Yirlo (Awerial) 2014-2015
55 No data On-going WB MTRB
69 Yei-New Lasu road 2011-2013
45 No data On-going WB MTRB
70 Ras Olo-Maridi road 2012-2013
71 No data On-going WB MTRB
71 Maridi-Kozi road 2013-2013
60 No data On-going WB MTRB
72 Morobo-Panyume 2013-2014
25 No data On-going WB MTRB
73 Panyume-Yaribe 2013- 25 No data On-going WB MTRB

8-23
No. Road Section Duration Length (km)
Amount Status Funding agency
Implementing agency
2014
74 Yaribe-Gimunu 2013-2014
30 No data On-going WB MTRB
75 Panyume-Kanchu-Limbe 2013-2015
30 No data On-going WB MTRB
76 Narus-Boma 2012-2013
240 No data On-going GRSS MTRB
77 Warrap-Kuacjok-Luonyaker
2012-2013
No data No data On-going EU WFP
78 Kangi-Kuacjok-Luonyaker 2012-2013
No data No data On-going EU WFP
79 Aluakluak-Mapourdit 2012-2013
No data No data On-going EU WFP
80 Pageri-Magwi 2012-2013
No data No data On-going Netherlands WFP
81 Mundri-Bangolo 2012-2013
No data No data On-going Netherlands WFP
82 Yei-Kegulu-Morobo 2012-2013
No data No data On-going USAID UNOPS
Source: Japan International Cooperation Agency. September 30, 2013. Supporting Document for the Project for Capacity Development on Sustainable Road Maintenance and Management in Juba. Unpublished.
As shown in Figure 8-19, construction and rehabilitation for many trunk roads are completed in 7 states, excluding Upper Nile, Jonglei, and Unity States. Transportation among major towns in these seven states has become better. Although some projects are suspended, mainly due to security issues, 46 road projects are on-going in all of South Sudan (Table 8-6). These on-going road projects include road construction and rehabilitation in areas which had not been targeted before, i.e., in Jonglei and Upper Nile, and in parts of Cental Equatoria, Eastern Equatoria and Warrap states. Until recently, the main objectives of road construction projects were to improve trunk roads connecting major towns and regions and to better deliver relief products and services. Such improvements may contribute to reducing the costs of transportation and the prices of products. However, completion of all interstate trunk roads will only provide road access to 18% of the population and 7% of the crop land in areas of high agricultural potential. Hence, the impact on rural connectivity is limited.209 More recently, some road projects have started focusing on the improvement of feeder roads to enhance accessibility of farmers and agricultural products to markets. Currently, the available rural road network is about 6,123 kilometres.208 As of May 2012, the WB estimated that the Rural Accessibility Index (RAI)212 would be improved to 39%, if all the trunk and major feeder roads were fully rehabilitated, while the RAI would be 18% if rehabilitation was limited to interstate trunk roads.209 Improvement of feeder roads is imperative to improve accessibility of farmers and agricultural products to markets. 39% of RAI does not sound a high figure, but infrastructure development takes time and is costly. Continuation of road infrastructure improvement is necessary to achieve an RAI of 39% or higher. Within GRSS there is the Feeder Road Technical Committee (FRTC), whose role is to identify feeder road standards and specifications, develop and prioritize criteria for selecting feeder roads to be constructed / rehabilitated, apply these criteria, and develop initial cost
212
The Rural Access Index (RAI), a key transport headline indicator, has been established to focus on the critical
role of access and mobility in the reduction of poverty in developing countries. The RAI estimates the proportion of the rural population with adequate access to the transport system. Measurement of RAI is based on household survey data to estimate the number of people who live within 2 kilometres (or about 25 minutes walking time) of the nearest all-weather road. The World Bank. Rural Transport, Rural Access Index (RAI). http://web.worldbank.org/WBSITE/EXTERNAL/TOPICS/EXTTRANSPORT/EXTRURALT/0,,contentMDK:22590482~menuPK:2997966~pagePK:210058~piPK:210062~theSitePK:515370~isCURL:Y,00.html. Accessed in November 20, 2013.

8-24
estimates for priority feeder roads. 213 After FRTC identifies priority feeder roads to be constructed, they are integrated into the on-going road projects. On-going road projects are depicted in Table 8-6 and Figure 8-20. Road improvements are also necessary for roads in urban areas. In the medium term, implementation of road projects in urban areas such as Juba, Malakal, Wau, Aweil, Rumbek, Yei, etc will be important as the urban population is expected to increase to 23% in 2015 and 26% in 2020.208 They will be needed to facilitate economic activities in urban areas. In addition, maintenance of the existing road network will require a large amount of funds. Overall, road infrastructure projects will need to be planned and implemented based on priorities that consider rural and urban demands and impacts.
213
Screening criteria of feeder road are as follows: road length, connectivity, requirements of demining,
requirements of full environmental impact assessment, population density, impact of food production and food security, cost of road rehabilitation/construction, security situation. Source: Feeder Road Screening Results.
August 19, 2011., Prepared by the Feeder Roads Technical Committee., GRSS.

8-2
5
Fig
ure
8-1
9:
Co
mp
lete
d R
oad
Pro
jects
So
urc
e:
Jap
an
In
tern
atio
nal C
oo
pe
ration
Ag
en
cy.
Se
pte
mb
er
30
, 20
13
. S
up
po
rtin
g D
ocu
me
nt
for
the
Pro
ject
for
Ca
pacity D
eve
lop
me
nt o
n S
usta
inab
le R
oa
d M
ain
ten
an
ce a
nd M
an
ag
em
en
t in
Ju
ba
. U
np
ub
lishe
d.

8-2
6
Fig
ure
8-2
0:
On
-go
ing
Ro
ad
Pro
jects
(a
s o
f O
cto
ber
1,
201
3)
S
ou
rce:
Jap
an
In
tern
atio
nal C
oo
pe
ration
Ag
en
cy.
Se
pte
mb
er
30
, 20
13
. S
up
po
rtin
g D
ocu
me
nt
for
the
Pro
ject
for
Ca
pacity D
eve
lop
me
nt
on
Susta
inab
le R
oa
d M
ain
ten
an
ce a
nd M
an
ag
em
en
t in
Ju
ba.
Unp
ub
lish
ed
.

9-1
9. Lessons learned from previous investments
The CAMP Task Team conducted a survey on past and on-going development assistance projects in South Sudan’s agricultural sector. The objective was to draw lessons for the formulation and implementation of CAMP out of the experiences of such interventions. The survey focused on the projects that were launched after the signing of the Comprehensive Peace Agreement (CPA) in 2005 in order to be relevant to the current situation. Through a literature survey, the CAMP Task Team identified agricultural development assistance projects. Due to time constraints, 27 projects were selected; EU funded projects are more than half of the total. It should be recognised that these projects may not be a representative sample. A questionnaire was prepared focussing on effectiveness/efficiency and long term sustainability and it was completed for each project. The information collected was analysed to learn lessons for CAMP formulation and implementation, with respect to improving CAMP’s effectiveness/efficiency and long term sustainability.
9.1 Cooperation with the government
Most projects studied work or worked with the central and/or local governments of South Sudan, although the levels of interaction varied. All of them found challenges in the process of cooperation with the government. This sometimes resulted in a low degree of government involvement in projects and programmes, as reflected in the statement by IDA and IFC: “Rather than using aid provision to build government capacity and legitimacy, donors have worked mainly in a humanitarian mode employing NGOs and Project Implementation Units to deliver assistance directly to beneficiary communities”.214 However, cooperation with the government is indispensable in order to have a significant and long-lasting impact on target institutions/communities/areas. In fact, one of the interviewees recognized that engagement of the respective Ministries in the initial process was significant for the effectiveness of an exit strategy and for sustainability of an intervention. Inadequate involvement of the government resulted in insufficient capacity and commitment of the government and hindered effective/efficient implementation of development projects/programmes and sustainability of such efforts. The following lessons are drawn from several projects concerning cooperation with the government.
The state authorities need to be engaged throughout the process to ensure that they own and prioritize implementation of projects in their work plan. The same is true of central government.
It is important to sign a Memorandum of Understanding with relevant state institutions at project inception, clearly detailing exit strategies to be integrated into the project during the implementation period.
Transparency and accountability of the project will motivate the government agencies and other stakeholders to be fully involved in the project planning, implementation and monitoring and evaluation.
Active involvement of and cooperation with community leaders help the project gain commitment and support by the government.
The importance of having long-term visions and incorporating the private sector needs to be discussed and agreed upon with government staff, especially senior members.
214
International Development Association and International Finance Corporation. 2013. Interim Strategy Note
(FY2013-2014) for the Republic of South Sudan. Washington D.C.: World Bank. p. 12.

9-2
The limited security of the country, particularly in rural areas, such as conflicts over land and water resources, may hinder implementation of development projects. In order to avoid conflicts over productive assets developed by projects, such as a water reservoir, local governments and communities need to be involved in the selection and identification of areas, projects and activities to be developed.
9.2 Coordination with DPs
Implementation of CAMP will require involvement of multiple donors, because the geographical areas and sectors covered are so large that it cannot be funded by a single donor. Some projects drew lessons on coordinating donors and/or involving new stakeholders into a project.
Coordination with other implementing agencies and donors will build synergies and ensure non-duplication of activities. This promotes effectiveness and efficiency of the project, which increases the chance of success in a limited amount of time and resources.
Also, common strategies should be developed with other agencies implementing similar projects in order to devise a functional uniform methodology.
However, funding agencies and implementing/supporting agencies need to be careful when they invite new stakeholders into projects because of a possible increase of coordination costs.
9.3 Partnership with the private sector
Sustainability becomes an important issue especially when private entities are established or trained in a project. Some projects identified that the private entities they launched and/or trained, such as community health groups, did not function after project completion. This was because the funds provided by the NGOs ceased at project completion. In order to ensure sustainability, the following suggestions were made on how to involve private entities in a project.
The private entities need to be linked to other organizations in order to operate on a cost recovery basis and to access loans. Private entities need to be able to generate income sustainably.
Also, the government and NGOs’ intervention should be kept at the minimum level. It seems better to reduce financial support to these groups as they grow financially. The target entity’s knowledge of asset building and management, and banking can be an indicator to control the level of intervention.
The size of private enterprises and their relationships are should be taken into consideration. Group-owned/run businesses are not always better than individually-run business. One of the projects studied identified a conflict of interests in the former case. When businesses are run by groups, the division of roles and responsibilities need to be clearly defined in order to avoid such conflicts.
Agriculture is basically a private sector activity. In order to promote sustainable operation of the agricultural sector, the government’s role needs to be clear and restricted to activities that government should do. These might include creating a supportive environment for agricultural activities such as development of regulations and provision of support services.
Additionally, the risk of failure of a business can be reduced by supporting already existing business to grow, rather than starting and growing new ones.
9.4 Participation of farmers
Farmers in South Sudan have limited capacity and inputs to realise the high potential of the fertile lands of South Sudan, due to decades of civil war. Effective/efficient and sustainable

9-3
capacity building of farmers and provision of inputs are essential to improve agricultural productivity. The following lessons were learnt from the various experiences of agricultural projects/programmes.
Famers need to be trained in cost effective ways. For instance, it is not always best to diversify products; it can be more cost effective to focus on increasing productivity of an existing product. Also, the project needs to be careful not to have too many trainees so that each trainee receives enough inputs; instead it should focus on increasing productivity.
It is risky to rely heavily on agricultural inputs such as seeds, fertilizer, and cattle from outside the project site for success of the project, due to poor infrastructure, unreliable transportation and insecurity in South Sudan. For instance, one of the projects studied identified theft of cattle being transported as a major issue.
Adoption of new technologies and practices requires time due to the conservative nature of rural households. A project team needs to spend sufficient time on creating mutual understanding, trust and friendship with the community leaders as well as the community at large. For instance, the needs and rationale that underlie farmers’ risk-averse approaches to farming should be understood in order to gain their understanding and support of new technologies and practices, which will make the project effective and sustainable in the long run.
Partnering with local NGOs and community-based organizations provides many advantages such as local knowledge and community acceptance. It will also increase sustainability after project completion and withdrawal of the international organization from the project site.


PART II


10-1
10. Crop
10.1 Overview
Over 95% of the territory of South Sudan is considered as suitable for agriculture and 50% of it is prime agricultural land for various crops. However, only 3.8% of land is utilised as cropland, while 62.6% of it is covered by trees.215 So far, only limited areas are utilised for crop production. Almost all farming areas are rain-fed, thus agricultural production is heavily influenced by rainfall. Precipitation generally increases from north-east to south-west and rainfall patterns tend to be erratic nowadays. Based on the precipitation, water availability and livelihood patterns, the country is categorised into seven livelihood zones (i.e., Greenbelt, Hills and Mountains, Ironstone Plateau, Eastern Flood Plain, Western Flood Plain, Nile-Sobat Rivers and Pastoral). In each zone, different types of agriculture are practiced. Approximately 78% of households in the county are engaged in agriculture 216 and the average area farmed per household is about 1.12ha. 217 The majority are subsistence farmers who cultivate crops for home consumption. They utilise very simple manual tools, such as hoe, maloda,218 panga and axe, for farming activities. In some areas farmers use ox ploughs but in most areas ploughing is done manually. Weeding is one the most labour intensive activities during the farming season since farmers practice mixed cropping and weed manually by using simple tools or by hand. Harvesting is also labour intensive. Most farmers do not use chemical fertilisers and many of them use traditional varieties of seeds which are obtained from their own harvest of the previous season whose quality is variable since they are a mixture of unknown varieties and liable to damage by insects. Use of high yielding varieties is not very common in rural areas since it is difficult for rural farmers to access them. Pesticides and herbicides are not used at all except by a limited number of progressive farmers and in large scale mechanised schemes. Main crops cultivated are sorghum, maize, cassava, groundnuts, sesame, pearl and finger millets, beans, peas, sweet potato and rice. Sorghum is a main staple food, which is widely grown in the whole country. Usually sorghum is grown with some other crops (e.g., groundnuts, sesame, cowpeas, beans and pumpkins). A large volume of maize is mainly grown in the Greater Equatoria Region, especially in the Greenbelt zone. Farmers in the northern part of the country also began to grow maize recently since sorghum is usually severely damaged by birds; farmers choose maize because it is has less damaged by birds. Cassava is mainly grown in the Greater Equatoria Region, especially in Western Equatoria State. Groundnuts are a very important crop for famers as both food and cash crops. It is widely grown. Even though vast arable land is available, farmers cannot exploit it fully due to their insufficient knowledge, skills, experience and use of simple hand tools, plus underdevelopment of mechanised farming and limited irrigation facilities. Total net cereal production in 2012 was 761,378 tons and total cereal requirement for 2013 was 1,132,368 tons.219 The estimated cereal deficit in 2013 is 370,991 tons. This number is much better
215
World Bank. Agricultural Potential, Rural Roads, and Farm Competitiveness in South Sudan. p. 5. 216
NBS. 2012. National Baseline Household Survey 2009. p. 53. 217
FAO / WFP. 2013. Crop and Food security Assessment Mission to South Sudan. p. 14. 218
Maloda is a traditional hoe. There are various kinds of malodas, such as anchor shaped blade and another
with a small trapezoidal blade. 219
Net cereal production is 80% of gross cereal production, taking into account postharvest loss and seeds for
the next season. FAO / WFP. 2013. Crop and Food security Assessment Mission to South Sudan. pp. 21-22.

10-2
than that of 2012 but the country still cannot achieve cereal self-sufficiency. This food gap could be filled by emergency food aid and imports from neighbouring countries. Vegetables are produced near homes mainly for home consumption. Most of the fresh vegetables in markets are coming from Uganda, Kenya and Sudan, and some green leafy vegetables (e.g., amaranthus and Jew’s mallow) and okra are supplied to markets from peri-urban areas of the country. Peas and beans (e.g., cowpeas, kidney beans, green gram and pigeon peas) are grown near homes, again mainly for home consumption. Fruit is also grown throughout the country. Especially in the Greenbelt and Hills and Mountains zones, various kinds of fruit are grown. Pineapple, mango, avocado, citrus, papaya, passion fruit, jack fruit and guava are produced and mainly consumed locally. A small volume is also sold in urban markets while a large volume, including watermelon and banana, is imported mainly from Uganda. Coffee and Tea are also grown in both zones but production volume seems to be limited. As mentioned, many vegetables and fruit are imported from neighbouring countries although South Sudan has great potential for vegetable and fruit production with substantial water resources and highly fertile soil.
10.2 Key issues and challenges
Key issues and challenges identified during the situation analysis are as follows: (1) Low agricultural production
The gross cereal yield has stagnated at a low level since 2009, approximately from 0.8 t/ha to less than 1.0 t/ha due to rain-fed farming, use of traditional varieties, low quality seeds, low inputs (e.g., fertiliser and agro-chemical) and damage by pests and diseases. Likewise, cereal area harvested per capita has been at a low level, about 0.1 ha, since 2009 because land reclamation, ploughing, seeding, weeding, harvesting and postharvest handling are mainly done manually by family or communal labour.
These two aspects (i.e. yield and area harvested per capita) are causes of serious food insecurity in 2013. Estimated cereal deficit in 2013 is approximately 370 thousand tons. This amount could be filled by food aid and cereal imports. Even the rural population, the majority of whom live in farming households, face food insecurity, particularly during the period of seasonal food insecurity.220
Due to favourable rainfall, temperature and soil conditions, some areas are suitable for cash crops (e.g., vegetables, fruit, tea, coffee and oil seeds); however, the potential is not fully exploited as of now.
(2) High costs
Compared to neighbouring countries, labour costs are relatively high due to the strong South Sudanese currency influenced by oil exports.
Prices of agricultural inputs are relatively high since all are imported from foreign countries. South Sudan is a landlocked country so import costs tend to be higher.
Domestic transport costs are increased up due to poor road conditions and high fuel prices.
Higher production costs reduce agricultural competitiveness in international markets. A large volume of agricultural products is imported from neighbouring countries such as Uganda, Kenya, Ethiopia and Sudan.
(3) Poor infrastructure
Interstate and primary road networks are not well maintained so some are not passable during the rainy season. This makes transportation costs higher. Since the
220
Seasonal food insecurity occurs when stocks of produce from the previous harvest may be depleted and
households may have to find alternative sources of food using coping mechanisms (or strategies).

10-3
condition of feeder roads is extremely poor, collection of products from production areas is difficult and costs for collection become very high.
Only a limited number of farmers own irrigation facilities although a large part of the country is endowed with substantial water resources.
Large and medium scale warehouses for storing and shipping cereals and drying yards for postharvest activities are not yet developed.
Public electric services are provided in very limited areas, so most business entities are utilising generators for electricity, which makes electricity very expensive.
(4) Insecurity Due to insecurity some farmers fail to cultivate crops. When farmers escape from
inter-communal or tribal conflicts and become Internally Displaced Persons (IDPs), they tend to lose opportunities to cultivate crops. This situation causes serious food insecurity in rural areas.
Livestock coming from other areas with armed pastoralists often destroys farmers’ crops. Fencing is one of the effective prevention measures but it requires a high investment. Usually farmers cannot afford to construct a fence.
(5) Weak service delivery to farmers
Both national and state governments can deliver very limited services to farmers. At payam level, a limited number of Agricultural Extension Officers (AEOs) are deployed, so farmers rarely get access to improved technical knowledge and skills for agriculture. NGOs provide some technical services (e.g., training and extension), but the number of beneficiaries is quite limited.
Basic research for crop production is rarely done by government institutions. Thus, new technologies for crop production are not developed. Similarly, information and technology dissemination for extension officers and farmers is limited.
Even though some farmers in the northern-eastern part of the country face serious crop damage by birds, governments cannot carry out proper pest control measures. Likewise, prevention measures for cassava mosaic and brown streak diseases are not carried out appropriately.
Rural financial services are also limited, although farmers often need some capital to expand farming operations.
Limited tractor services provided by national and state government institutions and the private sector restrict the expansion of the area farmed by farmers.
(6) Poorly organised farmers
Farmers lack the capacity to gather their harvest into a large volume to sell, so wholesalers and traders who need large volumes tend to purchase products in bulk in foreign countries.
The number of active farmer organisations, such as cooperatives and Farmer Based Organisations (FBOs), is very limited.
(7) Unfavourable environment for investments
Land acquisition processes are often influenced by local politics and traditional arrangements. High uncertainty of land acquisition becomes a serious factor that affects foreign investors’ decisions to invest in the agricultural sector.
Legal and illegal multiple taxation hinders active investments. Illegal taxes (i.e., bribes) make transaction costs high. In addition, rates of taxes are often changed without notice.
Basic infrastructure (roads, electricity, irrigation, potable water, ports, etc.) is not well developed.
The relatively high costs of inputs and labour and insecurity are also unfavourable factors for investments.

10-4
10.3 Policy framework
After the Comprehensive Peace Agreement (CPA), the Southern Sudan autonomous region was restored and the autonomous Government of Southern Sudan (GOSS) was established. The former GOSS Ministry of Agriculture and Forestry (MAF) developed the Food and Agriculture Policy Framework 2007-2011 (FAPF) in 2006, which was the first policy framework in the sector for Southern Sudan. The National Agriculture and Livestock Extension Policy (NALEP) was also developed. After independence in July 2011, MAF started preparing a new policy framework for the new country as well as eight subsector policies (Table 10-2).
Table 10-1: Summary of Agriculture Sector Policy Framework 2012-2017
Vision Food security for all the people of the Republic of South Sudan, enjoying improved quality of life and environment
Mission To create an enabling environment for the transformation of agriculture from a subsistence system into a modern, socially and economically sustainable system through science-based, market-oriented, competitive and profitable farming while maintaining the integrity of the natural resource base for the benefit of future generations of South Sudanese people.
Goal Increased agricultural productivity to improve food security and contribute to economic growth and enviromental sustainability
Targets by 2017 Cropland will increase from 3.8% (2.7 m ha) to 14.3 % (9.2 m ha) of total land area in the next five years
Per capita cropland increases from 0.32 ha to 0.99 ha in 5 years assuming 2.5% population growth
Average annual increase of more than 20 per cent for roots and tubers, more than 30 per cent for cereals and more than 25 per cent for horticultural crops.
Increase average yield of crops from 0.9 tons per ha to 3 tons per ha Contribute to reduction of rural poverty by 50 per cent from the baseline levels
of 55.4% in 2010; and reduce the number of people living below poverty line by half come 2017.
Key Policy Choices and Objectives
1. Accelerate food and agricultural production while ensuring that the growth is pro-poor, sustainable and contribute to food and nutrition security
Smallholder and Commercial Agriculture
Expansion and Intensification
Mechanization and employment generation
Foreign direct investment (FDI) in agriculture 2. Improve agricultural markets and trade through investing in market
infrastructure and institutions, and developing value chains
Local, regional and international markets
Agribusinesses and value addition
Production, marketing and price risks 3. Develop and enhance human and institutional capacity
Human and institutional capacity of all stakeholders
The role of government versus private sector
Pursue agricultural growth with social development
Guiding Principles
Decentralization and empowerment Pluralistic extension approach driven by communities Promotion of public-private partnership Government as a facilitator to stimulating rural development Cooperatives and farmer groups Promoting value addition and agro-processing Strengthening of rural infrastructure for roads, electricity and water Macro-economic stability Conducive marketing policies Sustainable development management
Subsector Policy Guidelines
ASPF indicates policy guidelines on the following subsectors. Crop Agricultural production support services Agricultural markets, value chain development and finance

10-5
Food security and nutrition Forestry development and management Role of agriculture and forestry in socio-economic change Sustainable agriculture, environment and climate change Social justice Coordination with other sectors
Source: GRSS. 2012. Agriculture Sector Policy Framework 2012-2017. pp. 9-12. Juba: GRSS.
In September 2011, MAF and the Ministry of Cooperative and Rural Development were merged into one ministry, the Ministry of Agriculture, Forestry, Cooperatives and Rural Development (MAFCRD); the new policy framework for the agriculture sector had to incorporate cooperative and rural development aspects. In this context, the Agriculture Sector Policy Framework 2012-2017 (ASPF) was drafted and passed by the National Legislative Assembly (NLA) - South Sudan’s parliament - in December 2012 and is now ready for dissemination. This is a comprehensive policy document for MAFCRD and contains subsector policy guidelines (e.g., crop, agricultural support services, agricultural marketing, food security and nutrition, and forestry). This policy document has stipulated national targets by 2017 regarding crop land expansion, increase of crop production and yield, and poverty reduction. A summary of ASPF is shown in Table 10-1. In addition to the eight key subsectors policies mentioned above, MAFCRD has been formulating four more subsector policies (i.e., rural development, rural finance, agricultural marketing and food security). The draft policies have been prepared and some are in the legislative process. The present status of subsector policies is shown in Table 10-2.
Table 10-2: Subsector policies as of July 2013
Subsector Present Status As of July 2013
1 Plant Protection Approved by the Council of Ministers on 15 March 2013
Presented to National Legislative Assembly
2 Horticulture Approved by the Council of Ministers on 15 March 2013
Presented to National Legislative Assembly
3 Agriculture Mechanisation
Approved by the Council of Ministers on 8th February 2013
Presented to National Legislative Assembly
4 Soil Health and Conservation (Fertiliser Policy)
Approved by the Council of Ministers on 15th March 2013
Presented to National Legislative Assembly
5 Seed Being discussed in MAFCRD
6 Research Being discussed in MAFCRD
7 Training and Capacity Development
Passed by the economic cluster with amendment
Preparing amendment for re-submission to the Council of Ministers
8 Rural Development Approved by the Council of Ministers on 7 June 2013
To be submitted to National Legislative Assembly
9 Rural Finance A stakeholders consultative forum held in June 2013
For submission to the Council of Ministers
10 Agricultural Marketing A stakeholders consultative forum held in June 2013
For submission to the Council of Ministers
11 Food Security A stakeholders consultative forum held in June 2013
To be submitted to the Council of Ministers Source: GRSS, MAFCRD and the FARM project, interviewed by the CAMP Task Team, Juba, June 2013, CAMP Situation Analysis

10-6
10.4 Institutions
10.4.1 Ministry of Agriculture, Forestry, Cooperatives and Rural Development 221
10.4.1.1 Mandate of the national ministry
MAFCRD was established in September 2011 through amalgamation of two ministries. The new mandate of the ministry was set out in the ASPF as follows:222
Develop and implement policies, objectives and strategies for development of agricultural sector in the areas of Food Security, Agriculture, Forestry, Rural Development and Cooperatives in South Sudan.
Promote productivity of agriculture and forestry for economic growth and development of South Sudan
Promote and enhance the formation of cooperative societies and community-based organizations as vehicles of community empowerment and poverty eradication
Coordinate and promote rural transformation and development The functions and duties of the ministry are also stated:
Formulate legislation, policies, standards, and plans for the development of agriculture, forestry, cooperatives and rural development in South Sudan
Prevention of environment degradation through tree planting, soil and water conservation and proper utilization of agricultural land
Promotion of sustainable use of natural resources for agricultural and forestry production including non-timber forest products
Promote the development and adaptation of appropriate technology in the field of agriculture and forestry
Create a national food policy to ensure adequate food availability
Promote and where necessary regulate the efficient production and marketing of agriculture and forest products
Promote community-based forestry conservation, management and utilization to ensure sustainable forestry production
Promote, undertake demand-driven agricultural and forestry research
Establish and supervise an agricultural microfinance and credit banking scheme
Control and regulate the use of agricultural chemicals and phytosanitary regulations and seed quality standards and licensing
Rehabilitating and expanding training institutions and research institutions
Provide technical assistance and training to State governments and other local governments to build their capacity to assume their responsibilities for agriculture and forestry matters as defined in the Constitution and RSS policy
Formulate and implement Cooperative Society legislation and policy
Promote the formation of cooperative societies and community-based organizations as vehicles of community empowerment and poverty eradication
Develop policy on Cooperative Savings and Banking services and facilitate their establishment throughout South Sudan
221
MAFCRD was merged with other ministries (i.e., the Ministry of Animal Resources and Fisheries and the
Tourism Directorate under the Ministry of Wildlife Conservation and Tourism) in August 2013 and becomes the Ministry of Agriculture, Forestry, Tourism, Animal Resources and Fisheries. A formal name the new ministry is not decided yet as of August 2013. 222 GRSS, MAFCRD. 2012. Agriculture Sector Policy Framework (ASPF): 2012-2017. p. 9. and GRSS, MAFCRD.
2013. Strategic Plan 2013-18. p. 2.

10-7
To provide training to upgrade the management and performance of community based programmes
Support the Amadi Institute of Community Development
Develop, in conjunction with other relevant ministries, state and local governments, policies, and strategies for the development of rural areas
Provide technical assistance to State governments to build their capacity to support cooperative societies and undertake rural development planning and manage the implementation of rural development plans
Coordinate Planning and implementation of programs with the State Ministries of Agriculture, Forestry, Cooperatives and Rural Development
10.4.1.2 Organisational structure
MAFCRD consists of seven directorates (Figure 10-1) including two technical directorates, which are related to crop production (i.e., Agriculture and Extension Services and Research and Training). Table 10-3 shows the departments in these two directorates.
Figure 10-1: Organogram of MAFCRD
Source: MAFCRD. 2012. Agriculture Sector Policy Framework (ASPF): 2012-2017. p. 10
Table 10-3: Crop related directorates and departments
Directorate Department
Agriculture and Extension Services
Crop production, plant protection, horticulture, postharvest and home economics, mechanisation, and extension services
Research and Training
Research and training
Source: Staff of the national government, interviewed by CAMP crops subsector team, Juba, July 2013, CAMP Situation Analysis.
Actual operations of the ministry are being executed under the above mentioned organogram, but this is still not approved by the Ministry of Labour, Public Service and Human Resources. Thus, budget requests in 2012/13 were made based on the previous organogram, which includes two crop related technical directorates, namely Agriculture and Production, and Research, Training and Extension.
10.4.1.3 Budget
Table 10-4 shows the budget of MAFCRD and crop production related directorates. Due to the austerity measures for the 2012/13 budget, the national budget was drastically reduced. MAFCRD, however, was allocated a more budget compared to the 2011/12 expenditures since there is a strong desire in the government to develop the agriculture sector to improve
Minister
Deputy MinisterAdvisers
Undersecretaries
ForestryFinance
and Administration
RuralDevelopment
Agriculture & Extension Services
Research and Training
Planning and Agricultural Economics
Cooperative

10-8
food security immediately. The former Directorate of Agriculture and Production secured more than ten times the budget compared to 2011/2012 expenditures. A main increment is capital expenditure, which was SSP 150,000 in the 2011/12 expenditures but is SSP 26,911,818 in the 2012/13 approved budget. Although approximately SSP 26 million for capital expenditure in 2012/13 was approved, actual capital expenditures related to agricultural development were small due to austerity measures. Allowances and necessary operating costs (e.g., fuel for cars and airtime for communications) for staff were cut and sometimes payment of salaries was delayed for two months. This situation negatively affects the morale and performance of government staff.
Table 10-4: Budget of MAFCRD and crop related directorates (SSP)
Ministry/Directorate
Budget
2011/12 Approved 2011/12
Expenditures 2012/13 Approved
MAFCRD 140,295,003 95,235,857 104,665,749
Agriculture and Production - 2,971,064 31,899,044
Wage and Salaries - 2,076,290 2,750,759 Use of Goods and Services - 744,774 2,236,467 Capital Expenditure - 150,000 26,911,818
Research, Training & Extension - 4,202,608 5,636,518
Wage and Salaries - 2,169,155 4,285,975 Use of Goods and Services - 2,033,453 1,350,543 Capital Expenditure - 0 0 Source: Republic of South Sudan Approved Budget 2012/13. pp. 222-224.
10.4.2 State government
10.4.2.1 Vision, Mission, Values and Mandate of the state ministry
Each state ministry created its own vision, mission values and mandate in line with the national government’s vision. Table 10-5 shows the case of the Ministry of Agriculture and Forestry (MAF), Jonglei State.
Table 10-5: Vision, Mission, Values and Mandate of the Ministry of
Agriculture and Forestry, Jonglei State
Vision A prosperous, growing, innovative, and demand driven rural economy that generates more jobs by adopting agro-forestry technologies appropriate to Jonglei that advance commercial producer groups, small and large scale farmers and forest industries so to yield food and income security with environmentally sustainable growth.
Mission To facilitate and promote the transformation of agriculture and forestry in Jonglei from subsistence farming with few productive trees so to advance into a science based, agro-forest sector with a sustainable market-driven system of rural economic growth
Values Based upon the national and state government’s values, where the ministry values promoting excellence in extension and food support work, accountability, transparency, integrity, inclusivity and mainstreaming gender and environmental concerns
Mandate To achieve 100% food security by supporting crop and forest producers to produce more than enough to cover food security needs, so to create market opportunities for trade, investment, business growth, and employment.
Source: Agriculture and Forestry Strategic Development Plan for 2012 to 2017
10.4.2.2 Organisational structure
MAFCRD stated in ASPF that the state ministries would basically consist of five departments (i.e., agriculture, forestry, cooperatives and rural development, planning, and administration

10-9
and finance). 223 State governments, however, are able to establish their own unique organisational structures. Thus, organisational structures of agriculture related ministries vary according to the needs and arrangements of the states. Figure 10-2 describes the organogram of the Ministry of Agriculture and Forestry, Lakes State. It has three technical directorates including mechanisation, instead of cooperatives and rural development, which is recommended by the national government. 224 Cooperative and rural development activities are under the jurisdiction of the Directorate of Agriculture.
Figure 10-2: Organogram of the Ministry of Agriculture and Forestry, Lakes State
Source: Staff of the Lake state government, interviewed by CAMP crops subsector team, Rumbek Centre, May 2013, CAMP Situation Analysis.
10.4.2.3 Budget and operation
States have their own ability to collect taxes but the most of their budget comes from the national government. As an example, Table 10-6 indicates the estimated revenue and expenditures 2013/14 of Western Bahr el Ghazal State. Budget transfers from the national government (i.e., block transfer, conditional transfer, counties development grant and counties block transfer) reach 70% which is almost equivalent to expenditures on personnel salaries. In 2012/2013 expenditures on salaries were 82% of the total; operating costs were only 12%.225 The state government sets a budget ceiling for each state ministry based on the revenues it expects to receive as shown in Table 10-6. The Ministry of Agriculture and Forestry was allocated SSP 4,343,407 as the 2013/14 budget and salaries are about 69% of the total budget (Table 10-7).
Table 10-6: Estimated revenue and expenditures 2013/14 of Western Bahr el Ghazal State (SSP)
Source of Revenue Expenditures
SSP % SSP %
Block transfer 40,564,775 20 Personnel salary 144,021,638 72
Conditional transfer 92,714,191 46 Operating costs 44,850,556 22
Counties development grant 5,862,439 3 Capital costs 12,606,195 6
Counties block transfer 1,951,734 1
State agricultural sale tax 11,104,214 6
State local revenue 49,281,036 24
223
GRSS, Agriculture Sector Policy Framework 2012-2017. p. 9. 224
Under the minister, the highest public servant is usually named Director General. 225
Documents collected from the Ministry of Agriculture and Forestry, Western Bahr el Ghazal State.
Minister
Director General
Directorate of Agriculture
Directorate of Forestry
Directorate of Mechanisation
Directorate of Planning &
Budget
Directorate of Finance and
Administration

10-10
Total 201,478,389 100 Total 201,478,389 100
Source: Documents collected from Ministry of Agriculture and Forestry in Western Bahr el Ghazal
During the situation analysis, interviews with state and county officials were conducted and almost all of them mentioned that there were serious constraints on the operating budget for activities on the ground. They have only a little or no budget for fuel, so many of the extension workers use their own money for purchasing fuel to visit fields, or do not conduct any activities. Some officers at county level mentioned that they did not obtain any operating budget and this situation had started even before the austerity measures. They only receive their salaries. Thus, service delivery to farmer beneficiaries on the ground by the government is limited (see Section 10.8 Services). Some officers also mentioned weak political will to support the agricultural sector.
Table 10-7: Estimated budget 2013/14 of Ministry of Agriculture and Forestry,
Western Bahr el Ghazal State (SSP)
Salaries Operating Capital Total
2,989,056 (69%)
944,414 (22%)
409,937 (9%)
4,343,407 (100%)
Source: Documents collected from the Ministry of Agriculture and Forestry, Western Bahr el Ghazal State.
Many state government staff pointed out the problems with reporting to the national government. A state ministry prepares monthly and annual reports and submits them to its minister. After receiving these reports, the minister presents them to the state council of ministers and then the governor’s office compiles all the reports from the state ministries to report to the President by the governor. In this regular reporting system, there is no direct reporting channel between the national and state ministries. The national ministry receives only minimal information on agriculture activities at the state level and sends very limited feedback to the state ministries.
10.4.3 Land Commission
The Interim Constitution of Southern Sudan states that the Southern Sudan Land Commission (SSLC) is to be established to deal with land issues in Southern Sudan. As a result, the SSLC was founded in 2006. Its functions are to (a) develop land laws and policies, (b) conduct research on land matters, (c) arbitrate on land disputes and (d) advise various levels of government on land issues.226 The SSLC attempted to prepare the Land Policy to create the principle of land administration, but it was not completed due to time constraints. Instead, as provisional rules, the Land Act was drafted and submitted to the NLA who passed it in 2009. Subsequently, in 2013, the draft Land Policy was approved by the Council of Ministers. Currently, the draft policy is waiting for the approval of the NLA. After approval, the SSLC plans to revise the Land Act to make it consistent with the policy for effective and efficient land administration. As of 2013, there are five state level Land Commissions in Central Equatoria, Western Equatoria, Jonglei, Unity, and Lakes States. The state Land Commissions were established to deal with land administration. The SSLC is expected to coordinate and give advice to the state Land Commissions; however, there is an institutional capacity issue. The annual budget of the SSLC is approximately SSP 1.8 million. The number of staff is 10, including the chairperson. Most staff perform management and administrative work. There are few
226
GOSS. 2013. South Sudan Land Commission. http://www.goss-online.org/magnoliaPublic/en/Independant-
Commissions-and-Chambers/Land-Commision.html (accessed on 13 July ,2013)

10-11
technocrats who give technical advice. The position that deals with conflict resolution is vacant at present and there is no section which deals with legal issues. In addition, the SSLC does not have any legal power to sort out land issues. After the Policy approval, the SSLC is required to play an important role in the Policy implementation. However, the SSLC would face budget and human resource issues.
10.4.4 Development Partners
Development partners have played vital roles to improve the situation of agriculture in South Sudan. Before and after the CPA, numbers of relief projects, including food distribution, were conducted, but from 2012 to early 2013, many food security projects which focused on food distribution were completed. Currently, the nature of many assistance projects are geared more towards development of sustainable livelihoods and capacity building of farmers and government officers.
10.4.4.1 Donors
There are various donors who support the crop subsector. Some of the on-going projects
funded by donors are shown in Table 10-8.
Table 10-8: Donor support to crop subsector
Name Major
projects/institutions funded
Objective or major activities Geographical
coverage/Target
CIDA Food Security Through Community-Based Livelihood Development and Water Harvesting
Help farmers and herders secure their access to water resources and increase food production and incomes
Jonglei and Upper Nile States
Building Community Resilience
Increase the resilience of Sudan’s poorest communities, and enhance livelihood and improve capacity of community volunteers
Eastern Equatoria State (EE)
Comprehensive Agricultural Development Master Plan (CAMP)
Dispatch an expert in the area of institutional capacity development
Entire nation
DFID African Enterprise Challenge Fund
Identify, select, support and monitor projects to ensure improvements in market system
Demonstrate innovative business models
Support commercially viable projects
Support projects that have high development impacts
Entire nation
EU Introduction and Dissemination of Innovative Food Security Practices
Improve food security of vulnerable populations through increasing farmers’ income, knowledge and farming techniques
Strengthen capacity of government officials
Distribute tools to farmers, and link producers and wholesalers
Yei and Lainya Counties of Central Equatoria State (CE)
GIZ Livelihood improvement
Distribution of farming tools and seeds
3 counties, Western Equatoria State (WE)
Improvement of market access
Develop markets for agricultural products through promoting value chain of agricultural products
Greenbelt
IFAD Southern Sudan Increase production and productivity to 2 payams in

10-12
Name Major
projects/institutions funded
Objective or major activities Geographical
coverage/Target
Livelihoods Development Project
improve food security and increase farmers’ income
Jonglei State
Irish govern-ment
Food Security and Livelihood project
Improve food security through providing food, seeds, and tools to farmers as well as providing training
Upper Nile State, northern Jonglei State
JICA CAMP Dispatch experts for formulation of CAMP Entire nation
National Effort for Agricultural Transformation (NEAT)
Develop an implementation plan for NEAT
Entire nation
Rice project Dispatch a rice expert to CTC Yei to improve training curriculum and to Yei Agricultural Research Centre (YARC) to implement rice research project
CE, Yei
Dutch govern-ment
CTC Yei, Marial Lou Livestock Training Centre (MLLTC), Amadi Rural Development Institute (Amadi RDI)
Develop curriculum for 9 month training course
CTC Yei, MLLTC, Amadi RDI
CTC Yei Improve teaching quality CTC Yei
USAID Food, Agribusiness, and Rural Markets (FARM) Project
Ensure a sustainable domestic food supply and reduce needs for imports, improve food security and increase income of rural farmers through improvement of farmers’ agricultural production, productivity, and trade through activities as follows; provision of tools, seeds, knowledge on farming skills, marketing opportunities, and behaviour change, and development of a platform for business
CE, WE, EE
WFP Food for Asset (FFA)
Provide low income and vulnerable farmers food, tools, and financial supports to enhance their capacity for farming
All ten states, but focusing on 5 states
a
Purchase for Progress (P4P)
Increase capacity of smallholders and low income farmers to enable them to produce and sell surplus crops both to WFP and to markets.
21 counties in CE and WE
a These five states are Northern Bahr El Ghazal, Western Bahr El Ghazal, Warrap, Upper Nile, and Lakes.
Source: CAMP Task Team. December 2012. Compilation of Development Assistance Project Profiles in South Sudan’s Agricultural Sector. December 2012. Unpublished. Donors, interviewed by CAMP crop subsector team, Juba, Yei, Malakal, 22 April to June. 2013. CAMP Situation Analysis, The Food, Agribusiness and Rural Markets (FARM) Project. Annual Work Plan October 2012 – September 2013. Maryland. 25 May 2013. CAMP Situation Analysis. World Vision, interviewed by CAMP crop subsector team, Malakal, 1 June 2013. CAMP Situation Analysis.
10.4.4.2 Non-governmental organizations (NGOs)
There are international NGOs and domestic NGOs which assist farmers across the nation.
NGOs have different specialities and geographic coverage. NGOs are normally funded by
donors and are project implementing bodies. Since it is difficult to identify and describe all
the NGOs’ activities in the country, some of the names, activities and target states of major
NGOs working in areas related to crop production are introduced in Table 10-9.

10-13
Table 10-9: Major NGOs assisting in the areas related to crop production
Name Major Objectives/Main Activities Target Areas/States
ACROSS Provide government staff and farmer groups with training on ox ploughs as well as providing seedlings of fruit trees
Rumbek East and Centre Counties in Lakes
Agency for Technical Cooperation and Development (ACTED)
Provide technical support related to storing quality seeds, compost making, and pest management to refugees
Western Bahr el Ghazal (WBG)
Bangladesh Rural Advancement Committee (BRAC)
Provide training to farmers about better farming skills and supply bulls and ox ploughs as well as providing food and farming tools
Yambio and Maridi Counties in WE
Church and Development
Promote community farming through identifying groups to improve ploughing and fencing skills, and distribute seeds and tools
Bor County in Jonglei
Norwegian People’s Aid
Provide fund for part of running cost and staff salary of Yei Agricultural Training Centre (YATC)
Trainees are from all over the country
Rural Action Against Hunger (RAAH)
Support farmers through providing agricultural tools and seeds with technical support to them, and provide food at subsidized prices
Entire state of WE
United Methodist Committee on Relief (UMCOR)
Promote fish farming, bee keeping, and poultry, improve cassava and vegetable production, and enhance capacity of farmers, community based extension workers, and government officers
Yei and Lainya Counties, CE
World Vision Distribute food, seeds, and tools including fishing gears, Provide seedlings of fruit trees, train farmers how to use tools properly
Upper Nile State and northern Jonglei State
Source: NGOs. April to June 2013. Interviewed by CAMP crop subsector team, Wau, Yei, Yambio, Maridi, Bor, Malakal, Rumbek and Juba. CAMP Situation Analysis.
Several NGOs such as ACROSS, ACTED, BRAC, World Vision, and Church and Development have provided technical assistance to farmers and other vulnerable groups to help them become more self-sufficient while the majority of NGOs are still focusing on food distribution. Creation of a market and/or linking traders and farmers are new perspectives for an agricultural project. To implement more such projects, a medium- to long-term perspective is essential. One challenge is that NGOs tend to implement their projects in limited geographical areas in limited period of times. Coordination of NGOs’ activities, facilitated by the government and DPs, is important to provide effective and efficient services to needy people.
10.4.5 Cooperatives
The history of cooperatives of South Sudan extends back to 1953 when a Department of Cooperatives was established in Juba to promote and develop cooperative societies.227 Cooperatives were established in several areas such as Juba, Wau, Malakal and Renk. Further development of cooperatives was hampered by the first civil war (1955-1972) and the second civil war (1983-2005). Cooperative development was resumed after the CPA with efforts by the Ministry of Cooperatives and Rural Development (merged with the Ministry of Agriculture and Forestry in 2011). As of 2013, 566 cooperatives are registered by national and state ministries (Table 10-10); 38% are agricultural cooperatives. There are also fisheries and bee keeping
227
GOSS. 2012. National Strategy for Cooperative Development 2012-2015. Juba.
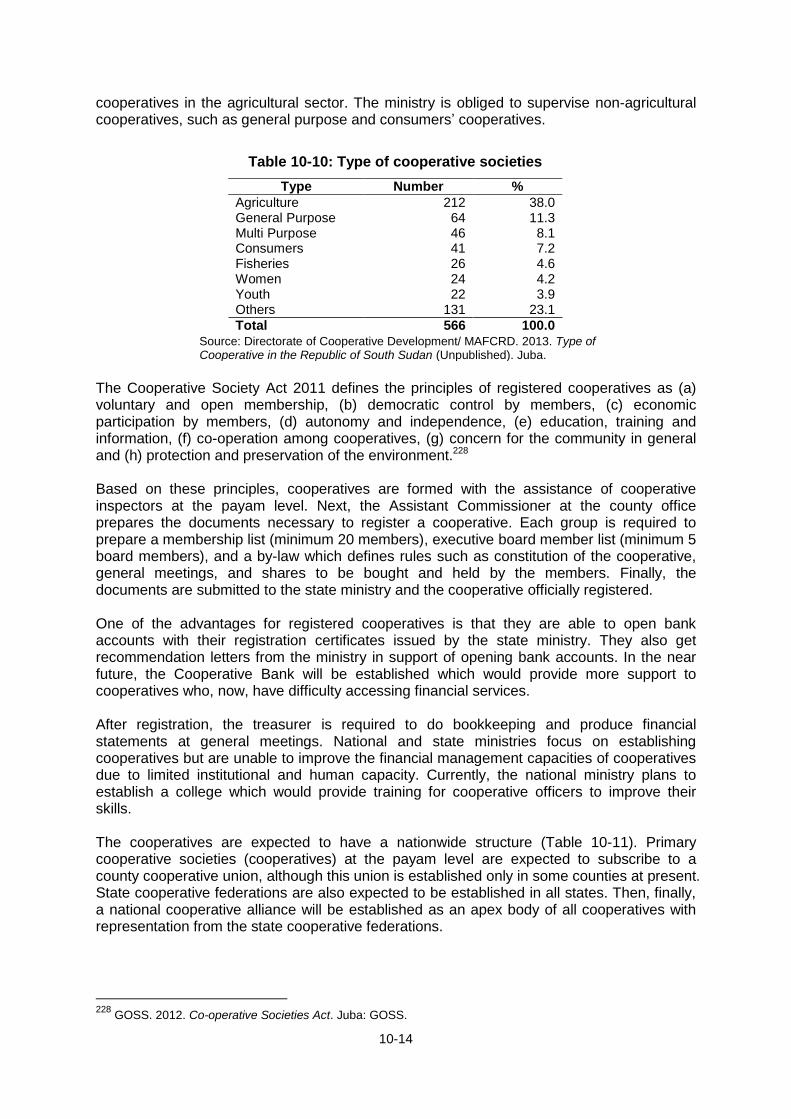
10-14
cooperatives in the agricultural sector. The ministry is obliged to supervise non-agricultural cooperatives, such as general purpose and consumers’ cooperatives.
Table 10-10: Type of cooperative societies
Type Number %
Agriculture 212 38.0 General Purpose 64 11.3 Multi Purpose 46 8.1 Consumers 41 7.2 Fisheries 26 4.6 Women 24 4.2 Youth 22 3.9 Others 131 23.1
Total 566 100.0
Source: Directorate of Cooperative Development/ MAFCRD. 2013. Type of Cooperative in the Republic of South Sudan (Unpublished). Juba.
The Cooperative Society Act 2011 defines the principles of registered cooperatives as (a) voluntary and open membership, (b) democratic control by members, (c) economic participation by members, (d) autonomy and independence, (e) education, training and information, (f) co-operation among cooperatives, (g) concern for the community in general and (h) protection and preservation of the environment.228 Based on these principles, cooperatives are formed with the assistance of cooperative inspectors at the payam level. Next, the Assistant Commissioner at the county office prepares the documents necessary to register a cooperative. Each group is required to prepare a membership list (minimum 20 members), executive board member list (minimum 5 board members), and a by-law which defines rules such as constitution of the cooperative, general meetings, and shares to be bought and held by the members. Finally, the documents are submitted to the state ministry and the cooperative officially registered. One of the advantages for registered cooperatives is that they are able to open bank accounts with their registration certificates issued by the state ministry. They also get recommendation letters from the ministry in support of opening bank accounts. In the near future, the Cooperative Bank will be established which would provide more support to cooperatives who, now, have difficulty accessing financial services. After registration, the treasurer is required to do bookkeeping and produce financial statements at general meetings. National and state ministries focus on establishing cooperatives but are unable to improve the financial management capacities of cooperatives due to limited institutional and human capacity. Currently, the national ministry plans to establish a college which would provide training for cooperative officers to improve their skills. The cooperatives are expected to have a nationwide structure (Table 10-11). Primary cooperative societies (cooperatives) at the payam level are expected to subscribe to a county cooperative union, although this union is established only in some counties at present. State cooperative federations are also expected to be established in all states. Then, finally, a national cooperative alliance will be established as an apex body of all cooperatives with representation from the state cooperative federations.
228
GOSS. 2012. Co-operative Societies Act. Juba: GOSS.

10-15
Table 10-11: Nationwide cooperative structure (proposed)
Level Body Situation
National National cooperative alliance To be established State State cooperative federation To be established
County County cooperative union Established in some counties Payam Primary cooperative society
(so-called cooperative) 566 registerd cooeratives
(as of 2013)
Source: Directorate of Cooperative Development/MAFCRD, intervened by CAMP Crop subsector team, July 2013, CAMP Situation Analysis
10.4.6 Private sector
In South Sudan, activities by the private sector in agriculture are very limited, especially, agro dealers. There are several agro dealers in Juba and some in Central Equatoria (CE), Western Equatoria (WE) and Jonglei States. In other areas, very few agro dealers were found. Even though the role of agro dealers is important for all states, agro dealers are concentrated in southern parts of the country and total numbers of agro dealers across South Sudan are limited. Table 10-12 shows a list of agro dealers, who are providing agricultural inputs in major towns.229 The range of years in business is from one to thirteen years so the number is increasing. Local farmers are the main customers for all agro dealers, but sometimes NGOs purchase seeds from them.230 In other major towns such as Malakal, Wau and Rumbek, there are no agro dealers even though there are hardware stores which also sell a few kinds of cereal and vegetable seeds. The most popular seed products for cereal are maize, sorghum and rice; for vegetables onion, cabbage, tomato, okra and eggplant. Ten out of eleven agro dealers sell vegetable seeds but only six sell pesticides or herbicides. This shows that the demand for seeds of certain vegetables is high, while the demand for pesticides and herbicides is lower. Moreover, only two out of eleven agro dealers sell fertilisers implying that demand for fertiliser is lower than for vegetable seeds. All agro dealers mentioned that they understood the effectiveness of their products through feedback from their customers and thought it was important to know the opinions of their customers.
Table 10-12: Agro dealers in South Sudan
Names Locations Main products sold Origins of
major products
Agro Life Juba, CE Agricultural tools (greenhouse kit, gardening tools), vegetable seeds
Kenya
Laisi General Stores
Juba, CE Cereal seeds, vegetable seeds and tools
Uganda
Seed Corn Juba, CE (Branch Nimule)
Cereal seeds, vegetable seeds, fertiliser, pesticides, herbicides and tools
Uganda
BA Juba International
Juba, CE
Fertilizer, pesticides, herbicides and tools
Tanzania
Century Seeds Yei, CE Cereal seeds, vegetable seeds, fertiliser, pesticides, herbicides and tools
Uganda, China through Kenya
Greenbelt Seeds Yei, CE Cereal seeds, vegetable seeds and tools
Uganda and Kenya
229
Agro dealers in Juba shown in Table 10-12 are the major ones. Many other agro dealers might operate in
Juba. Further surveys in Juba will be conducted. 230
Century Seeds mentioned that 60% of their sales in 2011 were generated by NGOs, but currently, 70% of
their sales are made to local farmers.

10-16
Kaboji’s Chain and Son’s Memorial Enterprise
Kajokeji, CE Cereal seeds, vegetable seeds, fertiliser, pesticides, herbicides and tools
Uganda
Zawa Trading Company
Yambio, WE
Cereal seeds, vegetable seeds, fertiliser and tools
Uganda
Eastern Equatoria Store
Torit, EE Vegetable seeds, maize seeds, pesticides, herbicides and tools
Kenya
Fight hunger seeds & Agro chemist
Torit, EE Vegetable seeds, maize seeds, fertiliser and tools
Kenya and Uganda
Peace Pharmacy Bor, Jonglei State Vegetable seeds Kenya
Libo Centre Aweil, Northern Bahr El Ghazal
Vegetable seeds, pesticides, herbicides, and tools
Kenya
Source: Agro dealers, interviewed by CAMP crops subsector team, April to June, CAMP Situation Analysis.
A few more enterprising agro dealers, such as Century Seeds and Greenbelt Seeds in Yei, either hire their own extension workers or hold radio extension programmes. These extension workers follow up with their customers to provide appropriate knowledge about farming with their products. They also visit communities to promote seeds of improved varieties and/or hybrid varieties for both cereals and vegetables. These efforts, including radio programmes, have improved their business and, also, agricultural production in the targeted areas. The common challenges are high cost of transportation and taxes, farmers’ limited knowledge about agricultural inputs, lack of storage facilities, limited packing technology, lack of capital and high interest rate for loans, and fluctuations in exchange rates between South Sudanese pounds (SSP) and foreign currencies. These challenges limit their business opportunities. Some agro dealers mentioned that their profits were limited due to the high costs of operation. At the same time, high retail prices of seeds minimize the numbers of farmers who can purchase seeds.231 If the number of agro dealers continues to be limited across South Sudan, opportunities for farmers to improve agricultural productivity will remain limited.
10.4.7 Traditional institutions
The boma was created by the SPLM as the lowest level of government in order to enhance the administrative efficiency of the then Southern Sudan. Traditionally, a village was an administrative unit formed by a clan organised by blood-related members. A boma consists of several villages. In a village, traditional leaders include the Headman (clan leader), elders and spiritual leaders (e.g. rain maker), plus clan members who together are in charge of communal work such as cultivation, hunting and defence. They also deal with disputes which arise in the village. In some areas, a spiritual leader looks after two villages. The chief system (boma level and up) has been incorporated into the public administration system; however, traditional institutions still play an important role at village and boma levels due to insufficient public institutional capacities.
10.5 Food crop production
10.5.1 Livelihood Zones
South Sudan’s territory is categorised into seven livelihood zones mainly based on rainfall, water availability and livelihood patterns in the areas (Figure 10-3). In general, rainfall in South Sudan gradually increases southward to the Congolese border from approximately 300 mm to 1,700 mm (Figure 10-4). Areas adjacent to the borders with Sudan and Kenya
231
For example, the retail price of maize seeds is SSP 7-16 per kilogram.

10-17
have less precipitation and are frequently affected by drought. The White Nile River flows from south to north in the eastern part of the country and is accompanied by vast marshlands.
Figure 10-3: Livelihood zones in South Sudan
Source: Data from the NBS National Baseline Household Survey 2009. Prepared by NBS / CAMP Task Team.

10-18
Figure 10-4: Annual precipitation of South Sudan
Source: Data from WorldClim. Prepared by NBS / CAMP Task Team.
Table 10-13: Livelihood zones and characteristics
Livelihood Zones
States Characteristics
Eastern Flood Plains
Upper Nile Jonglei Unity Eastern
Equatoria
Main crops grown are sorghum and groundnuts. Sesame, bulrush millet and cowpeas are also cultivated.
The Renk scheme is a mechanised irrigated farming scheme whose command areas (command area = area benefitting from
irrigation) are 654,000 ha in total.232
Fourteen irrigation pumps
for the national schemes are not operational as of June 2013. Livestock also plays an important role in sustaining livelihoods.
If there is food shortage due to seasonal food insecurity, farmers can sell or barter livestock to obtain staple foods.
Conflicts between farmers and pastoralists and among pastoralists seriously affect insecurity.
Frequent flooding occurs from August to November and this affects crop production negatively.
Fish becomes an important protein source in the flooding season.
Greenbelt Eastern Equatoria
Central Equatoria
Western Equatoria
Double cropping is possible and many farmers could produce surplus to sell to markets.
Maize, sorghum, cassava, upland rice, beans and varieties of vegetables and fruit are cultivated. Coffee and tea are also high potential products.
Postharvest losses of the first season are remarkably large due
232
GRSS. MWRI. 2010. Assessment, Design, Installation of Irrigation Pumps and Rehabilitation of Water Control
Infrastructures, Inception Phase, Preliminary Assessment Works on Renk Project, Final Report. p.8. Juba: MWRI

10-19
Livelihood Zones
States Characteristics
Western Bahr el Ghazal
to high moisture and inadequate storage facilities.
Hills and Mountains
Jonglei Eastern
Equatoria Central
Equatoria
Maize, sorghum, cassava, rice, wheat, beans and various vegetables and fruit are cultivated.
In higher altitude areas, production of vegetables and crops grown in cooler temperatures has high potential because these areas have the only temperate climate in the country. These areas also have high potential for perennial cash crop production such as coffee and tea.
Peri-urban vegetable production has a big potential, especially in suburbs of Juba, due to high fresh vegetable demand.
Livestock is also important for farmers to obtain cash income.
Ironstone Plateau
Eastern Equatoria
Central Equatoria
Western Equatoria
Lakes Warrap Northern Bahr el
Ghazal Western Bahr el
Ghazal
Main crops grown are sorghum and groundnuts. Sesame, bulrush millet, finger millet, beans and cowpeas are also important crops in the areas.
Livestock also plays an important role for livelihood, especially for obtaining cash income if there is food shortage due to seasonal food insecurity..
Conflicts between farmers and pastoralists and among pastoralists greatly affect insecurity and productivity.
Erratic rain seriously affects agricultural production.
Nile-Sobat Rivers
Jonglei Lakes Unity Upper Nile
Farmers grow crops and vegetables beside the wetlands. Wild animals in wetlands, such as elephants, hippopotamuses
and baboons, damage crops frequently. This zone is suitable for fisheries.
Pastoral Eastern Equatoria
Jonglei
The zone is purely for pastoralism since vegetation cover is grass and shrubs. Insecurity issues are serious since tribal and inter-communal conflicts frequently occur in the areas.
Western Flood Plains
Unity Lakes Warrap Northern Bahr el
Ghazal
Situation is quite similar to the Eastern Flood Plains zone. Main crops grown are sorghum and groundnuts. Sesame,
bulrush millet and cowpeas are also cultivated. Lowland (or paddy rice) grows in the Aweil Irrigation Scheme.
Livestock also plays an important role for livelihood. If there is food shortage due to seasonal food insecurity, farmers can sell or barter livestock to obtain staple foods.
Conflicts between farmers and pastoralists and among pastoralists greatly affect insecurity.
Frequent flooding occurs from August to November and this affects crop production negatively.
Fish becomes an important protein source in flooding season. Source: State and county officials, and farmers, interviewed by CAMP crops subsector team, April to June 2013, CAMP Situation Analysis. The highest potential livelihood zone is the Greenbelt situated in the Southern part of the country. The area has a bi-modal rainfall pattern with a rainy season of approximately 8 to 9 months, allowing double cropping. Various kinds of crops (e.g. maize, cassava, upland rice and beans) and vegetables can grow in this zone. The Hills and Mountains zone is also a high potential area for crop and vegetable production. Mountainous areas in this zone are suitable for crops needing cooler weather such as wheat, white or Irish potato (solanum tuberosum), cabbage, tea and coffee. The Nile-Sobat zone holds an enormous marsh land, called the “Sudd”, which is conserved under the Ramsar Convention on Wetlands. This area has a great potential for fisheries. East and west of the Nile-Sobat zone are the Eastern and Western Flood Plains zones. These areas are mainly flat fields and are affected by frequent flooding from August to November. The Ironstone Plateau zone is situated north of the

10-20
Greenbelt zone and is suitable for crops with drought resistance such as sorghum and groundnuts. Erratic rainfall severely affects crop production in this area. The Pastoral zone is suitable for pastures since the vegetation cover is grass and shrubs, due to less precipitation. The detailed characteristics of the livelihood zones are described in Table 10-13.
10.5.2 Trend of food crop production
Figure 10-5 shows the trend of cereal production and deficit in the recent five years. Net cereal production, (the amount available for consumption) was calculated as 80% of gross cereal production since estimates of postharvest losses and seeds for the next season account for 20% of gross production. Cereal demand per capita is 109 kg, which is estimated from the data of the National Baseline Household Survey 2009. Based on these estimates, South Sudan achieved cereal self-sufficiency in 2008. However, the country has not achieved that again. Production in 2009 and 2011 was relatively low mainly due to late and sporadic rainfalls and a longer dry spell respectively. Production in 2010 and 2012 was slightly better due to fair rainfall but the country was not able to produce enough cereal for domestic consumption. The total cereal area harvested has gradually increased since 2008 from 853,000 ha in 2008 to 1,085,000 ha in 2012 (Figure 10-6). The area harvested per capita, however, has been at the same level throughout this period since the population growth rate was almost the same as the expansion rate of cereal area harvested (Table 10-14). Cereal area harvested per capita has been about 0.1 ha. The net cereal yield has remained at a low level since 2009, ranging from 0.8 t/ha to less than 1.0 t/ha (Figure 10-6). In order to increase cereal production to achieve food self-sufficiency, both productivity per hectare (intensification) and farm expansion (extensification) need to be addressed.
Figure 10-5: Cereal net production and deficit
Source: FAO/WFP. 2013. Crop and Food Security Assessment Mission (CFSAM) to South Sudan. p. 25. Rome: FAO/WFP
Figure 10-6: Cereal area harvested, net yield and net production
Source: FAO/WFP. 2013. CFSAM to South Sudan. p. 25.Rome:FAO/WFP
0
200
400
600
800
1000
1200
2008 2009 2010 2011 2012
1086
541695
563761
0
225
291 474
371
'000 Mt
Net Production Deficit

10-21
Table 10-14: Cereal area harvested, population and cereal area harvested by capita in South Sudan
2008 2009 2010 2011 2012
Cereal area harvested (‘000 ha) a 853 851 921 860 1,085
Population estimated (‘000) b 8,473 8,941 9,415 9,897 10,386
Cereal area harvested per capita (ha) c 0.101 0.095 0.098 0.087 0.104
Cereal area harvested per capita (feddan) c 0.240 0.227 0.233 0.207 0.249
Sources:
a FAO Stat http://faostat.fao.org/ (accessed on 6 July 2013)
b NBS Statistical Year Book 2011
c
Calculated by the CAMP Task Team, 1 feddan (70m x 60m =4,200m2) = 0.42 ha
Figure 10-7: Trend of area harvested for cereal
Source: FAO/WFP. 2013. CFSAM to South Sudan. p. 25. Rome: FAO/WFP
Figure 10-7 describes the trend of cereal area harvested from 2008 to 2012. The area harvested in the three states of the Greater Upper Nile Region has not changed much. Upper Nile and Unity States have maintained almost the same area harvested for five years. In the Greater Equatoria Region, the area harvested in each state has steadily expanded. In the Greenbelt and Hills and Mountains zones, this tendency was confirmed through farmer interviews during the CAMP Situation Analysis. Some progressive farmers are rapidly expanding their area farmed. Subsistence farmers would cultivate larger areas if they had access to markets to sell their produce. In the Greater Bahr el Ghazal Region, the area farmed for cereal production has slightly increased except for Warrap State which had a large increase in 2012. Table 10-15 shows the yields of main staple crops (i.e., cereal, sorghum and maize) in South Sudan and its neighbouring countries. Since disaggregated cereal yield data for South Sudan are not available, cereal aggregated data are utilised for South Sudan. 68% and 44% of agricultural households grow sorghum and maize respectively in South Sudan,233 thus, it can be assumed that cereal yield is mainly composed of sorghum and maize. For this reason, yields of sorghum and maize in neighbouring countries (i.e., Sudan, Kenya, Uganda, Ethiopia and Tanzania) are compared to cereal yield in South Sudan with the aim of clarifying levels of productivity. Aggregated cereal yield in South Sudan is relatively low compared to sorghum yields in Uganda and Ethiopia, but is similar to yields in Kenya and Tanzania. Sorghum yield in Sudan is extremely low compared to other countries although Sudan produces the largest volume of sorghum among these countries.234 Maize yields in Uganda and Ethiopia are 2.34
233 Definition of agricultural households is households where one or more members own or use agricultural,
forest or pasture land. GRSS. NBS. 2012. National Baseline Household Survey 2009. p. 54. Juba: GRSS. 234
In 2009, sorghum production in Sudan, Kenya, Uganda, Ethiopia and Tanzania was 4,192; 99; 374; 2,804;
and 709 thousand tons. Data from FAO Stat. (http://faostat.fao.org/) (accessed on 6 July 2013)
0
200
2008 2009 2010 2011 2012
'000 ha Greater Equatoria
C Equatoria
E Equatoria
W Equatoria0
200
2008 2009 2010 2011 2012
'000 ha Greater Bahr el
Ghazal
N Bahr el Ghazal
W Bahr el Ghazal
Lakes
Warrap

10-22
and 2.49 t/ha in 2011 respectively; yields in Kenya and Tanzania have not reached 2 t/ha since 2008. Even though maize yields in Kenya and Tanzania are relatively low, they are much higher than the aggregated cereal yield of South Sudan.
Table 10-15: Yields (t/ha) of selected cereals
Country Crop 2008 2009 2010 2011
South Sudana Cereal 1.56 0.79 0.94 0.81
Sudan (former)b Sorghum 0.58 0.63 0.47 -
Kenyab Maize 1.39 1.29 1.73 1.58
Sorghum 0.52 0.57 0.73 0.63
Ugandab Maize 1.47 2.5 2.3 2.34
Sorghum 1.49 1.1 1.1 1.2
Ethiopiab Maize 2.14 2.22 2.12 2.49
Sorghum 1.51 1.74 1.84 1.84
Tanzaniab Maize 1.37 1.12 1.55 1.32
Sorghum 0.92 0.81 1.29 0.99 Source:
a Gross yield calculated from FAO, CFSAM 2009 – 2012 Data
b Data from FAO Stat. (http://faostat.fao.org/) (accessed on 6 July 2013)
Through the situation analysis, the CAMP Task Team discovered factors that resulted in low yields of sorghum. The first is the use of traditional (or unimproved) varieties of seeds, which take longer to mature and are low yielding; some farmers cannot get access to improved high yielding seeds. In addition, rural people prefer the taste of traditional sorghum varieties which also suffer less damage from birds due to the later timing of their milk and ripening stages. Secondly, sorghum usually grows in areas of less precipitation where rainfall has tended to be erratic recently. Farmers are cultivating sorghum without irrigation which makes sorghum yields low.
10.5.3 Food crop production areas and agricultural practices
Staple crops in South Sudan are sorghum, maize, cassava, millet, sweet potatoes and rice (Figure 10-8). Among them sorghum is the most important staple crop. Table 10-16 indicates that sorghum is cultivated by more than half of the total households in South Sudan. Approximately 80% of the households in Northern Bahr el Ghazal State grow sorghum. Sorghum is also cultivated by 79%, 73% and 67% of the households in Eastern Equatoria, Lakes and Jonglei States respectively.

10-23
Figure 10-8: Number of households harvesting crops (Top 10) in 2008/2009
Source: Data from the National Baseline Household Survey 2009. Prepared by NBS / CAMP Task Team
Table 10-16: Number of households producing major staple crops by state in 2009
Source: Data from the National Baseline Household Survey 2009. Prepared by NBS / CAMP Task Team
The second staple crop is maize. About 32% of the households cultivate maize. Maize is grown not only in the Greater Equatoria Region but also the Greater Upper Nile Region (i.e., Unity, Upper Nile and Jonglei States). Farmers in the Greater Equatoria Region produce
0 200,000 400,000 600,000 800,000
Rice
Peas
S.Potatos
Beans
Leafy.Veg.
Millet
Cassava
Groundnuts
Maize
Sorghum
# of HH
Rural
Urban
All area
Total 1,310,316 100.0% 681,819 52.0% 423,401 32.3% 120,053 9.2% 13,839 1.1% 89,703 6.8%
Urban 199,740 15.2% 23,236 1.8% 24,680 1.9% 11,526 0.9% 2,763 0.2% 3,160 0.2%
Rural 1,110,576 84.8% 658,584 50.3% 398,720 30.4% 108,526 8.3% 11,076 0.8% 86,543 6.6%
Total 142,438 100.0% 26,713 18.8% 67,979 47.7% - 0.0% 151 0.1% 715 0.5%
Urban 33,613 23.6% 2,713 1.9% 3,015 2.1% - 0.0% 151 0.1% 301 0.2%
Rural 108,825 76.4% 23,999 16.8% 64,964 45.6% - 0.0% - 0.0% 414 0.3%
Total 192,424 100.0% 129,220 67.2% 83,061 43.2% 4,327 2.2% 632 0.3% 1,082 0.6%
Urban 15,565 8.1% 4,824 2.5% 4,096 2.1% - 0.0% 91 0.0% - 0.0%
Rural 176,859 91.9% 124,396 64.6% 78,965 41.0% 4,327 2.2% 541 0.3% 1,082 0.6%
Total 72,114 100.0% 12,556 17.4% 37,949 52.6% 366 0.5% 67 0.1% 732 1.0%
Urban 12,120 16.8% 1,398 1.9% 3,196 4.4% - 0.0% 67 0.1% - 0.0%
Rural 59,994 83.2% 11,157 15.5% 34,753 48.2% 366 0.5% - 0.0% 732 1.0%
Total 169,505 100.0% 88,464 52.2% 58,261 34.4% 1,255 0.7% 951 0.6% 9,013 5.3%
Urban 13,070 7.7% 3,554 2.1% 1,376 0.8% - 0.0% 115 0.1% 229 0.1%
Rural 156,435 92.3% 84,910 50.1% 56,885 33.6% 1,255 0.7% 837 0.5% 8,784 5.2%
Total 133,563 100.0% 106,628 79.8% 5,154 3.9% - 0.0% 144 0.1% 966 0.7%
Urban 8,255 6.2% 1,292 1.0% - 0.0% - 0.0% 144 0.1% - 0.0%
Rural 125,308 93.8% 105,336 78.9% 5,154 3.9% - 0.0% - 0.0% 966 0.7%
Total 58,691 100.0% 26,566 45.3% 7,352 12.5% 7,567 12.9% - 0.0% 332 0.6%
Urban 25,932 44.2% 4,239 7.2% 1,496 2.5% 3,906 6.7% - 0.0% 332 0.6%
Rural 32,759 55.8% 22,327 38.0% 5,856 10.0% 3,660 6.2% - 0.0% - 0.0%
Total 92,323 100.0% 67,569 73.2% 15,562 16.9% 9,281 10.1% - 0.0% 22,987 24.9%
Urban 6,476 7.0% 747 0.8% 249 0.3% - 0.0% - 0.0% 249 0.3%
Rural 85,847 93.0% 66,821 72.4% 15,313 16.6% 9,281 10.1% - 0.0% 22,738 24.6%
Total 116,336 100.0% 35,292 30.3% 57,513 49.4% 58,586 50.4% 11,383 9.8% 28,783 24.7%
Urban 15,280 13.1% 2,101 1.8% 8,022 6.9% 5,539 4.8% 2,197 1.9% 1,815 1.6%
Rural 101,056 86.9% 33,191 28.5% 49,491 42.5% 53,047 45.6% 9,187 7.9% 26,968 23.2%
Total 179,071 100.0% 67,634 37.8% 54,994 30.7% 31,286 17.5% 511 0.3% 6,369 3.6%
Urban 56,357 31.5% 1,164 0.7% 2,329 1.3% 1,630 0.9% - 0.0% 233 0.1%
Rural 122,714 68.5% 66,470 37.1% 52,665 29.4% 29,656 16.6% 511 0.3% 6,136 3.4%
Total 153,851 100.0% 121,176 78.8% 35,576 23.1% 7,386 4.8% - 0.0% 18,724 12.2%
Urban 13,072 8.5% 1,202 0.8% 902 0.6% 451 0.3% - 0.0% - 0.0%
Rural 140,779 91.5% 119,974 78.0% 34,675 22.5% 6,935 4.5% - 0.0% 18,724 12.2%
Central Equatoria
Eastern Equatoria
Unity
Warrap
Northern Bahr El
Ghazal
Western Bahr El
Ghazal
Lakes
Western Equatoria
Cassava Rice Millet
Whole Nation
Upper Nile
Jonglei
State U/R total HH Sorghum Maize

10-24
maize and process it into flour to consume as a staple food such as posho and kisira. Meanwhile, in the Greater Upper Nile Region, farmers usually cultivate maize in small patches to consume fresh as a supplementary food. Cassava is the third important crop, cultivated mainly in the Greater Equatoria Region. Upland rice (non-irrigated) is mainly grown in Western Equatoria State and lowland rice in northern flooding areas. Millet is grown mainly in Western Equatoria and Lakes States.
10.5.3.1 Sorghum
Sorghum is grown throughout most of South Sudan. Main production areas are the Ironstone Plateau, Greenbelt, Hills and Mountains and Flood Plains zones (Figure 10-9). Cultivars are mainly traditional varieties, which take almost eight months to mature but some modern varieties, which are high yielding and early maturing with a three-month growing period, are also cultivated. Names of modern varieties are Serena, Go’do, Gadam el hamam, Kavi matama and Wad Ahmed. Usually sorghum is cultivated by mixed cropping (growing multiple crops on the same piece of land) with groundnuts, beans, cowpeas and pumpkins. Usually, seeds are broadcast (or scattered) at planting time making weeding difficult. Since farmers weed manually with simple tools, weeding is very labour intensive during the growing period. Birds (e.g., quelea quelea) are the most serious pest and cause serious damage to sorghum especially in the milk stage. During the situation analysis, some farmers interviewed in Renk County mentioned that many farmers could harvest less than 1 sack (about 100 kg) per feddan in 2012, which is equivalent to a yield of 0.24 t/ha, due to damage from quelea quelea. Locusts are also a serious pest damaging the plants by eating leaves.
Figure 10-9: Main areas of sorghum production
Source:Prepared by CAMP Task Team

10-25
Table 10-17: Consumption of sorghum in 2009
Note: Data of Western Bahr el Ghazal is not available. Source: Data from the National Baseline Household Survey 2009. Prepared by NBS / CAMP Task Team
Table 10-17 shows consumption of sorghum in 2009. Although the data for Western Bahr el Ghazal are not available, the data describe a general tendency. More than half of sorghum consumed in rural areas was purchased and more than 40% was self-produced. Thus, sorghum markets seem to be actively functioning even in rural areas. A large volume of sorghum was imported from Sudan before the closure of the border in 2011. This imported sorghum was mainly consumed in the northern part of the country.235 Rural people in Jonglei, Warrap, Northern Bahr el Ghazal and Eastern Equatoria States consume more than 100kg/year; in Lakes, rural people consume 264 kg/year.
10.5.3.2 Maize
Maize is grown mainly in the Greenbelt and Hills and Mountain zones (Figure 10-10). In the northern part of the country, farmers grow maize in small patches near their homes as supplementary food. Maize is the second staple food for the South Sudanese. Cultivars are mainly open pollinated varieties 236 but some progressive and large-scale farmers have started using hybrid varieties imported from Kenya and Uganda. Both types take almost five months to mature. Names of varieties are Longe 4, 5, 8 and 9, and Yei 2.237 Maize seeds are sown in rows since a maize seed is much larger than a sorghum seed, which is usually broadcast. Farmers can sow larger seeds in rows. Between rows of planted maize, other crops such as groundnuts, beans, cowpeas and pumpkin are cultivated. Post-harvest losses of the first cropping season (May-September) in the Greenbelt zone are extremely high due to high humidity and poor storage facilities. Wild animals (e.g., monkeys, baboons and squirrels) or livestock can cause serious damage to maize plants. Insect pests (e.g., locust, termite and stem bore) are another large factor for decreasing productivity.
235
Even after the border with Sudan was closed, some informal trade continued. During the CAMP Situation
Analysis it was confirmed that in the northern areas, such as Upper Nile, Warrap, Northern and Western Bahr el Ghazal states, sorghum, wheat flour and some vegetables were imported from Sudan. 236
Many farmers use their own seeds obtained from harvest in the previous season. 237
2011. Seed System Security Assessment South Sudan November-December 2010, p. 51.
From
purchased
From own
stock
From own
production
From gift and
other
sources
Total
Urban 42% 39% 19% 0% 100% 14,648 243,938 60 kg/year
Rural 63% 17% 14% 7% 100% 62,723 720,415 87 kg/year
Urban 76% 10% 11% 3% 100% 20,951 129,341 162 kg/year
Rural 53% 10% 34% 3% 100% 156,435 1,229,261 127 kg/year
Urban 76% 17% 5% 2% 100% 9,002 120,992 74 kg/year
Rural 78% 8% 10% 3% 100% 30,145 465,966 65 kg/year
Urban 72% 12% 13% 3% 100% 8,672 84,887 102 kg/year
Rural 55% 18% 25% 2% 100% 136,433 888,041 154 kg/year
Urban 87% 7% 2% 3% 100% 6,584 55,398 119 kg/year
Rural 62% 11% 23% 4% 100% 105,317 665,500 158 kg/year
Urban - - - - - - - - kg/year
Rural - - - - - - - - kg/year
Urban 63% 10% 24% 3% 100% 8,494 65,033 131 kg/year
Rural 52% 14% 30% 4% 100% 166,570 630,697 264 kg/year
Urban 75% 12% 11% 2% 100% 3,445 100,034 34 kg/year
Rural 47% 8% 41% 5% 100% 27,421 518,995 53 kg/year
Urban 91% 2% 3% 4% 100% 11,323 382,362 30 kg/year
Rural 74% 6% 18% 2% 100% 41,940 721,230 58 kg/year
Urban 62% 3% 35% 0% 100% 4,633 80,420 58 kg/year
Rural 29% 24% 44% 3% 100% 98,359 825,706 119 kg/year
Urban average 71% 14% 13% 2% 100% 87,751 1,262,405 70 kg/year
Rural average 54% 14% 28% 4% 100% 825,343 6,665,811 124 kg/year
National average 56% 14% 27% 3% 100% 913,094 7,928,216 115 kg/year
Population
(person)
Per person consumption
(kg/year/person)
Annual consumption (% to the total)
State
Warrap
Unity
Urban/ RuralTotal
(ton/year)
Eastern Equatoria
Central Equatoria
Western Equtoria
Lakes
Upper Nile
Western Bahr el Ghazel
Northern Bahr el Ghazel
Jonglei

10-26
Figure 10-10: Main areas of maize production
Source:Prepared by CAMP Task Team
10.5.3.3 Cassava
Cassava is grown mainly in the Greenbelt and Hills and Mountain zones. 13% of agricultural households238 and 25% of rural households cultivated cassava in Western Equatoria State, which is a growing centre for cassava (see Table 10-16). TME 14, Nase 1 and 2, and Oreste are varieties preferred by farmers;239 TME 14 and Oreste are cassava mosaic virus tolerance varieties. Cassava takes more than one year to mature. Farmers can harvest tubers at any time when necessity arises, so cassava is an important food to cope with food shortages during the period of seasonal food insecurity. Leaves of cassava are also utilised as a green vegetable. Cassava stocks are planted in rows and usually farmers do not practice mixed cropping. Cassava mosaic virus and brown streak virus diseases could become a serious threat for cassava growers in the Greater Equatoria Region. Cassava brown streak virus disease comes from Uganda and Kenya and could cause substantial losses if proper disease control is not carried out.240 However, effective disease control and quarantine systems do not exist. If these diseases spread rapidly in the production areas, it would be a major cause of food insecurity.
238
GRSS. NBS 2012. National Baseline household Survey 2009. Juba. GRSS. p54. Juba: NBS 239
Footnote 22 (Seed System Security Assessment South Sudan November-December 2010, p 51) 240
The New Nation. June 23- July 7 2013. S. Sudan hit by cassava diseases. p20. Juba.

10-27
Figure 10-11: Main areas of cassava production
Source:Prepared by CAMP Task Team
10.5.3.4 Rice
The main areas of rice production are shown in Figure 10-12. Currently, the volume of rice production is not significant but rice could substantially contribute to enhancing food security at both household and national levels since rice imports have been increasing in recent years.241 There are some large areas with potential for rice production. Upland rice grows mainly in the Greenbelt zones. Cultivars of upland rice (NERICA 1, 4 and 10) are cultivated and are newly introduced from Uganda.
Figure 10-12: Main areas of rice production
Source:Prepared by CAMP Task Team
Lowland rice (or paddy rice) could grow in the areas that flood in the Eastern and Western Flood Plains and Nile Sobat zones; however, this is not fully exploited so far. Lowland rice is also cultivated in the Aweil Irrigation Rice Scheme (AIRS) in Northern Bahr el Ghazal State. AIRS is a national irrigation scheme and about 2,700 feddans of farmland are operational in 2013, although 11,000 feddans were intended to be irrigated. Cultivars in the scheme are BR 4 and BG 400-1, and yield level is about 1 to 1.5 t/ha.
241
Net weight rice exports of Uganda to Sudan (primarily South Sudan) more than doubled from 5,072,413 tons
in 2010 to 11,590,109 tons 2011. COMSTAT. http://comstat.comesa.int/DataQuery.aspx (accessed on 18 July 2013)

10-28
10.5.4 Types of farmers
10.5.4.1 Overview of farm households
The dataset of the National Baseline Household Survey 2009 shows that among households that harvested crops in the season 2008/2009,242 47% harvested only one crop and 30% two crops (Table 10-18). These figures show that diversification of cultivated crops per household was very limited as 77% of households harvested only one or two crops. Especially in rural areas, farmers tend to concentrate on growing one or two types of crops.
Table 10-18: Number of crop(s) harvested by households
Source: Data from the National Baseline Household Survey 2009. Prepared by NBS / CAMP Task Team
Table 10-19: Number of plots cultivated by household
Source: Data from the National Baseline Household Survey 2009. Prepared by NBS / CAMP Task Team
Among the households which cultivated any crops in the season 2008/2009,243 about 84% cultivated only one plot (farmland) and 12% two (Table 10-19). Approximately 96% of households, which cultivated any crops, used only one or two plots. This is almost the same in both urban and rural areas.
242
Based on the NBS dataset, the total number of households is about 1,310,000 in 2009, and about 856,000
households harvested at least one crop in the season of 2008/2009. 243
Based on the NBS dataset, the total number of households is about 1,310,000 in 2009, and about 1,002,000
households cultivated farm(s) in the season of 2008/2009.
# % # % # %
1 402,280 47.0 16,696 28.5 385,585 48.3
2 257,955 30.1 17,044 29.1 240,911 30.2
3 90,842 10.6 10,031 17.2 80,810 10.1
4 56,025 6.5 9,567 16.4 46,458 5.8
5 21,950 2.6 799 1.4 21,151 2.7
6 16,833 2.0 2,931 5.0 13,902 1.7
7 5,372 0.6 739 1.3 4,633 0.6
8 3,896 0.5 411 0.7 3,485 0.4
9 1,191 0.1 262 0.4 930 0.1
total 856,344 100.0 58,480 100.0 797,864 100.0
# of crops
cultivated
All areas Urban Rural
# % # % # %
1 842,783 84.1 40,419 85.2 802,364 84.1
2 114,981 11.5 4,755 10.0 110,226 11.5
3 33,219 3.3 1,209 2.5 32,010 3.4
4 8,461 0.8 1,083 2.3 7,378 0.8
5 975 0.1 - 0.0 975 0.1
6 1,441 0.1 - 0.0 1,441 0.2
total 1,001,860 100.0 47,467 100.0 954,394 100.0
# of plots
cultivated
All areas Urban Rural

10-29
Figure 10-13: Proportion of households by status of owning agricultural land and livestock
in 2009
Source: Data from the National Baseline Household Survey 2009. Prepared by NBS / CAMP Task Team
Approximately 60% of households owned land for both crop production and livestock while 18% owned land only for crop production (Figure 10-13). The detailed breakdown by state is shown in Table 10-20. In Jonglei, Lakes, Warrap and Unity States, agro-pastoralism was very common. In Western Equatoria State, slightly less than half of households concentrated on crop production. In Unity, Upper Nile and Warrap States, the number of households concentrating on livestock was relatively large compared to other states.
The estimated average area growing crops per household was 1.12 ha, which is equivalent to 2.7 feddans, in 2012.244 These general figures show that the majority of households are engaged in farming relatively small areas with only a few types of crops. They are also keeping livestock. For the CAMP Situation Analysis, the CAMP Task Team defined three types of farmers: 1) subsistence farmers who cultivate small areas (1 to 4 feddans) and grow crops mainly for their own consumption; 2) progressive farmers who produce a surplus for selling (transforming to commercial farming); and 3) large-scale farmers who cultivate more than 100 feddan. When the team selected farmers to interview, they took into account the distance between the farmers’ homes and major markets since it is probable that distance to market might affect their production patterns.
244
FAO/WFP. 2013. CFSAM to South Sudan. p. 14. Rome: FAO/WFP
0% 10% 20% 30% 40% 50% 60% 70% 80% 90% 100%
Rural
Urban
Whole Nation
Crop & livestock Crop only Livestock only No crop & no livestock

10-30
Table 10-20: Proportion of households by status of owning agricultural land and livestock by state in 2009
Source: Data from the National Baseline Household Survey 2009. Prepared by NBS / CAMP Task Team
10.5.4.2 Subsistence farmers
In view of the sector policy objectives of MAFCRD, the main focuses of CAMP will be food security and poverty reduction in addition to economic development. Therefore, it is crucial to understand the situation of subsistence farmers who are the majority of the rural population in order to formulate effective programmes and projects for them. In this context, the CAMP Task Team conducted interviews with 113 farmers in ten states (Table 10-21) during the situation analysis. The team selected a larger number of subsistence farmers to interview to accurately know their situation. 96 out of the 113 farmers interviewed were subsistence farmers. Their typical characteristics and situation revealed through the interviews are as follows:
Subsistence farmers mainly use family and communal labour for farming activities (e.g., ploughing, sowing, weeding and harvesting). They usually do not have enough
# % # % # % # %
Total 1,310,316 775,646 59.2 231,702 17.7 133,941 10.2 169,026 12.9
Urban 199,740 27,156 2.1 20,406 1.6 47,929 3.7 104,249 8.0
Rural 1,110,576 748,491 57.1 211,296 16.1 86,012 6.6 64,777 4.9
Total 142,438 80,132 56.3 12,077 8.5 21,877 15.4 28,353 19.9
Urban 33,613 4,823 3.4 904 0.6 12,360 8.7 15,525 10.9
Rural 108,825 75,309 52.9 11,172 7.8 9,517 6.7 12,827 9.0
Total 192,424 137,505 71.5 27,059 14.1 22,511 11.7 5,349 2.8
Urban 15,565 3,914 2.0 1,638 0.9 6,827 3.5 3,186 1.7
Rural 176,859 133,591 69.4 25,420 13.2 15,685 8.2 2,163 1.1
Total 72,114 45,149 62.6 4,973 6.9 13,956 19.4 8,036 11.1
Urban 12,120 3,263 26.9 1,132 1.6 4,262 5.9 3,463 4.8
Rural 59,994 41,886 69.8 3,841 5.3 9,694 13.4 4,573 6.3
Total 169,505 116,758 68.9 18,107 10.7 25,769 15.2 8,871 5.2
Urban 13,070 4,242 2.5 1,376 0.8 5,274 3.1 2,178 1.3
Rural 156,435 112,516 66.4 16,731 9.9 20,495 12.1 6,692 3.9
Total 133,563 78,673 58.9 35,114 26.3 7,915 5.9 11,861 8.9
Urban 8,255 718 8.7 646 0.5 1,795 1.3 5,097 3.8
Rural 125,308 77,955 62.2 34,468 25.8 6,120 4.6 6,765 5.1
Total 58,691 16,935 28.9 15,451 26.3 4,058 6.9 22,246 37.9
Urban 25,932 1,745 3.0 5,569 9.5 1,496 2.5 17,122 29.2
Rural 32,759 15,190 25.9 9,883 16.8 2,562 4.4 5,124 8.7
Total 92,323 71,592 77.5 9,779 10.6 6,311 6.8 4,641 5.0
Urban 6,476 1,059 1.1 498 0.5 2,366 2.6 2,553 2.8
Rural 85,847 70,534 76.4 9,281 10.1 3,944 4.3 2,088 2.3
Total 116,336 41,351 35.5 56,281 48.4 4,692 4.0 14,011 12.0
Urban 15,280 4,011 3.4 6,494 5.6 1,433 1.2 3,343 2.9
Rural 101,056 37,340 32.1 49,787 42.8 3,260 2.8 10,669 9.2
Total 179,071 80,048 44.7 26,451 14.8 20,240 11.3 52,332 29.2
Urban 56,357 2,329 1.3 1,397 0.8 10,014 5.6 42,617 23.8
Rural 122,714 77,719 43.4 25,054 14.0 10,226 5.7 9,715 5.4
Total 153,851 107,503 69.9 26,410 17.2 6,611 4.3 13,326 8.7
Urban 13,072 1,052 8.0 751 0.5 2,104 1.4 9,165 6.0
Rural 140,779 106,451 75.6 25,659 16.7 4,508 2.9 4,161 2.7
Crop production
&
Livestock
Crop production
onlyLivestock only
State U/Rtotal #
of HH
Northern Bahr
El Ghazal
No crop
production
& no livestock
Whole Nation
Upper Nile
Jonglei
Unity
Warrap
Western Bahr
El Ghazal
Lakes
Western
Equatoria
Central
Equatoria
Eastern
Equatoria

10-31
funds to hire labourers. Ploughing, weeding and harvesting are labour intensive work, so it is difficult for them to expand the area cultivated using only family labour.
Some of the subsistence farmers try to hire labourers, but the cost of labour is extremely high and the supply of labourers is limited. Thus, they sometimes give up trying to expand their cultivated area. There is a tendency for young people not to want to farm, so scarcity of labour for farming is becoming a serious issue.
Subsistence farmers use hand tools for farming, e.g., hoes, pangas, malodas (traditional hoes), knives, sickles and axes. Even though they try to open and clear new areas for farming, they can only prepare a few feddans using manual labour and hand tools.
Subsistence farmers cannot afford to use agricultural inputs because of limited funds and unavailability of inputs. They use traditional varieties of seeds which are obtained from their own harvest of the previous season and are a mixture of unknown varieties which do not give high yields. Since they are practicing rain-fed, low input farming, yields are usually quite low and production is sometimes not enough to feed household members throughout the year.
Subsistence farmers in the Greenbelt zone are suffering from large postharvest losses in the first season.245 They generally use traditional storage facilities for grains and dried cassava, which sometimes do not perform well due to high humidity. Storage capacity is also limited.
A relatively large number of subsistence farmers are keeping small ruminants (e.g. goats and sheep) and chickens. If there is food shortage due to seasonal food insecurity, they sell these to obtain cash for purchasing food.
Insecurity is severely affecting the livelihoods of subsistence farmers. Due to intercommunal or tribal conflicts, some farmers leave their homes and become Internally Displaced Persons (IDPs). If this happens at an early stage of the rainy season, they are unable to plough their land and sow seeds and might face serious food insecurity.
Table 10-21: Number of farmer interviewees for situation analysis
State Subsistence Progressive Large Scale
Total Near
a Far
b Near Far Near Far
Eastern Equatoria State 9 17 0 0 2 1 29
Central Equatoria State 7 6 1 0 0 0 14
Western Equatoria State 0 8 0 0 0 0 8
Jonglei 1 7 0 0 0 0 8
Unity 3 4 1 0 0 0 8
Upper Nile 1 2 1 2 0 2 8
Northern Bahr el Ghazal 6 5 0 0 0 0 11
Western Bahr el Ghazal 4 4 0 0 1 0 9
Warrap 2 5 0 0 0 0 7
Lakes 2 3 4 1 1 0 11
Sub-total 35 61 7 3 4 3 113 Note:
a Farmers live near county capitals (markets), within about 10km radius.
b Farmers live far from county capitals (markets), outside of 10km radius.
Source: CAMP Situation Analysis from April to June 2013
Through interviews with subsistence farmers, the CAMP Task Team could confirm their cropping patterns as illustrated in the following figures. They mainly cultivate a few staple cereal crops, such as sorghum and maize, and also grow other crops like groundnuts, tubers (e.g., cassava and sweet potato), beans, sesame and some green leafy vegetables. Family
245
There are two crop seasons in the Greenbelt.

10-32
members consume most of the produce; some farmers have to purchase additional food from markets. In Rumbek, Unity State in the Ironstone Plateau zone, the majority of subsistence farmers cultivate sorghum and groundnuts mixed cropping (Figure 10-14). Since the soil type is sandy loam, groundnuts, which prefer well drained soil, grow well and are harvested easily due to less soil stickiness. Some farmers can produce surplus groundnuts but the sorghum harvest is sometimes not sufficient for home consumption. Many farmers use ox ploughs since NGOs are promoting this new technology; also, sandy soil is suitable for ox ploughs. The period of seasonal food insecurity in this area is from June to August. If farmers face food shortages, they sell their small ruminants such as goats and sheep or ask relatives for support.
Figure 10-14: Crop calendar of subsistence farmers in Rumbek, Lakes State (Ironstone Plateau zone)
Source: Farmers, interviewed by CAMP crops subsector team, May 2013, CAMP Situation Analysis
Mar Apr May Jun Jul Aug Sep Oct Nov Dec Jan Feb
Sorghum
(late maturity)
Groundnuts
Beans
Maize
Cowpeas
Seasonal food insecurity
Land Preparation Sowing Weeding Harvesting Growing Period
Rainfall

10-33
Figure 10-15: Crop calendar of subsistence farmers in Yambio, Western Equatoria State (Greenbelt zone)
Source: Farmers, interviewed by CAMP crops subsector team, April 2013, CAMP Situation Analysis
In Yambio, Western Equatoria State in the Greenbelt zone, the majority of subsistence farmers cultivate maize and/or sorghum with groundnuts mixed cropping (Figure 10-15). They also cultivate cassava for tubers, leaves and stalk. Cassava leaves are a very important green vegetable for farming households in this area and palatability of leaves is one of the key criteria for selecting cultivars. Stalks are used as firewood. The rainfall pattern is bi-modal so farmers are able to cultivate two crops in a year. Due to heavily forested land, it is difficult for farmers to open up new areas for farming manually. Many large tree stumps remain in the ground and this can hinder the use of tractors. Many farmers can produce surplus maize to sell in Yambio market. Seasonal food insecurity is not a major problem in this area since farmers can produce enough agricultural products year round. Western Equatoria State was the only state to produce a cereal surplus in the 2012/13 season.246 Two typical cases of subsistence farmers in Northern Bahr el Ghazal and Central Equatoria States are shown in Box 10-1.
Box 10-1: Cases of subsistence farmers
246
FAO/WFP. 2013. CFSAM to South Sudan. p. 24. Rome: FAO/WFP
Mar Apr May Jun Jul Aug Sep Oct Nov Dec Jan Feb
Maize 1
Maize 2
Sorghum (late maturity)
Groundnuts 1
Groundnuts 2
Cassava [Cassava is planted during the rainy season and is harvested after a year or later]
Seasonal food insecurity [Generally no seasonal food insecurity]
Land Preparation Sowing Weeding Harvesting Growing Period
Rainfall
[Case 1] In Northern Bahr el Ghazal State This farmer is cultivating two mogomat (area of 30m by 20m, which is equivalent to 1/7 feddan); one mogomat for sorghum and a half each for sesame and groundnuts. He also owns twenty cattle and ten goats. Sorghum planted was a late maturing variety (traditional one), which needs eight months to mature. He was using traditional manual tools for land preparation, weeding and harvesting. He harvested 3 bags (100kg/bag) of sorghum, 1.5 bags (100kg/bag) of sesame and 5 bags (50kg/bag) of groundnuts in 2012. He bartered 1 bag of sorghum and 2 bags of groundnuts for cattle. However, he mentions that he would have to purchase sorghum from the market during the period of seasonal food insecurity from July to August. He is very keen on livestock and is eager to increase the number although he feels there is not enough food for

10-34
Source: Farmer, interviewed by CAMP crops subsector team, Yei River, 23 May 2013, CAMP Situation Analysis.
Table 10-22: Issues of subsistence farmers
Items Issues
Land preparation
Tractor services are not available in many places, so the farmers cannot cultivate larger areas. Tractor hire cost is usually high even when tractor services are available.
Ox ploughs are used in limited areas (e.g., Lakes and Warrap States) due to limited support services, unavailability of tools and unfavourable soil types (sandy loam is suitable for animal traction).
Family manual labour is limited. Utilisation of hired labour is also difficult due to high cost and limited availability.
Inputs Quality seeds are sometimes not available in markets since there are no agro-dealers in some areas. The majority of farmers use their own seeds from the last harvest, which tend to be low quality and mixed with different varieties.
Chemical fertiliser is not available in almost the entire country except for some agro-dealers supported by Development Partners (DPs).
Cultivation Since weeding is very labour intensive; this hinders expansion of the area farmed. Mixed cropping makes weeding difficult so many farmers weed by hand and/or with special small hoes.
The farmers try row planting for maize, groundnuts and beans but broadcast sorghum and sesame. Weeding becomes very hard if they broadcast.
Pest and diseases
Pesticides and herbicides are rarely available in rural areas. Quelea quelea (birds) seriously damage sorghum in the northern part of the
country (especially in Renk County and other sorghum production areas). Other animal pests, such as monkeys, baboons and squirrels, and livestock also
cause serious damage to crops. Fencing is one of the measures to prevent damage but many farmers do not have the funds to do this.
Post-harvest activities
First season crops in the Greenbelt zone are frequently damaged by fungus due to high humidity.
Stored grains are damaged by weevils and rats since farmers lack modern storage facilities.
247
Usually, bitter cassava is soaked in water to remove toxic substances and then it is dried.
them. It seems that social aspects heavily influence agricultural practices in this area. [Case 2] In Central Equatoria State This farmer is cultivating two feddans; one feddan for maize and a half each for sorghum and cassava. He also owns six cattle, seven goats and ten chickens. He plants maize in rows using a rope to ensure straight rows and to set equal planting distances following the recommendation of an Agricultural Extension Officer (AEO). He uses his own maize seed and improved ones purchased from a market, which costs 14SSP for 2kg. He used traditional manual tools (e.g. hoe, axe, rake, fork hoe and panga) for land preparation, weeding and harvesting. He harvested 12 bags (100kg/bag) of maize through 2 crop seasons in 2012/13, and 6 bags of sorghum and 17 bags of dried cassava247 in 2012. Damage by monkeys and birds was very serious, so he thinks 65% of produce was lost. He, however, could maintain relatively good yield levels, since he was following instructions provided by the AEO. He could sell 3 bags of maize, 4 bags of sorghum and 9 bags of cassava to a market and his neighbours, especially from May to June, which is the highest price season of this produce. His son carries the produce to markets by his bicycle to sell to a trader but road conditions are very poor. He collects market information from neighbours and the boma headquarters.

10-35
Items Issues
Marketing Many of the farmers cannot obtain timely market price information. Even if they can get market information, it is difficult for them to send products to markets because of lack of transport and bad road conditions.
There are a limited number of traders who buy products from subsistence farmers.
External support/services
Extension services provided by the government are limited. Some NGOs are providing extension services to a limited number of farmers.
Financial services are very limited. Only about 3% of rural households could
borrow money for agricultural activities.248
Infrastructure Feeder road conditions are extremely bad in most areas. This is a big obstacle for access to markets. Also main roads are not paved and not well maintained, so transport costs between large cities are very high.
Large and medium scale warehouses for grains and facilities for collection points are not developed.
Only a very limited number of farmers have irrigation facilities.
Others Livestock of pastoralists coming from other areas destroys farmers’ crops. Fencing is one of the effective prevention measures but it requires high investment. Usually farmers cannot afford to construct a fence.
Erratic rainfall patterns seriously affect crop production in semi-arid areas in the northern part of the country. Frequent flooding also affects it in the Flood Plains zones.
Insecurity is also a serious issue for crop production. Some farmers fail to cultivate crops when they escape from conflicts and lose opportunities to plough land and sow seeds.
Some farmers who face food insecurity frequently receive food aid from NGOs and DPs. This may accelerate food aid dependency and reduce farmers’ motivation to farm.
Source: Farmers, interviewed by CAMP crops subsector team, April to June 2013, CAMP Situation Analysis
During the interviews with subsistence farmers, the team ascertained their major issues. Many of the farmers cannot get access to support services such as agricultural extension services and rural credit facilities. They are also suffering from low productivity because of erratic rains, low input agriculture, pest and diseases, and limited access to modern agricultural techniques. They want to expand their farmlands but they do not have enough financial and human capacity to do so. The detailed issues they are facing are shown in Table 10-22.
10.5.4.3 Progressive farmers
Although the majority of farmers are at a subsistence level, the CAMP Task Team could identify some progressive farmers and conducted interviews with them. They are cultivating relatively large farmlands and are engaged in commercial farming. Many of the progressive farmers have access to tractor services for ploughing, agricultural inputs (e.g., quality seeds, pesticides), hired labourers, market information and traders for selling produce. Many of the progressive farmers started commercial farming recently and it seems that their number is increasing rapidly, especially in the Greenbelt zone. The characteristics of the progressive farmers are as follows:
Progressive farmers have financial capacities to hire tractor services and labourers for land preparation. Some of them are shop owners and government officers, so they have other income sources besides agriculture.
Their educational levels are relatively high and are eager to accept and apply new technologies. They sometimes have precise records of their farm operations and can calculate their profit and loss easily.
248
Data from the NBS Dataset of the National Baseline Household Survey 2009 and calculated by NBS / the
CAMP Task Team, this figure is further explained in “9.8 Services.”

10-36
Many of them have connections with middlemen and traders. They know the season of the highest prices of their produce and, as they own storage facilities, wait for the best time to sell.
They have a clear vision of how to develop a farming operation over a few years. They recognise the business potential of agriculture.
Although the number of progressive farmers is still limited, the CAMP Task Team found some farmers who have already transformed their operations from subsistence farming into commercial and others who are new to commercial farming. They are looking for financial institutions that will provide credit for further expansion of their operations. The following box describes the case of one progressive farmer in Eastern Equatoria State.
Box 10-2: Case of progressive farmer in Eastern Equatoria State
This farmer is a member of the state council in Juba. He has a total of 100 feddan planted with sorghum and groundnuts, and a piece of land with vegetables along a river. He believes that agriculture will become a profitable business although he could only make a small profit from farming last year due to the large initial investment. He employs 25 workers who get regular income from work on his farm. He spends a lot of money for land reclamation, removing trees and other obstacles. He has a tractor and implements for all field operations. On some occasions, when the tractor is not fully engaged, he rents his tractor to other local smallholder farmers for income generation. He hires some labourers for seeding, weeding and harvesting. He notes that labour costs are very expensive. While labourers are paid wages, he also needs to provide them with food, otherwise most of them would leave work. He is planning to expand his farm to 200 feddans and to put a fence around the farm to prevent intruders (e.g., cow, goats, wild animals and thieves). He wants to introduce an irrigation system so that he could supply his products to markets in Torit throughout the year. He plans to ask the Agricultural Development Bank or Cooperative Bank of South Sudan for a loan to meet the extra charges for the expansion of his farm.
Source: Farmer, interviewed by CAMP crops subsector team, Torit, 13 April 2013, CAMP Situation Analysis.
10.5.4.4 Large scale farmers
In Renk County, Upper Nile State in the Eastern Flood Plains zone, the Renk Irrigation Scheme was operated by the Sudanese government before the independence of South Sudan. There are 23 sub-schemes in the scheme and now 9 sub-schemes are operated by the government and the rest by private farmers.249 There is no operational irrigation sub-scheme in the scheme due to breakage of pumps and insufficient funds for operation provided by the government. However, many private farmers are engaged in rain-fed mechanised large-scale farming in and outside the scheme. These farmers mainly grow sorghum, sesame, millet and groundnuts (Figure 10-16). Their farm sizes are very large compared to farms in other areas of the country. One of the interviewed farmers operates hundreds of feddans and another owns more than one thousand feddans. Land preparation on large farms is done by tractors and sowing is also done by mechanised broadcasters. Meanwhile, weeding and harvesting are done manually. This area has a semi-arid climate with total annual precipitation of about 500 mm. Farmers have no irrigation facilities, thus rainfall is the most crucial determinant of yield. Moreover,
249
GRSS. MWRI. 2010. Assessment, Design, Installation of Irrigation Pumps and Rehabilitation of Water Control
Infrastructures, Inception Phase, Preliminary Assessment Works on Renk Project, Final Report. p. 8.

10-37
damage from pests is very serious, particularly by birds, and additional numbers may migrate from Sudan.250 Although pest control is carried out in Sudan by aerial spraying, in South Sudan pest control measures are not taken at all. Some farmers mentioned that they cultivated 220 feddans of sorghum in 2012 but they only harvested 5 bags (100kg/bag) due to damage from birds. One farmer tried to use smoke to chase away birds but unsuccessfully. He believed that only aerial spraying was effective in preventing bird damage.
Figure 10-16: Crop calendar of large-scale farmers in Renk, Upper Nile State (Flood Plains zone)
Source: Farmers, interviewed by CAMP crops subsector team,, June 2013, CAMP Situation Analysis
The CAMP Task Team identified other large-scale farmers during the situation analysis, apart from those in mechanised rain-fed farming schemes such as the Renk scheme. One of these cases is described in the following box.
Box 10-3: Case of a large scale farmer in Lakes State
He used to be a police officer in this area and after retirement in 2008, he started farming in Rumbek Central County. He cultivated sorghum and groundnuts in two areas last year; one is about 400 feddans, which he plans to expand to 1,000 feddans this year, and another is 60 feddans. He also started cultivating 200 feddans in Wulu County this year. He owns 72 cattle, 22 sheep, 9 goats and 40 chickens. He practices mixed cropping with sorghum and groundnuts, sorghum seeds are broadcast and groundnuts are planted in holes prepared with an equal space between them. The soil is still productive because it is newly opened land. Animal pests, especially monkeys, squirrels and porcupines, and neighbours’ livestock, such as cows and goats, cause serious damage to his produce; he is planning to establish fences around his farms. He tries to hire labourers to open and plough his farmland since tractor services are very limited in this area. He faces many difficulties because labour costs are extremely high and hiring many labourers at one time is difficult during a busy farming season. Therefore, he chooses to open up a new area in a remote part of Wulu County where labourers are available due to limited job opportunities in the area and labour costs are more reasonable. He would like to buy a generator to operate an irrigation pump for vegetable production. He thinks demand for vegetables in the dry season is very high in Rumbek Town, and
250
FAO/WFP. 2013. Crop and Food Security Assessment Mission (CFSAM) to South Sudan. p. 20. Rome:
FAO/WFP
Mar Apr May Jun Jul Aug Sep Oct Nov Dec Jan Feb
Sorghum (late maturity)
Sesame
Groundnuts
Millet
Seasonal food insecurity
Land Preparation Sowing Weeding Harvesting Growing Period
Rainfall

10-38
vegetable prices are also remarkably high. He would like to obtain a daily cash income by supplying vegetables to markets, while cereal crop production would provide a large amount of cash income several times a year.
Source: Farmer, interviewed by CAMP crops subsector team, Rumbek Central, 23 May, CAMP Situation Analysis.
10.6 Cash crop production
10.6.1 Overview
South Sudan has great potential for the production of various cash crops such as vegetables, fruit, coffee, tea, sugarcane, sesame, groundnuts, sunflower, oil palm and cotton, all of which are for domestic consumption and export. In particular, the Greenbelt and Hills and Mountains zones are high potential areas due to favourable rainfall and fertile soil. However, this potential is not fully exploited. Vegetables are a high potential cash crop for domestic consumption. However, domestic production does not meet demand and a large volume of vegetables is imported from Uganda, Kenya, Ethiopia and Sudan. During the situation analysis, the CAMP Task Team collected market information on vegetables and other crops. At markets in state capitals, many imported vegetables and tuber crops are sold. Table 10-23 shows the origin and prices of three selected cash crops at major markets. In markets located in the southern part of the country, such as Torit, Juba and Rumbek, these items mainly come from Uganda and Kenya. Ugandan and Kenyan wholesalers and transporters import vegetables from their own countries. South Sudanese are rarely involved in this business.251 Meanwhile, in markets located in the northern part of the country, such as Bentiu, Malakal, Aweil, Wau and Kwajok, the same items are coming from Sudan and Ethiopia, or are produced locally around the state capitals. Local tomatoes are sold in the northern markets, since tomatoes are not commonly produced in Sudan and it is difficult to bring them from Uganda due to poor road conditions, high transport costs and high perishability. Seemingly, if markets are isolated from large production areas in foreign countries, local products are more competitive. This situation encourages farmers to produce vegetables for sale. Production of green leafy vegetables in peri-urban areas is a typical success story. Farmers grow Jew’s mallow and amaranths in small patches near urban areas, since demand for green leafy vegetables is very high and they are not imported from neighbouring countries due to high perishability.
Table 10-23: Origins and prices of selected crops at major markets (April-June, 2013)
Market Tomato Onion Potato
Origin Price Origin Price Origin Price
Torit Uganda SSP 600/ box Kenya SSP 6/kg Kenya SSP 3/kg
Juba Uganda SSP 2/ 4 large pieces
SSP 1/ 3 small pieces
Uganda SSP 5/ 4 large pieces
SSP 2/ 4 medium pieces
- -
Yei South Sudan
SSP 170/ box Uganda SSP 5/kg South Sudan
SSP 4/kg
Rumbek Uganda SSP 17/kg Uganda SSP 10/kg Uganda -
Bentiu Sudan SSP 2/ 3 small pieces
Sudan SSP 6/kg - -
Malakal South Sudan
SSP 5-10/ 4 pieces
Sudan SSP 5-10/ 4 pieces
Ethiopia SSP 25/kg
Aweil Sudan SSP 500/ box Sudan SSP 5/kg Sudan SSP 8/kg
251
The detailed information is shown in the section 10.7 Marketing and trade.

10-39
Market Tomato Onion Potato
Origin Price Origin Price Origin Price
Wau South Sudan
SSP 5/ 4 pieces
- - - -
Kwajok South Sudan
SSP 5/ 6 pieces
- - - -
Source: Wholesaler and Retailers, interviewed by CAMP crops subsector team, April to June 2013, CAMP Situation Analysis.
Fruit is another high potential cash crop but only a small amount is produced for commercial purposes. In the Greenbelt zone, various kinds of fruit, such as pineapple, mango, banana, citrus, papaya, watermelon, passion fruit and avocado, are grown. Likewise, small quantities of coffee and tea are grown and consumed locally, although they are high value and have high potential. Groundnuts and sesame are commonly grown in the whole country and are very important crops for farmers for home consumption. These two crops also have high potential for the production of vegetable oil, most of which is currently imported from neighbouring countries.
10.6.2 Production areas and agricultural practices
10.6.2.1 Vegetables
Through the situation analysis, three major potential areas for vegetable production are identified. Two potential areas for large volume production are the Greenbelt and Hills and Mountain zones (Figure 10-17). The third potential area is the suburbs of major towns since vegetable demand there is high.
Figure 10-17: High potential vegetable Production Areas
Source:Prepared by CAMP Task Team
In Yei and Morobo in the Greenbelt zone, various kinds of vegetables are cultivated for commercial purposes. During the situation analysis, agro-dealers in Yei mentioned that vegetable production in Yei and Morobo had grown in the last two years. Many kinds of vegetables, such as tomatoes, cabbages, cucumbers, bell peppers and onions, came from Uganda before but now some252 are produced locally. This is confirmed by the fact that sales of quality vegetable seeds have increased substantially due to the increase in the number of vegetable growers. Some of the farmers in the areas are returnees from Uganda who had farming experiences in Uganda growing vegetables.
252
According to the agro-dealers, it seems that almost 80% of vegetables at markets in Yei are local. Some
retailers, however, sell local vegetables as imported from Uganda, since they can get a higher price for imported vegetables.

10-40
Many interviewees in this area pointed out the difficulties of market access. Although, many of them know how to access local market information (e.g., through radio and neighbours), they cannot easily transport their products to local markets in Yei, due to inadequate feeder roads and lack of transportation. In addition, even though there is a large demand for fresh vegetables in Juba, vegetables from Yei and Morobo are not common in Juba markets. The reasons for this are as follows: The Juba-Yei road is not paved and its condition is poor especially in the rainy season.
The distance between Juba and Yei is 157km, but it sometimes takes more than 8 hours by truck during the rainy season.
It is difficult for local traders to collect a large volume of vegetables since vegetables are produced by small scale farmers who are not well organised to consolidate their products.
Traders at markets in Juba tend to prefer Ugandan products due to their high quality and the ease of obtaining a large volume. In addition, many of the vegetable wholesalers are Ugandans who have good connections with vegetable buyers and producers in Uganda.
Budi, Ikotos and Talanga in Eastern Equatoria State, the Hills and Mountains zone, are situated in high altitude areas suitable for vegetable production due to favourable rainfall and cool temperatures. However, vegetable production is not actively practiced by local farmers. In the Torit market, the nearest major market, most vegetables, e.g., tomato, onion, cucumber, carrot, cabbage and potato, come from Kenya and Uganda and only some vegetables (e.g., okra and green leafy vegetable) are locally produced near the market. Through interviews with state and county officials, and some retailers in the market, the following reasons hindering vegetable production were confirmed: Road conditions are very poor especially during the rainy season, which is the main
season for vegetable production, so it is not easy for vegetable producers to transport their products from farms to markets. Large trucks cannot use the roads, so small trucks are used to carry relatively small amounts, which makes prices higher.
Security conditions in some areas are not good; some farmers and traders hesitate to bring products to markets.
Due to poor roads, insecurity and less traders/middlemen, local farmers have little incentive to produce vegetables for sale. In addition, local farmers are not well organised to consolidate their products, due to less demand from traders/middlemen.
The abovementioned challenges in promoting vegetable production in higher elevation areas in the Hills and Mountains zone are similar to those in the Greenbelt zone. Potential areas in the Hills and Mountains zone are less developed for commercial vegetable production compared to Yei and Morobo. It seems that road conditions in these areas are much poorer, and Juba, the biggest market in the country, is much farther from the production areas. In addition, insecurity and low population density might affect the development of vegetable production. Peri-urban vegetable production is also common. Since fresh green leafy vegetables are commonly eaten as side dishes with local meals, demand is very high especially in urban areas. Some farmers, inside and around cities and towns, grow these vegetables on a small scale. Prices are much higher in the dry season than the rainy season, so some farmers near water sources (e.g., rivers, small streams, shallow wells and boreholes) try to grow them throughout the year. Mainly female farmers do this. During the situation analysis, the CAMP Task Team found that NGOs supported women’s groups in small scale vegetable production with simple irrigation facilities. Success in this activity is for the following reasons:
Demand for green leafy vegetables, such as Jew’s mallow, amaranths and sukuma wiki (local kale), is very high in towns, so farmers can find markets easily.

10-41
Since the harvesting cycles of these vegetables are relatively short, farmers can grow them several times in a year. If a farmer manages his farm well, he can harvest and send to market almost every day. Such farmers can obtain a daily cash income, which is important for household management. Farmers can obtain a relatively larger income from major crop production a few times a year, while peri-urban vegetable production provides frequent income which might fulfil the daily cash needs of households.
This is very intensive and profitable farming, thus, the impact of irrigation is high. If NGOs, financial service providers or governments support the initial costs for developing small irrigation facilities, operation and maintenance costs might be met by the frequent cash income. Some NGOs already support this type of activity.
For vegetable production, it is not necessary to have a large farm which makes it suitable for female farmers. In addition, women tend to manage daily cash income properly since they are used to managing daily household expenses.
10.6.2.2 Perennial cash crops
Due to favourable precipitation patterns, temperatures and soil conditions, some areas of South Sudan have high potential for perennial cash crop production, such as fruit, coffee, tea and oil palm. However, commercial farming of these crops is rarely found. Regarding fruit, mangos are grown in many places in the country which are sold in local markets but their quality is not of an international level due to the fibrous nature of the fruit. Citrus fruit (e.g. lemons and oranges), guavas, papayas, passion fruit, avocados, jackfruit and bananas are grown in the Greenbelt zone and part of the Hills and Mountains zone. These are mainly grown for home consumption and only a small quantity is sold in markets, although a large volume is imported from Uganda. Coffee is grown in the Greenbelt and Hills and Mountains zones on a small scale. According to an officer of the Horticultural Department of the national ministry, commercial coffee production began about 30 years ago. Although arabica coffee has higher values due to its taste and aroma, most of the coffee producers grow robusta coffee, since arabica coffee is more susceptible to diseases such as coffee berry disease and leaf rust disease. However, the officer believes that arabica coffee varieties with disease resistance could grow in the areas where robusta coffee grows. Some private companies from foreign countries are interested in coffee production in South Sudan.253 In the international market the price of coffee beans has fluctuated, but has remained at a relatively high level. In October 2013, the price of arabica coffee was more than 40% higher than robusta coffee. Neighbouring countries, such as Ethiopia and Uganda, are rapidly expanding their production, while the production of Kenya and Tanzania has stagnated. The producer’s price for green coffee beans was USD 5,011 per ton in Kenya and USD1,372 per ton in Rwanda.254 During the CAMP situation analysis, a 50kg bag of green coffee beans, probably robusta coffee, was sold for SSP500 at a shop (retail price), which is equivalent to USD3,436 per ton.255 It seems that the price of South Sudanese coffee is more competitive than Kenyan. However, coffee price is greatly affected by quality, varieties and brands, so competitiveness and the potential of coffee production should be examined considering these factors.
253
Sudan Tribune. 21 July 2013. Swiss firm eyes South Sudan for coffee production.
http://www.sudantribune.com/spip.php?article47343 (accessed on 5 August 2013) 254
Sources: FAO Stat http://faostat.fao.org/ (accessed on 6 October 2013) 255
Exchange rate is USD1 = SSP2.91 (JICA exchange rate as of August 2013)

10-42
Figure 10-18: Price trend of coffee in the international market
Figure 10-19: Production of coffee beans (green) by country
Note: data converted from US cents/pound to USD/Mt Source: International Monetary Fund (IMF). http://www.imf.org/external/np/res/commod/index.aspx (accessed on 7 October)
Sources: FAO Stat http://faostat.fao.org/ (accessed on 6 October 2013)
Tea production in the Greenbelt and Hills and Mountains zones also has potential. In 1983 the EU started a tea production project in Upper Talanga, Eastern Equatoria State, the Hills and Mountain zone, but it stopped due to the second civil war. Tea plants from the project period are still growing which implies that the weather and soil are suitable for tea production. Some farmers around the tea plantation harvest tea for home consumption. Large scale sugar cane production was planned in Mongala, Central Equatoria State in 2011. A private company was willing to provide SSP 270,000 for an initial investigation on the potential of a sugar cane plantation and sugar factory. However the investigation did not happen due to land and political issues which highlights that land acquisition is a crucial factor for large scale agricultural developments such as plantations. To promote foreign investment for such developments, a favourable environment, including clear land acquisition processes, must be created. Oil palm in Western Equatoria State and some nuts (e.g., cashew and shea nuts) in the Greenbelt and Ironstone Plateau zones might have high potential, although only limited information on these crops is available. In general, perennial cash crop development requires relatively large scale investments and strong international market linkages. More detailed investigation needs to be done to understand suitability of weather and soil types for target crops; international market price trends; potential for processing and required quality; possible international markets; and means and cost of transport.
10.6.2.3 Other cash crops
Not only perennial cash crops but also annual cash crops, such as sesame, groundnuts, sunflower, cotton and some fruit (e.g., pineapple and watermelon) are potential agricultural products. Sesame is a potential crop for export. Recently, the producer’s price for sesame seeds in Ethiopia and Sudan is comparatively high (Figure 10-20) because international prices are high. Before independence, the former Sudan was one of the largest exporters of sesame in the world. Figure 10-21 shows the sesame production trends of the large producers in Africa. The former Sudan was the top producer of sesame in Africa until 2009. Tanzania and Ethiopia rapidly increased sesame produce in the last decade and, in 2012, their output exceeded that of Sudan. Sudan became the fourth largest producer in Africa.
0
1,000
2,000
3,000
4,000
5,000
6,000
7,000
8,000
1980 1983 1986 1989 1992 1995 1998 2001 2004 2007 2010 2013
USD/Mt
Coffee (Arabica) Coffee (Robusta)
0
50,000
100,000
150,000
200,000
250,000
300,000
350,000
400,000
1980 1983 1986 1989 1992 1995 1998 2001 2004 2007 2010
Mt
Ethiopia Kenya Rwanda Uganda Tanzania

10-43
Figure 10-20: Producer price trend of sesame seed by country
Figure 10-21: Production of sesame seed by country
Sources: FAO Stat http://faostat.fao.org/ (accessed on 6 October 2013)
Sources: FAO Stat http://faostat.fao.org/ (accessed on 6 October 2013)
Some other oil seeds, such as sunflower and groundnuts, also have potential for export. The international price of sunflower oil has increased since 2008. In Tanzania the production of sunflower seeds has increased rapidly and Tanzania is now the twelfth largest producer in the world.256 Previously, sunflower were cultivated in large mechanised schemes in the north-eastern part of the country, especially in Renk County, under the supervision of the Sudanese government. Irrigated cotton was also grown in these schemes. Both cotton and sunflower seeds might be alternative cash crops to sorghum which is seriously damaged by birds (Quelea quelea); however, competitiveness of price and quality in international markets need to be examined carefully. Oil seeds might also be suitable as raw materials for vegetable oil production for domestic consumption; a large volume of vegetable oil is imported from neighbouring countries. This may be possible with relatively small investment and residues of vegetable oil production could be utilised as feeds for livestock, but production costs should be examined carefully for comparison with imported vegetable oil.
Figure 10-22: Price trend of sunflower oil in the international market
Figure 10-23: Production of sunflower seeds by country
Source: International Monetary Fund (IMF). http://www.imf.org/external/np/res/commod/index.aspx (accessed on 7 October)
Sources: FAO Stat http://faostat.fao.org/ (accessed on 6 October 2013)
256
Sources: FAO Stat http://faostat.fao.org/ (accessed on 6 October 2013)
0
200
400
600
800
1,000
1,200
1,400
1,600
1,800
1992 1995 1998 2001 2004 2007 2010
USD/Mt
Ethiopia Sudan (former)
0
50,000
100,000
150,000
200,000
250,000
300,000
350,000
400,000
450,000
500,000
Mt
Ethiopia Nigeria Sudan (former)
Uganda Tanzania
0
500
1,000
1,500
2,000
2,500
1980 1983 1986 1989 1992 1995 1998 2001 2004 2007 2010 2013
USD/Mt
0
100,000
200,000
300,000
400,000
500,000
600,000
700,000
800,000
900,000
Mt
Sudan (former) Uganda Tanzania

10-44
Some annual fruit crops, such as pineapples and watermelons, are grown in the Greenbelt zone. Demand is high but most are imported, so there are opportunities to replace imported with domestic.
10.6.3 Economic considerations for cash crop production
10.6.3.1 Potential
As mentioned above, there is great potential for cash crop production in South Sudan due to favourable natural resources (e.g., rainfall, temperature and soil types). Two types of opportunity are identified: 1) Replace imported agricultural products with domestic products for domestic consumption, such as vegetables, some fruit and oil seeds for vegetable oil production. Substituting local agricultural products for imported would reduce import expenditures. 2) Export for international markets. Coffee, tea, sesame, cotton, nuts and oil palm are potential products for export, which might contribute to sustainable economic growth.
10.6.3.2 Constraints
Major constraints are high labour costs, limited service delivery by the government, poor basic infrastructure and an unfavourable environment for investment. Table 10-24 shows details of these constrains. A detailed explanation is made in the following sections (mainly in 10.7 Marketing and trade and 10.8 Services).
Table 10-24: Constraints for cash crop production
Constraint Details
High labour costs
Compared to neighbouring countries, labour costs are high due to the strong South Sudan currency. Other possible causes of high labour costs are (1) high prices of domestic products, including labour costs, caused by oil exports and (2) insufficient labour for farming in rural areas due to low population density and unpopularity of farming work with young people.
High labour costs cause higher production costs which reduce competitiveness in international markets.
Limited service delivery
Both national and state governments deliver very limited services to farmers. Farmers rarely get access to technical knowledge and skills for cash crop production.
Basic research for annual and perennial cash crops is seldom done. Thus, new technologies for cash crop production are not developed for farmer beneficiaries.
Rural financial services are also limited, though farmers often need seed capital to start cash crop production.
Limited agricultural inputs
It is difficult for farmers to get access to improved seeds, fertilisers, agro-chemicals and other agricultural materials because of the very limited number of agro-dealers.
Prices of these inputs are high since all are imported.
Poor basic infrastructure
Interstate and other primary road networks are not well maintained; some are not passable during the rainy season which makes transport costs higher.
Since the condition of feeder roads is extremely poor, collection of products from production areas is difficult and costs become very high.
Public electricity services are very limited, most is produced using private generators, which makes electricity very expensive. Processing factories for cash crops might face the same situation.
Land acquisition
Land acquisition processes are often influenced by local politics and traditional arrangements. The high uncertainty of land acquisition is a serious factor that makes foreign investors hesitate to make large scale investments.
Multiple taxation
Legal and illegal multiple taxation is one of the causes of higher commodity prices. In addition, transaction costs become high due to frequent application.
Rates of taxes are often changed without notice.

10-45
Constraint Details
Foreign merchants
Many foreign merchants work in major markets in South Sudan. They have very strong connections with people in their home country and can easily make arrangements for collection, transport and import of agricultural products. It is difficult for South Sudanese merchants to have this kind of linkage with foreign producers.
Source: Interviewed by CAMP crops subsector team, April to June 2013, CAMP Situation Analysis
10.7 Marketing and trade
10.7.1 Characteristics of markets
In South Sudan, there are major markets available in the capital town of each state and sometimes, there are several large markets in major towns. Local markets are also available in rural towns and villages. Normally, markets are structured with both permanent and temporary stores. Wholesalers tend to operate in permanent stores, while retailers tend to operate in temporary stores. In each large town, there is a main market which operates throughout the year. In some large towns such as Juba, Yei, and Aweil, there are more than two markets. These markets function as local markets but also as waypoints to bring products to other areas. A variety of products are available, but many of them are imported. Not many locally processed foods are present except maize flour, cassava flour and wheat flour. Characteristics of some major markets in each state are presented in Table 10-25 based on the survey results of the CAMP Situation Analysis.
Table 10-25: Characteristics of major markets in each state
State Markets surveyed Majority of merchants at market(s) Number of merchants/size
of markets
Central Equatoria State (CE)
Konyokonyo, and Jebel Markets in Juba, and Main markets in -Yei, -Morobo, -Lainya, -Kajokeji, Counties
- The majority of merchants at Konyokonyo market are Sudanese.
- The majority of merchants at main markets in Kajokeji, Yei, and Lainya Counties are South Sudanese retailers.
- Majority of merchants engaged in Morobo County main market are South Sudanese traders.
Information not available
Western Equatoria State (WE)
Main markets in -Yambio, -Nzara, -Maridi Counties
- The majority of merchants at Yambio and Maridi Central Market are South Sudanese retailers.
- Total number of wholesalers and retailers at Yambio Central Market is about 425.
- The markets in Yambio and
Maridi are larger than the one in Nzara.
257
Eastern Equatoria State (EE)
Main markets in -Magwi, -Torit Counties
- The majority of merchants at Torit Main Market are Ugandans and Kenyans.
Information not available
Western Bahr el Ghazal State (WBG)
Main markets in Wau County - Jou market - Hajer market - Wau market
- More than 90 % of merchants are wholesalers.
- Majority of the traders, wholesalers, and retailers are Sudanese.
- Estimated total number of merchants is about 2,000.
Northern Main markets - Majority of merchants are Sudanese - Estimated total number of
257
WFP/VAM, March 2013. Western Equatoria State, Rapid Market Assessment Report in Western Equatoria
State. Juba.

10-46
State Markets surveyed Majority of merchants at market(s) Number of merchants/size
of markets
Bahr el Ghazal State (NBG)
in -Aweil Centre, -Aweil East Counties
wholesalers at Aweil main market. - Majority of merchants are South Sudanese domestic traders and retailers at market in Aweil East.
merchants in Aweil main market is about 3,000.
- Estimated total number of merchants at main market in Aweil East is about 1,200.
Warrap Main market in -Kwajok
- Majority of merchants are Sudanese at main market in Kwajok.
- Estimated total number of merchants is 200.
Lakes Main market in -Rumbek Centre
- Majority of merchants at Rumbek and Rumbek East Markets are Ugandan retailers.
- There are also large proportions of Kenyan and Sudanese merchants at the markets.
Information not available
Unity -Bentiu main market and
-Rubkona Market
- Majority of merchants at the market in Bentiu Main and Rubkona Market are South Sudanese retailers.
- Substantial numbers of Sudanese merchants exist at both markets.
Information not available
Jonglei Main market in -Bor
- Majority of merchants at the main market in Bor are Sudanese retailers. However, there are significant proportions of foreign retailers such as Ugandan, Ethiopians, Kenyans, and Eritrean retailers.
Information not available
Upper Nile
Main market in -Malakal -Renk
- Majority of merchants of Malakal Main market and a main market in Renk are Sudanese retailers.
Information not available
Sources: Farmers, market authority, wholesaler/retailer, trader, crop subsector questionnaires, ten states, April to June 2013, CAMP Situation Analysis.
Different actors play different roles in a market. They are traders, middlemen, wholesalers, retailers, and market authority. Collectively traders, middlemen, wholesalers and retailers are referred to as merchants. Characteristics of each player are explained in Table 10-26.
Table 10-26: Key players in market and their roles
Players Descriptions of their Roles
Traders (Importers)
They normally bring agricultural products from outside of a market. They may bring products from foreign countries or other states in South Sudan. Traders are also commonly called importers. Traders are either South Sudanese or foreigners such as Ugandan, Sudanese, Kenyans, etc.
Middlemen They buy agricultural products from traders and sell them to a wholesaler or a retailer at a market. Middlemen do not own stores at a market but own a storage facility. They purchase large volumes of agricultural products from traders and stay at a market. This is one example of middleman. There might be a different type of middleman who visits farms and purchases products by themselves to sell them to wholesalers and retailers.
Wholesalers They own a store in or close to a market and sell products in bulk to retailers and to other wholesalers. They tend to deal in cereal products because these products are non-perishable and can be stored for a longer time. Some wholesalers cross the border of South Sudan to purchase agricultural products in bulk and bring them back themselves.

10-47
Players Descriptions of their Roles
Retailers They buy products either from wholesalers, middlemen, or traders directly. They rent a small space at a market and pay a small amount of market fees on a daily basis. When farmers bring their products to markets, normally, they either sell their products to middlemen or retailers directly. It depends on their relationships.
Market authority They control usage of a market space and collect fees from merchants at the market. They are also responsible for maintaining security and a hygienic environment at the market. Often, the market authority is operated by the payam government office, but sometimes, the chamber of commerce plays the role of market authority. The arrangement of a market authority is different by area.
Source: Farmers, market authority, wholesaler/retailer, trader, crop subsector questionnaires, ten states, April to June 2013, CAMP Situation Analysis.
The types and numbers of merchants at the surveyed markets are presented in Table 10-25. A typical relationship of key players and flow of products is described in Figure 10-24.
Figure 10-24: Key players and relationships
Source: Trader and wholesaler/retailer, crop subsector questionnaires, Yei, Yambio, Maridi, Bor, Torit, Wau, Kwajok, Aweil, Malakal, Renk, Guit, April to June, 2013, CAMP Situation Analysis.
The above figure demonstrates a typical flow. However, some wholesalers cross the border to bring agricultural products back to their home town to sell to customers or retailers. Importers may sell agricultural products directly to wholesalers or retailers. In many major markets in different states, foreign merchants are found. They know farmers, brokers, associations, wholesalers and traders in their own countries and so have an advantage. Across the country, substantial numbers of agricultural products are imported from other countries, but more products are grown locally and sold at nearby markets. For example, beans, onions, tomatoes, green peppers, potatoes and cabbage are brought from local areas and from nearby counties to Yei River County. According to an agro dealer in Yei, in the last three years, more agricultural products are grown locally and sold in local markets.258 A market authority at the Yei Main market mentioned that about 50% of cassava, maize and groundnuts are locally grown.259
258
Agro Dealer, interviewed by CAMP crops subsector team, Yei, 13 April 2013, CAMP Situation Analysis. 259
Trader, questionnaire, Yei, 11 April, 2013, CAMP Situation Analysis.
Retailers
Consumers
Farmers in foreign countries
Importers Farmers in South Sudan
Domestic Traders
Middlemen
Wholesalers

10-48
Vegetables are in high demand and normally sell at higher prices than cereal crops. More farmers have realised this and started to grow them. Farmers, who bring their products to market, know the prices of agricultural products through radio programmes and their friends. Some farmers try to sell their products when the price is high but it is difficult to time the harvest. There are several issues commonly identified through the situation analysis. Safety at markets is a challenge. Theft is common. In addition, most buildings at markets are fire hazards. These factors negatively influence the viability of a market.
10.7.2 Domestic distribution chain
In South Sudan, a variety of agricultural products is sold at market and most of them are brought from areas surrounding the markets. Very limited quantities are brought from other states. This characteristic is stronger in the northern parts of the country. Thus, domestic agricultural products tend to be consumed locally whereas the majority of imported products are distributed nationally. Exceptions are identified in some cases such as groundnuts grown in Lakes State and brought to Juba, CE and Wau, NBG. Characteristics of available products and distribution chains are different by state. Identified local products sold at markets and major distribution chains of the ten states are described in Table 10-27.
Farmers living close to a market bring their products to the market to sell directly to retailers and wholesalers, so avoiding middlemen. Farmers obtain price information about their products and try to sell when prices rise. Trade and distribution routes are basically the same throughout the year, but in some areas such as Upper Nile State, supply routes change between the dry season and the rainy season. In the dry season, many traders bring agricultural products from Sudan and Ethiopia by road. In the rainy season, some traders use a boat to bring agricultural products from Juba. The frequency of supply decreases in the dry season and cost of delivery becomes higher in the rainy season.
Table 10-27: Identified local products and major distribution chains for ten states
State Identified local crops Origin(s) and distribution chains of products sold in the state
CE -maize, -sorghum, -cassava, -tomato, -okra, -green pepper, -onion, -amaranthus, -Jew’s mallow, -beans, -groundnuts, -cowpeas, -potato
- Maize, raw cassava, sorghum, groundnuts, and beans are grown in Yei, Lainya, and Morobo Counties and sold at markets in all of these counties.
- Dry cassava is made in Kajokeji County and sold at surrounding markets.
- Cassava is brought from Morobo and Yei to Juba. - Some beans and vegetables such as onions are brought
from Morobo and Yei to Lainya Counties.
WE -maize, -sorghum, -cassava, -rice, -groundnuts, -sesame, -finger millet, -okra, -sweet potato -pineapple
- Groundnuts are supplied from Rumbek to market in Maridi.
- Sorghum is brought from Maridi to Juba, Yei, and Rumbek a
- Maize is grown in many parts of the state and brought to the same towns as mentioned above.
EE -maize, -sorghum, -cassava, -sesame, -cowpeas, -Jew’s mallow, -eggplant, -okra, -amaranthus
- Many products such as maize, cassava, groundnuts and sesame are brought from Magwi County
- Cassava, Jew’s mallow, eggplant, cowpeas, okra and amaranthus are grown and sold inside of the state.
WBG -sorghum, -wheat, -groundnuts, -eggplant, -okra,
- Maize is brought from Ezo in WE. - Groundnuts, eggplants, okra, and tomatoes are grown in

10-49
State Identified local crops Origin(s) and distribution chains of products sold in the state
-tomato, -onions, -lentil, -cowpeas
Wau County and brought to market.
NBG -sorghum, -groundnuts, - sesame,
-riceb, -eggplant,
-green pepper, -okra
- Dried okra and groundnuts are brought from Meram and Warawar in NBG.
Warrap -sorghum, - sesame, -Jew’s mallow, -okra, - groundnuts, -tomato
- Sorghum, okra, Jew’s mallow, and tomato are grown in Kwajok and sold at nearby markets.
Lakes -sorghum, -millet, -groundnuts, -Jew’s mallow, -tamaliga
- Sorghum is grown in Rumbek East and sold at the Main Market in Rumbek.
- Groundnuts, Jew’s mallow, tamaliga are grown in Cuebit County and Rumbek North County. These are sold at market in Rumbek.
- Groundnuts are supplied to markets in Juba (CE) and Wau (WBG).
Unity -sorghum, - maize -cowpea, -pumpkin, -Jew’s mallow, -okra
- Farmers grow some varieties of products. They do not bring them from outside of the state.
- Many farmers grow pumpkin, but these are for home consumption.
Jonglei -sorghum, -groundnuts, -cowpeas, -maize, -sesame, -okra, -pumpkin, -onion, -rocket
- Most of agricultural products are grown locally and brought to local markets.
- Some agricultural products are brought from other parts of the country.
Upper Nile -sorghum, -finger millet -maize, -sesame, -onion, -tomato, -okra, -cotton, -rocket, -Jew’s mallow
- Many agricultural products are grown and brought to local markets.
a FEWSNET. 2012. Production and market flow maps: South Sudan First Season. Sorghum. Juba. FEWSNET.
2011. Production and market flow maps: South Sudan First Season. Maize. Juba. b
There is the Aweil rice scheme in Northern Bahr el Ghazal, and 22 varieties of rice are grown.
Sources: Farmers, market authority, wholesaler/retailer, trader, crop subsector questionnaires, ten states, April to June 2013, CAMP Situation Analysis.
10.7.3 Imported agricultural products
Large amounts of agricultural products are imported. In the southern parts of the country such as the Equatoria states, they come from Uganda, Kenya and the Democratic Republic of the Congo (DRC). In the north western part, main sources are Sudan and Uganda. In the north eastern part, Sudan, Ethiopia and Juba are main sources. In Table 10-28, identified origins of imported products at markets in each state are described.
Table 10-28: Origins of imported agricultural products by state
State Origin(s) of Imported Products CE - Cabbage, tomatoes and potatoes are from Uganda.
- Substantial amounts of cereals are from Uganda such as maize, sorghum and wheat.
WE - Rice, maize flour, red yellow beans come from outside the country, e.g.,Uganda. EE - Many agricultural products are from Uganda. (e.g. sorghum, maize, beans,
onions, cassava)

10-50
State Origin(s) of Imported Products
- Kenya is another source of agricultural products such as onions and potatoes. WBG - Cabbage, tomatoes and potatoes are from Uganda.
- Substantial amounts of cereals are from Uganda such as maize and sorghum. - Wheat is from Sudan.
NBG - Many products are from Sudan. (e.g. tomato, onion, and potato) Warrap - Maize, maize flour and sorghum are from Uganda. Lakes - Major imported agricultural products such as maize, onion, tomato, green
peppers, carrot, and cabbages are brought from Uganda. Remaining imported products come from Kenya and Sudan.
- Many agricultural products such as onion and sorghum come from Sudan, but many cereals are also brought from Uganda.
Unity - Many agricultural products such as sorghum, wheat flour and onion are from Sudan.
Jonglei - Most agricultural products come from Sudan and Uganda through Malakal and Juba.
- In the eastern part of the state, food products are supplied from Ethiopia. Upper Nile
- Sudan and Ethiopia are the main sources of agricultural products, especially in dry season.
- During rainy season, the road conditions become bad and more products are brought from Juba using boats.
Sources: Farmers, market authority, wholesaler/retailer, trader crop subsector questionnaires, ten states, April to June 2013, CAMP Situation Analysis., FEWS NET. July 2013. South Sudan Price Bulletin. Juba.
Uganda is a major supplier of imported products but in the northern part of South Sudan, Sudan and Ethiopia are the main sources. In Central Equatoria, Kaya-Morobo-Yei-Juba is one major route, and Nimule-Juba is another, used to transport products from Uganda to Juba. After arriving in Kaya, some products are brought to Maridi and Yambio. In Western Equatoria, imported products are brought to Yambio and Ezo, where they can be transported further to either Wau or Juba. In Eastern Equatoria, the road to Torit is the major route for imported products. After arriving in Torit, products continue to Juba or other towns in Eastern Equatoria. In the north western part of South Sudan, the main route from Sudan goes to Warawar. Imported products continue to Aweil or Kwajok. After Aweil, some continue further to Wau and even to Rumbek. In the north eastern part of South Sudan, products are imported from Sudan through Renk to Malakal or from Ethiopia to Malakal. Products are also brought from Sudan to Bentiu. After arriving in Malakal, imported products can continue to Rumbek, Bor and other towns. Products imported into Juba are not transported to towns in Central and Western Equatoria. It is assumed that there are enough products (local and imported) available in these areas. Major flows of imported agricultural products are demonstrated in Figure 10-25.

10-51
Figure 10-25: Major flows of imported agricultural products in South Sudan
Source:http://www.google.co.jp/search?q=South+Sudan+road+map&tbm=isch&tbo=u&source=univ&sa=X&ei=OqQBUuDVDZHbkgXr0oDQAg&ved=0CCkQsAQ&biw=1143&bih=542#facrc=_&imgdii=_&imgrc=ubgxKYnbyRvJUM%3A%3BMys3I95uKZS1M%3Bhttp%253A%252F%252Fmapsof.net, FEWSNET, Production and Market Flow Maps: South Sudan First and Second Season Sorghum, First and Second Season of Maize, Trader and wholesaler/retailer, crop subsector questionnaires, Yei, Yambio, Maridi, Bor, Torit, Wau, Kwajok, Aweil, Malakal, Renk, Guit, April to June, 2013, CAMP Situation Analysis.
10.7.4 Product price and cost
Generally, the origin of products is one of the major factors which affect prices. One case observed in Western Bahr el Ghazal (WBG) State demonstrates that prices of imported products are higher than locally grown products. Table 10-29 shows the difference in prices of local and imported maize. The reasons for the higher prices of imported products will be explained later.
Table 10-29: Selling prices of locally grown and imported maize in Wau, Western Bahr el Ghazal State
Type of Products Local Products Imported Products
Items
High Low High Low
Maize
Price SSP 3/kg SSP 2/kg SSP 4/kg SSP 3/kg
Season August 2012 February 2013 May-Aug.
2012 Feb.-May 2013
Sources: Trader, crop subsector questionnaires, Wau, May 2013, CAMP Situation Analysis. Price gaps are identified not only between local and imported products but also between different seasons. The above table shows that there is a clear price gap between the high season and low season. During the period before the harvest (May-August), prices tend to

10-52
be high; after the harvest (February-March), prices become lower. Prices are affected by the availability of products. Geographical differences contribute to the price gaps. In the northern parts of the country, prices of agricultural products tend to be higher than those in the souths; prices in rural areas are generally higher than urban areas. Major costs for wholesalers and retailers are transportation costs, taxes, labour costs for on-loading and off-loading. These costs affect the price of agricultural products. High costs for all these items are found in all states.
Table 10-30: Market fees at major markets
Market Market fees
Yei Main market (CE)
Permanent stores at the market need to pay SSP 300 per month. Retailer needs to pay SSP 25-50 for inside shelter per month to the market. Retailer needs to pay SSP 1.0 for open floor per day to the market.
Yambio Central market and Mundri West market (WE)
Wholesaler needs to pay from SSP 500 to SSP 1,500 to the Market Authority depending on size and location of store. Retailers need to pay SSP 2.0 per sack and/or SSP 20 monthly to the town council.
Torit Main market (EE)
Retailers pay SSP 500 per month as a market fee.
Wau Main market (WBG)
Permanent merchants need to pay SSP 3,000 per month, semi-permanent merchants need to pay SSP 1,000 to the market authority.
Aweil Centre market (NBG)
Permanent merchants need to pay SSP 400 to 1,500 monthly to a market authority. Merchants need to pay SSP 2,000-2,500 monthly to a market authority.
Kwajok market (Warrap)
Permanent merchants at main market need to pay SSP 500-1,700 monthly, and semi-permanent merchants need to pay SSP 300-600 monthly to a market authority.
Rumbek Main market (Lakes)
Merchants need to pay SSP 30-200 as a monthly market fee.
Guit market (Unity)
Merchants need to pay SSP100-310 monthly to the market, depends on size they occupy.
Bo Central market (Jonglei)
Merchants on the main market roads need to pay SSP 600 monthly to the shop owner and those inside the market pay SSP 300 per month. Amount changes depending on location of shop.
Malakal Main market (Upper Nile)
Merchants need to pay from SSP 220 to SSP 1,000 monthly depending on size of place they rent.
Sources: Farmers, market authority, wholesaler/retailer, trader, crop subsector questionnaires, ten states, April to June 2013, CAMP Situation Analysis.
As shown in Table 10-30, market fees paid to the market authority vary by market. Permanent merchants and wholesalers pay more to market authorities than retailers. Some market authorities charge a fee for each sack that traders and wholesalers bring into the market. These costs are a major burden to merchants. In addition to market fees, there are other costs such as transportation, labour, taxes, etc. How all these costs add up and how they may influence business needs to be examined more. One example of a wholesaler’s cost for the domestic trade of maize between Morobo and Yei is presented in Table 10-31.

10-53
Table 10-31: List of costs for domestic trade from Morobo to Yei River County, CES
Cost items Charges
(SSP per bag) Remarks
Transportation 25 • 1 bag is 100 kg. • The wholesaler buys about 10 bags
per week from farmers and • Cooperatives in Morobo County. • Amount of county tax differs by type
of crop.
Labour (on and off loading) 5
County tax in Morobo 2
County tax in Yei 5
Intermediate cost (fee for a middleman)
10
Market fee 5
Total 52 Source: Wholesaler/retailer, crop subsector questionnaire, Yei, 13 April 2013, CAMP Situation Analysis.
According to the wholesaler interviewed, there are other costs such as the rental fees for the store and storage, salaries for employees, and other bills including electricity and water; profit per bag of maize is about SSP 25 so net profit is not much. Transportation costs can be assumed to be higher for longer distances, so domestic products tend to be traded over short distances. The costs for imports can be even higher. The prices of agricultural products in Uganda and Juba are significantly different. One set of data indicates that the price of maize in Juba is three times higher than that at three Ugandan transport hub cities, Arua, Odramachaku and Mbarara. Beans are twice as expensive in Juba as in these three cities.260 After crossing the border into South Sudan, the unit cost for transportation is roughly 1.4 times higher.260 The main reason for the higher cost in South Sudan is considered poor infrastructure. Transportation costs are a major cost for traders. An example is introduced to estimate the influence of transportation costs on prices. As shown in Table 10-32, if the transport cost in South Sudan declines from USD 0.65 per ton/kilometre to USD 0.33 per ton/kilometre, maize prices in Juba and Rumbek are expected to fall by 9% to 20%. Sorghum prices in major markets are expected to fall by 30%.
Table 10-32: Simulated impact of lower transport prices on maize and sorghum prices in South Sudan (USD/ton)
Product Maize Sorghum
Name of towns Juba Rumbek Juba Aweil
Derived cost (at transport cost of USD 0.65 per ton/kilometre)
689 964 1,285 992
Derived cost (at transport cost of USD 0.33 per ton/kilometre)
628 768 829 680
Simulated price reduction rate -9% -20% -36% -31%
Source: World Bank, 23 May, 2012. Agriculture and Rural Development Unit, Sustainable Development Department, Country Department AFCE4, Africa Region, Report No. 68399-SS, Washington D.C.
Identifying the impact of improving infrastructure requires further and thorough analysis, but the above simulation shows the relationship between transportation costs and the price of agricultural products.
10.7.5 Taxation
There are several types of taxes in South Sudan. Taxes need to be paid to Customs at the South Sudan border and to states and counties in the process of transporting agricultural
260
Yutaka Yoshino, Grace Ngungi and Ephrem Asebe, June 2011, Africa Trade Policy Notes, Notes #21.
Enhancing the Recent Growth of Cross-Border Trade between South Sudan and Uganda.

10-54
products to a destination (market). Profit tax needs to be paid periodically. Types of taxes are shown in Table 10-33. In Table 10-33, a wholesaler moving products from Morobo County to Yei River County pays county tax twice; once at the Morobo County border and again at the Yei County border. Wholesalers and retailers in Eastern Equatoria pay about SSP 500-700 per year as profit tax to the government. In the case of a retailer/ wholesaler in Western Equatoria, he pays SSP 10,000 per truck as a tax and custom fee every time he crosses the border with agricultural products. These taxes and fees are charged formally (legal) and informally (illegal or bribes). Formal and informal payments during the transit after crossing the border to Juba and to other destinations need to be made. Some examples of total payments between Kaya-Juba and Nimule-Juba are shown in Table 10-34.
Table 10-33: Type of taxes that merchants need to pay
Type of tax Person who pay Place to pay Frequency/timing to pay
Custom Trader/Wholesaler Border of South Sudan Every trip
State tax Trader/Wholesaler State border Every trip
County tax Trader/Wholesaler County border Every trip
Market use fee Trader/Wholesaler/ Retailer
Market authority Monthly
Profit taxa Trader/Wholesaler Government office at a
market Monthly or periodically
b
License fee Trader Government office at a market
Annually
Police service Trader/Wholesaler Market police Monthly a
It is called development tax or revenue tax in some areas. b
Payment period is variable. It can be paid from monthly to annually.
Source: Trader and wholesaler/retailer, crop subsector questionnaires, Yei, Yambio, Maridi, Bor, Torit, Wau, Kwajok, Aweil, Malakal, Renk, Guit, April to June, 2013, CAMP Situation Analysis.
Table 10-34: Formal and informal payments during transit between border and Juba
Route Distance Total Amount
(SSP) No. of
Payments Average Amount per Payment
(SSP)
Kaya-Juba 233 km
285 11 25.91
205 8 25.63
165 9 18.33
200 7 28.57
Nimule-Juba 193 km
145 8 18.13
205 6 34.17
135 5 27.00
285 10 28.50 Source: Yoshino, Yutaka, Grace Ngungi and Ephrem Asebe. June 2011. Africa Trade Policy Notes, Notes #21. Enhancing the Recent Growth of Cross-Border Trade between South Sudan and Uganda. Washington D.C.: World Bank.
. The figures in the above table show that the amounts and numbers of payment are different for the same route. A reason for the different numbers of payment could be that there are many informal payments after the border. In some cases, more payments were made for shorter distances. This indicates that there were no strict rules about where and how much traders need to pay as of June 2011. In 2012, the number of collection points in the Nimule-Juba route was reduced to three after the road was paved. However, the Kaya-Juba route has not improved and this unclear taxation system may confuse traders as to how much they should prepare as payments for taxes and bribes after the border. With the data in Table 10-34, the size of a load for each trip is not given, but all traders paid over SSP 100 per trip and 5 of them paid more than SSP 200.

10-55
Table 10-34 shows that traders paid formal and informal payments 8-10 times on the Nimule-Juba route and 7-11 times on the Kaya-Juba route. This example clearly shows the multiple payments required for traders after the border of South Sudan. These multiple payments increase prices of products at markets. Through interviews with some merchants, bribes are requested by police officers at various places on the way to deliver products to market.
10.7.6 Collection and marketing capacity
One of the reasons for the large volume of foreign agricultural products in markets across the country is that local farmers lack the capacity to consolidate their harvest with other farmers to sell to a trader or a wholesaler. Consequently, wholesalers and traders tend to purchase products in bulk in foreign countries where cheaper products in bulk are available. This is a challenge for local farmers, traders and wholesalers to find new business opportunities and to make domestic products more competitive. Currently, there is no method where farmers, traders and wholesalers could meet, consolidate and negotiate among themselves to trade in larger quantities. Consolidation depends entirely on an individual trader’s personal relationships. WFP has tried to create collection points for farmers’ agricultural products and places where traders, wholesalers and farmers can meet to develop innovative purchasing solutions.261 These places also store farmers’ products. WFP also purchases domestic farmers’ products when certain criteria are met. These attempts are made with a programme titled Purchase for Progress (P4P). The Food, Agribusiness and Rural Markets (FARM) Project, supported by USAID, promotes marketing for farmers in the three Equatoria states. The project tries to create relationships between farmers and traders through providing them with appropriate product information. The project also tries to initiate business relationships between farmers and traders. These projects are good practices which support different players to create and strengthen their relationships to enhance business for agricultural products.
10.8 Services
10.8.1 Research
The principles of the Research Directorate of MAFCRD are to increase the quantity, quality and availability of technologies for the improvement of efficiency and profitability of agriculture in the country. The goal of agricultural research activities is to improve the food security of the country. Therefore, the Directorate focuses on testing and multiplying seeds of maize, sorghum, rice, cassava and tuber crops which are staple crops in South Sudan. The Research Directorate has several research partners overseas such as the Association for strengthening Agricultural Research in Eastern and Central Africa (ASARECA), Alliance for a Green Revolution in Africa (AGRA), International Institute of Tropical Agriculture (IITA), and International Crops Research Institute of Semi-Arid Tropics (ICRIST). Most of the agricultural research activities are requested and/or funded by these international research institutes or DPs. Under the supervision of the Research Directorate, there are currently two functioning research centres, the Yei Agricultural Research Centre (YARC) and the Palataka Agricultural Research Centre (PARC). Another is under rehabilitation which is the Halima Agricultural
261
WFP. Purchase for Progress (P4P) in South Sudan, Juba.
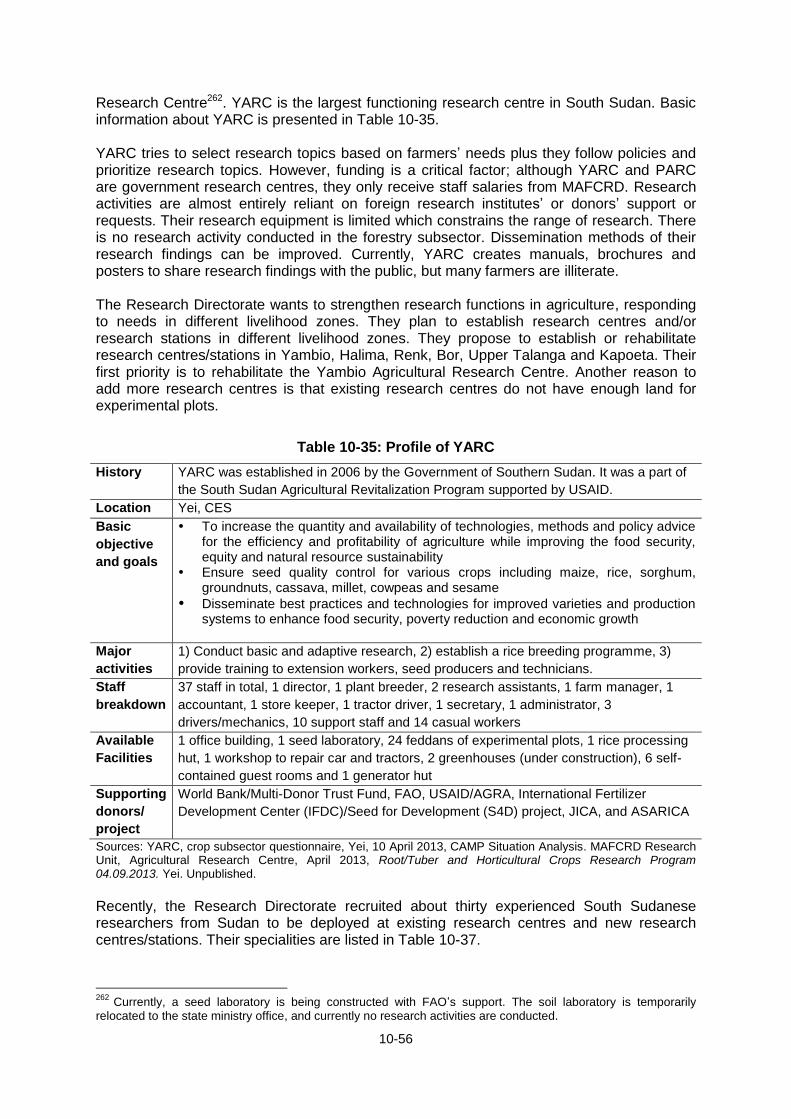
10-56
Research Centre262. YARC is the largest functioning research centre in South Sudan. Basic information about YARC is presented in Table 10-35. YARC tries to select research topics based on farmers’ needs plus they follow policies and prioritize research topics. However, funding is a critical factor; although YARC and PARC are government research centres, they only receive staff salaries from MAFCRD. Research activities are almost entirely reliant on foreign research institutes’ or donors’ support or requests. Their research equipment is limited which constrains the range of research. There is no research activity conducted in the forestry subsector. Dissemination methods of their research findings can be improved. Currently, YARC creates manuals, brochures and posters to share research findings with the public, but many farmers are illiterate. The Research Directorate wants to strengthen research functions in agriculture, responding to needs in different livelihood zones. They plan to establish research centres and/or research stations in different livelihood zones. They propose to establish or rehabilitate research centres/stations in Yambio, Halima, Renk, Bor, Upper Talanga and Kapoeta. Their first priority is to rehabilitate the Yambio Agricultural Research Centre. Another reason to add more research centres is that existing research centres do not have enough land for experimental plots.
Table 10-35: Profile of YARC
History YARC was established in 2006 by the Government of Southern Sudan. It was a part of
the South Sudan Agricultural Revitalization Program supported by USAID.
Location Yei, CES
Basic
objective
and goals
To increase the quantity and availability of technologies, methods and policy advice for the efficiency and profitability of agriculture while improving the food security, equity and natural resource sustainability
Ensure seed quality control for various crops including maize, rice, sorghum, groundnuts, cassava, millet, cowpeas and sesame
Disseminate best practices and technologies for improved varieties and production systems to enhance food security, poverty reduction and economic growth
Major
activities
1) Conduct basic and adaptive research, 2) establish a rice breeding programme, 3)
provide training to extension workers, seed producers and technicians.
Staff
breakdown
37 staff in total, 1 director, 1 plant breeder, 2 research assistants, 1 farm manager, 1
accountant, 1 store keeper, 1 tractor driver, 1 secretary, 1 administrator, 3
drivers/mechanics, 10 support staff and 14 casual workers
Available
Facilities
1 office building, 1 seed laboratory, 24 feddans of experimental plots, 1 rice processing
hut, 1 workshop to repair car and tractors, 2 greenhouses (under construction), 6 self-
contained guest rooms and 1 generator hut
Supporting
donors/
project
World Bank/Multi-Donor Trust Fund, FAO, USAID/AGRA, International Fertilizer
Development Center (IFDC)/Seed for Development (S4D) project, JICA, and ASARICA
Sources: YARC, crop subsector questionnaire, Yei, 10 April 2013, CAMP Situation Analysis. MAFCRD Research Unit, Agricultural Research Centre, April 2013, Root/Tuber and Horticultural Crops Research Program 04.09.2013. Yei. Unpublished.
Recently, the Research Directorate recruited about thirty experienced South Sudanese researchers from Sudan to be deployed at existing research centres and new research centres/stations. Their specialities are listed in Table 10-37.
262
Currently, a seed laboratory is being constructed with FAO’s support. The soil laboratory is temporarily relocated to the state ministry office, and currently no research activities are conducted.
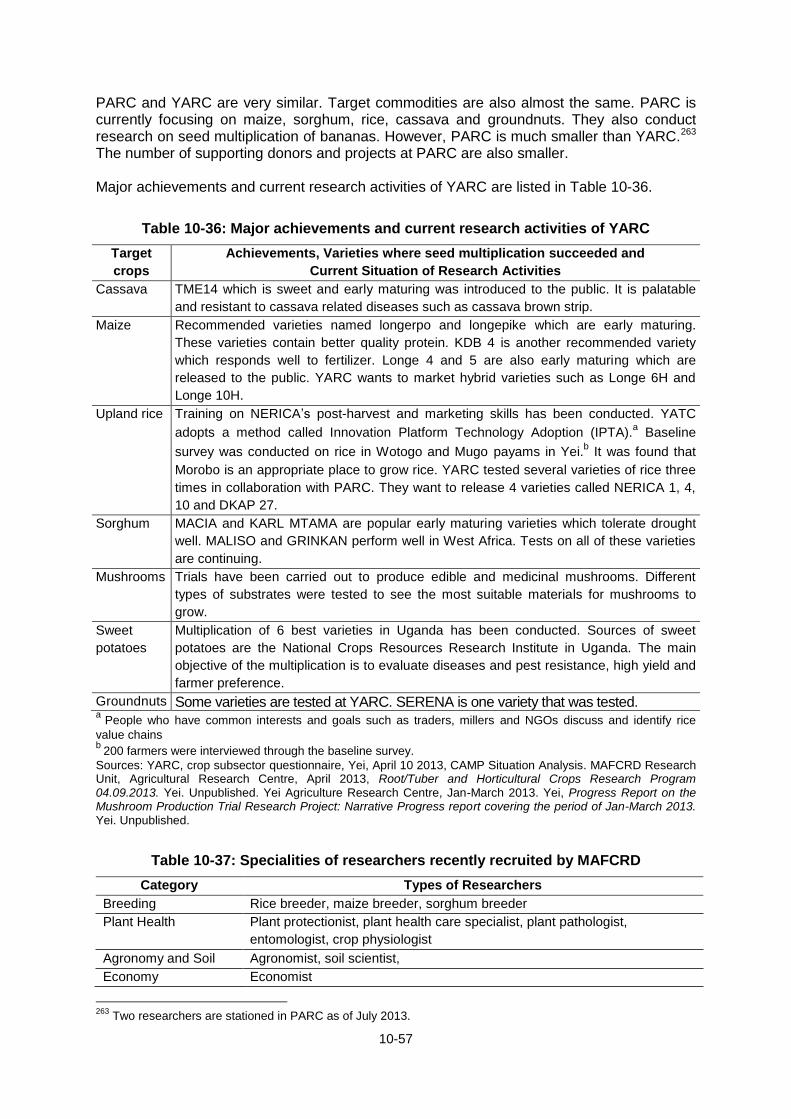
10-57
PARC and YARC are very similar. Target commodities are also almost the same. PARC is currently focusing on maize, sorghum, rice, cassava and groundnuts. They also conduct research on seed multiplication of bananas. However, PARC is much smaller than YARC.263 The number of supporting donors and projects at PARC are also smaller. Major achievements and current research activities of YARC are listed in Table 10-36.
Table 10-36: Major achievements and current research activities of YARC
Target
crops
Achievements, Varieties where seed multiplication succeeded and
Current Situation of Research Activities
Cassava TME14 which is sweet and early maturing was introduced to the public. It is palatable
and resistant to cassava related diseases such as cassava brown strip.
Maize Recommended varieties named longerpo and longepike which are early maturing.
These varieties contain better quality protein. KDB 4 is another recommended variety
which responds well to fertilizer. Longe 4 and 5 are also early maturing which are
released to the public. YARC wants to market hybrid varieties such as Longe 6H and
Longe 10H.
Upland rice Training on NERICA’s post-harvest and marketing skills has been conducted. YATC
adopts a method called Innovation Platform Technology Adoption (IPTA).a Baseline
survey was conducted on rice in Wotogo and Mugo payams in Yei.b It was found that
Morobo is an appropriate place to grow rice. YARC tested several varieties of rice three
times in collaboration with PARC. They want to release 4 varieties called NERICA 1, 4,
10 and DKAP 27.
Sorghum MACIA and KARL MTAMA are popular early maturing varieties which tolerate drought
well. MALISO and GRINKAN perform well in West Africa. Tests on all of these varieties
are continuing.
Mushrooms Trials have been carried out to produce edible and medicinal mushrooms. Different
types of substrates were tested to see the most suitable materials for mushrooms to
grow.
Sweet
potatoes
Multiplication of 6 best varieties in Uganda has been conducted. Sources of sweet
potatoes are the National Crops Resources Research Institute in Uganda. The main
objective of the multiplication is to evaluate diseases and pest resistance, high yield and
farmer preference.
Groundnuts Some varieties are tested at YARC. SERENA is one variety that was tested. a
People who have common interests and goals such as traders, millers and NGOs discuss and identify rice
value chains b
200 farmers were interviewed through the baseline survey.
Sources: YARC, crop subsector questionnaire, Yei, April 10 2013, CAMP Situation Analysis. MAFCRD Research Unit, Agricultural Research Centre, April 2013, Root/Tuber and Horticultural Crops Research Program 04.09.2013. Yei. Unpublished. Yei Agriculture Research Centre, Jan-March 2013. Yei, Progress Report on the Mushroom Production Trial Research Project: Narrative Progress report covering the period of Jan-March 2013. Yei. Unpublished.
Table 10-37: Specialities of researchers recently recruited by MAFCRD
Category Types of Researchers
Breeding Rice breeder, maize breeder, sorghum breeder
Plant Health Plant protectionist, plant health care specialist, plant pathologist,
entomologist, crop physiologist
Agronomy and Soil Agronomist, soil scientist,
Economy Economist
263
Two researchers are stationed in PARC as of July 2013.

10-58
Category Types of Researchers
Mechanization Mechanization specialist
Forestry Forestry specialist
Source: Directorate of Agricultural Research, MAFCRD, Interviewed by CAMP task team, Juba, 28 June 2013, CAMP Situation Analysis.
10.8.2 Training
See Section 5.5 Education and Training
10.8.3 Extension services
10.8.3.1 Agricultural extension services
An Agricultural Extension Officer (AEO) is a government extension officer working at state or county level. They are responsible for disseminating appropriate agricultural knowledge and techniques to farmers as well as distributing seeds and tools. Their target groups are mainly crop farmers. AEOs are responsible for supervising and supporting Community Based Extension Workers (CBEWs). If there is no AEO available in a certain area, another AEO or CBEW who works in a nearby payam would cover. An AEO is deployed in a state or county office in all the states to provide extension services. The National Agriculture and Livestock Extension Policy (NALEP) stipulates that one each AEO is to be stationed in county and payam offices.264 However, not enough AEOs are deployed in county offices. In Upper Nile State, there are three AEOs working at the state office, but no AEOs hired or deployed in county offices. It is difficult to recruit new AEOs because they do not want to work in small towns or rural areas. It is similar in other states. At the payam level, AEOs were deployed in each payam in Yei River County, Morobo County, and Lainya County in Central Equatoria State, but in other states, no AEO was found by the CAMP situation analysis. Even though the number of AEOs is smaller in Western Equatoria State (WES), Western Bahr el Ghazal State (WBG) and Upper Nile State, the total number of AEOs in each state is sufficient to cover county offices. However, the number of AEOs who provide extension services on a regular basis seems limited. Total number of AEOs and their deployment situation are shown in Table 10-38.
Table 10-38: Total numbers of AEOs and their deployment situation (as of June 2013)
State Total
number Deployment and other situations of AEOs
Central Equatoria
27 There are 5 AEOs in Juba, Yei, Lainya,a and Kajokeji Counties. 4 AEOs are in Morobo and 3 AEOs are in Terekeka County.
Western Equatoria
10 No AEOs are deployed to county offices. 5 out of 10 AEOs are seconded to NGOs or DPs as extension officers.b
Eastern Equatoria
38 Deployment situation is not confirmed yet. 3 out of 38 AEOs are seconded to NGOs and a DP.c
Western Bahr El Ghazal
7 3 AEOs are deployed to Jur River County and 4 AEOs are working at the state office in Wau.
Northern Bahr El Ghazal
15 3 AEOs are deployed at 5 counties. No AEO is deployed at payam level.
Warrap 51 30 AEOs out of 51 are deployed at 6 counties. Lakes 56 16 AEOs are deployed at 8 county offices (2 for each). The remaining
AEOs are working in the state office.
264
Government of South Sudan, Ministry of Agriculture and Forestry (MAF), Ministry of Animal Resources and Fisheries (MARF), November 2010. Final Draft National Agriculture and Livestock Extension Policy (NALEP).
Juba. Unpublished.
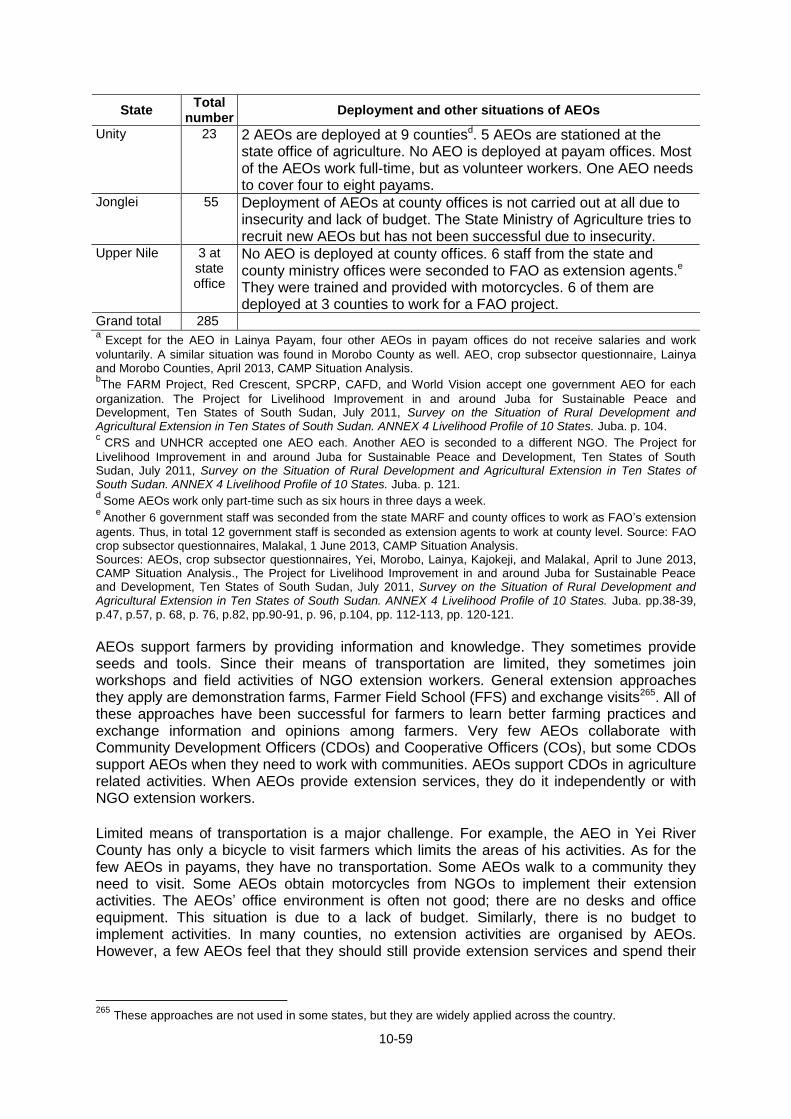
10-59
State Total
number Deployment and other situations of AEOs
Unity 23 2 AEOs are deployed at 9 countiesd. 5 AEOs are stationed at the state office of agriculture. No AEO is deployed at payam offices. Most of the AEOs work full-time, but as volunteer workers. One AEO needs to cover four to eight payams.
Jonglei 55 Deployment of AEOs at county offices is not carried out at all due to insecurity and lack of budget. The State Ministry of Agriculture tries to recruit new AEOs but has not been successful due to insecurity.
Upper Nile 3 at state office
No AEO is deployed at county offices. 6 staff from the state and county ministry offices were seconded to FAO as extension agents.e They were trained and provided with motorcycles. 6 of them are deployed at 3 counties to work for a FAO project.
Grand total 285 a
Except for the AEO in Lainya Payam, four other AEOs in payam offices do not receive salaries and work
voluntarily. A similar situation was found in Morobo County as well. AEO, crop subsector questionnaire, Lainya and Morobo Counties, April 2013, CAMP Situation Analysis. bThe FARM Project, Red Crescent, SPCRP, CAFD, and World Vision accept one government AEO for each
organization. The Project for Livelihood Improvement in and around Juba for Sustainable Peace and Development, Ten States of South Sudan, July 2011, Survey on the Situation of Rural Development and Agricultural Extension in Ten States of South Sudan. ANNEX 4 Livelihood Profile of 10 States. Juba. p. 104. c
CRS and UNHCR accepted one AEO each. Another AEO is seconded to a different NGO. The Project for
Livelihood Improvement in and around Juba for Sustainable Peace and Development, Ten States of South Sudan, July 2011, Survey on the Situation of Rural Development and Agricultural Extension in Ten States of South Sudan. ANNEX 4 Livelihood Profile of 10 States. Juba. p. 121. d
Some AEOs work only part-time such as six hours in three days a week. e
Another 6 government staff was seconded from the state MARF and county offices to work as FAO’s extension
agents. Thus, in total 12 government staff is seconded as extension agents to work at county level. Source: FAO crop subsector questionnaires, Malakal, 1 June 2013, CAMP Situation Analysis. Sources: AEOs, crop subsector questionnaires, Yei, Morobo, Lainya, Kajokeji, and Malakal, April to June 2013, CAMP Situation Analysis., The Project for Livelihood Improvement in and around Juba for Sustainable Peace and Development, Ten States of South Sudan, July 2011, Survey on the Situation of Rural Development and Agricultural Extension in Ten States of South Sudan. ANNEX 4 Livelihood Profile of 10 States. Juba. pp.38-39, p.47, p.57, p. 68, p. 76, p.82, pp.90-91, p. 96, p.104, pp. 112-113, pp. 120-121.
AEOs support farmers by providing information and knowledge. They sometimes provide seeds and tools. Since their means of transportation are limited, they sometimes join workshops and field activities of NGO extension workers. General extension approaches they apply are demonstration farms, Farmer Field School (FFS) and exchange visits265. All of these approaches have been successful for farmers to learn better farming practices and exchange information and opinions among farmers. Very few AEOs collaborate with Community Development Officers (CDOs) and Cooperative Officers (COs), but some CDOs support AEOs when they need to work with communities. AEOs support CDOs in agriculture related activities. When AEOs provide extension services, they do it independently or with NGO extension workers.
Limited means of transportation is a major challenge. For example, the AEO in Yei River County has only a bicycle to visit farmers which limits the areas of his activities. As for the few AEOs in payams, they have no transportation. Some AEOs walk to a community they need to visit. Some AEOs obtain motorcycles from NGOs to implement their extension activities. The AEOs’ office environment is often not good; there are no desks and office equipment. This situation is due to a lack of budget. Similarly, there is no budget to implement activities. In many counties, no extension activities are organised by AEOs. However, a few AEOs feel that they should still provide extension services and spend their
265
These approaches are not used in some states, but they are widely applied across the country.

10-60
own money to implement extension activities. Overall, this situation lowers the motivation of AEOs to provide extension services. Almost all AEOs are secondary school certificate holders, not graduated from a university. Most received one month of training about extension at a training centre before they were deployed. Subsequently, they have no training opportunities to update their knowledge of extension methods and subjects. They often have limited knowledge of creative and advanced extension approaches and skills, as well as of new technologies (e.g., seed varieties, tools, pest control, storage, marketing, etc.). In addition, insecurity constrains their activities. For example, in Rumbek East of Lakes State, due to a conflict situation, the AEO cannot easily provide extension services.
10.8.3.2 Rural development extension services
Community Development Officers (CDOs) work in the Department of Community Development which is a state department facilitating community development. CDOs support communities to identify problems, embark on self-help projects and build communal facilities. Raising awareness of areas such as health and sanitation and road construction is included in their responsibilities. Capacity building related to agriculture may be a part of their work, but extension work purely for an agricultural purpose is not a CDO’s responsibilities. It is a part of the reason that very few cases of collaboration have been identified between CDOs and AEOs, even though there is room for them to support each other more closely. Total numbers of CDOs are shown in Table 10-39. Numbers vary considerably between states. Central Equatoria State has the largest number and the Unity State has the smallest. In 2011, 54% of CDOs were deployed at county levels.266
Table 10-39: Total numbers of CDOs by State
Upper Nile
Jonglei Unity Warrap NBG WBG Lakes WES CES EES Total
48 12 3 29 8 13 14 11 84 30 252
Sources: Department of Community Development, crop subsector questionnaires, Yei and Malakal, April to June 2013, CAMP Situation Analysis. The Project for Livelihood Improvement in and around Juba for Sustainable Peace and Development, Ten States of South Sudan, July 2011, Survey on the Situation of Rural Development and Agricultural Extension in Ten States of South Sudan. Juba.
The CAMP situation analysis found out that community development offices own very limited or no transportation at state and county levels. This means that, even if CDOs are deployed at county offices, they cannot implement activities. CDOs have a stronger relationship with NGOs than AEOs. NGO staff, including extension workers, has better transportation and a budget for their activities. If CDOs collaborate with NGOs, they implement their activities more often and more effectively than working with AEOs. Limited budgets for transportation and implementation of activities is a serious challenge.
10.8.3.3 Cooperative development extension services
Cooperative Officers (COs) also work in the Department of Community Development. There is an office in each state which covers the entire state to support cooperatives. Main responsibilities of a CO are promoting the cooperative movement by supporting people who wish to establish, register, audit and supervise management of a cooperative. The target group is not limited to farmers but extends to any type of cooperative. Therefore, a CO performs outreach activities, but extension work for agricultural purposes is not part of his responsibilities. Normally, there is no collaboration between AEOs and COs, but some COs
266
The Project for Livelihood Improvement in and around Juba for Sustainable Peace and Development, Ten States of South Sudan, July 2011, Survey on the Situation of Rural Development and Agricultural Extension in Ten States of South Sudan. Juba. p. 54.

10-61
coordinate with NGO agricultural extension workers. Total numbers of COs in each state are shown in Table 10-40.
Table 10-40: Number of COs by state
Upper Nile
Jonglei Unity Warrap NBG WBG Lakes WES CES EES Total
30 29 4 30 24 15 25 17 55 26 255
Source: The Project for Livelihood Improvement in and around Juba for Sustainable Peace and Development, Ten States of South Sudan, July 2011, Survey on the Situation of Rural Development and Agricultural Extension in Ten States of South Sudan. Juba. p. 7.
The total numbers of COs vary from state by state. Only 28% of COs are deployed at county offices.266 Part of the reason is that COs need to support cooperative development and management in urban areas as well. However, limited budgets are another reason for this low rate. Limited budgets for operation and implementation of activities, as well as transportation, are major challenges for COs. Some cooperative offices have support from NGOs or DPs to improve the situation. For example, in Upper Nile State, the Cooperative Office was granted a fund from NPA to train 61 farmers on cooperative development and management. The office also trained 16 fishermen to develop cooperatives with support from NPA. NPA provided one vehicle for COs to implement their activities. This type of support is not common so normally, COs have limitations.
10.8.3.4 NGO extension services
Agricultural extension services are also provided by NGO extension workers. Some large NGOs hire extension workers to implement their own activities effectively; these kinds of NGOs exist across the country. Generally, NGO extension workers have better transportation and budgets for their activities. Their knowledge levels in farm practices and extension are higher than AEOs and CBEWs. NGO extension workers have better opportunities for capacity development. In Upper Nile State, several DPs and NGOs, such as UNDP, FAO, NPA, World Vision, VSF German and Oxfam, employ extension workers to provide extension services. The USAID-funded Food, Agribusiness and Rural Markets (FARM) Project employs extension workers to implement extension activities in Central Equatoria, Western Equatoria and Eastern Equatoria states. Smaller NGOs, such as the United Methodist Committee on Relief (UMCOR) in Yei, have some extension workers. Normally, AEOs and NGO extension workers have a fair relationship. NGOs periodically report their activities to the state or county government offices and ask AEOs to join some of their field activities, workshops and training. Levels of knowledge are different. NGO extension workers normally have a university degree or diploma in agricultural extension, but AEOs have a secondary school certificate and only received one month of training about extension. 267 Collaboration between NGO extension workers and AEOs is important to include government opinions into extension activities by NGOs. As an example of NGO extension workers, key information about extension workers of the FARM Project is provided in Table 10-41.
267
UMCOR, Interviewed by CAMP task team, Yei, 15 April 2013, CAMP Situation Analysis.

10-62
Table 10-41: Key information about extension workers of the FARM Project in CES
Number of extension workers
Target counties
Means of transportation
Their main activities
9 extension workers and 1 senior extension worker
Yei River, Morobo and Kajokeji
A motorcycle is provided to each extension worker.
- Provide 3-4 day training on basic agricultural skills and knowledge to farmers
- Train farmers about development of farmer-based organizations such as cooperatives
- Distribute seeds, fertilizers and tools - Set up demonstration farms and support their
operation as well as exchange visits - Assess yield and technology adoption rates and
pest and disease impacts on farmers Source: The FARM Project, crop subsector questionnaire, Yei, 11 April and 12 April 2013, CAMP Situation Analysis.
Three extension workers are assigned to one county and one senior extension worker oversees all of them. In Central Equatoria State, the FARM Project selected 145 motivated farmers in 2011. These farmers were trained and each of them is responsible to teach twenty other farmers new skills and knowledge. To these 145 farmers, bicycles were given. Last year, over 2,000 demonstration farms were created in the three counties to compare agricultural methods. Through extension activity, knowledge of appropriate spacing, line planting, right timing of planting and weeding, disease control, etc. is disseminated to the farmers. The adoption rate of technology was 20-23% among target farmers in 2012, and in 2013, the adoption rate increased to 40-47%. FARM considers the improvement is due to the efforts of the motivational farmers.268 Extension workers of the FARM Project get two training courses: 1) skills in the participatory mobilization of communities, and 2) basic agricultural skills and knowledge with best agronomic practices such as spacing, pest identification and control using integrated methods. Both courses are 7-10 days and paid by the FARM Project. Even though NGO extension workers have better conditions for implementing their activities, there are still some challenges and constraints. Often, coverage areas are extensive and the range of activities wide. Numbers of target farmers are large269 with a limited budget. The wide coverage in terms of areas and farmers, means NGO extension workers have to deal with language barriers.
10.8.3.5 Farmer based extension services
CBEWs are farmer based extension workers who are responsible for providing extension services to farmers at the boma level. They work under the supervision of AEOs and have to report to AEOs, but are not government officers. Therefore, they work without receiving any salary or financial incentives from the government. They are nominated from local farmers by the AEOs and trained by county or state offices. The GRSS wants to assign CBEWs to every boma office. However, their deployment varies by area. For example, no CBEWs were identified in Lakes and Jonglei states. However, in Upper Nile State, 31 CBEWs were trained and deployed in five counties by an NPA project.270
268
The FARM Project, crop subsector questionnaire, Yei, 12 April 2013, CAMP Situation Analysis. 269
Each extension officer is in charge of 400 to 500 farmers in Central Equatoria State. 270
Panyikang, Bailet, Fashoda, Renk and Maiwut Counties. The Project for Livelihood Improvement in and around Juba for Sustainable Peace and Development, Ten States of South Sudan, July 2011, Survey on the Situation of Rural Development and Agricultural Extension in Ten States of South Sudan. ANNEX 4 Results of State Survey. Juba. p. 38.

10-63
As a successful case in Yei River County, one CBEW visits Ronyi boma office two days a week to provide extension services to 20 leading farmers. He receives no salary or support from the government or NGOs, except the initial three month training. However, he has commuted to the boma office using his own bicycle to provide extension services since 2006. He has created a small demonstration farm at the boma office and uses it for extension activities. He has also introduced line planting and appropriate timings of different types of crops. Leading farmers supported by the CBEW have 15-20% higher yields and are earning more income. He is appreciated by the leading farmers who share his information with other farmers in their communities. 271 This is one of the success stories. CBEWs have the potential to improve extension activities, if they are properly supported by GRSS and NGOs. Farmer volunteers called “promoters” are supposed to be trained and assigned by the AEOs. The responsibilities of promoters are to support CBEWs to provide extension services at the community level. However, no active promoters were identified; the concept of volunteer promoters has not been well practiced. Sometimes, the AEOs visit boma offices to meet with CBEWs, but the AEOs’ transportation and budget are limited. So opportunities for AEOs to supervise CBEWs are limited. Transportation for CBEWs is also limited; many of them use their own bicycles or walk to communities. Insufficient opportunities for refresher training limit CBEWs’ knowledge of extension and farming skills. Insufficient numbers of CBEWs is another challenge.
10.8.4 Rural financial services
Through the situation analysis, the CAMP Task Team clarified that only a few institutions are providing financial services to farmers. Most of the farmers interviewed are not able to get access to financial services, since there is no rural financial service provider in their area.272 There are several financial institutions in Yei, which provide services for rural farmers, most farmers interviewed in Yei have never utilised such credit services. Some of them are eager to access financial services, but do not know how to apply nor what the requirements are. According to the interviews with some financial service providers in Yei, they have already started lending money to eligible farmers who are salaried workers of governments or NGOs or who have enough collateral as they want to avoid a default on the loan. Seemingly, the targets of the financial service providers are not subsistence farmers but progressive or large scale farmers with income from other sources or assets. The NBS Dataset of the National Baseline Household Survey 2009 shows that 17.4% of total households in South Sudan and 15.4% of rural households borrowed money last 12 months in 2009 (Table 10-42).
Table 10-42: Number of household borrowed money last 12 months in 2009
Area Total number of
households
Households that borrowed money
Number Percentage
Urban 199,740 57,605 28.8%
Rural 1,110,576 170,879 15.4%
Total 1,310,316 228,484 17.4% Source: Data from the National Baseline Household Survey 2009. Prepared by NBS / CAMP Task Team
The top reason for borrowing money is for household consumption needs (e.g. purchase of food and daily necessities), see Table 10-43. Meanwhile, the number of households that borrowed money for agricultural purposes is small. For example, only 3.2% of rural
271
CBEW, crop subsector questionnaire, Yei, 16 April 2013, CAMP Situation Analysis. 272
More information on financial institutions in South Sudan is provided in Section 5.3.4 Financial institutions.

10-64
households borrowed money for farm inputs. Likewise, only 3.6% of rural households borrowed money for buying other equipment for farming. The data shows that rural households rarely borrow money for agricultural purposes.
Table 10-43: Percentage (%) of households that borrowed money last 12 months by the main reason for borrowing money in 2009
Note: Reasons are multiple choices which are not weighted. Source: Data from the National Baseline Household Survey 2009. Prepared by NBS / CAMP Task Team
Table 10-44: Percentage (%) of households with main reasons for not borrowing money in 2009
Note: Reasons are multiple choices which are not weighted. Source: Data from the National Baseline Household Survey 2009. Prepared by NBS / CAMP Task Team
Table 10-44 shows the main reasons for not borrowing money. About 23% of rural households do not need credit which implies that approximately three quarters of rural households might have some need for rural financial services, but only limited formal
Whole
NationUrban Rural
I Agriculture
Farm Inputs 2.9 2.7 3.2
Buy heavy equipment 1.0 1.2 0.8
Buy other equipment 5.8 8.0 3.6
Buy animal 2.8 1.2 4.4
Buy agricultural land 0.8 0.8 0.8
Other agricultural costs 4.6 2.4 6.7
II Non-farm business
Working capital & purchase 3.8 4.9 2.6
Land and/or building equipment 3.1 2.4 3.8
Other business expenses 5.4 6.7 4.0
III Personal use
Consumption needs 64.9 61.6 68.1
Purchase/improvement dwelling 9.9 11.2 8.7
IV Other purposes
Religious, wedding, burial 3.3 2.0 4.6
Consumer durables 2.4 2.2 2.6
On-lending 1.1 0.8 1.4
Other 9.2 9.6 8.9
Reasons for borrowing money
ReasonsWhole
NationUrban Rural
No Need 23.8 25.9 22.9
Believed I would be refused 21.1 16.2 23.2
Too expensive 12.3 15.1 11.1
Inadequate collateral 6.7 5.7 7.2
Do not like to be in debt 25.2 31.9 22.2
Do not know any lender 17.1 11.8 19.5
Attempted to borrow but was refused 11.7 11.1 12.0
Because in debt 1.5 1.2 1.6
Other 9.5 6.2 11.0

10-65
financial services are provided for rural farmers. During the CAMP situation analysis, a few interviewees mentioned mutual financing arrangements among relatives. These kinds of informal arrangements, however, are not so common in rural areas.
10.8.5 Mechanisation
Mechanisation is one of the key factors to promote large-scale commercial farming. However, there are very limited numbers of operational tractors in the country, although demand for tractor services is quite high. After the CPA, a large numbers of tractors were introduced by the national and state governments, but many of them are not operational because of (a) lack of spare parts, (b) inadequate institutional capacity to operate large-scale mechanised farms, (c) inadequate maintenance skills and (d) poor tractor operators’ skills. A small number of private tractor service providers are operating but they usually provide ploughing and harrowing services only. The private service providers cannot fill the high demand for these services. Unavailability of tractor services hampers the expansion of the area farmed per household or group. Many progressive farmers and commercial farmers’ groups have tried to expand their farms. They need tractor services for ploughing and harrowing for large farms sometimes reaching almost a hundred feddans, instead of hiring expensive manual labourers. They try to use private tractor service providers or government institutions which own tractors for renting out. However, it is difficult since everybody needs such services during the early stage of the rainy season, which is the most appropriate time for ploughing and harrowing. Table 10-45 shows some private tractor service providers. It was difficult for the CAMP Task Team to find out about private tractor service providers during the situation analysis, even though the team was supported by the State Focal Points. The team was able to conduct interviews with service providers in only five states which implies that there are a limited number of service providers. Prices vary from place to place. There are some large-scale mechanised schemes in Renk County in Upper Nile State where the price and scale of tractor services are completely different to other places. In Renk, the unit cost for ploughing is about 4% of that in Yei and Aweil, and 3% of that in Maridi and Bor. Farms are large and not scattered and the soil is suitable for tractor use, so the service providers can utilise their tractors very efficiently. All the service providers interviewed pointed out that the unavailability of spare parts is a serious issue for the smooth operation of their business. They have to purchase them from Uganda and Sudan.
Table 10-45: Tractor services in different places
Place Service Price
(SSP/feddan) Typical size of
land Average # of
services provided Geographic
areas serviced
Yei Ploughing 160-200 8-12 feddans 80 feddans/month, 8-10 farmers/month
30 km away (Yei-Morobo) Harrowing 180
Maridi Ploughing 300 Maximum 2 ha 50 farmers/month Maridi, Yambio and part of Mundri West
Bor Ploughing 300 1-45 feddans 15-30 farmers/month
Inside payam
Harrowing 150
Aweil Ploughing 200 50 feddans 50 farmers/month Aweil Central
Renk Ploughing 7.5 240-1,000 feddans
1,000 feddans/week Those who apply for services Planting 7.5
Source: Tractor service providers, interviewed by CAMP crops subsector team, April to June 2013, CAMP Situation Analysis

10-66
Frequent breakdowns of tractors are also serious problems for the service providers. The main reasons for the breakdowns are poor farm conditions and inadequate tractor operators’ skills. In the Greenbelt zone, vegetation cover is thick forest so farmers who want to reclaim large areas have to remove stones and tree stumps before ploughing. If stumps are not properly removed, the tractor and its implements are easily damaged. However, removal of large tree stumps cannot be done manually and farmers need to hire heavy equipment such as bulldozers, which are rarely found in rural areas and are expensive to hire. Unskilled tractor operators also cause breakages of tractors. The depth of ploughing should be determined based on soil texture and moisture, and the existence of stumps and stones. However, unskilled operators tend to plough deeper without paying attention to farm conditions. As a result, plough disks get damaged easily. There is no functional government training centre for tractor operators to obtain appropriate skills as of August 2013. The Kapuri Agricultural and Technology Transfer Centre (KATTC) is expected to be a training centre for tractor operators but training has not been conducted since 2011 due to limited budgets. Even in the mechanised schemes in Renk, labourers are sowing seeds immediately after ploughing and harrowing by tractors. Combine harvesters are not utilised at all. Usually, postharvest activities, such as threshing and drying, are done manually. Small simple threshers for maize are sometime used by government institutions, and large scale and progressive farmers. A few small scale rice mills were introduced in the Greenbelt zone by NGOs and DPs on a trial basis. A large rice mill was introduced to the Aweil Rice Scheme, but it is not operational now due to lack of spare parts. Ox ploughing was introduced by some NGOs to show this simple and affordable technology to subsistence farmers. In Lakes State, ox ploughing was adopted rapidly compared to other areas since the soil type (sandy soil) is suitable for ox ploughing. Some NGOs are helping farmers by providing training and the necessary tools. A plough suitable for ox ploughing, imported from Kenya, was approximately SSP 950 in Torit in April 2013.
10.8.6 Agricultural inputs
Most of the farmers interviewed in the CAMP situation analysis use their own seeds for cereal production. The seeds are harvested in the previous season and kept by the farmers. Even though farmers are willing to test new varieties of sorghum and millet, it is difficult for them to get access to new varieties of seeds. Some farmers in the Greenbelt zone can access hybrid varieties of maize and new varieties of upland rice more easily than improved sorghum and millet varieties. Vegetable growers began to buy quality seeds from agro dealers as they transform from subsistence to commercial farmers. Quality vegetable seeds are mainly imported from Kenya and Uganda. The major seed companies are East Africa Seed, Freshco Kenya Ltd and Seed Company Ltd in Kenya, and NASECO Seed Company, East African Seed Company and Farm Input Care Centre Ltd in Uganda. Chemical fertilisers are rarely utilised by farmers. Only a few progressive farmers working with a project supported by the International Fertilizer Development Center (IFDC) use urea (46% nitrogen content) and DAP: di-ammonium phosphate (18% nitrogen, 46% phosphate and 0% potassium content). These are available at shops supported by IFDC and are sold more cheaply to customers who are targets of the IFDC project.273 Most of farmers do not use manure because: (a) manure preparation is labour intensive work, (b) many livestock are necessary to produce enough manure, so many farmers cannot afford it and (c) the soil
273
Both Urea and DAP are the same price, SSP 35/bag (25kg), at the shop in Torit supported by IFDC in April
2013.

10-67
is still fertile enough to grow crops. If soil fertility decreases, some farmers move to different areas to leave the farmland fallow to recover its soil fertility. As mentioned in Section 10.4.6 Private sector, the number of agro dealers that handle agricultural inputs is quite small, taking the agricultural potential into consideration. The CAMP Task Team could find agro dealers only in five states; it seems that demand for quality seeds, chemical fertilisers, pesticides and herbicides are still at a low level.
10.8.7 Plant protection
Through interviews with farmers, it was found that most farmers do not use chemicals for pests and diseases. A few progressive farmers sometimes utilised pesticides for termite nests. The most serious pest for sorghum production is a bird called Quelea quelea. Especially in mechanised schemes in Renk County, the damage from Quelea quelea is extremely serious. Although pest control is carried out in Sudan by aerial spraying274, in South Sudan pest control measures are not taken at all. Due to serious damage from the birds, many farmers had very little harvest in 2012. Likewise, damage by insects (e.g., migratory desert locusts and grass hoppers) to sorghum and maize is serious, again due to the lack of pest control. To improve the situation, the national and state governments are considering some pest control measures for large mechanised schemes (e.g., spraying for Quelea quelea nests on trees) but the measures are not carried out due to budget constraints. Other pests, such as monkeys, squirrels and termites, have a negative impact on agricultural products, but these are not so serious compared to the pests mentioned above. In addition, livestock kept by pastoralists sometimes causes serious damage to crops grown by local farmers which leads to tribal and inter-communal conflicts. Fencing is an effective prevention measure but local farmers cannot afford to fence their farmland due to financial constraints. In some areas, traditional conflict resolution mechanisms are working well to solve this issue, but not in all areas. Cassava mosaic and brown streak diseases are threat for farmers in the Greater Equatoria Region, especially in the Greenbelt zone. Rosette virus and leaf spot are serious diseases of groundnuts. 275 Regarding weeds, the spread of striga is the most critical issue since herbicides are not effective in controlling striga. Although damage by pests and diseases is serious, services related to plant protection (e.g. application of pesticides and quarantine of seeds and plants) are not provided by the government due to limited human and institutional capacity, no operating budget and no collaboration mechanism between the national and state governments. In 2012, South Sudan became a member of the Desert Locust Control Organization for Eastern Africa (DLCO-EA), which is a regional pest and vector management organisation established in 1962. This organisation is mandated to control migratory pests such as Desert locust, African armyworm moth, Quelea quelea and Tsetse fly.276 It is expected that migratory pest control could be implemented through DLCO-EA.
10.9 Agricultural infrastructure
Although main roads, feeder roads, irrigation facilities, storage, drying yards and market facilities are key infrastructure for crop production and marketing, these facilities are not well developed in either the public or private sectors. Main road and feeder road
274
Aerial spraying is carried out in mechanised schemes in Sudan by the government. 275
FAO/WFP. 2013. Crop and Food Security Assessment Mission to South Sudan. p. 20. Rome: FAO/WFP 276
DLCO-EA. http://www.dlcoea.org.et/ (accessed on 29 August 2013)

10-68
construction/rehabilitation are covered in Section 8.10 Infrastructure; this section focuses on other agricultural infrastructure. There are only two large scale irrigation schemes in the country, i.e., the Aweil Irrigation Rice Scheme (AIRS) and the Renk Irrigation Schemes. ARIS was initiated by the British colonial government in 1945. The scheme expanded in area gradually and about 2,700 feddans of farmland are now operational. In 2009 the scheme was rehabilitated through the Aweil Irrigation Rehabilitation Project supported by GIZ under the Sudan Productive Capacity Recovery Programme (SPCRP), funded by the EU.277 During the project period, demining, and dike and canal maintenance were carried out and agricultural machinery (e.g. large scale rice mill and heavy equipment) and technical assistance provided. However, after completion, the scheme has not operated effectively due to limited funds for operating costs and limited human resources. The Renk Irrigation Schemes, which are composed of 23 sub-schemes,278have not been operational for more than three years; most of the farmers have migrated away from the scheme areas to nearby towns due to lack of drinking water for humans and livestock. 279 Small scale pump irrigation schemes that use surface water from rivers and streams or underground water are sometimes found in suburban areas. Some progressive farmers establish small irrigation systems, including water pumps, boreholes, pipes and water tanks, for dry season vegetable production. Some farmers’ groups (e.g., women’s group and cooperatives) are provided with water pumps and tanks by DPs for vegetable production. However, this is not common. Regarding storage facilities, WFP is promoting medium scale warehouse construction through the Purchase for Progress (P4P) initiative. P4P planned to construct 10 to 15 warehouses to be managed by farmers’ organizations and four of them are already established as of April 2013.280 The floor area of each warehouse is about 300 to 400 square meters. P4P also provides farmers’ organizations with training on warehouse management and some equipment (e.g., tarpaulins, pallets, trays and moisture meters). Nzara Farmer Association (NFA) in Yambio is one of the successful cases. NFA is working very actively to collect products from local smallholders. NFA sold sorghum and maize to P4P and earned about USD 64,000 in 2012. Usually subsistence farmer households own small scale traditional grain storehouses, which have no ventilation to keep cereal dry. During the rainy season, cereals stored in these storehouses are often affected by mould due to high cereal moisture content caused by limited ventilation. To avoid this, many households keep cereal in sacks and put them in the ceiling of their houses but storage capacity is limited. Many farmers in the Greenbelt zone, where humidity is very high in the rainy season, face serious postharvest loss. To ameliorate this situation, some DPs introduced improved storage facilities made of tin roofs with wire mesh walls and floors. Well established drying yards (e.g., cemented floors) for drying cereals and cassava are not commonly used. There is no large scale drying facility for postharvest processing. Farming households usually dry their produce on the mud ground, tarpaulin, or simple platforms.
277
GRSS. Ministry of Electricity, Dams, Water Resources and Irrigation. 2013. Irrigation Development Master
Plan:Progress Report 1 (Draft). pp 3-1 – 3-3. 2013. Juba 278
GRSS. MWRI. 2010. Assessment, Design, Installation of Irrigation Pumps and Rehabilitation of Water Control
Infrastructures, Inception Phase, Preliminary Assessment Works on Renk Project, Final Report. p. 8. Juba:
MWRI 279
GRSS. Ministry of Electricity, Dams, Water Resources and Irrigation. 2013. Irrigation Development Master
Plan:Progress Report 1 (Draft). P. 3-20. 2013. Juba 280
P4P incharge in WFP, interviewed by CAMP crops subsector team, 4 April 2013.

10-69
Public market facilities are poorly constructed with temporary materials, which are prone to outbreaks of fire. The floors are not cemented; drainage systems are poor, leading to many puddles with dirty water during the rainy season, when sanitation conditions are extremely poor. On the other hand, private market facilities constructed by landowners or merchants are permanent structures with cement floors and walls. These market facilities are usually for processed products, such as maize flour, sugar and cooking oil, so sanitation conditions are fair.
Figure 10-26: Agricultural infrastructure established by public and private sectors
Irrigation
Aweil Irrigation Rice Scheme Irrigated vegetable production
in peri-urban (using surface water)
Small water pump for irrigated vegetable production
Storage
Warehouse constructed by WFP through P4P
Traditional grain storage Improved grain storage introduced by DPs
Drying yard
Drying cassava on tarpaulin Improved drying platform Traditional drying platform
Market facility
Shop established by the
government Small shops established by the
government Wholesaler’s shop established
by a landowner
Source: CAMP crops subsector team, April to September 2013, CAMP Situation Analysis.
10.10 Investment
Even though there is vast potential in the agriculture sector, not much investment has been made since CPA. Regarding public investment, the government failed to invest effectively and efficiently to develop the agricultural sector. In the Maputo declaration on agriculture and food security in Africa in July 2003, two targets were set: (a) increasing agricultural productivity by 6% per year through 2015 and (b) allocating at least 10% of the national

10-70
budget to agriculture and rural development within five years. 281 However, the budget approved for the former MAFCRD and MARF in 2012/13 were 1.6% and 0.4% of the total budget. Table 10-46 shows only 2% of the total budget was allocated to agriculture related ministries, while 38.1% and 3% of the total budget were allocated the Ministry of Defence and Veteran Affairs and the Ministry of Wildlife Conservation and Tourism.
Table 10-46: Approved budget 2012/13
Note: % is against the National total budget Source: Republic of South Sudan approved budget 2012/13. p23, p34.
Investment for service delivery, such as research, training and extension, is very limited and ineffective. Only one research centre is functional in South Sudan and there are only a few government training centres providing training courses for Agriculture Extension Officers (AEOs) and farmers. Only 285 AEOs are assigned 282 and most of them are not well equipped in terms of transport and necessary materials for extension activities. Likewise, 252 Community Development Officers (CDOs) and 255 Cooperative Officers (COs) are working on the ground but they face a similar situation to the AEOs.283 Public services do not reach most farmers. Investment for infrastructure, such as feeder roads, irrigation facilities, storage and market facilities, is minimal (see section 10.9 Agricultural infrastructure). The government is working with DPs for infrastructure development. The World Bank, EU, WFP and USAID are the main DPs supporting feeder road rehabilitation/construction. In order to collect more agricultural products effectively and to facilitate private sector trading activities, some warehouses are constructed in strategic towns with support from WFP. However, public investment for infrastructure development is insufficient to meet demand. In the private sector, almost all businesses in the country are small and medium sized enterprises (SMEs).284 This is also true with respect to crop production; all agro dealers, retailers, wholesalers and producers are SMEs; there are no large enterprises for agribusiness. A large volume of investment by the private sector has not yet materialised. The former Ministry of Commerce, Industry and Investment set 11 priority sectors, including agriculture and agribusiness, who would receive benefits and incentives to encourage investment (Table 10-47). However, the investment environment is still not favourable due to
281
FAO. 2012. The State of Food and Agriculture: Investing in agriculture for a better future 2012. p 26. Rome. 282
Population of South Sudan in 2012 is estimated as approximately 10 million, so one AEO should cover about
35,000 people to deliver extension services for the whole nation. 283
Number of AEOs, CDOs and COs are from 10.8.3 Extension services. 284 African Economic Outlook. http://www.africaneconomicoutlook.org/en/countries/east-africa/south-sudan/
(accessed on 7 Octber 2013)
Items
National total budget 100%
MAFCRD MARF
Wage and Salaries 15,534,086 5,432,721
Use of Goods and Services 16,095,269 10,938,316
Capital Expenditure 32,875,644 -
Transfer to Sates 40,160,750 11,210,504
Sub-total 104,665,749 1.6% 27,581,541 0.4%
132,247,290 2.0%
2,542,356,046 38.1%
Ministry of Wildlife Conservation and Tourism 198,706,464 3.0%
Approved budget 2012/13 (SSP)
6,664,162,036
Ministry of Defence and Veteran Affairs
Grand total of agriculture related ministries

10-71
the unclear land acquisition process, multiple informal taxation, insecurity and the high cost of labour and commodities.
Table 10-47: Tax concessions and incentives regime
Concessions and incentives
Details
Duty exemption Agricultural imports – tools, equipment, machinery and tractors, pharmaceutical, animal feed, seeds – for boosting food and cash crop productions shall be exempt from any duties and taxes for a period that shall be determined by law.
Tax incentives Tax incentives include capital allowances ranging from 20% to 100%, deductible annual allowances ranging from 20% to 40%; and other depreciation allowances ranging from 8% to 20%.
Special incentives Special incentives may be granted by the Board of Directors of South Sudan Investment Authority to investments in strategic or transformational sectors. These special incentives are only available on special application by investments in areas designated as strategic or transformational.
Source: GRSS. 2011. Republic of South Sudan Investor Guide. p 22. Juba
10.11 Cross cutting issues
(1) Gender In South Sudan, 48.1% of the population are women285 and 80% of the family labour is contributed by women.286 71% of women engage in crop farming as a main source of income.287 Thus, women are an important labour force for farming. If they were widows, they would be the main income earners and/or decision makers. However, the literacy rate of women between 15 and 24 years is 28% while for men it is 55%.288 Women’s net enrolment rate for primary school is 37.1% compared to 50.8% for men.289 Lower educational profiles generally lead to the lower social status of women. Women normally do not have the right to own land, and the decision making system is based on male leaders, especially in rural areas. This negatively affects the opportunities for women to have equal access to resources. However, female farmers are essential for agriculture in South Sudan. Extension workers and staff of NGOs should be aware of this when they implement activities at a community level and provide equal opportunities of services to female farmers. (2) Labour costs Besides the importance of female labour force in the crop subsector, the younger labour force is also very important for agricultural development. Labour participation rates for those between 15 and 34 years old and those between 35 and 54 years old are 72% and 85%.290 According to the data, about 30% of the age group between 15 and 34 years old are not employed. It was identified through the CAMP situation analysis that agricultural labour costs are high. Most subsistence farmers cultivate only the area which is manageable by family members.
285
3.97 million are women out of 8.26 million total population in the 2008 Census. Source: National Bureau of Statistics, Government of Republic of the South Sudan (GRSS). January 2012. National Baseline Household Survey 2009, Report for South Sudan 2012. p. 8. Juba. 286
NBS, Government of Republic of GRSS. South Sudan Statistical Yearbook 2011. p.11. Juba. 287
NBS, GRSS. January 2012. National Baseline Household Survey 2009, Report for South Sudan 2012. P. 101. Juba. 288
NBS, GRSS. 2011. South Sudan Statistical Yearbook 2011. p. 41. Juba. 289
NBS, GRSS. 2011. South Sudan Statistical Yearbook 2011. p. 23. Juba. 290
NBS, GRSS. 2011. South Sudan Statistical Yearbook 2011. p. 84. Juba.

10-72
Although there must be employment opportunities in other sectors, the figures shown above indicate that the agricultural sector can fill the gap between work opportunities and a surplus labour force. An agro dealer in Yei mentioned that he tried to hire young people to work for his experimental plots, but the young people stopped coming to the farm after one day. He had to find short term workers from Kenya and found that the total costs were lower.291 High labour costs and low participation in the labour force are a hindrance to improving crop production and expanding the sizes of farmlands. (3) Conflicts/security In South Sudan, conflicts with Sudan and internal domestic conflicts occur. Causes of these conflicts vary, but it affects farming seriously. For example, in Upper Nile State, there are armed rebel groups who attack different communities to steal their food, money and belongings including cattle. Farmers abandon their farming. Some farmers even flee their communities and become internally displaced persons (IDPs). In some states, such as Western Bahr El Ghazal, Western Equatoria) and Jonglei, there are conflicts between farmers and pastoralists because livestock damages crops. These conflicts cause negative effects in agricultural production. Only 3.8% (2.5 million ha) of the total land area of South Sudan (64.7 million ha) is used for crop farming as of 2009.292 There are still large areas that are uncultivated, but land under cultivation is increasing. In Central Equatoria and Western Equatoria states large scale land clearing is being carried out.293 In some areas, the cleared lands were dense forests causing land degradation and loss of biodiversity. Large-scale forest clearance is reported in the areas of Juba, Terekeka and Yambio.293 If mechanization were promoted further, the land clearance would increase and the environmental impact would be larger.
291
Century Seeds, interviewed by CAMP crop sub-sector, Yei, 13 April 2013. CAMP Situation Analysis. 292
World Bank, Africa Region. 14 October 2011. Strategic Choices for Realizing South Sudan’s Agricultural Potential. Washington D.C. 293
GRSS, Ministry of Environment, and United Nations Environment Programme, January 2012. Environmental Impacts Risks and Opportunities Assessment: Natural resources management and climate change in South Sudan. p.36. Juba.