Embed Size (px)
Citation preview

COMPREHENSIVEANNUAL FINANCIAL REPORT
FOR THE FISCAL YEARS ENDED AUGUST 31, 2015 AND 2014TARRANT COUNTY COLLEGE DISTRICT
TEXAS

Comprehensive Annual Financial Report
For the Fiscal Years Ended August 31, 2015 and 2014
Prepared by:
Finance Department Tarrant County College District
Texas

Tarrant County College District Comprehensive Annual Financial Report
Table of Contents Page
INTRODUCTORY SECTION Chancellor’s Letter ..................................................................................................... i Transmittal Letter ...................................................................................................... ii GFOA Certificate of Achievement ............................................................................. ix Elected Officials ......................................................................................................... x Principal Officials ....................................................................................................... xi Chancellor’s Executive Leadership Team ................................................................... xii FINANCIAL SECTION Independent Auditor's Report ..................................................................................... 1 Management’s Discussion and Analysis ..................................................................... 4 FINANCIAL STATEMENTS Statements of Net Position ................................................................................... 12 Statements of Revenues, Expenses and Changes in Net Position .......................... 14 Statements of Cash Flows .................................................................................... 15 Notes to Financial Statements .............................................................................. 16 REQUIRED SUPPLEMENTARY INFORMATION Schedule of the District’s Proportionate Share of the Net Pension Liability ............ 44 Schedule of the District’s Contributions ................................................................. 45 Notes to Required Supplementary Information ...................................................... 46 SUPPLEMENTARY DATA Schedule of Operating Revenues ............................................................................ 48 Schedule of Operating Expenses by Object .......................................................... 50 Schedule of Non-Operating Revenues and Expenses ............................................ 52 Schedule of Net Position by Source and Availability ............................................ 54 STATISTICAL SECTION - (Unaudited) Net Position by Component ....................................................................................... 58 Revenues by Source.................................................................................................... 60 Program Expenses by Function .................................................................................. 62 Tuition and Fees ........................................................................................................ 64 Assessed Value and Taxable Assessed Value of Property ............................................ 66 State Appropriation Per FTSE and Contact Hour ....................................................... 68 Principal Taxpayers .................................................................................................... 70 Property Tax Levies and Collections .......................................................................... 72 Ratios of Outstanding Debt ........................................................................................ 74 Legal Debt Margin Information .................................................................................. 76 Pledged Revenue Coverage ........................................................................................ 78 Demographic and Economic Statistics – Taxing District ............................................. 79 Principal Employers ................................................................................................... 80 Faculty, Staff and Administrators Statistics ................................................................. 84 Enrollment Details ..................................................................................................... 86 Student Profile ........................................................................................................... 90 Transfer to Senior Institutions .................................................................................... 93 Capital Asset Information .......................................................................................... 94

Tarrant County College District Comprehensive Annual Financial Report
Table of Contents (Continued)
Page
FEDERAL SINGLE AUDIT SECTION
Schedule of Expenditures of Federal Awards .............................................................. 97 Notes to Schedule of Expenditures of Federal Awards .............................................. 100 Independent Auditor’s Report on Internal Control over Financial Reporting and
on Compliance and Other Matters Based on an Audit of Financial Statements Performed in Accordance with Government Auditing Standards........................ 101
Independent Auditor’s Report on Compliance for Each Major Program and on Internal Control over Compliance Required by OMB Circular A-133 ................. 103 Federal Schedule of Findings and Questioned Costs ................................................. 106
STATE SINGLE AUDIT SECTION Schedule of Expenditures of State Awards ................................................................ 109 Notes to Schedule of Expenditures of State Awards .................................................. 110 Independent Auditor’s Report on Compliance for Each Major Program and on Internal Control over Compliance Required by UGMS Single Audit Circular ............................................................................. 111 State Schedule of Findings and Questioned Costs ..................................................... 113

INTRODUCTORY SECTION
INTR
OD
UC
TOR
Y S
ECTI
ON

i
December 11, 2015
To the Board of Trustees: This past year has been one of celebration and success for Tarrant County College District, and I am pleased to share the Comprehensive Annual Financial Report with you and with our community. Through this re-port, you will get a detailed picture of the District’s financial operations for fiscal year 2015, which ended on August 31, 2015. On October 1, 2015, we lost our beloved leader, Chancellor Erma Johnson Hadley, after a courageous and determined battle with cancer. Her death came just two short months after she proudly stood along-side former Chancellors Joe B. Rushing, C.A. Rob-erson and Leonardo de la Garza on stage at TCCD’s 50th Anniversary Celebration, which included a bond burning ceremony in honor of TCCD’s last outstand-ing general obligation, making the District debt free for the first time in its history. At that moment, she announced to thunderous applause that TCCD was officially debt-free. What a wonderful way to begin our next 50 years, and what a profound testament to her leadership and to TCCD’s stewardship of our tax-payers’ dollars.
This year began with great discussion about the future of college affordability and new proposals. More than 100,000 students come through our doors each year – often, not knowing exactly what they wish to pursue but keenly aware their futures will be brighter with a college education. Our job is to meet them where they are and help get them where they wish to go – to show them their Success Within Reach – and to teach them, as Chancellor Hadley used to say, that “it’s yours for the working.” We continue to explore ways to improve student suc-cess outcomes as measured by course completion, by retention and by graduation. I’m pleased to report that in 2015, we enjoyed record-breaking graduation numbers, with 7,340 students receiving a diploma or certificate. Of those, 42 were graduating from the Marine Creek Early College High School, receiving an associate degree along with their high-school di-ploma. Last August, we opened our sixth early col-lege high school at the South campus, our dual credit program continues to grow, and our online class offer-ings (along with enrollment) continue to grow expo-nentially. Going forward, we have set the bar even higher for ourselves, challenging our faculty and staff to improve the retention rates of our degree-seeking, first-time-in-college students by 20 percent in one year. We know this is bold work. We also know that this is the right work for our students and for our community. This report will provide an inside look at how TCCD’s commitments to student success, community impact and institutional excellence have been mani-fest over the past year. Our hope is that our 50-year legacy of serving Tarrant County – combined with our unwavering commitment to ongoing innovation – gives you continued confidence in the powerful eco-nomic engine that is Tarrant County College District. Sincerely,
Angela Robinson Acting Chancellor

ii
December 11, 2015 To: Acting Chancellor Angela Robinson, Members of the Board of Trustees, and The Citizens of the Tarrant County College
District The comprehensive annual financial report of the Tarrant County College District for the fiscal year ended August 31, 2015, is hereby submitted. The purpose of this report is to provide detailed in-formation concerning the financial condition and performance of the District. Responsibility for the preparation and integrity of the financial infor-mation and fairness of the presentation, including all disclosures, rests with the management of the Dis-trict. To the best of our knowledge, the enclosed data are accurate in all material respects and are re-ported in a manner designed to present fairly the fi-nancial position and results of operations of the Dis-trict. All disclosures necessary to enable the reader to gain an understanding of the District’s financial activities have been included.
Comprehensive Annual Financial Report The Tarrant County College District’s comprehen-sive annual financial report (CAFR) for the fiscal year ended August 31, 2015 was prepared by the Fi-nance Department. The financial statements are prepared in accordance with Generally Accepted Accounting Principles (GAAP) as established by the Governmental Accounting Standards Board (GASB) and comply with Annual Financial Reporting Re-quirements for Texas Public Community and Junior Colleges as set forth by the Texas Higher Education Coordinating Board. The Notes to the Financial Statements are provided in the financial section and
are considered essential to fair presentation and ade-quate disclosure for this financial report. The notes include the Summary of Significant Accounting Pol-icies for the District and other necessary disclosures of important matters relating to the financial posi-tion of the District. The notes are treated as an inte-gral part of the financial statements and should be read in conjunction with them. Further, this letter of transmittal and the financial statements should be read in conjunction with the Management’s Discus-sion and Analysis (pages 4-11), which focuses on current activities, decisions, and currently known facts to provide an overview of the financial state-ments and reasons for significant changes from the prior year. The independent firm of certified public accountants of Weaver and Tidwell, L.L.P., was engaged to au-dit the financial statements and related notes and issue a report thereon. They have informed District management and the Board of Trustees that their audit was conducted in accordance with generally accepted auditing standards, which require a consid-eration of internal controls in determining audit pro-cedures. The report of the independent auditors based upon their audit of the financial statements is included in the financial section of this report.

iii
The District is required to undergo an annual federal single audit in conformity with the provisions of the Single Audit Act Amendments of 1996, and U.S. Office of Management and Budget Circular A-133, Audits of States, Local Governments and Non-Profit Or-ganizations, and an annual state single audit in con-formity with the Texas Governor’s Office of Budget and Planning Uniform Grant Management Standards Single Audit Circular. Information related to these single audits, including the schedule of federal ex-penditures of awards, schedule of state expenditures of awards, and auditor’s reports on compliance and on internal controls is included in the federal and state single audit sections of this report.
Organization of District The Tarrant County College District was established as a public community college in an election held in Tarrant County, Texas, on July 31, 1965. The Dis-trict operates as a community college district under the laws of the State of Texas. An elected, seven-member Board of Trustees, that has oversight re-sponsibility and control over all District activities, governs the District. The Board of Trustees has no financial accountability over Tarrant County or oth-er Tarrant County districts and, accordingly, only financial data for the Tarrant County College Dis-trict is included in this report.
Mission and Values Tarrant County College District, a comprehensive two-year institution, is dedicated to providing quali-ty education that exceeds the expectations of the people of Tarrant County. Accordingly, the mission is as follows: Tarrant County College District pro-vides affordable and open access to quality teaching and learning. The District implements its mission through a clearly defined set of programs, services, and partnerships that include university transfer pro-grams; workforce education programs; technical pro-grams; developmental courses; adult literacy cours-es; continuing education and community services; an extensive curriculum; a highly qualified, enthusi-astic, innovative, faculty and staff; appropriate tech-nology, equipment, and learning resources; diverse modes of instruction and delivery; support services to foster student success; work and partnerships in support of the cultural and economic development of the community; and a commitment to institutional effectiveness, which involves an ongoing process of self-examination, self-improvement, and an unwa-vering pursuit of excellence. Tarrant County College District is committed to: Excellence: our belief in providing outstanding
quality in educational programs, administrative support, and services to students, faculty and staff;
Access: our belief in providing educational op-
portunities for all members of the community; Diversity: our belief that the District should re-
flect the diverse composition of our community; Student Success: our belief in providing quality
instruction, resources, and support services to assist our students in achieving their goals;
Service to Community: our belief in the im-portance of engaging the community in our ef-forts to enhance the economic health and quality of Tarrant County; and

iv
Innovation and Creativity: our belief in culti-vating a learning environment that evaluates and incorporates into our curricula emerging technol-ogies and methodologies to enhance our quality of instruction and our administrative effective-ness for our students, faculty, and staff.
Economic Condition and Outlook Located in North Central Texas, Tarrant County is one of the fastest-growing counties in the nation with nearly 1.9 million residents, according to the United States Census Bureau. Home to several ma-jor corporations including Alcon, AMR/American Airlines, Bell Helicopter, BNSF Railway, and Lock-heed Martin, among others. Tarrant County repre-sents an ideal location for business due to its proxim-ity to Dallas-Fort Worth International Airport, the ninth busiest airport in the world; and Alliance Air-port, the worlds first 100% industrial airport de-signed for cargo and corporate aviation. This vi-brant business community, fueled by more than 30,000 companies, provides meaningful employment opportunities even through economic fluctuations. In September 2015, the unemployment rate in Tar-rant County totaled 4.1 percent compared to 5.1 per-cent nationwide. Having steadily risen over the last 20 years, employment in Fort Worth alone is fore-cast to grow by 1.5 percent annually through 2030. Already a diversified economy spanning agriculture, manufacturing, transportation, communication, con-struction, health care, and trade and professional service industries, the Fort Worth economic climate also has benefited from the increase in total number of natural gas wells throughout Tarrant County and surrounding communities. The Texas Railroad Commission ranked Tarrant County first in Texas’s gas-producing counties, yielding 58.1 billion cubic feet annually. With continued exploration and pro-duction, associated jobs to support this industry will continue to increase and contribute to the county’s vibrant economy.
Major Initiatives Since its inception 50 years ago as a single-campus junior college, Tarrant County College District has
grown to become the nation’s 13th-largest institution of higher education based on annual enrollment. Its impact is felt keenly throughout Tarrant County, with one of every 19 residents taking advantage of the educational programs and workforce training services the District offers. TCCD serves more than 100,000 students each year, spanning all age groups and representing 49 countries. With a greater num-ber of students discouraged to attend college due to prohibitive costs or their own lack of college readi-ness, TCCD continues to provide pathways to high-er education based on its fundamental philosophy that “everyone is college material.” TCCD knows that sustainable economic viability for Tarrant County and beyond requires an educated, well-trained and prepared workforce ready to meet the demands of the future. The District’s commitments to student success, affordability, accessibility and institutional effectiveness, as articulated in its Vision 2015 Strategic Plan, inform the creation of every new program or initiative TCCD introduces, and provide a relevant and evidence-based benchmark against which the District can measure its success. According to American College Testing (ACT), making the transition from freshman to sophomore year is difficult for one in every four college students, who leave before achieving a degree or completing their college education elsewhere. Because TCCD prioritizes student retention, completion and gradua-tion above all else, the District continues to invest in developing, sustaining and expanding those pro-grams and services that will help students overcome obstacles and achieve success.
v
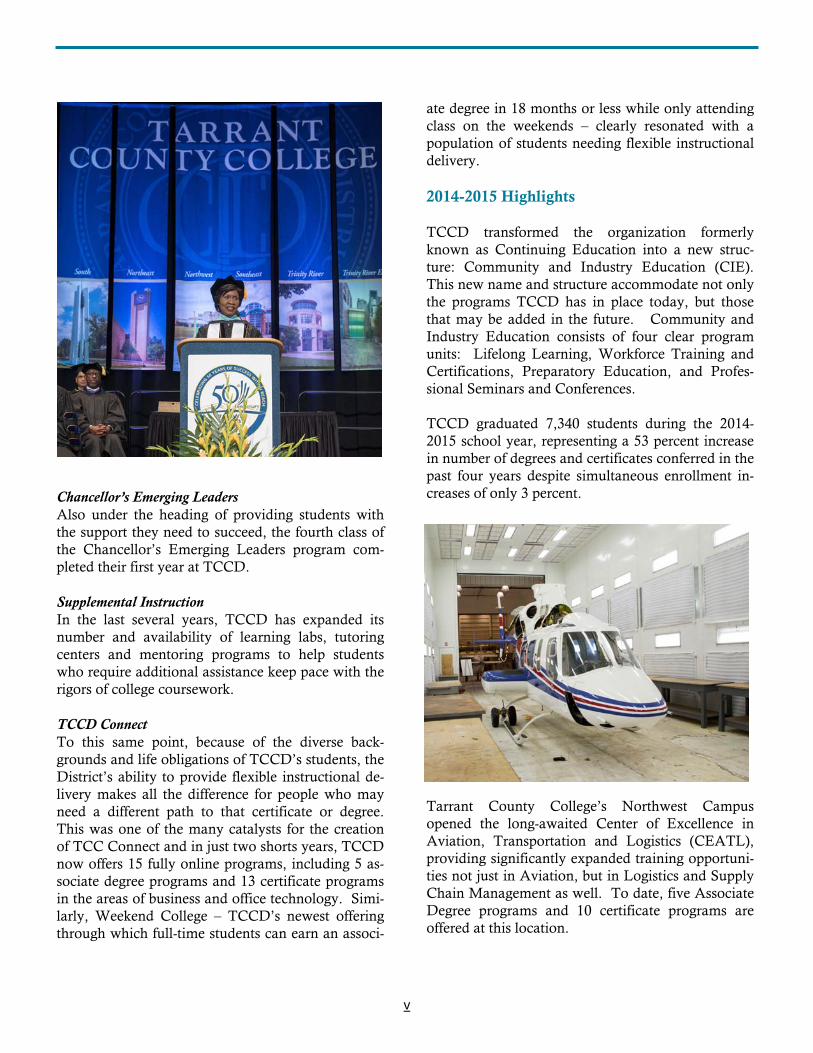
Chancellor’s Emerging Leaders Also under the heading of providing students with the support they need to succeed, the fourth class of the Chancellor’s Emerging Leaders program com-pleted their first year at TCCD. Supplemental Instruction In the last several years, TCCD has expanded its number and availability of learning labs, tutoring centers and mentoring programs to help students who require additional assistance keep pace with the rigors of college coursework. TCCD Connect To this same point, because of the diverse back-grounds and life obligations of TCCD’s students, the District’s ability to provide flexible instructional de-livery makes all the difference for people who may need a different path to that certificate or degree. This was one of the many catalysts for the creation of TCC Connect and in just two shorts years, TCCD now offers 15 fully online programs, including 5 as-sociate degree programs and 13 certificate programs in the areas of business and office technology. Simi-larly, Weekend College – TCCD’s newest offering through which full-time students can earn an associ-
ate degree in 18 months or less while only attending class on the weekends – clearly resonated with a population of students needing flexible instructional delivery. 2014-2015 Highlights TCCD transformed the organization formerly known as Continuing Education into a new struc-ture: Community and Industry Education (CIE). This new name and structure accommodate not only the programs TCCD has in place today, but those that may be added in the future. Community and Industry Education consists of four clear program units: Lifelong Learning, Workforce Training and Certifications, Preparatory Education, and Profes-sional Seminars and Conferences. TCCD graduated 7,340 students during the 2014-2015 school year, representing a 53 percent increase in number of degrees and certificates conferred in the past four years despite simultaneous enrollment in-creases of only 3 percent.
Tarrant County College’s Northwest Campus opened the long-awaited Center of Excellence in Aviation, Transportation and Logistics (CEATL), providing significantly expanded training opportuni-ties not just in Aviation, but in Logistics and Supply Chain Management as well. To date, five Associate Degree programs and 10 certificate programs are offered at this location.

vi
TCCD’s year-long celebration of its 50-year legacy of service to the community culminated in August with a free public event at Panther Island on the Trinity River in downtown Fort Worth. The hall-mark event, “TCCD Proud: Celebrating 50 Years,” included “Over the Years,” a historical tribute; greet-ings and proclamations from elected officials; and a bond-burning ceremony in honor of TCCD’s final payment on its last general obligation bond, making it debt-free for the first time in its history. Partici-pants also enjoyed “Doing Up the Decades” – per-formances from each campus highlighting the last five decades, and the “Education Try-Way,” where participants tried their hand at flying with a laptop flight simulator, recorded their memories of TCCD in the Radio/TV/Film studio, learned to spell their names in sign language and enjoyed chocolate-dipped fruit while checking out TCCD programs and services showcased in tents on the banks of the Trinity River. The Fort Worth Chamber of Commerce honored TCCD with the Chairman’s Spirit of Enterprise Award at the Chamber’s 133rd annual meeting. Ini-tiated in 1975, the award recognizes companies that have made significant contributions to the city’s ad-vancement and prosperity while reflecting the strengths of the American private enterprise system. TCCD becomes only the second higher education institution to be honored with the Spirit of Enter-prise Award, and was lauded for its annual econom-ic impact in Tarrant County of $444.8 million.
Institutional Excellence TCCD prides itself on putting “Success Within Reach” by virtue of its commitment to affordability, accessibility and diversity that is reflective of the community. Of all the Big 10 Community Colleges in Texas, TCCD has the second-lowest tuition. In 2014-2015, TCCD also completed the work it be-gan two years ago to move to common course mate-rials for all TCCD courses. The anticipated benefits were two-fold: first, creating consistency across all TCCD campuses and second, to help students save some of their precious dollars while ensuring they would have access to the materials they needed to succeed. Currently, 97% of TCCD’s classes now have common course materials selected. High school students and their families are looking for every possible way to make college a reality, which is why the programs TCCD offers to foster a college-going culture are so critical. Our Early Col-lege High Schools underscore our commitment to this very thing – creating a college-going culture.
Financial Information Internal Controls District management is responsible for establishing and maintaining internal controls designed to ensure that the assets of the District are protected from loss, theft, or misuse and to ensure that adequate account-ing data are compiled to allow for the preparation of financial statements in conformity with generally

vii
accepted accounting principles. The internal con-trols are designed to provide reasonable, but not ab-solute, assurance that these objectives are met. The concept of reasonable assurance recognizes that: (1) the cost of a control should not exceed the benefits likely to be derived; and (2) the valuation of costs and benefits requires estimates and judgments by management. Single Audit As a recipient of federal, state, and local financial assistance, the District also is responsible for ensur-ing that adequate internal control is in place to com-ply with applicable laws and regulations related to those programs. This internal control is subject to periodic evaluation by management and the inde-pendent auditors of the District. As a part of the District’s single audits, described earlier, tests are made to determine the adequacy of the internal con-trol, including that portion related to federal and state awards programs, as well as to determine that the District has complied with applicable laws and regulations. The Schedules of Findings and Ques-tioned Costs for the District’s Federal and State Sin-gle Audits for the fiscal year ended August 31, 2015 are included on pages 106 and 113, respectively. Budgeting Controls The District continues to apply budgetary controls and accounting on a fund basis. The objective of these budgetary controls is to ensure compliance with legal provisions embodied in the annual appro-priated budget approved by the District’s Board of Trustees. Activities of the unrestricted current fund, auxiliary enterprises fund, and retirement of indebt-edness fund are included in the annual appropriated budget. The District also maintains an encumbrance accounting system as one technique of accomplish-ing budgetary control. Encumbered amounts lapse at year-end. However, encumbrances are re-appropriated as part of the next year’s budget. All funds are included in the consolidated financial statements presented, although the funds are not sep-arately reported in the CAFR under GASB 34 and 35. (See Note 2 to the Financial Statements, Sum-mary of Significant Accounting Policies, pages 16-20)
As demonstrated by the statements and schedules included in the financial section of this report, the District continues to meet its responsibility for sound financial management.
Debt Administration As previously mentioned, during TCCD’s 50th Cele-bration, Chancellor Hadley, former Chancellor de la Garza, and the Board of Trustees participated in a bond burning ceremony. The District becoming debt-free was due in part to policies initiated in 1998 when the Board of Trustees adopted the “pay-as-you-go” strategy. Current and planned capital expendi-tures will be funded from District investments or budget resources. As a result, Tarrant County citi-zens get their money’s worth – dollar for dollar – rather than seeing about a third of all capital outlay funds going to pay interest on bonds. Students are winners, too, as the District is able to add more and better facilities. This cash basis “pay-as-you-go” ap-proach to capital funding is unique to TCCD among the 50 Texas public community colleges. Manage-ment’s Discussion and Analysis provides additional detail on implementation of the District’s financial strategy.
Independent Audit State statute requires an annual audit by independ-ent certified public accountants. The purpose of an independent audit is to provide assurance, based on

viii
independent review and testing, that the basic finan-cial statements and accompanying notes are fairly stated in all material respects. The District’s Board of Trustees selected the accounting firm of Weaver and Tidwell, L.L.P. In addition to meeting the re-quirements set forth in state statutes, their audit also was designed to meet the requirements of the Feder-al Single Audit Act Amendments of 1996 and relat-ed OMB Circular A-133 and the State Single Audit related to the Uniform Grant Management Stand-ards Single Audit Circular. The auditor’s reports re-lated specifically to the single audits are included in the Single Audit Sections.
Awards The Government Finance Officers Association of the United States and Canada (GFOA) awarded a Certificate of Achievement for Excellence in Finan-cial Reporting to the District for its comprehensive annual financial report for the fiscal year ended Au-gust 31, 2014. This was the twenty-third consecutive year that the District has achieved this prestigious award. In order to be awarded a Certificate of Achievement, a District must publish an easily read-able and efficiently organized comprehensive annual financial report. The report must satisfy both gener-ally accepted accounting principles and applicable legal requirements. A Certificate of Achievement is valid for a period of one year. We believe that our current comprehen-sive annual financial report continues to meet the Certificate of Achievement Program’s requirements, and we are submitting it to the GFOA in anticipa-tion of another certificate.
Acknowledgments We are grateful to the Board of Trustees for its dili-gent planning and oversight of the financial opera-tions of the District. We would particularly like to acknowledge the Chancellor and the Chancellor’s Executive Leadership Team for providing the re-sources necessary to prepare this financial report. Finance Department employees are recognized for their contributions to the completion of this report.
We would also like to thank the accounting firm of Weaver and Tidwell, L.L.P., for its timely comple-tion of the audit. Sincerely,
Mark E. McClendon Vice Chancellor for Finance
Nancy H. Chang Associate Vice Chancellor for Finance
Stan Vick, C.P.A. Director of Accounting
Linzy R. Brannan, C.P.A. Chief Accountant

ix

x
Tarrant County College District Elected Officials August 31, 2015
Louise Appleman President of the Board
Term Expires: May 2019
O.K. Carter Secretary of the Board
Term Expires: May 2017
Conrad C. Heede Vice President of the Board
Term Expires: May 2021
Bill Greenhill Assistant Secretary of the Board
Term Expires: May 2017
Teresa Ayala Member of the Board
Term Expires: May 2021
Gwendolyn Morrison Member of the Board
Term Expires: May 2019
Kristin Vandergriff Member of the Board
Term Expires: May 2021

xi
Tarrant County College District Principal Officials August 31, 2015
Administrative Officials
Chancellor Erma C. Johnson Hadley, M.Ed. President, Southeast Campus Bill Coppola, Ph.D. President, Trinity River Campus Tahita M. Fulkerson, Ph.D. Vice Chancellor for Communications and External Affairs Reginald Gates, M.Ed. Vice Chancellor for Academic Affairs and Student Success Joy Gates Black, Ed.D. President, Northeast Campus Allen Goben, Ed.D. President, South Campus Peter Jordan, Ed.D. President, Northwest Campus Elva C. LeBlanc, Ph.D. Vice Chancellor for Institutional Intelligence and Technology Timothy Marshall, M.S. Vice Chancellor for Finance Mark McClendon, M.S., M.B.A. President, TCC Connect Carlos Morales, Ph.D. Vice Chancellor for Real Estate and Facilities Nina Petty, B.B.A. Vice Chancellor for Administration and General Counsel Angela Robinson, J.D.
Finance Officials
Associate Vice Chancellor for Finance Nancy H. Chang, M.B.A. Director of Accounting Stan L. Vick, C.P.A. Chief Accountant Linzy R. Brannan, C.P.A.

xii
Tarrant County College District
Chancellor’s Executive Leadership Team

FINANCIAL SECTION
FIN
AN
CIA
L SEC
TIO
N

AN INDEPENDENT MEMBER OF BAKER TILLY INTERNATIONAL
WEAVER AND TIDWELL LLP CERTIFIED PUBLIC ACCOUNTANTS AND ADVISORS
2821 WEST SEVENTH STREET, SUITE 700, FORT WORTH, TX 76107 P: 817.332.7905 F: 817.429.5936
1
INDEPENDENT AUDITOR'S REPORT To the Board of Trustees Tarrant County College District Report on the Financial Statements We have audited the accompanying Statements of Net Position of Tarrant County College District (the District) as of August 31, 2015 and 2014, the related Statements of Revenues, Expenses and Changes in Net Position and Cash Flows for the years then ended and the related notes to the financial statements. Management’s Responsibility for the Financial Statements Management is responsible for the preparation and fair presentation of these financial statements in accordance with accounting principles generally accepted in the United States of America; this includes the design, implementation, and maintenance of internal control relevant to the preparation and fair presentation of financial statements that are free from material misstatement, whether due to fraud or error. Auditor’s Responsibility Our responsibility is to express an opinion on these financial statements based on our audits. We conducted our audits in accordance with auditing standards generally accepted in the United States of America and the standards applicable to financial audits contained in Government Auditing Standards, issued by the Comptroller General of the United States. Those standards require that we plan and perform the audit to obtain reasonable assurance about whether the financial statements are free from material misstatement. An audit involves performing procedures to obtain audit evidence about the amounts and disclosures in the financial statements. The procedures selected depend on the auditor’s judgment, including the assessment of the risks of material misstatement of the financial statements, whether due to fraud or error. In making those risk assessments, the auditor considers internal control relevant to the entity’s preparation and fair presentation of the financial statements in order to design audit procedures that are appropriate in the circumstances, but not for the purpose of expressing an opinion on the effectiveness of the entity’s internal control. Accordingly, we express no such opinion. An audit also includes evaluating the appropriateness of accounting policies used and the reasonableness of significant accounting estimates made by management, as well as evaluating the overall presentation of the financial statements. We believe that the audit evidence we have obtained is sufficient and appropriate to provide a basis for our audit opinion.

To the Board of Trustees Tarrant County College District Page 2
2
Opinion In our opinion, the financial statements referred to above present fairly, in all material respects, the financial position of the District as of August 31, 2015 and 2014, and the results of its operations and its cash flows for the years then ended, in accordance with accounting principles generally accepted in the United States of America. Emphasis of Matter Change in Accounting Principle As discussed in Note 2, the District implemented Governmental Accounting Standards Board (GASB) Statement No. 68, Accounting and Financial Reporting for Pensions – An Amendment of GASB Statement No. 27 and GASB Statement No. 71, Pension Transition for Contributions Made Subsequent to the Measurement Date – An Amendment of GASB Statement No. 68, effective September 1, 2014. The implementation of these statements resulted in a restatement of net position as of August 31, 2014 in the amount of $46,603,458. Our opinion is not modified with respect to this matter. Other Matters Required Supplementary Information Accounting principles generally accepted in the United States of America require that the management’s discussion and analysis on pages 4 through 11, Schedule of the District’s Proportionate Share of the Net Pension Liability, Schedule of the District’s Contributions and Notes to Required Supplementary Information on pages 44 to 46 be presented to supplement the basic financial statements. Such information, although not a part of the basic financial statements, is required by the Governmental Accounting Standards Board, who considers it to be an essential part of financial reporting for placing the basic financial statements in an appropriate operational, economic, or historical context. We have applied certain limited procedures to the required supplementary information in accordance with auditing standards generally accepted in the United States of America, which consisted of inquiries of management about the methods of preparing the information and comparing the information for consistency with management’s responses to our inquiries, the basic financial statements, and other knowledge we obtained during our audit of the basic financial statements. We do not express an opinion or provide any assurance on the information because the limited procedures do not provide us with sufficient evidence to express an opinion or provide any assurance. Other Information Our audits were conducted for the purpose of forming an opinion on the basic financial statements. The introductory section on pages i to xii, the statistical section on pages 57 to 95 and the additional financial information on pages 48 to 55 are presented for the purposes of
To the Board of Trustees Tarrant County College District Page 3
3
additional analysis and are not a required part of the basic financial statements. The schedules of expenditures of federal and state awards, as required by U.S. Office of Management and Budget Circular A-133, Audits of States, Local Governments, and Non-Profit Organizations, are also presented for purposes of additional analysis and are also not a required part of the basic financial statements. The additional financial information and schedules of expenditures of federal and state awards are the responsibility of management and were derived from and relate directly to the underlying accounting and other records used to prepare the basic financial statements. Such information has been subjected to the auditing procedures applied in the audits of the basic financial statements and certain additional procedures, including comparing and reconciling such information directly to the underlying accounting and other records used to prepare the basic financial statements or to the basic financial statements themselves, and other procedures in accordance with auditing standards generally accepted in the United States of America. In our opinion, the additional financial information and the schedules of expenditures of federal and state awards are fairly stated, in all material respects, in relation to the basic financial statements as a whole. The introductory and statistical sections have not been subjected to the auditing procedures applied in the audits of the basic financial statements and, accordingly, we do not express an opinion or provide any assurance on them. Other Reporting Required by Government Auditing Standards In accordance with Government Auditing Standards, we have also issued our report dated December 11, 2015 on our consideration of the District's internal control over financial reporting and on our tests of its compliance with certain provisions of laws, regulations, contracts, and grant agreements and other matters. The purpose of that report is to describe the scope of our testing of internal control over financial reporting and compliance and the results of that testing, and not to provide an opinion on internal control over financial reporting or on compliance. That report is an integral part of an audit performed in accordance with Government Auditing Standards in considering the District’s internal control over financial reporting and compliance. WEAVER AND TIDWELL, L.L.P. Fort Worth, Texas December 11, 2015

4
Introduction The following Management’s Discussion and Analy-sis (MD&A) reviews the District’s financial activity during the fiscal years ended August 31, 2015, 2014 and 2013. The MD&A is based on currently known facts, decisions, and conditions that have an impact on financial activities of the District and other key financial data as required by GASB 34. It should be read in conjunction with the transmittal letter (pages ii-viii), the District’s basic financial statements (pages 12-15) and the notes to the financial state-ments (pages 16-42). Responsibility for the com-pleteness and fairness of the information in this sec-tion rests with the District management.
Understanding the Financial Statements
The financial statement presentation was mandated by Governmental Accounting Standards Board (GASB) Statement No. 34 and implemented by the District in fiscal 2002. For financial statement pur-poses, the District is considered a special-purpose government engaged only in business-type activities. Accordingly, the financial statements of the District are presented using the economic measurement fo-cus and the accrual basis of accounting. Under the accrual basis of accounting, revenues are recognized when earned, and expenses are recorded when an obligation has been incurred. All significant intra-agency transactions have been eliminated. (A de-tailed discussion of the reporting and accounting pol-icies of the District may be found in Note 2 to the financial statements, pages 16-20.) The financial statements are comprised of the following compo-nents. Report of Independent Auditors presents an unmodi-fied opinion rendered by an independent certified public accounting firm, Weaver and Tidwell LLP,
on the fairness (in all material respects) of the finan-cial statements. Statement of Net Position (SNP) provides a snapshot of the District’s assets, liabilities and deferred out-flows and inflows of resources at the end of the fiscal year presented. The District’s net position is the dif-ference between: (a) assets and deferred outflows of resources and (b) liabilities and deferred inflows of resources, and is subdivided into three categories to indicate limitations on the use of net position:
● Net Investment in Capital Assets is not availa-ble for use since these are the resources that have been invested in capital assets such as land, buildings and improvements, and equipment of the District.
● Restricted Net Position is not accessible for gen-eral use because of third-party restrictions on the use of such assets.
● Unrestricted Net Position is available for gen-eral use as directed by the management of the District.
Statement of Revenues, Expenses, and Changes in Net Position (SRECNP) presents the revenues earned and the expenses incurred as a result of the District’s op-erations during the fiscal year. Revenues and ex-penses are categorized as operating, non-operating, or other related activities in accordance with GASB 34 as interpreted by the Texas Higher Education Co-ordinating Board. Statement of Cash Flows (SCF) presents information related to cash inflows and outflows summarized by operating, capital and non-capital financing, and investing activities. It provides relevant information when evaluating the financial viability of the District during the fiscal years ended August 31, 2015 and 2014. The SCF can be used to assess the District’s ability to meet current and future financial obliga-tions.

5
Notes to the Financial Statements (Notes) provide addi-tional information to clarify and expand on the fi-nancial statements.
Required Supplementary Information is supporting information that the GASB has concluded is essen-tial for placing basic financial statements and notes to basic financial statements in an appropriate opera-tional, economic, or historical context.
Supplementary Data is supporting information that is presented for the purposes of additional analysis or that the GASB has concluded is essential for placing basic financial statements and notes to basic finan-cial statements in an appropriate operational, eco-nomic, or historical context.
Fiscal Year 2015 Financial Highlights ● In the fiscal year ended August 31, 2015, total
District revenues exceeded total expenses by $32.3 million as a result of careful budgeting, pru-dent fiscal management and conservation of re-sources.
● During the fiscal year, the District capitalized $14.7 million of capital improvements on existing properties.
Statement of Net Position The Statement of Net Position includes all assets, liabilities, and deferred outflows and inflows of re-sources. Changes in net position that occur over time can indicate improvement or erosion of the Dis-trict’s financial condition when considered with non-financial facts such as enrollment levels, the condi-tion of facilities, etc. Total assets increased by $14.8 million during fiscal year 2015, and $30.6 million during fiscal year 2014 and total liabilities increased $23.9 million for fiscal year 2015 and decreased $6.7 million for fiscal year 2014. ● Current Assets increased by $36.3 million during
fiscal year 2015, and increased by $37.5 million during fiscal year 2014. The 2015 increase is pri-
marily due to an increase in short-term invest-ments. The 2014 increase is also attributable to an increase in short-term investments. Current assets consist mainly of cash, short-term invest-ments, and receivables. Cash and short-term in-vestments are maintained at levels necessary to cover current liabilities as they come due and to ensure adequate liquidity as funds are needed for expenditures associated with building and expan-sion projects. Receivables are from students, property taxes, and grants and contracts. At year-end 2015, current assets increased from the prior year 10.7 percent of total assets to the current year 13.7 percent of total assets; long-term investments decreased from the prior year 13.4 percent of total assets to the current year 9.7 percent of total as-sets; and capital assets increased from the prior year 75.9 percent of total assets to current year 76.6 percent of total assets. The trends for long-term investments and capital assets will fluctuate with the spending schedule in future years based on planned construction and renovation projects.
● Non-current Assets decreased by 2.1 percent, or
$21.5 million, for fiscal year 2015, and decreased $6.9 million (0.7 percent) for fiscal year 2014. The 2015 decrease is due to a decrease in long-term investments. The majority of the capital asset
Condensed Statements of Net PositionAugust 31(Dollars in millions)
2015 20142014-15 Change
20132013-14 Change
Current Assets $156.6 $120.3 $36.3 $82.8 $37.5
Non-Current Assets:
Long-Term Investments 110.6 151.5 (40.9) 169.7 (18.2)
Capital Assets, net 876.3 856.9 19.4 845.6 11.3Total Assets 1,143.5 1,128.7 14.8 1,098.1 30.6
Deferred Outflows 7.4 7.4
Current Liabilities 53.1 65.3 (12.2) 59.1 6.2
Non-Current Liabilities 45.3 9.2 36.1 22.1 (12.9)
Total Liabilities 98.4 74.5 23.9 81.2 (6.7)
Deferred Inflows 12.6 12.6
Net Investment in Capital Assets 871.3 839.0 32.3 816.9 22.1
Restricted 6.8 8.9 (2.1) 6.6 2.3
Unrestricted 161.8 206.3 (44.5) 193.4 12.9Total Net Position 1,039.9$ 1,054.2$ (14.3)$ 1,016.9$ 37.3$

6
value is in property and equipment, with addi-tional construction continually ongoing. Proper-ty, plant and equipment, net of depreciation, in-creased by $19.4 million compared to year end 2014. This increase, net of current year deprecia-tion of $29.9 million, reflects spending on various ongoing capital improvement projects.
Deferred Outflows of Resources - The imple-mentation of GASB 68 this year resulted in the recording of deferred outlfows of resources related to pensions for the year ended August 31, 2015 in the amount of $7.4 million.
Current Liabilities decreased $12.2 million and non-current liabilities increased $36.1 million for the year ended August 31, 2015. Current liabili-ties of $53.1 million were comprised of accounts payable, accrued liabilities, accrued employee benefits, unearned revenue, and the current por-tion of a note payable. Accounts payable and ac-crued expenses for goods and services received prior to the end of the fiscal year decreased $4.3 million. The current portion of the District’s long-term debt at fiscal year-end of $5.0 million de-creased by $8.0 million over the fiscal 2014 amount. (See Notes 6 and 7, pages 24-26, for ad-ditional information regarding the bond indebted-ness and the note payable.)
Non-current Liabilities primarily consist of ac-crued employee benefits and net pension liability as required by GASB 68. Total non-current liabil-ities were $45.3 million at August 31, 2015
(including net pension liability of $41.1 million)versus $9.2 million at August 31, 2014.
● Deferred Inflows of Resources - The implemen-
tation of GASB 68 this year resulted in the record-ing of deferred inflows of resources related to pen-sions for the year ended August 31, 2015 in the amount of $12.6 million.
● Net Position (total assets and deferred outflows
less total liabilities and deferred inflows) de-creased $14.3 million, or 1.4 percent. This was primarily due to the requirements of GASB 68
Comparative Composition of Assets, Liabilities, Deferred Outflows and In-flows, and Net Position Years Ended August 31 (Dollars in Millions)
2015
2014
2013
$871
$839
$817
$162
$206
$193
$7
$9
$7
NET POSITION
Restricted Unrestricted Invested in Capital Assets
2015
2014
2013
$53
$65
$59
$45
$9
$22
LIABILITIES
Non‐Current Liabilities Current Liabilities
2015
2014
2013
$157
$120
$83
$111
$152
$170
$876
$857
$846
ASSETS
Capital Assets LT Investmen ts Curren t Assets

7
whereby individual institutions must record the present value of projected pension payments. Net investment in capital assets, $871.3 million, repre-sents 83.8 percent of net position, which reflects the District’s substantial investment in capital as-sets such as property, buildings, and equipment. Restricted net position such as grants from third-party agencies with expenditure restrictions, stu-dent loan funds, or assets designated for debt ser-vice represented an additional 0.6 percent of net position. The remaining unrestricted net position may be used for educational or general operations of the District. Unrestricted net position de-creased $44.5 million, and represents 15.6 percent of net position. During fiscal year 2015, the net position designated for future capital outlay de-creased by $8.0 million to $19.7 million. The por-tion of net position committed to capital assets is expected to remain substantial with the ongoing improvements district wide.
Statement of Revenues, Expenses, and Changes in Net Position The Statement of Revenues, Expenses and Changes in Net Position presents the revenues earned and the expenses incurred during the year. Activities are reported as either operating or non-operating. Oper-ating revenues represent the amounts received from customers in exchange for services provided by the District. Operating expenses are the costs incurred to provide District services to customers. Operating revenues include activities with characteristics of exchange transactions such as student tuition and fees (net of scholarship discounts and allowances), sales and services of auxiliary enterprises, some fed-eral, state, and local grants and contracts, and inter-est on institutional student loans. Non-operating revenues include activities that have the characteris-tics of non-exchange transactions such as ad valorem taxes, state appropriations, other federal grants and investment income. Depreciation on capital assets is included in operating expenses. Since state appro-priations and county tax revenue are a significant portion of maintenance and operations funding, clas-sification of this revenue as non-operating will usual-
ly result in an operating loss, as it does for the Dis-trict for fiscal year 2015. Revenues Total revenues decreased $6.4 million, or 1.6 per-cent, over the prior year to $405.3 million in 2015. For fiscal 2014, total revenue was $411.7 million. The decrease for fiscal 2015 is primarily the result of a decrease in grants and contracts. For fiscal year 2014 the increase of $12.8 million was primarily due to a slight increase in property taxes, state appropria-tions, and investment income and other. Operating Revenues Operating revenue decreased $3.4 million in 2015, or 4.7 percent over 2014, to $69.2 million. In fiscal year 2014, operating revenue increased 1.1 percent over 2013. The primary source of operating revenue has continually been tuition and fees. Revenue from tuition and fees increased $0.1 million or 0.2 percent over 2014 to $49.5 million. For the
Years Ended August 31(Dollars in millions)
2015 20142014-15 Change
20132013-14 Change
Operating RevenueTuition & Fees 49.5$ 49.4$ 0.1$ 50.2$ (0.8)$ Grants & Contracts 11.6 14.1 (2.5) 12.5 1.6 Auxiliary Enterprises 3.4 2.8 0.6 2.9 (0.1) Other Operating Revenue 4.7 6.3 (1.6) 6.2 0.1 Total Operating Revenue 69.2 72.6 (3.4) 71.8 0.8
Operating Expenses
Instruction 130.7 123.3 7.4 115.8 7.5 Public Service 9.2 8.1 1.1 8.3 (0.2) Academic Support 29.0 27.6 1.4 24.8 2.8 Student Services 31.5 29.6 1.9 28.8 0.8 Institutional Support 40.9 39.7 1.2 39.3 0.4 Operation & Maintenance of Plant 33.2 38.4 (5.2) 34.7 3.7 Scholarships & Fellowships 64.5 75.7 (11.2) 76.4 (0.7) Auxiliary Enterprises 3.8 2.8 1.0 2.2 0.6 Depreciation 29.9 29.2 0.7 27.4 1.8 Total Operating Expenses 372.7 374.4 (1.7) 357.7 16.7
Operating Loss (303.5) (301.8) (1.7) (285.9) (15.9)
Non-Operating Revenue (Expense)
State Appropriations 70.0 69.2 0.8 63.3 5.9 Ad Valorem Tax 197.4 187.8 9.6 182.2 5.6 Grants & Contracts 66.3 76.7 (10.4) 80.4 (3.7) Investment & Other Income 2.4 5.3 (2.9) 1.1 4.2 Non-Operating Expense (0.3) - (0.3) - - Total Non-Operating Revenue (Expense) 335.8 339.0 (3.2) 327.0 12.0
Income before Other Revenue,
(Expense), Gains & (Losses) 32.3 37.2 (4.9) 41.1 (3.9)
Other Revenue-Gifts - 0.1 (0.1) 0.1 - Increase in Net Position 32.3 37.3 (5.0) 41.2 (3.9) Net Position
Net Position-Year Beginning 1,054.2 1,016.9 37.3 975.7 41.2 Change in Accounting Principle (46.6) (46.6) Total Revenue 405.3 411.7 (6.4) 398.9 12.8 Total Expenses (373.0) (374.4) 1.4 (357.7) (16.7) Net Position-Year End 1,039.9$ 1,054.2$ (14.3)$ 1,016.9$ 37.3$
Condensed Statements of Revenues, Expenses, and Changes in Net Position

8
per hour. Out-of-County tuition was increased $3 to $76 per hour, and Non-Resident tuition was in-creased $6 to $171 per hour. Beginning in spring 2013, In-County tuition was increased $3 to $55 per hour; Out-of-County tuition was increased $10 to $86 per hour; and Non-Resident tuition was in-creased $34 to $205 per hour. Those tuition rates remain in effect until spring 2016 when the following changes will occur: In County rate will be $59 per hour; Out-of-County rate will be $106 per hour; Out-of-State and Non-Resident rate will be $255 per hour. Non-Operating Revenues (Expense) Non-operating revenues (expense) decreased from $339.0 million to $335.8 million for the fiscal years ended August 31, 2015 and 2014, respectively. For fiscal 2013, non-operating revenue was $327.0 mil-lion. For 2015, non-operating revenue consists pre-dominantly of ad-valorem taxes of $197.4 million, which increased by $9.6 million or 5.1 percent, and state appropriations of $70.0 million, which in-creased by $0.8 million or 1.2 percent. In 1998, the Board of Trustees of the Tarrant County College District, acting on the chancellor’s recom-mendation, altered the traditional approach of rely-ing on bonded indebtedness for new construction, repair and renovation, and major equipment pur-chases. Instead, the District elected to fund such expenditures from maintenance and operations tax revenue. In August 2002, the Board of Trustees of the District set the tax rate at 13.938 cents per $100 valuation. Since that time the Board of Trustees in-creased the tax rate to 14.897 for 2012 and 2013, and increased the tax rate to 14.950 beginning in 2014. State Appropriations to the Tarrant County College District, as to all Texas public colleges and universi-ties, are set during biennial sessions of the Texas Legislature. The level of funding for each biennium is derived from enrollment during a “base year”- the total number of contact hours amassed during a peri-od beginning the summer preceding the legislative session and ending with the spring semester during which the appropriations bill is passed. Texas com-munity colleges have attempted for decades, without
Total Revenue by Source Fiscal Year 2014-15 Total $405.3 (Dollars in millions)
fiscal years 1996 through 2001, the District main-tained a policy of increasing the in-district tuition rate by $2 per hour per year. After 2001, in response to a call from the Texas Higher Education Coordi-nating Board to hold the line on tuition increases as part of the “Closing the Gaps Plan” for higher edu-cation, the amount of tuition increase at TCCD was reduced to $1 per hour per year. Beginning in spring 2004, state universities in Texas were able to set their own levels of tuition for the first time. Subsequently some state universities imposed substantial tuition increases, which resulted in a greater number of stu-dents seeking more affordable tuition rates such as those offered at TCCD. Support for this growth had to be funded by the two local sources of revenue – tuition and taxes. Planning in that regard, the Board approved a three-year tuition increase plan of $2 per year beginning with the 2005 year. Following this three-year plan, In-County tuition was not increased. However, Out-of-district tuition increased by $10 to $73 per hour and the Non-resident tuition increased by $15 to $165 per hour in the spring of 2008. Since then, there were no increases until Spring 2012, when In-County tuition was increased by $2 to $52
0.8%
1.8%
12.2%
17.3%
19.2%
48.7%
Auxiliary Enterprises
Investment & Other Income
Tuition and Fees
State Appropriations
Grants and Contracts
Ad Valorem Tax

9
success, to achieve “full formula funding”. The Dis-trict, together with the other community colleges in Texas, is being asked to do more with less. As State resources allocated to community colleges decline, the District must look more and more to local tax revenues and tuition and fees as a source of revenue to provide educational services for the community. State appropriations accounted for 35 percent of to-tal (operating and non-operating) revenue in fiscal 1998, and declined to 16.8 percent of revenue in 2014. For 2015, state appropriations accounted for 17.3 percent of revenue. In contrast, local property taxes accounted for 21.0 percent of total revenue in fiscal 1998 and 48.7 percent of revenue in 2015. Tui-tion and fees were $49.5 million in fiscal 2015 and $49.4 in fiscal 2014, and slightly increased as a per-centage of total revenue to 12.2 percent in 2015 from 12.0 percent in 2014. Grants and contracts have decreased from $90.8 mil-lion in 2014 to $77.9 million in 2015, and are 19.2 percent of total revenues. During fiscal 2013, reve-nues from grants and contracts were $92.9 million. This source of revenue includes restricted revenues made available by government agencies as well as private agencies. Grant funding is recognized as rev-enue at the point when all eligibility requirements
imposed by the provider have been met.
Auxiliary enterprise expense exceeded auxiliary en-terprise revenue by $0.4 million for fiscal 2015. Auxiliary enterprises include various enterprise enti-ties that exist predominantly to furnish goods or ser-vices to students, faculty, staff or the general public and charge a fee directly related to the cost of those goods or services. These enterprises are intended to be self-supporting. During fiscal 2015, the District recorded a $0.6 million increase in sales revenues from operations at our auxiliary enterprises. Fiscal year 2015 investment and other income de-creased by $2.9 million to $2.4 million compared to a $4.2 million increase for the prior year. (See Note 4, page 24, for additional information on investment earnings and portfolio market adjustments.) Expenses Total expenses for fiscal 2015 decreased $1.4 million to $373.0 million from $374.4 million for fiscal 2014. For fiscal 2013, total expenses were $357.7 million. The current year decrease is mostly attributable to reduced scholarship and fellowship expense and op-erating and maintenance of plant expense in fiscal year 2015. Operating expenses decreased by $1.7 million to $372.7 million, a decrease of 0.5 percent from fiscal 2014. For fiscal 2013, operating expenses were $357.7 million. Significant fluctuations in 2015 op-erating expenses are as follows: ● Salaries and wages increased $7.4 million to
$164.7 million
Revenue by Source Years Ended August 31 (Dollars in millions)
$0 $100 $200 $300 $400 $500 $600
Other
Tuition & Fees
Grants & Contracts
State Appropriations
Ad Valorem Tax
2015 2014 2013
Years Ended August 31(Dollars in millions)
2015 20142014-15 Change
20132013-14 Change
Salary & Wages $164.7 $157.3 $7.4 $146.5 $10.8
Staff Benefits 47.7 45.1 2.6 43.4 1.7
Other Expenses 130.4 142.8 (12.4) 140.4 2.4
Depreciation 29.9 29.2 0.7 27.4 1.8
Total Operating Expenses 372.7$ 374.4$ (1.7)$ 357.7$ 16.7$
Operating Expense by Natural Classification

10
● Staff benefits increased by $2.6 million to $47.7 million
Other expenses decreased by $12.4 million to $130.4 million
An analysis of operating expenses by function indi-cates the most significant year-to-year percentage changes to be in auxiliary enterprises (increased 35.7 percent to $3.8 million) and scholarships and fellow-ships (decreased 14.8 percent to $64.5 million).
Statement of Cash Flows Cash receipts from operating activities are from tui-tion and fees, grants and contracts, and auxiliary enterprise activities. The primary cash outlays for operating activities are payments to or on behalf of employees and to vendors. As is typical for colleges, universities, and many other public sector entities using the GASB financial model, TCCD’s cash flow from operating activities was a deficit. The deficit was $261.5 million for fiscal 2015, $256.0 million for fiscal 2014, and $248.9 million for fiscal 2013. This is a reflection of the classification (mandated by
GASB Statement No. 9) of ad-valorem taxes, state appropriations, and Title IV grant revenue as non-operating activities, thus separating those revenues from the operating activities calculation. Cash generated from non-capital financing activities, predominantly local property taxes, was $318.7 mil-lion for 2015, $316.3 million for 2014, and $319.9 million for 2013. Cash used for capital and related financing activities was $62.5 million for 2015, $50.6 million for 2014, and $71.0 million for 2013. Cash provided by investing activities for 2015 was $4.8 million which reflects the purchase and maturi-ty of investments and interest income from invest-ments. This was $9.9 million more than cash used by investing activities for fiscal 2014 of $5.1 million. Cash and cash equivalents decreased by $0.5 million from $6.4 million at August 31, 2014 to $5.9 million at August 31, 2015.
Operating Expense by Function Years Ended August 31 (Dollars in millions)
$0
$20
$40
$60
$80
$100
$120
$140
Instruction Public Service AcademicSupport
StudentServices
InstitutionalSupport
Operation &Maintenance
of Plant
Scholarships&
Fellowships
AuxiliaryEnterprises
Depreciation
$131
$9
$29 $32 $41 $33
$65
$4
$30
$123
$8
$28 $30 $40 $38
$76
$3
$29
$116
$8 $25 $29
$39 $35
$76
$2
$27
2015 2014 2013
11
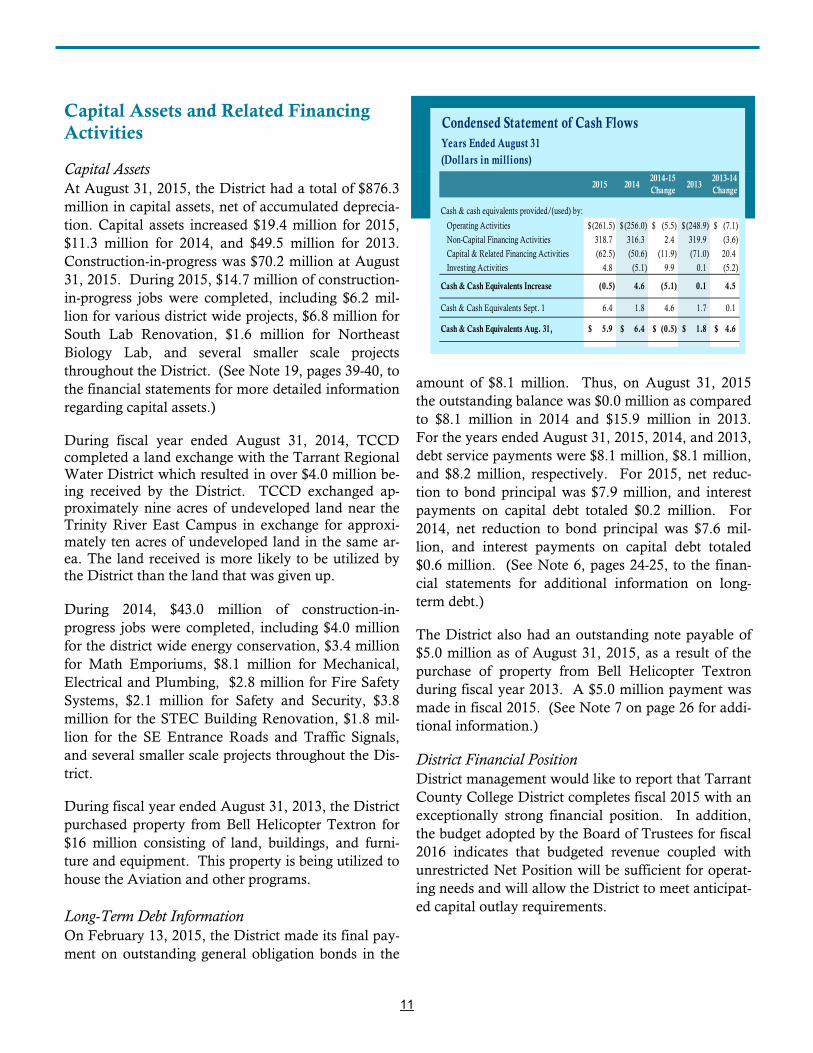
Capital Assets and Related Financing Activities Capital Assets At August 31, 2015, the District had a total of $876.3 million in capital assets, net of accumulated deprecia-tion. Capital assets increased $19.4 million for 2015, $11.3 million for 2014, and $49.5 million for 2013. Construction-in-progress was $70.2 million at August 31, 2015. During 2015, $14.7 million of construction-in-progress jobs were completed, including $6.2 mil-lion for various district wide projects, $6.8 million for South Lab Renovation, $1.6 million for Northeast Biology Lab, and several smaller scale projects throughout the District. (See Note 19, pages 39-40, to the financial statements for more detailed information regarding capital assets.)
During fiscal year ended August 31, 2014, TCCD completed a land exchange with the Tarrant Regional Water District which resulted in over $4.0 million be-ing received by the District. TCCD exchanged ap-proximately nine acres of undeveloped land near the Trinity River East Campus in exchange for approxi-mately ten acres of undeveloped land in the same ar-ea. The land received is more likely to be utilized by the District than the land that was given up. During 2014, $43.0 million of construction-in-progress jobs were completed, including $4.0 million for the district wide energy conservation, $3.4 million for Math Emporiums, $8.1 million for Mechanical, Electrical and Plumbing, $2.8 million for Fire Safety Systems, $2.1 million for Safety and Security, $3.8 million for the STEC Building Renovation, $1.8 mil-lion for the SE Entrance Roads and Traffic Signals, and several smaller scale projects throughout the Dis-trict.
During fiscal year ended August 31, 2013, the District purchased property from Bell Helicopter Textron for $16 million consisting of land, buildings, and furni-ture and equipment. This property is being utilized to house the Aviation and other programs. Long-Term Debt Information On February 13, 2015, the District made its final pay-ment on outstanding general obligation bonds in the
amount of $8.1 million. Thus, on August 31, 2015 the outstanding balance was $0.0 million as compared to $8.1 million in 2014 and $15.9 million in 2013. For the years ended August 31, 2015, 2014, and 2013, debt service payments were $8.1 million, $8.1 million, and $8.2 million, respectively. For 2015, net reduc-tion to bond principal was $7.9 million, and interest payments on capital debt totaled $0.2 million. For 2014, net reduction to bond principal was $7.6 mil-lion, and interest payments on capital debt totaled $0.6 million. (See Note 6, pages 24-25, to the finan-cial statements for additional information on long-term debt.)
The District also had an outstanding note payable of $5.0 million as of August 31, 2015, as a result of the purchase of property from Bell Helicopter Textron during fiscal year 2013. A $5.0 million payment was made in fiscal 2015. (See Note 7 on page 26 for addi-tional information.)
District Financial Position District management would like to report that Tarrant County College District completes fiscal 2015 with an exceptionally strong financial position. In addition, the budget adopted by the Board of Trustees for fiscal 2016 indicates that budgeted revenue coupled with unrestricted Net Position will be sufficient for operat-ing needs and will allow the District to meet anticipat-ed capital outlay requirements.
Condensed Statement of Cash FlowsYears Ended August 31
(Dollars in millions)
2015 20142014-15 Change
20132013-14 Change
Operating Activities (261.5)$ (256.0)$ (5.5)$ (248.9)$ (7.1)$
Non-Capital Financing Activities 318.7 316.3 2.4 319.9 (3.6)
Capital & Related Financing Activities (62.5) (50.6) (11.9) (71.0) 20.4
Investing Activities 4.8 (5.1) 9.9 0.1 (5.2)
Cash & Cash Equivalents Increase (0.5) 4.6 (5.1) 0.1 4.5
Cash & Cash Equivalents Sept. 1 6.4 1.8 4.6 1.7 0.1
Cash & Cash Equivalents Aug. 31, 5.9$ 6.4$ (0.5)$ 1.8$ 4.6$
Cash & cash equivalents provided/(used) by:

2015 2014ASSETS
Current assetsCash and cash equivalents 5,938,874$ 6,438,891$ Investments 120,018,090 82,590,429Accounts receivable, less allowance
for doubtful accounts of $13,821,570 and $10,672,700 in 2015 and 2014, respectively 11,440,097 10,316,773
Taxes receivable, less allowance for doubtful accounts of $2,340,116 and $2,090,709 in 2015 and 2014, respectively 4,861,026 4,803,181
Interest receivable 342,556 224,567Federal grants and contracts receivable 8,058,054 8,511,289State and local grants and contracts receivable 2,100,589 2,920,080Prepaid expenses and other current assets 3,864,197 4,474,703
Total current assets 156,623,483 120,279,913 Non-current assets
Investments 110,096,695 149,728,532Restricted investments 479,913 1,789,985Capital assets, net
Non-depreciable capital assets 143,545,686 114,097,350Depreciable capital assets 732,716,828 742,827,197
Total non-current assets 986,839,122 1,008,443,064 Total assets 1,143,462,605 1,128,722,977 DEFERRED OUTFLOWS OF RESOURCES
Deferred outflows related to pensions 7,364,151Deferred refunding costs 20,055
LIABILITIESCurrent liabilities
Accounts payable 11,924,003 17,684,007Accrued liabilities 8,269,810 6,783,511Accrued compensated absences 5,353,319 5,040,853Deposits held for others 377,776 390,235Unearned revenue 22,176,568 22,430,342Current portion of bonds payable 8,083,004Current portion of note payable 5,000,000 4,901,480
Total current liabilities 53,101,476 65,313,432 Non-current liabilities
Note payable 4,950,495 Accrued compensated absences 4,076,442 4,163,795Workers' compensation payable 88,178 130,401Net pension liability 41,132,646
Total non-current liabilities 45,297,266 9,244,691 Total liabilities 98,398,742 74,558,123 DEFERRED INFLOWS OF RESOURCES
Deferred inflows related to pensions 12,582,598
The Notes to Financial Statements are an integral part of these statements.
TARRANT COUNTY COLLEGE DISTRICTEXHIBIT 1
STATEMENTS OF NET POSITIONAUGUST 31, 2015 AND 2014
12

2015 2014NET POSITION
Net investment in capital assets 871,262,514$ 839,009,623$ Restricted for:
ExpendableStudent aid 6,617,434 7,143,143 Loans 143,862 142,266 Debt service 23,521 1,558,144
Total restricted 6,784,817 8,843,553
Unrestricted 161,798,085 206,331,733
Total net position (Schedule D) 1,039,845,416$ 1,054,184,909$
The Notes to Financial Statements are an integral part of these statements.
TARRANT COUNTY COLLEGE DISTRICTEXHIBIT 1
STATEMENTS OF NET POSITIONAUGUST 31, 2015 AND 2014
(continued)
13

2015 2014REVENUES
Operating revenuesTuition and fees, net of allowances and discounts of $13,592,252 and $15,472,087 in 2015 and 2014, respectively 49,478,068$ 49,371,002$ Federal grants and contracts 3,685,838 3,217,611 State grants and contracts 5,228,098 5,880,099 Non-governmental grants and contracts 2,727,036 4,946,370 Auxiliary enterprises 3,358,327 2,835,286 Other operating revenue 4,714,371 6,343,924
Total operating revenue (Schedule A) 69,191,738 72,594,292
EXPENSESOperating expenses
Instruction 130,672,056 123,303,575 Public service 9,188,202 8,099,598 Academic support 28,991,793 27,567,965 Student services 31,470,516 29,578,631 Institutional support 40,875,729 39,704,272 Operation and maintenance of plant 33,264,591 38,451,779 Scholarships and fellowships 64,561,713 75,701,812 Auxiliary enterprises 3,786,956 2,822,103 Depreciation 29,897,030 29,196,006
Total operating expenses (Schedule B) 372,708,586 374,425,741
Operating loss (303,516,848) (301,831,449)
NON-OPERATING REVENUES (EXPENSES)State appropriations 70,036,690 69,156,327 Maintenance ad-valorem taxes 190,805,920 179,789,467 Debt service ad-valorem taxes 6,616,686 8,036,819 Federal grants and contracts 66,314,027 76,657,485 Gifts 100,000 Investment income 1,467,880 3,653,612 Other income 910,990 959,439 Gain (loss) on disposal of assets (371,380) 732,136
Total non-operating revenue (Schedule C) 335,780,813 339,085,285 Increase in net position (Schedule D) 32,263,965 37,253,836
NET POSITION, BEGINNING OF YEAR,AS PREVIOUSLY REPORTED 1,054,184,909 1,016,931,073
Change in accounting principle (Schedule D) (46,603,458)
NET POSITION, BEGINNING OF YEAR, AS RESTATED 1,007,581,451
NET POSITION, END OF YEAR 1,039,845,416$ 1,054,184,909$
The Notes to Financial Statements are an integral part of these statements.
TARRANT COUNTY COLLEGE DISTRICTEXHIBIT 2
STATEMENTS OF REVENUES, EXPENSESAND CHANGES IN NET POSITION
YEARS ENDED AUGUST 31, 2015 AND 2014
14

2015 2014
CASH FLOWS FROM OPERATING ACTIVITIESReceipts from tuition and fees 47,877,014$ 47,572,165$ Receipts from grants and contracts 12,670,345 13,046,144 Payments to suppliers (149,794,290) (154,112,058) Payments to or on behalf of employees (181,105,799) (172,514,407) Receipts from auxiliary enterprise charges 3,208,327 2,685,286 Other receipts 5,627,407 7,305,699 Net cash used by operating activities (261,516,996) (256,017,171)
CASH FLOWS FROM NON-CAPITAL FINANCING ACTIVITIESReceipts from state appropriations 54,396,982 54,479,329 Receipts from non-operating federal revenue 66,929,290 73,787,670 Receipts from local property taxes 197,364,761 187,955,534 Receipts from gifts 100,000 Net cash provided by non-capital financing activities 318,691,033 316,322,533
CASH FLOWS FROM CAPITAL AND RELATED FINANCING ACTIVITIESPurchase of capital assets (49,645,122) (46,064,381) Proceeds from sale of assets 38,745 6,314,025 Payments on capital debt - principal (12,786,975) (10,550,000) Payments on capital debt - interest, net of interest capitalized 2015 of $194,263 and 2014 $295,390 (144,841) (279,035) Net cash used by capital and related financing activities (62,538,193) (50,579,391)
CASH FLOWS FROM INVESTING ACTIVITIESProceeds from sale and maturities of investments 719,047,872 453,773,647 Interest on investments 1,282,823 1,308,445 Purchase of investments (715,466,556) (460,228,342) Net cash provided (used) by investing activities 4,864,139 (5,146,250)
Net increase (decrease) in cash and cash equivalents (500,017) 4,579,721
CASH AND CASH EQUIVALENTS, BEGINNING OF YEAR 6,438,891 1,859,170
CASH AND CASH EQUIVALENTS, END OF YEAR 5,938,874$ 6,438,891$
RECONCILIATION OF OPERATING LOSS TO NET CASH USED BY OPERATING ACTIVITIESOperating loss (303,516,848)$ (301,831,449)$ Adjustments to reconcile operating loss to
net cash used by operating activities Depreciation 29,897,030 29,196,006 Non-cash state appropriations 15,639,708 14,676,998 Non- cash pension expense 3,801,988 Non-operating other income 913,036 961,775 Change in operating assets and liabilities
Receivables (465,861) (1,342,963) Prepaid expenses and other current assets 610,506 (1,870,819) Deferred outflows of resources (4,054,353) Accounts payable and accrued liabilities (4,299,036) 5,332,787 Accrued compensated absences 225,113 454,316 Deposits held for others (12,459) 9,988 Deferred revenue (255,820) (1,603,810)
Net cash used by operating activities (261,516,996)$ (256,017,171)$
SCHEDULE OF NON-CASH INVESTING ANDFINANCING ACTIVITIES
Change in fair value of investments (87,410)$ 2,385,159$ Land acquired under exchange contract $ 4,723,130$
The Notes to Financial Statements are an integral part of these statements.
TARRANT COUNTY COLLEGE DISTRICTEXHIBIT 3
STATEMENTS OF CASH FLOWSYEARS ENDED AUGUST 31, 2015 AND 2014
15

16
NOTE 1. REPORTING ENTITY The Tarrant County College District (the District) was established as a public junior college in an election held in Tarrant County, Texas on July 31, 1965. The two largest cities in Tarrant County are Fort Worth and Arling-ton. The District operates as a junior college district under the laws of the State of Texas and is considered to be a special purpose, primary government according to the definition in Government Accounting Standards Board (GASB) Statement No. 14. While the District receives funding from local, state and federal sources, and must comply with the spending, reporting and record keeping requirements of these entities, it is not a component unit of any other governmental entity. In addition, the District has considered all potential component units and no other entity meets the criteria for inclusion in the District’s reporting entity. NOTE 2. SUMMARY OF SIGNIFICANT ACCOUNTING POLICIES Report Guidelines The significant accounting policies followed by the District in preparing these financial statements are in accord-ance with the Texas Higher Education Coordinating Board’s Annual Financial Reporting Requirements for Texas Public Community and Junior Colleges. The District applies all applicable GASB pronouncements. The District is report-ed as a special-purpose government engaged in business-type activities. Tuition Discounting Certain tuition amounts are required to be set aside for use as scholarships by qualifying students. This set aside amount, called the Texas Public Education Grant (TPEG), is shown with tuition and fee revenue amounts as a separate set aside amount (Texas Education Code §56.033). When the award for tuition is used by the student, the amount is recorded as a tuition discount. If the amount is disbursed directly to the student, the amount is recorded as a scholarship expense. Certain Title IV HEA Program funds are received by the District to pass through to students. These funds are initially received by the District and recorded as restricted revenue. When the student is awarded and uses these funds for tuition and fees, the amounts are recorded as revenue and a corresponding amount is recorded as a tuition discount. If the amount is disbursed directly to the student, the amount is recorded as a scholarship ex-pense. The District awards tuition and fee scholarships from institutional funds to students who qualify. When these amounts are used for tuition and fees, the amounts are recorded as tuition and fee revenue and a corresponding amount is recorded as a tuition discount. If the amount is disbursed directly to the student, the amount is rec-orded as a scholarship expense. Basis of Accounting The financial statements of the District have been prepared using the economic resources measurement focus and the accrual basis of accounting. Revenues are recorded when earned and expenses are recorded when a lia-bility is incurred, regardless of the timing of related cash flows. Property taxes are recognized as revenues in the years for which they are levied. Grants and similar items are recognized as revenue as soon as all eligibility re-quirements imposed by the provider have been met. All significant internal activity has been eliminated. Encumbrance accounting, under which purchase orders, contracts, and other commitments for expenditures of

17
NOTE 2. SUMMARY OF SIGNIFICANT ACCOUNTING POLICIES-continued
Basis of Accounting– continued funds are recorded in order to reserve that portion of the applicable appropriation, is employed as an extension of formal budgetary integration. Under Texas law, appropriations lapse at August 31, and encumbrances out-standing at that time are to be either canceled or appropriately provided for in the subsequent year’s budget. Encumbrances outstanding as of August 31, 2015 of $19,152,060 have been provided for in the fiscal year 2016 budget. Budgetary Data Each community college in Texas is required by law to prepare an annual operating budget of anticipated reve-nues and expenditures for the fiscal year beginning September 1. The District’s Board of Trustees adopts the budget, which is prepared on the accrual basis of accounting. A copy of the approved budget and subsequent amendments must be filed with the Texas Higher Education Coordinating Board, Legislative Budget Board, Legislative Reference Library, and Governor’s Office of Budget and Planning by December 1. Cash and Cash Equivalents Cash and cash equivalents consist of cash on hand, demand deposits and short-term investments with original maturities of three months or less from the date of purchase. Investments In accordance with GASB Statement No. 31, Accounting and Financial Reporting for Certain Investments and Exter-nal Investment Pools, investments are reported at fair value. Fair values are based on published market rates. Short-term investments have an original maturity greater than three months but less than one year at the date of purchase. The governing board has designated public funds investment pools comprised of $112,102,616 and $75,703,658 at August 31, 2015 and 2014, respectively, to be short-term investments. Long-term investments have an original maturity of greater than one year at the date of purchase. Capital Assets Capital assets are recorded at cost at the date of acquisition, or fair value at the date of donation. For equip-ment, the District’s capitalization policy includes all items with a unit cost of $5,000 or more and an estimated useful life in excess of one year. Renovations to buildings, infrastructure and land improvements that signifi-cantly increase the value or extend the useful life of the structure are capitalized. The costs of normal mainte-nance and repairs that do not add to the value of the asset or materially extend assets’ lives are charged to oper-ating expense in the year in which the expense is incurred. Depreciation is computed using the straight-line method over the estimated useful lives of the assets, generally 50 years for buildings, 20 years for improvements, 10 years for furniture, machinery, vehicles and other equipment, 5 years for telecommunications and peripheral equipment, and 15 years for library books. Collections, which consist of purchased works of art, are not depre-ciated as they are deemed to have permanent value. Deferred Outflows of Resources In addition to assets, the Statements of Net Position present a separate section for deferred outflows of re-sources. This separate financial statement element represents a consumption of net position that applies to a future period(s) and so will not be recognized as an outflow expense of resources until that time. Governments are only permitted to report deferred outflows of resources in circumstances specifically authorized by the GASB. Accrued Compensated Absences Employees’ compensated absences are accrued when earned. The liability and expense incurred are recorded at year-end as accrued compensated absences in the Statements of Net Position and as a component of operating expenses in the Statements of Revenues, Expenses and Changes in Net Position.

18
NOTE 2. SUMMARY OF SIGNIFICANT ACCOUNTING POLICIES-continued Unearned Revenue Tuition and fees collected in advance and related to academic terms in the next fiscal year are recorded as un-earned revenue. Contract revenues related to government grants and food services are recognized over the con-tract period. Contract payments received in advance are recorded as unearned revenue. Deferred Inflows of Resources In addition to liabilities, the Statements of Net Position present a separate section for deferred inflows of re-sources. This separate financial statement element represents an acquisition of net position that applies to a fu-ture period(s) and so is not recognized as an inflow of resources (revenue) until that time. Governments are only permitted to report deferred inflows of resources in circumstances specifically authorized by the GASB. Estimates The preparation of the financial statements in conformity with generally accepted accounting principles requires management to make estimates and assumptions that affect certain reported amounts and disclosures. Accord-ingly, actual results could differ from those estimates. Net Position The District’s net position is classified as follows: Net investment in capital assets – This represents the District’s total investment in capital assets, net of outstanding debt obligations related to those capital assets. To the extent debt has been incurred but not yet expended for capital assets, such amounts are not included as a component of net investment in capital assets. Restricted net position – nonexpendable – Nonexpendable restricted net position consists of endowment and similar type funds in which donors or other outside sources have stipulated, as a condition of the gift instrument, that the principal is to be maintained inviolate and in perpetuity, and invested for the purpose of producing present and future income, which may be either expended or added to principal. The District had no nonexpendable restricted net position as of August 31, 2015 or 2014. Restricted net position – expendable – Restricted expendable net position includes resources in which the District is legally or contractually obligated to spend in accordance with restrictions imposed by external third parties. Unrestricted net position – Unrestricted net position represents resources to be used for transactions relating to the educational and general operations of the District, and may be used at the discretion of the governing board to meet current expenses for any purpose. These resources also include auxiliary enterprises, which are substantial-ly self-supporting activities that provide services for students, faculty and staff. When an expense is incurred that can be paid using either restricted or unrestricted resources, the District’s poli-cy is to first apply the expense towards restricted resources and then towards unrestricted resources. Operating and Non-operating Revenue and Expense Policy The District distinguishes operating revenues and expenses from non-operating items. The District reports as a business-type activity and as a single proprietary fund. Operating revenues and expenses generally result from providing services in connection with the District’s principal ongoing operations. The principal operating revenues are tuition and related fees, grants and contracts, and operations of auxiliary enterprises. Operating expenses include the cost of sales and services, administrative expenses, and depreciation of capital assets. Non-operating revenues include activities that have the characteristics of non-exchange trans-

19
NOTE 2. SUMMARY OF SIGNIFICANT ACCOUNTING POLICIES-continued Operating and Non-operating Revenue and Expense Policy– continued actions, such as property taxes, state appropriations, gifts and contributions, and other revenue and expenses that are defined as non-operating by GASB 9, Reporting Cash Flows of Proprietary and Nonexpendable Trust Funds and Government Entities that use Proprietary Fund Accounting, and investment income. Non-exchange transactions are recognized in accordance with the standards in GASB 33, Accounting and Financial Reporting for Nonexchange Transactions. In accordance with GASB 24, Accounting and Financial Reporting for Certain Grants and Other Finan-cial Assistance, the District records revenue received for federal Title IV grant programs (such as Pell grants) as non-operating revenue. Pensions For the year ended August 31, 2015, the District implemented the provisions of GASB Statement No. 68, Ac-counting and Financial Reporting for Pensions (GASB 68), as amended by GASB Statement No. 71, Pension Transi-tion for Contributions Made Subsequent to the Measurement Date (GASB 71). The fiduciary net position of the Teach-er Retirement System of Texas (TRS) has been determined on the flow of economic resources measurement fo-cus and full accrual basis of accounting. This includes, for purposes of measuring the net pension liability, de-ferred outflows of resources and deferred inflows of resources related to pensions, pension expense, and infor-mation about assets, liabilities and additions to/deductions from TRS’s fiduciary net position. Benefit payments (including refunds of employee contributions) are recognized when due and payable in accordance with the ben-efit terms. Investments are reported at fair value. As a result of this change, the District reported pension ex-pense of $3,801,988 for the year ended August 31, 2015. The District is reporting in fiscal year 2015, the net pension liability, deferred outflows of resources, and deferred inflows of resources using a measurement date of August 31, 2014 in accordance with GASB 68, paragraphs 22-23. Restatement of Beginning Net Position In the year of implementation of GASB 68, as amended by GASB 71, a restatement to beginning net position as of September 1, 2014 was required for the recording of the beginning net pension liability and for the recording of deferred outflows of resources for contributions made after the measurement date of the beginning net pen-sion liability and beginning of the District’s fiscal year. It was impracticable to determine the cumulative effect of this accounting change and its retroactive application to prior periods because the information required to de-termine the balances of deferred inflows of resources and deferred outflows of resources related to pensions as of August 31, 2013 was not available. Beginning net position as of September 1, 2014, has been restated as follows for the implementation of GASB 68 as amended by GASB 71.
Beginning net position, as previously reported 1,054,184,909$ Prior period adjustment-implementation of GASB 68: Net pension liability (measurement date as of August 31, 2013) (50,507,393) Deferred outflows-District contributions made during fiscal year 2014 3,903,935 Beginning net position, as restated 1,007,581,451$

20
NOTE 2. SUMMARY OF SIGNIFICANT ACCOUNTING POLICIES-continued Reclassifications Certain reclassifications have been made to the 2014 financial statements to make them conform with the 2015 financial statement presentation. Such reclassifications had no effect on change in net position. NOTE 3. AUTHORIZED INVESTMENTS The Board of Trustees has adopted an investment policy regarding the investment of its funds as defined in the Public Funds Investment Act of 1995 (Chapter 2256, Texas Government Code). The investments of the District are in compliance with the Board’s investment policy. Authorized investments include: (1) obligations of the United States or its agencies and instrumentalities, including obligations that are fully guaranteed or insured by the Federal Deposit Insurance Corporation or by the explicit full faith and credit of the United States, (2) other obligations which are unconditionally guaranteed or insured by, or backed by the full faith and credit of the United States or their respective agencies and instrumentalities, (3) certificates of deposit, (4) fully collateralized repurchase agreements, (5) eligible investment pools rated no lower than AAA or AAA-m by a nationally recog-nized rating service, (6) commercial paper notes rated no lower than A-1 or P-1 or an equivalent rating by a na-tionally recognized rating service, and (7) cash management and fixed income funds sponsored by organizations exempt from federal income taxation, negotiable certificates of deposit issued by a bank that has a certificate of deposit rating of at least 1 or the equivalent by a nationally recognized credit rating agency or that is associated with a holding company having a commercial paper rating of at least A-1, P-1, or the equivalent by a nationally recognized credit rating agency; and corporate bonds, debentures, or similar debt obligations rated by a national-ly recognized investment rating firm in one of the two highest long-term rating categories. During the year ended August 31, 2012, the District established the Gas Royalty Scholarship Fund. As de-scribed in Note 4, these funds are invested and managed by a related organization. Under the District’s invest-ment policy, the scholarship fund is invested in accordance with the Uniform Prudent Management of Institu-tional Funds Act (UPMIFA). The investment strategy governing the scholarship fund shall be to (1) preserve the real purchasing power of the principal in the fund and (2) provide a stable source of perpetual financial sup-port. NOTE 4. DEPOSITS AND INVESTMENTS At August 31, 2015 and 2014, the carrying amounts of the District’s deposits were $5,916,874 and $6,418,893 and total bank balances equaled $7,016,620 and $9,189,320, respectively. Bank balances of $250,000 were cov-ered by the Federal Depository Insurance Corporation with $6,766,620 and $8,939,320 covered by collateral pledged in a joint custody security account with market values of $11,416,303 and $11,306,875 at August 31, 2015 and 2014, respectively. The collateral account is held in the District’s name by the Federal Reserve Bank, which is an independent third-party custodian. Included in short-term investments at August 31, 2015 and 2014 were $5,334,102 and $24,526,336 invested in TexPool, a pool managed by the Treasurer of the State of Texas, $5,388,882 and $26,590,100 invested in Tex-Star, a pool managed by JP Morgan Investment Management Inc. and First Southwest Company, $64,081,314 and $32,926 invested in TexasTerm, a series of pools managed by PFM Asset Management, LLC, and $37,298,318 and $24,554,296 invested in Lone Star Investment Pool, a pool managed by First Public, LLC, re-spectively. The fair value of the District’s positions in the pools is substantially the same as the value of the pools’ shares. The investments in which the pools may invest are subject to the same restrictions as the District.

21
NOTE 4. DEPOSITS AND INVESTMENTS-continued The State Comptroller of Public Accounts exercises oversight responsibility over TexPool. Oversight includes the ability to significantly influence operations, designation of management and accountability for fiscal matters. Additionally, the State Comptroller has established an advisory board composted of both participants in TexPool and other persons who do not have a business relationship with TexPool. The advisory board mem-bers review the investment policy and management fee structure. TexStar is overseen by an advisory board composed of participants in TexStar and others who do not have a business relationship with TexStar. The business and affairs of TexStar are managed by the advisory board. TexasTERM has an advisory board composed of local government officials, finance directors and treasurers. The advisory board has oversight responsibility and reviews the investment policy and management fee struc-ture. Lone Star Investment Pool is governed by an 11 member board of individuals representing participating entities. The board manages the business and affairs of the pool. During the year ended August 31, 2012, the District entered into a management agreement with Tarrant County College Foundation (the Foundation), a related organization (see Note 16). Under this agreement, the Founda-tion will invest, manage and monitor certain designated funds of the District (hereinafter referred to as Beneficial Interest in Funds Held by Affiliate), derived principally from oil and gas lease and bonus payments, in accord-ance with applicable laws and the District’s investment policy. The terms of the agreement dictate that the Dis-trict will determine the use of the earnings from the invested funds and authorize all expenditures from the funds. Cash and Cash Equivalents included on Exhibit 1 consist of the items reported below:
2015 2014
Bank deposits
Demand deposits 5,916,874$ 6,418,893$
Cash on hand
Petty cash 22,000 19,998
Total cash and cash equivalents 5,938,874$ 6,438,891$
Cash and Cash Equivalents

22
NOTE 4. DEPOSITS AND INVESTMENTS– continued As of August 31, 2015 the District had the following investments and maturities:
Fair Value Fair ValueAugust 31, 2015 August 31, 2014
TexPool 5,334,102$ 24,526,336$ TexStar 5,388,882 26,590,100 TexasTERM - TexasDAILY 44,081,314 32,926 TexasTERM - TexasTERM 20,000,000 Lone Star Investment Pool 37,298,318 24,554,296 Beneficial Interest in Funds Held by Affiliate 8,395,387 8,676,756 U.S. Government Agencies 110,096,695 149,728,532 Total 230,594,698 234,108,946 Cash and cash equivalents 5,938,874 6,438,891
Total deposits and investments 236,533,572 240,547,837
Cash and cash equivalents (Exhibit 1) 5,938,874 6,438,891 Investments - current (Exhibit 1) 120,018,090 82,590,429 Restricted investments - non-current (Exhibit 1) 479,913 1,789,985 Investments - non-current (Exhibit 1) 110,096,695 149,728,532
Total deposits and investments 236,533,572$ 240,547,837$
Reconciliation of Deposits and Investments to Exhibit 1
CreditInvestment Type Rating Fair Value Less than 1 1 to 2 3 to 4
U.S. Government Agencies AAA 110,096,695$ $ 69,980,703$ 40,115,992$ TexPool AAAm 5,334,102 5,334,102 TexStar AAAm 5,388,882 5,388,882 TexasTERM - TexasDAILY AAAm 44,081,314 44,081,314 TexasTERM - TexasTERM AAAf 20,000,000 20,000,000 Lone Star Investment Pool AAA 37,298,318 37,298,318 Beneficial interest in funds held by affiliate 8,395,387
Total fair value 230,594,698$ 112,102,616$ 69,980,703$ 40,115,992$
Investment Maturities (in Years)

23
NOTE 4. DEPOSITS AND INVESTMENTS– continued Due to the diversity of the underlying investments, Beneficial Interest in Funds Held by Affiliate does not have a specific investment maturity. As of August 31, 2015 and 2014, Beneficial Interest in Funds Held by Affiliate was comprised of the following underlying investments:
Interest Rate Risk- In accordance with state law and District policy, the District concentrates its investment portfolio in shorter-term securities in order to limit interest rate risk. Unless matched to a specific cash flow, the District does not invest in securities maturing more than four years from the date of purchase. For investment pools, the average dollar-weighted maturity shall not exceed two years. Credit Risk- In accordance with state law and District policy, investments in investment pools are rated no low-er than AAA or AAAm or an equivalent rating of at least one nationally recognized rating service.
Concentration of Credit Risk- The District’s investment policy does not place a limit on the amount the District may invest in any one issuer with the exception of a 3% maximum per issuer in regards to corporate bonds. As of August 31, 2015, more than 5% of the District’s investments are in TexasTERM (8.7%), TexasDAILY (19.1%), Lone Star Investment Pool (16.2%), FHLB (8.7%), FHLMC (8.7%), FNMA (17.4%), and FFCB (13.0%). As of August 31, 2015 and 2014, restricted investments consist of the following:
2015 2014
U.S. Government Agencies 3,156,749$ 3,098,300$ Certificates of Deposit 351,252 352,584 Corporate Bonds 780,898 790,288 Mutual Funds - Money Market 129,197 187,480 Mutual Funds - Fixed Income 1,333,032 1,161,098 Mutual Funds - Equity 2,501,927 2,916,640 Mutual Funds - Real Estate 142,332 170,366
Total fair value 8,395,387$ 8,676,756$
2015 2014
Funds held for others 377,776$ 325,510$ Funds restricted to student loans 102,137 100,523 Funds restricted to debt retirement 1,363,952
Total restricted investments 479,913$ 1,789,985$
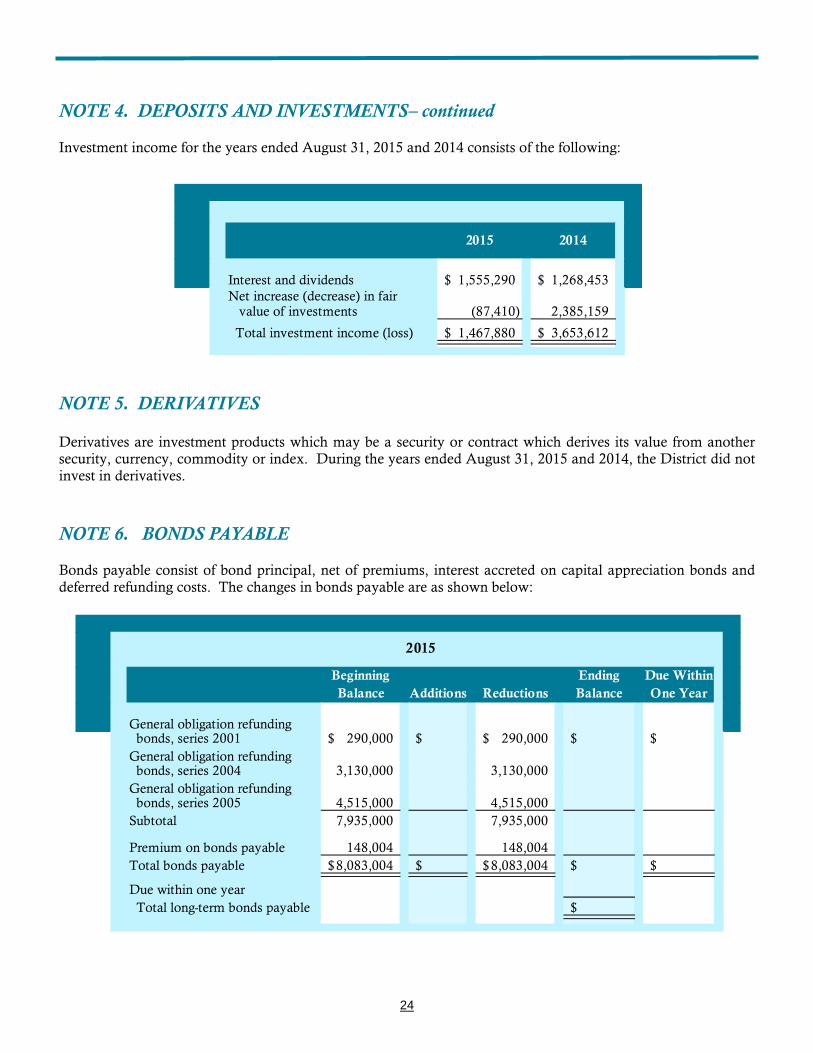
24
NOTE 4. DEPOSITS AND INVESTMENTS– continued Investment income for the years ended August 31, 2015 and 2014 consists of the following:
NOTE 5. DERIVATIVES Derivatives are investment products which may be a security or contract which derives its value from another security, currency, commodity or index. During the years ended August 31, 2015 and 2014, the District did not invest in derivatives. NOTE 6. BONDS PAYABLE Bonds payable consist of bond principal, net of premiums, interest accreted on capital appreciation bonds and deferred refunding costs. The changes in bonds payable are as shown below:
2015 2014
Interest and dividends 1,555,290$ 1,268,453$ Net increase (decrease) in fair value of investments (87,410) 2,385,159
Total investment income (loss) 1,467,880$ 3,653,612$
Beginning Ending Due WithinBalance Additions Reductions Balance One Year
General obligation refunding bonds, series 2001 290,000$ $ 290,000$ $ $General obligation refunding bonds, series 2004 3,130,000 3,130,000 General obligation refunding bonds, series 2005 4,515,000 4,515,000 Subtotal 7,935,000 7,935,000
Premium on bonds payable 148,004 148,004 Total bonds payable 8,083,004$ $ 8,083,004$ $ $
Due within one year Total long-term bonds payable $
2015

25
NOTE 6. BONDS PAYABLE—continued
Bonds payable are comprised of the following issues:
2015 2014
General obligation bonds, series 2001,issued to partially refund series 1994,1995 and 1996. Issued July 15, 2001for $18,765,000; all authorized bondshave been issued. The source ofrevenues for debt service is futureproperty taxes. Retired. $ 290,000$
General obligation bonds, series 2004,issued to partially refund series 1994,1995 and 1996. Issued September 1,2004 for $23,375,000; all authorizedbonds have been issued. The source ofrevenues for debt service is futureproperty taxes. Retired. 3,130,000
General obligation bonds, series 2005,issued to partially refund series 1994.Issued May 24, 2005 for $13,435,000;all authorized bonds have been issued.The source of revenues for debt serviceis future property taxes. Retired. 4,515,000
Total $ 7,935,000$
Beginning Ending Due WithinBalance Additions Reductions Balance One Year
General obligation refunding bonds, series 2001 570,000$ $ 280,000$ 290,000$ 290,000$ General obligation refunding bonds, series 2004 5,790,000 2,660,000 3,130,000 3,130,000 General obligation refunding bonds, series 2005 9,125,000 4,610,000 4,515,000 4,515,000 Subtotal 15,485,000 7,550,000 7,935,000 7,935,000
Premium on bonds payable 469,560 321,556 148,004 148,004 Total bonds payable 15,954,560$ $ 7,871,556$ 8,083,004$ 8,083,004$
Due within one year 8,083,004 Total long-term bonds payable $
2014

26
NOTE 7. NOTE PAYABLE The District has a note payable that had a balance of $5,000,000 and $9,851,975 outstanding at August 31, 2015 and 2014, respectively. The note is secured by real property and bears no interest, so the District imputed inter-est at 1.0%. Payments are due on September 1 as follows:
NOTE 8. EMPLOYEES’ RETIREMENT PLAN The State of Texas has joint contributory plans for the District’s full-time employees. Full-time employees par-ticipate in either the Teacher Retirement System of Texas or the Optional Retirement Program.
Teacher Retirement System of Texas
Plan Description The District participates in a cost-sharing multiple-employer defined benefit pension that has a special funding situation. The plan is administered by the Teacher Retirement System of Texas (TRS). TRS’s defined benefit pension plan is established and administered in accordance with the Texas Constitution, Article XVI, Section 67 and Texas Government Code, Title 8, Subtitle C. The pension trust fund is a qualified pension trust under Sec-tion 401(a) of the Internal Revenue Code. The Texas Legislature establishes benefits and contribution rates within the guidelines of the Texas Constitution. The pension’s Board of Trustees does not have the authority to establish or amend benefit terms. All employees of public, state-supported educational institutions in Texas who are employed for one-half or more of the standard work load and who are not exempted from membership under Texas Government Code, Title 8, Section 822.002 are covered by the system. Pension Plan Fiduciary Net Position Detailed information about the Teacher Retirement System’s fiduciary net position is available in a separately-issued Comprehensive Annual Financial Report that includes financial statements and required supplementary information. That report may be obtained on the Internet at http://www.trs.state.tx.us/about/documents/cafr.pdf#CAFR; by writing to TRS at 1000 Red River Street, Austin, TX, 78701-2698; or by calling (512) 542-6592. Benefits Provided TRS provides service and disability retirement, as well as death and survivor benefits, to eligible employees (and their beneficiaries) of public and higher education in Texas. The pension formula is calculated using 2.3 percent (multiplier) times the average of the five highest annual creditable salaries times years of credited service to ar-rive at the annual standard annuity except for members who are grandfathered, the three highest annual salaries are used. The normal service retirement is at age 65 with 5 years of credited service or when the sum of the member’s age and years of credited service equals 80 or more years. Early retirement is at age 55 with 5 years of
Fiscal Year
2016 5,000,000$

27
NOTE 8. EMPLOYEES’ RETIREMENT PLAN-continued Benefits Provided– continued service credit or earlier than 55 with 30 years of service credit. There are additional provisions for early retire-ment if the sum of the member’s age and years of service credit total at least 80, but the member is less than age 60 or 62 depending on date of employment, or if the member was grandfathered in under a previous rule. There are no automatic post-employment benefit changes; including automatic COLAs. Ad hoc post-employment benefit changes, including ad hoc COLAs can be granted by the Texas Legislature as noted in the Plan descrip-tion above. Contributions Contribution requirements are established or amended pursuant to Article 16, section 67 of the Texas Constitu-tion which requires the Texas legislature to establish a member contribution rate of not less than 6 percent of the member’s annual compensation and a state contribution rate of not less than 6 percent and not more than 10 percent of the aggregate annual compensation paid to members of the system during the fiscal year. Texas Gov-ernment Code section 821.006 prohibits benefit improvements, if as a result of the particular action, the time re-quired to amortize TRS’ unfunded actuarial liabilities would be increased to a period that exceeds 31 years, or, if the amortization period already exceeds 31 years, the period would be increased by such action. Employee contribution rates are set in state statute, Texas Government Code 825.402. Senate Bill 1458 of the 83rd Texas Legislature amended Texas Government Code 825.402 for member contributions and established employee contribution rates for fiscal years 2014 through 2017. The 83rd Texas Legislature, General Appropria-tions Act (GAA) established the employer contribution rates for fiscal years 2014 and 2015. As the non-employer contributing entity for public education and junior colleges, the State of Texas contributes to the retirement system an amount equal to the current employer contribution rate times the aggregate annual compensation of all participating members of the pension trust fund during that fiscal year reduced by the amounts described below which are paid by the employers. Employers (public school, junior college, other enti-ties or the State of Texas as the employer for senior universities and medical schools) are required to pay the em-ployer contribution rate in the following instances:
On the portion of the member's salary that exceeds the statutory minimum for members entitled to the statutory minimum under Section 21.402 of the Texas Education Code.
During a new member’s first 90 days of employment.
Contribution Rates
Fiscal Year 2015 2014
Member 6.7% 6.4%Non-Employer Contributing Entity (State) 6.8% 6.8%Employers 6.8% 6.8%
District Contributions 4,054,353$ 3,904,053$ State of Texas On-behalf Contributions 3,073,289$ 3,148,538$

28
NOTE 8. EMPLOYEES’ RETIREMENT PLAN-continued Contributions– continued
When any part or all of an employee’s salary is paid by federal funding sources, a privately spon-
sored source, from non-educational and general, or local funds. When the employing district is a public junior college or junior college district, the employer shall
contribute to the retirement system an amount equal to 50% of the state contribution rate for cer-tain instructional or administrative employees; and 100% of the state contribution rate for all other employees.
In addition to the employer contributions listed above, when employing a retiree of the Teacher Retirement Sys-tem the employer shall pay both the member contribution and the state contribution as an employment after re-tirement surcharge.
Actuarial Assumptions The total pension liability in the August 31, 2014 actuarial valuation was determined using the following actuari-al assumptions:
Valuation Date August 31, 2014
Actuarial Cost Method Individual Entry Age Normal
Amortization Method Level Percentage of Payroll, Open
Remaining Amortization Period 30 years
Asset Valuation Method 5 year Market Value
Discount Rate 8.00%
Long-term expected Investment Rate of Return* 8.00%
Salary Increases* 4.25% to 7.25%
Weighted-Average at Valuation Date 5.55%
Payroll Growth Rate 3.50%
*Includes Inflation of 3%
The actuarial methods and assumptions are primarily based on a study of actual experience for the four year pe-riod ending August 31, 2010 and adopted on April 8, 2011. With the exception of the post-retirement mortality rates for healthy lives and a minor change to the expected retirement age for inactive vested members stemming from the actuarial audit performed in the Summer of 2014, the assumptions and methods are the same as used in the prior valuation. When the mortality assumptions were adopted in 2011 they contained a significant margin for possible future mortality improvement. As of the date of the valuation there has been a significant erosion of this margin to the point that the margin has been eliminated. Therefore, the post-retirement mortality rates for current and future retirees was decreased to add additional margin for future improvement in mortality in ac-cordance with the Actuarial Standards of Practice No. 35.

29
NOTE 8. EMPLOYEES’ RETIREMENT PLAN-continued Discount Rate The discount rate used to measure the total pension liability was 8.0%. There was no change in the discount rate since the previous year. The projection of cash flows used to determine the discount rate assumed that con-tributions from plan members and those of the contributing employers and the non-employer contributing entity are made at the statutorily required rates. Based on those assumptions, the pension plan’s fiduciary net position was projected to be available to make all future benefit payments of current plan members. Therefore, the long-term expected rate of return on pension plan investments was applied to all periods of projected benefit pay-ments to determine the total pension liability. The long-term rate of return on pension plan investments is 8%. The long-term expected rate of return on pension plan investments was determined using a building-block meth-od in which best-estimates ranges of expected future real rates of return (expected returns, net of pension plan investment expense and inflation) are developed for each major asset class. These ranges are combined to pro-duce the long-term expected rate of return by weighting the expected future real rates of return by the target asset allocation percentage and by adding expected inflation. Best estimates of geometric real rates of return for each major asset class included in the systems target asset allocation as of August 31, 2014, are summarized below:
Long-Term ExpectedExpected Contribution to
Target Geometric Real Long-TermAllocation Rate of Return Protfolio Returns*
Global Equity
U.S. 18.0% 4.6% 1.0% Non-U.S. Developed 13.0% 5.1% 0.8% Emerging Markets 9.0% 5.9% 0.7% Directional Hedge Funds 4.0% 3.2% 0.1% Private Equity 13.0% 7.0% 1.1%Stable Value
U.S. Treasuries 11.0% 0.7% 0.1% Absolute Return 0.0% 1.8% 0.0% Stable Value Hedge Funds 4.0% 3.0% 0.1% Cash 1.0% -0.2% 0.0%Real Return
Global Inflation Linked Bonds 3.0% 0.9% 0.0% Real Assets 16.0% 5.1% 1.1% Energy and Natural Resources 3.0% 6.6% 0.2% Commodities 0.0% 1.2% 0.0%Risk Parity Risk Parity 5.0% 6.7% 0.3%
Inflation Expectation 2.2%Alpha 1.0%
Total 100.0% 8.7%
* The Expected Contribution to Returns incorporates the volatility drag resulting from the conversion betweenArithmetic and Geometric means return
Source: Teacher Retirement System of Texas 2014 Comprehensive Annual Financial Report
Asset Class

30
NOTE 8. EMPLOYEES’ RETIREMENT PLAN-continued Discount Rate Sensitivity Analysis The following schedule shows the impact of the Net Pension Liability if the discount rate used was 1% less than and 1% greater than the discount rate that was used (8%) in measuring the 2014 Net Pension Liability.
Pension Liabilities, Pension Expense, and Deferred Outflows of Resources and Deferred Inflows of Resources Related to Pensions At August 31, 2015, the District reported a liability of $41,132,646 for its proportionate share of the TRS’s net pension liability. This liability reflects a reduction for State pension support provided to the District. The amount recognized by the District as its proportionate share of the net pension liability, the related State sup-port, and the total portion of the net pension liability that was associated with the District were as follows: The net pension liability was measured as of August 31, 2014 and the total pension liability used to calculate the net pension liability was determined by an actuarial valuation as of that date. The employer’s proportion of the net pension liability was based on the employer’s contribution to the net pension plan relative to the contribu-tions of all employers to the plan for the period September 1, 2013 thru August 31, 2014. There were no changes of assumptions or other inputs that affected measurement of the total pension liability during the measurement period. There were no changes of benefit terms that affected measurement of the total pension liability during the meas-urement period. There was a change in employer contribution requirements that occurred after the measurement date of the net pension liability and the employer’s reporting date. A 1.5% contribution for employers not paying Old Age Sur-vivor and Disability Insurance (OASDI) on certain employees went into law effective September 1, 2014. The amount of the expected resultant change in the employer’s proportion cannot be determined at this time.
1% Decrease in Discount Rate (8.0%) 1% Increase in Discount Rate (7.0%) Discount Rate (9.0%)
The Districts proportionate share of the net pension liability: 73,501,543$ 41,132,646$ 16,926,738$
The District's Proportionate share of the collective net pension liability 41,132,646$
State's proportionate share that is associated with the District 33,243,381
Total 74,376,027$

31
NOTE 8. EMPLOYEES’ RETIREMENT PLAN-continued Pension Liabilities, Pension Expense, and Deferred Outflows of Resources and Deferred Inflows of Resources Related to Pensions-continued For the year ended August 31, 2015, the District recognized pension expense of $3,073,289 and revenue of $3,073,289 for support provided by the State, based on a measurement date of August 31, 2014. At August 31, 2015, the District reported its proportionate share of the TRS’s deferred outflows of resources and deferred inflows of resources related to pensions from the following sources, based on a measurement date of August 31, 2014:
District contributions subsequent to the measurement date of $4,054,353 are reported as deferred outflows of resources related to pensions and will be recognized as a reduction of the net pension liability during the year ending August 31, 2016. The net amounts of the employer’s balances of deferred outflows and inflows of resources related to pensions will be recognized in pension expense as follows:
Year Ended August 31Pension Expense
Amount
2016 1,467,942$
2017 (2,586,411)
2018 (2,586,411)
2019 (2,586,411)
2020 556,543
Thereafter 516,301
Deferred Outflows Deferred Inflowsof Resources of Resources
Differences between expected and actual economic experience 636,130$ $
Changes in actuarial assumptions 2,673,668
Difference between projected and actual investment earnings 12,571,816
Changes in proportion and difference between the employer's contributions and the proportionate share of contributions 10,782
Contributions paid to TRS subsequent to the measurement date 4,054,353
Total 7,364,151$ 12,582,598$
32
NOTE 8. EMPLOYEES’ RETIREMENT PLAN-continued Optional Retirement Plan Plan Description The state has also established an optional retirement program for institutions of higher education. Participation in the Optional Retirement Program is in lieu of participation in the Teacher Retirement System. The optional retirement program provides for the purchase of annuity contracts and operates under the provisions of the Tex-as Constitution, Article XVI, Sec. 67, and Texas Government Code, Title 8, Subtitle C. Funding Policy Contribution requirements are not actuarially determined but are established and amended by the Texas state legislature. The percentages of participant salaries currently contributed by the state and each participant are 3.3% and 6.65%, respectively. The District contributed 5.2% in fiscal years 2015 and 2014 and 2.5% in fiscal year 2013 for employees who were participating in the optional retirement program prior to September 1, 1995. Benefits fully vest after one year plus one day of employment. Because these are individual annuity contracts, the state has no additional or unfunded liability for this program. Senate Bill (S.B.) 1812, effective September 1, 2013, limits the amount of the states contribution to 50% of eligible employees in the reporting district. State contributions to the Optional Retirement Plan made on behalf of the District for the years ended August 31, 2015, 2014, and 2013 were $970,542, $971,829, and $1,716,110, respectively. The on-behalf payments are reflected in the accompanying financial statements as both revenue and expenses. Total retirement expense paid by the State of $4,257,841 is reflected in the accompanying financial statements as both revenues and expenditures. Participants contributed $9,161,315 ($7,205,527 for the Teacher Retirement Program and $1,955,788 for the Optional Retirement Program). The District contributed $1,234,139, $1,251,073, and $369,614 for the years ended August 31, 2015, 2014, and 2013, respectively, to the Optional Re-tirement Program to cover the 5.2% and 2.5% referenced above. Total payroll expense for fiscal years 2015 and 2014 was approximately $165,000,000 and $157,000,000, respec-tively. The total payroll of employees covered by the Teacher Retirement System was approximately $96,700,000 and $91,400,000, and the total payroll of employees covered by the Optional Retirement Program was approximately $29,400,000 for each of the fiscal years 2015 and 2014. All employees of the District who are employed for ½ or more of the standard workload are eligible to partici-pate in one of the above programs. Participants in the Teacher Retirement System are eligible for normal retire-ment at age 65 with 5 years of service or when the sum of the participant’s age and years of credited service equals or exceeds 80 years. Participants may elect to receive reduced retirement at age 55 with 5 years of service or at any age below 50 with 30 years of service or any combination of age plus years of service which equals 80. A member is fully vested after 5 years of creditable service and is entitled to any benefit for which eligibility re-quirements have been met. Participants in the Optional Retirement Program are fully vested in their individual investments after one year of service.
NOTE 9. POST-EMPLOYMENT BENEFITS OTHER THAN PENSIONS In addition to providing pension benefits, the State provides certain healthcare and life insurance benefits for retired employees. Most of the employees with 10 years of service will become eligible for those benefits when they reach normal retirement age while working for the State. Those and similar benefits for active employees are provided through an insurance company whose premiums are based on benefits paid during the previous year. The State recognizes the cost of providing these benefits by expending the annual insurance premiums.

33
NOTE 9. POST-EMPLOYMENT BENEFITS OTHER THAN PENSIONS-continued The State's average contribution per full-time employee was $224 and $213 per month for the years ended Au-gust 31, 2015 and 2014, respectively. The cost of providing those benefits for all employees in the year ended August 31, 2015, paid by the State of Texas on behalf of the District, totaled $11,381,867 ($10,604,553 for the year ended August 31, 2014) with $5,543,251 for 672 retirees (retiree benefits for 661 retirees cost $5,119,953 in fiscal year 2014) and $5,838,616 for 2,175 active employees (active employee benefits for 2,143 employees cost $5,484,600 in fiscal year 2014). The on-behalf payments are reflected in the accompanying financial statements as both revenues and expenses. Plan Description Tarrant County College District contributes to the State Retiree Health Plan (SRHP), a cost-sharing, multiple-employer, defined benefit postemployment healthcare plan administered by the Employees Retirement System of Texas (ERS). SRHP provides medical benefits to retired employees of participating universities, community colleges and state agencies in accordance with Chapter 1551, Texas Insurance Code. Benefit and contribution provisions of SRHP are authorized by State law and may be amended by the Texas Legislature. ERS issues a publicly available financial report that includes financial statements and required supplementary information for SRHP. That report may be obtained from ERS via their website at http://www.ers.state.tx.us/. Funding Policy Section 1551.055 of Chapter 1551, Texas Insurance Code provides that contribution requirements of the plan members and the participating employers are established and may be amended by the ERS board of trustees. Plan members or beneficiaries receiving benefits pay any premium over and above the employer contribution. The employer’s share of the cost of retiree healthcare coverage for the current year is known as the implicit rate subsidy and is the difference between the claims costs for the retirees and the amounts contributed by the retir-ees. The ERS board of trustees sets the employer contribution rate based on the implicit rate subsidy which is actuarially determined in accordance with the parameters of GASB Statement 45. The employer contribution rate represents a level of funding that, if paid on an ongoing basis, is projected to cov-er normal costs each year and amortize any unfunded actuarial liabilities (or funding excess) of the plan over a period not to exceed thirty years. Beginning September 1, 2013, S.B. 1812 limited the state’s contribution to 50% of eligible employees for community colleges. The District’s contributions to SRHP for the years ended August 31, 2015, 2014, and 2013, were $525,911, $479,682, and $427,704, respectively, which equaled the required contributions each year. NOTE 10. DEFERRED COMPENSATION PROGRAMS District employees may elect to defer a portion of their earnings for income tax and investment purposes pursu-ant to authority granted in Government Code 609.001. The employees’ investments are held in tax deferred an-nuity plans pursuant to Internal Revenue Code Section 403(b). As of August 31, 2015 and 2014, the District had 333 and 348 employees participating in the program, respectively. A total of $1,781,400 and $1,818,369 in payroll deductions had been invested in approved plans during the fiscal years 2015 and 2014, respectively. In June 2003 the District added a deferred compensation plan pursuant to Internal Revenue Code Section 457(b) to the employer benefit package. Full-time employees can begin participating in the plan on their first day of employment. An employee can contribute up to a maximum of $18,000 ($24,000 for participants over 50 years
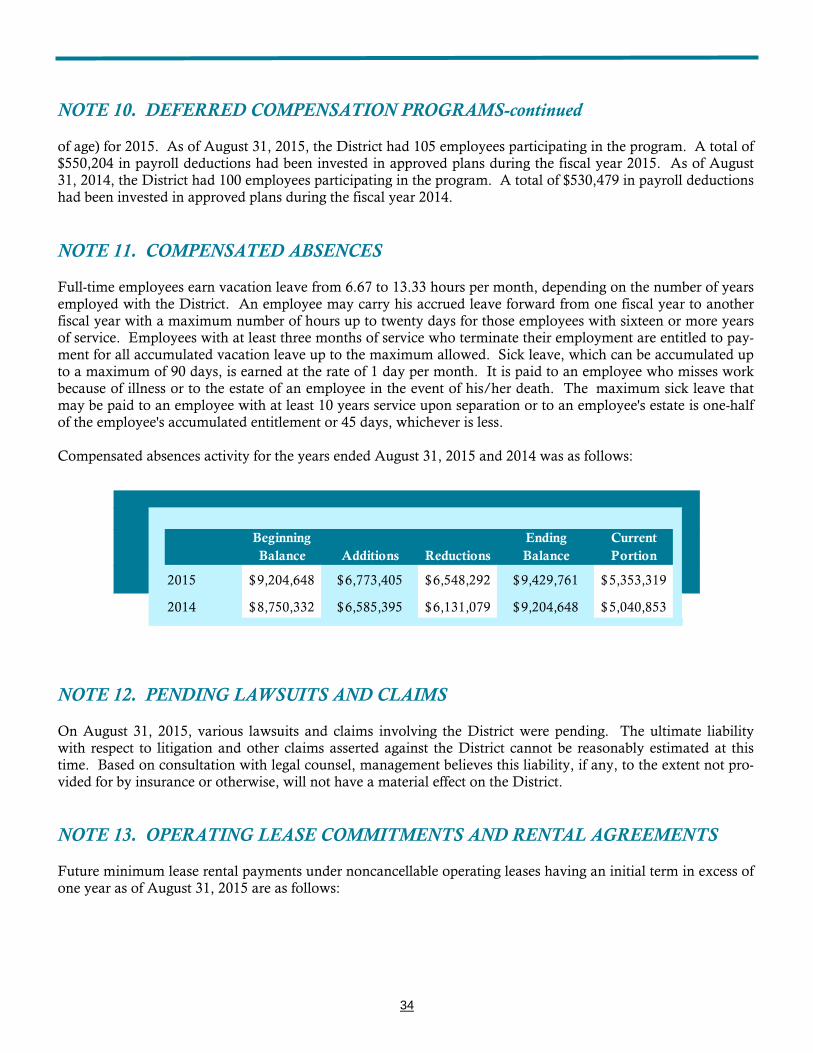
34
NOTE 10. DEFERRED COMPENSATION PROGRAMS-continued of age) for 2015. As of August 31, 2015, the District had 105 employees participating in the program. A total of $550,204 in payroll deductions had been invested in approved plans during the fiscal year 2015. As of August 31, 2014, the District had 100 employees participating in the program. A total of $530,479 in payroll deductions had been invested in approved plans during the fiscal year 2014. NOTE 11. COMPENSATED ABSENCES Full-time employees earn vacation leave from 6.67 to 13.33 hours per month, depending on the number of years employed with the District. An employee may carry his accrued leave forward from one fiscal year to another fiscal year with a maximum number of hours up to twenty days for those employees with sixteen or more years of service. Employees with at least three months of service who terminate their employment are entitled to pay-ment for all accumulated vacation leave up to the maximum allowed. Sick leave, which can be accumulated up to a maximum of 90 days, is earned at the rate of 1 day per month. It is paid to an employee who misses work because of illness or to the estate of an employee in the event of his/her death. The maximum sick leave that may be paid to an employee with at least 10 years service upon separation or to an employee's estate is one-half of the employee's accumulated entitlement or 45 days, whichever is less. Compensated absences activity for the years ended August 31, 2015 and 2014 was as follows: NOTE 12. PENDING LAWSUITS AND CLAIMS On August 31, 2015, various lawsuits and claims involving the District were pending. The ultimate liability with respect to litigation and other claims asserted against the District cannot be reasonably estimated at this time. Based on consultation with legal counsel, management believes this liability, if any, to the extent not pro-vided for by insurance or otherwise, will not have a material effect on the District. NOTE 13. OPERATING LEASE COMMITMENTS AND RENTAL AGREEMENTS Future minimum lease rental payments under noncancellable operating leases having an initial term in excess of one year as of August 31, 2015 are as follows:
Beginning Ending CurrentBalance Additions Reductions Balance Portion
2015 9,204,648$ 6,773,405$ 6,548,292$ 9,429,761$ 5,353,319$
2014 8,750,332$ 6,585,395$ 6,131,079$ 9,204,648$ 5,040,853$

35
NOTE 13. OPERATING LEASE COMMITMENTS AND RENTAL AGREEMENTS-continued Approximately $893,000 and $1,060,000 in rent paid or due under operating leases is included in expenses on the statements of revenues, expenses and changes in net position for the years ended August 31, 2015 and 2014, respectively. Effective in February 2007, the District entered into a contract to lease excess broadband capacity to a third par-ty. The lease is for an initial term of 15 years with an automatic 15 year renewal pending certain conditions. Under the terms of the lease, the District will receive (1) a $150,000 equipment allowance, payable in three in-stallments over the lease term; (2) annual royalties of $702,662 through December 2010 and increased to $760,383 beginning January 2011, which is indexed for inflation beginning in 2013; and (3) a royalty overage equal to 0.2% of the lessee’s revenue derived from the leased capacity. Upon commencement of the initial lease term, the District also received a $2,000,000 inducement royalty payment. Annual future minimum payments to be received under this agreement are as follows: $760,383 indexed for inflation for 2015-2037, with an additional $50,000 in 2016 and 2026. The District leases space in its Trinity River Campus under a noncancellable operating lease with a current term through 2018. Lease income of $4,047,813 and $5,650,000 was recognized during the years ended August 31, 2015 and 2014, respectively. Future minimum lease payments to be received under this agreement are as fol-lows:
Fiscal Minimum FutureYear Ending Lease Payments
2016 703,916$
2017 290,551
2018 207,429
2019 73,458
2020 73,458
2021-2024 263,225
1,612,037$
Fiscal Minimum FutureYear Ending Lease Payments
2016 1,279,202$
2017 978,027
2018 652,018
2,909,247$

36
NOTE 14. CONTRACT AND GRANT AWARDS The District receives funding from various federal and state contract and grant programs. Revenues are recog-nized as funds are actually expended. Funds received but not expended during the reporting period are reported as unearned revenue. For direct federal contract and grant awards, funds expended but not collected are report-ed as federal receivables. Federal pass-through awards and non-federal contract and grant awards for which funds are expended but not collected are reported as state and local grants and contracts receivable. Contract and grant awards that are not yet funded and for which the institution has not yet performed services are not in-cluded in the financial statements. Contract and grant awards funds already committed, e.g. multi-year awards or funds awarded during fiscal years 2015 and 2014 for which monies have not been received nor funds expend-ed totaled approximately $9,420,000 and $13,110,000, respectively. Of this amount approximately $6,890,000 and $9,570,000 were from federal contract and grant awards and $2,530,000 and $3,540,000 were from state contract and grant awards for fiscal years ended August 31, 2015 and 2014, respectively.
NOTE 15. RISK MANAGEMENT The District is exposed to various risks of loss related to torts; theft of, damage to, and destruction of assets; er-rors and omissions; injuries to employees; and natural disasters. The District fully insures its buildings, struc-tures, contents and equipment with the purchase of commercial insurance in an all risk blanket property insur-ance policy. The District has designated unrestricted net position of $700,000 to cover self-insurance for work-ers’ compensation, unemployment compensation and insurance policy deductibles. Settled claims have not exceeded commercial insurance coverage in any of the past three years. The District self-insures its workers' compensation plan and its unemployment compensation. The workers’ compensation plan is administered by an outside insurance carrier which processes all self-insurance claims. The District also carries an insurance policy for excess liabilities related to workers’ compen-sation. An outside agent processes all unemployment compensation claims. The District has accrued amounts that represent the best estimate of claims filed, but not paid and claims incurred, but not reported. Accrued lia-bilities are generally based on actuarial valuation and the present value of unpaid expected claims. The discount rates used to calculate the present value of liabilities was 1.0% for the years ended August 31, 2015 and 2014. Changes in the accrued uninsured claims liability are as follows for fiscal years ended August 31:
2015 2014
Beginning balance 875,396$ 1,077,302$ Current year claims and changes in estimates 423,829 197,636 Claim payments (449,071) (399,542)
Ending balance 850,154 875,396
Current portion (761,976) (744,995)
Non-current portion 88,178$ 130,401$

37
NOTE 16. RELATED PARTIES The Tarrant County College Foundation is a nonprofit organization with the sole purpose of supporting the edu-cational and other activities of the District. The Foundation solicits donations and acts as coordinator of gifts made by other parties. It remitted restricted gifts of $1,823,040 and $1,729,690 to the District during the years ended August 31, 2015 and 2014, respectively. During the fiscal year, the District furnished certain services, such as office space, utilities and some staff assistance to the Foundation at no charge. As of August 31, 2015 and 2014, the District had a receivable balance due from the Foundation of $665,367 and $555,647, respectively.
NOTE 17. PROPERTY TAX CALENDAR The District's ad valorem property tax is levied each October 1 on the assessed value listed as of the prior Janu-ary 1 for all real and personal property located in the District.
Current DebtOperations Service Total
Tax Rate per $100 valuation authorized $ .20000 $ .50000 $ .70000(maximum per enabling legislation)
Tax Rate per $100 valuation assessed $ .14392 $ .00558 $ .14950
2015
Current DebtOperations Service Total
Tax Rate per $100 valuation authorized $ .20000 $ .50000 $ .70000(maximum per enabling legislation)
Tax Rate per $100 valuation assessed $ .14241 $ .00709 $ .14950
2014
2015 2014
Assessed Valuation of the District 165,536,552,214$ 157,360,405,817$
Less: Exemptions and Abatements (29,410,889,832) (28,379,058,585)
Net Assessed Valuation of the District 136,125,662,382$ 128,981,347,232$

38
NOTE 17. PROPERTY TAX CALENDAR-continued Taxes levied for the years ended August 31, 2015 and 2014 amounted to $201,968,650 and $192,007,990, respec-tively, including any penalties and interest assessed. Property taxes attach as an enforceable lien on property as of January 1 following the October 1 levy. Taxes are due on receipt of the tax bill and are delinquent if not paid before February 1 of the year following the year in which imposed. The use of tax proceeds is restricted to either maintenance and operations or interest and sinking expenses. Tax collections for the years ended August 31, 2015 and 2014 were 99.87% and 99.99% of the current tax levy, re-spectively. The District remitted payments of $4,344,158 and $4,037,163 in fiscal years 2015 and 2014, respec-tively, for taxes collected on behalf of Tax Incremental Finance Districts. Allowances for uncollectible taxes are based upon historical experience in collecting property taxes. NOTE 18. INCOME TAXES The District is exempt from income taxes under Internal Revenue Code Section 115, Income of States, Municipali-ties, Etc., although unrelated business income may be subject to income taxes under Internal Revenue Code Sec-tion 511 (a)(2)(B), Imposition of Tax on Unrelated Business Income of Charitable, Etc. Organizations. The District had no unrelated business income tax liability for the years ended August 31, 2015 and 2014.
Current DebtTaxes Collected Operations Service Total
Current Taxes Collected 180,129,897$ 8,967,916$ 189,097,813$
Delinquent Taxes Collected 1,438,341 71,609 1,509,950
Penalties and Interest Collected 1,319,236 65,679 1,384,915
Total Collections 182,887,474$ 9,105,204$ 191,992,678$
2014
Current DebtTaxes Collected Operations Service Total
Current Taxes Collected 191,531,525$ 7,425,972$ 198,957,497$
Delinquent Taxes Collected 1,317,109 51,066 1,368,175
Penalties and Interest Collected 1,331,567 51,627 1,383,194
Total Collections 194,180,201$ 7,528,665$ 201,708,866$
2015

39
NOTE 19. CAPITAL ASSETS Capital assets activity for the years ended August 31, 2015 and 2014, is summarized as follows:
Beginning Additions Ending
Balance (Transfers) Deletions Balance
Non-depreciable capital assetsLand 71,950,588$ $ $ 71,950,588$ Collections 1,433,518 (7,150) 1,426,368 Construction in progress 40,713,244 29,455,486 70,168,730
Total cost of non-depreciable capital assets 114,097,350 29,455,486 (7,150) 143,545,686
Depreciable capital assetsBuildings 589,139,988 23,262 589,163,250 Improvements other than buildings 296,025,141 14,744,272 310,769,413 Telecommunications and peripheral equipment 26,395,681 1,310,392 (1,911,863) 25,794,210 Library books 7,903,450 559,509 (421,147) 8,041,812 Furniture and other equipment 42,167,109 3,552,201 (834,907) 44,884,403
Total cost of depreciable capital assets 961,631,369 20,189,636 (3,167,917) 978,653,088
Accumulated depreciationBuildings 101,828,592 10,604,730 112,433,322 Improvements other than buildings 72,346,489 12,928,186 85,274,675 Telecommunications and peripheral equipment 20,846,889 2,279,796 (1,787,159) 21,339,526 Library books 4,033,793 389,414 (309,729) 4,113,478 Furniture and other equipment 19,748,409 3,694,904 (668,054) 22,775,259
Total accumulated depreciation 218,804,172 29,897,030 (2,764,942) 245,936,260
Net depreciable capital assets 742,827,197 (9,707,394) (402,975) 732,716,828
Net capital assets 856,924,547$ 19,748,092$ (410,125)$ 876,262,514$
2015

40
NOTE 19. CAPITAL ASSETS-continued
Capital assets activity for the year ended August 31, 2014 reflects a change in estimate of accumulated deprecia-tion. Included in gain on disposal of assets for the years ended August 31, 2015 and 2014, respectively, are $0 and $2,282,833 in insurance proceeds from District property that was impaired.
Beginning Additions Ending
Balance (Transfers) Deletions Balance
Non-depreciable capital assetsLand 77,818,209$ 4,723,140$ (10,590,761)$ 71,950,588$ Collections 1,433,518 1,433,518 Construction in progress 41,988,790 (1,275,546) 40,713,244
Total cost of non-depreciable capital assets 121,240,517 3,447,594 (10,590,761) 114,097,350
Depreciable capital assetsBuildings 589,139,988 589,139,988 Improvements other than buildings 253,060,263 42,973,054 (8,176) 296,025,141 Telecommunications and peripheral equipment 28,257,031 1,373,602 (3,234,952) 26,395,681 Library books 7,850,559 718,164 (665,273) 7,903,450 Furniture and other equipment 40,896,170 2,275,097 (1,004,158) 42,167,109
Total cost of depreciable capital assets 919,204,011 47,339,917 (4,912,559) 961,631,369
Accumulated depreciationBuildings 91,224,073 10,604,519 101,828,592 Improvements other than buildings 60,829,629 11,521,103 (4,243) 72,346,489 Telecommunications and peripheral equipment 20,725,827 3,205,174 (3,084,112) 20,846,889 Library books 4,946,674 372,770 (1,285,651) 4,033,793 Furniture and other equipment 17,080,264 3,492,440 (824,295) 19,748,409
Total accumulated depreciation 194,806,467 29,196,006 (5,198,301) 218,804,172
Net depreciable capital assets 724,397,544 18,143,911 285,742 742,827,197
Net capital assets 845,638,061$ 21,591,505$ (10,305,019)$ 856,924,547$
2014

41
NOTE 20. COMMITMENTS AND CONTINGENCIES The District has entered into several contracts for various construction and renovation projects across the Dis-trict. As of August 31, 2015, the balance remaining on these contracts totaled approximately $11,418,000.
NOTE 21. DESIGNATIONS OF UNRESTRICTED NET POSITION The governing board of the District has made the following designations of unrestricted net position: NOTE 22. DISAGGREGATION OF RECEIVABLES AND PAYABLES BALANCES Accounts receivable at August 31, 2015 and 2014, were as follows:
2015 2014
Student Receivables 23,514,446$ 19,578,926$
Accounts Receivable 1,469,588 1,242,280
Other Receivables 277,633 168,267
Subtotal 25,261,667 20,989,473
Allowance for Doubtful Accounts (13,821,570) (10,672,700)
Total Accounts Receivable-Exhibit 1 11,440,097$ 10,316,773$
2015 2014
Unrestricted net positionDesignated for
Capital outlay 19,707,675$ 27,706,873$ Future renewals and replacements 25,382,599 1,729,754 Future operating budgets 5,000,000 5,000,000 Insurance 700,000 700,000
Undesignated 111,007,811 171,195,106
Total unrestricted net position 161,798,085$ 206,331,733$

42
NOTE 22. DISAGGREGATION OF RECEIVABLES AND PAYABLES BALANCES-continued Accounts payable and accrued liabilities at August 31, 2015 and 2014, were as follows:
NOTE 23. CHANGE IN ACCOUNTING PRINCIPLE As discussed in Note 2, the District has implemented GASB Statement No. 68, Accounting and Financial Reporting for Pensions – An Amendment of GASB Statement No. 27 and GASB Statement No. 71, Pension Transition for Contri-butions Made Subsequent to the Measurement Date – An Amendment of GASB Statement No. 68. In accordance with these statements, the District has restated its net position as of August 31, 2014 as shown on the Statements of Revenues, Expenses, and Changes in Net Position in order to reflect the effects of implementing these standards. The effect of these adjustments was a reduction of the District’s August 31, 2014 net position as previously re-ported in the amount of $46,603,458.
2015 2014
Vendors Payable 11,924,003$ 17,684,007$
Accounts Payable-Exhibit 1 11,924,003 17,684,007
Salaries & Benefits Payable 5,684,714 5,130,761
Workers' Compensation Payable 606,278 502,959
Retainage Payable 1,823,120 890,863
Accrued Interest 16,892
Unemployment Compensation 155,698 242,036
Accrued Liabilities-Exhibit 1 8,269,810 6,783,511 Total Accounts Payable and Accrued Liabilities 20,193,813$ 24,467,518$

43
Required
Supplementary
Information
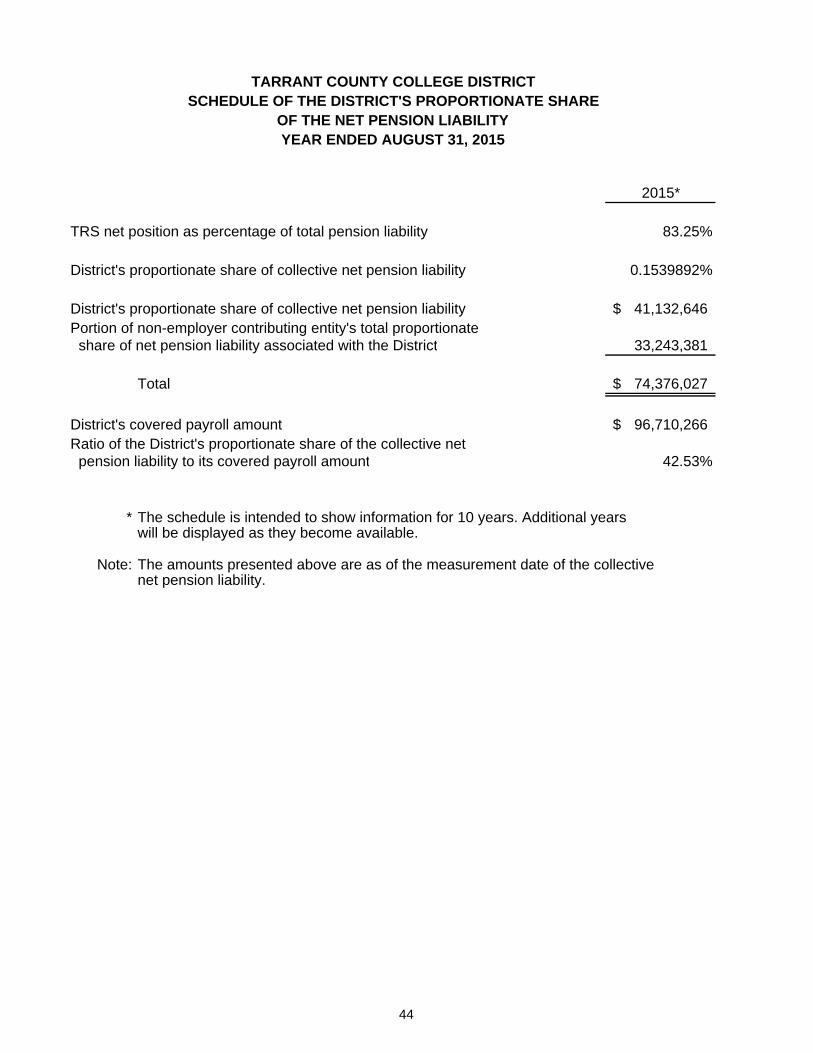
2015*
TRS net position as percentage of total pension liability 83.25%
District's proportionate share of collective net pension liability 0.1539892%
District's proportionate share of collective net pension liability 41,132,646$ Portion of non-employer contributing entity's total proportionate share of net pension liability associated with the District 33,243,381
Total 74,376,027$
District's covered payroll amount 96,710,266$ Ratio of the District's proportionate share of the collective net pension liability to its covered payroll amount 42.53%
* The schedule is intended to show information for 10 years. Additional yearswill be displayed as they become available.
Note: The amounts presented above are as of the measurement date of the collectivenet pension liability.
TARRANT COUNTY COLLEGE DISTRICTSCHEDULE OF THE DISTRICT'S PROPORTIONATE SHARE
OF THE NET PENSION LIABILITYYEAR ENDED AUGUST 31, 2015
44

2015*
Legally required contributions 4,054,353$ Actual contributions (4,054,353)
Contributions deficiency (excess) -
District covered employee payroll amount 96,710,266$
Ratio of actual contributions to covered payroll amount 4.19%
* The schedule is intended to show information for 10 years. Additional yearswill be displayed as they become available.
Note: The amounts presented above are as of the District's most recent fiscal year-end.
TARRANT COUNTY COLLEGE DISTRICTSCHEDULE OF THE DISTRICT'S CONTRIBUTIONS
YEAR ENDED AUGUST 31, 2015
45

46
CHANGES OF BENEFIT TERMS:
There were no benefit changes recognized in the total pension liability as of August 31, 2015.
CHANGES OF ASSUMPTIONS:
There were no changes of assumptions for the year ended August 31, 2015.
TARRANT COUNTY COLLEGE DISTRICT NOTES TO REQUIRED SUPPLEMENTARY INFORMATION
YEAR ENDED AUGUST 31, 2015

47
Supplementary
Data

TotalEducational
Unrestricted Restricted Activities
TuitionState funded courses
In-district resident tuition 44,336,742$ $ 44,336,742$ Out-of-district resident tuition 5,761,108 5,761,108 TPEG- credit (set aside)* 3,135,665 3,135,665 Non-resident tuition 5,366,074 5,366,074 Continuing education 2,637,554 2,637,554 TPEG-continuing education (set aside)* 168,344 168,344
Non-state funded continuing education 1,420,134 1,420,134
Total tuition 62,825,621 62,825,621
FeesLaboratory fees 96,677 96,677 Other fees 148,022 148,022
Total fees 244,699 244,699
Allowances and discountsBad debt allowance (2,807,548) (2,807,548) Scholarship allowances (899,751) (899,751) Remissions and exemptions (1,098,551) (1,098,551) TPEG allowances (345,358) (345,358) Federal grants to students (8,441,044) (8,441,044)
Total allowances and discounts (13,592,252) (13,592,252)
Total net tuition and fees 49,478,068 49,478,068
Other operating revenuesFederal grants and contracts 3,685,838 3,685,838 State grants and contracts 5,228,098 5,228,098 Non-governmental grants and contracts 2,727,036 2,727,036 Other operating revenues 4,714,371 4,714,371
Total other operating revenues 4,714,371 11,640,972 16,355,343
Auxiliary enterprisesBookstore Food service Testing center Child center Professional Pilot
Total net auxiliary enterprises
Total operating revenues 54,192,439$ 11,640,972$ 65,833,411$
* In accordance with Education Code 56.033, $3,304,009 and $3,364,701 of tuition for the years ended August 31, 2015 and 2014, respectively, was set aside for Texas Public Education Grants (TPEG)
Note: The District has contracted with a college bookstore operator to operate and manage the District's bookstoresunder an agreement that terminates on September 30, 2016 and may be renewed for additional successive oneyear periods upon mutual agreement of the parties.
TARRANT COUNTY COLLEGE DISTRICTSCHEDULE A
SCHEDULE OF OPERATING REVENUESYEAR ENDED AUGUST 31, 2015
(WITH MEMORANDUM TOTALS FOR THE YEAR ENDED AUGUST 31, 2014)
48

Auxiliary 2015 2014Enterprises Total Total
$ 44,336,742$ 46,056,705$
5,761,108 5,860,255 3,135,665 3,225,259 5,366,074 5,627,289 2,637,554 2,180,030
168,344 139,442 1,420,134 1,490,206
62,825,621 64,579,186
96,677 96,677 148,022 167,226
244,699 263,903
(2,807,548) (3,042,230) (899,751) (788,680)
(1,098,551) (1,798,244) (345,358) (442,354)
(8,441,044) (9,400,579)
(13,592,252) (15,472,087)
49,478,068 49,371,002
3,685,838 3,217,611 5,228,098 5,880,099 2,727,036 4,946,370 4,714,371 6,343,924
16,355,343 20,388,004
1,026,173 1,026,173 1,348,227 347,046 347,046 346,062 439,497 439,497 480,380 311,354 311,354 334,526
1,234,257 1,234,257 326,091
3,358,327 3,358,327 2,835,286
3,358,327$ 69,191,738$ 72,594,292$
(Exhibit 2) (Exhibit 2)
49
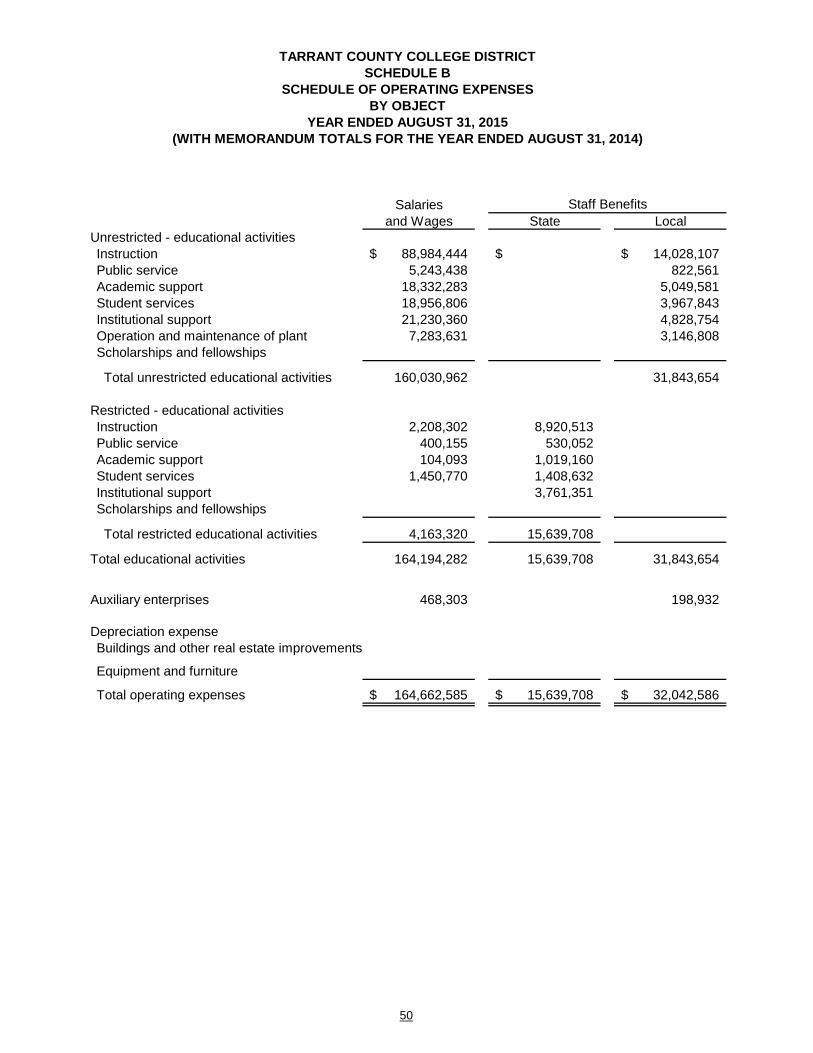
Salariesand Wages State Local
Unrestricted - educational activitiesInstruction 88,984,444$ $ 14,028,107$ Public service 5,243,438 822,561 Academic support 18,332,283 5,049,581 Student services 18,956,806 3,967,843 Institutional support 21,230,360 4,828,754 Operation and maintenance of plant 7,283,631 3,146,808 Scholarships and fellowships
Total unrestricted educational activities 160,030,962 31,843,654
Restricted - educational activitiesInstruction 2,208,302 8,920,513 Public service 400,155 530,052 Academic support 104,093 1,019,160 Student services 1,450,770 1,408,632 Institutional support 3,761,351 Scholarships and fellowships
Total restricted educational activities 4,163,320 15,639,708
Total educational activities 164,194,282 15,639,708 31,843,654
Auxiliary enterprises 468,303 198,932
Depreciation expense Buildings and other real estate improvements
Equipment and furniture
Total operating expenses 164,662,585$ 15,639,708$ 32,042,586$
Staff Benefits
TARRANT COUNTY COLLEGE DISTRICTSCHEDULE B
SCHEDULE OF OPERATING EXPENSESBY OBJECT
YEAR ENDED AUGUST 31, 2015(WITH MEMORANDUM TOTALS FOR THE YEAR ENDED AUGUST 31, 2014)
50

Other 2015 2014Expenses Total Total
15,370,955$ 118,383,506$ 112,284,612$ 1,509,924 7,575,923 6,569,060 4,486,676 27,868,540 26,493,923 4,537,486 27,462,135 26,101,310
11,055,264 37,114,378 36,149,782 22,834,152 33,264,591 38,451,779 1,698,401 1,698,401 1,798,244
61,492,858 253,367,474 247,848,710
1,159,735 12,288,550 11,018,963 682,072 1,612,279 1,530,538
1,123,253 1,074,042 1,148,979 4,008,381 3,477,321
3,761,351 3,554,490 62,863,312 62,863,312 73,903,568
65,854,098 85,657,126 94,558,922
127,346,956 339,024,600 342,407,632
3,119,721 3,786,956 2,822,103
23,532,916 23,532,916 22,125,623
6,364,114 6,364,114 7,070,383
160,363,707$ 372,708,586$ 374,425,741$
(Exhibit 2) (Exhibit 2)
51

AuxiliaryUnrestricted Restricted Enterprises
NON-OPERATING REVENUES State appropriations Education and general state support 54,396,982$ $ $ State group insurance 11,381,867 State retirement matching 4,257,841
Total state appropriations 54,396,982 15,639,708
Maintenance ad valorem taxes 190,805,920 Debt service ad valorem taxes 6,616,686 Federal grants and contracts 66,314,027 Gifts Investment income 1,763,238 23,302 Other income 910,990 Gain on disposal of assets
Total non-operating revenues 254,493,816 81,953,735 23,302
NON-OPERATING EXPENSES Investment losses 318,660 Loss on disposal of assets 371,380
Total non-operating expenses 371,380 318,660
Net non-operating revenues 254,122,436$ 81,635,075$ 23,302$
TARRANT COUNTY COLLEGE DISTRICTSCHEDULE C
SCHEDULE OF NON-OPERATING REVENUES AND EXPENSESYEAR ENDED AUGUST 31, 2015
(WITH MEMORANDUM TOTALS FOR THE YEAR ENDED AUGUST 31, 2014)
52
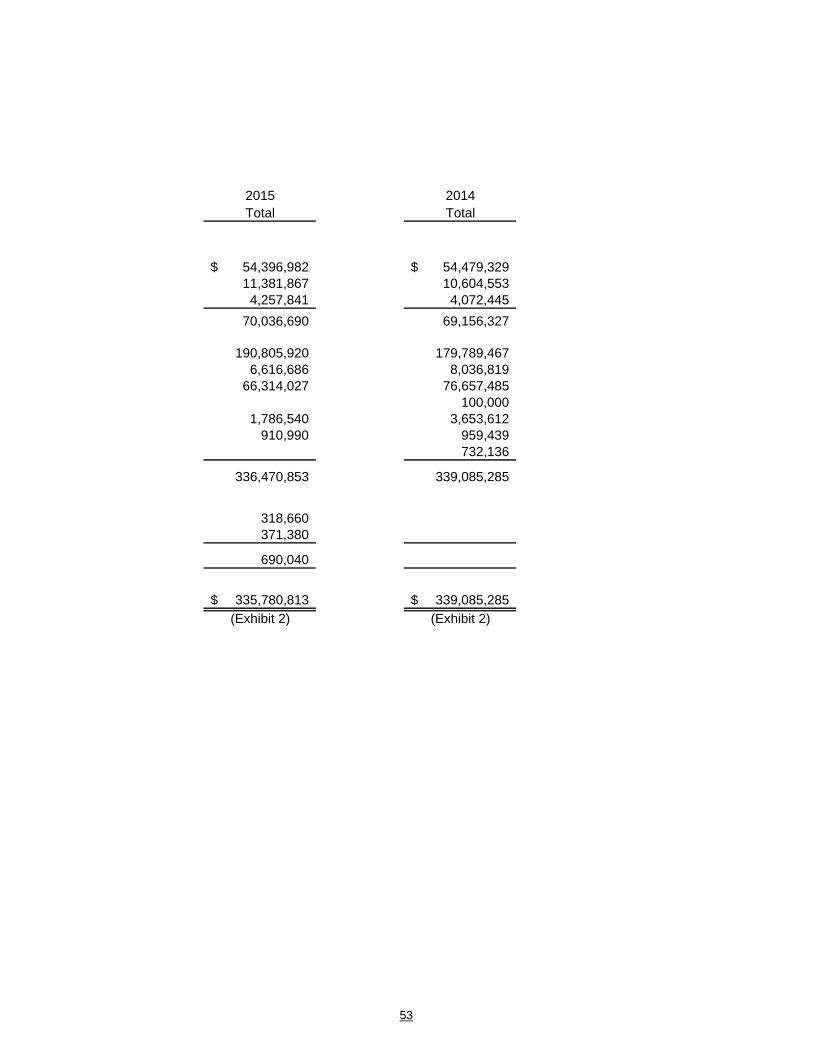
2015 2014Total Total
54,396,982$ 54,479,329$ 11,381,867 10,604,553 4,257,841 4,072,445
70,036,690 69,156,327
190,805,920 179,789,467 6,616,686 8,036,819
66,314,027 76,657,485 100,000
1,786,540 3,653,612 910,990 959,439
732,136
336,470,853 339,085,285
318,660 371,380
690,040
335,780,813$ 339,085,285$
(Exhibit 2) (Exhibit 2)
53

Unrestricted Expendable Non-Expendable
Current:Unrestricted 87,157,475$ $ $
Board designated 50,790,274 Restricted 6,617,434Auxiliary enterprises 23,850,336
Loan 143,862Plant:Debt service 23,521Investment in plant
Total net position, August 31, 2015 161,798,085 6,784,817
Total net position, August 31, 2014 206,331,733 8,843,553
Change in accounting principle (46,603,458)
Net increase (decrease) in net position (44,533,648)$ (2,058,736)$ $
Restricted
TARRANT COUNTY COLLEGE DISTRICTSCHEDULE D
SCHEDULE OF NET POSITION BY SOURCE AND AVAILABILITYYEAR ENDED AUGUST 31, 2015
(WITH MEMORANDUM TOTALS FOR THE YEAR ENDED AUGUST 31, 2014)
Detail by Source
54

Net Investmentin Capital Assets Total Yes No
$ 87,157,475$ 87,157,475$ $ 50,790,274 50,790,274 6,617,434 6,617,434
23,850,336 23,850,336 143,862 143,862
23,521 23,521
871,262,514 871,262,514 871,262,514
871,262,514 1,039,845,416 111,007,811 928,837,605 (Exhibit 1)
839,009,623 1,054,184,909 175,209,031 878,975,878 (Exhibit 1)
(46,603,458) (46,603,458)
(Exhibit 2)
32,252,891$ 32,263,965$ (17,597,762)$ 49,861,727$
(Exhibit 2)
Detail by Source Available for Current Operations
55

®

STATISTICAL SECTION
STA
TIST
ICA
L SEC
TIO
N

57
STATISTICAL SECTION
This part of the Tarrant County College District’s comprehensive annual financial report presents detailed information as a context for understanding what the information in the financial statements, note disclosures and required supplementary information says about the District’s overall financial health.
Contents
Statistical Supplements
Financial Trends 1-3
These schedules contain trend information to help the reader understand how the District’s financial performance and well-being have changed over time.
Revenue Capacity 4-8
These schedules contain information to help the reader assess the District’s most significant local revenue sources.
Debt Capacity 9-11
These schedules present information to help the reader assess the affordability of the District’s current level of outstanding debt.
Demographic and Economic Information 12-13
These schedules offer demographic and economic indicators to help the reader understand the environment within which the District’s activities take place.
Operating Information 14-18
These schedules contain employment, enrollment and infrastructure data to help the reader understand how the information in the District’s financial report relates to the services the District provides and the activities it performs.
Sources: Unless otherwise noted, the information in these schedules is derived from the comprehensive financial reports from the relevant year.

2015 2014 2013 2012
Net investment in capital assets 871,262,514$ 839,009,623$ 816,910,267$ 772,740,979$
Restricted - expendable 6,784,817 8,843,553 6,639,969 6,770,189
Restricted - nonexpendable
Unrestricted 161,798,085 206,331,733 193,380,837 196,305,399
Total primary government net position 1,039,845,416 1,054,184,909 1,016,931,073 975,816,567
Net Position, beginning of year 1,054,184,909 1,016,931,073 975,662,444 923,886,954
Change in accounting principle (46,603,458)
Net Position, beginning of year, restated 1,007,581,451
Increase in Net Position 32,263,965$ 37,253,836$ 41,268,629$ 51,929,613$
LAST TEN FISCAL YEARS(UNAUDITED)
TARRANT COUNTY COLLEGE DISTRICTSTATISTICAL SUPPLEMENT 1
NET POSITION BY COMPONENT
58

2011 2010 2009 2008 2007 2006
757,613,463$ 707,299,717$ 638,222,485$ 548,838,668$ 207,334,709$ 152,503,842$
6,243,001 5,601,190 5,419,823 5,709,923 4,524,571 4,628,236
207,973 699,347 673,065 607,895
160,030,490 157,642,379 148,297,840 143,437,568 374,501,328 320,001,778
923,886,954 870,543,286 792,148,121 698,685,506 587,033,673 477,741,751
870,543,286 792,148,121 698,685,506 587,033,673 477,741,751 383,432,794
53,343,668$ 78,395,165$ 93,462,615$ 111,651,833$ 109,291,922$ 94,308,957$
59

2015 2014 2013 2012Operating revenues Tuition and fees (net of discounts) 49,478,068$ 49,371,002$ 50,245,813$ 50,214,996$ Governmental grants and contracts Federal grants and contracts 3,685,838 3,217,611 3,757,923 3,338,370 State grants and contracts 5,228,098 5,880,099 5,554,657 4,770,234 Non-governmental grants and contracts 2,727,036 4,946,370 3,162,051 3,971,945 Auxiliary enterprises 3,358,327 2,835,286 2,920,961 3,275,283 Other operating revenues 4,714,371 6,343,924 6,212,717 5,607,184
Total operating revenues 69,191,738 72,594,292 71,854,122 71,178,012 Non-operating revenues State appropriations 70,036,690 69,156,327 63,300,842 61,563,447 Ad-valorem taxes 197,422,606 187,826,286 182,149,704 180,009,933 Federal grants and contracts 66,314,027 76,657,485 80,360,739 77,967,771 Gifts 100,000 142,795 Investment income 1,467,880 3,653,612 1,117,501 Other income 910,990 1,691,575 1,134,523 899,186
Total non-operating revenues 336,152,193 339,085,285 327,088,603 321,557,838 Other revenues Additions to permanent endowments
Total revenues 405,343,931$ 411,679,577$ 398,942,725$ 392,735,850$
Operating revenues Tuition and fees (net of discounts) 12.21% 11.99% 12.59% 12.81% Governmental grants and contracts Federal grants and contracts 0.91% 0.78% 0.94% 0.85% State grants and contracts 1.29% 1.43% 1.39% 1.21% Non-governmental grants and contracts 0.68% 1.20% 0.79% 1.01% Auxiliary enterprises 0.83% 0.70% 0.73% 0.83% Other operating revenues 1.17% 1.54% 1.56% 1.43%
Total operating revenues 17.09% 17.64% 18.00% 18.14%Non-operating revenues State appropriations 17.28% 16.80% 15.87% 15.68% Ad-valorem taxes 48.70% 45.62% 45.66% 45.82% Federal grants and contracts 16.36% 18.62% 20.15% 19.85% Gifts 0.00% 0.02% 0.04% Investment income 0.36% 0.89% 0.28% Other income 0.21% 0.41% 0.28% 0.23%
Total non-operating revenues 82.91% 82.36% 82.00% 81.86%
Other revenues Additions to permanent endowments
Total revenues 100.00% 100.00% 100.00% 100.00%
(UNAUDITED)
TARRANT COUNTY COLLEGE DISTRICTSTATISTICAL SUPPLEMENT 2
REVENUES BY SOURCELAST TEN FISCAL YEARS
60

2011 2010 2009 2008 2007 2006
46,446,649$ 45,507,326$ 41,411,491$ 38,918,863$ 35,651,135$ 37,454,608$
3,738,898 2,662,284 4,530,581 2,420,630 2,122,182 2,642,452 6,403,470 4,436,087 2,931,041 2,335,426 1,793,467 1,377,111 3,123,262 2,245,408 2,180,664 1,139,402 1,366,985 1,049,439 3,453,670 3,381,510 3,103,757 3,211,761 4,513,492 15,677,393 6,922,636 7,036,611 7,095,780 1,481,599 428,375 564,977
70,088,585 65,269,226 61,253,314 49,507,681 45,875,636 58,765,980
65,923,473 67,133,335 60,335,031 59,543,945 57,004,281 56,331,587 163,339,387 170,989,124 168,458,577 156,897,585 145,076,199 133,946,296 84,809,753 59,862,557 35,579,625 23,179,682 20,153,359 18,676,113
750 5,250 1,200 1,000 1,101,500 1,600,511 1,404,780 3,681,350 17,518,082 21,165,311 13,464,141 2,213,352 702,665 702,660 702,656 5,141,280 1,189,502
317,887,226 300,097,711 268,757,243 257,843,150 248,541,430 224,709,139
26,223 42,660 40,810 64,698 45,801
387,975,811$ 365,393,160$ 330,053,217$ 307,391,641$ 294,481,764$ 283,520,920$
11.98% 12.45% 12.55% 12.65% 12.11% 13.21%
0.96% 0.73% 1.37% 0.79% 0.72% 0.93%1.65% 1.21% 0.89% 0.76% 0.61% 0.49%0.81% 0.61% 0.66% 0.37% 0.46% 0.37%0.89% 0.93% 0.94% 1.04% 1.53% 5.53%1.78% 1.93% 2.15% 0.48% 0.15% 0.20%
18.07% 17.86% 18.56% 16.09% 15.58% 20.73%
16.99% 18.37% 18.28% 19.37% 19.36% 19.87%42.10% 46.80% 51.04% 51.06% 49.26% 47.24%21.86% 16.38% 10.78% 7.54% 6.84% 6.59%
0.39%0.41% 0.38% 1.12% 5.70% 7.19% 4.75%0.57% 0.19% 0.21% 0.23% 1.75% 0.42%
81.93% 82.12% 81.43% 83.90% 84.40% 79.26%
0.02% 0.01% 0.01% 0.02% 0.01%
100.00% 100.00% 100.00% 100.00% 100.00% 100.00%
61

2015 2014 2013 2012
Instruction 130,672,056$ 123,303,575$ 115,814,409$ 108,078,177$ Public service 9,188,202 8,099,598 8,333,736 5,496,537 Academic support 28,991,793 27,567,965 24,779,010 21,512,584 Student services 31,470,516 29,578,631 28,786,433 24,690,936 Institutional support 40,875,729 39,704,272 39,193,209 34,326,749 Operation and maintenance of plant 33,264,591 38,451,779 34,748,311 38,794,192 Scholarship and fellowships 64,561,713 75,701,812 76,363,289 78,968,897 Auxiliary enterprises 3,786,956 2,822,103 2,243,087 2,152,576 Depreciation 29,897,030 29,196,006 27,412,612 26,188,770
Total operating expenses 372,708,586 374,425,741 357,674,096 340,209,418
Interest on capital related debt 289,308 Foundation transferLoss on disposal of fixed assets 371,380 307,511
Total non-operating expenses 371,380 596,819
Total expenses 373,079,966$ 374,425,741$ 357,674,096$ 340,806,237$
Instruction 35.03% 32.93% 32.38% 31.74%Public service 2.45% 2.16% 2.33% 1.61%Academic support 7.77% 7.36% 6.93% 6.31%Student services 8.44% 7.90% 8.05% 7.24%Institutional support 10.96% 10.61% 10.96% 10.07%Operation and maintenance of plant 8.92% 10.27% 9.71% 11.38%Scholarship and fellowships 17.31% 20.22% 21.35% 23.17%Auxiliary enterprises 1.02% 0.75% 0.63% 0.63%Depreciation 8.01% 7.80% 7.66% 7.68%
Total operating expenses 99.91% 100.00% 100.00% 99.83%
Interest on capital related debt 0.08%Foundation transferLoss on disposal of fixed assets 0.09% 0.09%
Total non-operating expenses 0.09% 0.17%
Total expenses 100.00% 100.00% 100.00% 100.00%
(UNAUDITED)
TARRANT COUNTY COLLEGE DISTRICTSTATISTICAL SUPPLEMENT 3
PROGRAM EXPENSES BY FUNCTIONLAST TEN FISCAL YEARS
62

2011 2010 2009 2008 2007 2006
114,166,378$ 95,921,420$ 83,437,483$ 75,066,102$ 71,745,930$ 68,221,085$ 7,001,458 6,739,303 6,365,670 5,041,719 4,641,156 4,751,125
21,847,574 16,917,975 14,013,169 12,514,941 11,349,181 10,097,671 25,282,806 20,840,918 17,849,057 15,874,448 14,125,391 14,092,532 29,283,026 31,207,465 26,010,789 23,307,939 26,263,394 21,636,434 34,941,445 39,900,473 38,177,688 32,293,652 26,056,295 23,876,530 78,792,547 55,583,034 35,129,416 21,813,943 18,846,333 21,169,637 2,262,986 2,114,115 1,624,126 1,582,216 2,583,589 14,599,987
20,670,066 17,268,778 12,123,042 7,961,528 7,561,001 7,941,827
334,248,286 286,493,481 234,730,440 195,456,488 183,172,270 186,386,828
1,055,063 2,676,865 201,997 1,432,482
383,857 302,517 427,680 283,320 962,509 148,270
383,857 504,514 1,860,162 283,320 2,017,572 2,825,135
334,632,143$ 286,997,995$ 236,590,602$ 195,739,808$ 185,189,842$ 189,211,963$
34.11% 33.42% 35.27% 38.35% 38.73% 36.04%2.09% 2.35% 2.69% 2.58% 2.51% 2.51%6.53% 5.89% 5.92% 6.39% 6.13% 5.34%7.56% 7.26% 7.54% 8.11% 7.63% 7.45%8.75% 10.87% 10.99% 11.91% 14.18% 11.44%
10.44% 13.90% 16.14% 16.50% 14.07% 12.62%23.55% 19.37% 14.85% 11.14% 10.18% 11.19%0.68% 0.74% 0.69% 0.81% 1.40% 7.72%6.18% 6.02% 5.12% 4.07% 4.08% 4.20%
99.89% 99.82% 99.21% 99.86% 98.91% 98.51%
0.57% 1.41%0.07% 0.61%
0.11% 0.11% 0.18% 0.14% 0.52% 0.08%
0.11% 0.18% 0.79% 0.14% 1.09% 1.49%
100.00% 100.00% 100.00% 100.00% 100.00% 100.00%
63
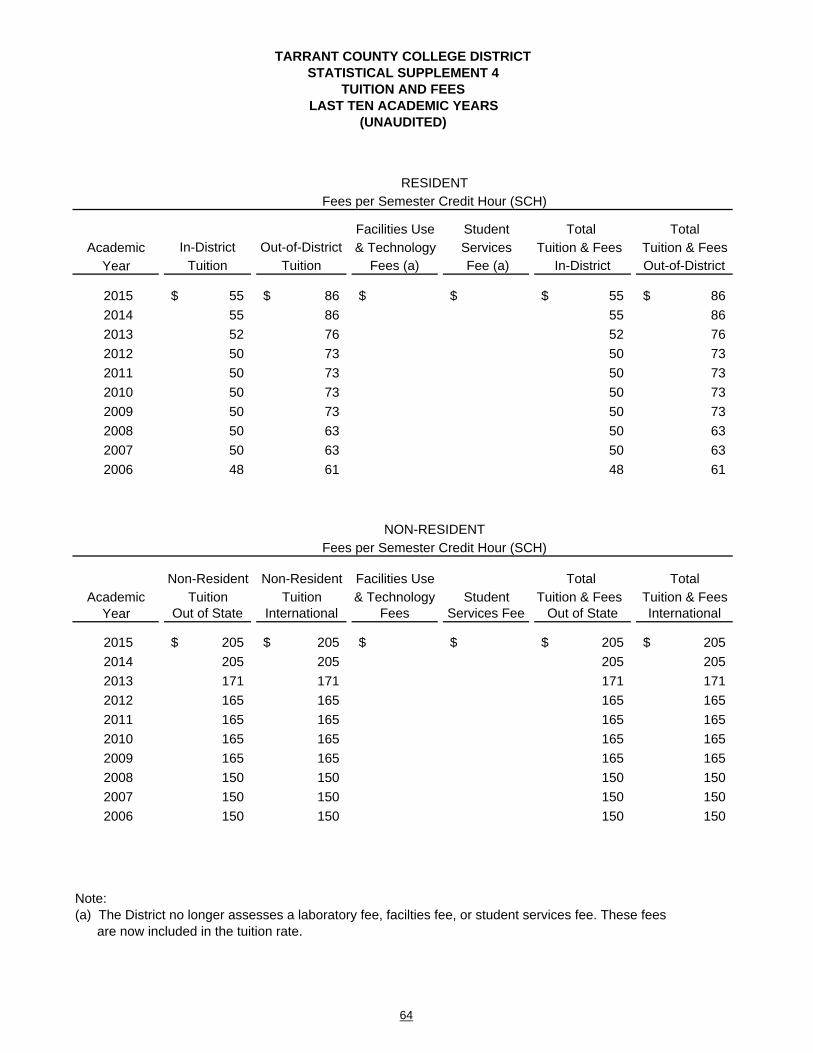
Facilities Use Student Total TotalIn-District Out-of-District & Technology Services Tuition & Fees Tuition & Fees
Tuition Tuition Fees (a) Fee (a) In-District Out-of-District
2015 55$ 86$ $ $ 55$ 86$
2014 55 86 55 86
2013 52 76 52 76
2012 50 73 50 73
2011 50 73 50 73
2010 50 73 50 73
2009 50 73 50 73
2008 50 63 50 63
2007 50 63 50 63
2006 48 61 48 61
Non-Resident Non-Resident Facilities Use Total TotalTuition Tuition & Technology Student Tuition & Fees Tuition & Fees
Out of State International Fees Services Fee Out of State International
2015 205$ 205$ $ $ 205$ 205$
2014 205 205 205 205
2013 171 171 171 171
2012 165 165 165 165
2011 165 165 165 165
2010 165 165 165 165
2009 165 165 165 165
2008 150 150 150 150
2007 150 150 150 150
2006 150 150 150 150
Note:(a) The District no longer assesses a laboratory fee, facilties fee, or student services fee. These fees are now included in the tuition rate.
AcademicYear
RESIDENT
NON-RESIDENTFees per Semester Credit Hour (SCH)
Fees per Semester Credit Hour (SCH)
AcademicYear
LAST TEN ACADEMIC YEARS(UNAUDITED)
TARRANT COUNTY COLLEGE DISTRICTSTATISTICAL SUPPLEMENT 4
TUITION AND FEES
64

Cost for 12 Cost for 12 Increase from Increase fromSCH SCH Prior Year Prior Year
In-District Out-of-District In-District Out-of-District
660$ 1,032$ 0.00% 0.00%
660 1,032 5.77% 13.16%
624 912 4.00% 4.11%
600 876 0.00% 0.00%
600 876 0.00% 0.00%
600 876 0.00% 0.00%
600 876 0.00% 15.87%
600 756 0.00% 0.00%
600 756 4.17% 3.28%
576 732 4.35% 3.39%
Cost for 12 Cost for 12 Increase from Increase fromSCH SCH Prior Year Prior Year
Out of State International Out of State International
2,460$ 2,460$ 0.00% 0.00%
2,460 2,460 19.88% 19.88%
2,052 2,052 3.64% 3.64%
1,980 1,980 0.00% 0.00%
1,980 1,980 0.00% 0.00%
1,980 1,980 0.00% 0.00%
1,980 1,980 10.00% 10.00%
1,800 1,800 0.00% 0.00%
1,800 1,800 0.00% 0.00%
1,800 1,800 0.00% 0.00%
RESIDENTFees per Semester Credit Hour (SCH)
NON-RESIDENTFees per Semester Credit Hour (SCH)
65

Fiscal Year
Assessed Valuation of
Real Property
Assessed Valuation of
Personal Property
Assessed Valuation of
Property Less: Exemptions
2015 141,311,318,941$ 25,239,113,478$ 166,550,432,419$ (30,237,870,137)$
2014 134,490,264,565 23,748,078,239 158,238,342,804 (30,784,142,232)
2013 131,175,795,248 22,689,236,805 153,865,032,053 (28,772,399,041)
2012 129,269,619,814 21,355,852,598 150,625,472,412 (27,134,616,699)
2011 126,259,248,729 20,867,055,732 147,126,304,461 (25,115,089,135)
2010 131,940,371,709 21,335,328,974 153,275,700,683 (25,568,435,000)
2009 126,732,666,961 21,837,887,387 148,570,554,348 (23,951,146,989)
2008 117,918,342,981 20,528,694,871 138,447,037,852 (23,543,915,305)
2007 109,182,979,056 19,094,790,500 128,277,769,556 (22,509,449,466)
2006 96,338,355,955 19,697,899,501 116,036,255,456 (21,098,340,175)
Source:Tarrant Appraisal District
Notes:Property is assessed at full market value.(a) per $100 taxable assessed valuation
LAST TEN FISCAL YEARS(UNAUDITED)
TARRANT COUNTY COLLEGE DISTRICTSTATISTICAL SUPPLEMENT 5
ASSESSED VALUE AND TAXABLE ASSESSED VALUE OF PROPERTY
66

Taxable Assessed Value
Ratio of TaxableAssessed Value
to Assessed Value
Maintenance and
Operations (a) Debt Service
(a) Total (a)
136,312,562,282$ 81.84% 0.14392$ 0.00558$ 0.14950$
127,454,200,572 80.55% 0.14241 0.00709 0.14950
125,092,633,012 81.30% 0.14241 0.00656 0.14897
123,490,855,713 81.99% 0.14206 0.00691 0.14897
122,011,215,326 82.93% 0.13126 0.00638 0.13764
127,707,265,683 83.32% 0.13126 0.00641 0.13767
124,619,407,359 83.88% 0.13126 0.00670 0.13796
114,903,122,547 82.99% 0.13126 0.00812 0.13938
105,768,320,090 82.45% 0.13068 0.00870 0.13938
94,937,915,281 81.82% 0.13046 0.00892 0.13938
67

Fiscal YearState
Appropriation FTSE
State Appropriation
per FTSE
2015 54,396,982$ 28,160 1,932$
2014 54,479,329 29,395 1,853
2013 53,068,368 29,403 1,805
2012 51,882,971 29,054 1,786
2011 48,763,674 28,417 1,716
2010 50,920,045 25,536 1,994
2009 45,672,690 22,649 2,017
2008 45,442,760 21,658 2,098
2007 43,361,661 20,206 2,146
2006 43,361,661 20,509 2,114
Source:(a) CBM004(b) CBM00C
Note:FTSE is defined as the number of full time students plus total hours taken by part-time students divided by 12.
Appropriation per FTSE
TARRANT COUNTY COLLEGE DISTRICTSTATISTICAL SUPPLEMENT 6
STATE APPROPRIATION PER FTSE AND CONTACT HOURLAST TEN FISCAL YEARS
(UNAUDITED)
68

Academic and Vocational
ContactHours (a)
Continuing Ed Contact Hours (b)
Total Contact Hours
State Appropriation per Contact
Hour
18,199,288 1,883,522 20,082,810 2.71$
18,599,915 1,638,878 20,238,793 2.69
18,611,304 1,615,743 20,227,047 2.62
18,486,584 1,682,220 20,168,804 2.57
18,559,872 1,467,076 20,026,948 2.43
17,673,443 1,247,942 18,921,385 2.69
15,212,795 1,283,646 16,496,441 2.77
13,975,532 1,107,544 15,083,076 3.01
12,703,996 1,097,771 13,801,767 3.14
12,868,384 551,891 13,420,275 3.23
Appropriation per Contact Hour
69

TaxpayerType of
Business 2015 2014 2013
Oncor Electric Delivery Co LLC Electric Utility 996,124,098$ 996,541,431$ 951,568,636$ XTO Energy Inc Natural Gas Utility 703,298,589 691,815,632 597,305,424 General Motors LLC Auto Manufacturer 694,999,441 305,558,069 Bell Helicopter Textron Helicopter Manufacturer 526,450,434 368,852,302 353,813,947 Chesapeake Operating Natural Gas Utility 494,992,110 472,698,380 565,845,620 Wal-Mart Stores Retail 474,129,452 474,104,104 470,417,156 American Airlines Inc Airline 434,149,748 415,466,631 366,781,877 Barnett Gathering LP Natural Gas Exploration 401,081,040 400,981,515 471,761,413 Devon Energy Production Natural Gas Utility 295,994,780 322,885,510 381,143,310 Town Square Ventures LP Retail 293,001,243 Opryland Hotel Hotel 252,604,271 278,139,403 Southwestern Bell Telephone Utility 240,513,694 Quicksilver Resources Natural Gas ExplorationEncana Oil & Gas (USA) Inc Natural Gas UtilityDdr/Dtc City Investments Investments Grapevine Mills Ltd Partnership RetailTXU Electric Delivery Co Electric UtilityCity Center Development Co Real Estate DevelopmentChief Oil and Gas Natural Gas Utility
Totals 5,314,220,935$ 4,701,507,845$ 4,677,290,480$
Total Taxable Assessed Value 136,312,562,282$ 127,454,200,572$ 125,092,633,012$
TaxpayerType of
Business 2015 2014 2013
Oncor Electric Delivery Co LLC Electric Utility 0.73% 0.78% 0.76%XTO Energy Inc Natural Gas Utility 0.52% 0.54% 0.48%General Motors LLC Auto Manufacturer 0.51% 0.24%Bell Helicopter Textron Helicopter Manufacturer 0.39% 0.29% 0.28%Chesapeake Operating Natural Gas Utility 0.36% 0.37% 0.45%Wal-Mart Stores Retail 0.35% 0.37% 0.38%American Airlines Inc Airline 0.32% 0.33% 0.29%Barnett Gathering LP Natural Gas Exploration 0.29% 0.31% 0.38%Devon Energy Production Natural Gas Utility 0.22% 0.26% 0.30%Town Square Ventures LP Retail 0.21%Opryland Hotel Hotel 0.20% 0.22%Southwestern Bell Telephone Utility 0.19%Quicksilver Resources Natural Gas ExplorationEncana Oil & Gas (USA) Inc Natural Gas UtilityDdr/Dtc City Investments InvestmentsGrapevine Mills Ltd Partnership RetailTXU Electric Delivery Co Electric UtilityCity Center Development Co Real Estate DevelopmentChief Oil and Gas Natural Gas Utility
Totals 3.90% 3.69% 3.73%
Source:Tarrant Appraisal District
TARRANT COUNTY COLLEGE DISTRICTSTATISTICAL SUPPLEMENT 7
PRINCIPAL TAXPAYERSLAST TEN FISCAL YEARS
(UNAUDITED)
70

2012 2011 2010 2009 2008 2007 2006
910,223,719$ 888,088,078$ 903,047,789$ 912,586,199$ 1,065,754,757$ $ $874,943,953 295,564,940 289,614,547 717,253,382 502,644,401 377,420,196
388,497,181 418,973,452 441,749,768 493,923,798 445,724,506 285,082,199 206,682,031 664,160,020 736,221,860 512,027,150 459,642,110 437,961,437 395,426,831 392,756,246 404,645,406 370,549,819 413,905,030 313,528,707 332,996,493 292,074,639 379,219,005 366,801,436 498,730,635 517,041,670 507,896,741 288,678,979 251,248,399 471,202,990 506,053,300 497,668,900 594,289,520 414,202,754 299,098,900
285,854,271 273,331,856 247,781,677 256,104,271 285,567,693 254,567,693 220,172,829 269,220,847 308,900,768 348,419,062 394,307,840 408,342,184 467,495,260 585,760,329
359,055,290 311,069,570 297,235,050
271,364,765 238,241,510 218,044,937 204,390,717 190,000,000
1,022,692,138 990,629,437 244,925,000 226,205,474
4,923,739,890$ 4,429,374,473$ 4,329,304,107$ 4,469,150,177$ 4,695,535,432$ 4,205,159,518$ 3,863,220,744$
123,490,855,713$ 122,011,215,326$ 127,707,265,683$ 124,619,407,359$ 114,903,122,547$ 105,768,320,090$ 94,937,915,281$
2012 2011 2010 2009 2008 2007 2006
0.74% 0.73% 0.71% 0.73% 0.93%0.71% 0.23% 0.23% 0.62% 0.48% 0.40%
0.31% 0.34% 0.35% 0.40% 0.39% 0.27% 0.22%0.54% 0.60% 0.40% 0.37%0.35% 0.32% 0.31% 0.32% 0.32% 0.39% 0.33%0.27% 0.24% 0.30% 0.29% 0.43% 0.49% 0.53%0.23% 0.21%0.38% 0.42% 0.39% 0.48% 0.36% 0.28%
0.23% 0.22% 0.19% 0.21% 0.25% 0.24% 0.23%0.22% 0.25% 0.27% 0.32% 0.36% 0.44% 0.62%
0.30%0.24% 0.24%
0.24% 0.23%0.19% 0.19% 0.20%
0.97% 1.04%0.26%0.24%
3.98% 3.63% 3.39% 3.59% 4.09% 3.98% 4.07%
% of Taxable Assessed Value by Tax Year
Taxable Assessed Value by Tax Year
71

LevyCumulative Levy
Adjustment
Adjusted Tax Levy
(a)
Collections-Year of Levy(b)
2015 201,369,072$ (459,345)$ 200,909,727$ 198,833,848$
2014 188,459,192 2,236,286 190,695,478 188,956,746
2013 184,458,402 395,328 184,853,730 183,071,724
2012 182,088,704 427,055 182,515,759 180,673,316
2011 165,529,411 1,217,026 166,746,437 164,882,248
2010 166,752,648 7,611,534 174,364,182 171,863,844
2009 163,282,528 7,347,808 170,630,336 168,182,973
2008 158,440,008 759,323 159,199,331 157,104,943
2007 145,656,686 1,117,463 146,774,149 144,425,218
2006 132,491,200 2,065,866 134,557,066 132,300,437
Source:Tarrant County Tax Assessor/ Collector and District records
Notes:(a) As of August 31st of the current reporting year(b) Property tax only- does not include penalties and interest(c) Represents cumulative collections of prior years not collected in the current year or the year of the tax levy(d) Represents current year collections of prior years levies
Fiscal Year Ended
August 31
TARRANT COUNTY COLLEGE DISTRICTSTATISTICAL SUPPLEMENT 8
PROPERTY TAX LEVIES AND COLLECTIONSLAST TEN FISCAL YEARS
(UNAUDITED)
72

PercentagePrior Collections
of Prior Levies (c)
Current Collections
of Prior Levies(d)
Total Collections(b+c+d)
Cumulative Collections
of Adjusted Levy
98.97% $ $ 198,833,848$ 98.97%
99.09% 609,970 189,566,716 99.41%
99.04% 755,155 334,510 184,161,389 99.63%
98.99% 1,199,335 183,497 182,056,148 99.75%
98.88% 1,385,055 125,483 166,392,786 99.79%
98.57% 1,676,026 115,151 173,655,021 99.59%
98.57% 2,014,096 39,795 170,236,864 99.77%
98.68% 1,924,842 17,920 159,047,705 99.90%
98.40% 1,841,543 12,495 146,279,256 99.66%
98.32% 1,581,798 8,472 133,890,707 99.50%
73
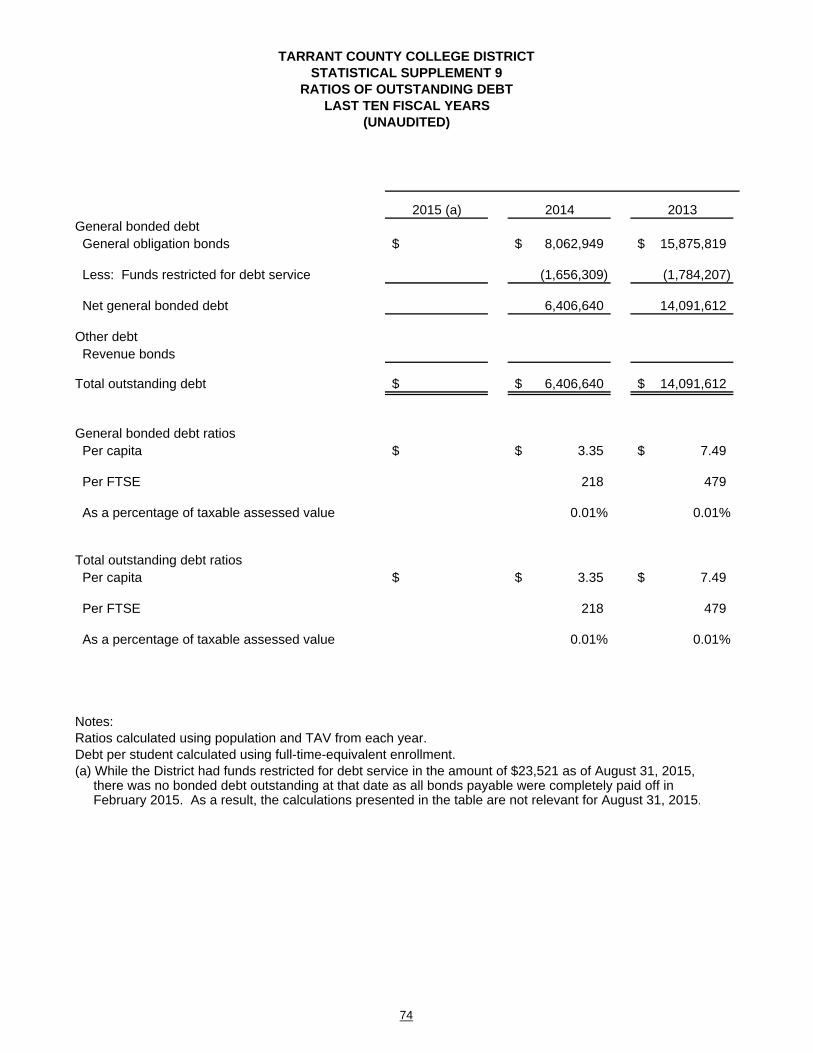
2015 (a) 2014 2013General bonded debt General obligation bonds $ 8,062,949$ 15,875,819$
Less: Funds restricted for debt service (1,656,309) (1,784,207)
Net general bonded debt 6,406,640 14,091,612
Other debt Revenue bonds
Total outstanding debt $ 6,406,640$ 14,091,612$
General bonded debt ratios Per capita $ 3.35$ 7.49$
Per FTSE 218 479
As a percentage of taxable assessed value 0.01% 0.01%
Total outstanding debt ratios Per capita $ 3.35$ 7.49$
Per FTSE 218 479
As a percentage of taxable assessed value 0.01% 0.01%
Notes:Ratios calculated using population and TAV from each year.Debt per student calculated using full-time-equivalent enrollment.(a) While the District had funds restricted for debt service in the amount of $23,521 as of August 31, 2015, there was no bonded debt outstanding at that date as all bonds payable were completely paid off in February 2015. As a result, the calculations presented in the table are not relevant for August 31, 2015.
TARRANT COUNTY COLLEGE DISTRICTSTATISTICAL SUPPLEMENT 9
RATIOS OF OUTSTANDING DEBTLAST TEN FISCAL YEARS
(UNAUDITED)
74

2012 2011 2010 2009 2008 2007 2006
23,324,225$ 30,588,040$ 37,444,583$ 43,834,151$ 51,097,358$ 57,077,547$ 62,652,263$
(2,559,199) (3,260,900) (4,073,884) (4,431,372) (4,795,411) (4,171,254) (4,362,986)
20,765,026 27,327,140 33,370,699 39,402,779 46,301,947 52,906,293 58,289,277
20,765,026$ 27,327,140$ 33,370,699$ 39,402,779$ 46,301,947$ 52,906,293$ 58,289,277$
11.34$ 15.03$ 18.24$ 21.80$ 26.01$ 30.32$ 34.88$
715 962 1,307 1,740 2,138 2,618 2,842
0.02% 0.02% 0.03% 0.03% 0.04% 0.05% 0.06%
11.34$ 15.03$ 18.24$ 21.80$ 26.01$ 30.32$ 34.88$
715 962 1,307 1,740 2,138 2,618 2,842
0.02% 0.02% 0.03% 0.03% 0.04% 0.05% 0.06%
75

2015 (a) 2014 2013 2012
Taxable Assessed Value 136,312,562,282$ 127,454,200,572$ 125,092,633,012$ 123,490,855,713$
General Obligation Bonds
Statutory Tax Levy Limit for Debt Service 681,562,811$ 637,271,003$ 625,463,165$ 617,454,279$
Less Funds Restricted for Repayment
of General Obligation Bonds (1,656,309) (1,784,207) (2,559,199)
Total Net General Obligation Debt 681,562,811 635,614,694 623,678,958 614,895,080
Current Year Debt Service Requirements 8,129,263 8,124,425 8,166,281 8,389,325
Excess of Statutory Limit for Debt Service
over Current Requirements 673,433,548$ 627,490,269$ 615,512,677$ 606,505,755$
Net Current Requirements as a % of
Statutory Limit 1.19% 1.01% 1.02% 0.94%
Note:Texas Education Code Section 130.122 limits the debt service tax levy of community colleges to $0.50 per hundred dollarstaxable assessed valuation.(a) While the District had funds restricted for debt service in the amount of $23,521 as of August 31, 2015, there was no bonded debt outstanding at that date as all bonds payable were completely paid off in February 2015. As a result, the calculations presented in the table are not relevant for August 31, 2015.
TARRANT COUNTY COLLEGE DISTRICTSTATISTICAL SUPPLEMENT 10
LEGAL DEBT MARGIN INFORMATIONLAST TEN FISCAL YEARS
(UNAUDITED)
76

2011 2010 2009 2008 2007 2006
122,011,215,326$ 127,707,265,683$ 124,619,407,359$ 114,903,122,547$ 105,768,320,090$ 94,937,915,281$
610,056,077$ 638,536,328$ 623,097,037$ 574,515,613$ 528,841,600$ 474,689,576$
(3,260,900) (4,073,884) (4,431,372) (4,795,411) (4,171,254) (4,362,986)
606,795,177 634,462,444 618,665,665 569,720,202 524,670,346 470,326,590
8,372,725 8,260,344 9,626,181 8,539,225 8,412,368 8,421,042
598,422,452$ 626,202,100$ 609,039,484$ 561,180,977$ 516,257,978$ 461,905,548$
0.84% 0.66% 0.83% 0.65% 0.80% 0.85%
77

Currently the District has no outstanding or pledged revenue bonds
TARRANT COUNTY COLLEGE DISTRICTSTATISTICAL SUPPLEMENT 11
PLEDGED REVENUE COVERAGELAST TEN FISCAL YEARS
(UNAUDITED)
78

District District DistrictCalendar District Personal Personal Income Unemployment
Year Population Income Per Capita Rate
2015 1,945,360 84,905,643,000$ 43,645$ 4.00%
2014 1,911,541 80,929,107,000 42,337 5.50%
2013 1,880,153 75,776,982,000 40,304 5.90%
2012 1,831,230 70,095,625,000 38,278 6.90%
2011 1,817,840 70,485,542,000 38,774 8.40%
2010 1,829,400 68,105,714,000 37,228 8.40%
2009 1,807,750 65,870,354,000 36,438 8.20%
2008 1,780,150 61,138,590,000 34,345 5.00%
2007 1,745,050 58,844,636,480 33,721 4.00%
2006 1,671,295 55,513,808,000 33,216 5.00%
Sources:Population from US Bureau of the CensusPersonal Income from US bureau of Economic AnalysisUnemployment rate from Texas Workforce Commission
TARRANT COUNTY COLLEGE DISTRICT
(UNAUDITED)
STATISTICAL SUPPLEMENT 12DEMOGRAPHIC AND ECONOMIC STATISTICS - TAXING DISTRICT
LAST TEN FISCAL YEARS
79

Employer
Number of
Employees
Percentage of
Total Employment
Number of
Employees
Percentage of
Total Employment
Number of
Employees
Percentage of
Total Employment
AMR/American Airlines 24,000 2.40% 22,169 2.34% 22,169 2.38%
Lockheed Martin 13,690 1.37% 14,988 1.58% 14,988 1.61%
Fort Worth ISD 12,000 1.20% 11,000 1.16% 11,000 1.18%
Texas Health Resources 12,000 1.20% 18,866 1.99% 18,866 2.03%
NAS-Fort Worth-Joint Reserve Base 11,000 1.10% 11,350 1.20% 11,350 1.22%
Arlington ISD 8,126 0.81% 8,126 0.86% 8,126 0.87%
City of Fort Worth 6,161 0.62% 6,195 0.65% 6,195 0.67%
JPS Health Network 6,000 0.60% 4,872 0.51% 4,872 0.52%
Alcon Laboratories Inc. 5,922 0.59%
Cook Children's Health Care System 5,876 0.59% 4,826 0.51% 4,826 0.52%
University of Texas at Arlington 6,239 0.66% 6,239 0.67%
Burlington Northern
Harris Methodist Fort Worth
Bell Helicopter Textron Plant
City of Arlington
Fidelity Investments
American Airlines/ HQ
Cowboys Stadium
Odyssey One Source Inc
RadioShack Corp
Tarrant County Administrative Office
Harris Methodist Southwest
104,775 10.48% 108,631 11.46% 108,631 11.67%
Source 2013 and forward:Fort Worth Chamber Economic Development for Major EmployersBureau of Labor Statistics for Total Employment
Prior Source Now Unavailable:North Central Texas Council of Governments
LAST TEN FISCAL YEARS(UNAUDITED)
201320142015
TARRANT COUNTY COLLEGE DISTRICTSTATISTICAL SUPPLEMENT 13
PRINCIPAL EMPLOYERS
80

Number of
Employees
Percentage of
Total Employment
Number of
Employees
Percentage of
Total Employment
Number of
Employees
Percentage of Total
Employment
Number of
Employees
Percentage of Total
Employment
11,709 1.11% 11,709 0.72% 11,709 0.72% 11,842 0.73%
10,500 0.99% 13,500 0.83% 13,500 0.83% 13,500 0.83%
11,350 1.07% 11,350 0.70% 11,350 0.70% 5,361 0.33%
4,600 0.43% 4,302 0.26% 4,302 0.26% 4,302 0.26%
3,500 0.33% 3,300 0.20% 3,300 0.20%
5,300 0.33% 5,300 0.33% 4,987 0.31%
4,900 0.46%
4,100 0.39% 3,968 0.24% 3,968 0.24% 3,968 0.24%
3,820 0.36% 3,820 0.24% 3,820 0.24% 3,820 0.24%
3,500 0.33%
3,200 0.30% 3,200 0.20% 3,200 0.20%
6,500 0.40% 6,500 0.40% 6,500 0.40%
3,500 0.22%
3,273 0.20%
61,179 5.77% 66,949 4.12% 66,949 4.12% 61,053 3.76%
2012 2011 2010 2009
81

Employer
Number of
Employees
Percentage of Total
Employment
Number of
Employees
Percentage of Total
Employment
Number of
Employees
Percentage of Total
Employment
AMR/American Airlines 11,842 0.73% 12,000 0.74% 5,011 0.31%
Lockheed Martin 13,500 0.83% 16,000 0.99% 16,800 1.03%
Fort Worth ISD
Texas Health Resources
NAS-Fort Worth-Joint Reserve Base 5,361 0.33% 5,361 0.33% 3,906 0.24%
Arlington ISD
City of Fort Worth
JPS Health Network 3,811 0.23% 3,811 0.23% 3,473 0.21%
Alcon Laboratories Inc.
Cook Children's Health Care System 3,900 0.24% 3,900 0.24% 3,740 0.23%
University of Texas at Arlington 3,337 0.21% 3,337 0.21% 5,079 0.31%
Burlington Northern
Harris Methodist Fort Worth 3,500 0.22% 3,500 0.22% 4,000 0.25%
Bell Helicopter Textron Plant 3,820 0.24% 3,478 0.21%
City of Arlington
Fidelity Investments
American Airlines/ HQ 4,118 0.25% 4,118 0.25% 4,118 0.25%
Cowboys Stadium
Odyssey One Source Inc
RadioShack Corp 3,337 0.21% 3,337 0.21%
Tarrant County Administrative Office 4,141 0.26%
Harris Methodist Southwest 3,789 0.23%
56,526 3.48% 58,842 3.62% 54,057 3.33%
2007 20062008
82

®
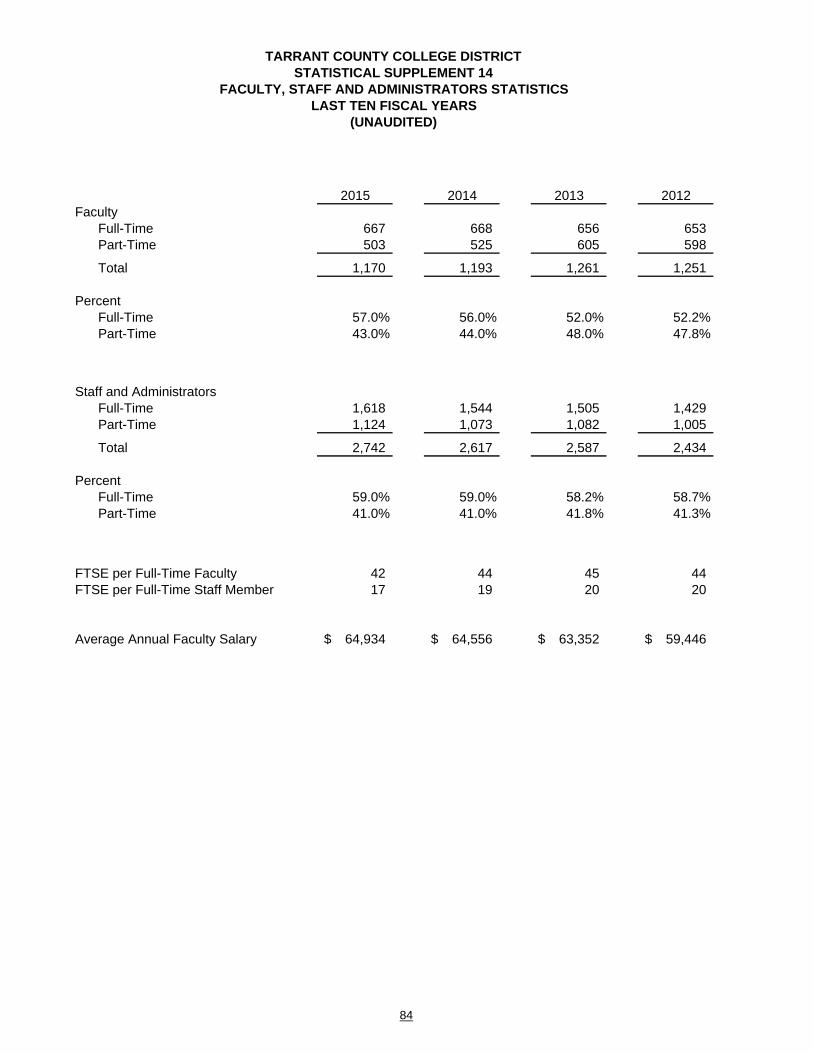
2015 2014 2013 2012Faculty
Full-Time 667 668 656 653 Part-Time 503 525 605 598
Total 1,170 1,193 1,261 1,251
PercentFull-Time 57.0% 56.0% 52.0% 52.2%Part-Time 43.0% 44.0% 48.0% 47.8%
Staff and AdministratorsFull-Time 1,618 1,544 1,505 1,429 Part-Time 1,124 1,073 1,082 1,005
Total 2,742 2,617 2,587 2,434
PercentFull-Time 59.0% 59.0% 58.2% 58.7%Part-Time 41.0% 41.0% 41.8% 41.3%
FTSE per Full-Time Faculty 42 44 45 44 FTSE per Full-Time Staff Member 17 19 20 20
Average Annual Faculty Salary 64,934$ 64,556$ 63,352$ 59,446$
Note:(a) Survey format and methodology were changed FY 2003
TARRANT COUNTY COLLEGE DISTRICTSTATISTICAL SUPPLEMENT 14
FACULTY, STAFF AND ADMINISTRATORS STATISTICSLAST TEN FISCAL YEARS
(UNAUDITED)
84

2011 2010 2009 2008 2007 2006
673 664 602 576 545 522 501 473 490 431 476 437
1,174 1,137 1,092 1,007 1,021 959
57.3% 58.4% 55.1% 57.2% 53.4% 54.4%42.7% 41.6% 44.9% 42.8% 46.6% 45.6%
1,398 1,338 1,174 1,070 1,062 1,072 971 956 804 1,058 1,114 1,039
2,369 2,294 1,978 2,128 2,176 2,111
59.0% 58.3% 59.4% 50.3% 48.8% 50.8%41.0% 41.7% 40.6% 49.7% 51.2% 49.2%
42 38 38 38 37 39 20 19 19 20 19 19
59,496$ 60,110$ 58,209$ 55,981$ 55,515$ 54,122$
85

Student Classification Number Percent Number Percent Number Percent
00-30 hours 35,341 61% 37,196 61% 29,411 52%31-60 hours 16,083 28% 17,263 28% 19,333 34%Unclassified 2,100 4% 2,324 4% 2,914 5%Associates 2,933 5% 2,797 5% 3,785 7%Bachelors 1,146 2% 1,287 2% 986 2%
Total 57,603 100% 60,867 100% 56,429 100%
Semester Hour Load
0-11 semester hours 39,919 69% 40,172 66% 37,243 66%12 & over 17,684 31% 20,695 34% 19,186 34% Total 57,603 100% 60,867 100% 56,429 100%
Average course load 8.3 8.6 8.7
Tuition StatusTexas resident (in-district) 49,655 86% 52,861 87% 48,807 86%Texas resident (out-of-district) 4,044 7% 4,293 7% 4,368 8%Non-resident tuition 3,904 7% 3,713 6% 3,254 6% Total 57,603 100% 60,867 100% 56,429 100%
Source: CBM001
Fall 2013Fall 2014
TARRANT COUNTY COLLEGE DISTRICTSTATISTICAL SUPPLEMENT 15
ENROLLMENT DETAILSLAST TEN FISCAL YEARS
(UNAUDITED)
Fall 2012
86

Number Percent Number Percent Number Percent Number Percent Number Percent
36,012 63% 37,994 65% 34,988 67% 30,545 67% 28,825 67%15,504 27% 15,133 26% 13,021 25% 10,970 24% 10,112 24%1,999 4% 1,671 3% 1,509 3% 1,324 3% 1,161 3%2,072 4% 2,059 4% 1,783 3% 1,588 4% 1,533 4%1,219 2% 1,194 2% 1,048 2% 898 2% 787 2%
56,806 100% 58,051 100% 52,349 100% 45,325 100% 42,418 100%
36,924 65% 37,153 64% 33,503 64% 29,914 66% 27,784 66%19,882 35% 20,898 36% 18,846 36% 15,411 34% 14,634 34%56,806 100% 58,051 100% 52,349 100% 45,325 100% 42,418 100%
8.7 8.7 8.6 8.6 8.6
49,856 88% 50,870 88% 45,937 88% 40,104 89% 37,301 88%4,106 7% 4,267 7% 4,002 8% 3,219 7% 3,463 8%2,844 5% 2,914 5% 2,410 4% 2,002 4% 1,654 4%
56,806 100% 58,051 100% 52,349 100% 45,325 100% 42,418 100%
Fall 2010Fall 2011 Fall 2008Fall 2009 Fall 2007
87

Student Classification Number Percent Number Percent
00-30 hours 25,447 66% 25,784 67%31-60 hours 9,731 25% 9,536 25%Unclassified 1,088 3% 965 2%Associates 1,407 4% 1,485 4%Bachelors 778 2% 818 2%
Total 38,451 100% 38,588 100%
Semester Hour Load
0-11 semester hours 24,993 65% 24,696 64%12 & over 13,458 35% 13,892 36% Total 38,451 100% 38,588 100%
Average course load 8.7 8.7
Tuition StatusTexas resident (in-district) 33,971 89% 34,242 89%Texas resident (out-of-district) 3,239 8% 3,171 8%Non-resident tuition 1,241 3% 1,175 3% Total 38,451 100% 38,588 100%
Fall 2005Fall 2006
88

®
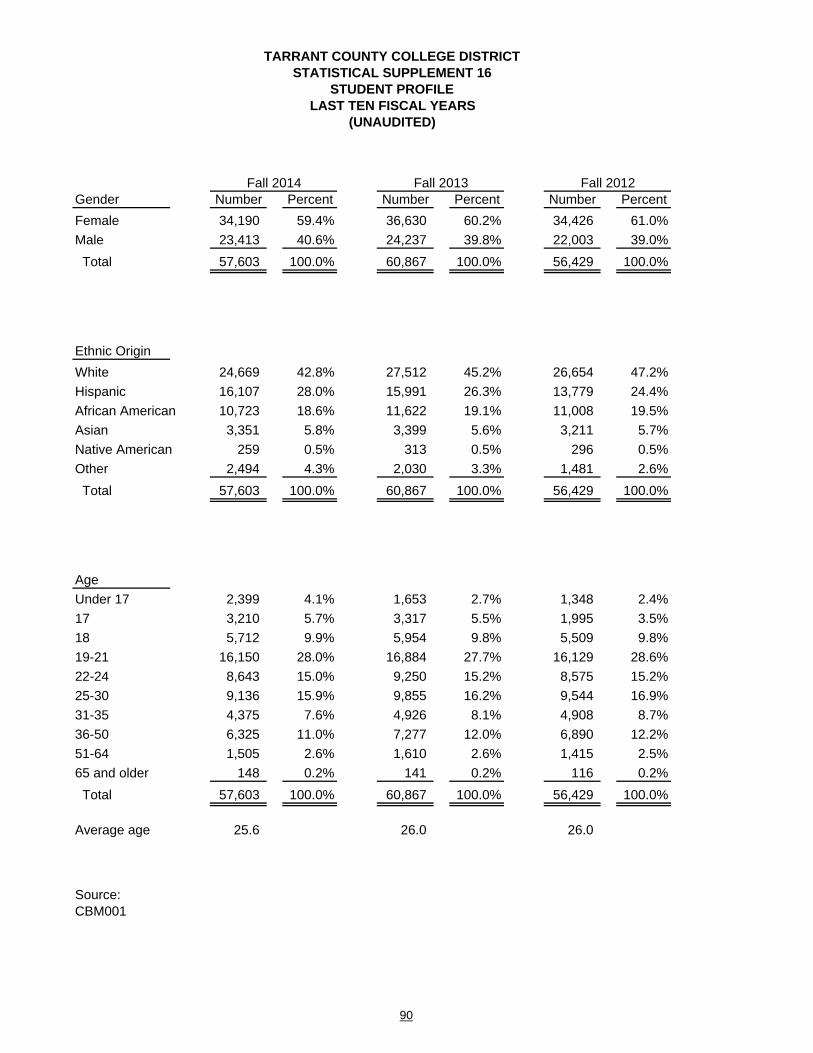
Gender Number Percent Number Percent Number Percent
Female 34,190 59.4% 36,630 60.2% 34,426 61.0%
Male 23,413 40.6% 24,237 39.8% 22,003 39.0%
Total 57,603 100.0% 60,867 100.0% 56,429 100.0%
Ethnic Origin
White 24,669 42.8% 27,512 45.2% 26,654 47.2%
Hispanic 16,107 28.0% 15,991 26.3% 13,779 24.4%
African American 10,723 18.6% 11,622 19.1% 11,008 19.5%
Asian 3,351 5.8% 3,399 5.6% 3,211 5.7%
Native American 259 0.5% 313 0.5% 296 0.5%
Other 2,494 4.3% 2,030 3.3% 1,481 2.6%
Total 57,603 100.0% 60,867 100.0% 56,429 100.0%
Age
Under 17 2,399 4.1% 1,653 2.7% 1,348 2.4%
17 3,210 5.7% 3,317 5.5% 1,995 3.5%
18 5,712 9.9% 5,954 9.8% 5,509 9.8%
19-21 16,150 28.0% 16,884 27.7% 16,129 28.6%
22-24 8,643 15.0% 9,250 15.2% 8,575 15.2%
25-30 9,136 15.9% 9,855 16.2% 9,544 16.9%
31-35 4,375 7.6% 4,926 8.1% 4,908 8.7%
36-50 6,325 11.0% 7,277 12.0% 6,890 12.2%
51-64 1,505 2.6% 1,610 2.6% 1,415 2.5%
65 and older 148 0.2% 141 0.2% 116 0.2%
Total 57,603 100.0% 60,867 100.0% 56,429 100.0%
Average age 25.6 26.0 26.0
Source:CBM001
Fall 2012Fall 2013Fall 2014
LAST TEN FISCAL YEARS(UNAUDITED)
TARRANT COUNTY COLLEGE DISTRICTSTATISTICAL SUPPLEMENT 16
STUDENT PROFILE
90

Number Percent Number Percent Number Percent Number Percent Number Percent
34,618 60.9% 34,864 60.1% 31,347 59.9% 27,371 60.4% 25,701 60.6%
22,188 39.1% 23,187 39.9% 21,002 40.1% 17,954 39.6% 16,717 39.4%
56,806 100.0% 58,051 100.0% 52,349 100.0% 45,325 100.0% 42,418 100.0%
28,408 50.0% 30,683 52.9% 29,333 56.0% 26,278 58.0% 25,308 59.6%
12,642 22.3% 12,064 20.8% 10,412 19.9% 8,421 18.6% 7,472 17.6%
10,946 19.3% 10,485 18.1% 8,647 16.5% 7,143 15.8% 6,429 15.2%
3,319 5.8% 3,462 6.0% 3,121 6.0% 2,768 6.1% 2,464 5.8%
312 0.5% 293 0.5% 253 0.5% 256 0.5% 192 0.5%
1,179 2.1% 1,064 1.8% 583 1.1% 459 1.0% 553 1.3%
56,806 100.0% 58,051 100.0% 52,349 100.0% 45,325 100.0% 42,418 100.0%
1,232 2.2% 1,093 1.9% 768 1.5% 468 1.0% 390 0.9%
2,048 3.6% 1,853 3.2% 2,047 3.9% 1,675 3.7% 1,609 3.8%
5,807 10.2% 5,858 10.1% 5,637 10.8% 5,146 11.4% 4,871 11.5%
16,204 28.4% 16,736 28.8% 15,610 29.8% 14,218 31.4% 13,326 31.4%
8,921 15.7% 9,340 16.1% 8,156 15.6% 7,136 15.7% 6,794 16.0%
9,714 17.1% 10,303 17.7% 8,737 16.7% 7,228 15.9% 6,611 15.6%
4,692 8.3% 4,668 8.0% 4,046 7.7% 3,306 7.3% 3,012 7.1%
6,744 11.9% 6,823 11.8% 6,095 11.6% 5,157 11.4% 4,941 11.6%
1,301 2.3% 1,277 2.2% 1,145 2.2% 906 2.0% 799 1.9%
143 0.3% 100 0.2% 108 0.2% 85 0.2% 65 0.2%
56,806 100.0% 58,051 100.0% 52,349 100.0% 45,325 100.0% 42,418 100.0%
25.8 25.6 25.6 25.3 25.3
Fall 2009Fall 2010 Fall 2008Fall 2011 Fall 2007
91
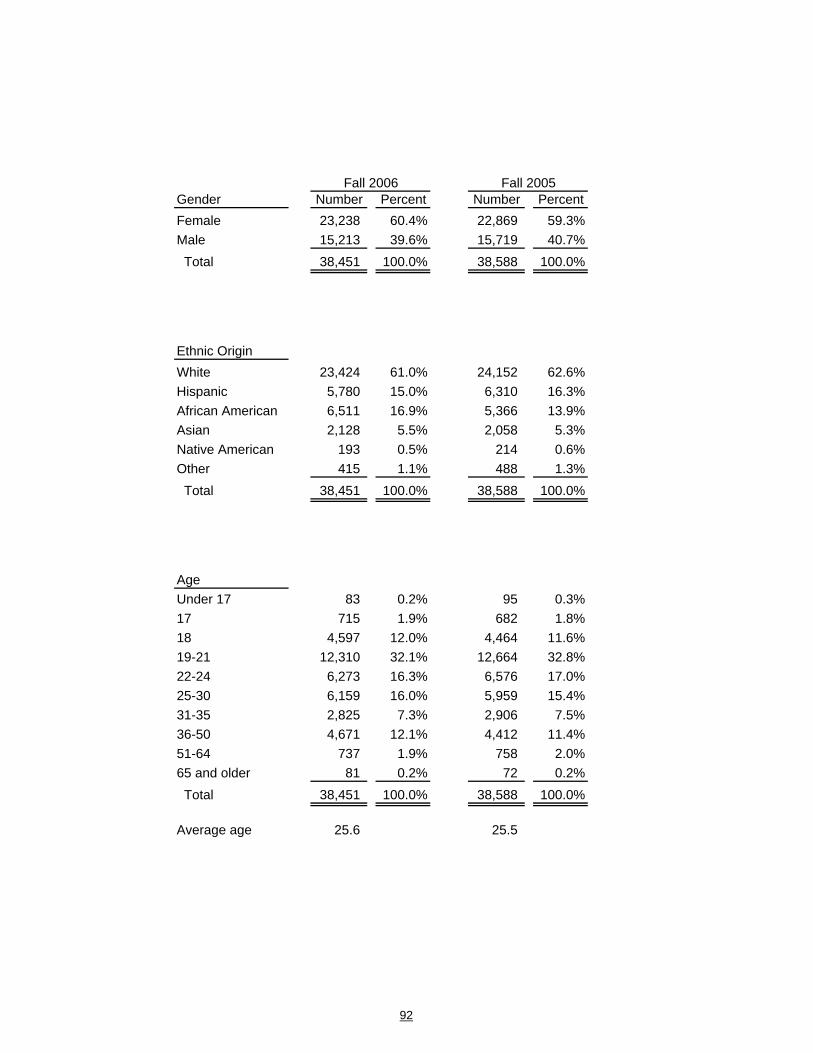
Gender Number Percent Number Percent
Female 23,238 60.4% 22,869 59.3%
Male 15,213 39.6% 15,719 40.7%
Total 38,451 100.0% 38,588 100.0%
Ethnic Origin
White 23,424 61.0% 24,152 62.6%
Hispanic 5,780 15.0% 6,310 16.3%
African American 6,511 16.9% 5,366 13.9%
Asian 2,128 5.5% 2,058 5.3%
Native American 193 0.5% 214 0.6%
Other 415 1.1% 488 1.3%
Total 38,451 100.0% 38,588 100.0%
Age
Under 17 83 0.2% 95 0.3%
17 715 1.9% 682 1.8%
18 4,597 12.0% 4,464 11.6%
19-21 12,310 32.1% 12,664 32.8%
22-24 6,273 16.3% 6,576 17.0%
25-30 6,159 16.0% 5,959 15.4%
31-35 2,825 7.3% 2,906 7.5%
36-50 4,671 12.1% 4,412 11.4%
51-64 737 1.9% 758 2.0%
65 and older 81 0.2% 72 0.2%
Total 38,451 100.0% 38,588 100.0%
Average age 25.6 25.5
Fall 2006 Fall 2005
92

Transfer Transfer Transfer Total of % of Student Student Student all all Count Count Count Transfer Transfer
Academic Technical Tech-Prep Students StudentsUniversities:
Angelo State University 57 4 - 61 0.39%Lamar University 24 5 - 29 0.18%Midwestern State University 175 42 - 217 1.38%Prairie View A&M University 51 8 - 59 0.37%Sam Houston State University 115 28 3 146 0.93%Stephen F. Austin State University 206 23 - 229 1.46%Sul Ross State University 3 - - 3 0.02%Sul Ross State University - Rio Grande - 3 - 3 0.02%Tarleton State University 940 250 14 1,204 7.65%Texas A&M University 798 47 - 845 5.37%Texas A&M University - Central Texas 1 - - 1 0.01%Texas A&M University - Commerce 70 20 2 92 0.58%Texas A&M University - Corpus Christi 57 10 - 67 0.43%Texas A&M University - Kingsville 11 3 1 15 0.09%Texas A&M University - Texarkana 11 5 - 16 0.10%Texas A&M University at Galveston 33 1 - 34 0.22%Texas A&M University - San Antonio - 3 - 3 0.02%Texas Southern University 33 3 - 36 0.23%Texas State University - San Marcos 374 34 - 408 2.59%Texas Tech University 805 89 3 897 5.70%Texas Woman's University 807 212 18 1,037 6.59%The University of Texas at Arlington 5,359 1,127 64 6,550 41.64%The University of Texas at Austin 490 19 - 509 3.24%The University of Texas at Brownsville 8 4 - 12 0.08%The University of Texas at Dallas 233 41 3 277 1.76%The University of Texas at El Paso 9 3 - 12 0.08%The University of Texas - Pan American 5 1 - 6 0.04%The University of Texas at San Antonio 38 2 2 42 0.27%The University of Texas at Tyler 43 12 - 55 0.35%The University of Texas of the Permian Basin 50 12 1 63 0.40%University of Houston 83 12 2 97 0.62%University of Houston - Downtown 6 2 3 11 0.07%University of Houston - Clear Lake 4 - - 4 0.02%University of Houston - Victoria 7 5 - 12 0.08%University of North Texas 2,157 351 27 2,535 16.11%University of North Texas at Dallas 63 18 1 82 0.52%West Texas A&M University 49 12 - 61 0.39%
Total 13,175 2,411 144 15,730 100.00%
Source: http://www.txhighereddata.org/reports/performance/ctcasalf/ctcaddl/
(UNAUDITED)
TARRANT COUNTY COLLEGE DISTRICTSTATISTICAL SUPPLEMENT 17
TRANSFER TO SENIOR INSTITUTIONS2013-2014 GRADUATES, COMPLETERS AND NON-RETURNERS
93

2015 2014 2013 2012
Academic Buildings 86 84 82 81
Square footage 2,387,613 2,267,293 2,191,020 2,172,664
Libraries 5 5 5 5
Square footage 124,630 124,630 127,000 124,630
Number of Volumes 282,822 274,597 282,245 278,276
15 15 15 14
Square footage 252,270 192,115 97,607 79,000
Dining Facilities 10 8 6 6
Square footage 95,327 89,146 80,109 80,109
Average daily customers 1,707 2,138 2,402 2,200
Athletic Facilities 13 13 13 13
Square footage 172,000 172,000 172,000 172,000
Gymnasiums 4 4 4 4
Fitness Centers 5 5 5 5
Tennis Courts 3 3 3 3
Plant facilities 14 14 12 12
Square footage 104,725 104,725 100,205 97,100
Transportation
Cars 24 24 25 65
Light Trucks/Vans 179 174 166 127
Fire Trucks 3 2
Administrative and support support buildings
TARRANT COUNTY COLLEGE DISTRICTSTATISTICAL SUPPLEMENT 18CAPITAL ASSET INFORMATION
LAST TEN FISCAL YEARS(UNAUDITED)
94

2011 2010 2009 2008 2007 2006
79 60 52 41 40 42
2,167,963 2,030,332 2,021,500 1,625,000 1,611,000 1,611,000
5 5 5 4 4 4
127,000 127,000 127,000 113,000 113,000 113,000
266,019 253,989 237,318 212,591 249,630 255,062
13 11 10 8 8 8
77,400 70,500 69,000 66,000 66,000 66,000
6 5 5 4 4 4
80,109 79,000 79,000 61,000 61,000 61,000
2,345 2,230 1,308 1,380 1,208 1,075
13 13 13 12 12 12
172,000 172,000 172,000 166,000 166,000 166,000
4 4 4 4 4 4
5 5 5 4 4 4
3 3 3 2 2 4
12 11 11 10 10 11
97,100 91,000 91,000 56,000 56,000 56,000
52 44 44 41 41 22
112 127 130 128 120 128
95

®

FEDERAL SINGLE AUDIT SECTION
FED
ER
AL
SIN
GLE
AU
DIT
SEC
TIO
N

1 of 3
Pass Pass ThroughFederal Through DisbursementsCFDA Grantor's and
Number Number Expenditures
DEPARTMENT OF EDUCATION
Federal Direct Programs:
Student Financial Assistance Cluster
Federal Supplemental Educational Opportunity Grant 84.007 809,100$
Federal Work Study Program 84.033 758,845
Federal Pell Grant Program 84.063 64,371,780
Federal Direct Student Loans 84.268 33,022,850
Higher Education Institutional Aid 84.031A 371,814
TRIO Cluster
TRIO Student Support Services 84.042A 283,533
TRIO Upward Bound 84.047A 684,973
Total Direct from Department of Education 100,302,895
Pass-Through from:
Fort Worth Independent School District
Adult Education - Basic Grants to States 84.002 0514AEL000 234,164
Texas A&M University
Adult Education - Basic Grants to States 84.002 02-S150202 42,038
Texas Workforce Commission
Adult Education - Basic Grants to States 84.002 BTAEL-03-CD 368
Texas Higher Education Coordinating Board
Career and Technical Education - Basic Grants to States 84.048 154260 1,554,829
MDRC Developmental Education Acceleration Project 84.372 R372A090010 18,880
Total Texas Higher Education Coordinating Board 1,573,709
Total Department of Education 102,153,174
DEPARTMENT OF AGRICULTURE
Pass-Through From:
Texas Workforce Commission
State Administrative Matching Grants for the Supplemental
Apprenticeship 10.561 0515ATP000 25,600
DEPARTMENT OF HOUSING AND URBAN DEVELOPMENT
Pass-Through from:
Water from the Rock
Community Development Block Grants/Entitlement Grants 14.218 18,170
TARRANT COUNTY COLLEGE DISTRICTSCHEDULE E
SCHEDULE OF EXPENDITURES OF FEDERAL AWARDSYEAR ENDED AUGUST 31, 2015
Federal Grantor/Pass-Through Grantor/
Program Title
97

2 of 3
Pass Pass ThroughFederal Through DisbursementsCFDA Grantor's and
Number Number Expenditures
DEPARTMENT OF JUSTICEPass-Through from:
Bureau of Justice AssistanceBulletproof Vest 16.607 6,753
DEPARTMENT OF LABORPass-Through from:
Texas Workforce CommissionEmployment Service / Wagner-Peyser Funded Activities 17.207 43,203 Apprenticeship -WIA Dislocated Workers 17.278 0515ATP000 100,422 Total Texas Workforce Commission 143,625
Texas Higher Education Coordinating BoardWorker Train National Emergency Grant 17.277 EM-24470-13-60-A-48 53,614
Total Department of Labor 197,239
NATIONAL ENDOWMENT FOR THE HUMANITIES
Pass-Through From:
Gilder Lehrman Institute of American History
Civil War 150 45.164 GI-50416-12 18
Created Equal 45.164 GI-50416-12 60
Changing America 45.164 GI-50416-12 1,161
Dust, Drought and Dreams 45.164 GI-50416-12 287
Total National Endowment For The Humanities 1,526
NATIONAL SCIENCE FOUNDATION
Pass-Through from:
University of Texas at Arlington
Opportunity Enhancing Diversity in GeoSciences 47.050 NSF10-599 2,487
University of Texas at El Paso
LSAMP: A Model Senior Alliance 47.076 26-1008-4125 18,811
Texas A&M Engineering Experiment Station
Pathways for Industrial Automation Careers 47.076 DUE-1304843 15,081
South Texas Aviation Maintenance Tech Ed Project 47.076 DUE-1205021 25,143
Total National Science Foundation 61,522
TARRANT COUNTY COLLEGE DISTRICTSCHEDULE E
SCHEDULE OF EXPENDITURES OF FEDERAL AWARDSYEAR ENDED AUGUST 31, 2015
Federal Grantor/Pass-Through Grantor/
Program Title
98

3 of 3
Pass Pass ThroughFederal Through DisbursementsCFDA Grantor's and
Number Number Expenditures
SMALL BUSINESS ADMINISTRATION
Pass-Through from:
North Texas Small Business Development Center
Small Business Development Centers 59.037 SBAHQ-12-B-0051 50,065
Small Business Development Centers 59.037 SBAHQ-12-B-0051 267,624
Small Business Job Act Program 59.037 1-603001-0152 18,000
Total Small Business Administration 335,689
DEPARTMENT OF HEALTH AND HUMAN SERVICES
Pass-Through from:
Substance Abuse and Mental Health Services Administration
Suicide Prevention Pilot 93.243 1U79SM060533-01 88,600
Fort Worth Independent School District
Temporary Assistance for Needy Families 93.558 0514AEL000 89,678
Texas Workforce Commission
Temporary Assistance for Needy Families - Apprenticeship 93.558 0515ATP000 36,044
Total Department of Health and Human Services 214,322
Total Federal Financial Assistance 103,013,995$
See Notes to Schedule on Following Page
Federal Grantor/Pass-Through Grantor/
Program Title
TARRANT COUNTY COLLEGE DISTRICTSCHEDULE E
SCHEDULE OF EXPENDITURES OF FEDERAL AWARDSYEAR ENDED AUGUST 31, 2015
99

TARRANT COUNTY COLLEGE DISTRICT NOTES TO SCHEDULE OF EXPENDITURES OF FEDERAL AWARDS
100
NOTE 1. FEDERAL ASSISTANCE RECONCILIATION Federal Revenues – per Schedule of Expenditures of Federal Awards: Federal Grants and Contracts – per Schedule A $ 3,685,838 Federal Grants and Contracts – per Schedule C 66,314,027 Direct Loans 33,022,850 Veterans’ Administration (8,720) Total Federal Revenues per Schedule of Expenditures of Federal Awards $ 103,013,995
NOTE 2. SIGNIFICANT ACCOUNTING POLICIES USED IN PREPARING THE SCHEDULE
The expenditures included in the schedule are reported for the District’s fiscal year. Expenditure reports to funding agencies are prepared on the award period basis. The expenditures reported above represent funds which have been expended by the District for the purposes of the award. The expenditures reported above may not have been reimbursed by the funding agencies as of the end of the fiscal year. Some amounts reported in the schedule may differ from amounts used in the preparation of the financial statements. Separate accounts are maintained for the different awards to aid in the observance of limitations and restrictions imposed by the funding agencies. Management believes they have followed all applicable guidelines issued by various entities in the preparation of the schedule.
NOTE 3. STUDENT LOANS PROCESSED AND ADMINISTRATIVE COSTS RECOVERED
Total Loans Admin Processed & Federal Grantor/ New Loans Cost Admin Cost CFDA Number/Program Name Processed Recovered Recovered U.S. Department of Education:
84.268 Direct Loans $ 33,022,850 $ - $ 33,022,850

101
INDEPENDENT AUDITOR’S REPORT ON INTERNAL CONTROL OVER
FINANCIAL REPORTING AND ON COMPLIANCE AND OTHER MATTERS BASED ON AN AUDIT OF FINANCIAL STATEMENTS PERFORMED IN ACCORDANCE WITH GOVERNMENT AUDITING STANDARDS
To the Board of Trustees Tarrant County College District We have audited, in accordance with the auditing standards generally accepted in the United States of America and the standards applicable to financial audits contained in Government Auditing Standards issued by the Comptroller General of the United States, the financial statements of Tarrant County College District (the District) as of and for the year ended August 31, 2015, and the related notes to the financial statements, and have issued our report thereon dated December 11, 2015. Internal Control over Financial Reporting In planning and performing our audit of the financial statements, we considered the District’s internal control over financial reporting (internal control) to determine the audit procedures that are appropriate in the circumstances for the purpose of expressing our opinion on the financial statements, but not for the purpose of expressing an opinion on the effectiveness of the District’s internal control. Accordingly, we do not express an opinion on the effectiveness of the District’s internal control. A deficiency in internal control exists when the design or operation of a control does not allow management or employees, in the normal course of performing their assigned functions, to prevent, or detect and correct, misstatements on a timely basis. A material weakness is a deficiency, or a combination of deficiencies, in internal control, such that there is a reasonable possibility that a material misstatement of the entity’s financial statements will not be prevented, or detected and corrected on a timely basis. A significant deficiency is a deficiency, or a combination of deficiencies, in internal control that is less severe than a material weakness, yet important enough to merit attention by those charged with governance. Our consideration of internal control over financial reporting was for the limited purpose described in the first paragraph of this section and was not designed to identify all deficiencies in internal control over financial reporting that might be material weaknesses or significant deficiencies. Given these limitations, during our audit we did not identify any deficiencies in internal control over financial reporting that we consider to be material weaknesses. However, material weaknesses may exist that have not been identified. Texas Public Funds Investment Act We have also performed tests designed to verify the District’s compliance with the requirements of the Texas Public Funds Investment Act. During the year ended August 31, 2015, no instances of noncompliance were found.

To the Board of Trustees Tarrant County College District
102
Compliance and Other Matters As part of obtaining reasonable assurance about whether the District’s financial statements are free from material misstatement, we performed tests of its compliance with certain provisions of laws, regulations, contracts, and grant agreements, noncompliance with which could have a direct and material effect on the determination of financial statement amounts. However, providing an opinion on compliance with those provisions was not an objective of our audit and, accordingly, we do not express such an opinion. The results of our tests disclosed no instances of noncompliance or other matters that are required to be reported under Government Auditing Standards. Purpose of this Report The purpose of this report is solely to describe the scope of our testing of internal control and compliance and the results of that testing, and not to provide an opinion on the effectiveness of the entity’s internal control or on compliance. This report is an integral part of an audit performed in accordance with Government Auditing Standards in considering the entity’s internal control and compliance. Accordingly, this communication is not suitable for any other purpose. WEAVER AND TIDWELL, L.L.P. Fort Worth, Texas December 11, 2015

AN INDEPENDENT MEMBER OF BAKER TILLY INTERNATIONAL
WEAVER AND TIDWELL, L.L.P. CERTIFIED PUBLIC ACCOUNTANTS AND ADVISORS
2821 WEST SEVENTH STREET, SUITE 700, FORT WORTH, TX 76107 P: 817.332.7905 F: 817.429.5936
103
INDEPENDENT AUDITOR’S REPORT ON COMPLIANCE FOR
EACH MAJOR PROGRAM AND ON INTERNAL CONTROL OVER COMPLIANCE REQUIRED BY OMB CIRCULAR A-133
To the Board of Trustees Tarrant County College District Report on Compliance for Each Major Federal Program We have audited the compliance of Tarrant Country College District (the District) with the types of compliance requirements described in the U.S. Office of Management and Budget (OMB) Compliance Supplement that could have a direct and material effect on each of the District’s major federal programs for the year ended August 31, 2015. The District’s major federal programs are identified in the summary of auditor’s results section of the accompanying federal schedule of findings and questioned costs. Management’s Responsibility Management is responsible for compliance with the requirements of laws, regulations, contracts, and grants applicable to its federal programs. Auditor’s Responsibility Our responsibility is to express an opinion on compliance for each of the District’s major federal programs based on our audit of the types of compliance requirements referred to above. We conducted our audit of compliance in accordance with auditing standards generally accepted in the United States of America; the standards applicable to financial audits contained in Government Auditing Standards, issued by the Comptroller General of the United States; and OMB Circular A-133, Audits of States, Local Governments, and Non-Profit Organizations. Those standards and OMB Circular A-133 require that we plan and perform the audit to obtain reasonable assurance about whether noncompliance with the types of compliance requirements referred to above that could have a direct and material effect on a major federal program occurred. An audit includes examining, on a test basis, evidence about the District’s compliance with those requirements and performing such other procedures as we considered necessary in the circumstances. We believe that our audit provides a reasonable basis for our opinion on compliance for each major federal program. However, our audit does not provide a legal determination of the District’s compliance. Opinion on Each Major Federal Program In our opinion, the District complied, in all material respects, with the types of compliance requirements referred to above that could have a direct and material effect on each of its major federal programs for the year ended August 31, 2015.

To the Board of Trustees Tarrant County College District
104
Other Matters The results of our auditing procedures disclosed instances of noncompliance with the compliance requirements referred to above that are required to be reported in accordance with OMB Circular A-133 and which are described in the accompanying federal schedule of findings and questioned costs as item 2015-001. Our opinion on each major federal program is not modified with respect to these matters. The District’s response to the noncompliance findings identified in our audit are described in the accompanying corrective action plan. The District’s response was not subjected to the auditing procedures applied in the audit of compliance and, accordingly, we express no opinion on the response. Report on Internal Control over Compliance Management of the District is responsible for establishing and maintaining effective internal control over compliance with the types of compliance requirements referred to above. In planning and performing our audit of compliance, we considered the District’s internal control over compliance with the types of requirements that could have a direct and material effect on each major federal program as a basis for designing auditing procedures that are appropriate in the circumstances for the purpose of expressing an opinion on compliance for each major federal program and to test and report on internal control over compliance in accordance with OMB Circular A-133, but not for the purpose of expressing an opinion on the effectiveness of internal control over compliance. Accordingly, we do not express an opinion on the effectiveness of the District’s internal control over compliance. A deficiency in internal control over compliance exists when the design or operation of a control over compliance does not allow management or employees, in the normal course of performing their assigned functions, to prevent, or detect and correct noncompliance with a type of compliance requirement of a federal program on a timely basis. A material weakness in internal control over compliance is a deficiency, or combination of deficiencies in internal control over compliance, such that there is a reasonable possibility that material noncompliance with a type of compliance requirement of a federal program will not be prevented, or detected and corrected on a timely basis. A significant deficiency in internal control over compliance is a deficiency, or a combination of deficiencies, in internal control over compliance with a type of compliance requirement of a federal program that is less severe than a material weakness in internal control over compliance, yet important enough to merit attention by those charged with governance. Our consideration of internal control over compliance was for the limited purpose described in the first paragraph of this section and was not designed to identify all deficiencies in internal control over compliance that might be material weaknesses or significant deficiencies, and therefore, material weaknesses or significant deficiencies may exist that were not identified. We did not identify any deficiencies in internal control over compliance that we consider to be material weaknesses. However, we identified certain deficiencies in internal control over compliance, as described in the accompanying federal schedule of findings and questioned costs as item 2015-001, that we consider to be significant deficiencies.
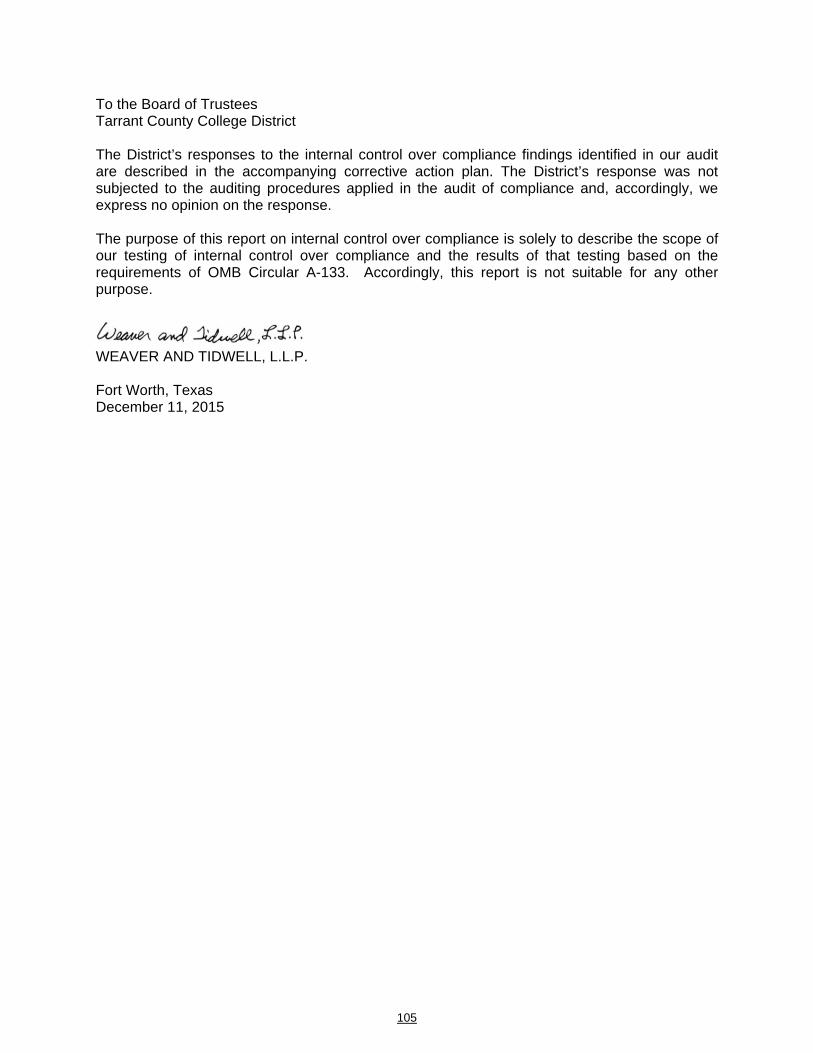
To the Board of Trustees Tarrant County College District
105
The District’s responses to the internal control over compliance findings identified in our audit are described in the accompanying corrective action plan. The District’s response was not subjected to the auditing procedures applied in the audit of compliance and, accordingly, we express no opinion on the response. The purpose of this report on internal control over compliance is solely to describe the scope of our testing of internal control over compliance and the results of that testing based on the requirements of OMB Circular A-133. Accordingly, this report is not suitable for any other purpose. WEAVER AND TIDWELL, L.L.P. Fort Worth, Texas December 11, 2015

106
TARRANT COUNTY COLLEGE DISTRICT FEDERAL SCHEDULE OF FINDINGS AND QUESTIONED COSTS
YEAR ENDED AUGUST 31, 2015 Section I. Summary of Auditor’s Results
Financial Statements The type of auditor’s report issued: Unmodified Internal Control over Financial reporting:
Material weakness(es) identified yes X no
Significant deficiencies identified that are not considered to be material weaknesses? yes X none reported
Noncompliance material to financial statements noted? yes X no
Federal Awards Internal control over major programs:
Material weakness(es) identified yes X no
Significant deficiencies identified that are not considered to be material weaknesses? X yes no
Type of auditor’s report issued on compliance for major programs: Unmodified Any audit findings disclosed that are required to be reported in accordance with section 510(a) of Circular A-133? X yes no Identification of major programs:
Student Financial Assistance Cluster Career and Technical Education - Basic Grants to States
Small Business Development Center Dollar threshold used to distinguish between type A and type B programs: $300,000 Auditee qualified as low-risk auditee? X yes no

107
TARRANT COUNTY COLLEGE DISTRICT FEDERAL SCHEDULE OF FINDINGS AND QUESTIONED COSTS
YEAR ENDED AUGUST 31, 2015 (CONTINUED)
Section II. Financial Statement Findings
There were no findings relating to internal control or compliance which are required to be reported in accordance with Government Auditing Standards.
Section III. Federal Award Findings and Questioned Costs
Finding: 2015-001
Federal program: CFDA 84.048 Career and Technical Education - Basic Grants to States
Federal agency: U.S. Department of Education Pass-Through Entity: Texas Higher Education Coordinating Board
Compliance Requirements: Activities Allowed or Unallowed; Allowable Costs and Cost Principles; Period of Availability of Federal Funds
Criteria: Program requirements state that grant activities and costs must be according to OMB Circular A-21 and the grant's Request for Application. Activities and costs must also be expended during the federal funding period (September 1, 2014 to August 31, 2015).
Condition: For the year ended August 31, 2015, we reviewed a sample of expenses charged to the grant and noted $9,313 in unallowable expenses and expenses incurred outside of the federal funding period. Projection of noncompliance noted in our sample resulted in likely questioned costs of $24,918 for the year ended August 31, 2015.
Questioned Costs: $24,918
Cause: During the grant’s year-end closing process, review of invoice descriptions and shipping dates was not sufficient to ensure that unallowable expenses were not charged to the grant.
Effect: As a result, the District charged expenses to the grant that are unallowable and outside the period of availability.
Recommendation: The District’s program staff and management should review invoices descriptions and shipping dates in sufficient detail during the year-end closing process to ensure that all expenses charged to the grant are allowable and incurred during the period of availability.

108
TARRANT COUNTY COLLEGE DISTRICT FEDERAL SCHEDULE OF FINDINGS AND QUESTIONED COSTS
YEAR ENDED AUGUST 31, 2015 (CONTINUED)
Section IV. Corrective Action Plan
Finding: 2015-001 Responsible official’s response and planned corrective actions: The District will
implement the controls and processes in place to ensure only allowable expenses are charged to grants. A review will be conducted no less than each quarter between the grant accountant and project manager. All equipment purchases will be rigorously reviewed to detect any items that are not in compliance with regulation.
Implementation Date: September 1, 2015 Responsible Person: Sheryl Harris, Perkins Basic Grant Project Director
Section V. Prior Year Audit Findings There were no prior year audit findings.

STATE SINGLE AUDIT SECTION
STA
TE S
ING
LE A
UD
IT S
ECTI
ON

Grant Contract Number Expenditures
TEXAS WORKFORCE COMMISSION
Apprenticeship 0515ATP000 180,975$
Skills Development Fund - GM 0513SDF000 232,109
Skills Development Fund - Manu Cons 0514SDF000 191,752
Skills Development Fund - Veteran & Industry 0514SDF001 186,469
Skills for Small Business 0515SSD000 7,200Total Direct from Texas Workforce Commission 798,505
Pass-Through From:
Fort Worth Independent School District
Adult Education and Literacy 41,365
Total Texas Workforce Commission 839,870
TEXAS COMPTROLLER OF PUBLIC ACCOUNTS
Law Enforcement Office Standards and Education 5,733
TEXAS DEPARTMENT OF STATE HEALTH SERVICES
Pass-Through From:
MHMR of Tarrant County
Healthy Community Collaborative E151767 18,342
TEXAS HIGHER EDUCATION COORDINATING BOARD
Work Study 251,580
Be On Time 9116697M 8,049
Toward Excellence, Access & Success Grant I 9117701M 244,587
Texas Educational Opportunity Grant 9122062M 3,379,369
Professional Nursing Shortage Over 70% Program FY2011 9105206M 18,445
Professional Nursing Shortage Over 70% Program FY2015 9000122M 270,856
Nursing and Allied Health 13058 399
Accelerated Developmental Education Pilot Project - ModMath 9120873M 328
Adult Basic Education Innovation Grants 9123413M 47,962
Top 10% Scholarship 9300032M 7,800
Texas-Science, Technology, Engineering and Math T-STEM 11276 65,188 Total Direct From Texas Higher Education Coordinating Board 4,294,563
Pass-Through From:Education Service Center Region 11
Academic Vertical Alignment Training and Renewal 2,232
Dallas County Community CollegeSmall Business Development Center SBAHQ-12-B-0051 66,980 Small Business Development Center 378
Total Texas Higher Education Coordinating Board 4,364,153
Total State Financial Assistance 5,228,098$
See Notes to Schedule on Following Page
Grant Agency / Program Title
TARRANT COUNTY COLLEGE DISTRICTSCHEDULE F
SCHEDULE OF EXPENDITURES OF STATE AWARDS YEAR ENDED AUGUST 31, 2015
109

110
TARRANT COUNTY COLLEGE DISTRICT
NOTES TO SCHEDULE OF EXPENDITURES OF STATE AWARDS NOTE 1. STATE ASSISTANCE RECONCILIATION State Revenues – per Schedule of Expenditures of State Awards: State Grants and Contracts – per Schedule A $ 5,228,098
Total State Revenues per Schedule of Expenditures of State Awards $ 5,228,098 NOTE 2. SIGNIFICANT ACCOUNTING POLICIES USED IN PREPARING THE SCHEDULE
The expenditures included in the schedule are reported for the District’s fiscal year. Expenditure reports to funding agencies are prepared on the award period basis. The expenditures reported above represent funds, which have been expended by the District for the purposes of the award. The expenditures reported above may not have been reimbursed by the funding agencies as of the end of the fiscal year. Separate accounts are maintained for the different awards to aid in the observance of limitations and restrictions imposed by the funding agencies. Management believes they have followed all applicable guidelines issued by various entities in the preparation of the schedule.

AN INDEPENDENT MEMBER OF BAKER TILLY INTERNATIONAL
WEAVER AND TIDWELL, L.L.P. CERTIFIED PUBLIC ACCOUNTANTS AND ADVISORS
2821 WEST SEVENTH STREET, SUITE 700, FORT WORTH, TX 76107 P: 817.332.7905 F: 817.429.5936
111
INDEPENDENT AUDITOR’S REPORT ON COMPLIANCE FOR EACH MAJOR PROGRAM AND ON INTERNAL CONTROL OVER COMPLIANCE REQUIRED BY UGMS SINGLE AUDIT CIRCULAR
To the Board of Trustees Tarrant County College District Report on Compliance for Each Major State Program We have audited the compliance of Tarrant Country College District (the District) with the types of compliance requirements described in the Texas Governor’s Office of Budget and Planning, Uniform Grant Management Standards (UGMS) which includes the State of Texas Single Audit Circular that could have a direct and material effect on each of the District’s major state programs for the year ended August 31, 2015. The District’s major state programs are identified in the summary of auditor’s results section of the accompanying state schedule of findings and questioned costs. Management’s Responsibility Management is responsible for compliance with the requirements of laws, regulations, contracts, and grants applicable to its state programs. Auditor’s Responsibility Our responsibility is to express an opinion on compliance for each of the District’s major state programs based on our audit of the types of compliance requirements referred to above. We conducted our audit of compliance in accordance with auditing standards generally accepted in the United States of America; the standards applicable to financial audits contained in Government Auditing Standards, issued by the Comptroller General of the United States; and UGMS State of Texas Single Audit Circular. Those standards and UGMS Single Audit Circular require that we plan and perform the audit to obtain reasonable assurance about whether noncompliance with the types of compliance requirements referred to above that could have a direct and material effect on a major state program occurred. An audit includes examining, on a test basis, evidence about the District’s compliance with those requirements and performing such other procedures as we considered necessary in the circumstances. We believe that our audit provides a reasonable basis for our opinion on compliance for each major state program. However, our audit does not provide a legal determination of the District’s compliance. Opinion on Each Major State Program In our opinion, the District complied, in all material respects, with the types of compliance requirements referred to above that could have a direct and material effect on each of its major state programs for the year ended August 31, 2015.

To the Board of Trustees Tarrant County College District
112
Report on Internal Control over Compliance Management of the District is responsible for establishing and maintaining effective internal control over compliance with the types of compliance requirements referred to above. In planning and performing our audit of compliance, we considered the District’s internal control over compliance with the types of requirements that could have a direct and material effect on each major state program as a basis for designing auditing procedures that are appropriate in the circumstances for the purpose of expressing an opinion on compliance for each major state program and to test and report on internal control over compliance in accordance with UGMS Single Audit Circular, but not for the purpose of expressing an opinion on the effectiveness of internal control over compliance. Accordingly, we do not express an opinion on the effectiveness of the District’s internal control over compliance. A deficiency in internal control over compliance exists when the design or operation of a control over compliance does not allow management or employees, in the normal course of performing their assigned functions, to prevent, or detect and correct noncompliance with a type of compliance requirement of a state program on a timely basis. A material weakness in internal control over compliance is a deficiency, or combination of deficiencies in internal control over compliance, such that there is a reasonable possibility that material noncompliance with a type of compliance requirement of a state program will not be prevented, or detected and corrected on a timely basis. A significant deficiency in internal control over compliance is a deficiency, or a combination of deficiencies, in internal control over compliance with a type of compliance requirement of a state program that is less severe than a material weakness in internal control over compliance, yet important enough to merit attention by those charged with governance. Our consideration of internal control over compliance was for the limited purpose described in the first paragraph of this section and was not designed to identify all deficiencies in internal control over compliance that might be material weaknesses or significant deficiencies. We did not identify any deficiencies in internal control over compliance that we consider to be material weaknesses. However, material weaknesses may exist that have not been identified. The purpose of this report on internal control over compliance is solely to describe the scope of our testing of internal control over compliance and the results of that testing based on the requirements of UGMS Single Audit Circular. Accordingly, this report is not suitable for any other purpose.
WEAVER AND TIDWELL, L.L.P. Fort Worth, Texas December 11, 2015
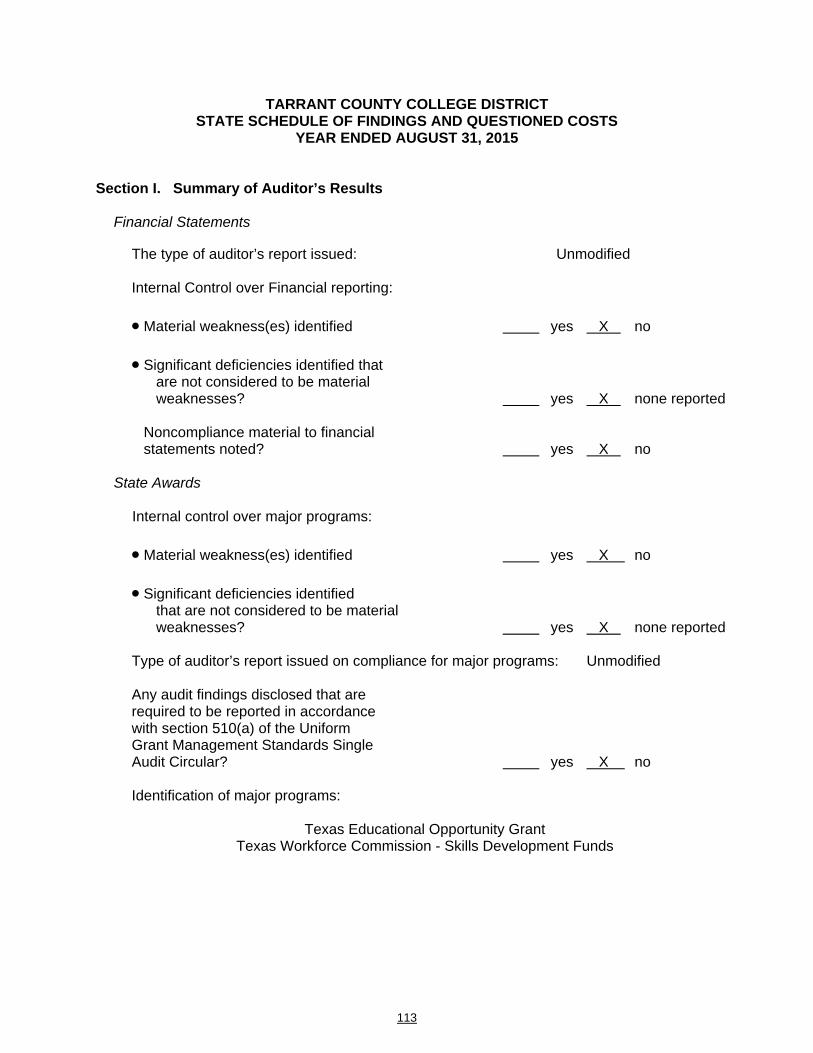
113
TARRANT COUNTY COLLEGE DISTRICT STATE SCHEDULE OF FINDINGS AND QUESTIONED COSTS
YEAR ENDED AUGUST 31, 2015 Section I. Summary of Auditor’s Results
Financial Statements The type of auditor’s report issued: Unmodified Internal Control over Financial reporting:
Material weakness(es) identified yes X no
Significant deficiencies identified that are not considered to be material weaknesses? yes X none reported
Noncompliance material to financial statements noted? yes X no
State Awards Internal control over major programs:
Material weakness(es) identified yes X no
Significant deficiencies identified that are not considered to be material weaknesses? yes X none reported
Type of auditor’s report issued on compliance for major programs: Unmodified Any audit findings disclosed that are required to be reported in accordance with section 510(a) of the Uniform Grant Management Standards Single Audit Circular? yes X no Identification of major programs:
Texas Educational Opportunity Grant Texas Workforce Commission - Skills Development Funds

114
TARRANT COUNTY COLLEGE DISTRICT STATE SCHEDULE OF FINDINGS AND QUESTIONED COSTS
YEAR ENDED AUGUST 31, 2015 (CONTINUED)
Dollar threshold used to distinguish between type A and type B programs: $300,000
Auditee qualified as low-risk auditee? X yes _ no
Section II. Financial Statement Findings
There were no findings relating to internal control or compliance which are required to be reported in accordance with Government Auditing Standards.
Section III. State Award Findings and Questioned Costs
There were no findings relating to internal control or compliance which are required to be reported in accordance with Government Auditing Standards.
Section IV. Corrective Action Plan The current year audit of state awards disclosed no findings that require a corrective action plan.
Section V. Prior Year Audit Findings
There were no prior year audit findings.

Equal Opportunity/Equal Access Institution
TARRANT COUNTY COLLEGE DISTRICTFINANCE DEPARTMENT1500 HOUSTON STREET
FORT WORTH, TEXAS 76102www.tccd.edu
FINANCE:18832:9/15:JD