Embed Size (px)
Citation preview

COMPREHENSIVE ANNUALFINANCIAL REPORT
FOR THE FISCAL YEAR ENDED JUNE 30, 2011
Prepared by the Finance Department
Cary, North Carolina
WAKE COUNTY BOARD OF EDUCATION
COMPREHENSIVE ANNUAL FINANCIAL REPORT
Year Ended June 30, 2011
TABLE OF CONTENTS
Page No. INTRODUCTORY SECTION Letter of Transmittal...................................................................................i
Certificates of Achievement ................................................................... viii Organizational Chart ................................................................................. x Board of Education and Leadership Team ............................................... xi FINANCIAL SECTION Independent Auditors’ Report .................................................................. 1 Management’s Discussion and Analysis .................................................. 3 Basic Financial Statements: Government-wide Financial Statements: Statement of Net Assets ....................................................... 10 Statement of Activities .......................................................... 11 Fund Financial Statements:
Balance Sheet – Governmental Funds ................................. 13 Statement of Revenues, Expenditures, and Changes in Fund Balance - Governmental Funds ........... 14 Reconciliation of the Governmental Funds Statement of Revenues, Expenditures and Changes in Fund Balance with the Government- Wide Statement of Activities ............................................ 16
Statement of Revenues, Expenditures, and Changes in Fund Balances - Budget and Actual – General Fund and Annually Budgeted Major Special Revenue Fund ..... 17 Statement of Net Assets – Enterprise Funds ........................ 19 Statement of Revenues, Expenses, and Changes in Fund Net Assets - Enterprise Funds ............................ 20 Statement of Cash Flows - Enterprise Funds ....................... 21 Notes to the Basic Financial Statements .................................... 22
Supplementary Information and Combining, Individual Fund Statements and Schedules: Combining Balance Sheet – Non-Major Governmental Funds ............................................................ 44 Combining Statement of Revenues, Expenditures, And Changes in Fund Balances – Non-Major Governmental Funds ............................................................ 45 Schedules of Revenues, Expenditures, and Changes In Fund Balances – Budget and Actual: General Fund ............................................................................. 46 State Public School Fund ........................................................... 49 Grants Funds ............................................................................. 51 Capital Projects Fund ................................................................. 55 Enterprise Funds ........................................................................ 57 Other Restricted Funds .............................................................. 59 Schedule of Revenues, Expenditures and Changes in Fund Balances – Individual School Funds .................................. 60
STATISTICAL SECTION Net Assets by Component ..................................................................... 65 Expenses, Program Revenues and Net (Expense)/Revenue ................. 66 General Revenues and Total Change in Net Assets .............................. 68
Fund Balances, Governmental Funds .................................................... 70 General Governmental Revenues by Source ......................................... 72 General Governmental Expenditures by Function .................................. 74 Other Financing Sources and Uses and Net Change In Fund Balances, Governmental Funds .................................... 76 Enterprise Fund Expenses..................................................................... 77 Enterprise Fund Revenues and Operating Transfers In by Source ............................................................................................. 78 Long-Term Debt .................................................................................... 80 Assessed Value of Taxable Property for Wake County ......................... 81 Property Tax Rates - All Overlapping Governments for Wake County ........................................................................................ 82 Ten Principal Taxpayers for Wake County ............................................ 84 Property Tax Levies and Collections for Wake County .......................... 85 Ratios of Outstanding Debt by Type for Wake County .......................... 86 Ratio of General Bonded Debt Outstanding for Wake County ............... 88 Direct and Overlapping Governmental Activities Debt for Wake County ................................................................ 89 Legal Debt Margin Information for Wake County ................................... 90 Demographic and Economic Statistics for Wake County ....................... 92 Principal Employers for Wake County ................................................... 93 Full Time Employees by Category ......................................................... 94 Operating Statistics ............................................................................... 95 Teacher Base Salaries .......................................................................... 96 Capital Asset Information ....................................................................... 97
SINGLE AUDIT SECTION Independent Auditor’s Report on Internal Control over Financial Reporting and on Compliance and Other Matters Based on an
Audit of Financial Statements Performed in Accordance with Government Auditing Standards ........................................................... 99
Independent Auditor’s Report on Compliance with Requirements Applicable to Each Major Federal Program and on Internal Control Over Compliance in Accordance with OMB Circular A-133 and the State Single Audit Implementation Act ........................ 101 Independent Auditor’s Report on Compliance with Requirements Applicable to Each Major State Program and on Internal Control Over Compliance in Accordance with Applicable Sections of OMB Circular A-133 and the State Single Audit
Implementation Act ............................................................................. 103 Schedule of Findings and Questioned Costs ....................................... 105 Corrective Action Plan ......................................................................... 108 Summary Schedule of Prior Year Audit Findings ................................. 109 Schedule of Expenditures of Federal and State Awards ...................... 110 Notes to Schedule of Expenditures of Federal and
State Awards ...................................................................................... 114

FINANCIAL REPORT
FOR THE FISCAL YEAR ENDED JUNE 30, 2011
Prepared by the Finance Department
Cary, North Carolina
Int
ro
du
ct
Ion
I n t r o d u c t I o n
i
October 26, 2011
To the Members of the Wake County Board of Education and the Citizens of Wake County, North Carolina: We are pleased to submit the comprehensive annual financial report of the Wake County Board of Education (Board) for the year ended June 30, 2011, as mandated by both local ordinances and state statutes. These ordinances and statutes require that the Board issue annually a report on its financial position and activity and that an independent firm of certified public accountants will audit this report. Responsibility for both the accuracy of the data and the completeness and fairness of the presentation, including all disclosures, rests with management. To the best of our knowledge and belief, the enclosed data are accurate in all material respects and reported in a manner that presents fairly the financial position and results of operations of the various funds of the Board. All disclosures necessary to enable the reader to gain an understanding of the Board’s activities have been included. The presentation of the comprehensive annual financial report is in four sections: introductory, financial, statistical, and single audit. The introductory section, which is unaudited, includes this letter of transmittal, an organizational chart, a list of the Board’s principal elected and appointed officials, and copies of the Certificates of Achievement for Excellence in Financial Reporting awarded by the Government Finance Officers Association (GFOA) and the Association of School Business Officials (ASBO) International. The financial section includes the management’s discussion and analysis, government-wide financial statements, fund financial statements and schedules, as well as the independent auditor’s report on these financial statements and schedules. The statistical section, which is unaudited, includes data on financial trends, revenue capacity, and debt capacity, as well as demographic and economic information and operating information. The management’s discussion and analysis contains further discussion of the financial statements and financial standing of the Board. This letter of transmittal complements and should be read in conjunction with the management’s discussion and analysis. The Board is required to undergo an annual single audit in conformity with the provisions of the Single Audit Act Amendments of 1996, the U. S. Office of Management and Budget’s Circular A-133, Audits of States, Local Governments, and Non-Profit Organizations, and the North Carolina Single Audit Implementation Act. Information related to this single audit, including a schedule of expenditures of federal and state awards, the report on compliance and on internal control, reports on compliance with requirements applicable to each major federal and state program, and a schedule of findings and questioned costs are included in the single audit section of the comprehensive annual financial report.
W E B S I T E : W W W . W C P S S . N E T
C R O S S R O A D S B U I L D I N G I 5625 D I L L A R D D R I V E
C A R Y , N O R T H C A R O L I N A 2 7518 P H O N E : 919 . 431 .7 575
F A X : 919 .4 31 .7 563
SUPERINTENDENT’S OFFICE Anthony J. Tata, Superintendent
ii
The financial reporting entity includes all the funds of the Board. The members of the Board, elected by the public, corporately have decision-making authority. Although Wake County levies all taxes, the Board determines how the school system will spend the funds generated for schools. The County cannot modify the school system’s budget nor is the County entitled to share in any surpluses or required to finance any deficits of the school system. For these reasons, the Board is not fiscally dependent on the County and therefore is recognized as a primary government, as defined by the Governmental Accounting Standards Board. The Board also receives funding from state and federal government sources and must comply with the concomitant requirements of those funding entities. The Board does not have any component units, nor is it a component unit of any other entity.
GOVERNMENTAL STRUCTURE, LOCAL ECONOMIC CONDITION, AND OUTLOOK The Wake County Public School System (“WCPSS”) is one comprehensive school district serving the entire county; including Raleigh, Cary, Apex, Wendell, Fuquay-Varina, Garner, Knightdale, Rolesville, Wake Forest, Holly Springs, Morrisville, and Zebulon. In July 1976, the former Wake County and Raleigh City public school systems merged to create the WCPSS. For 2010-11 the school system was the largest in North Carolina and the 18th largest system in the nation. It served 143,299 students from kindergarten through 12th grade in 103 elementary schools, 32 middle schools, 24 high schools, and 4 special/optional schools. The school system has over 16,600 full-time employees and is the second largest employer in Wake County. The system has over 9,000 regular classroom teachers, not including media specialists, counselors, psychologists, etc. At the helm of the school system are the Wake County Board of Education and the Superintendent. The Board consists of nine members, elected in districts by the public, who serve four-year terms. The Superintendent, selected by the Board, serves as chief executive officer of the system. The Board is responsible for setting policy, while the Superintendent and his administrative team are in charge of managing the operations of the school system. A principal charged with the responsibility of the total school operations administers each individual school. Appropriate instructional and support personnel based on pupil enrollment staff the schools. The school principal and faculty work cooperatively with instructional specialists and central administrative staff in developing and implementing effective instructional programs. Thirty-two of the school system’s 163 schools are magnet schools, which offer unique educational alternatives. All students are eligible to apply, and the network features the following distinct programs: engineering; museum; creative arts and science; leadership; active learning and technology; international baccalaureate; gifted and talented/AG basics; center for Spanish language/IB PYP; Montessori; gifted and talented; international studies; university connections and leadership; GT/IB center for humanities, sciences and the arts; center for leadership and technology; and early college. The Board established the magnet network to offer a choice in instructional opportunities, maximize use of school facilities, and help balance schools. The program has proven to be highly successful and contributes to Wake County’s stature as a leader in education.
iii
The recurring publicity of Wake County as one of the most desired places to live and work in the United States, as evidenced by various publications and polls has continued to turn the spotlight on quality of life enjoyed by Wake County citizens. While quality of life is an intangible asset, there are also many tangible attributes that we can point to in explaining the County’s attractiveness. Chartered in 1771, Wake County covers an area of 864 square miles and is the second most populous county in the state. Twelve municipalities reside in Wake County including Raleigh, the county seat and state capital. A unique mix of urban and rural areas with small towns distinguishes Wake County from other counties in the state and provides something for everyone in choosing a lifestyle. Located in the north central section of the state on the piedmont plateau, Wake County is approximately half way between Washington, D. C., and Atlanta. As well as being a part of that major industrial corridor, Wake County is also convenient to the recreation of the beautiful North Carolina mountains and serene North Carolina beaches. Low rolling hills in the northwest changing gradually to level land in the southeast is the character of the County’s topography. The central North Carolina climate is relatively mild with moderate winters and warm summers. The location, geography, and climate make Wake County an enjoyable place to live and work while also contributing significantly to the economic viability of the region. The presence of state and local government employment markets, the college and university employment markets, and the Research Triangle Park research facilities, stabilize the economy of the area, as well as offer substantial employment opportunities to the County’s population. No major specialized industry dominates the economy of the County. The economic downturn beginning in 2008 continues to impact the Wake County Public School System. The school system has experienced state funding reductions and no increase in local funding while facing increased costs, additional school openings, and student growth. Federal funding has increased over the past two years due to the American Recovery and Reinvestment Act. However, this funding will present a challenge as this revenue stream ends, with no additional source of funds to replace this revenue. The Research Triangle Park, organized in 1959, straddles on the Wake and Durham County line. It encompasses 6,800 acres of land set aside for research and research-oriented manufacturing. With the attractiveness of the Research Triangle Park and its proximity to three major research universities, it is no accident that medical and electronic industries flourish in the region. The quantity and quality of the instructional programs of the school system are directly dependent on the funding provided and on effective management and efficient use of those funds. We recognize the important trust and responsibility we are given in the management of public resources and continue to be vigilant and trustworthy in fulfilling that responsibility. During the last several years we have aggressively pursued ways to reduce costs and improve efficiency by implementing workers’ compensation and dental self-insurance, and by working collaboratively with Wake County Government to minimize legal costs for workers’ compensation claims and real estate transactions. The school system managed costs by reducing staff and adjusting formulas for non-personnel resources supporting schools and

iv
departments. We believe that continuation of these financial management practices coupled with appropriate planning should provide appropriate fiscal accountability to the public and continued improvement of programs and outcomes for our students.
MAJOR INITIATIVES
Wake County Public School System Board Goal and Strategies
In March of 2011, the Wake County Board of Education adopted a Mission, Vision and Core Beliefs to sustain academic growth for Wake County’s elementary, middle, and high school students. The mission states, “The Wake County Public School System will significantly increase achievement for all students by providing a world-class education that equips students with the knowledge and expertise to become successful, productive citizens.”
The vision states, “WCPSS will serve as the national standard for increasing student achievement in the 21st century. Highly effective teachers and principals are empowered to raise the achievement of all children and will provide students with high quality classroom instruction that fosters intellectual development.
WCPSS recognizes children have different needs and is committed to ensuring all are challenged to reach their full potential. Students will graduate in increasingly high percentages and compete successfully as productive citizens. WCPSS will continue this community’s proud tradition of education leadership and academic excellence with a proactive school staff, effectively supported by the Board of Education and Central Services.”
The core beliefs are:
1. All children, regardless of socio-economic circumstances, can be high achieving students.
2. Academic achievement gaps can and will be eliminated by aggressively challenging students at all achievement levels.
3. Highly effective principals and teachers are the key to improving growth in student achievement.
4. The Board of Education and Central Services promote an environment of continuous improvement that results in a high performing organization and is 100% focused on student achievement.
5. Supportive and passionate parents, families, student mentors, and other members of the multi-cultural Wake County community are active participants in the education of our students.
In a spirit of openness, integrity, and accountability, WCPSS is committed to active communication and collaboration with parents and a demanding, caring community.
v
SAT Scores
The average combined Scholastic Assessment Test (SAT) score for Wake County Public School System seniors was 1,568. This is three points lower than the combined score for 2009-10. Participation of the Wake County Public School System was 74 percent. National participation was 50 percent and the state participation rate was 67 percent. Wake’s score was 93 points above the North Carolina average of 1,475 and 68 points above the national average of 1,500. Wake students scored an average of 544 on math, 521 on critical reading and 503 on writing.
FINANCIAL INFORMATION The state primarily finances the cost of public education in North Carolina and establishes minimum programs. Local boards of county commissioners appropriate local funds, in varying amounts by district, to supplement the basic program. Local boards of education in North Carolina have no tax levying or borrowing authority and are required to maintain accounting records in a uniform format. The management of the school system is responsible for establishing and maintaining an internal control structure designed to ensure that the assets of the school system are protected from loss, theft, or misuse and to ensure that adequate accounting data are compiled to allow for the preparation of financial statements in conformity with accounting principles generally accepted in the United States of America. The internal control structure provides reasonable, but not absolute, assurance in meeting these objectives. The concept of reasonable assurance recognizes that the cost of a control should not exceed the benefits derived and the valuation of costs and benefits requires estimates and judgments by management. As a recipient of federal, state, and local financial assistance, the school system is also responsible for ensuring that an adequate internal control structure is in place to ensure and document compliance with applicable laws and regulations related to these programs. This internal control structure is subject to periodic evaluation by management and the school system’s internal auditor. The North Carolina School Budget and Fiscal Control Act mandate a uniform budget format and the adoption of an annual balanced budget resolution by July 1 each year. The Board adopts budgets for all governmental funds and the proprietary funds. The objective of these budgetary controls is to ensure compliance with legal provisions embodied in the annual appropriated budget and in funds provided by the federal, state, and local governments. The financial section reflects the final budget, as amended for the fiscal year. The school system also maintains an encumbrance accounting system as one method of maintaining budgetary control. Encumbered amounts lapse at year-end. However, WCPSS generally re-appropriates outstanding encumbrances considered to be continuing contracts as part of the following year’s budget.
vi
As demonstrated by the statements and schedules included in the financial section of this report, the school system continues to meet its responsibility for sound financial management.
OTHER INFORMATION
Independent Audit
State statutes require an annual audit by independent certified public accountants. The Board selected the firm Cherry, Bekaert & Holland, L.L.P. In addition to meeting the requirements set forth in state statutes, the auditor designed their audit to meet the requirements of the federal Single Audit Act Amendments of 1996, as required by the U. S. Office of Management and Budget’s Circular A-133, and the North Carolina Single Audit Implementation Act. The auditors conducted the engagement in accordance with auditing standards generally accepted in the United States of America and used the standards set forth in the United States Government Accountability Office’s Government Auditing Standards. The auditor’s report on the general purpose financial statements and combining and individual fund statements and schedules is included in the financial section of this report.
Awards The Government Finance Officers Association of the United States and Canada (GFOA) and the Association of School Business Officials (ASBO) awarded Certificates of Achievement for Excellence in Financial Reporting to the Board for its comprehensive annual financial report for the year ended June 30, 2010. This was the twenty-second consecutive year that the Board received these prestigious awards. In order to be awarded Certificates of Achievement, the Board published an easily readable and efficiently organized comprehensive annual financial report. This report satisfied both accounting principles generally accepted in the United States of America and applicable legal requirements. The Certificates of Achievement are valid for a period of one year only. We believe that our current comprehensive annual financial report continues to meet the requirements for the Certificates of Achievement, and we are submitting it to the GFOA and ASBO to determine its eligibility for another certificate.
Acknowledgments The efficient and dedicated services of the entire staff of the finance division were essential in the preparation of this report. We would like to express our appreciation to all members of the division who assisted and contributed to the preparation of this report and to the Board’s independent certified public accountants, Cherry, Bekaert & Holland, L.L.P., for their assistance. The contributions of all are invaluable and sincerely appreciated and clearly reflect the high standards that we have set for ourselves.


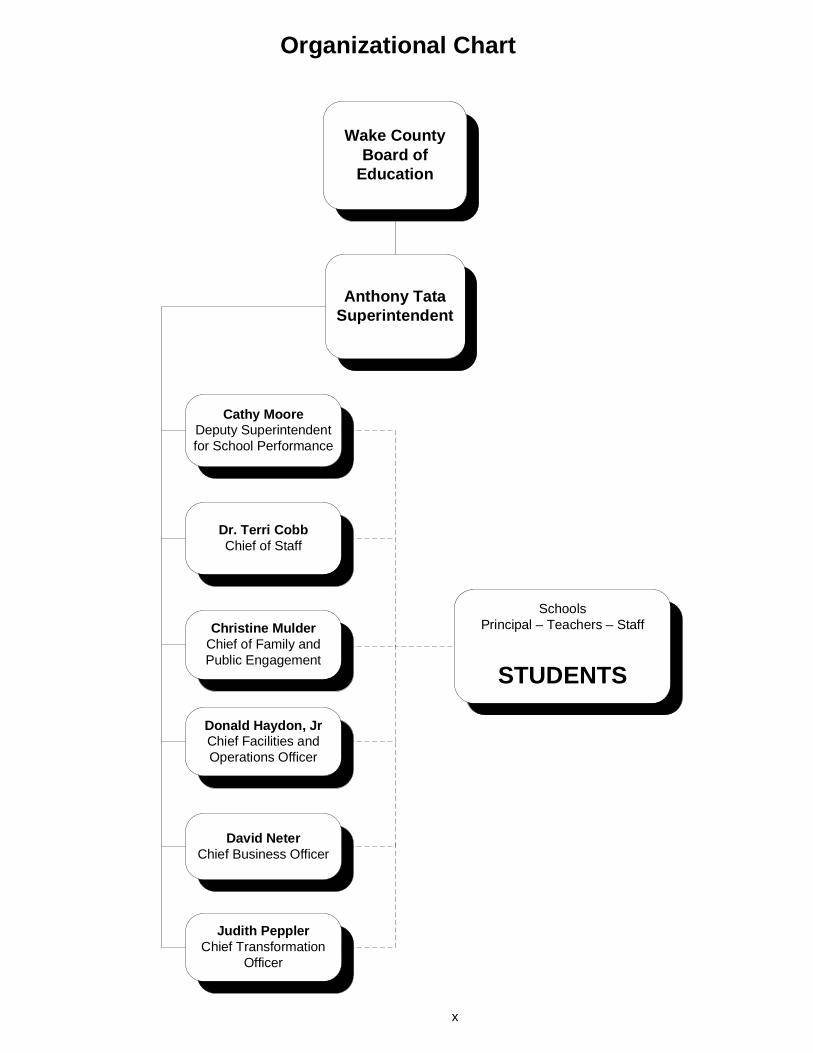
Wake CountyBoard of
Education
Anthony TataSuperintendent
SchoolsPrincipal – Teachers – Staff
STUDENTS
Cathy MooreDeputy Superintendentfor School Performance
Dr. Terri CobbChief of Staff
Christine MulderChief of Family andPublic Engagement
Donald Haydon, JrChief Facilities andOperations Officer
David NeterChief Business Officer
Judith PepplerChief Transformation
Officer
Organizational Chart
x

Board of Education and Leadership Team
Leadership TeamAnthony Tata, Superintendent
Ron Margiotta (District 8)Chair
Debra Goldman (District 9)Vice Chair
Anthony TataSuperintendent
Chief Offi cers
Cathy Moore, Deputy Superintendent for School Performance
Dr. Terri Cobb, Chief of StaffChristine Mulder, Chief of Family and Public EngagementDonald Haydon Jr., Chief Facilities and Operations Offi cer
David Neter, Chief Business Offi cerJudith Peppler, Chief Transformation Offi cer
Finance
Mark Winters, Finance Offi cer
Area Superintendents
Danny Barnes - Eastern Wake CountyLloyd Gardner - Southern Wake County
Dr. Pamela Kinsey-Barker - Northern Wake CountyAndre Smith - Northeastern Wake CountyJulye Mizelle - Southwestern Wake County
Jacqueline Ellis - Western Wake CountyKevin Hobbs - Central Wake County
Assistant Superintendents
Sylvia Wilkins - AcademicsStephen Gainey - Human Resources
Joe Desormeaux - Facilities Lisa Grillo - Special Education
Marvin Connelly - Student Support ServicesVacant - Data and Accountability
Vacant - Technology
xi
Chris Malone (District 1) John Tedesco (District 2) Kevin Hill (District 3) Keith Sutton (District 4)
Ann McLaurin (District 5) Carolyn Morrison (District 6) Deborah Prickett (District 7)

FINANCIAL REPORT
FOR THE FISCAL YEAR ENDED JUNE 30, 2011
Prepared by the Finance Department
Cary, North Carolina
FIna
nc
Ial S
ec
tIo
nF I n a n c I a l S e c t I o n
3
Management’s Discussion and Analysis This section of the Wake County Board of Education’s (the Board) financial report represents our discussion and analysis of the financial performance of the Board for the year ended June 30, 2011. This information should be read in conjunction with the audited financial statements included in this report. Financial Highlights • The Board enjoyed an increased enrollment of 3,410 students (or 2.44%) from the previous
year. • The assets of the Board exceeded its liabilities at the close of the fiscal year by
$2,626,926,559. • The government’s total net assets increased by $84,066,214 primarily due to increased
capital assets in the Governmental Activities. • As of the close of the current fiscal year, the Board’s governmental funds reported combined
ending fund balances of $74,981,113, an increase of $18,866,905 in comparison with the prior year. Approximately 45 percent of this total amount, or $33,875,157, is available for spending at the government’s discretion.
Overview of the Financial Statements The audited financial statements of the Board consists of four components. They are as follows: • Independent Auditors’ Report • Management's Discussion and Analysis (required supplementary information) • Basic Financial Statements • Supplemental information that presents combining and budgetary statements for non-major
governmental and enterprise funds The basic financial statements include two types of statements that present different views of the Board’s finances. The first are the government-wide statements. The government-wide statements are presented on the full accrual basis of accounting and include the statement of net assets and the statement of activities. The statement of net assets includes all of the Board’s assets and liabilities. Assets and liabilities are classified in the order of relative liquidity for assets and due date for liabilities. This statement provides a summary of the Board's investment in assets and obligations to creditors. Liquidity and financial flexibility can be evaluated using the information contained in this statement. The statement of activities summarizes the Board’s revenues and expenses for the current year. A net (expense) revenue format is used to indicate to what extent each function is self-sufficient. The second type of statements included in the basic financial statements are the fund financial statements, which are presented for the Board’s governmental funds and proprietary funds. These statements present the governmental funds on the modified accrual basis of accounting, measuring the near term inflows and outflows of financial resources and what is available at year-end to spend in the next fiscal year. The fund financial statements focus on the Board’s most significant funds. Because a different basis of accounting is used in the government-wide statements, reconciliation from the governmental fund financial statements to the government-wide statements is required. The government-wide statements provide information about the Board as an economic unit, while the fund financial statements provide information on the financial resources of the Board’s major funds.
4
Government-wide Statements The government-wide statements report information about the Board as a whole using accounting methods similar to those used by private-sector companies. The statement of net assets includes all of the Board’s assets and liabilities. All of the current year’s revenues and expenses are accounted for in the statement of activities regardless of when cash is received or paid. The two government-wide statements report the Board’s net assets and how they have changed. Net assets – the difference between the Board’s assets and liabilities – is one way to measure the Board’s financial health or position.
• Over time, increases or decreases in the Board’s net assets are an indicator of whether its financial position is improving or deteriorating.
• To assess the Board’s overall health, consider additional non-financial factors such as changes in the property tax base and the condition of its school buildings and other physical assets.
The Board’s activities are divided into two categories in the government-wide statements:
• Governmental activities: Most of the Board’s basic services are included here, such as regular and special education, transportation, and administration. County funding and state and federal aid finance most of these activities.
• Business-type activities: The Board charges fees to help it cover the costs of certain services it provides. Child nutrition and tuition programs are included here.
Fund Financial Statements The fund financial statements provide more detailed information about the Board’s funds, focusing on its most significant or “major” funds – not the Board as a whole. Funds are accounting devices the Board uses to keep track of specific sources of funding and spending on particular programs.
• Some funds are required by State law, such as the State Public School Fund. • The Board established other funds to control and manage money for a particular
purpose or to show that it is properly using certain revenues, such as in the Direct Federal Grants Fund.
The Wake County Board of Education has two types of funds: Governmental funds: Most of the Board’s basic services are included in the governmental funds, which generally focus on two things – how cash and other assets can readily be converted to cash flow in and out and the balances left at year-end that are available for spending. As a result of this focus, the governmental funds statements provide a detailed short- term view that helps determine whether there are more or fewer financial resources that can be spent in the near future to finance the Board’s programs. Because this information does not encompass the additional long-term focus of the government-wide statements, additional information at the bottom of the governmental funds statements, in the form of a reconciliation, explains the relationship (or differences) between them. The Board has several governmental funds: the General Fund, the State Public School Fund, the Individual Schools Fund, the
5
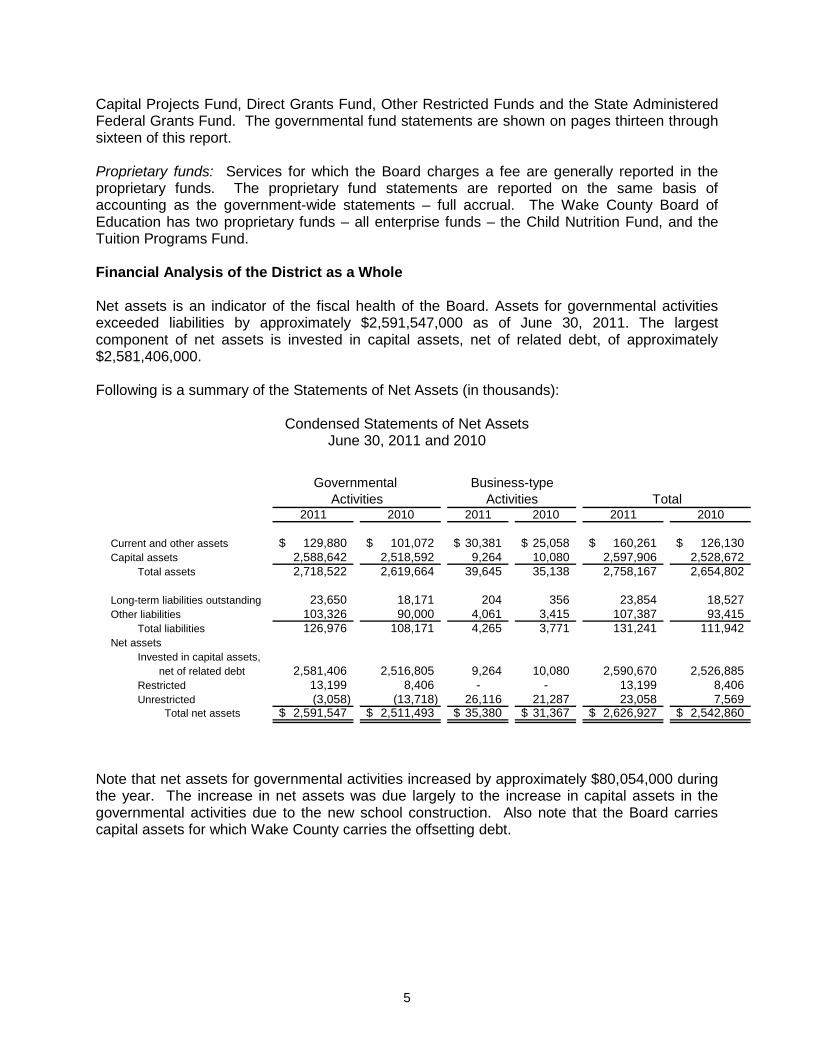
Capital Projects Fund, Direct Grants Fund, Other Restricted Funds and the State Administered Federal Grants Fund. The governmental fund statements are shown on pages thirteen through sixteen of this report. Proprietary funds: Services for which the Board charges a fee are generally reported in the proprietary funds. The proprietary fund statements are reported on the same basis of accounting as the government-wide statements – full accrual. The Wake County Board of Education has two proprietary funds – all enterprise funds – the Child Nutrition Fund, and the Tuition Programs Fund. Financial Analysis of the District as a Whole Net assets is an indicator of the fiscal health of the Board. Assets for governmental activities exceeded liabilities by approximately $2,591,547,000 as of June 30, 2011. The largest component of net assets is invested in capital assets, net of related debt, of approximately $2,581,406,000. Following is a summary of the Statements of Net Assets (in thousands):
Condensed Statements of Net Assets June 30, 2011 and 2010
Note that net assets for governmental activities increased by approximately $80,054,000 during the year. The increase in net assets was due largely to the increase in capital assets in the governmental activities due to the new school construction. Also note that the Board carries capital assets for which Wake County carries the offsetting debt.
2011 2010 2011 2010 2011 2010
Current and other assets 129,880$ 101,072$ 30,381$ 25,058$ 160,261$ 126,130$ Capital assets 2,588,642 2,518,592 9,264 10,080 2,597,906 2,528,672
Total assets 2,718,522 2,619,664 39,645 35,138 2,758,167 2,654,802
Long-term liabilities outstanding 23,650 18,171 204 356 23,854 18,527 Other liabilities 103,326 90,000 4,061 3,415 107,387 93,415
Total liabilities 126,976 108,171 4,265 3,771 131,241 111,942 Net assets
Invested in capital assets, net of related debt 2,581,406 2,516,805 9,264 10,080 2,590,670 2,526,885 Restricted 13,199 8,406 - - 13,199 8,406 Unrestricted (3,058) (13,718) 26,116 21,287 23,058 7,569
Total net assets 2,591,547$ 2,511,493$ 35,380$ 31,367$ 2,626,927$ 2,542,860$
TotalGovernmental Business-type
Activities Activities
6
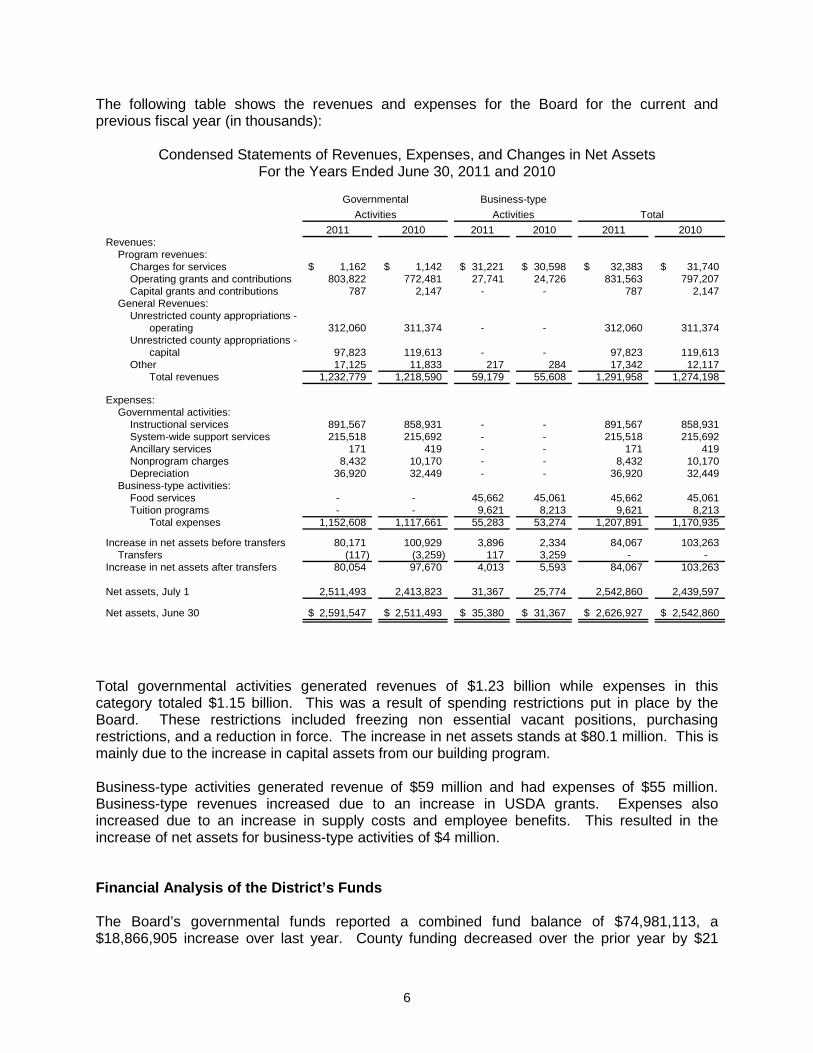
The following table shows the revenues and expenses for the Board for the current and previous fiscal year (in thousands):
Condensed Statements of Revenues, Expenses, and Changes in Net Assets For the Years Ended June 30, 2011 and 2010
Total governmental activities generated revenues of $1.23 billion while expenses in this category totaled $1.15 billion. This was a result of spending restrictions put in place by the Board. These restrictions included freezing non essential vacant positions, purchasing restrictions, and a reduction in force. The increase in net assets stands at $80.1 million. This is mainly due to the increase in capital assets from our building program. Business-type activities generated revenue of $59 million and had expenses of $55 million. Business-type revenues increased due to an increase in USDA grants. Expenses also increased due to an increase in supply costs and employee benefits. This resulted in the increase of net assets for business-type activities of $4 million. Financial Analysis of the District’s Funds The Board’s governmental funds reported a combined fund balance of $74,981,113, a $18,866,905 increase over last year. County funding decreased over the prior year by $21
2011 2010 2011 2010 2011 2010Revenues:
Program revenues:Charges for services 1,162$ 1,142$ 31,221$ 30,598$ 32,383$ 31,740$ Operating grants and contributions 803,822 772,481 27,741 24,726 831,563 797,207 Capital grants and contributions 787 2,147 - - 787 2,147
General Revenues:Unrestricted county appropriations -
operating 312,060 311,374 - - 312,060 311,374 Unrestricted county appropriations -
capital 97,823 119,613 - - 97,823 119,613 Other 17,125 11,833 217 284 17,342 12,117
Total revenues 1,232,779 1,218,590 59,179 55,608 1,291,958 1,274,198
Expenses:Governmental activities:
Instructional services 891,567 858,931 - - 891,567 858,931 System-wide support services 215,518 215,692 - - 215,518 215,692 Ancillary services 171 419 - - 171 419 Nonprogram charges 8,432 10,170 - - 8,432 10,170 Depreciation 36,920 32,449 - - 36,920 32,449
Business-type activities:Food services - - 45,662 45,061 45,662 45,061 Tuition programs - - 9,621 8,213 9,621 8,213
Total expenses 1,152,608 1,117,661 55,283 53,274 1,207,891 1,170,935
Increase in net assets before transfers 80,171 100,929 3,896 2,334 84,067 103,263 Transfers (117) (3,259) 117 3,259 - -
Increase in net assets after transfers 80,054 97,670 4,013 5,593 84,067 103,263
Net assets, July 1 2,511,493 2,413,823 31,367 25,774 2,542,860 2,439,597
Net assets, June 30 2,591,547$ 2,511,493$ 35,380$ 31,367$ 2,626,927$ 2,542,860$
TotalGovernmental
ActivitiesBusiness-type
Activities
7
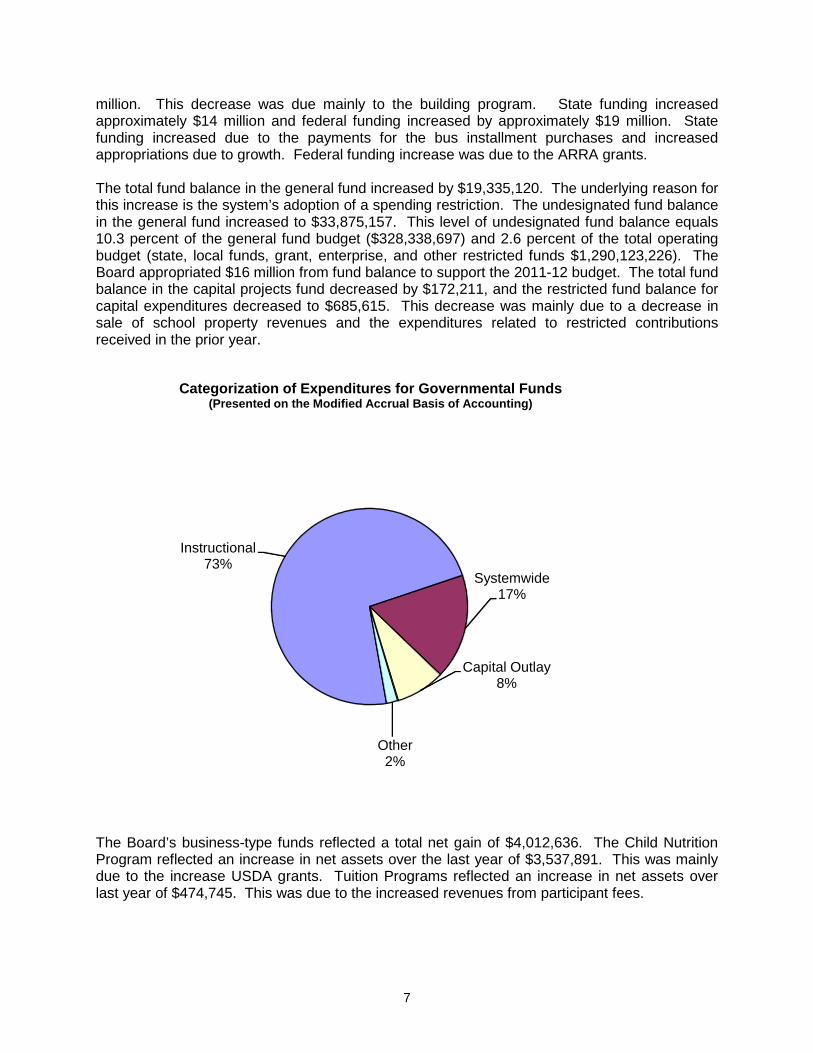
million. This decrease was due mainly to the building program. State funding increased approximately $14 million and federal funding increased by approximately $19 million. State funding increased due to the payments for the bus installment purchases and increased appropriations due to growth. Federal funding increase was due to the ARRA grants. The total fund balance in the general fund increased by $19,335,120. The underlying reason for this increase is the system’s adoption of a spending restriction. The undesignated fund balance in the general fund increased to $33,875,157. This level of undesignated fund balance equals 10.3 percent of the general fund budget ($328,338,697) and 2.6 percent of the total operating budget (state, local funds, grant, enterprise, and other restricted funds $1,290,123,226). The Board appropriated $16 million from fund balance to support the 2011-12 budget. The total fund balance in the capital projects fund decreased by $172,211, and the restricted fund balance for capital expenditures decreased to $685,615. This decrease was mainly due to a decrease in sale of school property revenues and the expenditures related to restricted contributions received in the prior year.
Instructional 73%
Systemwide17%
Capital Outlay8%
Other2%
Categorization of Expenditures for Governmental Funds (Presented on the Modified Accrual Basis of Accounting)
The Board’s business-type funds reflected a total net gain of $4,012,636. The Child Nutrition Program reflected an increase in net assets over the last year of $3,537,891. This was mainly due to the increase USDA grants. Tuition Programs reflected an increase in net assets over last year of $474,745. This was due to the increased revenues from participant fees.
8
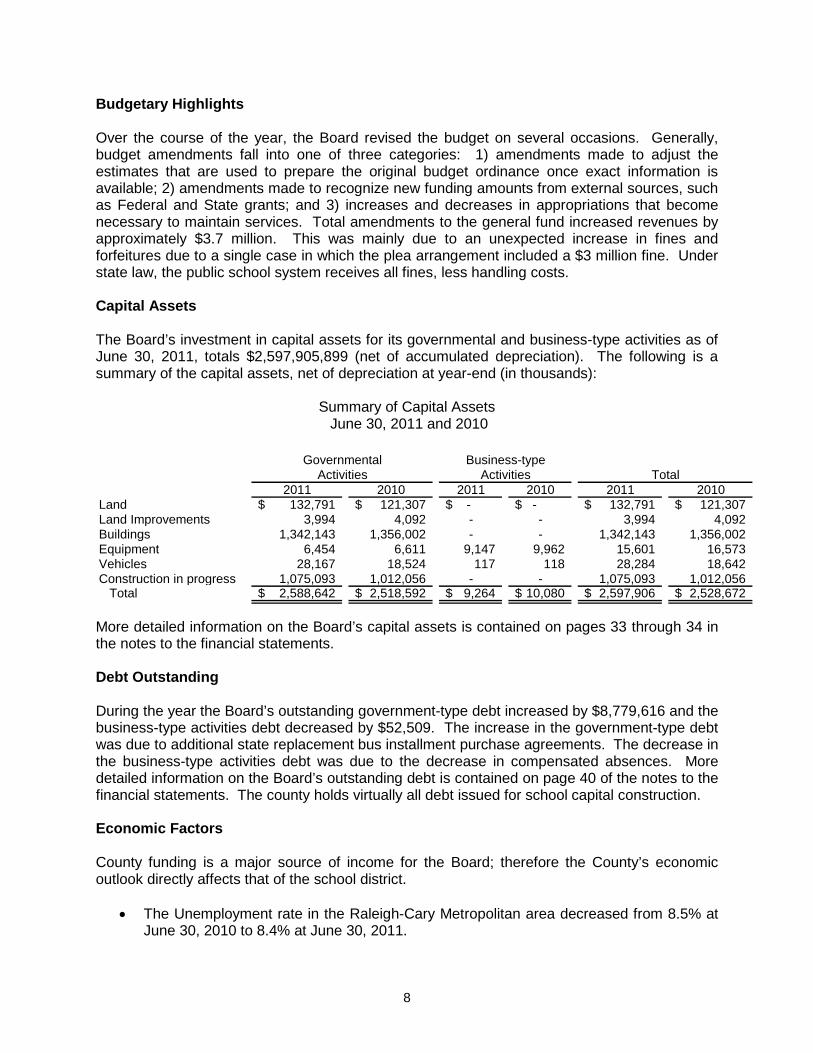
Budgetary Highlights Over the course of the year, the Board revised the budget on several occasions. Generally, budget amendments fall into one of three categories: 1) amendments made to adjust the estimates that are used to prepare the original budget ordinance once exact information is available; 2) amendments made to recognize new funding amounts from external sources, such as Federal and State grants; and 3) increases and decreases in appropriations that become necessary to maintain services. Total amendments to the general fund increased revenues by approximately $3.7 million. This was mainly due to an unexpected increase in fines and forfeitures due to a single case in which the plea arrangement included a $3 million fine. Under state law, the public school system receives all fines, less handling costs. Capital Assets The Board’s investment in capital assets for its governmental and business-type activities as of June 30, 2011, totals $2,597,905,899 (net of accumulated depreciation). The following is a summary of the capital assets, net of depreciation at year-end (in thousands):
Summary of Capital Assets June 30, 2011 and 2010
More detailed information on the Board’s capital assets is contained on pages 33 through 34 in the notes to the financial statements. Debt Outstanding During the year the Board’s outstanding government-type debt increased by $8,779,616 and the business-type activities debt decreased by $52,509. The increase in the government-type debt was due to additional state replacement bus installment purchase agreements. The decrease in the business-type activities debt was due to the decrease in compensated absences. More detailed information on the Board’s outstanding debt is contained on page 40 of the notes to the financial statements. The county holds virtually all debt issued for school capital construction. Economic Factors County funding is a major source of income for the Board; therefore the County’s economic outlook directly affects that of the school district.
• The Unemployment rate in the Raleigh-Cary Metropolitan area decreased from 8.5% at June 30, 2010 to 8.4% at June 30, 2011.
2011 2010 2011 2010 2011 2010Land 132,791$ 121,307$ $ - $ - 132,791$ 121,307$ Land Improvements 3,994 4,092 - - 3,994 4,092 Buildings 1,342,143 1,356,002 - - 1,342,143 1,356,002 Equipment 6,454 6,611 9,147 9,962 15,601 16,573 Vehicles 28,167 18,524 117 118 28,284 18,642 Construction in progress 1,075,093 1,012,056 - - 1,075,093 1,012,056 Total 2,588,642$ 2,518,592$ 9,264$ 10,080$ 2,597,906$ 2,528,672$
TotalGovernmental
ActivitiesBusiness-type
Activities
9
• The total assessed value of property in the County increased to $119.5 billion for the fiscal year ended June 30, 2011, a .3 percent increase over the prior fiscal year
• Sales tax collections for the fiscal year ended June 30, 2011 were $114 million. This is a 9% increase from $104.4 million in the prior fiscal year.
Requests for Information This report is intended to provide a summary of the financial condition of the Wake County Board of Education. Questions or requests for additional information should be addressed to: Mark Winters, Finance Officer Wake County Board of Education 110 Corning Road, Crossroads II Cary, NC 27518
10
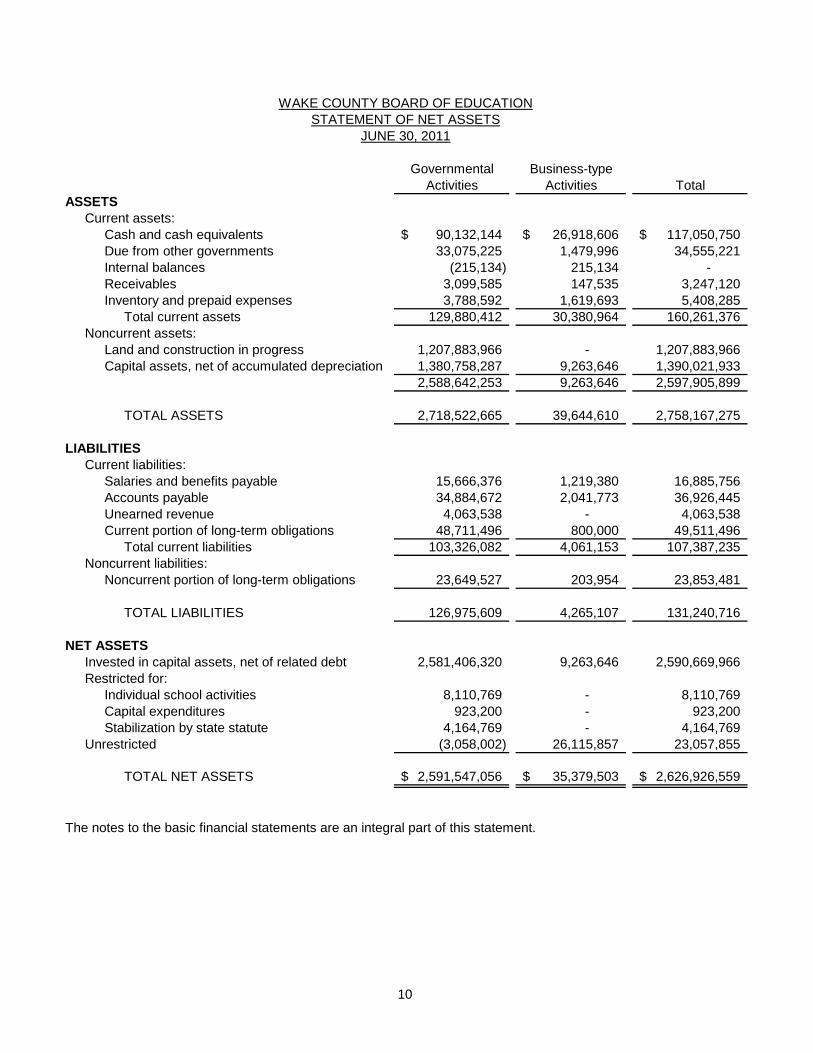
Governmental Business-typeActivities Activities Total
ASSETSCurrent assets:
Cash and cash equivalents 90,132,144$ 26,918,606$ 117,050,750$ Due from other governments 33,075,225 1,479,996 34,555,221 Internal balances (215,134) 215,134 - Receivables 3,099,585 147,535 3,247,120 Inventory and prepaid expenses 3,788,592 1,619,693 5,408,285
Total current assets 129,880,412 30,380,964 160,261,376 Noncurrent assets:
Land and construction in progress 1,207,883,966 - 1,207,883,966 Capital assets, net of accumulated depreciation 1,380,758,287 9,263,646 1,390,021,933
2,588,642,253 9,263,646 2,597,905,899
TOTAL ASSETS 2,718,522,665 39,644,610 2,758,167,275
LIABILITIESCurrent liabilities:
Salaries and benefits payable 15,666,376 1,219,380 16,885,756 Accounts payable 34,884,672 2,041,773 36,926,445 Unearned revenue 4,063,538 - 4,063,538 Current portion of long-term obligations 48,711,496 800,000 49,511,496
Total current liabilities 103,326,082 4,061,153 107,387,235 Noncurrent liabilities:
Noncurrent portion of long-term obligations 23,649,527 203,954 23,853,481
TOTAL LIABILITIES 126,975,609 4,265,107 131,240,716
NET ASSETSInvested in capital assets, net of related debt 2,581,406,320 9,263,646 2,590,669,966 Restricted for:
Individual school activities 8,110,769 - 8,110,769 Capital expenditures 923,200 - 923,200 Stabilization by state statute 4,164,769 - 4,164,769
Unrestricted (3,058,002) 26,115,857 23,057,855
TOTAL NET ASSETS 2,591,547,056$ 35,379,503$ 2,626,926,559$
The notes to the basic financial statements are an integral part of this statement.
WAKE COUNTY BOARD OF EDUCATIONSTATEMENT OF NET ASSETS
JUNE 30, 2011
11
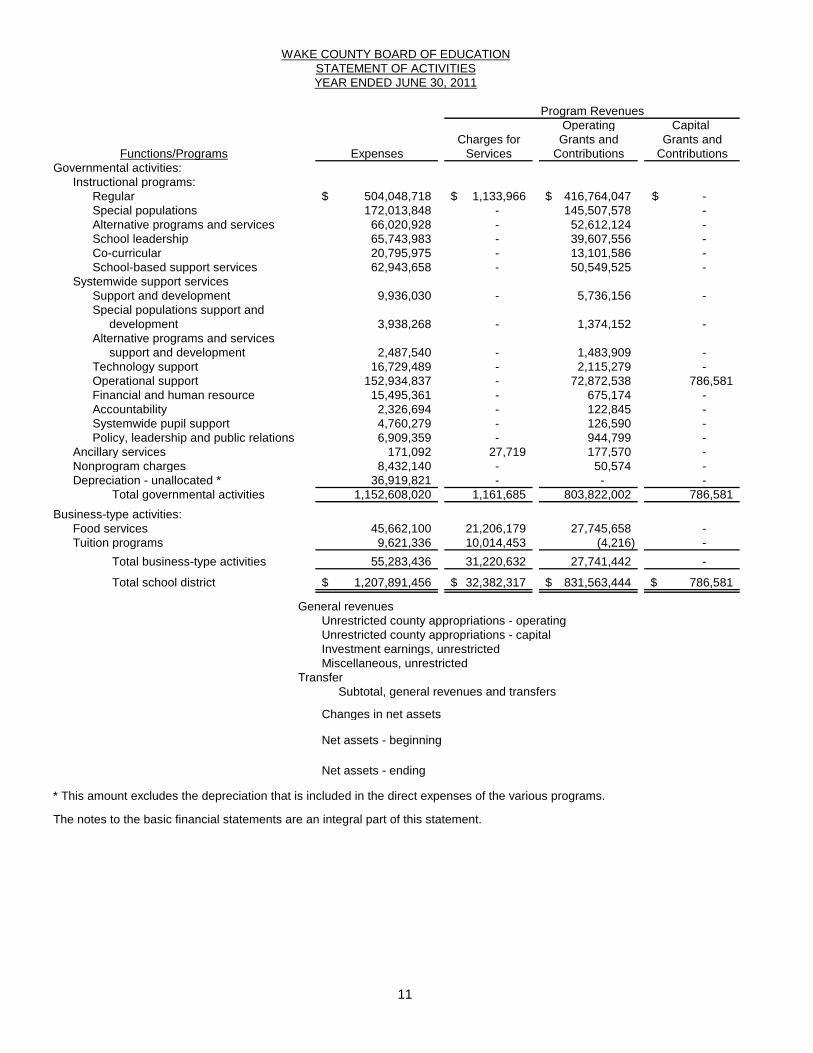
Operating Capital Charges for Grants and Grants and
Expenses Services Contributions ContributionsGovernmental activities:
Instructional programs:Regular 504,048,718$ 1,133,966$ 416,764,047$ -$ Special populations 172,013,848 - 145,507,578 - Alternative programs and services 66,020,928 - 52,612,124 - School leadership 65,743,983 - 39,607,556 - Co-curricular 20,795,975 - 13,101,586 - School-based support services 62,943,658 - 50,549,525 -
Systemwide support servicesSupport and development 9,936,030 - 5,736,156 - Special populations support and development 3,938,268 - 1,374,152 - Alternative programs and services support and development 2,487,540 - 1,483,909 - Technology support 16,729,489 - 2,115,279 - Operational support 152,934,837 - 72,872,538 786,581 Financial and human resource 15,495,361 - 675,174 - Accountability 2,326,694 - 122,845 - Systemwide pupil support 4,760,279 - 126,590 - Policy, leadership and public relations 6,909,359 - 944,799 -
Ancillary services 171,092 27,719 177,570 - Nonprogram charges 8,432,140 - 50,574 - Depreciation - unallocated * 36,919,821 - - -
Total governmental activities 1,152,608,020 1,161,685 803,822,002 786,581 Business-type activities:
Food services 45,662,100 21,206,179 27,745,658 - Tuition programs 9,621,336 10,014,453 (4,216) -
Total business-type activities 55,283,436 31,220,632 27,741,442 -
Total school district 1,207,891,456$ 32,382,317$ 831,563,444$ 786,581$
General revenuesUnrestricted county appropriations - operatingUnrestricted county appropriations - capitalInvestment earnings, unrestrictedMiscellaneous, unrestricted
Transfer Subtotal, general revenues and transfers
Changes in net assets
Net assets - beginning
Net assets - ending
* This amount excludes the depreciation that is included in the direct expenses of the various programs.
The notes to the basic financial statements are an integral part of this statement.
Functions/Programs
Program Revenues
WAKE COUNTY BOARD OF EDUCATIONSTATEMENT OF ACTIVITIESYEAR ENDED JUNE 30, 2011
12
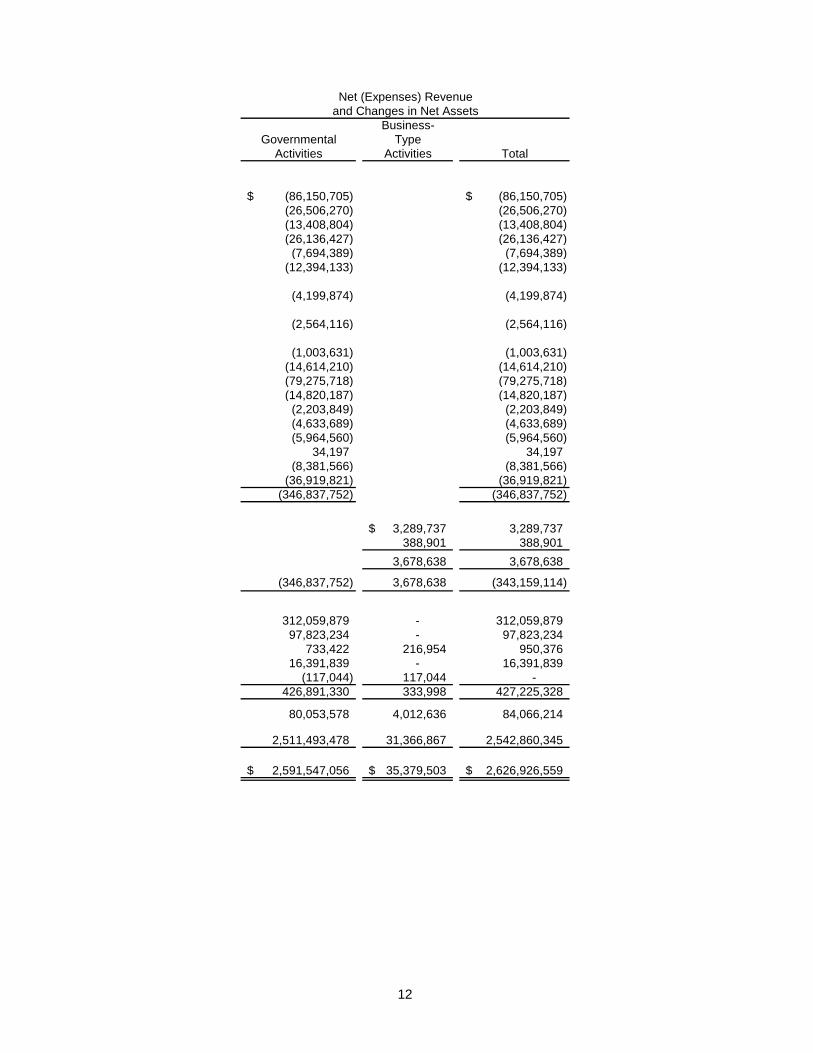
Business-Governmental Type
Activities Activities Total
(86,150,705)$ (86,150,705)$ (26,506,270) (26,506,270) (13,408,804) (13,408,804) (26,136,427) (26,136,427)
(7,694,389) (7,694,389) (12,394,133) (12,394,133)
(4,199,874) (4,199,874)
(2,564,116) (2,564,116)
(1,003,631) (1,003,631) (14,614,210) (14,614,210) (79,275,718) (79,275,718) (14,820,187) (14,820,187)
(2,203,849) (2,203,849) (4,633,689) (4,633,689) (5,964,560) (5,964,560)
34,197 34,197 (8,381,566) (8,381,566)
(36,919,821) (36,919,821) (346,837,752) (346,837,752)
3,289,737$ 3,289,737 388,901 388,901
3,678,638 3,678,638
(346,837,752) 3,678,638 (343,159,114)
312,059,879 - 312,059,879 97,823,234 - 97,823,234
733,422 216,954 950,376 16,391,839 - 16,391,839
(117,044) 117,044 - 426,891,330 333,998 427,225,328
80,053,578 4,012,636 84,066,214
2,511,493,478 31,366,867 2,542,860,345
2,591,547,056$ 35,379,503$ 2,626,926,559$
Net (Expenses) Revenueand Changes in Net Assets
13
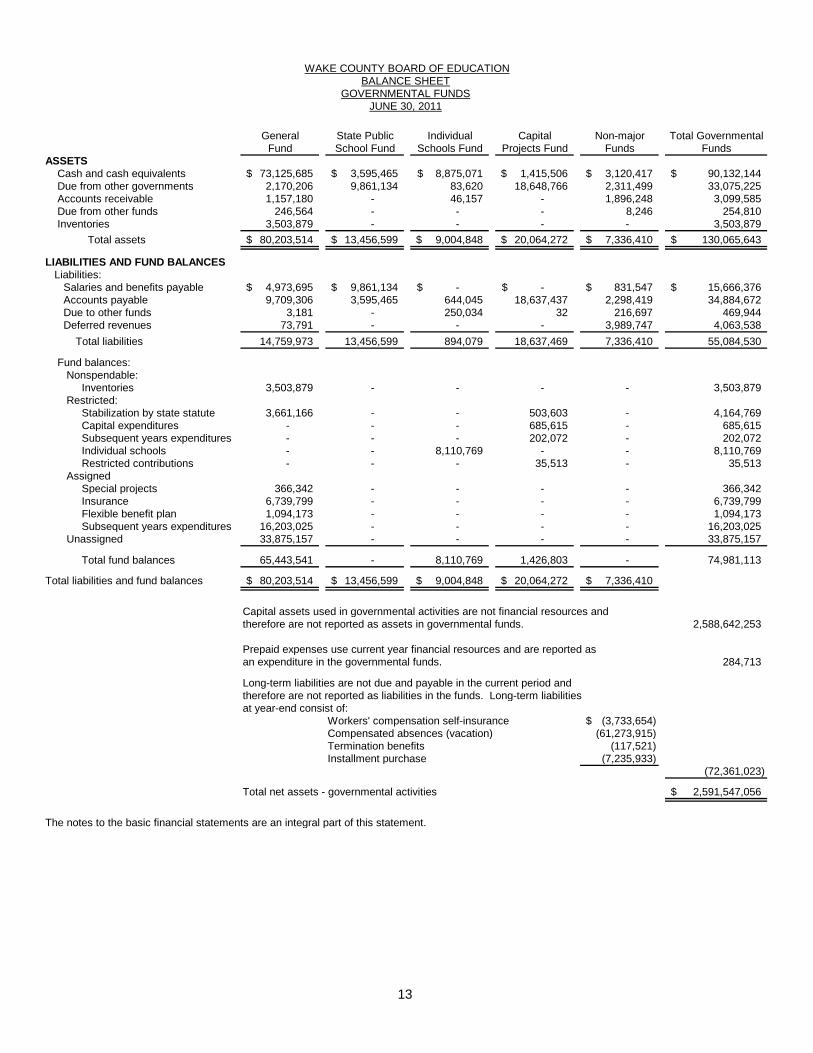
General State Public Individual Capital Non-major Total GovernmentalFund School Fund Schools Fund Projects Fund Funds Funds
ASSETS Cash and cash equivalents 73,125,685$ 3,595,465$ 8,875,071$ 1,415,506$ 3,120,417$ 90,132,144$ Due from other governments 2,170,206 9,861,134 83,620 18,648,766 2,311,499 33,075,225 Accounts receivable 1,157,180 - 46,157 - 1,896,248 3,099,585 Due from other funds 246,564 - - - 8,246 254,810 Inventories 3,503,879 - - - - 3,503,879 Total assets 80,203,514$ 13,456,599$ 9,004,848$ 20,064,272$ 7,336,410$ 130,065,643$
LIABILITIES AND FUND BALANCES Liabilities: Salaries and benefits payable 4,973,695$ 9,861,134$ -$ -$ 831,547$ 15,666,376$ Accounts payable 9,709,306 3,595,465 644,045 18,637,437 2,298,419 34,884,672 Due to other funds 3,181 - 250,034 32 216,697 469,944 Deferred revenues 73,791 - - - 3,989,747 4,063,538 Total liabilities 14,759,973 13,456,599 894,079 18,637,469 7,336,410 55,084,530
Fund balances: Nonspendable: Inventories 3,503,879 - - - - 3,503,879 Restricted: Stabilization by state statute 3,661,166 - - 503,603 - 4,164,769 Capital expenditures - - - 685,615 - 685,615 Subsequent years expenditures - - - 202,072 - 202,072 Individual schools - - 8,110,769 - - 8,110,769 Restricted contributions - - - 35,513 - 35,513 Assigned Special projects 366,342 - - - - 366,342 Insurance 6,739,799 - - - - 6,739,799 Flexible benefit plan 1,094,173 - - - - 1,094,173 Subsequent years expenditures 16,203,025 - - - - 16,203,025 Unassigned 33,875,157 - - - - 33,875,157
Total fund balances 65,443,541 - 8,110,769 1,426,803 - 74,981,113
Total liabilities and fund balances 80,203,514$ 13,456,599$ 9,004,848$ 20,064,272$ 7,336,410$
Capital assets used in governmental activities are not financial resources andtherefore are not reported as assets in governmental funds. 2,588,642,253
Prepaid expenses use current year financial resources and are reported as an expenditure in the governmental funds. 284,713
Long-term liabilities are not due and payable in the current period and therefore are not reported as liabilities in the funds. Long-term liabilities at year-end consist of:
Workers' compensation self-insurance (3,733,654)$ Compensated absences (vacation) (61,273,915) Termination benefits (117,521) Installment purchase (7,235,933)
(72,361,023)
Total net assets - governmental activities 2,591,547,056$
The notes to the basic financial statements are an integral part of this statement.
WAKE COUNTY BOARD OF EDUCATIONBALANCE SHEET
GOVERNMENTAL FUNDSJUNE 30, 2011
14
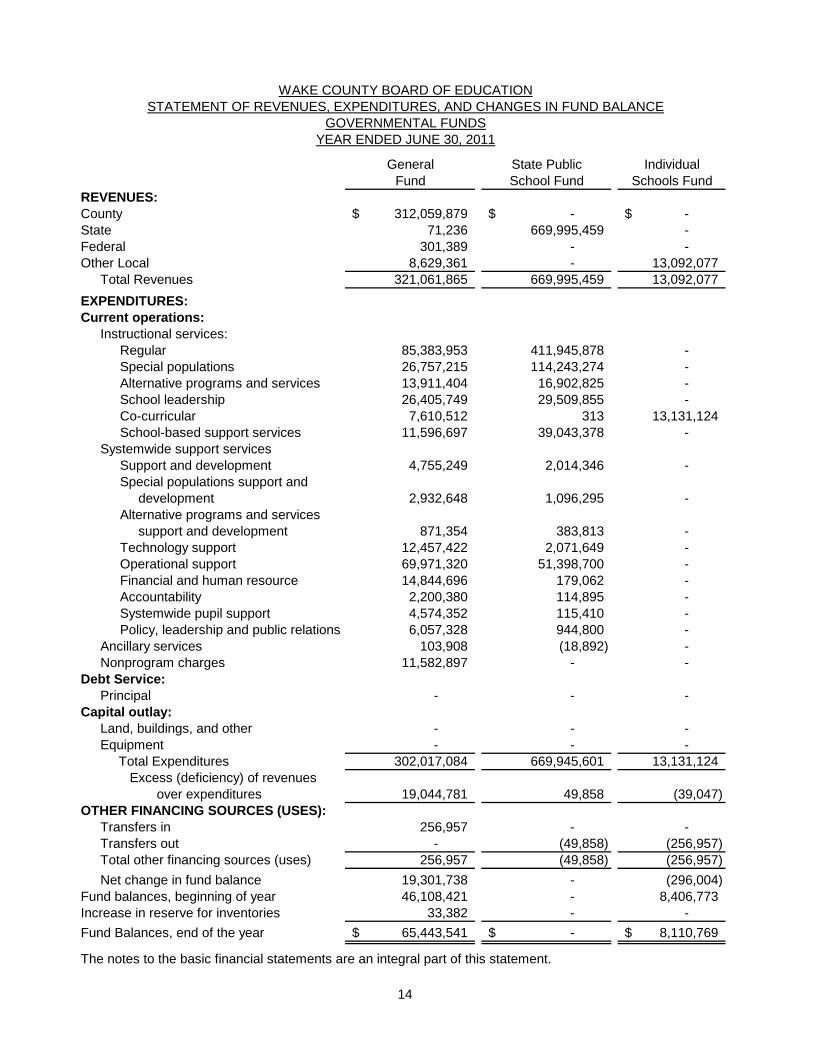
General State Public IndividualFund School Fund Schools Fund
REVENUES: County 312,059,879$ -$ -$ State 71,236 669,995,459 - Federal 301,389 - - Other Local 8,629,361 - 13,092,077
Total Revenues 321,061,865 669,995,459 13,092,077 EXPENDITURES:Current operations:
Instructional services:Regular 85,383,953 411,945,878 - Special populations 26,757,215 114,243,274 - Alternative programs and services 13,911,404 16,902,825 - School leadership 26,405,749 29,509,855 - Co-curricular 7,610,512 313 13,131,124 School-based support services 11,596,697 39,043,378 -
Systemwide support servicesSupport and development 4,755,249 2,014,346 - Special populations support and development 2,932,648 1,096,295 - Alternative programs and services support and development 871,354 383,813 - Technology support 12,457,422 2,071,649 - Operational support 69,971,320 51,398,700 - Financial and human resource 14,844,696 179,062 - Accountability 2,200,380 114,895 - Systemwide pupil support 4,574,352 115,410 - Policy, leadership and public relations 6,057,328 944,800 -
Ancillary services 103,908 (18,892) - Nonprogram charges 11,582,897 - -
Debt Service:Principal - - -
Capital outlay:Land, buildings, and other - - - Equipment - - - Total Expenditures 302,017,084 669,945,601 13,131,124 Excess (deficiency) of revenues
over expenditures 19,044,781 49,858 (39,047) OTHER FINANCING SOURCES (USES):
Transfers in 256,957 - - Transfers out - (49,858) (256,957) Total other financing sources (uses) 256,957 (49,858) (256,957) Net change in fund balance 19,301,738 - (296,004)
Fund balances, beginning of year 46,108,421 - 8,406,773 Increase in reserve for inventories 33,382 - - Fund Balances, end of the year 65,443,541$ -$ 8,110,769$
The notes to the basic financial statements are an integral part of this statement.
WAKE COUNTY BOARD OF EDUCATIONSTATEMENT OF REVENUES, EXPENDITURES, AND CHANGES IN FUND BALANCE
GOVERNMENTAL FUNDSYEAR ENDED JUNE 30, 2011
15
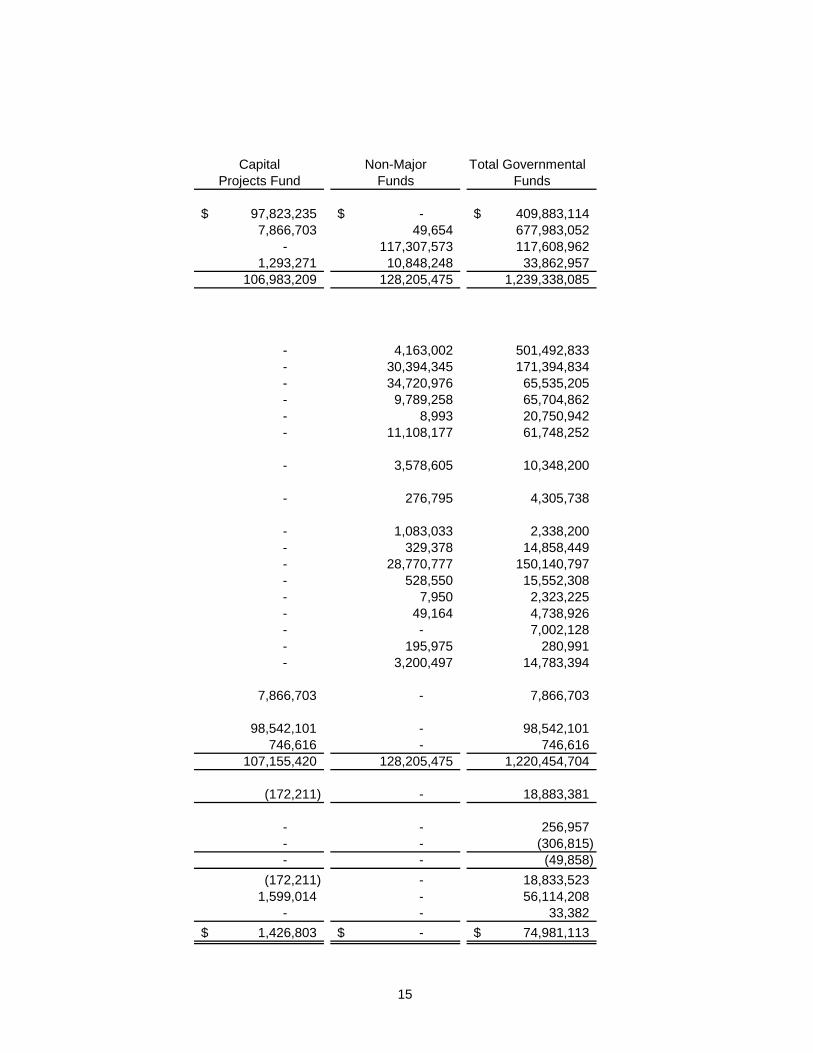
Capital Non-Major Total GovernmentalProjects Fund Funds Funds
97,823,235$ -$ 409,883,114$ 7,866,703 49,654 677,983,052
- 117,307,573 117,608,962 1,293,271 10,848,248 33,862,957
106,983,209 128,205,475 1,239,338,085
- 4,163,002 501,492,833 - 30,394,345 171,394,834 - 34,720,976 65,535,205 - 9,789,258 65,704,862 - 8,993 20,750,942 - 11,108,177 61,748,252
- 3,578,605 10,348,200
- 276,795 4,305,738
- 1,083,033 2,338,200 - 329,378 14,858,449 - 28,770,777 150,140,797 - 528,550 15,552,308 - 7,950 2,323,225 - 49,164 4,738,926 - - 7,002,128 - 195,975 280,991 - 3,200,497 14,783,394
7,866,703 - 7,866,703
98,542,101 - 98,542,101 746,616 - 746,616
107,155,420 128,205,475 1,220,454,704
(172,211) - 18,883,381
- - 256,957 - - (306,815) - - (49,858)
(172,211) - 18,833,523 1,599,014 - 56,114,208
- - 33,382 1,426,803$ -$ 74,981,113$
16
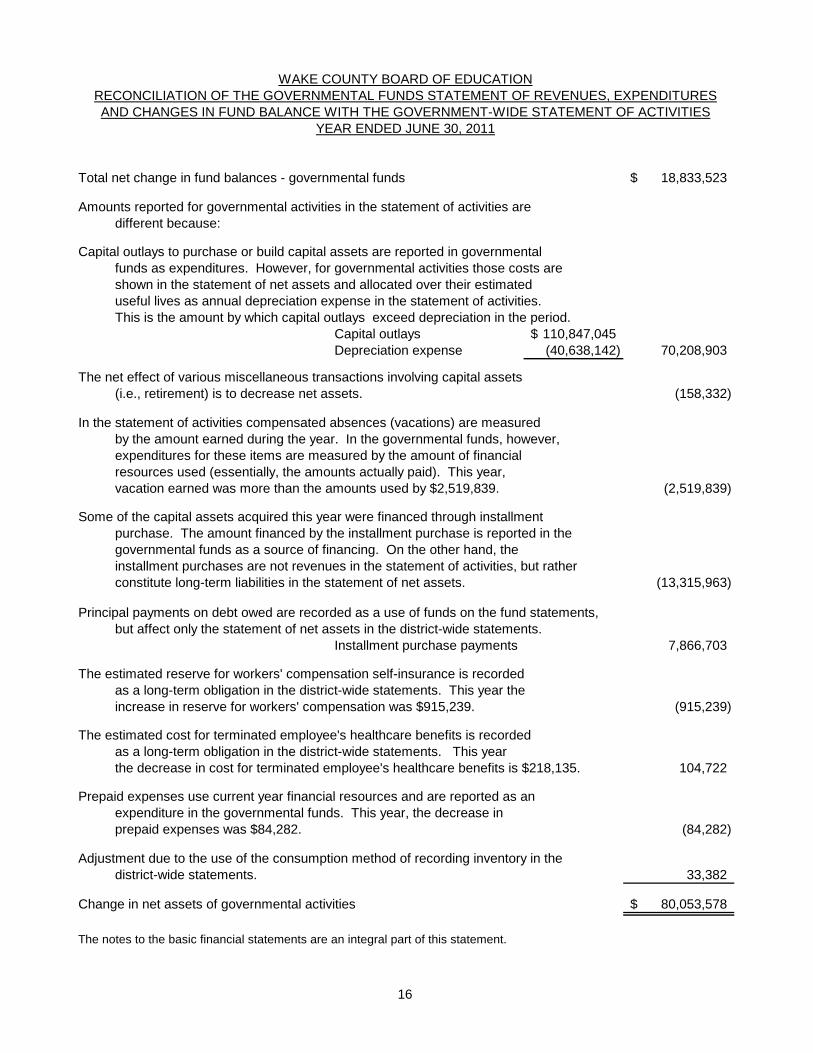
Total net change in fund balances - governmental funds 18,833,523$
Amounts reported for governmental activities in the statement of activities aredifferent because:
Capital outlays to purchase or build capital assets are reported in governmental funds as expenditures. However, for governmental activities those costs areshown in the statement of net assets and allocated over their estimateduseful lives as annual depreciation expense in the statement of activities.This is the amount by which capital outlays exceed depreciation in the period.
Capital outlays 110,847,045$ Depreciation expense (40,638,142) 70,208,903
The net effect of various miscellaneous transactions involving capital assets(i.e., retirement) is to decrease net assets. (158,332)
In the statement of activities compensated absences (vacations) are measured by the amount earned during the year. In the governmental funds, however,expenditures for these items are measured by the amount of financial resources used (essentially, the amounts actually paid). This year,vacation earned was more than the amounts used by $2,519,839. (2,519,839)
Some of the capital assets acquired this year were financed through installmentpurchase. The amount financed by the installment purchase is reported in the governmental funds as a source of financing. On the other hand, the installment purchases are not revenues in the statement of activities, but ratherconstitute long-term liabilities in the statement of net assets. (13,315,963)
Principal payments on debt owed are recorded as a use of funds on the fund statements,but affect only the statement of net assets in the district-wide statements.
Installment purchase payments 7,866,703
The estimated reserve for workers' compensation self-insurance is recordedas a long-term obligation in the district-wide statements. This year the increase in reserve for workers' compensation was $915,239. (915,239)
The estimated cost for terminated employee's healthcare benefits is recordedas a long-term obligation in the district-wide statements. This yearthe decrease in cost for terminated employee's healthcare benefits is $218,135. 104,722
Prepaid expenses use current year financial resources and are reported as an expenditure in the governmental funds. This year, the decrease in prepaid expenses was $84,282. (84,282)
Adjustment due to the use of the consumption method of recording inventory in thedistrict-wide statements. 33,382
Change in net assets of governmental activities 80,053,578$
The notes to the basic financial statements are an integral part of this statement.
WAKE COUNTY BOARD OF EDUCATIONRECONCILIATION OF THE GOVERNMENTAL FUNDS STATEMENT OF REVENUES, EXPENDITURESAND CHANGES IN FUND BALANCE WITH THE GOVERNMENT-WIDE STATEMENT OF ACTIVITIES
YEAR ENDED JUNE 30, 2011
17
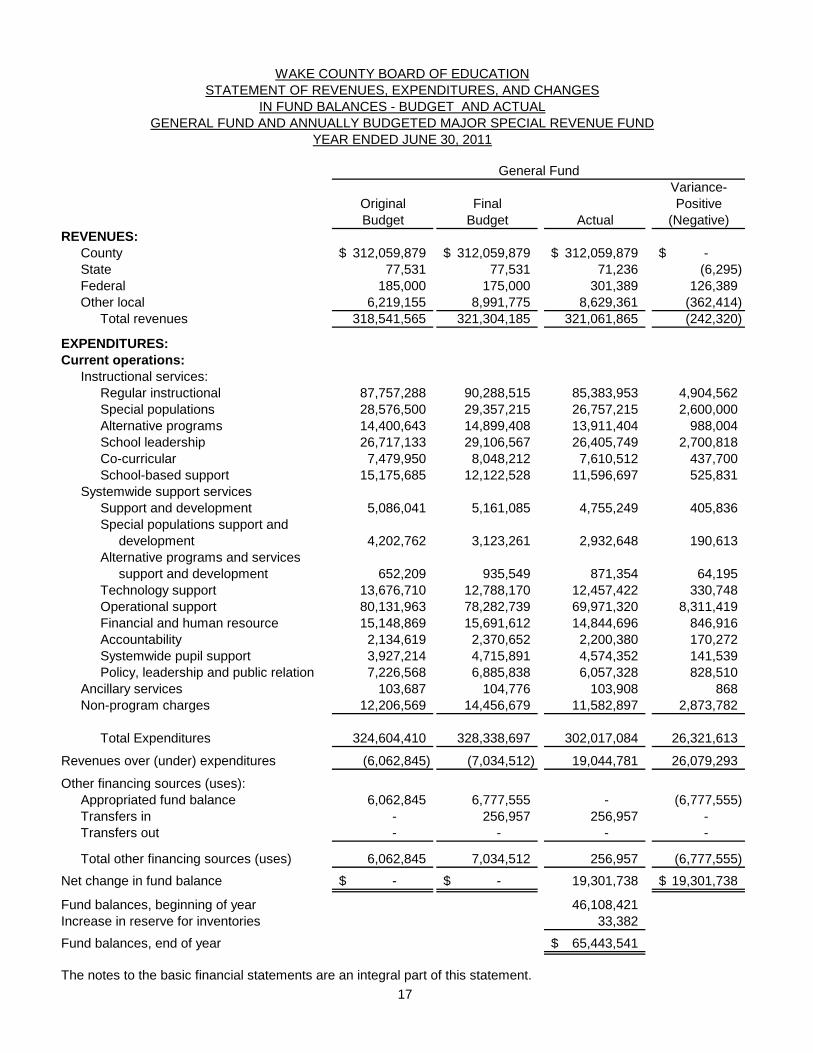
Variance-Original Final PositiveBudget Budget Actual (Negative)
REVENUES:County 312,059,879$ 312,059,879$ 312,059,879$ -$ State 77,531 77,531 71,236 (6,295) Federal 185,000 175,000 301,389 126,389 Other local 6,219,155 8,991,775 8,629,361 (362,414)
Total revenues 318,541,565 321,304,185 321,061,865 (242,320)
EXPENDITURES:Current operations:
Instructional services:Regular instructional 87,757,288 90,288,515 85,383,953 4,904,562 Special populations 28,576,500 29,357,215 26,757,215 2,600,000 Alternative programs 14,400,643 14,899,408 13,911,404 988,004 School leadership 26,717,133 29,106,567 26,405,749 2,700,818 Co-curricular 7,479,950 8,048,212 7,610,512 437,700 School-based support 15,175,685 12,122,528 11,596,697 525,831
Systemwide support services Support and development 5,086,041 5,161,085 4,755,249 405,836 Special populations support and development 4,202,762 3,123,261 2,932,648 190,613 Alternative programs and services support and development 652,209 935,549 871,354 64,195 Technology support 13,676,710 12,788,170 12,457,422 330,748 Operational support 80,131,963 78,282,739 69,971,320 8,311,419 Financial and human resource 15,148,869 15,691,612 14,844,696 846,916 Accountability 2,134,619 2,370,652 2,200,380 170,272 Systemwide pupil support 3,927,214 4,715,891 4,574,352 141,539 Policy, leadership and public relation 7,226,568 6,885,838 6,057,328 828,510
Ancillary services 103,687 104,776 103,908 868 Non-program charges 12,206,569 14,456,679 11,582,897 2,873,782
Total Expenditures 324,604,410 328,338,697 302,017,084 26,321,613
Revenues over (under) expenditures (6,062,845) (7,034,512) 19,044,781 26,079,293
Other financing sources (uses):Appropriated fund balance 6,062,845 6,777,555 - (6,777,555) Transfers in - 256,957 256,957 - Transfers out - - - -
Total other financing sources (uses) 6,062,845 7,034,512 256,957 (6,777,555) Net change in fund balance -$ -$ 19,301,738 19,301,738$
Fund balances, beginning of year 46,108,421 Increase in reserve for inventories 33,382 Fund balances, end of year 65,443,541$
The notes to the basic financial statements are an integral part of this statement.
STATEMENT OF REVENUES, EXPENDITURES, AND CHANGESWAKE COUNTY BOARD OF EDUCATION
General Fund
YEAR ENDED JUNE 30, 2011GENERAL FUND AND ANNUALLY BUDGETED MAJOR SPECIAL REVENUE FUND
IN FUND BALANCES - BUDGET AND ACTUAL
18
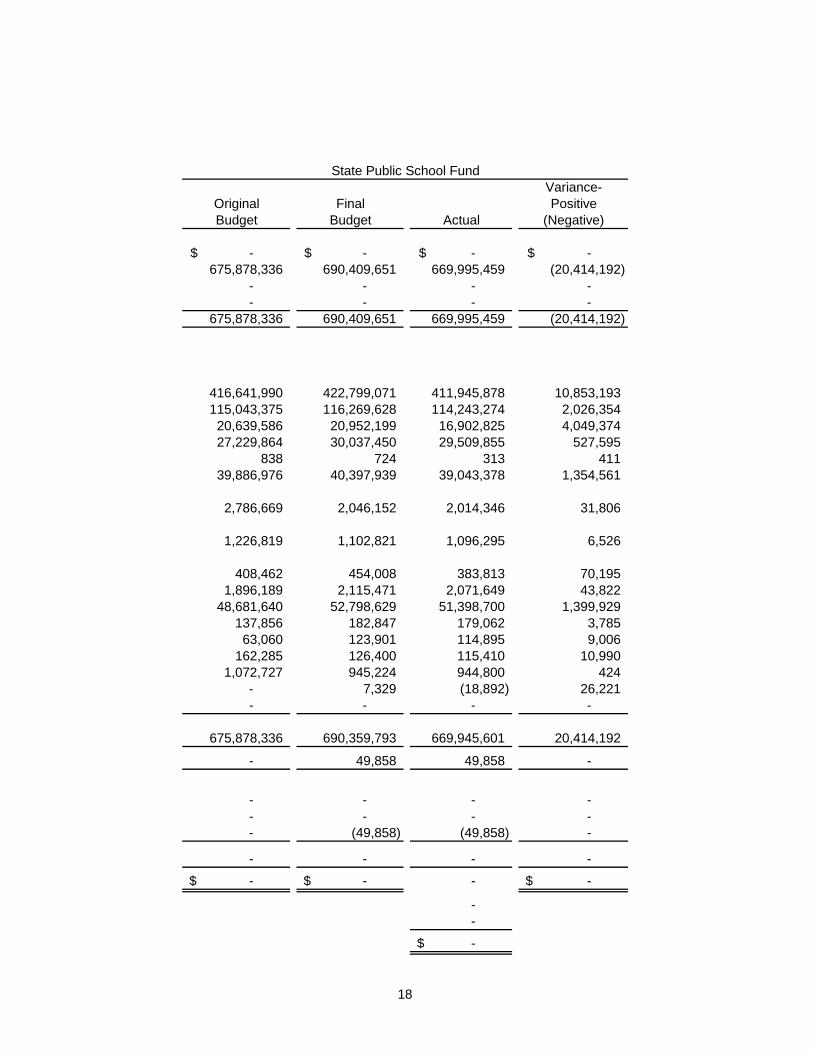
Variance-Original Final PositiveBudget Budget Actual (Negative)
-$ -$ -$ -$ 675,878,336 690,409,651 669,995,459 (20,414,192)
- - - - - - - -
675,878,336 690,409,651 669,995,459 (20,414,192)
416,641,990 422,799,071 411,945,878 10,853,193 115,043,375 116,269,628 114,243,274 2,026,354 20,639,586 20,952,199 16,902,825 4,049,374 27,229,864 30,037,450 29,509,855 527,595
838 724 313 411 39,886,976 40,397,939 39,043,378 1,354,561
2,786,669 2,046,152 2,014,346 31,806
1,226,819 1,102,821 1,096,295 6,526
408,462 454,008 383,813 70,195 1,896,189 2,115,471 2,071,649 43,822
48,681,640 52,798,629 51,398,700 1,399,929 137,856 182,847 179,062 3,785 63,060 123,901 114,895 9,006
162,285 126,400 115,410 10,990 1,072,727 945,224 944,800 424
- 7,329 (18,892) 26,221 - - - -
675,878,336 690,359,793 669,945,601 20,414,192
- 49,858 49,858 -
- - - - - - - - - (49,858) (49,858) -
- - - - -$ -$ - -$
- - -$
State Public School Fund
19
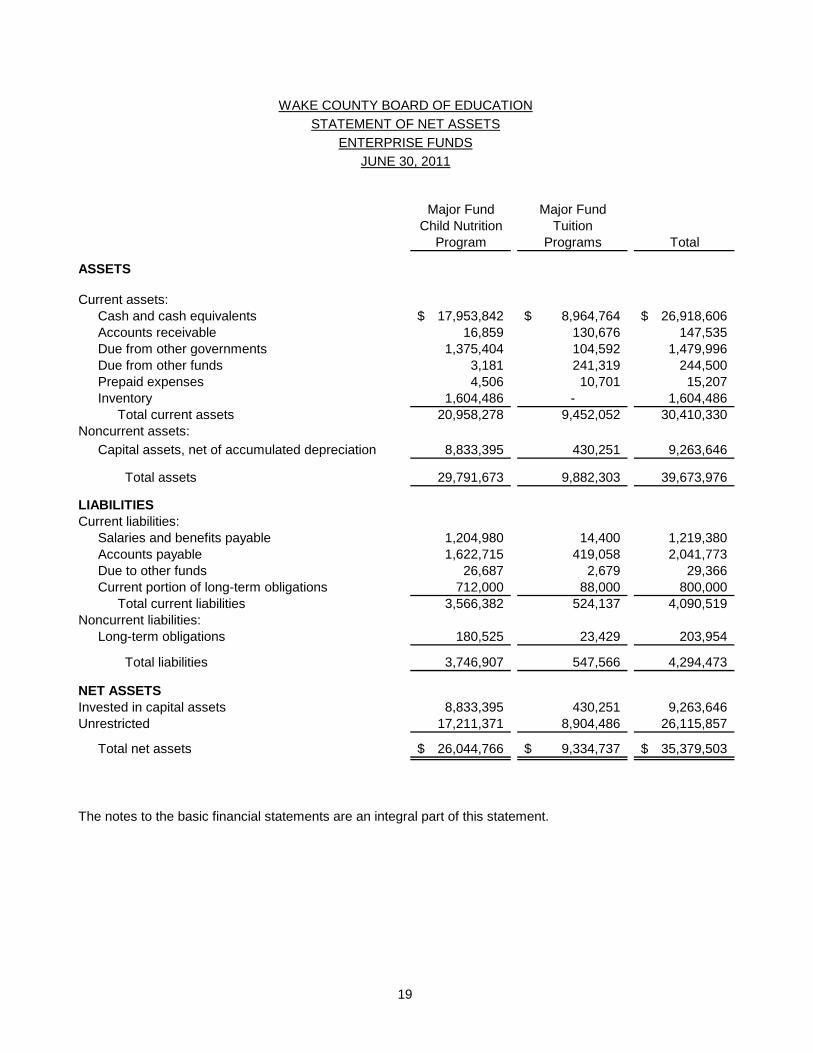
Major Fund Major FundChild Nutrition Tuition
Program Programs Total
ASSETS
Current assets:Cash and cash equivalents 17,953,842$ 8,964,764$ 26,918,606$ Accounts receivable 16,859 130,676 147,535 Due from other governments 1,375,404 104,592 1,479,996 Due from other funds 3,181 241,319 244,500 Prepaid expenses 4,506 10,701 15,207 Inventory 1,604,486 - 1,604,486
Total current assets 20,958,278 9,452,052 30,410,330 Noncurrent assets:
Capital assets, net of accumulated depreciation 8,833,395 430,251 9,263,646
Total assets 29,791,673 9,882,303 39,673,976
LIABILITIESCurrent liabilities:
Salaries and benefits payable 1,204,980 14,400 1,219,380 Accounts payable 1,622,715 419,058 2,041,773 Due to other funds 26,687 2,679 29,366 Current portion of long-term obligations 712,000 88,000 800,000
Total current liabilities 3,566,382 524,137 4,090,519 Noncurrent liabilities:
Long-term obligations 180,525 23,429 203,954
Total liabilities 3,746,907 547,566 4,294,473
NET ASSETSInvested in capital assets 8,833,395 430,251 9,263,646 Unrestricted 17,211,371 8,904,486 26,115,857
Total net assets 26,044,766$ 9,334,737$ 35,379,503$
The notes to the basic financial statements are an integral part of this statement.
JUNE 30, 2011ENTERPRISE FUNDS
STATEMENT OF NET ASSETSWAKE COUNTY BOARD OF EDUCATION
20
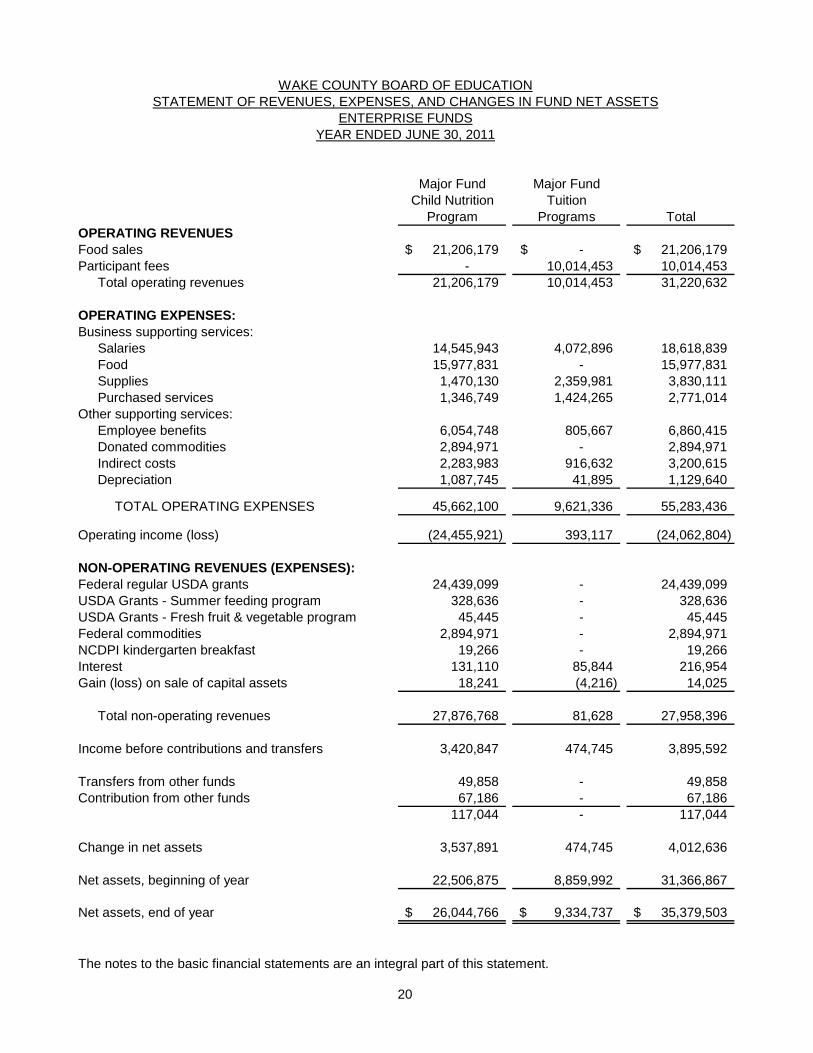
Major Fund Major FundChild Nutrition Tuition
Program Programs TotalOPERATING REVENUES Food sales 21,206,179$ -$ 21,206,179$ Participant fees - 10,014,453 10,014,453
Total operating revenues 21,206,179 10,014,453 31,220,632
OPERATING EXPENSES:Business supporting services:
Salaries 14,545,943 4,072,896 18,618,839 Food 15,977,831 - 15,977,831 Supplies 1,470,130 2,359,981 3,830,111 Purchased services 1,346,749 1,424,265 2,771,014
Other supporting services:Employee benefits 6,054,748 805,667 6,860,415 Donated commodities 2,894,971 - 2,894,971 Indirect costs 2,283,983 916,632 3,200,615 Depreciation 1,087,745 41,895 1,129,640
TOTAL OPERATING EXPENSES 45,662,100 9,621,336 55,283,436
Operating income (loss) (24,455,921) 393,117 (24,062,804)
NON-OPERATING REVENUES (EXPENSES):Federal regular USDA grants 24,439,099 - 24,439,099 USDA Grants - Summer feeding program 328,636 - 328,636 USDA Grants - Fresh fruit & vegetable program 45,445 - 45,445 Federal commodities 2,894,971 - 2,894,971 NCDPI kindergarten breakfast 19,266 - 19,266 Interest 131,110 85,844 216,954 Gain (loss) on sale of capital assets 18,241 (4,216) 14,025
Total non-operating revenues 27,876,768 81,628 27,958,396
Income before contributions and transfers 3,420,847 474,745 3,895,592
Transfers from other funds 49,858 - 49,858 Contribution from other funds 67,186 - 67,186
117,044 - 117,044
Change in net assets 3,537,891 474,745 4,012,636
Net assets, beginning of year 22,506,875 8,859,992 31,366,867
Net assets, end of year 26,044,766$ 9,334,737$ 35,379,503$
The notes to the basic financial statements are an integral part of this statement.
WAKE COUNTY BOARD OF EDUCATIONSTATEMENT OF REVENUES, EXPENSES, AND CHANGES IN FUND NET ASSETS
ENTERPRISE FUNDSYEAR ENDED JUNE 30, 2011
21
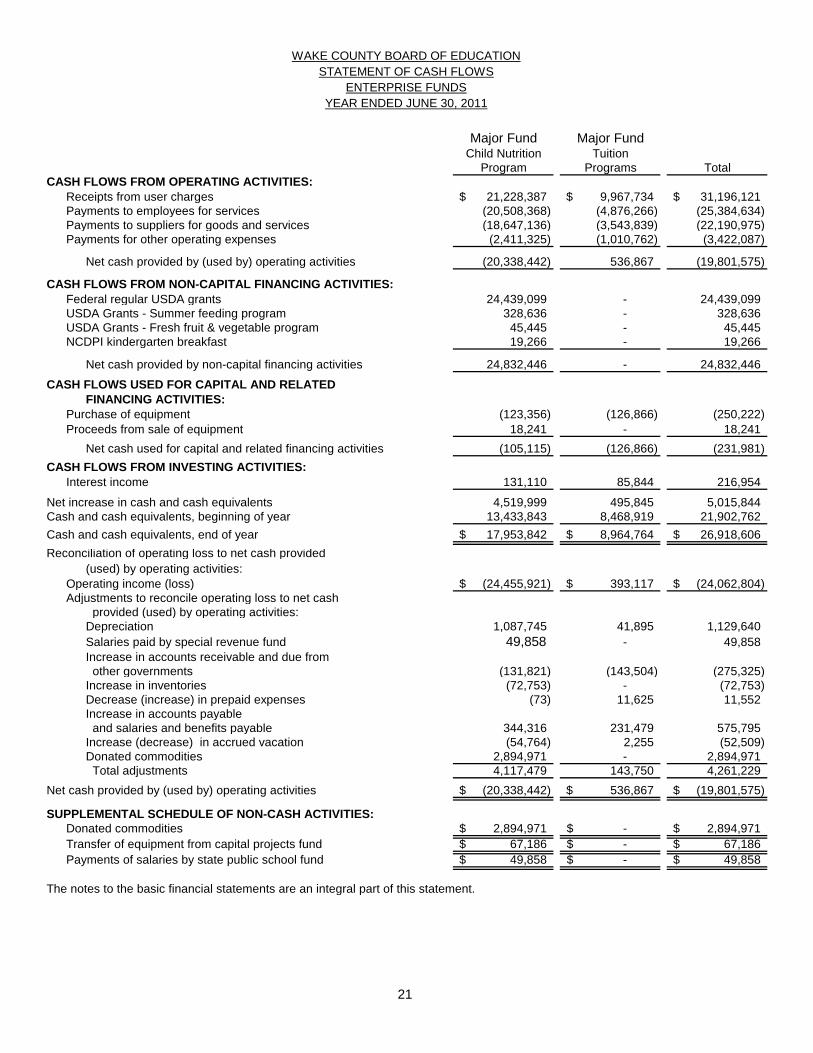
Major Fund Major FundChild Nutrition Tuition
Program Programs TotalCASH FLOWS FROM OPERATING ACTIVITIES:
Receipts from user charges 21,228,387$ 9,967,734$ 31,196,121$ Payments to employees for services (20,508,368) (4,876,266) (25,384,634) Payments to suppliers for goods and services (18,647,136) (3,543,839) (22,190,975) Payments for other operating expenses (2,411,325) (1,010,762) (3,422,087)
Net cash provided by (used by) operating activities (20,338,442) 536,867 (19,801,575)
CASH FLOWS FROM NON-CAPITAL FINANCING ACTIVITIES:Federal regular USDA grants 24,439,099 - 24,439,099 USDA Grants - Summer feeding program 328,636 - 328,636 USDA Grants - Fresh fruit & vegetable program 45,445 - 45,445 NCDPI kindergarten breakfast 19,266 - 19,266
Net cash provided by non-capital financing activities 24,832,446 - 24,832,446
CASH FLOWS USED FOR CAPITAL AND RELATED FINANCING ACTIVITIES:
Purchase of equipment (123,356) (126,866) (250,222) Proceeds from sale of equipment 18,241 - 18,241
Net cash used for capital and related financing activities (105,115) (126,866) (231,981) CASH FLOWS FROM INVESTING ACTIVITIES:
Interest income 131,110 85,844 216,954
Net increase in cash and cash equivalents 4,519,999 495,845 5,015,844 Cash and cash equivalents, beginning of year 13,433,843 8,468,919 21,902,762 Cash and cash equivalents, end of year 17,953,842$ 8,964,764$ 26,918,606$ Reconciliation of operating loss to net cash provided
(used) by operating activities:Operating income (loss) (24,455,921)$ 393,117$ (24,062,804)$ Adjustments to reconcile operating loss to net cash
provided (used) by operating activities:Depreciation 1,087,745 41,895 1,129,640 Salaries paid by special revenue fund 49,858 - 49,858 Increase in accounts receivable and due from other governments (131,821) (143,504) (275,325) Increase in inventories (72,753) - (72,753) Decrease (increase) in prepaid expenses (73) 11,625 11,552 Increase in accounts payable and salaries and benefits payable 344,316 231,479 575,795 Increase (decrease) in accrued vacation (54,764) 2,255 (52,509) Donated commodities 2,894,971 - 2,894,971 Total adjustments 4,117,479 143,750 4,261,229
Net cash provided by (used by) operating activities (20,338,442)$ 536,867$ (19,801,575)$
SUPPLEMENTAL SCHEDULE OF NON-CASH ACTIVITIES:Donated commodities 2,894,971$ -$ 2,894,971$ Transfer of equipment from capital projects fund 67,186$ -$ 67,186$ Payments of salaries by state public school fund 49,858$ -$ 49,858$
The notes to the basic financial statements are an integral part of this statement.
WAKE COUNTY BOARD OF EDUCATIONSTATEMENT OF CASH FLOWS
ENTERPRISE FUNDSYEAR ENDED JUNE 30, 2011
22
Wake County Board of Education
Notes to the Basic Financial Statements
Year Ended June 30, 2011
I.
Summary of Significant Accounting Policies
The accounting policies of The Wake County Board of Education conform to accounting principles generally accepted in the United States of America (GAAP) as applicable to governments. The following is a summary of the more significant accounting policies: A.
Reporting Entity
The Wake County Board of Education (Board) is a Local Education Agency empowered by State law [Chapter 115C of the North Carolina General Statutes] with the responsibility to oversee and control all activities related to public school education in Wake County, North Carolina. Although Wake County levies all taxes, the Board determines how the school system will spend the funds generated for schools. The Board receives state, local, and federal government funding and must adhere to the legal requirements of each funding entity.
B.
Basis of Presentation
Government-wide Statements: The statement of net assets and the statement of activities display information about the Board. These statements include the financial activities of the overall government. Eliminations have been made to minimize the effect of internal activities upon revenues and expenses. Interfund services provided and used are not eliminated in the process of consolidation. These statements distinguish between the governmental and business-type activities of the Board. Governmental activities generally are financed through intergovernmental revenues, and other non-exchange transactions. Business-type activities are financed in whole or in part by fees charged to external parties.
The statement of activities presents a comparison between direct expenses and program revenues for the different business-type activities of the Board and for each function of the Board’s governmental activities. Direct expenses are those that are specifically associated with a program or function and, therefore, are clearly identifiable to a particular function. Indirect expense allocations that have been made in the funds have been reversed for the statement of activities. Program revenues include (a) fees and charges paid by the recipients of goods or services offered by the programs and (b) grants and contributions that are restricted to meeting the operational or capital requirements of a particular program. Revenues that are not classified as program revenues are presented as general revenues.
Fund Financial Statements: The fund financial statements provide information about the Board’s funds. Separate statements for each fund category – governmental and proprietary – are presented. The emphasis of fund financial statements is on major governmental and enterprise funds, each displayed in a separate column. All remaining governmental and enterprise funds are aggregated and reported as non-major funds.
23
Proprietary fund operating revenues, such as charges for services, result from exchange transactions associated with the principal activity of the fund. Exchange transactions are those in which each party receives and gives up essentially equal values. Non-operating revenues, such as subsidies and investment earnings, result from non-exchange transactions or ancillary activities. Operating expenses for enterprise funds include the cost of sales and services, administrative expenses, indirect costs, and depreciation on capital assets. All expenses not meeting this definition are reported as non-operating expenses. The Board reports the following major governmental funds:
General Fund. The General Fund is the general operating fund of the Board. The General Fund accounts for all financial resources except those that are required to be accounted for in another fund. This fund is the “Local Current Expense Fund,” which is mandated by State law [G.S. 115C-426]. State Public School Fund. The State Public School Fund includes appropriations from the Department of Public Instruction for the current operating expenditures of the public school system. Individual Schools Fund. The Individual Schools Fund includes revenues and expenditures of the activity funds of the individual schools. The primary revenue sources include funds held on behalf of various clubs and organizations, receipts from athletic events, and proceeds from various fund raising activities. The primary expenditures are for athletic teams, club programs, activity buses, and instructional needs. Capital Projects Fund. The Capital Projects Fund accounts for financial resources to be used for the acquisition and construction of major capital facilities (other than those financed by proprietary funds and trust funds). It is mandated by State law [G.S.115C-426]. Capital projects are funded by Wake County appropriations, proceeds of Wake County bonds issued for public school construction, as well as certain State assistance. The Board reports the following major enterprise funds: Child Nutrition Fund. The Child Nutrition Fund is used to account for the food service program within the school system. Tuition Programs Fund. The Tuition Programs Fund is used to account for before and after school and other tuition based programs within the school system.
C.
Measurement Focus and Basis of Accounting
Government-wide and Proprietary Fund Financial Statements. The government-wide and proprietary fund financial statements are reported using the economic resources measurement focus and the accrual basis of accounting. Revenues are recorded when earned and expenses are recorded at the time liabilities are incurred, regardless of when the related cash flows take place. Non-exchange transactions, in which the Board gives (or receives) value without directly receiving (or giving) equal value in exchange, includes grants and donations. Revenue from grants and donations is recognized in the fiscal year in which all eligibility requirements have been satisfied.
24
Governmental Fund Financial Statements. Governmental funds are reported using the current financial resources measurement focus and the modified accrual basis of accounting. Under this method, revenues are recognized when measurable and available. The Board considers all revenues reported in the governmental funds to be available if the revenues are collected within sixty days after year-end. These could include federal, state, and county grants, and some charges for services. Expenditures are recorded when the related fund liability is incurred, except for claims and judgments and compensated absences, which are recognized as expenditures to the extent they have matured. General capital asset acquisitions are reported as expenditures in governmental funds. Acquisitions under capital leases are reported as other financing sources. Under the terms of grant agreements, the Board funds certain programs by a combination of specific cost-reimbursement grants and general revenues. Thus, when program expenses are incurred, there are both restricted and unrestricted net assets available to finance the program. It is the Board’s policy to first apply cost-reimbursement grant resources to such programs and then general revenues.
All governmental and business-type activities of the Board follow FASB Statements and Interpretations issued on or before November 30, 1989, Accounting Principles Board Opinions, and Accounting Research Bulletins, unless those pronouncements conflict with GASB pronouncements.
D.
Budgetary Data
The Board’s budgets are adopted as required by the North Carolina General Statutes. Annual budgets are adopted for all funds, except for the individual schools special revenue funds, as required by the North Carolina General Statutes. No budget is required by State law for individual school funds. All appropriations lapse at the fiscal year-end. Budgets are adopted on a basis consistent with GAAP, except for revenues and expenditures of the debt service fund being included in the budget of the capital projects fund and the enterprise fund, which is budgeted on the modified accrual basis. The appropriations in the various funds are formally budgeted and controlled at the functional level. Expenditures may not legally exceed appropriations at the functional level for all of the Board’s funds. Subject to the provisions of the statutes, the Board may amend the budget resolution at any time after its adoption. State law also requires that transfers to or from the capital outlay fund be approved by the Board and the Board of County Commissioners. By resolution of the Board, the superintendent may transfer monies from one appropriation to another within the same fund, subject to certain limitations described below. If such transfers require the Board’s approval, they must be reported at the next subsequent meeting. The superintendent is authorized by the Board to transfer appropriations under the following conditions:
1. The superintendent may not transfer any amounts between funds nor from any
contingency appropriation within a fund without Board approval. 2. The superintendent may transfer amounts between purpose codes and between
functions within a purpose code. A summary of all such transfers must be reported to the Board monthly.
3. The superintendent may transfer any amounts in state and federal projects upon prior approval of the appropriate funding agency. If such transfers require the Board’s approval under other provisions, they must be reported monthly.
25
The superintendent is authorized by the Board to accept appropriations into the budget under the following conditions:
1. The superintendent may accept all state appropriations. A summary of such
appropriations must be reported to the Board monthly. 2. The superintendent may accept federal appropriations if the application for funding has
been approved by the Board. A summary of such appropriations must be reported to the Board monthly.
3. The superintendent may accept categorical program appropriations if the program has been approved by the Board. A summary of such appropriations must be reported to the Board monthly.
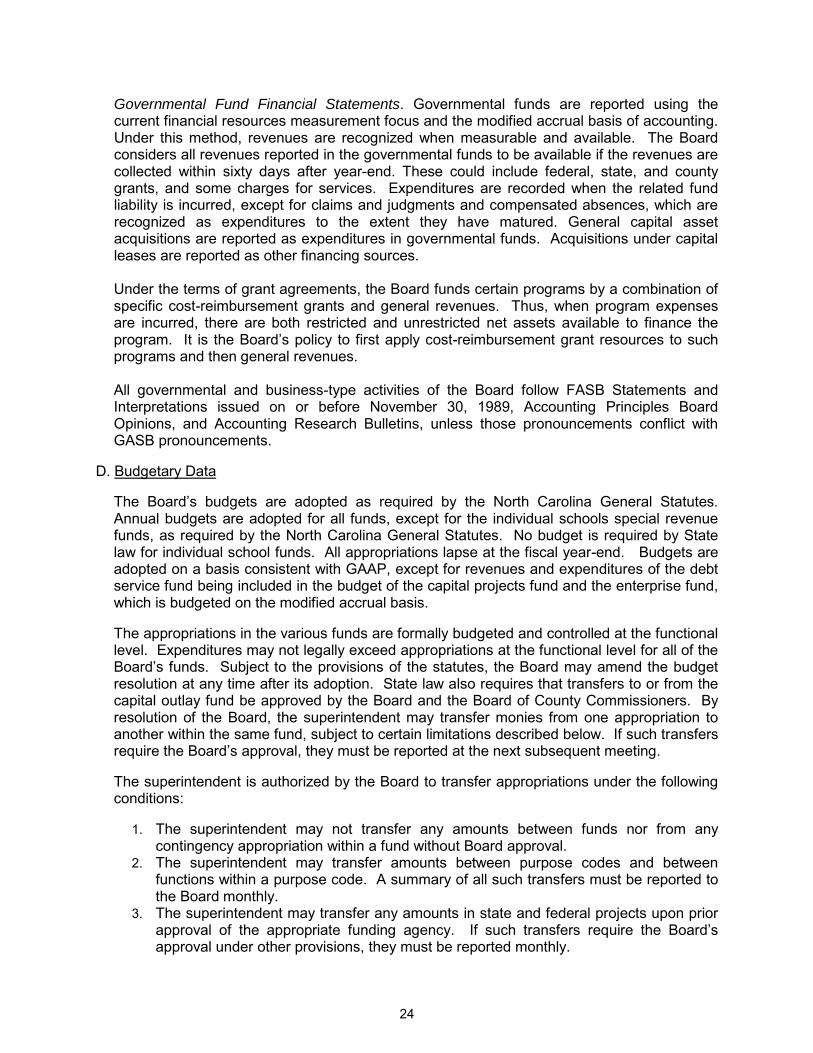
4. The superintendent may accept other appropriations upon prior approval of the Board. During the fiscal year there were budget amendments totaling $193,885,870 approved by the Board as follows:
General fund $ 3,734,283 State public school fund 14,531,316 Grants and other restricted funds 68,952,870 Capital projects funds 105,020,431 Enterprise fund
$ 193,885,870 1,646,970
E.
Assets, Liabilities, and Fund Equity
1.
Deposits and Investments
All deposits of the Board are made in board-designated official depositories and are secured as required by State law [G.S. 115C-444]. The Board may designate, as an official depository, any bank or savings association whose principal office is located in North Carolina. Also, the Board may establish time deposit accounts such as NOW and SuperNOW accounts, money market accounts, and certificates of deposit. The Board also has money credited in its name with the State Treasurer and may issue State warrants against these funds.
State law [G.S. 115C-443] authorizes the Board to invest in obligations of the United States or obligations fully guaranteed both as to principal and interest by the United States; obligations of the State of North Carolina; bonds and notes of any North Carolina local government or public authority; obligations of certain non-guaranteed federal agencies; certain high quality issues of commercial paper and bankers' acceptances; the North Carolina Capital Management Trust (NCCMT), an SEC-registered (2a-7) money market mutual fund; and the North Carolina State Treasurer’s Short Term Investment Fund (STIF). The STIF is managed by the staff of the Department of State Treasurer and operated in accordance with state laws and regulations. It is not registered with the SEC. It consists of an internal portion and an external portion in which the Board participates. Investments are restricted to those enumerated in G.S. 147-69.1.
26
The Board’s investments are reported at fair value as determined by quoted market prices. The NCCMT Cash Portfolio’s securities are valued at fair value, which is the NCCMT’s share price. The STIF securities are reported at cost and maintain a constant $1 per share value. Under the authority of G.S. 147-69.3, no unrealized gains or losses of the STIF are distributed to external participants of the fund. Money market investments that have a remaining maturity at the time of purchase of one year or less are reported at amortized cost. Non-participating interest earning investment contracts are reported at cost.
2.
Cash and Cash Equivalents
The Board pools money from several funds to facilitate disbursement and investment and to maximize investment income. Therefore, all cash and investments are essentially demand deposits and are considered cash and cash equivalents.
3.
Inventories and Prepaid Expenses
The inventories of the Board are valued at cost and the Board uses the first-in, first-out (FIFO) flow assumption in determining cost. The inventories of the Board’s General Fund consist of expendable materials and supplies, which are recorded as expenditures when purchased. The General Fund inventories do not reflect current appropriable resources and, thus, an equivalent portion of fund balance is reserved. Proprietary Fund inventories consist of food and supplies and are recorded as expenses when consumed.
Certain payments to vendors reflect costs applicable to future accounting periods and are recorded as prepaid expenses in the government-wide statements.
4.
Capital Assets
The Board's capital assets are recorded at original cost. Donated assets are listed at their estimated fair value at the date of donation or forfeiture. Improvements are capitalized and depreciated over the remaining useful lives of the related capital assets. Certain items acquired before July 1, 1989 are recorded at an estimated original historical cost. The total of these estimates is not considered large enough that any errors would be material when capital assets are considered as a whole.
It is the policy of the Board to capitalize all capital assets costing more than $5,000 with an estimated useful life of two or more years and all intangibles more than $50,000. The cost of normal maintenance and repairs that do not add to the value of the asset or materially extend asset lives are not capitalized. Wake County holds title to certain properties, which are reflected as capital assets in the financial statements of the Board. The properties have been deeded to the County to permit installment purchase financing of acquisition and construction costs and to permit the County to receive refunds of sales tax paid for construction costs. Agreements between the County and Board give the schools full use of the facilities, full responsibility for maintenance of the facilities, and provides that the County will convey title of the property back to the Board, once all restrictions of the financing agreements and all sales tax reimbursement requirements have been met.
27
Capital assets are depreciated using the straight-line method over the following estimated useful lives:
Governmental Activities
And Tuition Programs
Child Nutrition Program
Years Years Buildings 50 Kitchen and Landscape Equipment 15 12 Furniture 20 20 All Other Equipment 10 10 Vehicles 8 5 Computer equipment 5 6 Land Improvement 20
Land and construction in progress are not depreciated.
Depreciation for building and equipment that serve multiple purposes cannot be allocated ratably and is therefore reported as “unallocated depreciation” on the Statement of Activities.
5.
Long-term Obligations
In the government-wide financial statements, long-term debt and other long-term obligations are reported as liabilities in the applicable governmental activities.
6.
Compensated Absences
The Board follows the State’s policy for vacation and sick leave. Employees may accumulate up to thirty (30) days earned vacation leave with such leave being fully vested when earned. For the Board, the current portion of the accumulated vacation pay is not considered to be material. The Board’s liability for accumulated earned vacation and the salary-related payments as of June 30, 2011 are recorded in the government-wide and proprietary fund financial statements on a LIFO basis. An estimate has been made based on prior years’ records of the current portion of compensated absences.
The sick leave policy of the Board provides for an unlimited accumulation of earned sick leave. Sick leave does not vest, but any unused sick leave accumulated at the time of retirement may be used in the determination of length of service for retirement benefit purposes. Since the Board has no obligation for accumulated sick leave until it is actually taken, no accrual for sick leave has been made.
7.
Net Assets/Fund Balances
Net assets in the government-wide and proprietary fund financial statements are classified as invested in capital assets, net of related debt; restricted; and unrestricted. Restricted net assets represent constraints on resources that are either externally imposed by creditors, grantors, contributors, or the laws or regulations of other governments, or imposed by law through state statute. Fund Balance in the governmental fund financial statements is composed of five classifications designed to disclose the hierarchy of constraints placed on how fund balance can be spent.
28
The governmental fund types classify fund balance as follows: Nonspendable fund balance – This classification includes amounts that cannot be spent because they are either (a) not in spendable form or (b) legally or contractually required to be maintained intact. Inventories – portion of fund balance that is not an available resource because it
represents the year-end balance of ending inventories, which are not spendable resources.
Assets held for resale – portion of fund balance that is not an available resource
because it represents the year-end balance of assets held for resale, which are not spendable resources.
Restricted fund balance – This classification includes amounts that are restricted to specific purposes externally imposed by creditors or imposed by law. Restricted for stabilization by state statute – portion of fund balance that is
restricted by State Statute [G.S. 115C-425(a)]. Restricted for school capital outlay – portion of fund balance that can only be used
for School Capital Outlay. [G.S. 159-18 through 22] Restricted for individual schools – revenue sources restricted for expenditures for
the various clubs and organizations, athletic events, and various fund raising activities for which they were collected.
Restricted contributions – revenue sources that are restricted by the contributor for
specific purposes. Committed fund balance – portion of fund balance that can only be used for specific purpose imposed by majority vote by quorum of Board of Education’s governing body (highest level of decision-making authority) and in certain instances approval by the County’s governing body is required. Any changes or removal of specific purpose requires majority action by the governing bodies that approved the original action. Assigned fund balance – portion of fund balance that Wake County Board of Education intends to use for specific purposes. Subsequent year’s expenditures - portion of fund balance that is appropriated in
the next year’s budget that is not already classified in restricted or committed. The governing body approves the appropriation.
Insurance – portion of fund balance that is assigned for claims in the self-insured
workers compensation and dental plans and for excess claims. Balances are assigned by management and approved by The Board.
Special projects – portion of fund balance that is assigned for special projects that
continue into the next fiscal year. Balances are assigned by management and approved by The Board.
29
Flexible benefits – portion of fund balance that is assigned from prior year’s forfeitures in order to offset potential losses in future years. Balances are assigned by management and approved by The Board.
Unassigned fund balance – the portion of fund balance that has not been restricted, committed, or assigned to specific purposes or other funds. The Superintendent will use resources in the following hierarchy: federal funds, state funds, local non-board of education funds, board of education funds. For purposes of fund balance classification expenditures are to be spent from restricted fund balance first, followed in-order by committed fund balance, assigned fund balance and lastly unassigned fund balance. The Superintendent has the authority to deviate from this policy if it is in the best interest of the Board of Education.
II.
Reconciliation of Government-wide and Fund Financial Statements
A.
Explanation of certain differences between the governmental fund balance sheet and the government-wide statement of net assets.
The governmental fund balance sheet includes a reconciliation between fund balance - total governmental funds and net assets – governmental activities as reported in the government-wide statement of net assets. The net adjustment of $2,516,565,943 consists of several elements as follows:
Description Amount
Capital assets used in governmental activities are not financial resources and are therefore not reported in the funds (total capital assets on government-wide statement in governmental activities column) $ 3,049,988,325 Less accumulated depreciation (461,346,072Net capital assets
)
2,588,642,253
Prepaid expenses use current year financial resources and are reported as an expenditure in the governmental funds 284,713 Liabilities that, because they are not due and payable in the current period, do not require current resources to pay and are therefore not recorded in the fund statements: Workers’ compensation self-insurance (3,733,654) Compensated absences (61,273,915) Termination benefits (117,521) Installment purchase (7,235,933
)
Total adjustments $ 2,516,565,943
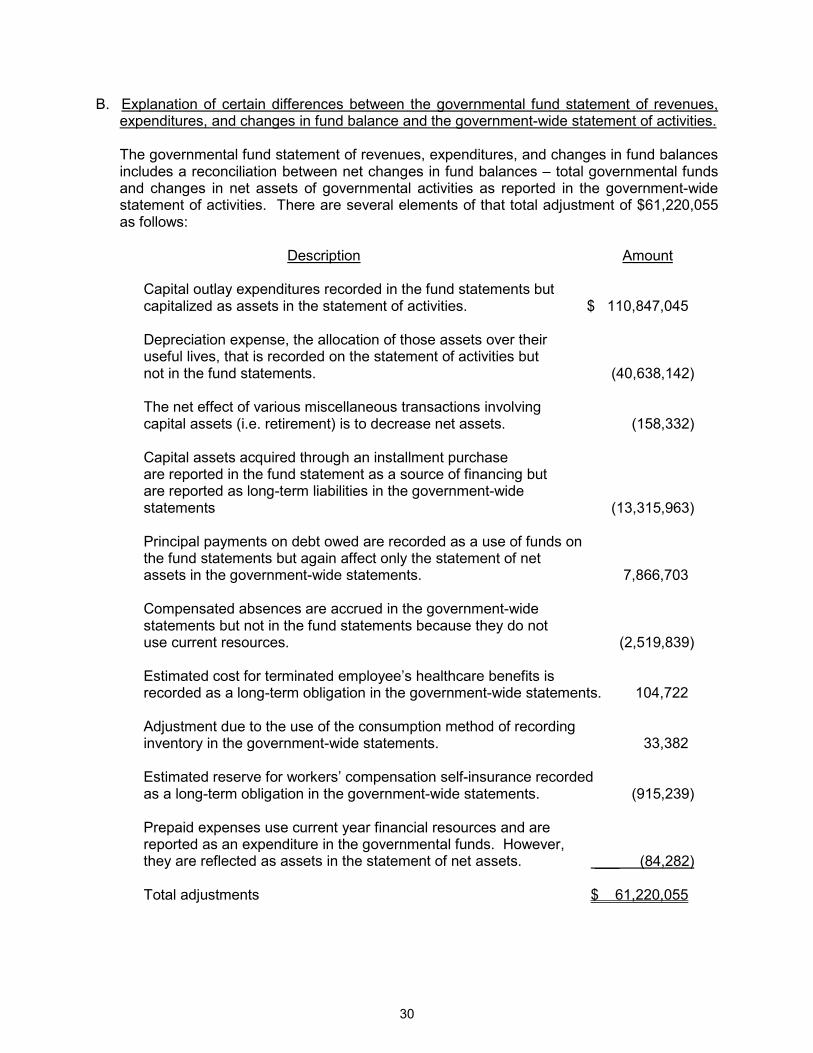
30
B.
Explanation of certain differences between the governmental fund statement of revenues, expenditures, and changes in fund balance and the government-wide statement of activities.
The governmental fund statement of revenues, expenditures, and changes in fund balances includes a reconciliation between net changes in fund balances – total governmental funds and changes in net assets of governmental activities as reported in the government-wide statement of activities. There are several elements of that total adjustment of $61,220,055 as follows:
Description
Amount
Capital outlay expenditures recorded in the fund statements but capitalized as assets in the statement of activities. $ 110,847,045 Depreciation expense, the allocation of those assets over their useful lives, that is recorded on the statement of activities but not in the fund statements. (40,638,142) The net effect of various miscellaneous transactions involving capital assets (i.e. retirement) is to decrease net assets. (158,332) Capital assets acquired through an installment purchase are reported in the fund statement as a source of financing but are reported as long-term liabilities in the government-wide statements (13,315,963) Principal payments on debt owed are recorded as a use of funds on the fund statements but again affect only the statement of net assets in the government-wide statements. 7,866,703 Compensated absences are accrued in the government-wide statements but not in the fund statements because they do not use current resources. (2,519,839) Estimated cost for terminated employee’s healthcare benefits is recorded as a long-term obligation in the government-wide statements. 104,722 Adjustment due to the use of the consumption method of recording inventory in the government-wide statements. 33,382 Estimated reserve for workers’ compensation self-insurance recorded as a long-term obligation in the government-wide statements. (915,239) Prepaid expenses use current year financial resources and are reported as an expenditure in the governmental funds. However, they are reflected as assets in the statement of net assets.
___ (84,282)
Total adjustments $ 61,220,055
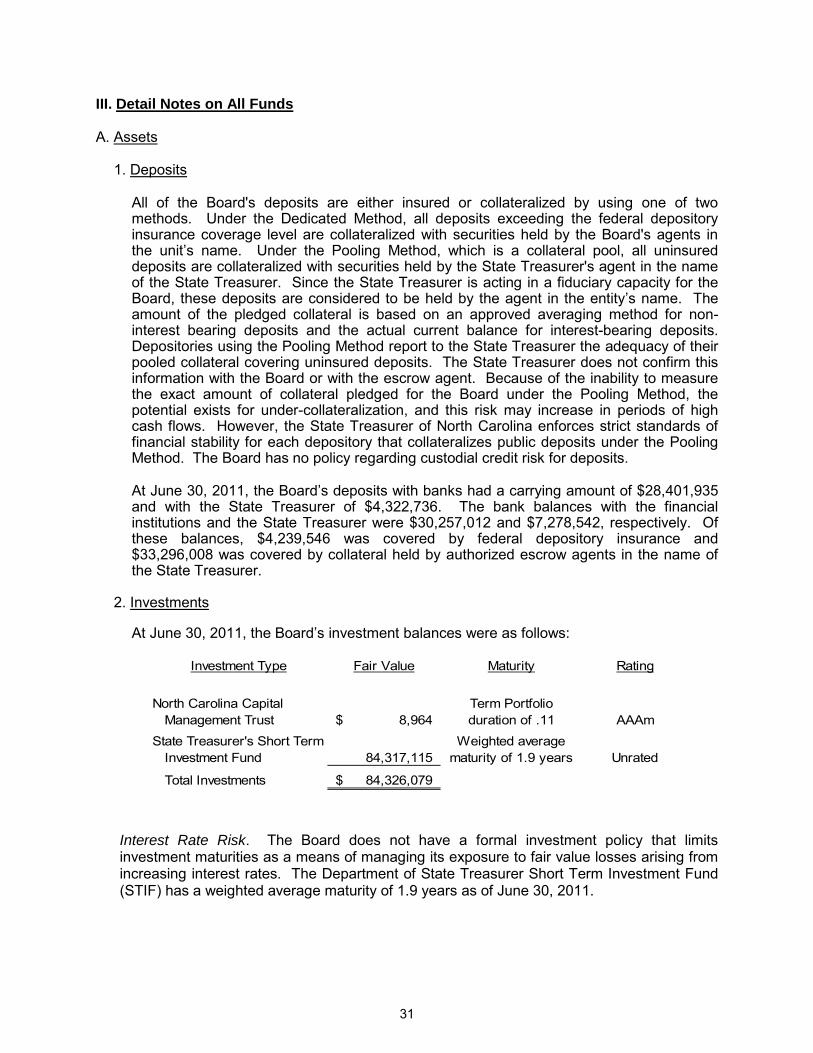
31
III.
Detail Notes on All Funds
A.
Assets
1.
Deposits
All of the Board's deposits are either insured or collateralized by using one of two methods. Under the Dedicated Method, all deposits exceeding the federal depository insurance coverage level are collateralized with securities held by the Board's agents in the unit’s name. Under the Pooling Method, which is a collateral pool, all uninsured deposits are collateralized with securities held by the State Treasurer's agent in the name of the State Treasurer. Since the State Treasurer is acting in a fiduciary capacity for the Board, these deposits are considered to be held by the agent in the entity’s name. The amount of the pledged collateral is based on an approved averaging method for non-interest bearing deposits and the actual current balance for interest-bearing deposits. Depositories using the Pooling Method report to the State Treasurer the adequacy of their pooled collateral covering uninsured deposits. The State Treasurer does not confirm this information with the Board or with the escrow agent. Because of the inability to measure the exact amount of collateral pledged for the Board under the Pooling Method, the potential exists for under-collateralization, and this risk may increase in periods of high cash flows. However, the State Treasurer of North Carolina enforces strict standards of financial stability for each depository that collateralizes public deposits under the Pooling Method. The Board has no policy regarding custodial credit risk for deposits.
At June 30, 2011, the Board’s deposits with banks had a carrying amount of $28,401,935 and with the State Treasurer of $4,322,736. The bank balances with the financial institutions and the State Treasurer were $30,257,012 and $7,278,542, respectively. Of these balances, $4,239,546 was covered by federal depository insurance and $33,296,008 was covered by collateral held by authorized escrow agents in the name of the State Treasurer.
2.
Investments
At June 30, 2011, the Board’s investment balances were as follows:
Interest Rate Risk. The Board does not have a formal investment policy that limits investment maturities as a means of managing its exposure to fair value losses arising from increasing interest rates. The Department of State Treasurer Short Term Investment Fund (STIF) has a weighted average maturity of 1.9 years as of June 30, 2011.
Investment Type Fair Value Maturity Rating
North Carolina Capital Term Portfolio Management Trust 8,964$ duration of .11 AAAmState Treasurer's Short Term Weighted average Investment Fund 84,317,115 maturity of 1.9 years Unrated
Total Investments 84,326,079$
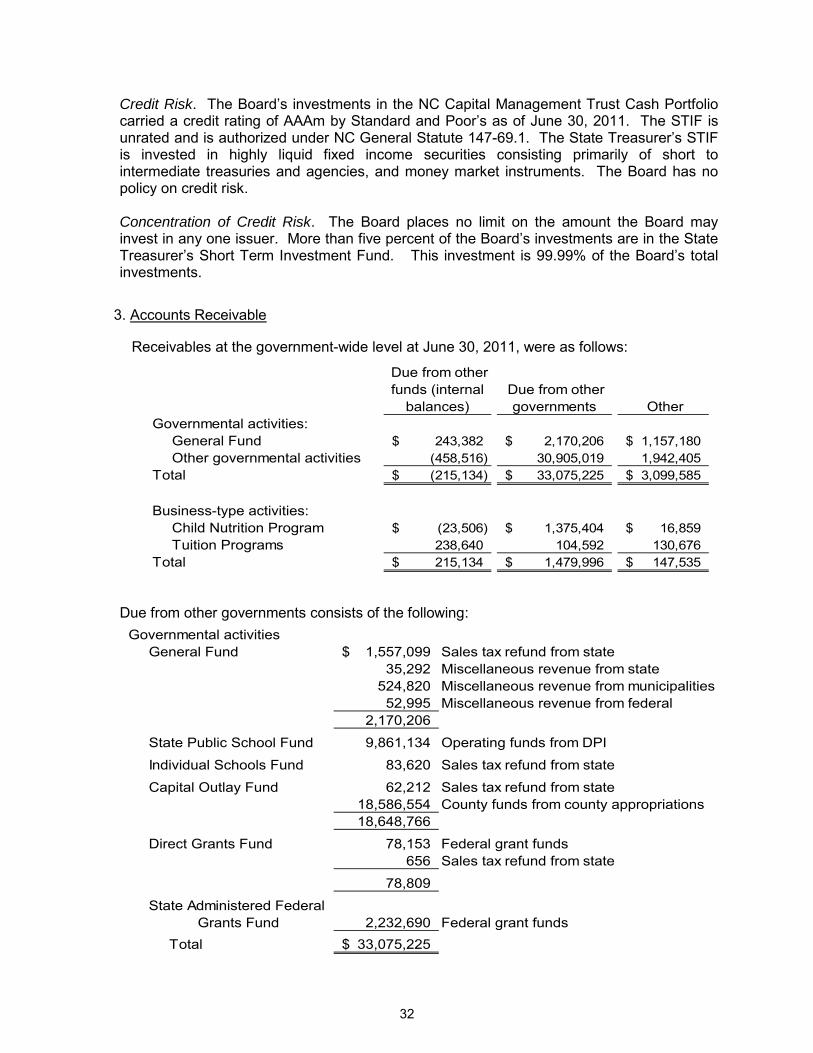
32
Credit Risk. The Board’s investments in the NC Capital Management Trust Cash Portfolio carried a credit rating of AAAm by Standard and Poor’s as of June 30, 2011. The STIF is unrated and is authorized under NC General Statute 147-69.1. The State Treasurer’s STIF is invested in highly liquid fixed income securities consisting primarily of short to intermediate treasuries and agencies, and money market instruments. The Board has no policy on credit risk. Concentration of Credit Risk. The Board places no limit on the amount the Board may invest in any one issuer. More than five percent of the Board’s investments are in the State Treasurer’s Short Term Investment Fund. This investment is 99.99% of the Board’s total investments.
3.
Accounts Receivable
Receivables at the government-wide level at June 30, 2011, were as follows:
Due from other governments consists of the following:
Governmental activitiesGeneral Fund 1,557,099$ Sales tax refund from state
35,292 Miscellaneous revenue from state524,820 Miscellaneous revenue from municipalities52,995 Miscellaneous revenue from federal
2,170,206
State Public School Fund 9,861,134 Operating funds from DPI
Individual Schools Fund 83,620 Sales tax refund from state
Capital Outlay Fund 62,212 Sales tax refund from state18,586,554 County funds from county appropriations18,648,766
Direct Grants Fund 78,153 Federal grant funds656 Sales tax refund from state
78,809
State Administered Federal Grants Fund 2,232,690 Federal grant funds Total 33,075,225$
Due from other funds (internal
balances) Due from other
governments Other Governmental activities:
General Fund 243,382$ 2,170,206$ 1,157,180$ Other governmental activities (458,516) 30,905,019 1,942,405
Total (215,134)$ 33,075,225$ 3,099,585$
Business-type activities:Child Nutrition Program (23,506)$ 1,375,404$ 16,859$ Tuition Programs 238,640 104,592 130,676
Total 215,134$ 1,479,996$ 147,535$
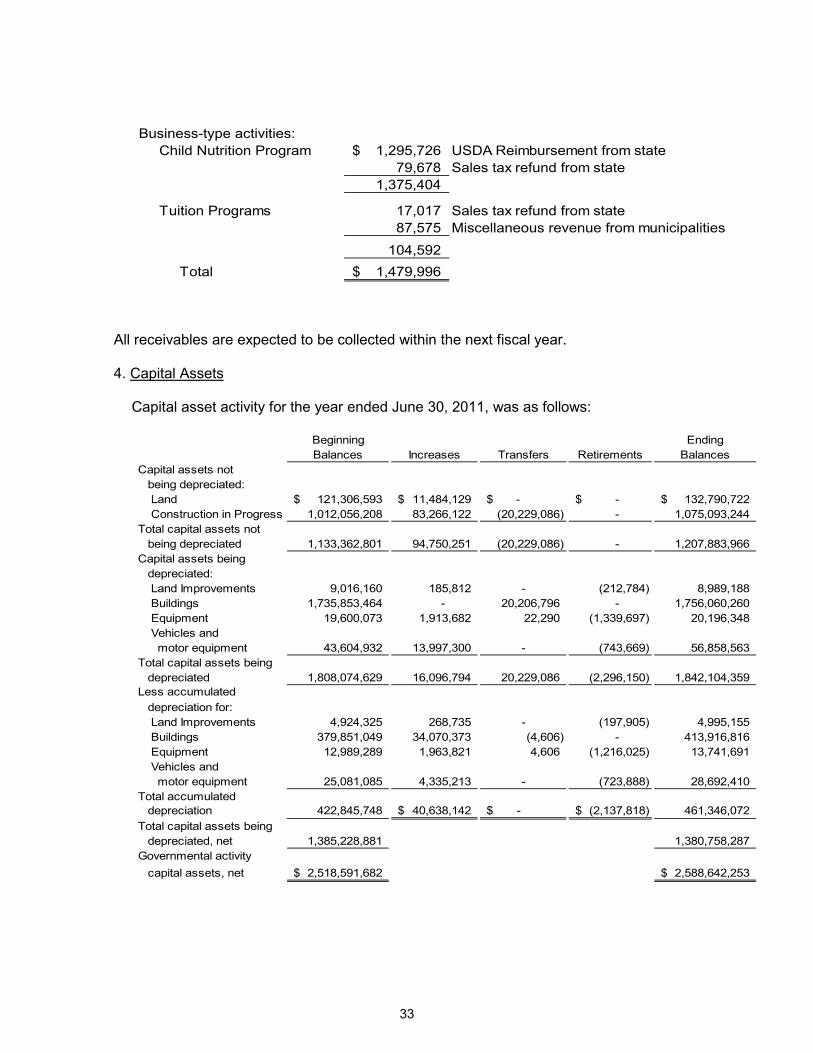
33
All receivables are expected to be collected within the next fiscal year. 4. Capital Assets
Capital asset activity for the year ended June 30, 2011, was as follows:
Beginning EndingBalances Increases Transfers Retirements Balances
Capital assets not being depreciated: Land 121,306,593$ 11,484,129$ $ - -$ 132,790,722$ Construction in Progress 1,012,056,208 83,266,122 (20,229,086) - 1,075,093,244 Total capital assets not being depreciated 1,133,362,801 94,750,251 (20,229,086) - 1,207,883,966 Capital assets being depreciated: Land Improvements 9,016,160 185,812 - (212,784) 8,989,188 Buildings 1,735,853,464 - 20,206,796 - 1,756,060,260 Equipment 19,600,073 1,913,682 22,290 (1,339,697) 20,196,348 Vehicles and motor equipment 43,604,932 13,997,300 - (743,669) 56,858,563 Total capital assets being depreciated 1,808,074,629 16,096,794 20,229,086 (2,296,150) 1,842,104,359 Less accumulated depreciation for: Land Improvements 4,924,325 268,735 - (197,905) 4,995,155 Buildings 379,851,049 34,070,373 (4,606) - 413,916,816 Equipment 12,989,289 1,963,821 4,606 (1,216,025) 13,741,691 Vehicles and motor equipment 25,081,085 4,335,213 - (723,888) 28,692,410 Total accumulated depreciation 422,845,748 40,638,142$ -$ (2,137,818)$ 461,346,072 Total capital assets being depreciated, net 1,385,228,881 1,380,758,287 Governmental activity capital assets, net 2,518,591,682$ 2,588,642,253$
Business-type activities:Child Nutrition Program 1,295,726$ USDA Reimbursement from state
79,678 Sales tax refund from state1,375,404
Tuition Programs 17,017 Sales tax refund from state87,575 Miscellaneous revenue from municipalities
104,592 Total 1,479,996$
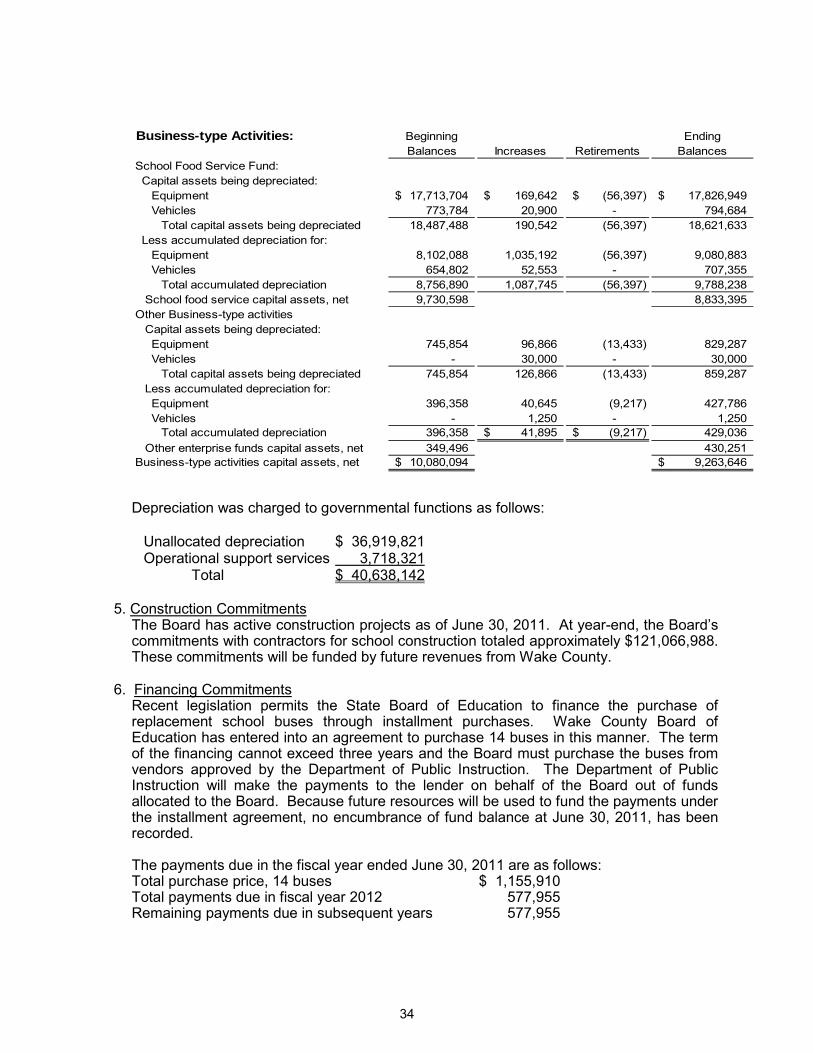
34
Depreciation was charged to governmental functions as follows:
Unallocated depreciation $ 36,919,821 Operational support services 3,718,321 Total $ 40,638,142
5.
The Board has active construction projects as of June 30, 2011. At year-end, the Board’s commitments with contractors for school construction totaled approximately $121,066,988. These commitments will be funded by future revenues from Wake County.
Construction Commitments
6.
Recent legislation permits the State Board of Education to finance the purchase of replacement school buses through installment purchases. Wake County Board of Education has entered into an agreement to purchase 14 buses in this manner. The term of the financing cannot exceed three years and the Board must purchase the buses from vendors approved by the Department of Public Instruction. The Department of Public Instruction will make the payments to the lender on behalf of the Board out of funds allocated to the Board. Because future resources will be used to fund the payments under the installment agreement, no encumbrance of fund balance at June 30, 2011, has been recorded.
Financing Commitments
The payments due in the fiscal year ended June 30, 2011 are as follows: Total purchase price, 14 buses $ 1,155,910 Total payments due in fiscal year 2012 577,955 Remaining payments due in subsequent years 577,955
Business-type Activities: Beginning EndingBalances Increases Retirements Balances
School Food Service Fund: Capital assets being depreciated: Equipment 17,713,704$ 169,642$ (56,397)$ 17,826,949$ Vehicles 773,784 20,900 - 794,684 Total capital assets being depreciated 18,487,488 190,542 (56,397) 18,621,633 Less accumulated depreciation for: Equipment 8,102,088 1,035,192 (56,397) 9,080,883 Vehicles 654,802 52,553 - 707,355 Total accumulated depreciation 8,756,890 1,087,745 (56,397) 9,788,238 School food service capital assets, net 9,730,598 8,833,395 Other Business-type activities Capital assets being depreciated: Equipment 745,854 96,866 (13,433) 829,287 Vehicles - 30,000 - 30,000 Total capital assets being depreciated 745,854 126,866 (13,433) 859,287 Less accumulated depreciation for: Equipment 396,358 40,645 (9,217) 427,786 Vehicles - 1,250 - 1,250 Total accumulated depreciation 396,358 41,895$ (9,217)$ 429,036 Other enterprise funds capital assets, net 349,496 430,251 Business-type activities capital assets, net 10,080,094$ 9,263,646$
35
B.
Liabilities
1.
Pension Plan Obligations and Other Postemployment Obligations
a. Teachers’ and State Employees’ Retirement System
Plan Description. Wake County Board of Education contributes to the statewide Teachers’ and State Employees’ Retirement System (TSERS), a cost-sharing multiple-employer defined benefit pension plan administered by the State of North Carolina. TSERS provides retirement benefits to plan members and beneficiaries. Article 1 of G.S. Chapter 135 assigns the authority to establish and amend benefit provisions to the North Carolina General Assembly. The Teachers’ and State Employees’ Retirement System is included in the Comprehensive Annual Financial Report (CAFR) for the State of North Carolina. The State’s CAFR includes financial statements and required supplementary information for TSERS. That report may be obtained by writing to the Office of the State Controller, 1410 Mail Service Center, Raleigh, North Carolina 27699-1410, or by calling (919) 981-5454.
Funding Policy. Plan members are required to contribute six percent of their annual covered salary and the Board is required to contribute at an actuarially determined rate. The current rate is 10.51% of annual covered payroll. The contribution requirements of plan members and Wake County Board of Education are established and may be amended by the North Carolina General Assembly. The Board’s contributions to TSERS for the years ended June 30, 2011, 2010, and 2009 were $76,807,263, $63,301,626, and $61,350,915, respectively, equal to the required contributions for each year.
b.
Other Postemployment Benefits
1.
Healthcare Benefits
Plan Description. The postemployment healthcare benefits are provided through a cost-sharing multiple-employer defined benefit plan administered by the Executive Administrator and the Board of Trustees of the Comprehensive Major Medical Plan (the Plan). The Executive Administrator and the Board of Trustees of the Plan establishes premium rates except as may be established by the General Assembly in an appropriation act. The Plan’s benefit and contribution provisions are established by Chapter 135-7, Article 1, and Chapter 135, Article 3 of the General Statutes and may be amended only by the North Carolina General Assembly. By General Statute, the Plan accumulates contributions from employers and any earnings on those contributions in the Retiree Health Benefit Fund. These assets shall be used to provide health benefits to retired and disabled employees and their applicable beneficiaries. These contributions are irrevocable. Also by law, these assets are not subject to the claims of creditors of the employers making contributions to the Plan.
The State of North Carolina issues a publicly available financial report that includes financial statements and required supplementary information for the State’s Comprehensive Major Medical Plan (also, referred to as the State Health Plan). An electronic version of this report is available by accessing the North Carolina Office of the State Controller’s Internet home page http://www.ncosc.net/ and clicking on “Financial Reports”, or by calling the State Controller’s Financial Reporting Section at (919) 981-5454.
36
Funding Policy. The Comprehensive Major Medical Plan is administered by the Executive Administrator and Board of Trustees of the Plan, which establish premium rates except as may be established by the General Assembly in an appropriation act. The healthcare benefits for retired and disabled employees are the same as for active employees, except that the coverage becomes secondary when former employees become eligible for Medicare. For employees first hired on and after October 1, 2006, future coverage as retired employees is subject to the requirement that the future retiree have 20 or more years of retirement service credit in order to receive coverage on a noncontributory basis. Employees first hired on and after October 1, 2006 with 10 but less than 20 years of retirement service credit are eligible for coverage on a partially contributory basis. For such future retirees, the State will pay 50% of the State Health Plan’s total noncontributory premium. For employees hired before October 1, 2006, healthcare benefits are provided to retirees (at no charge to the retirees) who have at least five years of contributing retirement membership prior to disability or retirement. In addition, persons who became surviving spouses of retirees prior to October 1, 1986, receive the same coverage as retirees at the State’s expense. Contributions are determined as a percentage of covered monthly payroll. Annually, the monthly contribution rates to the Plan, which are intended to finance benefits and administrative expenses on a pay-as-you-go basis, are determined by the General Assembly in the Appropriations Bill. For the fiscal years ended June 30, 2011, 2010, and 2009, the School Board paid all annual required contributions to the Plan for postemployment healthcare benefits of $35,809,285, $32,803,340, and $30,901,358, respectively. These contributions represented 4.9%, 4.5%, and 4.1% of covered payroll, respectively. 2.
Long-term Disability Benefits
Plan Description. Short-term and long-term disability benefits are provided through the Disability Income Plan of North Carolina (DIPNC), a cost-sharing, multiple-employer defined benefit plan. The DIPNC is administered by the Board of Trustees of the Teachers’ and State Employees’ Retirement System. Long-term disability benefits are payable as an other postemployment benefit from DIPNC after the conclusion of the short-term disability period or after salary continuation payments cease, whichever is later, for as long as an employee is disabled. Benefit and contribution provisions are established by Chapter 135, Article 6, of the General Statutes and may be amended only by the North Carolina General Assembly. The Plan accumulates contributions from employers and any earnings on those contributions in the Disability Income Plan Trust Fund. The plan does not provide for automatic post-retirement benefit increases. The State of North Carolina issues a publicly available financial report that includes financial statements and required supplementary information for the DIPNC. An electronic version of this report is available by accessing the North Carolina Office of the State Controller’s Internet home page http://www.ncosc.net/ and clicking on “Financial Reports”, or by calling the State Controller’s Financial Reporting Section at (919) 981-5454. Funding Policy. An employee is eligible to receive long-term disability benefits provided the following requirements are met: (1) the employee has five or more years of contributing membership service in the Teachers’ and State Employees’ Retirement System of North Carolina, earned within 96 months prior to the end of the short-term disability period or cessation of salary continuation payments, whichever is later; (2) the employee must make application to receive long-term benefits within 180 days after the
37
conclusion of the short-term disability period or after salary continuation payments cease or after monthly payments for Workers’ Compensation cease (excluding monthly payments for permanent partial benefits), whichever is later; (3) the employee must be certified by the Medical Board to be mentally or physically disabled for the further performance of his/her usual occupation; (4) the disability must have been continuous, likely to be permanent, and incurred at the time of active employment; (5) the employee must not be eligible to receive an unreduced retirement benefit from the Retirement System; and (6) the employee must terminate employment as a permanent, full-time employee. An employee is eligible to receive an unreduced retirement benefit from the Retirement System after (1) reaching the age of 65 and completing five years of creditable service, or (2) reaching the age of 60 and completing 25 years of creditable service, or (3) completing 30 years of creditable service, at any age. For members with five or more years of membership service as of July 31, 2007, the monthly long-term disability benefit is equal to 65% of one-twelfth of an employee’s annual base rate of compensation last payable to the participant or beneficiary prior to the beginning of the short-term disability period, plus the like percentage of one twelfth of the annual longevity payment to which the participant or beneficiary would be eligible. The monthly benefits are subject to a maximum of $3,900 per month reduced by any primary Social Security disability benefits and by monthly payments for Workers’ Compensation to which the participant or beneficiary may be entitled. The monthly benefit shall be further reduced by the amount of any monthly payments from the Department of Veterans Affairs, any other federal agency or any payments made under the provisions of G.S. 127A-108, to which the participant or beneficiary may be entitled on account of the same disability. Provided in any event, the benefits payable shall be no less than $10 a month. When an employee qualifies for an unreduced service retirement allowance from the Retirement System, the benefits payable from DIPNC will cease, and the employee will commence retirement under the TSERS. For members who obtain five years of membership service on or after August 1, 2007, the monthly long-term disability benefit is reduced by the primary Social Security retirement benefit to which you might be entitled should you become age 62 during the first 36 months. After 36 months of long-term disability, there will be no further payments from the DIPNC unless the member is approved for and are in receipt of primary Social Security disability benefits. It is payable so long as the member remains disabled and is in receipt of a primary Social Security disability benefit until eligible for an unreduced service retirement benefit. When an employee qualifies for an unreduced service retirement allowance from the Retirement System, the benefits payable from DIPNC will cease, and the employee will commence retirement under the TSERS. The Board’s contributions are established in the Appropriations Bill by the General Assembly. Benefit and contribution provisions are established by Chapter 135, Article 6, of the General Statutes and may be amended only by the North Carolina General Assembly. The contributions cannot be separated between the amounts that relate to other postemployment benefits and employment benefits for active employees. Those individuals who are receiving extended short-term disability benefit payments cannot be separated from the number of members currently eligible to receive disability benefits as an other postemployment benefit. For the fiscal years ended June 30, 2011, 2010, and 2009, the Board paid all annual required contributions to the DIPNC for disability benefits of $3,800,169, $3,790,608, and $3,919,196, respectively. These contributions represented .52%, .52%, and .52% of covered payroll, respectively.
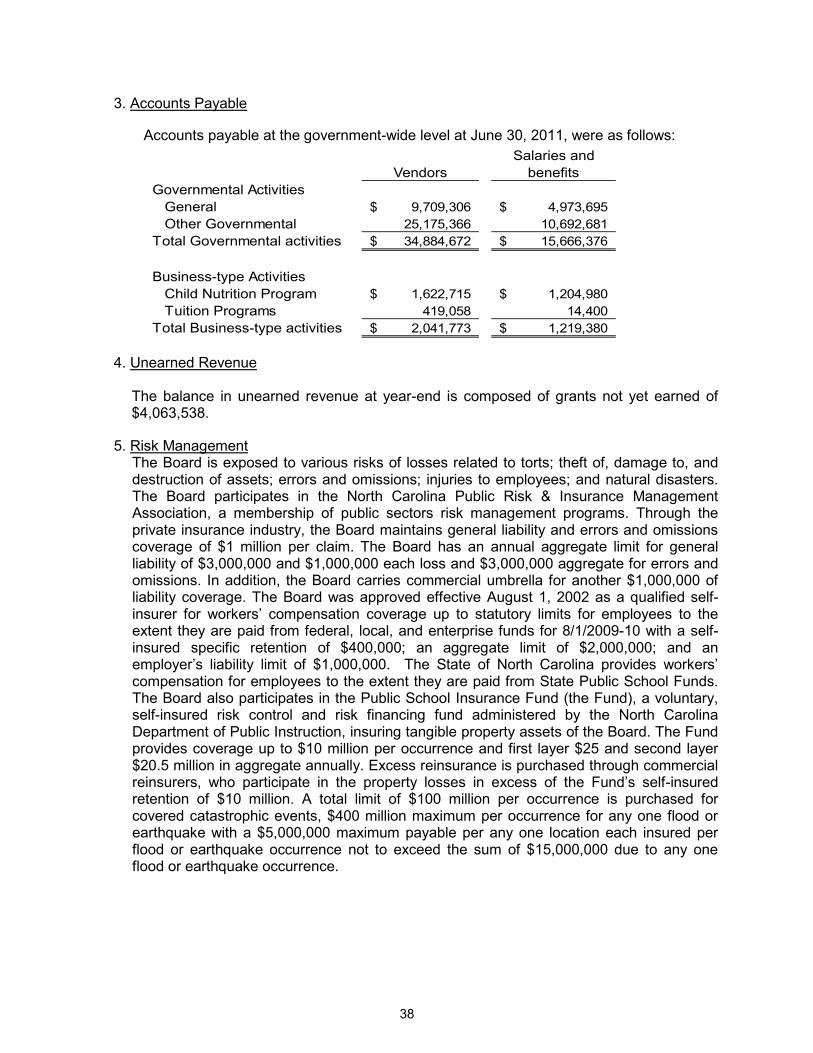
38
3.
Accounts Payable
Accounts payable at the government-wide level at June 30, 2011, were as follows:
4.
Unearned Revenue
The balance in unearned revenue at year-end is composed of grants not yet earned of $4,063,538.
5. The Board is exposed to various risks of losses related to torts; theft of, damage to, and destruction of assets; errors and omissions; injuries to employees; and natural disasters. The Board participates in the North Carolina Public Risk & Insurance Management Association, a membership of public sectors risk management programs. Through the private insurance industry, the Board maintains general liability and errors and omissions coverage of $1 million per claim. The Board has an annual aggregate limit for general liability of $3,000,000 and $1,000,000 each loss and $3,000,000 aggregate for errors and omissions. In addition, the Board carries commercial umbrella for another $1,000,000 of liability coverage. The Board was approved effective August 1, 2002 as a qualified self-insurer for workers’ compensation coverage up to statutory limits for employees to the extent they are paid from federal, local, and enterprise funds for 8/1/2009-10 with a self-insured specific retention of $400,000; an aggregate limit of $2,000,000; and an employer’s liability limit of $1,000,000. The State of North Carolina provides workers’ compensation for employees to the extent they are paid from State Public School Funds. The Board also participates in the Public School Insurance Fund (the Fund), a voluntary, self-insured risk control and risk financing fund administered by the North Carolina Department of Public Instruction, insuring tangible property assets of the Board. The Fund provides coverage up to $10 million per occurrence and first layer $25 and second layer $20.5 million in aggregate annually. Excess reinsurance is purchased through commercial reinsurers, who participate in the property losses in excess of the Fund’s self-insured retention of $10 million. A total limit of $100 million per occurrence is purchased for covered catastrophic events, $400 million maximum per occurrence for any one flood or earthquake with a $5,000,000 maximum payable per any one location each insured per flood or earthquake occurrence not to exceed the sum of $15,000,000 due to any one flood or earthquake occurrence.
Risk Management
Salaries andVendors benefits
Governmental ActivitiesGeneral 9,709,306$ 4,973,695$ Other Governmental 25,175,366 10,692,681
Total Governmental activities 34,884,672$ 15,666,376$
Business-type ActivitiesChild Nutrition Program 1,622,715$ 1,204,980$ Tuition Programs 419,058 14,400
Total Business-type activities 2,041,773$ 1,219,380$
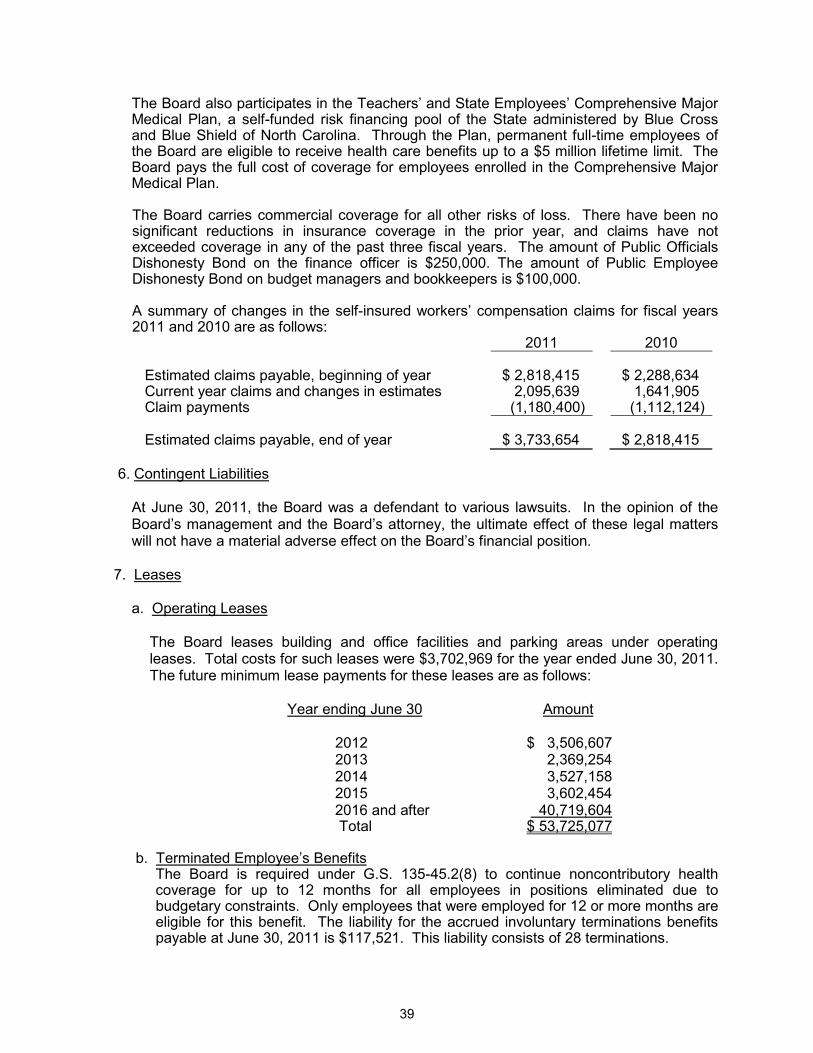
39
The Board also participates in the Teachers’ and State Employees’ Comprehensive Major Medical Plan, a self-funded risk financing pool of the State administered by Blue Cross and Blue Shield of North Carolina. Through the Plan, permanent full-time employees of the Board are eligible to receive health care benefits up to a $5 million lifetime limit. The Board pays the full cost of coverage for employees enrolled in the Comprehensive Major Medical Plan.
The Board carries commercial coverage for all other risks of loss. There have been no significant reductions in insurance coverage in the prior year, and claims have not exceeded coverage in any of the past three fiscal years. The amount of Public Officials Dishonesty Bond on the finance officer is $250,000. The amount of Public Employee Dishonesty Bond on budget managers and bookkeepers is $100,000. A summary of changes in the self-insured workers’ compensation claims for fiscal years 2011 and 2010 are as follows:
2011 2010 Estimated claims payable, beginning of year $ 2,818,415 $ 2,288,634 Current year claims and changes in estimates 2,095,639 1,641,905 Claim payments (1,180,400) (1,112,124) Estimated claims payable, end of year
$ 3,733,654
$ 2,818,415
6.
Contingent Liabilities
At June 30, 2011, the Board was a defendant to various lawsuits. In the opinion of the Board’s management and the Board’s attorney, the ultimate effect of these legal matters will not have a material adverse effect on the Board’s financial position.
7.
Leases
a.
Operating Leases
The Board leases building and office facilities and parking areas under operating leases. Total costs for such leases were $3,702,969 for the year ended June 30, 2011. The future minimum lease payments for these leases are as follows:
Year ending June 30
Amount
2012 $ 3,506,607 2013 2,369,254 2014 3,527,158 2015 3,602,454 2016 and after 40,719,604
Total $ 53,725,077
b.
The Board is required under G.S. 135-45.2(8) to continue noncontributory health coverage for up to 12 months for all employees in positions eliminated due to budgetary constraints. Only employees that were employed for 12 or more months are eligible for this benefit. The liability for the accrued involuntary terminations benefits payable at June 30, 2011 is $117,521. This liability consists of 28 terminations.
Terminated Employee’s Benefits
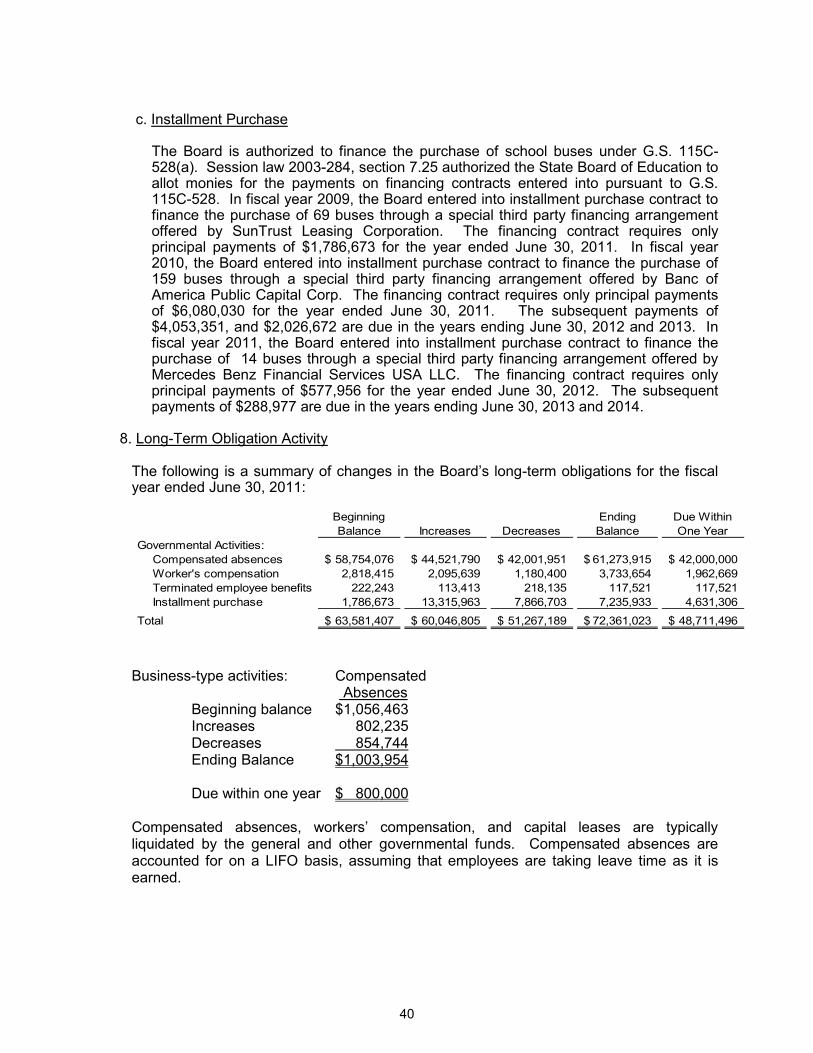
40
c.
Installment Purchase
The Board is authorized to finance the purchase of school buses under G.S. 115C-528(a). Session law 2003-284, section 7.25 authorized the State Board of Education to allot monies for the payments on financing contracts entered into pursuant to G.S. 115C-528. In fiscal year 2009, the Board entered into installment purchase contract to finance the purchase of 69 buses through a special third party financing arrangement offered by SunTrust Leasing Corporation. The financing contract requires only principal payments of $1,786,673 for the year ended June 30, 2011. In fiscal year 2010, the Board entered into installment purchase contract to finance the purchase of 159 buses through a special third party financing arrangement offered by Banc of America Public Capital Corp. The financing contract requires only principal payments of $6,080,030 for the year ended June 30, 2011. The subsequent payments of $4,053,351, and $2,026,672 are due in the years ending June 30, 2012 and 2013. In fiscal year 2011, the Board entered into installment purchase contract to finance the purchase of 14 buses through a special third party financing arrangement offered by Mercedes Benz Financial Services USA LLC. The financing contract requires only principal payments of $577,956 for the year ended June 30, 2012. The subsequent payments of $288,977 are due in the years ending June 30, 2013 and 2014.
8.
Long-Term Obligation Activity
The following is a summary of changes in the Board’s long-term obligations for the fiscal year ended June 30, 2011:
Business-type activities: Compensated Beginning balance $1,056,463
Absences
Increases 802,235 Decreases Ending Balance $1,003,954
854,744
Due within one year $ 800,000 Compensated absences, workers’ compensation, and capital leases are typically liquidated by the general and other governmental funds. Compensated absences are accounted for on a LIFO basis, assuming that employees are taking leave time as it is earned.
Beginning Balance Increases Decreases
Ending Balance
Due Within One Year
Governmental Activities:Compensated absences 58,754,076$ 44,521,790$ 42,001,951$ 61,273,915$ 42,000,000$ Worker's compensation 2,818,415 2,095,639 1,180,400 3,733,654 1,962,669 Terminated employee benefits 222,243 113,413 218,135 117,521 117,521 Installment purchase 1,786,673 13,315,963 7,866,703 7,235,933 4,631,306
Total 63,581,407$ 60,046,805$ 51,267,189$ 72,361,023$ 48,711,496$
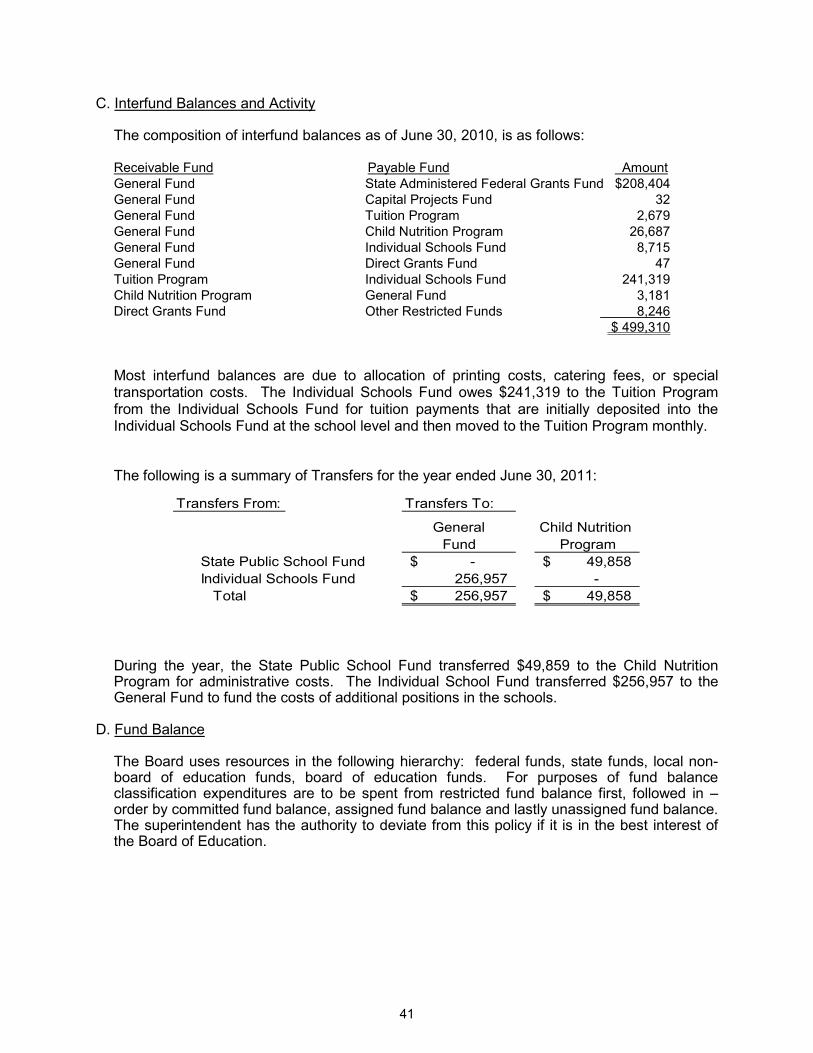
41
C.
Interfund Balances and Activity
The composition of interfund balances as of June 30, 2010, is as follows: Receivable Fund Payable Fund General Fund State Administered Federal Grants Fund $208,404
Amount
General Fund Capital Projects Fund 32 General Fund Tuition Program 2,679 General Fund Child Nutrition Program 26,687 General Fund Individual Schools Fund 8,715 General Fund Direct Grants Fund 47 Tuition Program Individual Schools Fund 241,319 Child Nutrition Program General Fund 3,181 Direct Grants Fund Other Restricted Funds $ 499,310
8,246
Most interfund balances are due to allocation of printing costs, catering fees, or special transportation costs. The Individual Schools Fund owes $241,319 to the Tuition Program from the Individual Schools Fund for tuition payments that are initially deposited into the Individual Schools Fund at the school level and then moved to the Tuition Program monthly.
The following is a summary of Transfers for the year ended June 30, 2011:
During the year, the State Public School Fund transferred $49,859 to the Child Nutrition Program for administrative costs. The Individual School Fund transferred $256,957 to the General Fund to fund the costs of additional positions in the schools.
D.
Fund Balance
The Board uses resources in the following hierarchy: federal funds, state funds, local non-board of education funds, board of education funds. For purposes of fund balance classification expenditures are to be spent from restricted fund balance first, followed in –order by committed fund balance, assigned fund balance and lastly unassigned fund balance. The superintendent has the authority to deviate from this policy if it is in the best interest of the Board of Education.
Transfers From: Transfers To:
General Child Nutrition Fund Program
State Public School Fund -$ 49,858$ Individual Schools Fund 256,957 - Total 256,957$ 49,858$
42
The following schedule provides management and citizens with information on the portion of General fund balance that is available for appropriation.
Total fund balance – General Fund $65,443,541 Less: Inventories 3,503,879 Stabilization by State Statute 3,661,166 Special Projects 366,342 Insurance 6,739,799 Flexible benefit plan 1,094,173 Appropriated Fund balance in 2012 budget
16,203,025
Remaining fund balance $33,875,157 Encumbrances are amounts needed to pay any commitments related to purchase orders and contracts that remain unperformed at year end. Encumbrance balances at year end were: General Fund $87,216 Capital Projects Fund 503,603 IV.
Summary Disclosure of Significant Contingencies
Federal and State Assisted Programs
The Board has received proceeds from several federal and State grants. Periodic audits of these grants are required and certain costs may be questioned as not being appropriate expenditures under the grant agreements. Such audits could result in the refund of grant monies to the grantor agencies. Management believes that any required refunds will be immaterial. No provision has been made in the accompanying financial statements for the refund of grant monies.
Subsequent Events
The Board has evaluated subsequent events through October 31, 2011 in connection with the preparation of these financial statements, which is the date the financial statements were available to be issued.
43
NON-MAJOR FUNDS
Governmental Funds
Special Revenue Funds Special revenue funds are used to account for specific revenues, other than major capital projects, that are legally restricted to expenditure for particular purposes. The non-major special revenue funds include: Direct Grants Fund – The Direct Grants Fund is used to account for grant monies received directly from the grantors. State Administered Federal Grants Fund – The State Administered Federal Grants Fund is used to account for federal grant monies administered through the State Department of Public Instruction. Other Restricted Funds – Other Restricted Funds is used to account for revenues from reimbursements.
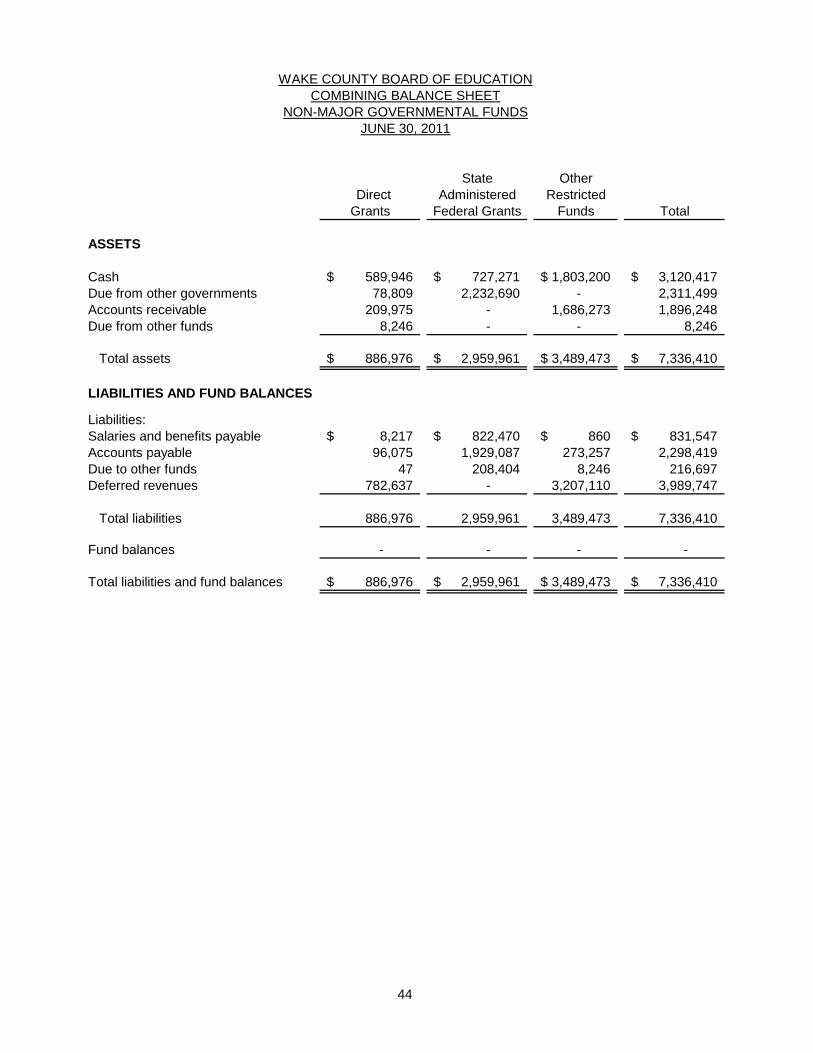
44
WAKE COUNTY BOARD OF EDUCATIONCOMBINING BALANCE SHEET
NON-MAJOR GOVERNMENTAL FUNDSJUNE 30, 2011
State OtherDirect Administered Restricted
Grants Federal Grants Funds Total
ASSETS
Cash 589,946$ 727,271$ 1,803,200$ 3,120,417$ Due from other governments 78,809 2,232,690 - 2,311,499 Accounts receivable 209,975 - 1,686,273 1,896,248 Due from other funds 8,246 - - 8,246
Total assets 886,976$ 2,959,961$ 3,489,473$ 7,336,410$
LIABILITIES AND FUND BALANCES
Liabilities:Salaries and benefits payable 8,217$ 822,470$ 860$ 831,547$ Accounts payable 96,075 1,929,087 273,257 2,298,419 Due to other funds 47 208,404 8,246 216,697 Deferred revenues 782,637 - 3,207,110 3,989,747
Total liabilities 886,976 2,959,961 3,489,473 7,336,410
Fund balances - - - -
Total liabilities and fund balances 886,976$ 2,959,961$ 3,489,473$ 7,336,410$
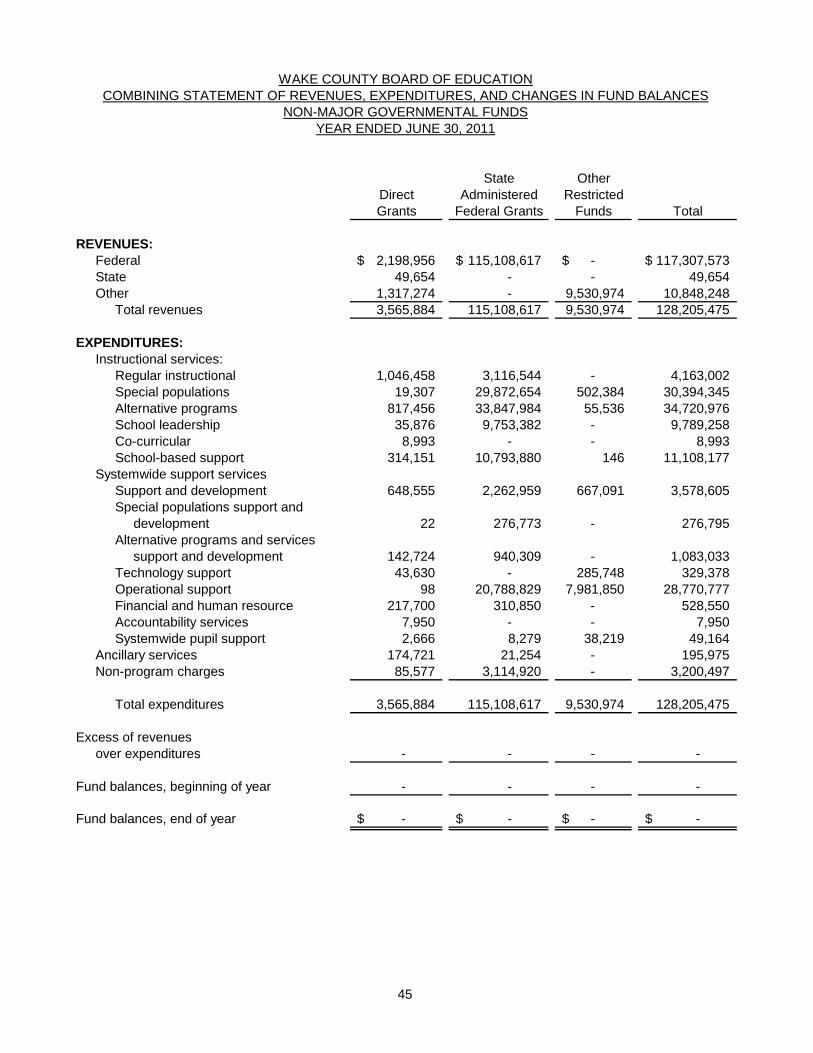
45
State OtherDirect Administered RestrictedGrants Federal Grants Funds Total
REVENUES:Federal 2,198,956$ 115,108,617$ -$ 117,307,573$ State 49,654 - - 49,654 Other 1,317,274 - 9,530,974 10,848,248
Total revenues 3,565,884 115,108,617 9,530,974 128,205,475
EXPENDITURES:Instructional services:
Regular instructional 1,046,458 3,116,544 - 4,163,002 Special populations 19,307 29,872,654 502,384 30,394,345 Alternative programs 817,456 33,847,984 55,536 34,720,976 School leadership 35,876 9,753,382 - 9,789,258 Co-curricular 8,993 - - 8,993 School-based support 314,151 10,793,880 146 11,108,177
Systemwide support servicesSupport and development 648,555 2,262,959 667,091 3,578,605 Special populations support and development 22 276,773 - 276,795 Alternative programs and services support and development 142,724 940,309 - 1,083,033 Technology support 43,630 - 285,748 329,378 Operational support 98 20,788,829 7,981,850 28,770,777 Financial and human resource 217,700 310,850 - 528,550 Accountability services 7,950 - - 7,950 Systemwide pupil support 2,666 8,279 38,219 49,164
Ancillary services 174,721 21,254 - 195,975 Non-program charges 85,577 3,114,920 - 3,200,497
Total expenditures 3,565,884 115,108,617 9,530,974 128,205,475
Excess of revenuesover expenditures - - - -
Fund balances, beginning of year - - - -
Fund balances, end of year -$ -$ -$ -$
YEAR ENDED JUNE 30, 2011
WAKE COUNTY BOARD OF EDUCATIONCOMBINING STATEMENT OF REVENUES, EXPENDITURES, AND CHANGES IN FUND BALANCES
NON-MAJOR GOVERNMENTAL FUNDS
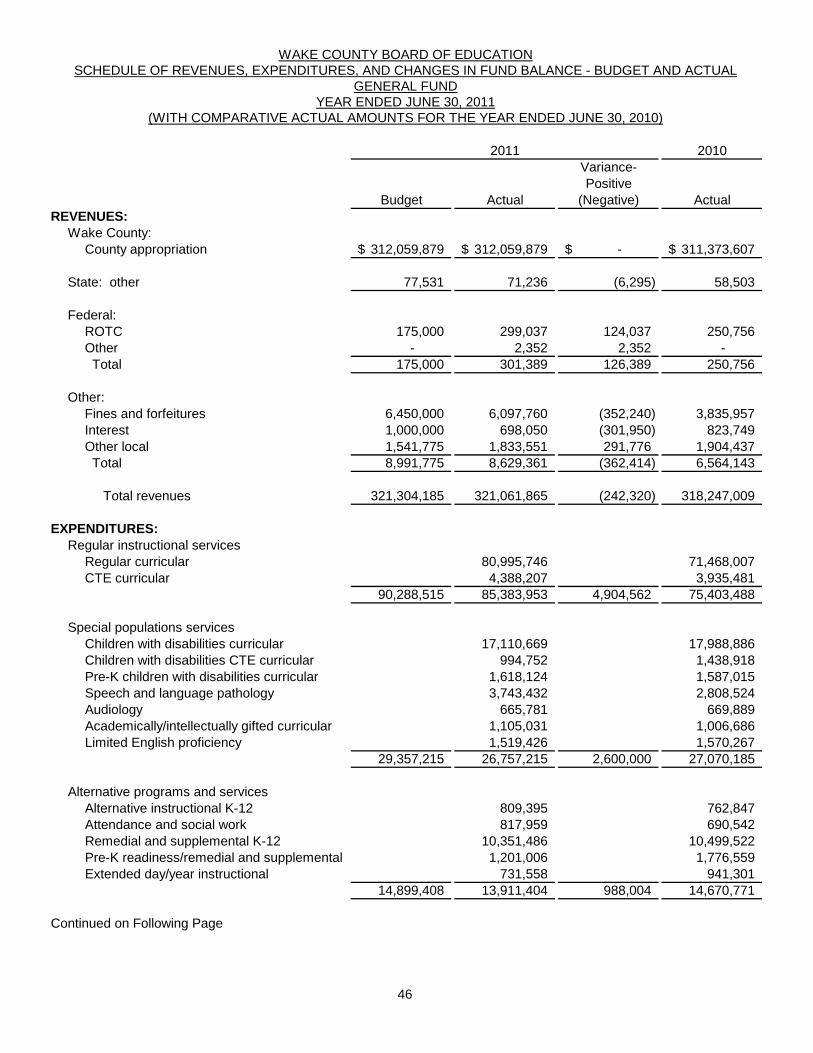
46
2010Variance-Positive
Budget Actual (Negative) ActualREVENUES: Wake County:
County appropriation 312,059,879$ 312,059,879$ -$ 311,373,607$
State: other 77,531 71,236 (6,295) 58,503
Federal:ROTC 175,000 299,037 124,037 250,756 Other - 2,352 2,352 - Total 175,000 301,389 126,389 250,756
Other:Fines and forfeitures 6,450,000 6,097,760 (352,240) 3,835,957 Interest 1,000,000 698,050 (301,950) 823,749 Other local 1,541,775 1,833,551 291,776 1,904,437 Total 8,991,775 8,629,361 (362,414) 6,564,143
Total revenues 321,304,185 321,061,865 (242,320) 318,247,009
EXPENDITURES:Regular instructional services
Regular curricular 80,995,746 71,468,007 CTE curricular 4,388,207 3,935,481
90,288,515 85,383,953 4,904,562 75,403,488
Special populations servicesChildren with disabilities curricular 17,110,669 17,988,886 Children with disabilities CTE curricular 994,752 1,438,918 Pre-K children with disabilities curricular 1,618,124 1,587,015 Speech and language pathology 3,743,432 2,808,524 Audiology 665,781 669,889 Academically/intellectually gifted curricular 1,105,031 1,006,686 Limited English proficiency 1,519,426 1,570,267
29,357,215 26,757,215 2,600,000 27,070,185
Alternative programs and servicesAlternative instructional K-12 809,395 762,847 Attendance and social work 817,959 690,542 Remedial and supplemental K-12 10,351,486 10,499,522 Pre-K readiness/remedial and supplemental 1,201,006 1,776,559 Extended day/year instructional 731,558 941,301
14,899,408 13,911,404 988,004 14,670,771
Continued on Following Page
(WITH COMPARATIVE ACTUAL AMOUNTS FOR THE YEAR ENDED JUNE 30, 2010)
2011
WAKE COUNTY BOARD OF EDUCATIONSCHEDULE OF REVENUES, EXPENDITURES, AND CHANGES IN FUND BALANCE - BUDGET AND ACTUAL
GENERAL FUNDYEAR ENDED JUNE 30, 2011
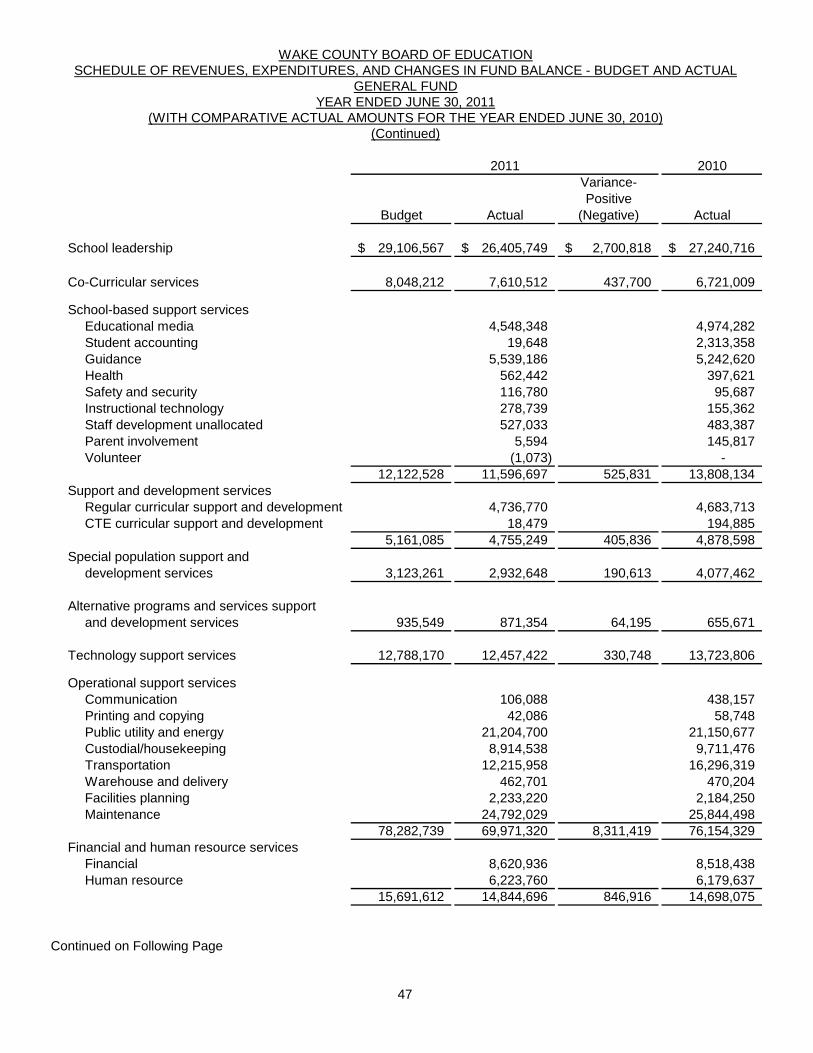
47
2010Variance-Positive
Budget Actual (Negative) Actual
School leadership 29,106,567$ 26,405,749$ 2,700,818$ 27,240,716$
Co-Curricular services 8,048,212 7,610,512 437,700 6,721,009
School-based support servicesEducational media 4,548,348 4,974,282 Student accounting 19,648 2,313,358 Guidance 5,539,186 5,242,620 Health 562,442 397,621 Safety and security 116,780 95,687 Instructional technology 278,739 155,362 Staff development unallocated 527,033 483,387 Parent involvement 5,594 145,817 Volunteer (1,073) -
12,122,528 11,596,697 525,831 13,808,134 Support and development services
Regular curricular support and development 4,736,770 4,683,713 CTE curricular support and development 18,479 194,885
5,161,085 4,755,249 405,836 4,878,598 Special population support and
development services 3,123,261 2,932,648 190,613 4,077,462
Alternative programs and services supportand development services 935,549 871,354 64,195 655,671
Technology support services 12,788,170 12,457,422 330,748 13,723,806
Operational support servicesCommunication 106,088 438,157 Printing and copying 42,086 58,748 Public utility and energy 21,204,700 21,150,677 Custodial/housekeeping 8,914,538 9,711,476 Transportation 12,215,958 16,296,319 Warehouse and delivery 462,701 470,204 Facilities planning 2,233,220 2,184,250 Maintenance 24,792,029 25,844,498
78,282,739 69,971,320 8,311,419 76,154,329 Financial and human resource services
Financial 8,620,936 8,518,438 Human resource 6,223,760 6,179,637
15,691,612 14,844,696 846,916 14,698,075
Continued on Following Page
2011
(WITH COMPARATIVE ACTUAL AMOUNTS FOR THE YEAR ENDED JUNE 30, 2010)
WAKE COUNTY BOARD OF EDUCATIONSCHEDULE OF REVENUES, EXPENDITURES, AND CHANGES IN FUND BALANCE - BUDGET AND ACTUAL
GENERAL FUNDYEAR ENDED JUNE 30, 2011
(Continued)
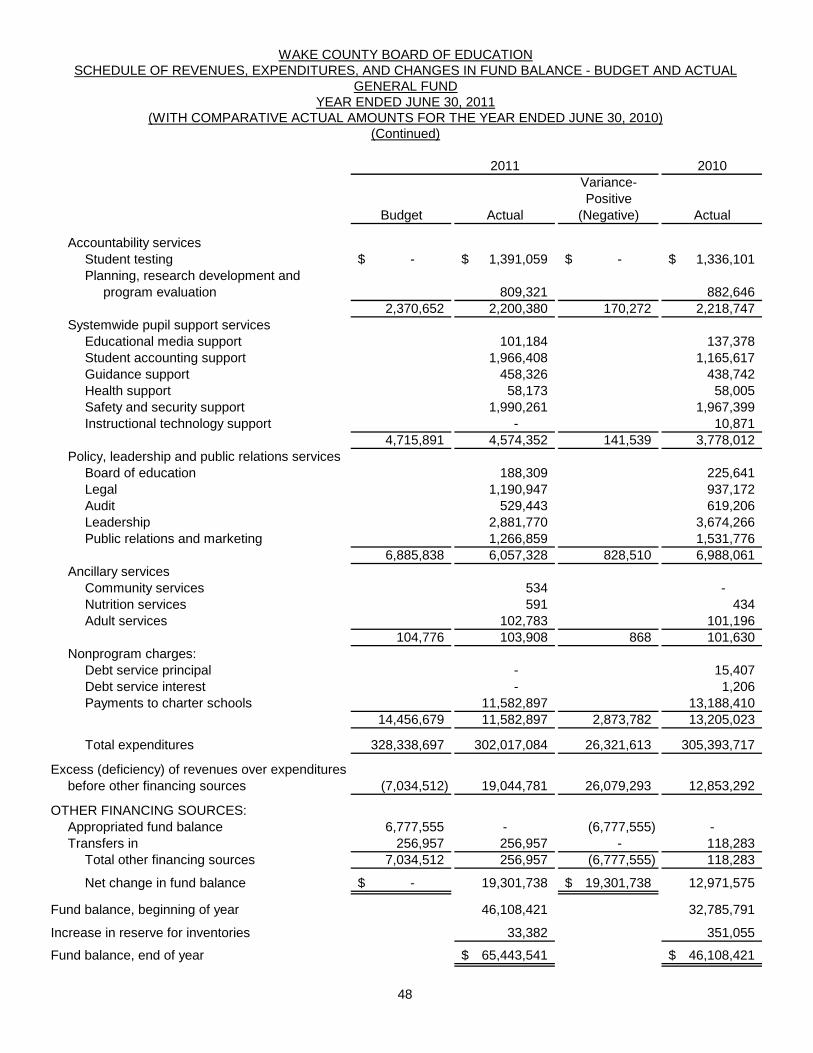
48
2010Variance-Positive
Budget Actual (Negative) Actual
Accountability servicesStudent testing -$ 1,391,059$ -$ 1,336,101$ Planning, research development and program evaluation 809,321 882,646
2,370,652 2,200,380 170,272 2,218,747 Systemwide pupil support services
Educational media support 101,184 137,378 Student accounting support 1,966,408 1,165,617 Guidance support 458,326 438,742 Health support 58,173 58,005 Safety and security support 1,990,261 1,967,399 Instructional technology support - 10,871
4,715,891 4,574,352 141,539 3,778,012 Policy, leadership and public relations services
Board of education 188,309 225,641 Legal 1,190,947 937,172 Audit 529,443 619,206 Leadership 2,881,770 3,674,266 Public relations and marketing 1,266,859 1,531,776
6,885,838 6,057,328 828,510 6,988,061 Ancillary services
Community services 534 - Nutrition services 591 434 Adult services 102,783 101,196
104,776 103,908 868 101,630 Nonprogram charges:
Debt service principal - 15,407 Debt service interest - 1,206 Payments to charter schools 11,582,897 13,188,410
14,456,679 11,582,897 2,873,782 13,205,023
Total expenditures 328,338,697 302,017,084 26,321,613 305,393,717
Excess (deficiency) of revenues over expendituresbefore other financing sources (7,034,512) 19,044,781 26,079,293 12,853,292
OTHER FINANCING SOURCES:Appropriated fund balance 6,777,555 - (6,777,555) -Transfers in 256,957 256,957 - 118,283
Total other financing sources 7,034,512 256,957 (6,777,555) 118,283
Net change in fund balance -$ 19,301,738 19,301,738$ 12,971,575
Fund balance, beginning of year 46,108,421 32,785,791
Increase in reserve for inventories 33,382 351,055
Fund balance, end of year 65,443,541$ 46,108,421$
(Continued)(WITH COMPARATIVE ACTUAL AMOUNTS FOR THE YEAR ENDED JUNE 30, 2010)
2011
WAKE COUNTY BOARD OF EDUCATIONSCHEDULE OF REVENUES, EXPENDITURES, AND CHANGES IN FUND BALANCE - BUDGET AND ACTUAL
GENERAL FUNDYEAR ENDED JUNE 30, 2011
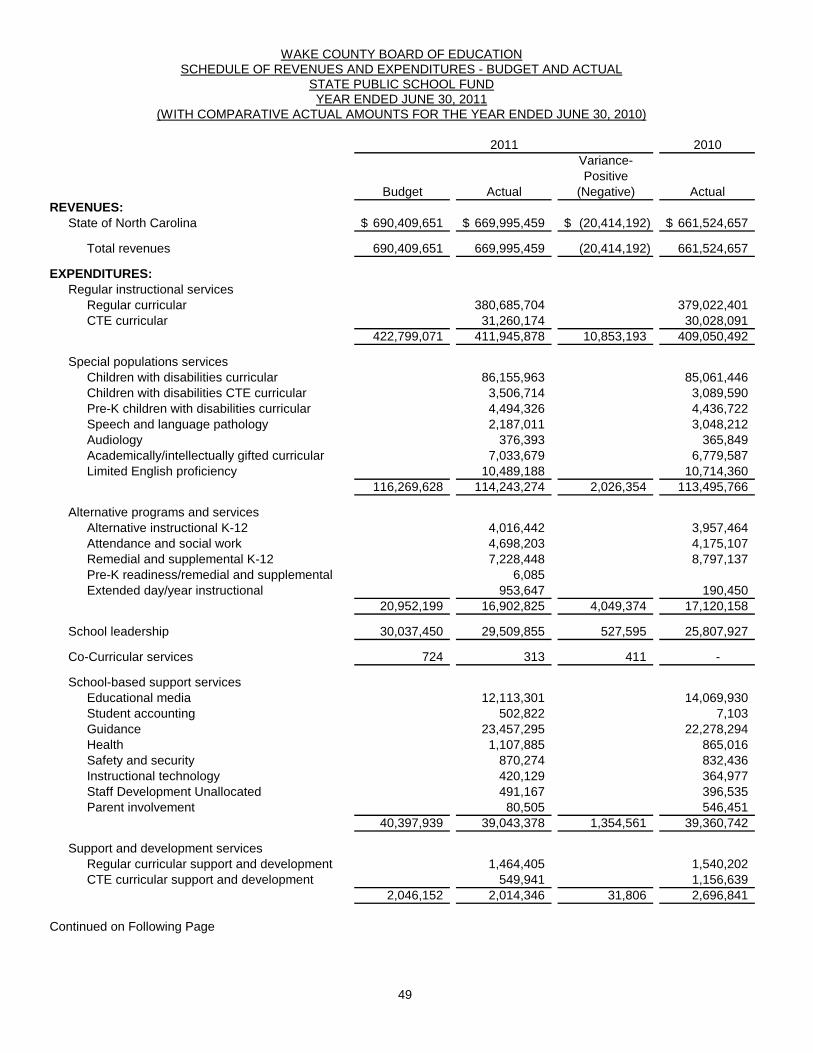
49
2010Variance-Positive
Budget Actual (Negative) ActualREVENUES:
State of North Carolina 690,409,651$ 669,995,459$ (20,414,192)$ 661,524,657$
Total revenues 690,409,651 669,995,459 (20,414,192) 661,524,657
EXPENDITURES:Regular instructional services
Regular curricular 380,685,704 379,022,401 CTE curricular 31,260,174 30,028,091
422,799,071 411,945,878 10,853,193 409,050,492
Special populations servicesChildren with disabilities curricular 86,155,963 85,061,446 Children with disabilities CTE curricular 3,506,714 3,089,590 Pre-K children with disabilities curricular 4,494,326 4,436,722 Speech and language pathology 2,187,011 3,048,212 Audiology 376,393 365,849 Academically/intellectually gifted curricular 7,033,679 6,779,587 Limited English proficiency 10,489,188 10,714,360
116,269,628 114,243,274 2,026,354 113,495,766
Alternative programs and servicesAlternative instructional K-12 4,016,442 3,957,464 Attendance and social work 4,698,203 4,175,107 Remedial and supplemental K-12 7,228,448 8,797,137 Pre-K readiness/remedial and supplemental 6,085 Extended day/year instructional 953,647 190,450
20,952,199 16,902,825 4,049,374 17,120,158
School leadership 30,037,450 29,509,855 527,595 25,807,927
Co-Curricular services 724 313 411 -
School-based support servicesEducational media 12,113,301 14,069,930 Student accounting 502,822 7,103 Guidance 23,457,295 22,278,294 Health 1,107,885 865,016 Safety and security 870,274 832,436 Instructional technology 420,129 364,977 Staff Development Unallocated 491,167 396,535 Parent involvement 80,505 546,451
40,397,939 39,043,378 1,354,561 39,360,742
Support and development servicesRegular curricular support and development 1,464,405 1,540,202 CTE curricular support and development 549,941 1,156,639
2,046,152 2,014,346 31,806 2,696,841
Continued on Following Page
2011
(WITH COMPARATIVE ACTUAL AMOUNTS FOR THE YEAR ENDED JUNE 30, 2010)
WAKE COUNTY BOARD OF EDUCATIONSCHEDULE OF REVENUES AND EXPENDITURES - BUDGET AND ACTUAL
STATE PUBLIC SCHOOL FUNDYEAR ENDED JUNE 30, 2011
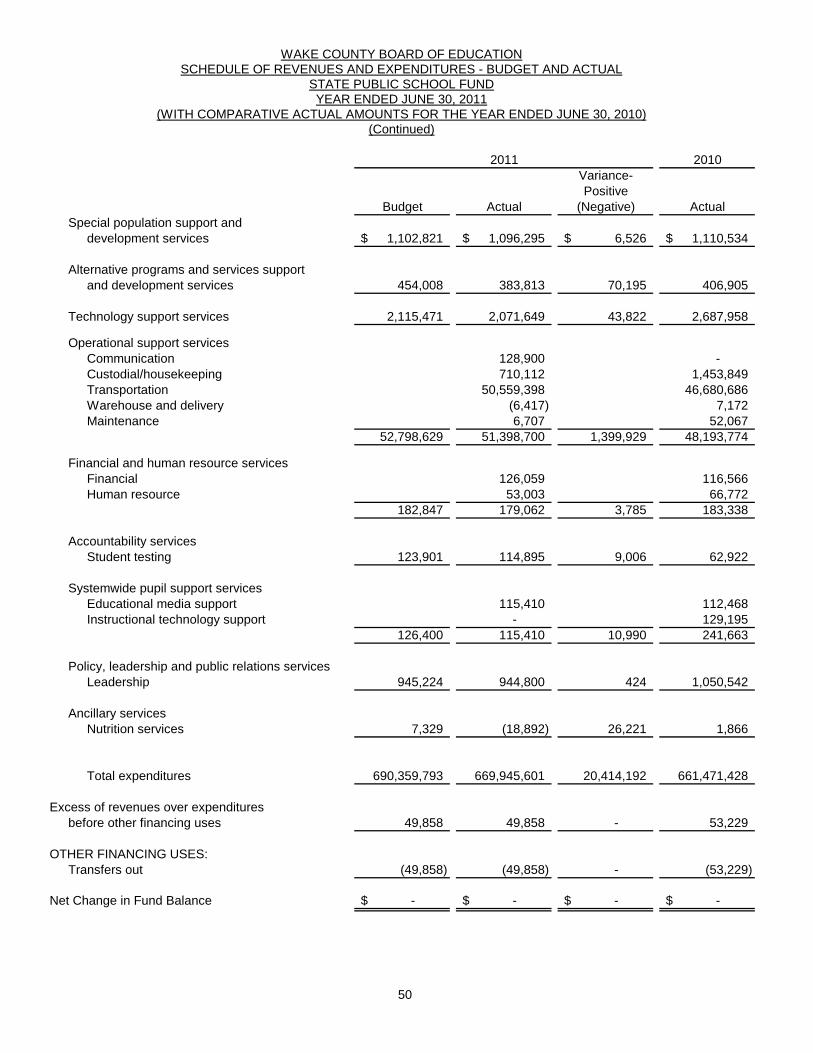
50
2010Variance-Positive
Budget Actual (Negative) ActualSpecial population support and
development services 1,102,821$ 1,096,295$ 6,526$ 1,110,534$
Alternative programs and services supportand development services 454,008 383,813 70,195 406,905
Technology support services 2,115,471 2,071,649 43,822 2,687,958
Operational support servicesCommunication 128,900 - Custodial/housekeeping 710,112 1,453,849 Transportation 50,559,398 46,680,686 Warehouse and delivery (6,417) 7,172 Maintenance 6,707 52,067
52,798,629 51,398,700 1,399,929 48,193,774
Financial and human resource servicesFinancial 126,059 116,566 Human resource 53,003 66,772
182,847 179,062 3,785 183,338
Accountability servicesStudent testing 123,901 114,895 9,006 62,922
Systemwide pupil support servicesEducational media support 115,410 112,468 Instructional technology support - 129,195
126,400 115,410 10,990 241,663
Policy, leadership and public relations servicesLeadership 945,224 944,800 424 1,050,542
Ancillary servicesNutrition services 7,329 (18,892) 26,221 1,866
Total expenditures 690,359,793 669,945,601 20,414,192 661,471,428
Excess of revenues over expendituresbefore other financing uses 49,858 49,858 - 53,229
OTHER FINANCING USES:Transfers out (49,858) (49,858) - (53,229)
Net Change in Fund Balance -$ -$ -$ -$
(WITH COMPARATIVE ACTUAL AMOUNTS FOR THE YEAR ENDED JUNE 30, 2010)(Continued)
2011
WAKE COUNTY BOARD OF EDUCATIONSCHEDULE OF REVENUES AND EXPENDITURES - BUDGET AND ACTUAL
STATE PUBLIC SCHOOL FUNDYEAR ENDED JUNE 30, 2011
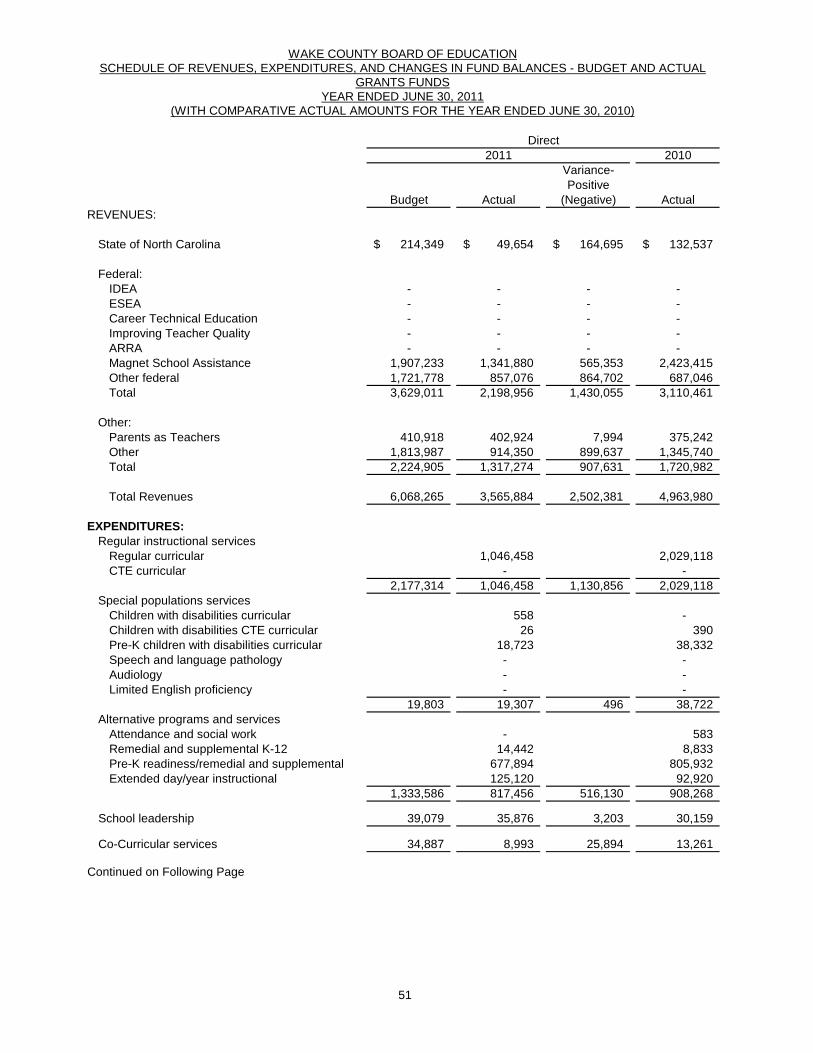
51
2011 2010Variance-Positive
Budget Actual (Negative) ActualREVENUES:
State of North Carolina 214,349$ 49,654$ 164,695$ 132,537$
Federal:IDEA - - - -ESEA - - - -Career Technical Education - - - -Improving Teacher Quality - - - -ARRA - - - -Magnet School Assistance 1,907,233 1,341,880 565,353 2,423,415Other federal 1,721,778 857,076 864,702 687,046Total 3,629,011 2,198,956 1,430,055 3,110,461
Other:Parents as Teachers 410,918 402,924 7,994 375,242Other 1,813,987 914,350 899,637 1,345,740Total 2,224,905 1,317,274 907,631 1,720,982
Total Revenues 6,068,265 3,565,884 2,502,381 4,963,980
EXPENDITURES:Regular instructional services
Regular curricular 1,046,458 2,029,118 CTE curricular - -
2,177,314 1,046,458 1,130,856 2,029,118 Special populations services
Children with disabilities curricular 558 - Children with disabilities CTE curricular 26 390 Pre-K children with disabilities curricular 18,723 38,332 Speech and language pathology - - Audiology - - Limited English proficiency - -
19,803 19,307 496 38,722 Alternative programs and services
Attendance and social work - 583 Remedial and supplemental K-12 14,442 8,833 Pre-K readiness/remedial and supplemental 677,894 805,932 Extended day/year instructional 125,120 92,920
1,333,586 817,456 516,130 908,268
School leadership 39,079 35,876 3,203 30,159
Co-Curricular services 34,887 8,993 25,894 13,261
Continued on Following Page
(WITH COMPARATIVE ACTUAL AMOUNTS FOR THE YEAR ENDED JUNE 30, 2010)
Direct
WAKE COUNTY BOARD OF EDUCATIONSCHEDULE OF REVENUES, EXPENDITURES, AND CHANGES IN FUND BALANCES - BUDGET AND ACTUAL
GRANTS FUNDSYEAR ENDED JUNE 30, 2011
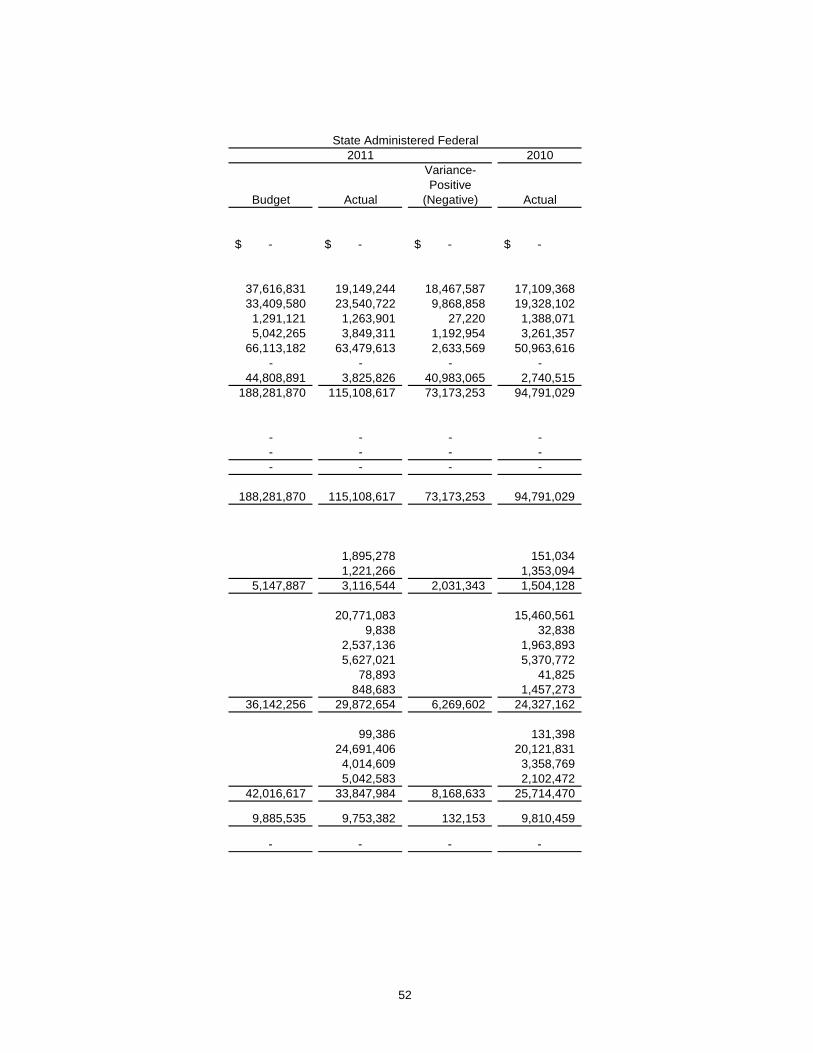
52
2011 2010Variance-Positive
Budget Actual (Negative) Actual
-$ -$ -$ -$
37,616,831 19,149,244 18,467,587 17,109,36833,409,580 23,540,722 9,868,858 19,328,102
1,291,121 1,263,901 27,220 1,388,0715,042,265 3,849,311 1,192,954 3,261,357
66,113,182 63,479,613 2,633,569 50,963,616- - - -
44,808,891 3,825,826 40,983,065 2,740,515188,281,870 115,108,617 73,173,253 94,791,029
- - - -- - - -- - - -
188,281,870 115,108,617 73,173,253 94,791,029
1,895,278 151,034 1,221,266 1,353,094
5,147,887 3,116,544 2,031,343 1,504,128
20,771,083 15,460,561 9,838 32,838
2,537,136 1,963,893 5,627,021 5,370,772
78,893 41,825 848,683 1,457,273
36,142,256 29,872,654 6,269,602 24,327,162
99,386 131,398 24,691,406 20,121,831
4,014,609 3,358,769 5,042,583 2,102,472
42,016,617 33,847,984 8,168,633 25,714,470
9,885,535 9,753,382 132,153 9,810,459
- - - -
State Administered Federal
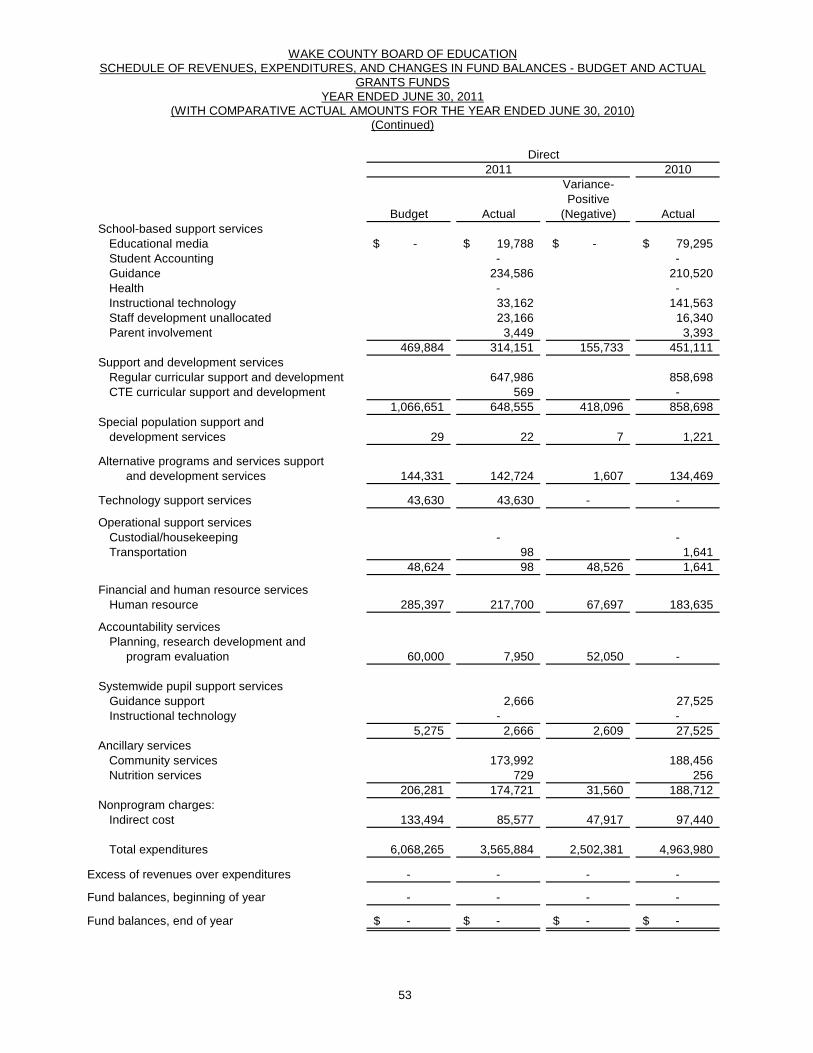
53
2011 2010Variance-Positive
Budget Actual (Negative) ActualSchool-based support services
Educational media -$ 19,788$ -$ 79,295$ Student Accounting - - Guidance 234,586 210,520 Health - - Instructional technology 33,162 141,563 Staff development unallocated 23,166 16,340 Parent involvement 3,449 3,393
469,884 314,151 155,733 451,111 Support and development services
Regular curricular support and development 647,986 858,698 CTE curricular support and development 569 -
1,066,651 648,555 418,096 858,698 Special population support and
development services 29 22 7 1,221
Alternative programs and services support and development services 144,331 142,724 1,607 134,469
Technology support services 43,630 43,630 - -
Operational support servicesCustodial/housekeeping - - Transportation 98 1,641
48,624 98 48,526 1,641
Financial and human resource servicesHuman resource 285,397 217,700 67,697 183,635
Accountability servicesPlanning, research development and program evaluation 60,000 7,950 52,050 -
Systemwide pupil support servicesGuidance support 2,666 27,525 Instructional technology - -
5,275 2,666 2,609 27,525 Ancillary services
Community services 173,992 188,456 Nutrition services 729 256
206,281 174,721 31,560 188,712 Nonprogram charges:
Indirect cost 133,494 85,577 47,917 97,440
Total expenditures 6,068,265 3,565,884 2,502,381 4,963,980
Excess of revenues over expenditures - - - -
Fund balances, beginning of year - - - -
Fund balances, end of year -$ -$ -$ -$
Direct
WAKE COUNTY BOARD OF EDUCATIONSCHEDULE OF REVENUES, EXPENDITURES, AND CHANGES IN FUND BALANCES - BUDGET AND ACTUAL
GRANTS FUNDSYEAR ENDED JUNE 30, 2011
(Continued)(WITH COMPARATIVE ACTUAL AMOUNTS FOR THE YEAR ENDED JUNE 30, 2010)
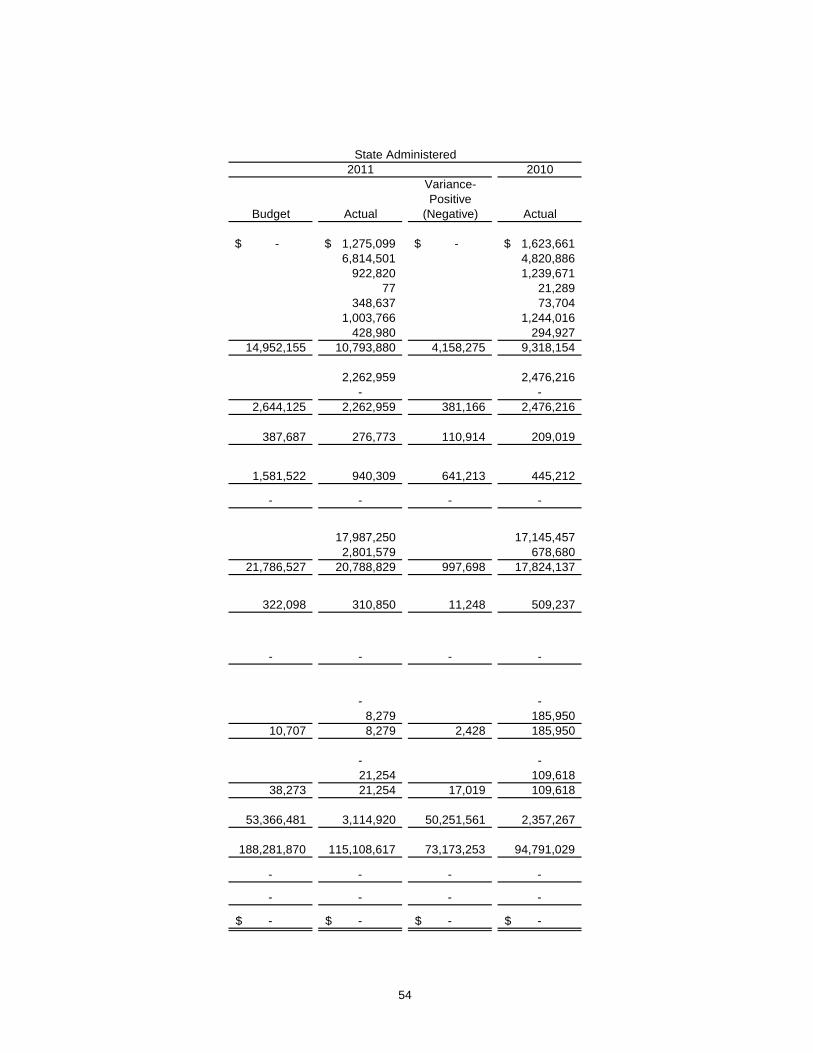
54
2011 2010Variance-Positive
Budget Actual (Negative) Actual
-$ 1,275,099$ -$ 1,623,661$ 6,814,501 4,820,886
922,820 1,239,671 77 21,289
348,637 73,704 1,003,766 1,244,016
428,980 294,927 14,952,155 10,793,880 4,158,275 9,318,154
2,262,959 2,476,216 - -
2,644,125 2,262,959 381,166 2,476,216
387,687 276,773 110,914 209,019
1,581,522 940,309 641,213 445,212
- - - -
17,987,250 17,145,457 2,801,579 678,680
21,786,527 20,788,829 997,698 17,824,137
322,098 310,850 11,248 509,237
- - - -
- - 8,279 185,950
10,707 8,279 2,428 185,950
- - 21,254 109,618
38,273 21,254 17,019 109,618
53,366,481 3,114,920 50,251,561 2,357,267
188,281,870 115,108,617 73,173,253 94,791,029
- - - -
- - - -
-$ -$ -$ -$
State Administered
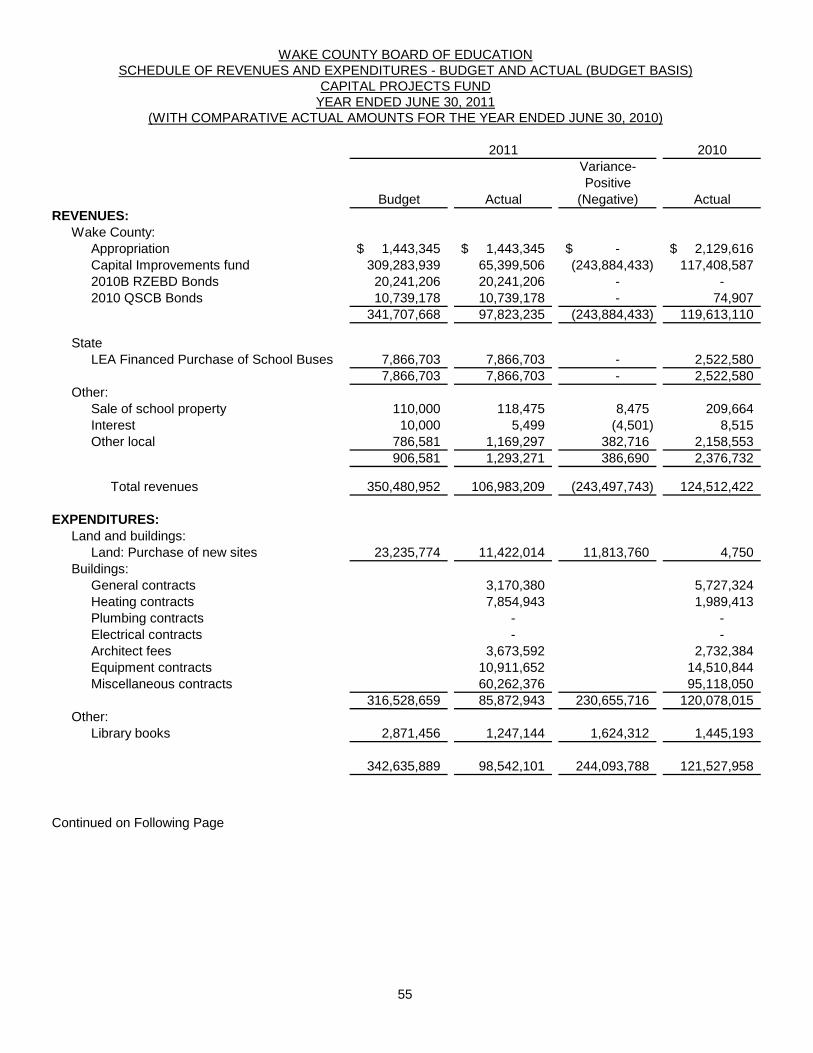
55
2010Variance-Positive
Budget Actual (Negative) ActualREVENUES:
Wake County:Appropriation 1,443,345$ 1,443,345$ -$ 2,129,616$ Capital Improvements fund 309,283,939 65,399,506 (243,884,433) 117,408,587 2010B RZEBD Bonds 20,241,206 20,241,206 - - 2010 QSCB Bonds 10,739,178 10,739,178 - 74,907
341,707,668 97,823,235 (243,884,433) 119,613,110
StateLEA Financed Purchase of School Buses 7,866,703 7,866,703 - 2,522,580
7,866,703 7,866,703 - 2,522,580 Other:
Sale of school property 110,000 118,475 8,475 209,664 Interest 10,000 5,499 (4,501) 8,515 Other local 786,581 1,169,297 382,716 2,158,553
906,581 1,293,271 386,690 2,376,732
Total revenues 350,480,952 106,983,209 (243,497,743) 124,512,422
EXPENDITURES:Land and buildings:
Land: Purchase of new sites 23,235,774 11,422,014 11,813,760 4,750 Buildings:
General contracts 3,170,380 5,727,324 Heating contracts 7,854,943 1,989,413 Plumbing contracts - - Electrical contracts - - Architect fees 3,673,592 2,732,384 Equipment contracts 10,911,652 14,510,844 Miscellaneous contracts 60,262,376 95,118,050
316,528,659 85,872,943 230,655,716 120,078,015 Other:
Library books 2,871,456 1,247,144 1,624,312 1,445,193
342,635,889 98,542,101 244,093,788 121,527,958
Continued on Following Page
2011
WAKE COUNTY BOARD OF EDUCATIONSCHEDULE OF REVENUES AND EXPENDITURES - BUDGET AND ACTUAL (BUDGET BASIS)
CAPITAL PROJECTS FUNDYEAR ENDED JUNE 30, 2011
(WITH COMPARATIVE ACTUAL AMOUNTS FOR THE YEAR ENDED JUNE 30, 2010)
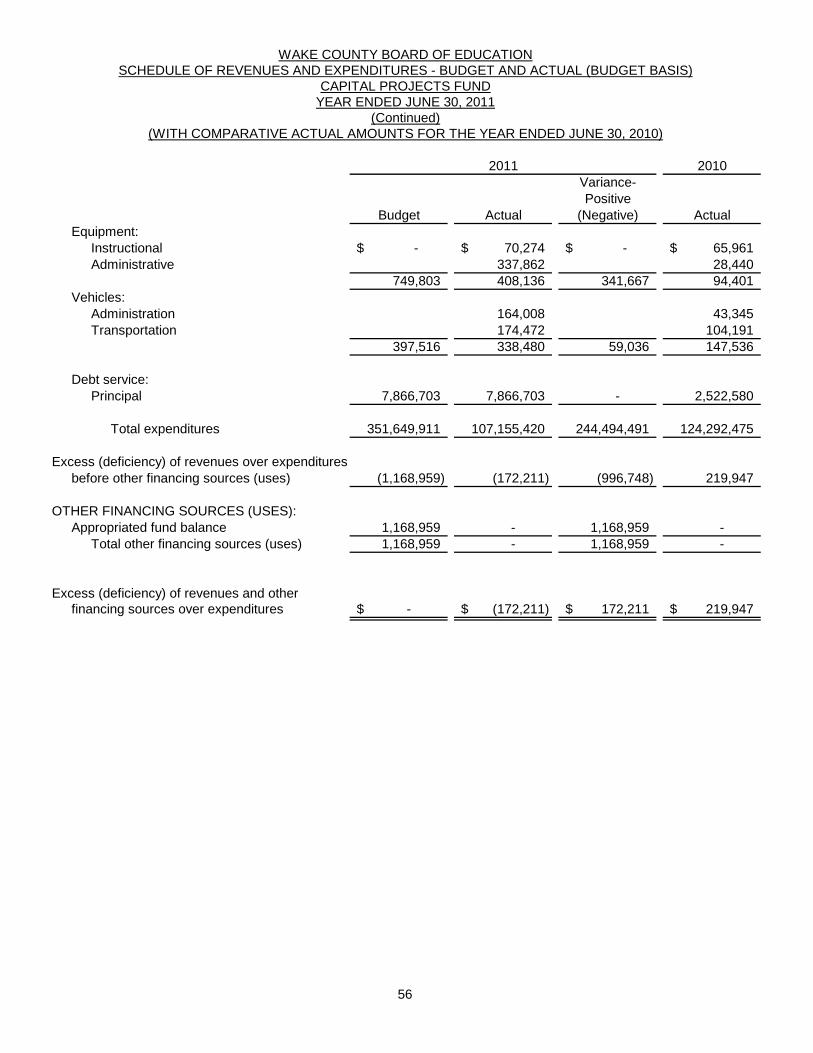
56
2010Variance-Positive
Budget Actual (Negative) ActualEquipment:
Instructional -$ 70,274$ -$ 65,961$ Administrative 337,862 28,440
749,803 408,136 341,667 94,401 Vehicles:
Administration 164,008 43,345 Transportation 174,472 104,191
397,516 338,480 59,036 147,536
Debt service:Principal 7,866,703 7,866,703 - 2,522,580
Total expenditures 351,649,911 107,155,420 244,494,491 124,292,475
Excess (deficiency) of revenues over expendituresbefore other financing sources (uses) (1,168,959) (172,211) (996,748) 219,947
OTHER FINANCING SOURCES (USES):Appropriated fund balance 1,168,959 - 1,168,959 -
Total other financing sources (uses) 1,168,959 - 1,168,959 -
Excess (deficiency) of revenues and otherfinancing sources over expenditures -$ (172,211)$ 172,211$ 219,947$
(WITH COMPARATIVE ACTUAL AMOUNTS FOR THE YEAR ENDED JUNE 30, 2010)
2011
WAKE COUNTY BOARD OF EDUCATIONSCHEDULE OF REVENUES AND EXPENDITURES - BUDGET AND ACTUAL (BUDGET BASIS)
CAPITAL PROJECTS FUNDYEAR ENDED JUNE 30, 2011
(Continued)
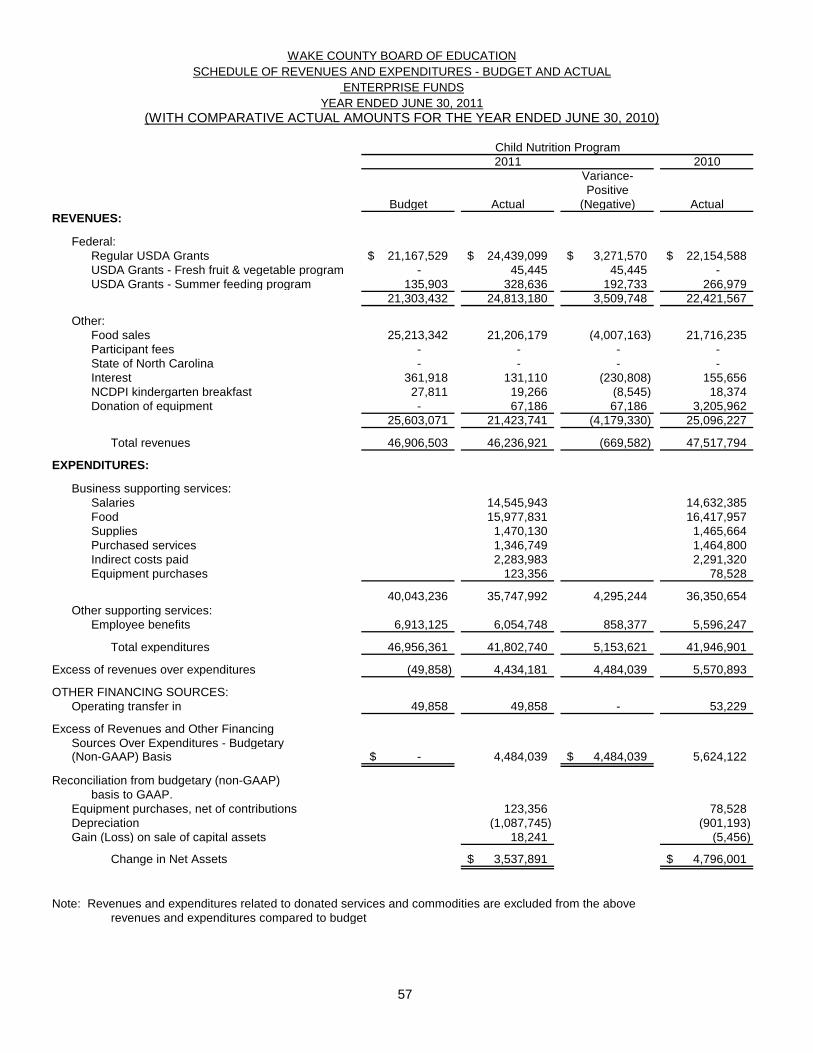
57
2010Variance-Positive
Budget Actual (Negative) ActualREVENUES:
Federal:Regular USDA Grants 21,167,529$ 24,439,099$ 3,271,570$ 22,154,588$ USDA Grants - Fresh fruit & vegetable program - 45,445 45,445 - USDA Grants - Summer feeding program 135,903 328,636 192,733 266,979
21,303,432 24,813,180 3,509,748 22,421,567
Other:Food sales 25,213,342 21,206,179 (4,007,163) 21,716,235Participant fees - - - - State of North Carolina - - - - Interest 361,918 131,110 (230,808) 155,656 NCDPI kindergarten breakfast 27,811 19,266 (8,545) 18,374 Donation of equipment - 67,186 67,186 3,205,962
25,603,071 21,423,741 (4,179,330) 25,096,227
Total revenues 46,906,503 46,236,921 (669,582) 47,517,794
EXPENDITURES:
Business supporting services: Salaries 14,545,943 14,632,385Food 15,977,831 16,417,957 Supplies 1,470,130 1,465,664 Purchased services 1,346,749 1,464,800 Indirect costs paid 2,283,983 2,291,320 Equipment purchases 123,356 78,528
40,043,236 35,747,992 4,295,244 36,350,654
Other supporting services: Employee benefits 6,913,125 6,054,748 858,377 5,596,247
Total expenditures 46,956,361 41,802,740 5,153,621 41,946,901
Excess of revenues over expenditures (49,858) 4,434,181 4,484,039 5,570,893
OTHER FINANCING SOURCES:Operating transfer in 49,858 49,858 - 53,229
Excess of Revenues and Other Financing Sources Over Expenditures - Budgetary (Non-GAAP) Basis -$ 4,484,039 4,484,039$ 5,624,122
Reconciliation from budgetary (non-GAAP)basis to GAAP.
Equipment purchases, net of contributions 123,356 78,528 Depreciation (1,087,745) (901,193) Gain (Loss) on sale of capital assets 18,241 (5,456)
Change in Net Assets 3,537,891$ 4,796,001$
Note: Revenues and expenditures related to donated services and commodities are excluded from the above revenues and expenditures compared to budget
2011
WAKE COUNTY BOARD OF EDUCATIONSCHEDULE OF REVENUES AND EXPENDITURES - BUDGET AND ACTUAL
ENTERPRISE FUNDSYEAR ENDED JUNE 30, 2011
(WITH COMPARATIVE ACTUAL AMOUNTS FOR THE YEAR ENDED JUNE 30, 2010)
Child Nutrition Program
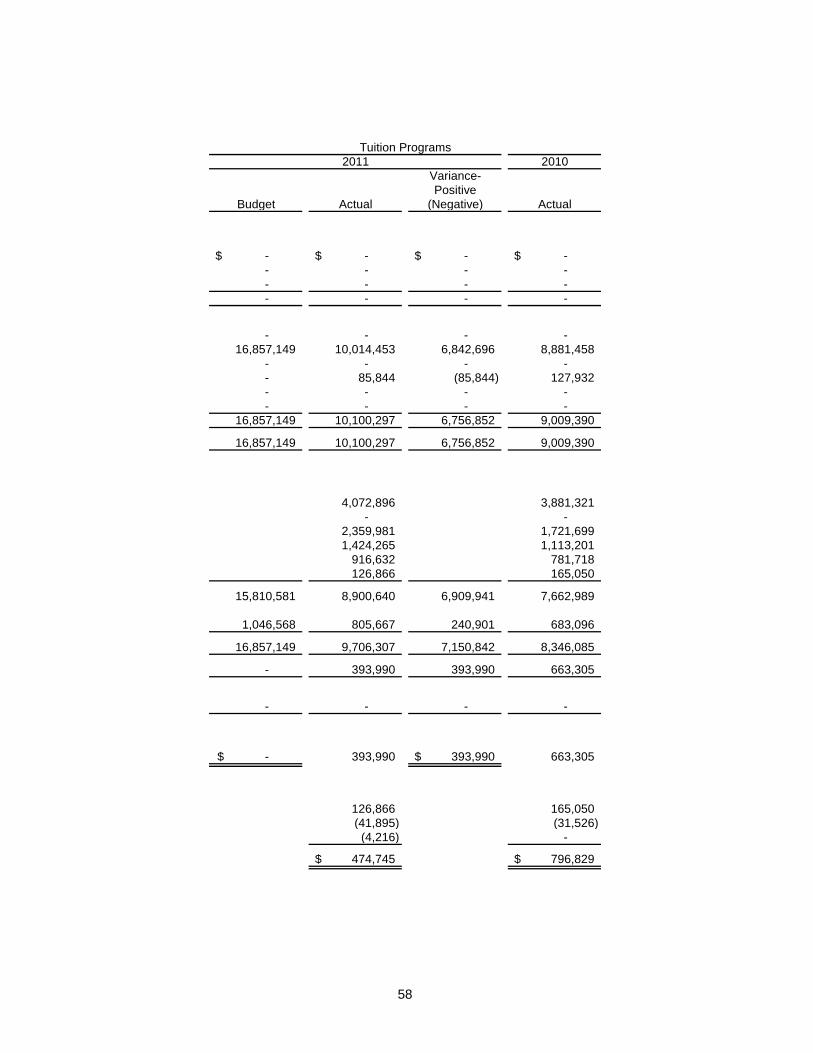
58
2010Variance-Positive
Budget Actual (Negative) Actual
-$ -$ -$ -$ - - - - - - - - - - - -
- - - - 16,857,149 10,014,453 6,842,696 8,881,458
- - - - - 85,844 (85,844) 127,932 - - - - - - - -
16,857,149 10,100,297 6,756,852 9,009,390
16,857,149 10,100,297 6,756,852 9,009,390
4,072,896 3,881,321- -
2,359,981 1,721,699 1,424,265 1,113,201
916,632 781,718 126,866 165,050
15,810,581 8,900,640 6,909,941 7,662,989
1,046,568 805,667 240,901 683,096
16,857,149 9,706,307 7,150,842 8,346,085
- 393,990 393,990 663,305
- - - -
-$ 393,990 393,990$ 663,305
126,866 165,050 (41,895) (31,526)
(4,216) -
474,745$ 796,829$
2011Tuition Programs
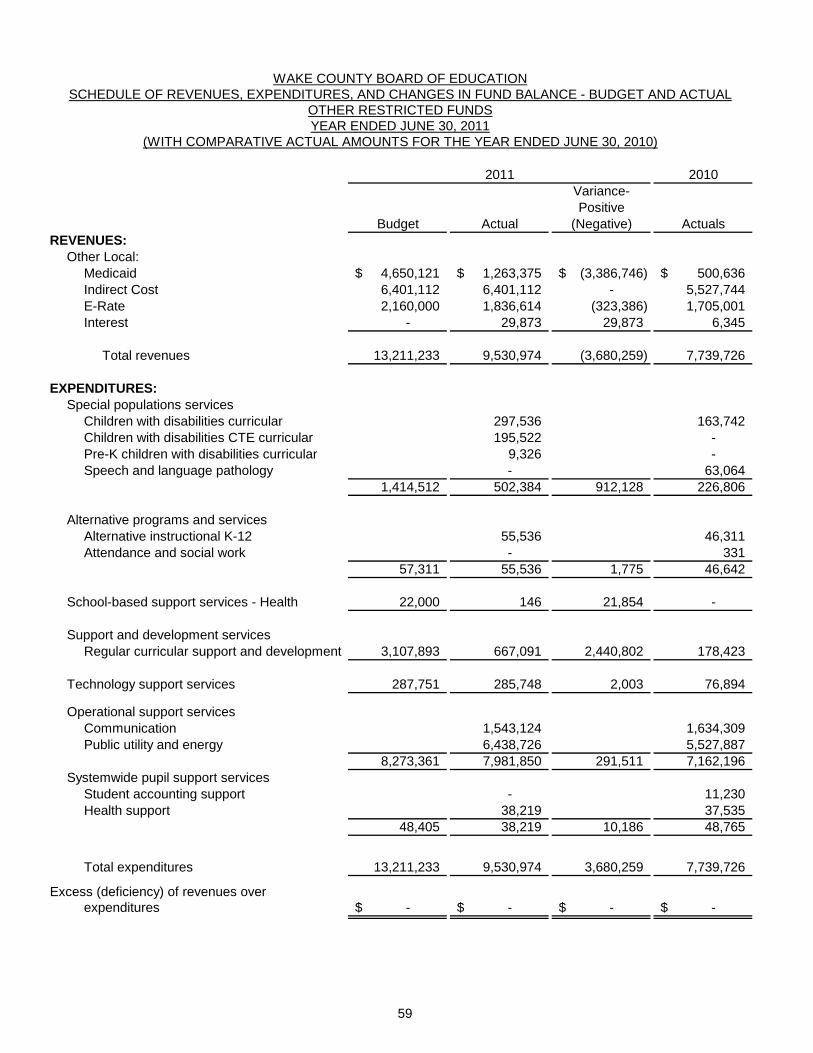
59
2010Variance-Positive
Budget Actual (Negative) ActualsREVENUES:
Other Local:Medicaid 4,650,121$ 1,263,375$ (3,386,746)$ 500,636$ Indirect Cost 6,401,112 6,401,112 - 5,527,744 E-Rate 2,160,000 1,836,614 (323,386) 1,705,001 Interest - 29,873 29,873 6,345
Total revenues 13,211,233 9,530,974 (3,680,259) 7,739,726
EXPENDITURES:Special populations services
Children with disabilities curricular 297,536 163,742 Children with disabilities CTE curricular 195,522 - Pre-K children with disabilities curricular 9,326 - Speech and language pathology - 63,064
1,414,512 502,384 912,128 226,806
Alternative programs and servicesAlternative instructional K-12 55,536 46,311 Attendance and social work - 331
57,311 55,536 1,775 46,642
School-based support services - Health 22,000 146 21,854 -
Support and development servicesRegular curricular support and development 3,107,893 667,091 2,440,802 178,423
Technology support services 287,751 285,748 2,003 76,894
Operational support servicesCommunication 1,543,124 1,634,309 Public utility and energy 6,438,726 5,527,887
8,273,361 7,981,850 291,511 7,162,196 Systemwide pupil support services
Student accounting support - 11,230 Health support 38,219 37,535
48,405 38,219 10,186 48,765
Total expenditures 13,211,233 9,530,974 3,680,259 7,739,726
Excess (deficiency) of revenues over expenditures -$ -$ -$ -$
2011
WAKE COUNTY BOARD OF EDUCATIONSCHEDULE OF REVENUES, EXPENDITURES, AND CHANGES IN FUND BALANCE - BUDGET AND ACTUAL
OTHER RESTRICTED FUNDSYEAR ENDED JUNE 30, 2011
(WITH COMPARATIVE ACTUAL AMOUNTS FOR THE YEAR ENDED JUNE 30, 2010)
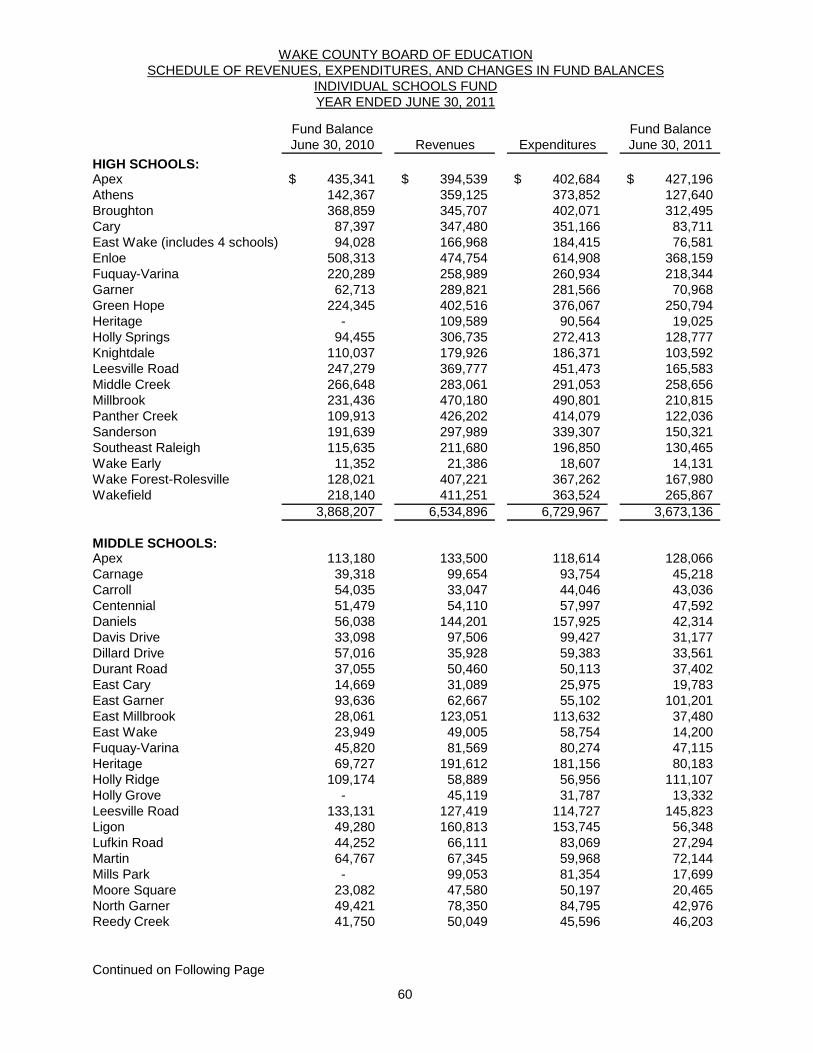
60
WAKE COUNTY BOARD OF EDUCATIONSCHEDULE OF REVENUES, EXPENDITURES, AND CHANGES IN FUND BALANCES
INDIVIDUAL SCHOOLS FUNDYEAR ENDED JUNE 30, 2011
Fund Balance Fund BalanceJune 30, 2010 Revenues Expenditures June 30, 2011
HIGH SCHOOLS:Apex 435,341$ 394,539$ 402,684$ 427,196$ Athens 142,367 359,125 373,852 127,640 Broughton 368,859 345,707 402,071 312,495 Cary 87,397 347,480 351,166 83,711 East Wake (includes 4 schools) 94,028 166,968 184,415 76,581 Enloe 508,313 474,754 614,908 368,159 Fuquay-Varina 220,289 258,989 260,934 218,344 Garner 62,713 289,821 281,566 70,968 Green Hope 224,345 402,516 376,067 250,794 Heritage - 109,589 90,564 19,025 Holly Springs 94,455 306,735 272,413 128,777 Knightdale 110,037 179,926 186,371 103,592 Leesville Road 247,279 369,777 451,473 165,583 Middle Creek 266,648 283,061 291,053 258,656 Millbrook 231,436 470,180 490,801 210,815 Panther Creek 109,913 426,202 414,079 122,036 Sanderson 191,639 297,989 339,307 150,321 Southeast Raleigh 115,635 211,680 196,850 130,465 Wake Early 11,352 21,386 18,607 14,131 Wake Forest-Rolesville 128,021 407,221 367,262 167,980 Wakefield 218,140 411,251 363,524 265,867
3,868,207 6,534,896 6,729,967 3,673,136
MIDDLE SCHOOLS:Apex 113,180 133,500 118,614 128,066 Carnage 39,318 99,654 93,754 45,218 Carroll 54,035 33,047 44,046 43,036 Centennial 51,479 54,110 57,997 47,592 Daniels 56,038 144,201 157,925 42,314 Davis Drive 33,098 97,506 99,427 31,177 Dillard Drive 57,016 35,928 59,383 33,561 Durant Road 37,055 50,460 50,113 37,402 East Cary 14,669 31,089 25,975 19,783 East Garner 93,636 62,667 55,102 101,201 East Millbrook 28,061 123,051 113,632 37,480 East Wake 23,949 49,005 58,754 14,200 Fuquay-Varina 45,820 81,569 80,274 47,115 Heritage 69,727 191,612 181,156 80,183 Holly Ridge 109,174 58,889 56,956 111,107 Holly Grove - 45,119 31,787 13,332 Leesville Road 133,131 127,419 114,727 145,823 Ligon 49,280 160,813 153,745 56,348 Lufkin Road 44,252 66,111 83,069 27,294 Martin 64,767 67,345 59,968 72,144 Mills Park - 99,053 81,354 17,699 Moore Square 23,082 47,580 50,197 20,465 North Garner 49,421 78,350 84,795 42,976 Reedy Creek 41,750 50,049 45,596 46,203
Continued on Following Page
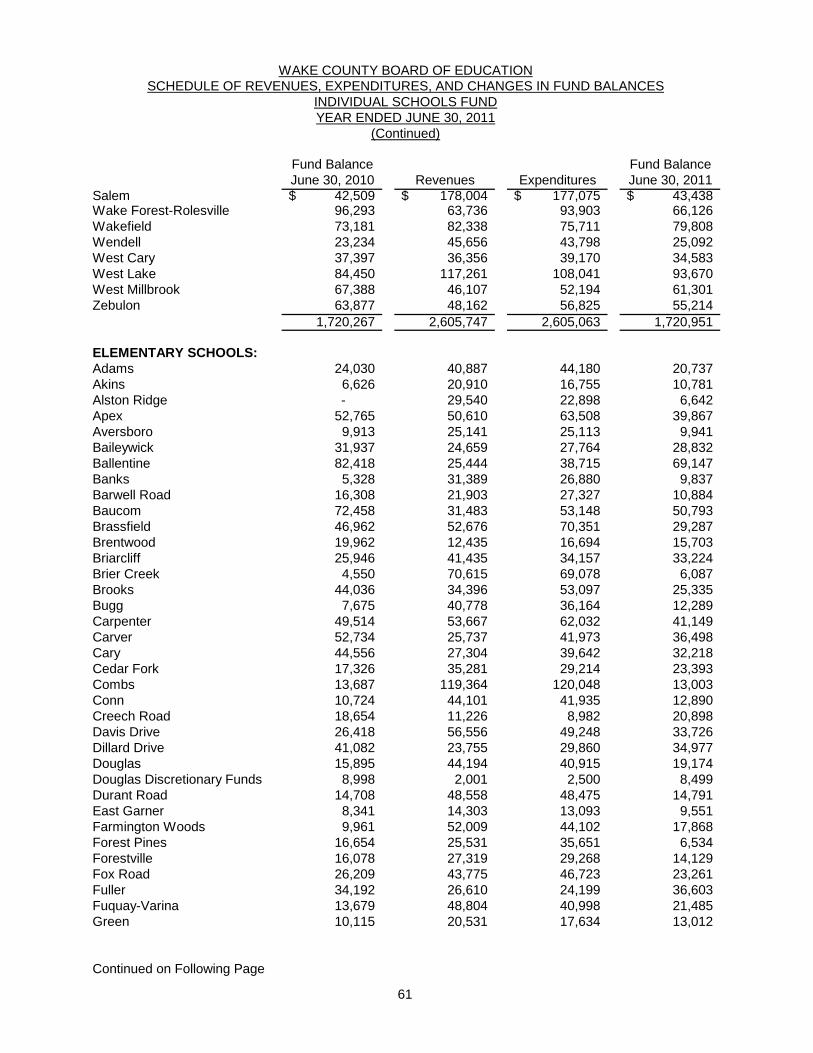
61
WAKE COUNTY BOARD OF EDUCATIONSCHEDULE OF REVENUES, EXPENDITURES, AND CHANGES IN FUND BALANCES
INDIVIDUAL SCHOOLS FUNDYEAR ENDED JUNE 30, 2011
(Continued)
Fund Balance Fund BalanceJune 30, 2010 Revenues Expenditures June 30, 2011
Salem 42,509$ 178,004$ 177,075$ 43,438$ Wake Forest-Rolesville 96,293 63,736 93,903 66,126 Wakefield 73,181 82,338 75,711 79,808 Wendell 23,234 45,656 43,798 25,092 West Cary 37,397 36,356 39,170 34,583 West Lake 84,450 117,261 108,041 93,670 West Millbrook 67,388 46,107 52,194 61,301 Zebulon 63,877 48,162 56,825 55,214
1,720,267 2,605,747 2,605,063 1,720,951
ELEMENTARY SCHOOLS:Adams 24,030 40,887 44,180 20,737 Akins 6,626 20,910 16,755 10,781 Alston Ridge - 29,540 22,898 6,642 Apex 52,765 50,610 63,508 39,867 Aversboro 9,913 25,141 25,113 9,941 Baileywick 31,937 24,659 27,764 28,832 Ballentine 82,418 25,444 38,715 69,147 Banks 5,328 31,389 26,880 9,837 Barwell Road 16,308 21,903 27,327 10,884 Baucom 72,458 31,483 53,148 50,793 Brassfield 46,962 52,676 70,351 29,287 Brentwood 19,962 12,435 16,694 15,703 Briarcliff 25,946 41,435 34,157 33,224 Brier Creek 4,550 70,615 69,078 6,087 Brooks 44,036 34,396 53,097 25,335 Bugg 7,675 40,778 36,164 12,289 Carpenter 49,514 53,667 62,032 41,149 Carver 52,734 25,737 41,973 36,498 Cary 44,556 27,304 39,642 32,218 Cedar Fork 17,326 35,281 29,214 23,393 Combs 13,687 119,364 120,048 13,003 Conn 10,724 44,101 41,935 12,890 Creech Road 18,654 11,226 8,982 20,898 Davis Drive 26,418 56,556 49,248 33,726 Dillard Drive 41,082 23,755 29,860 34,977 Douglas 15,895 44,194 40,915 19,174 Douglas Discretionary Funds 8,998 2,001 2,500 8,499 Durant Road 14,708 48,558 48,475 14,791 East Garner 8,341 14,303 13,093 9,551 Farmington Woods 9,961 52,009 44,102 17,868 Forest Pines 16,654 25,531 35,651 6,534 Forestville 16,078 27,319 29,268 14,129 Fox Road 26,209 43,775 46,723 23,261 Fuller 34,192 26,610 24,199 36,603 Fuquay-Varina 13,679 48,804 40,998 21,485 Green 10,115 20,531 17,634 13,012
Continued on Following Page
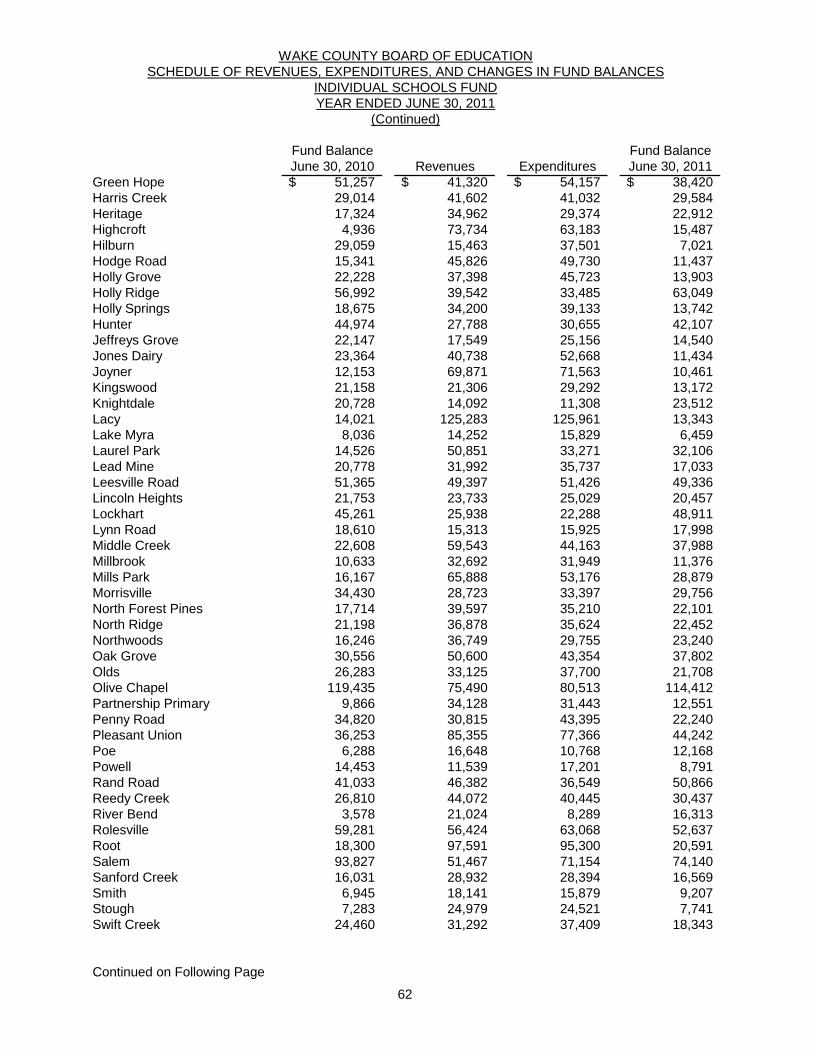
62
WAKE COUNTY BOARD OF EDUCATIONSCHEDULE OF REVENUES, EXPENDITURES, AND CHANGES IN FUND BALANCES
INDIVIDUAL SCHOOLS FUNDYEAR ENDED JUNE 30, 2011
(Continued)
Fund Balance Fund BalanceJune 30, 2010 Revenues Expenditures June 30, 2011
Green Hope 51,257$ 41,320$ 54,157$ 38,420$ Harris Creek 29,014 41,602 41,032 29,584 Heritage 17,324 34,962 29,374 22,912 Highcroft 4,936 73,734 63,183 15,487 Hilburn 29,059 15,463 37,501 7,021 Hodge Road 15,341 45,826 49,730 11,437 Holly Grove 22,228 37,398 45,723 13,903 Holly Ridge 56,992 39,542 33,485 63,049 Holly Springs 18,675 34,200 39,133 13,742 Hunter 44,974 27,788 30,655 42,107 Jeffreys Grove 22,147 17,549 25,156 14,540 Jones Dairy 23,364 40,738 52,668 11,434 Joyner 12,153 69,871 71,563 10,461 Kingswood 21,158 21,306 29,292 13,172 Knightdale 20,728 14,092 11,308 23,512 Lacy 14,021 125,283 125,961 13,343 Lake Myra 8,036 14,252 15,829 6,459 Laurel Park 14,526 50,851 33,271 32,106 Lead Mine 20,778 31,992 35,737 17,033 Leesville Road 51,365 49,397 51,426 49,336 Lincoln Heights 21,753 23,733 25,029 20,457 Lockhart 45,261 25,938 22,288 48,911 Lynn Road 18,610 15,313 15,925 17,998 Middle Creek 22,608 59,543 44,163 37,988 Millbrook 10,633 32,692 31,949 11,376 Mills Park 16,167 65,888 53,176 28,879 Morrisville 34,430 28,723 33,397 29,756 North Forest Pines 17,714 39,597 35,210 22,101 North Ridge 21,198 36,878 35,624 22,452 Northwoods 16,246 36,749 29,755 23,240 Oak Grove 30,556 50,600 43,354 37,802 Olds 26,283 33,125 37,700 21,708 Olive Chapel 119,435 75,490 80,513 114,412 Partnership Primary 9,866 34,128 31,443 12,551 Penny Road 34,820 30,815 43,395 22,240 Pleasant Union 36,253 85,355 77,366 44,242 Poe 6,288 16,648 10,768 12,168 Powell 14,453 11,539 17,201 8,791 Rand Road 41,033 46,382 36,549 50,866 Reedy Creek 26,810 44,072 40,445 30,437 River Bend 3,578 21,024 8,289 16,313 Rolesville 59,281 56,424 63,068 52,637 Root 18,300 97,591 95,300 20,591 Salem 93,827 51,467 71,154 74,140 Sanford Creek 16,031 28,932 28,394 16,569 Smith 6,945 18,141 15,879 9,207 Stough 7,283 24,979 24,521 7,741 Swift Creek 24,460 31,292 37,409 18,343
Continued on Following Page
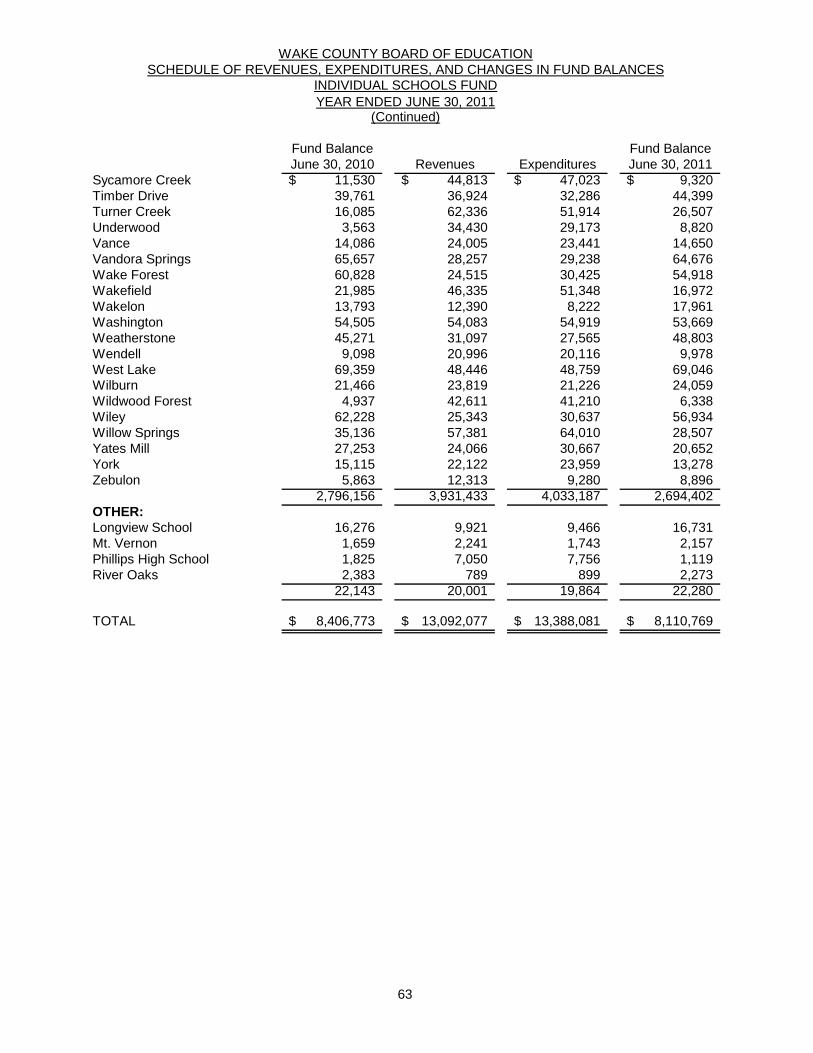
63
WAKE COUNTY BOARD OF EDUCATIONSCHEDULE OF REVENUES, EXPENDITURES, AND CHANGES IN FUND BALANCES
INDIVIDUAL SCHOOLS FUNDYEAR ENDED JUNE 30, 2011
(Continued)
Fund Balance Fund BalanceJune 30, 2010 Revenues Expenditures June 30, 2011
Sycamore Creek 11,530$ 44,813$ 47,023$ 9,320$ Timber Drive 39,761 36,924 32,286 44,399 Turner Creek 16,085 62,336 51,914 26,507 Underwood 3,563 34,430 29,173 8,820 Vance 14,086 24,005 23,441 14,650 Vandora Springs 65,657 28,257 29,238 64,676 Wake Forest 60,828 24,515 30,425 54,918 Wakefield 21,985 46,335 51,348 16,972 Wakelon 13,793 12,390 8,222 17,961 Washington 54,505 54,083 54,919 53,669 Weatherstone 45,271 31,097 27,565 48,803 Wendell 9,098 20,996 20,116 9,978 West Lake 69,359 48,446 48,759 69,046 Wilburn 21,466 23,819 21,226 24,059 Wildwood Forest 4,937 42,611 41,210 6,338 Wiley 62,228 25,343 30,637 56,934 Willow Springs 35,136 57,381 64,010 28,507 Yates Mill 27,253 24,066 30,667 20,652 York 15,115 22,122 23,959 13,278 Zebulon 5,863 12,313 9,280 8,896 2,796,156 3,931,433 4,033,187 2,694,402 OTHER:Longview School 16,276 9,921 9,466 16,731 Mt. Vernon 1,659 2,241 1,743 2,157 Phillips High School 1,825 7,050 7,756 1,119 River Oaks 2,383 789 899 2,273
22,143 20,001 19,864 22,280
TOTAL 8,406,773$ 13,092,077$ 13,388,081$ 8,110,769$

FINANCIAL REPORT
FOR THE FISCAL YEAR ENDED JUNE 30, 2011
Prepared by the Finance Department
Cary, North Carolina
Sta
tIS
tIc
al S
ec
tIo
nS t a t I S t I c a l S e c t I o n
64
Statistical Section This section of the Board’s Comprehensive Annual Financial Report presents detailed information for understanding what the information in the financial statements, note disclosures, and required supplementary information says about the Board’s overall financial position. Contents: Financial Trends These schedules contain trend information to help the reader understand how the Board’s financial position has changed over time. Revenue Capacity Since the Board’s revenues are primarily provided by Wake County, these schedules contain information to help the reader access Wake County’s major revenue sources. Debt Capacity Since the Board’s construction funding is primarily provided by Wake County, these schedules present information to help the reader assess the affordability of Wake County’s current levels of outstanding debt and their ability to issue additional debt in the future. Demographic and Economic Information These schedules offer demographic and economic indicators to help the reader understand the environment within which the Board’s financial activities take place. Operating Information These schedules contain staffing, key operating statistics comparisons and capital asset data to help the reader understand how the information in the Board’s financial report related to the services the Board provides and the activities it performs. Sources: Unless otherwise noted, the information in these schedules is derived from the comprehensive annual financial reports and budget documents for the relevant year. The Board implemented GASB 34 in fiscal year 2002; schedules presenting government-wide information include information beginning in that year.
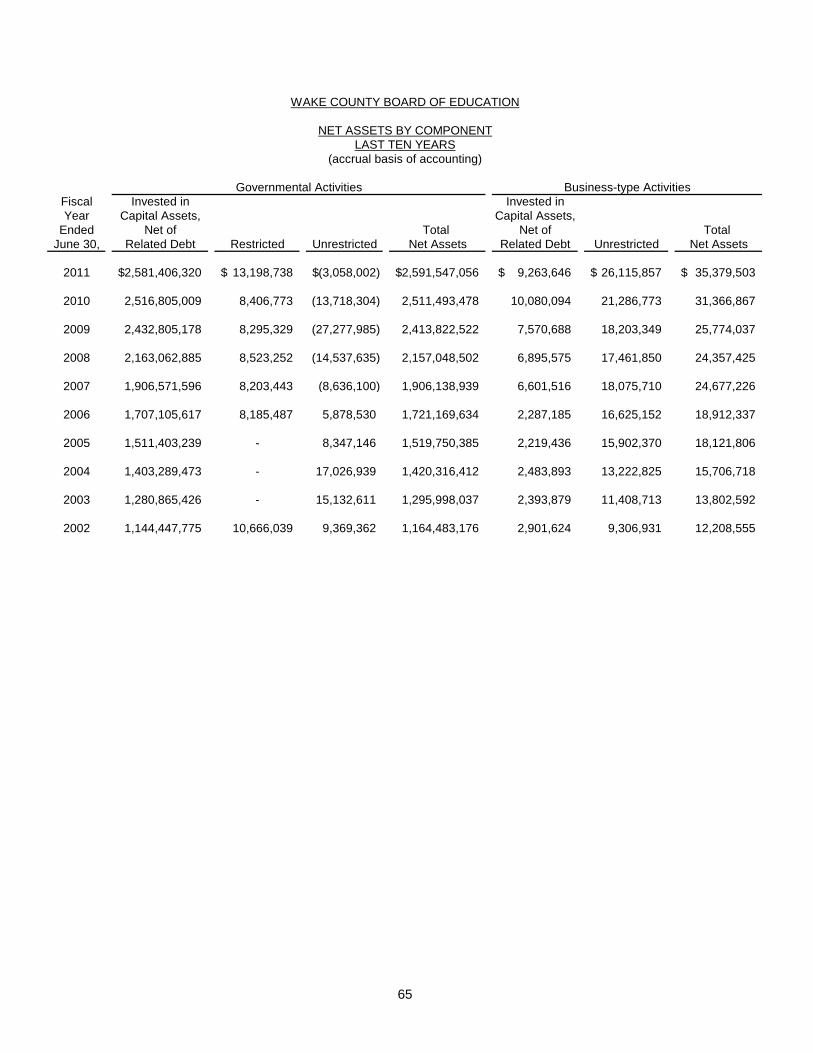
65
Fiscal Invested in Invested inYear Capital Assets, Capital Assets,
Ended Net of Total Net of Total June 30, Related Debt Restricted Unrestricted Net Assets Related Debt Unrestricted Net Assets
2011 2,581,406,320$ 13,198,738$ (3,058,002)$ 2,591,547,056$ 9,263,646$ 26,115,857$ 35,379,503$
2010 2,516,805,009 8,406,773 (13,718,304) 2,511,493,478 10,080,094 21,286,773 31,366,867
2009 2,432,805,178 8,295,329 (27,277,985) 2,413,822,522 7,570,688 18,203,349 25,774,037
2008 2,163,062,885 8,523,252 (14,537,635) 2,157,048,502 6,895,575 17,461,850 24,357,425
2007 1,906,571,596 8,203,443 (8,636,100) 1,906,138,939 6,601,516 18,075,710 24,677,226
2006 1,707,105,617 8,185,487 5,878,530 1,721,169,634 2,287,185 16,625,152 18,912,337
2005 1,511,403,239 - 8,347,146 1,519,750,385 2,219,436 15,902,370 18,121,806
2004 1,403,289,473 - 17,026,939 1,420,316,412 2,483,893 13,222,825 15,706,718
2003 1,280,865,426 - 15,132,611 1,295,998,037 2,393,879 11,408,713 13,802,592
2002 1,144,447,775 10,666,039 9,369,362 1,164,483,176 2,901,624 9,306,931 12,208,555
WAKE COUNTY BOARD OF EDUCATION
NET ASSETS BY COMPONENT
Governmental Activities Business-type Activities
LAST TEN YEARS(accrual basis of accounting)
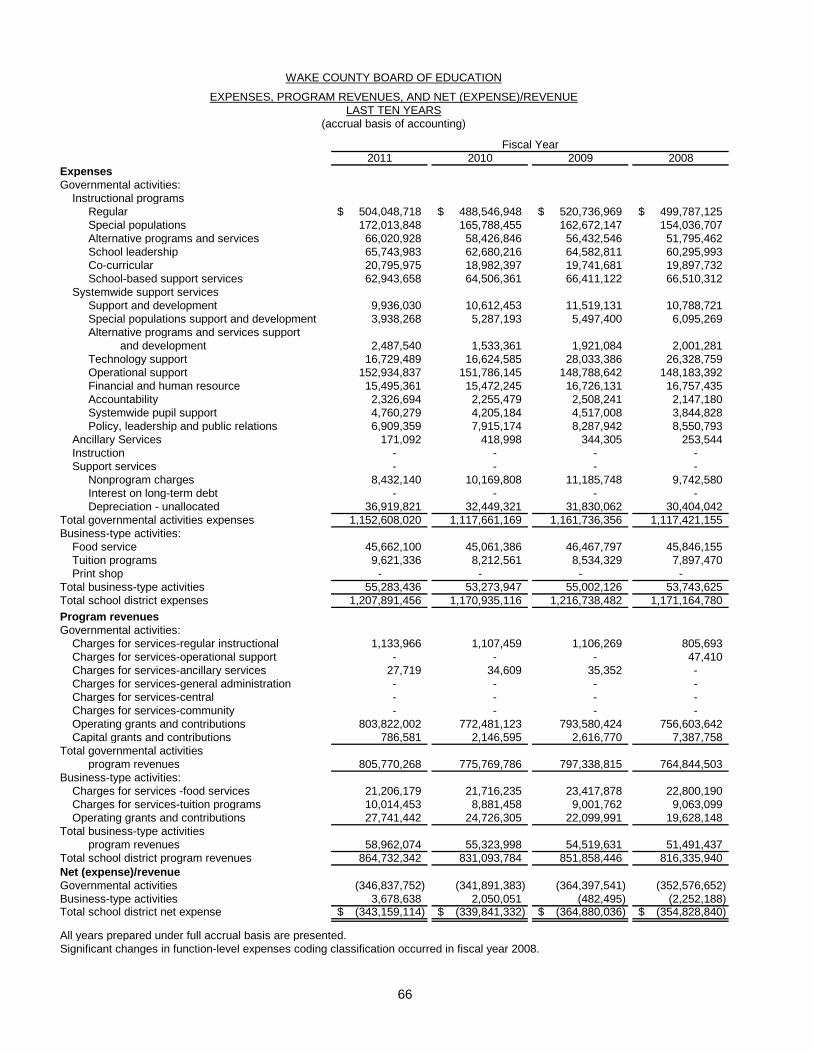
66
2011 2010 2009 2008ExpensesGovernmental activities:
Instructional programsRegular 504,048,718$ 488,546,948$ 520,736,969$ 499,787,125$ Special populations 172,013,848 165,788,455 162,672,147 154,036,707 Alternative programs and services 66,020,928 58,426,846 56,432,546 51,795,462 School leadership 65,743,983 62,680,216 64,582,811 60,295,993 Co-curricular 20,795,975 18,982,397 19,741,681 19,897,732 School-based support services 62,943,658 64,506,361 66,411,122 66,510,312
Systemwide support servicesSupport and development 9,936,030 10,612,453 11,519,131 10,788,721 Special populations support and development 3,938,268 5,287,193 5,497,400 6,095,269 Alternative programs and services support
and development 2,487,540 1,533,361 1,921,084 2,001,281 Technology support 16,729,489 16,624,585 28,033,386 26,328,759 Operational support 152,934,837 151,786,145 148,788,642 148,183,392 Financial and human resource 15,495,361 15,472,245 16,726,131 16,757,435 Accountability 2,326,694 2,255,479 2,508,241 2,147,180 Systemwide pupil support 4,760,279 4,205,184 4,517,008 3,844,828 Policy, leadership and public relations 6,909,359 7,915,174 8,287,942 8,550,793
Ancillary Services 171,092 418,998 344,305 253,544 Instruction - - - - Support services - - - -
Nonprogram charges 8,432,140 10,169,808 11,185,748 9,742,580 Interest on long-term debt - - - - Depreciation - unallocated 36,919,821 32,449,321 31,830,062 30,404,042
Total governmental activities expenses 1,152,608,020 1,117,661,169 1,161,736,356 1,117,421,155 Business-type activities:
Food service 45,662,100 45,061,386 46,467,797 45,846,155 Tuition programs 9,621,336 8,212,561 8,534,329 7,897,470 Print shop - - - -
Total business-type activities 55,283,436 53,273,947 55,002,126 53,743,625 Total school district expenses 1,207,891,456 1,170,935,116 1,216,738,482 1,171,164,780 Program revenuesGovernmental activities:
Charges for services-regular instructional 1,133,966 1,107,459 1,106,269 805,693 Charges for services-operational support - - - 47,410 Charges for services-ancillary services 27,719 34,609 35,352 - Charges for services-general administration - - - - Charges for services-central - - - - Charges for services-community - - - - Operating grants and contributions 803,822,002 772,481,123 793,580,424 756,603,642 Capital grants and contributions 786,581 2,146,595 2,616,770 7,387,758
Total governmental activitiesprogram revenues 805,770,268 775,769,786 797,338,815 764,844,503
Business-type activities:Charges for services -food services 21,206,179 21,716,235 23,417,878 22,800,190 Charges for services-tuition programs 10,014,453 8,881,458 9,001,762 9,063,099 Operating grants and contributions 27,741,442 24,726,305 22,099,991 19,628,148
Total business-type activities program revenues 58,962,074 55,323,998 54,519,631 51,491,437
Total school district program revenues 864,732,342 831,093,784 851,858,446 816,335,940 Net (expense)/revenueGovernmental activities (346,837,752) (341,891,383) (364,397,541) (352,576,652) Business-type activities 3,678,638 2,050,051 (482,495) (2,252,188) Total school district net expense (343,159,114)$ (339,841,332)$ (364,880,036)$ (354,828,840)$
All years prepared under full accrual basis are presented. Significant changes in function-level expenses coding classification occurred in fiscal year 2008.
WAKE COUNTY BOARD OF EDUCATION
EXPENSES, PROGRAM REVENUES, AND NET (EXPENSE)/REVENUELAST TEN YEARS
(accrual basis of accounting)
Fiscal Year
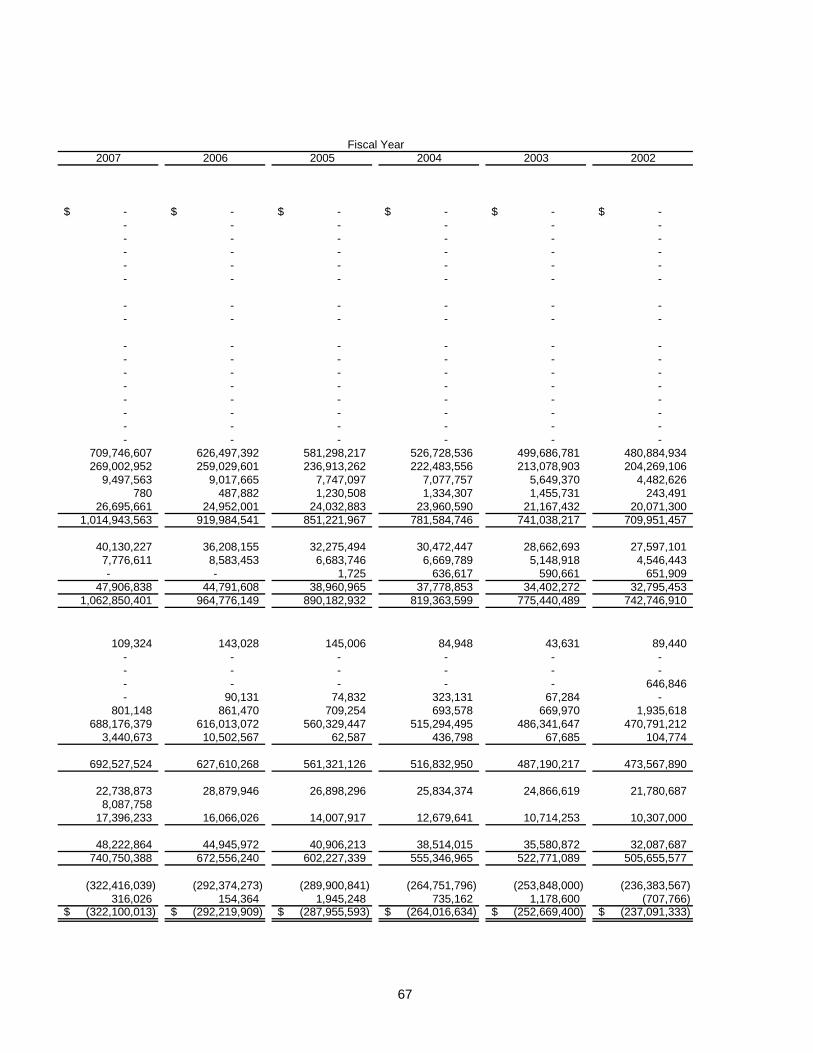
67
2007 2006 2005 2004 2003 2002
-$ -$ -$ -$ -$ -$ - - - - - - - - - - - - - - - - - - - - - - - - - - - - - -
- - - - - - - - - - - -
- - - - - - - - - - - - - - - - - - - - - - - - - - - - - - - - - - - - - - - - - - - - - - - -
709,746,607 626,497,392 581,298,217 526,728,536 499,686,781 480,884,934 269,002,952 259,029,601 236,913,262 222,483,556 213,078,903 204,269,106
9,497,563 9,017,665 7,747,097 7,077,757 5,649,370 4,482,626 780 487,882 1,230,508 1,334,307 1,455,731 243,491
26,695,661 24,952,001 24,032,883 23,960,590 21,167,432 20,071,300 1,014,943,563 919,984,541 851,221,967 781,584,746 741,038,217 709,951,457
40,130,227 36,208,155 32,275,494 30,472,447 28,662,693 27,597,101 7,776,611 8,583,453 6,683,746 6,669,789 5,148,918 4,546,443 - - 1,725 636,617 590,661 651,909
47,906,838 44,791,608 38,960,965 37,778,853 34,402,272 32,795,453 1,062,850,401 964,776,149 890,182,932 819,363,599 775,440,489 742,746,910
109,324 143,028 145,006 84,948 43,631 89,440 - - - - - - - - - - - - - - - - - 646,846 - 90,131 74,832 323,131 67,284 -
801,148 861,470 709,254 693,578 669,970 1,935,618 688,176,379 616,013,072 560,329,447 515,294,495 486,341,647 470,791,212
3,440,673 10,502,567 62,587 436,798 67,685 104,774
692,527,524 627,610,268 561,321,126 516,832,950 487,190,217 473,567,890
22,738,873 28,879,946 26,898,296 25,834,374 24,866,619 21,780,687 8,087,758
17,396,233 16,066,026 14,007,917 12,679,641 10,714,253 10,307,000
48,222,864 44,945,972 40,906,213 38,514,015 35,580,872 32,087,687 740,750,388 672,556,240 602,227,339 555,346,965 522,771,089 505,655,577
(322,416,039) (292,374,273) (289,900,841) (264,751,796) (253,848,000) (236,383,567) 316,026 154,364 1,945,248 735,162 1,178,600 (707,766)
(322,100,013)$ (292,219,909)$ (287,955,593)$ (264,016,634)$ (252,669,400)$ (237,091,333)$
Fiscal Year
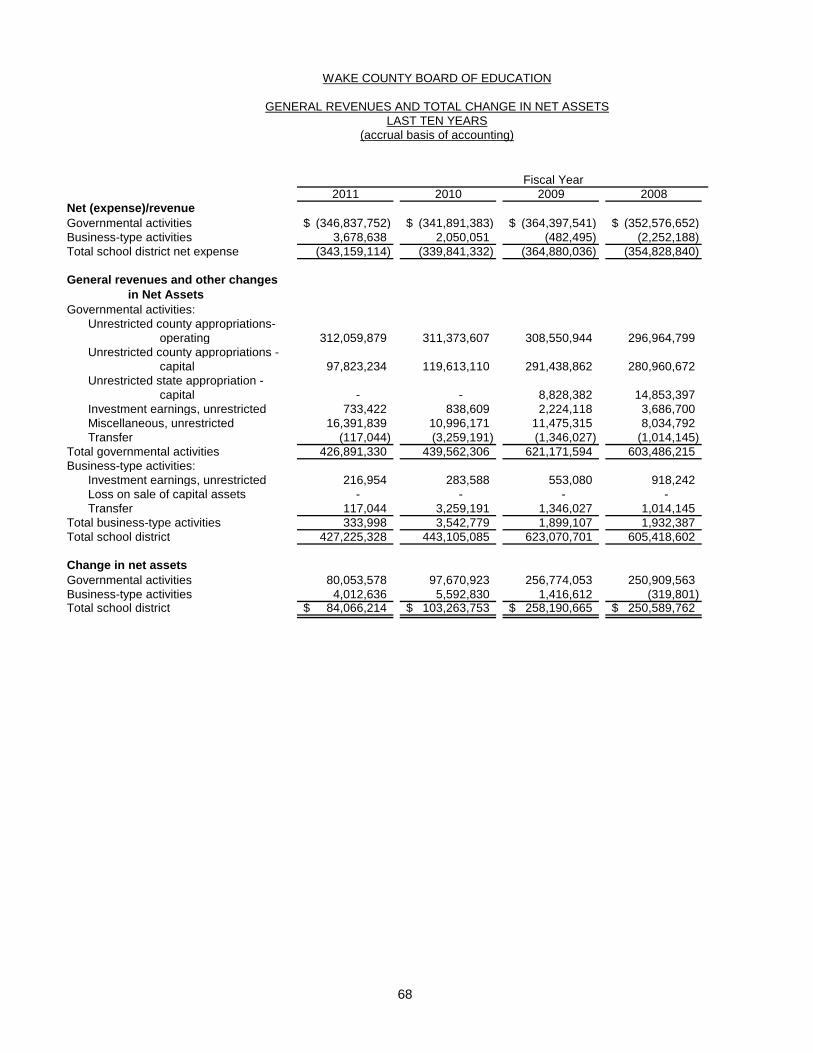
68
2011 2010 2009 2008Net (expense)/revenueGovernmental activities (346,837,752)$ (341,891,383)$ (364,397,541)$ (352,576,652)$ Business-type activities 3,678,638 2,050,051 (482,495) (2,252,188) Total school district net expense (343,159,114) (339,841,332) (364,880,036) (354,828,840)
General revenues and other changesin Net Assets
Governmental activities:Unrestricted county appropriations-
operating 312,059,879 311,373,607 308,550,944 296,964,799 Unrestricted county appropriations -
capital 97,823,234 119,613,110 291,438,862 280,960,672 Unrestricted state appropriation -
capital - - 8,828,382 14,853,397 Investment earnings, unrestricted 733,422 838,609 2,224,118 3,686,700 Miscellaneous, unrestricted 16,391,839 10,996,171 11,475,315 8,034,792 Transfer (117,044) (3,259,191) (1,346,027) (1,014,145)
Total governmental activities 426,891,330 439,562,306 621,171,594 603,486,215 Business-type activities:
Investment earnings, unrestricted 216,954 283,588 553,080 918,242 Loss on sale of capital assets - - - - Transfer 117,044 3,259,191 1,346,027 1,014,145
Total business-type activities 333,998 3,542,779 1,899,107 1,932,387 Total school district 427,225,328 443,105,085 623,070,701 605,418,602
Change in net assetsGovernmental activities 80,053,578 97,670,923 256,774,053 250,909,563 Business-type activities 4,012,636 5,592,830 1,416,612 (319,801) Total school district 84,066,214$ 103,263,753$ 258,190,665$ 250,589,762$
Fiscal Year
WAKE COUNTY BOARD OF EDUCATION
GENERAL REVENUES AND TOTAL CHANGE IN NET ASSETSLAST TEN YEARS
(accrual basis of accounting)
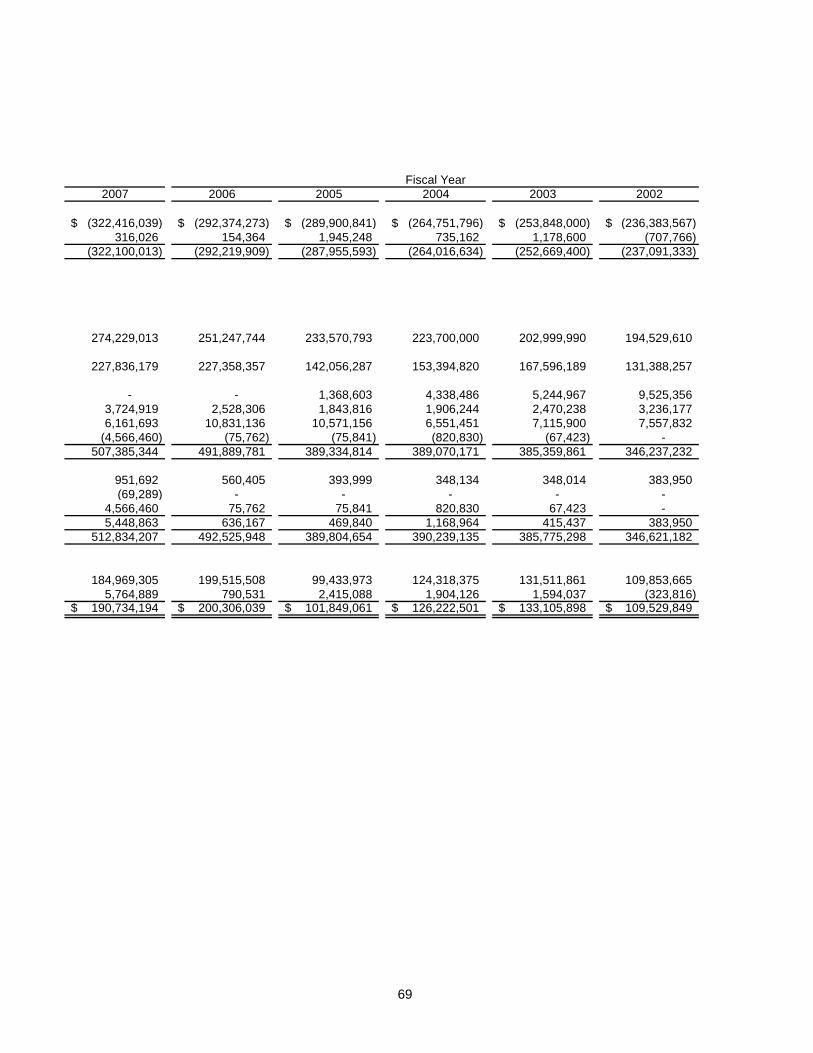
69
2007 2006 2005 2004 2003 2002
(322,416,039)$ (292,374,273)$ (289,900,841)$ (264,751,796)$ (253,848,000)$ (236,383,567)$ 316,026 154,364 1,945,248 735,162 1,178,600 (707,766)
(322,100,013) (292,219,909) (287,955,593) (264,016,634) (252,669,400) (237,091,333)
274,229,013 251,247,744 233,570,793 223,700,000 202,999,990 194,529,610
227,836,179 227,358,357 142,056,287 153,394,820 167,596,189 131,388,257
- - 1,368,603 4,338,486 5,244,967 9,525,356 3,724,919 2,528,306 1,843,816 1,906,244 2,470,238 3,236,177 6,161,693 10,831,136 10,571,156 6,551,451 7,115,900 7,557,832
(4,566,460) (75,762) (75,841) (820,830) (67,423) - 507,385,344 491,889,781 389,334,814 389,070,171 385,359,861 346,237,232
951,692 560,405 393,999 348,134 348,014 383,950 (69,289) - - - - -
4,566,460 75,762 75,841 820,830 67,423 - 5,448,863 636,167 469,840 1,168,964 415,437 383,950
512,834,207 492,525,948 389,804,654 390,239,135 385,775,298 346,621,182
184,969,305 199,515,508 99,433,973 124,318,375 131,511,861 109,853,665 5,764,889 790,531 2,415,088 1,904,126 1,594,037 (323,816)
190,734,194$ 200,306,039$ 101,849,061$ 126,222,501$ 133,105,898$ 109,529,849$
Fiscal Year
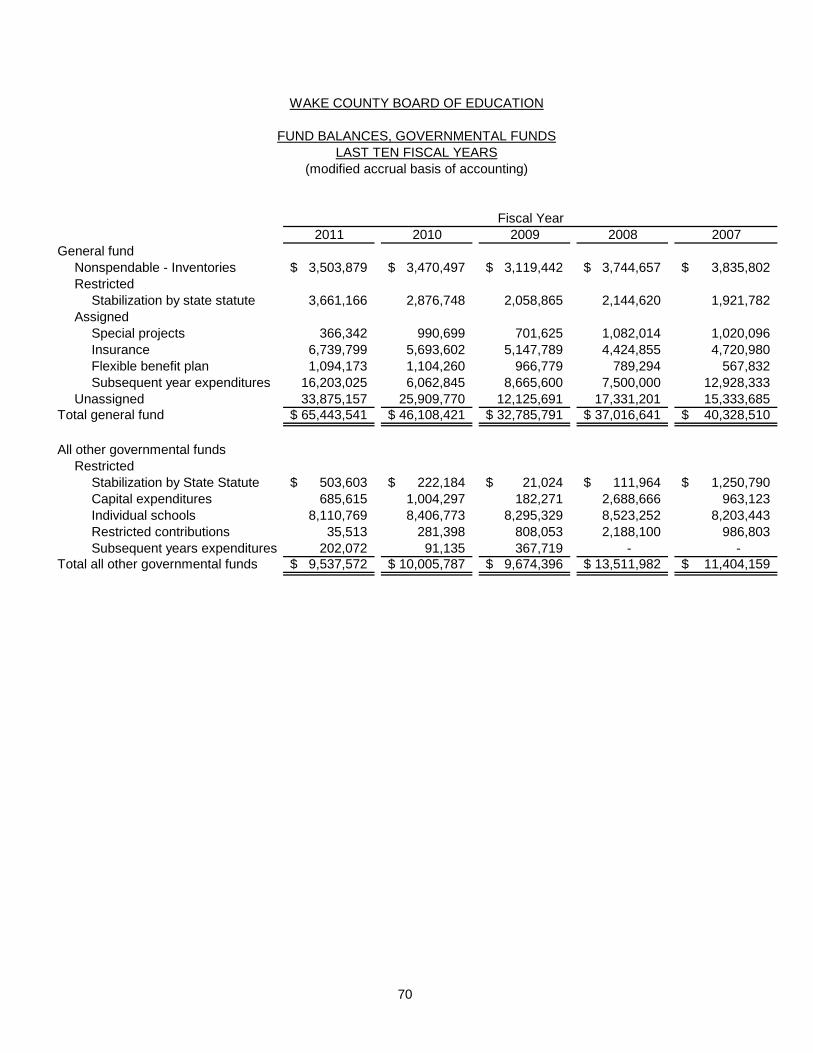
70
2011 2010 2009 2008 2007General fund
Nonspendable - Inventories 3,503,879$ 3,470,497$ 3,119,442$ 3,744,657$ 3,835,802$ Restricted
Stabilization by state statute 3,661,166 2,876,748 2,058,865 2,144,620 1,921,782 Assigned
Special projects 366,342 990,699 701,625 1,082,014 1,020,096 Insurance 6,739,799 5,693,602 5,147,789 4,424,855 4,720,980 Flexible benefit plan 1,094,173 1,104,260 966,779 789,294 567,832 Subsequent year expenditures 16,203,025 6,062,845 8,665,600 7,500,000 12,928,333
Unassigned 33,875,157 25,909,770 12,125,691 17,331,201 15,333,685 Total general fund 65,443,541$ 46,108,421$ 32,785,791$ 37,016,641$ 40,328,510$
All other governmental fundsRestricted
Stabilization by State Statute 503,603$ 222,184$ 21,024$ 111,964$ 1,250,790$ Capital expenditures 685,615 1,004,297 182,271 2,688,666 963,123 Individual schools 8,110,769 8,406,773 8,295,329 8,523,252 8,203,443 Restricted contributions 35,513 281,398 808,053 2,188,100 986,803 Subsequent years expenditures 202,072 91,135 367,719 - -
Total all other governmental funds 9,537,572$ 10,005,787$ 9,674,396$ 13,511,982$ 11,404,159$
Fiscal Year
WAKE COUNTY BOARD OF EDUCATION
FUND BALANCES, GOVERNMENTAL FUNDSLAST TEN FISCAL YEARS
(modified accrual basis of accounting)
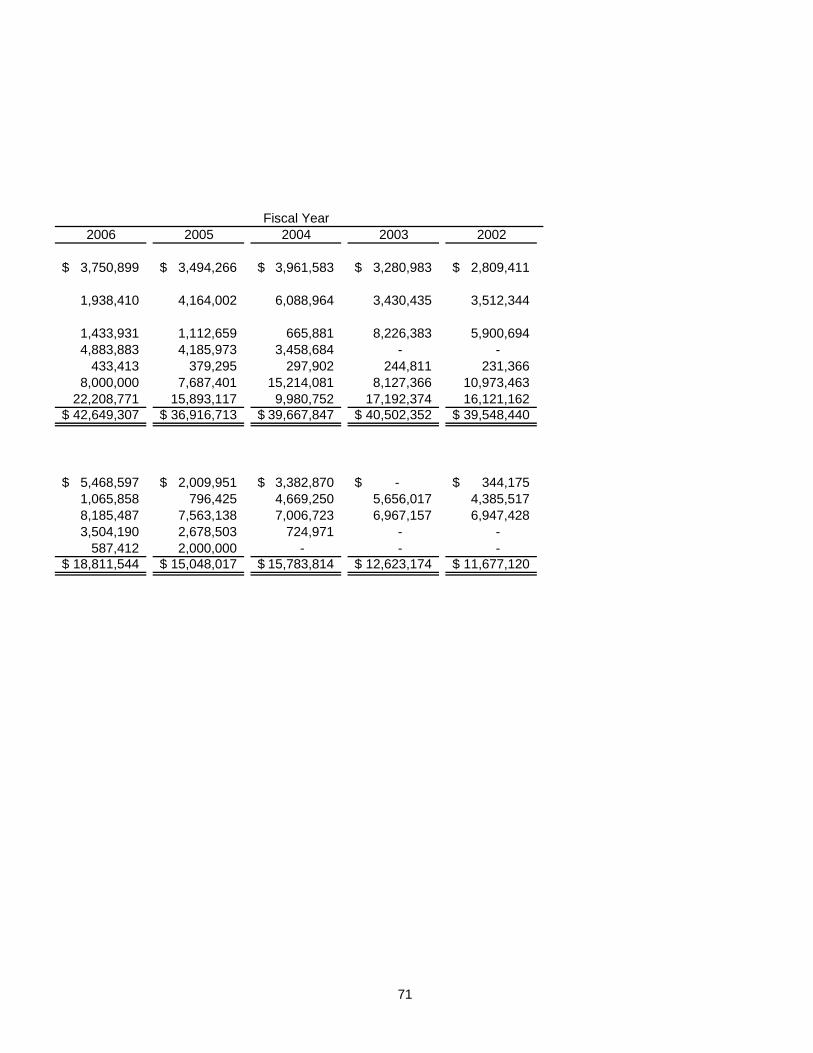
71
2006 2005 2004 2003 2002
3,750,899$ 3,494,266$ 3,961,583$ 3,280,983$ 2,809,411$
1,938,410 4,164,002 6,088,964 3,430,435 3,512,344
1,433,931 1,112,659 665,881 8,226,383 5,900,694 4,883,883 4,185,973 3,458,684 - -
433,413 379,295 297,902 244,811 231,366 8,000,000 7,687,401 15,214,081 8,127,366 10,973,463
22,208,771 15,893,117 9,980,752 17,192,374 16,121,162 42,649,307$ 36,916,713$ 39,667,847$ 40,502,352$ 39,548,440$
5,468,597$ 2,009,951$ 3,382,870$ $ - 344,175$ 1,065,858 796,425 4,669,250 5,656,017 4,385,517 8,185,487 7,563,138 7,006,723 6,967,157 6,947,428 3,504,190 2,678,503 724,971 - -
587,412 2,000,000 - - - 18,811,544$ 15,048,017$ 15,783,814$ 12,623,174$ 11,677,120$
Fiscal Year
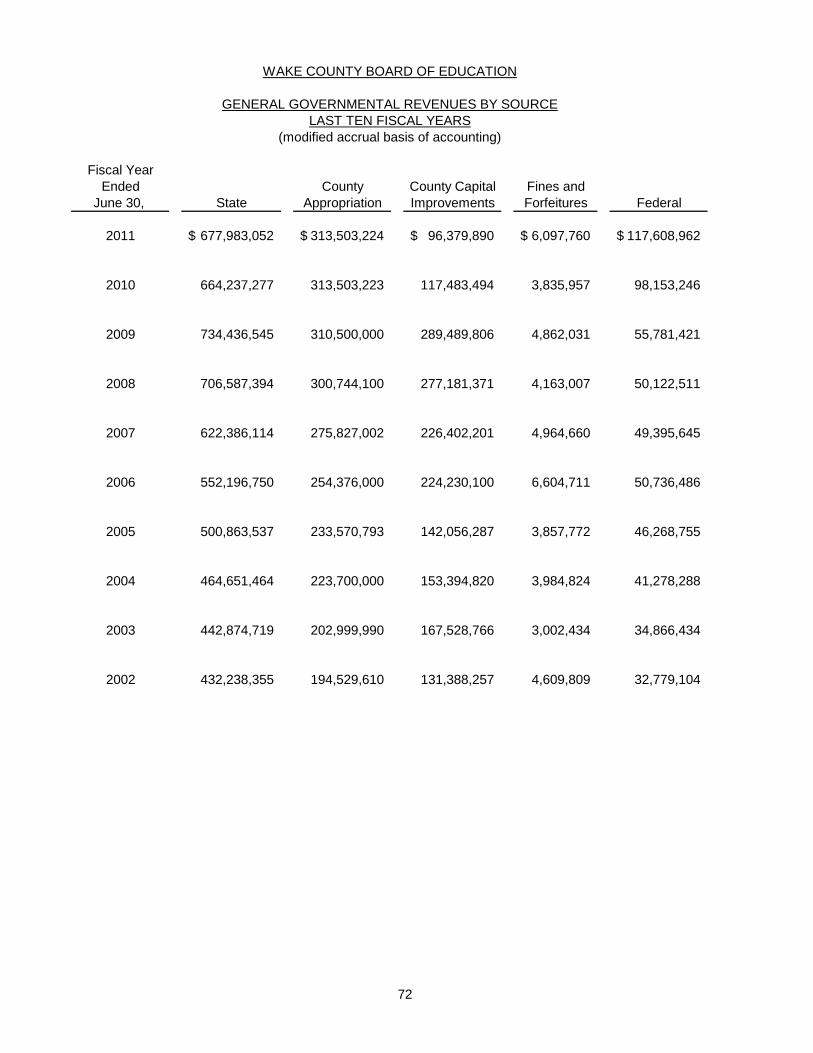
72
Fiscal YearEnded County County Capital Fines and
June 30, State Appropriation Improvements Forfeitures Federal
2011 677,983,052$ 313,503,224$ 96,379,890$ 6,097,760$ 117,608,962$
2010 664,237,277 313,503,223 117,483,494 3,835,957 98,153,246
2009 734,436,545 310,500,000 289,489,806 4,862,031 55,781,421
2008 706,587,394 300,744,100 277,181,371 4,163,007 50,122,511
2007 622,386,114 275,827,002 226,402,201 4,964,660 49,395,645
2006 552,196,750 254,376,000 224,230,100 6,604,711 50,736,486
2005 500,863,537 233,570,793 142,056,287 3,857,772 46,268,755
2004 464,651,464 223,700,000 153,394,820 3,984,824 41,278,288
2003 442,874,719 202,999,990 167,528,766 3,002,434 34,866,434
2002 432,238,355 194,529,610 131,388,257 4,609,809 32,779,104
LAST TEN FISCAL YEARSGENERAL GOVERNMENTAL REVENUES BY SOURCE
WAKE COUNTY BOARD OF EDUCATION
(modified accrual basis of accounting)
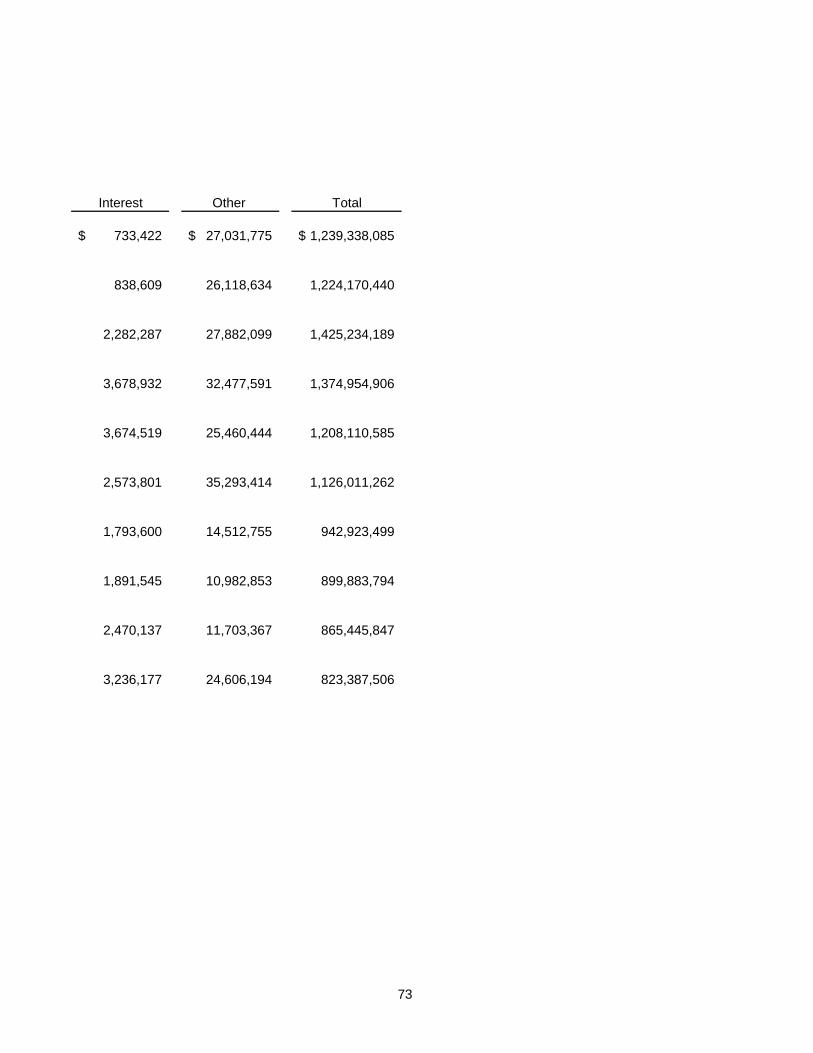
73
Interest Other Total
733,422$ 27,031,775$ 1,239,338,085$
838,609 26,118,634 1,224,170,440
2,282,287 27,882,099 1,425,234,189
3,678,932 32,477,591 1,374,954,906
3,674,519 25,460,444 1,208,110,585
2,573,801 35,293,414 1,126,011,262
1,793,600 14,512,755 942,923,499
1,891,545 10,982,853 899,883,794
2,470,137 11,703,367 865,445,847
3,236,177 24,606,194 823,387,506
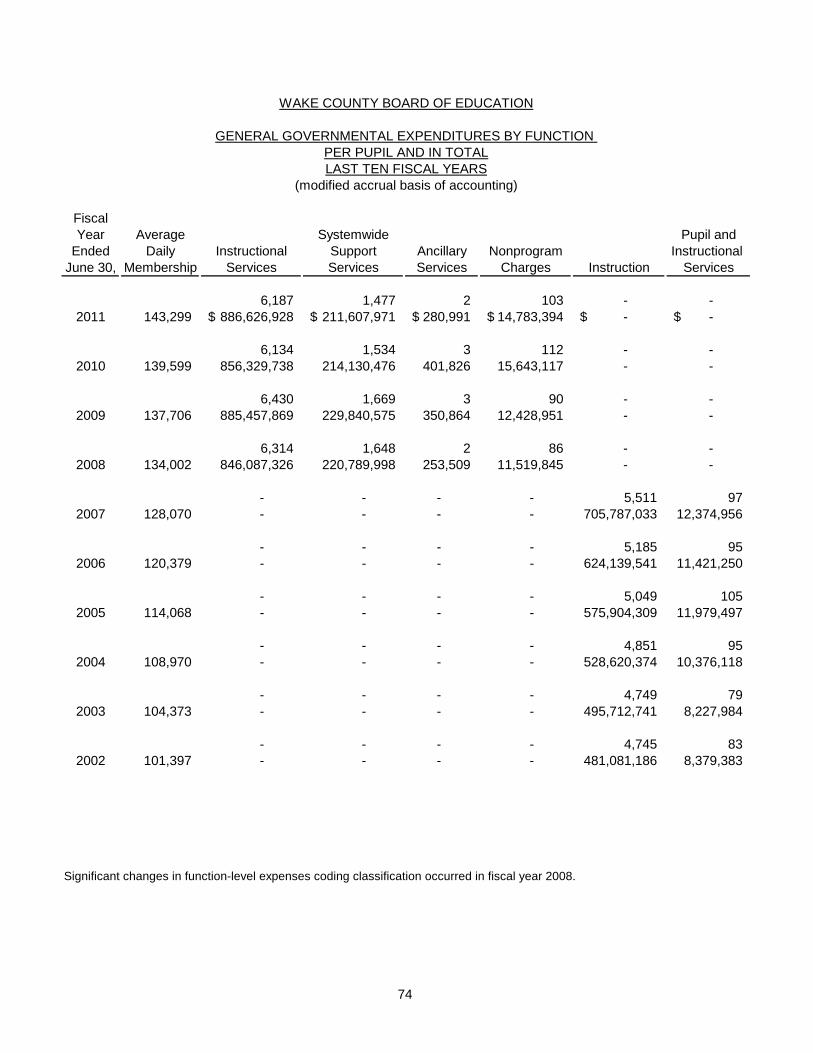
74
FiscalYear Average Systemwide Pupil and
Ended Daily Instructional Support Ancillary Nonprogram Instructional June 30, Membership Services Services Services Charges Instruction Services
6,187 1,477 2 103 - - 2011 143,299 886,626,928$ 211,607,971$ 280,991$ 14,783,394$ -$ -$
6,134 1,534 3 112 - - 2010 139,599 856,329,738 214,130,476 401,826 15,643,117 - -
6,430 1,669 3 90 - - 2009 137,706 885,457,869 229,840,575 350,864 12,428,951 - -
6,314 1,648 2 86 - - 2008 134,002 846,087,326 220,789,998 253,509 11,519,845 - -
- - - - 5,511 97 2007 128,070 - - - - 705,787,033 12,374,956
- - - - 5,185 95 2006 120,379 - - - - 624,139,541 11,421,250
- - - - 5,049 105 2005 114,068 - - - - 575,904,309 11,979,497
- - - - 4,851 95 2004 108,970 - - - - 528,620,374 10,376,118
- - - - 4,749 79 2003 104,373 - - - - 495,712,741 8,227,984
- - - - 4,745 83 2002 101,397 - - - - 481,081,186 8,379,383
Significant changes in function-level expenses coding classification occurred in fiscal year 2008.
WAKE COUNTY BOARD OF EDUCATION
GENERAL GOVERNMENTAL EXPENDITURES BY FUNCTION PER PUPIL AND IN TOTALLAST TEN FISCAL YEARS
(modified accrual basis of accounting)
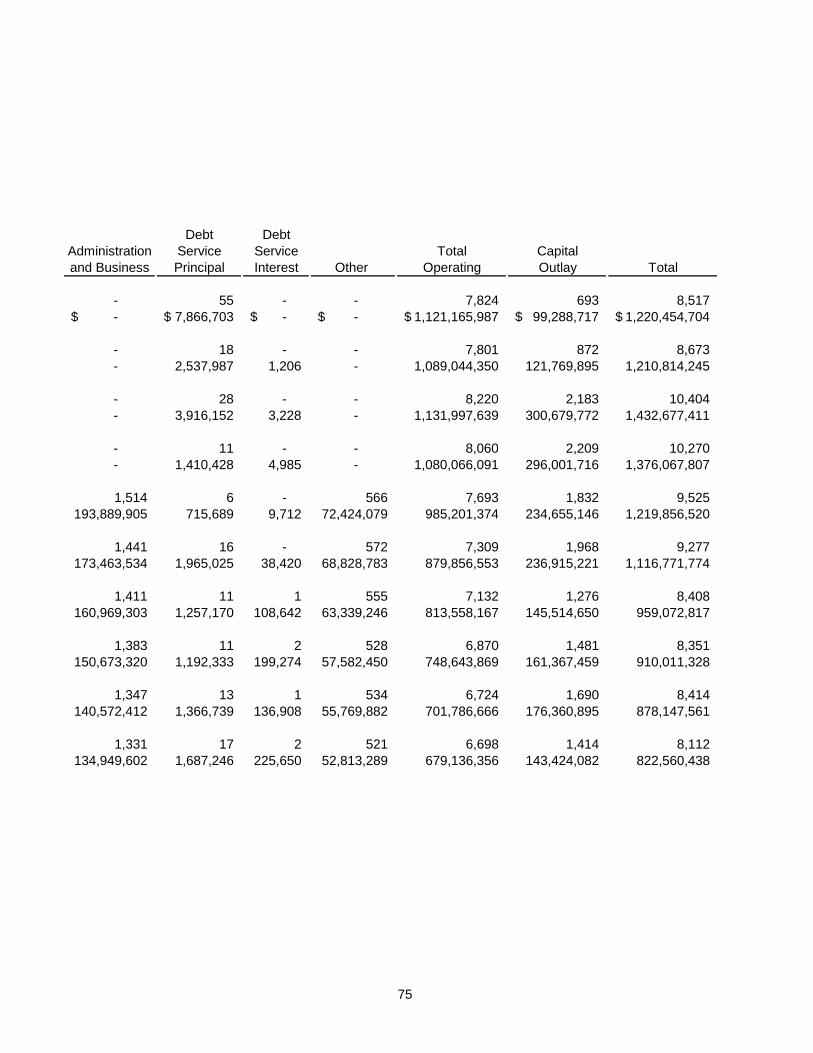
75
Debt DebtAdministration Service Service Total Capitaland Business Principal Interest Other Operating Outlay Total
- 55 - - 7,824 693 8,517 -$ 7,866,703$ -$ -$ 1,121,165,987$ 99,288,717$ 1,220,454,704$
- 18 - - 7,801 872 8,673 - 2,537,987 1,206 - 1,089,044,350 121,769,895 1,210,814,245
- 28 - - 8,220 2,183 10,404 - 3,916,152 3,228 - 1,131,997,639 300,679,772 1,432,677,411
- 11 - - 8,060 2,209 10,270 - 1,410,428 4,985 - 1,080,066,091 296,001,716 1,376,067,807
1,514 6 - 566 7,693 1,832 9,525 193,889,905 715,689 9,712 72,424,079 985,201,374 234,655,146 1,219,856,520
1,441 16 - 572 7,309 1,968 9,277 173,463,534 1,965,025 38,420 68,828,783 879,856,553 236,915,221 1,116,771,774
1,411 11 1 555 7,132 1,276 8,408 160,969,303 1,257,170 108,642 63,339,246 813,558,167 145,514,650 959,072,817
1,383 11 2 528 6,870 1,481 8,351 150,673,320 1,192,333 199,274 57,582,450 748,643,869 161,367,459 910,011,328
1,347 13 1 534 6,724 1,690 8,414 140,572,412 1,366,739 136,908 55,769,882 701,786,666 176,360,895 878,147,561
1,331 17 2 521 6,698 1,414 8,112 134,949,602 1,687,246 225,650 52,813,289 679,136,356 143,424,082 822,560,438
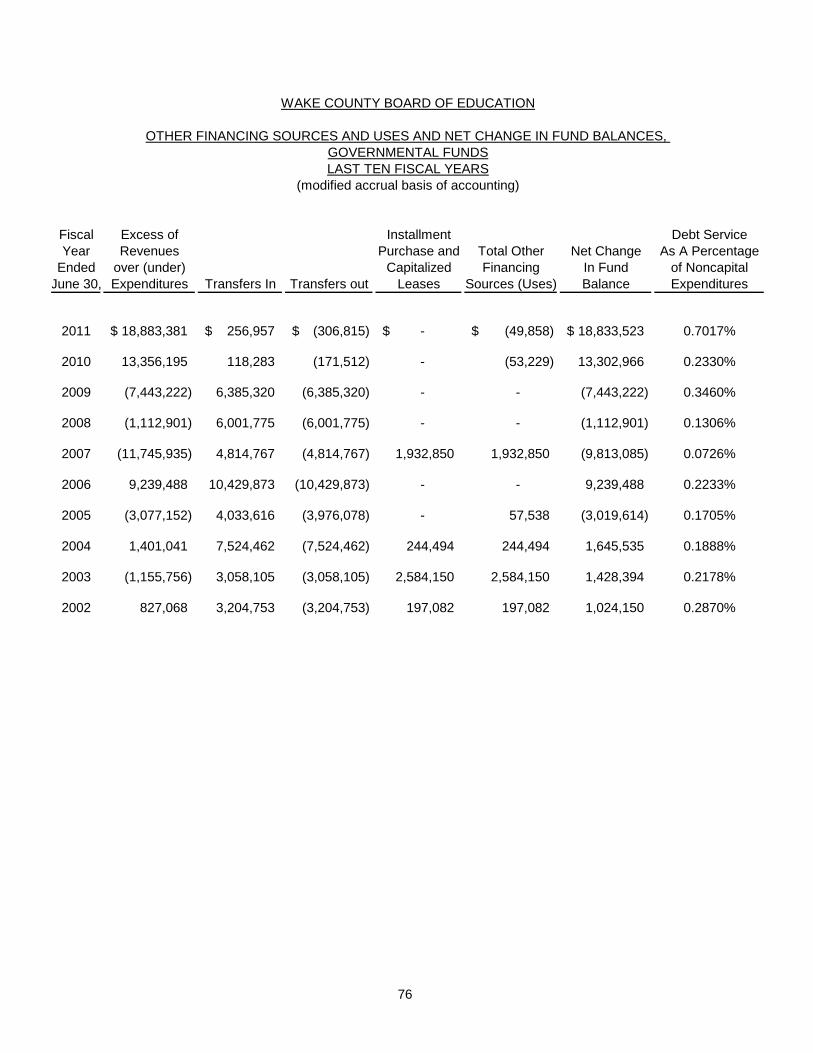
76
Fiscal Excess of Installment Debt ServiceYear Revenues Purchase and Total Other Net Change As A Percentage
Ended over (under) Capitalized Financing In Fund of NoncapitalJune 30, Expenditures Transfers In Transfers out Leases Sources (Uses) Balance Expenditures
2011 18,883,381$ 256,957$ (306,815)$ -$ (49,858)$ 18,833,523$ 0.7017%
2010 13,356,195 118,283 (171,512) - (53,229) 13,302,966 0.2330%
2009 (7,443,222) 6,385,320 (6,385,320) - - (7,443,222) 0.3460%
2008 (1,112,901) 6,001,775 (6,001,775) - - (1,112,901) 0.1306%
2007 (11,745,935) 4,814,767 (4,814,767) 1,932,850 1,932,850 (9,813,085) 0.0726%
2006 9,239,488 10,429,873 (10,429,873) - - 9,239,488 0.2233%
2005 (3,077,152) 4,033,616 (3,976,078) - 57,538 (3,019,614) 0.1705%
2004 1,401,041 7,524,462 (7,524,462) 244,494 244,494 1,645,535 0.1888%
2003 (1,155,756) 3,058,105 (3,058,105) 2,584,150 2,584,150 1,428,394 0.2178%
2002 827,068 3,204,753 (3,204,753) 197,082 197,082 1,024,150 0.2870%
(modified accrual basis of accounting)
WAKE COUNTY BOARD OF EDUCATION
OTHER FINANCING SOURCES AND USES AND NET CHANGE IN FUND BALANCES, GOVERNMENTAL FUNDSLAST TEN FISCAL YEARS
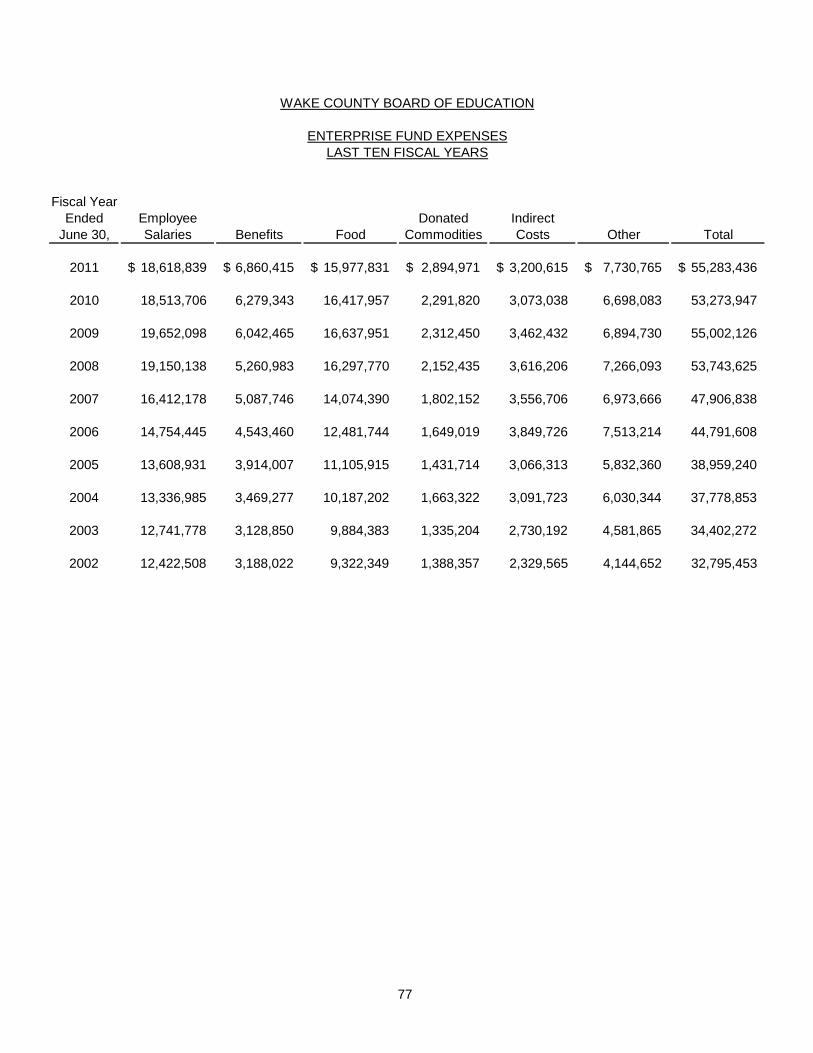
77
WAKE COUNTY BOARD OF EDUCATION
ENTERPRISE FUND EXPENSESLAST TEN FISCAL YEARS
Fiscal YearEnded Employee Donated Indirect
June 30, Salaries Benefits Food Commodities Costs Other Total
2011 18,618,839$ 6,860,415$ 15,977,831$ 2,894,971$ 3,200,615$ 7,730,765$ 55,283,436$
2010 18,513,706 6,279,343 16,417,957 2,291,820 3,073,038 6,698,083 53,273,947
2009 19,652,098 6,042,465 16,637,951 2,312,450 3,462,432 6,894,730 55,002,126
2008 19,150,138 5,260,983 16,297,770 2,152,435 3,616,206 7,266,093 53,743,625
2007 16,412,178 5,087,746 14,074,390 1,802,152 3,556,706 6,973,666 47,906,838
2006 14,754,445 4,543,460 12,481,744 1,649,019 3,849,726 7,513,214 44,791,608
2005 13,608,931 3,914,007 11,105,915 1,431,714 3,066,313 5,832,360 38,959,240
2004 13,336,985 3,469,277 10,187,202 1,663,322 3,091,723 6,030,344 37,778,853
2003 12,741,778 3,128,850 9,884,383 1,335,204 2,730,192 4,581,865 34,402,272
2002 12,422,508 3,188,022 9,322,349 1,388,357 2,329,565 4,144,652 32,795,453
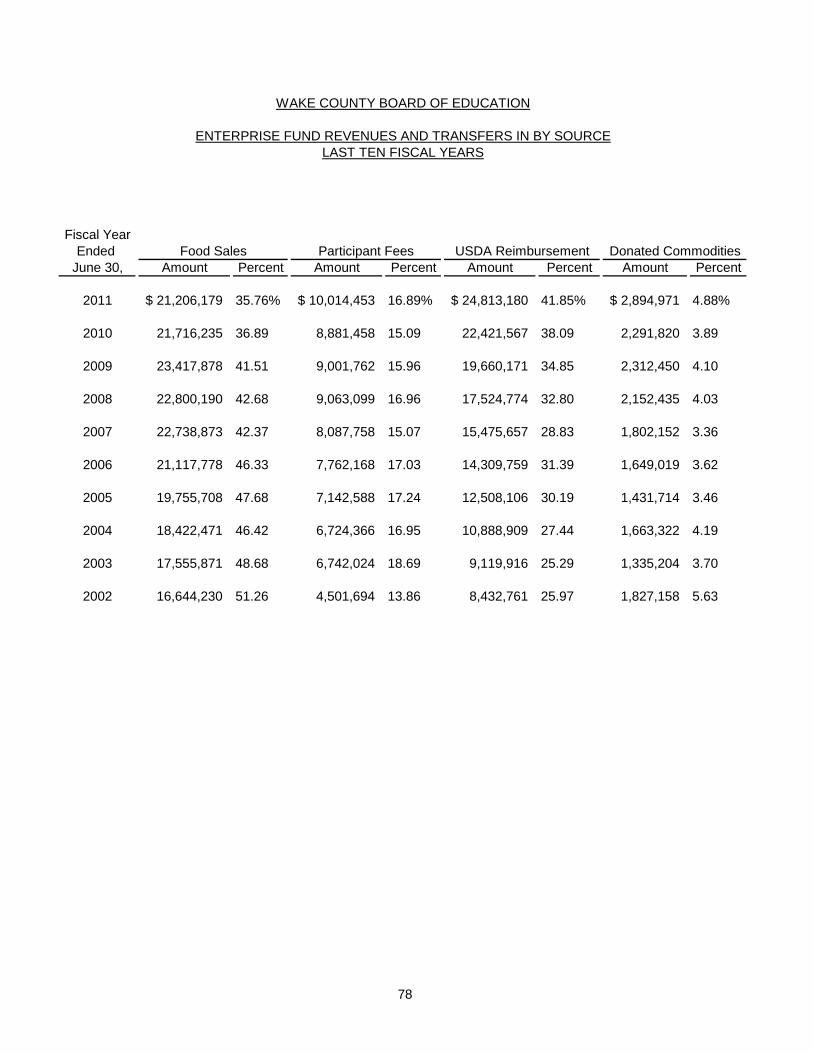
78
Fiscal YearEnded USDA Reimbursement Donated Commodities
June 30, Amount Percent Amount Percent Amount Percent Amount Percent
2011 21,206,179$ 35.76% 10,014,453$ 16.89% 24,813,180$ 41.85% 2,894,971$ 4.88%
2010 21,716,235 36.89 8,881,458 15.09 22,421,567 38.09 2,291,820 3.89
2009 23,417,878 41.51 9,001,762 15.96 19,660,171 34.85 2,312,450 4.10
2008 22,800,190 42.68 9,063,099 16.96 17,524,774 32.80 2,152,435 4.03
2007 22,738,873 42.37 8,087,758 15.07 15,475,657 28.83 1,802,152 3.36
2006 21,117,778 46.33 7,762,168 17.03 14,309,759 31.39 1,649,019 3.62
2005 19,755,708 47.68 7,142,588 17.24 12,508,106 30.19 1,431,714 3.46
2004 18,422,471 46.42 6,724,366 16.95 10,888,909 27.44 1,663,322 4.19
2003 17,555,871 48.68 6,742,024 18.69 9,119,916 25.29 1,335,204 3.70
2002 16,644,230 51.26 4,501,694 13.86 8,432,761 25.97 1,827,158 5.63
Food Sales Participant Fees
WAKE COUNTY BOARD OF EDUCATION
ENTERPRISE FUND REVENUES AND TRANSFERS IN BY SOURCELAST TEN FISCAL YEARS
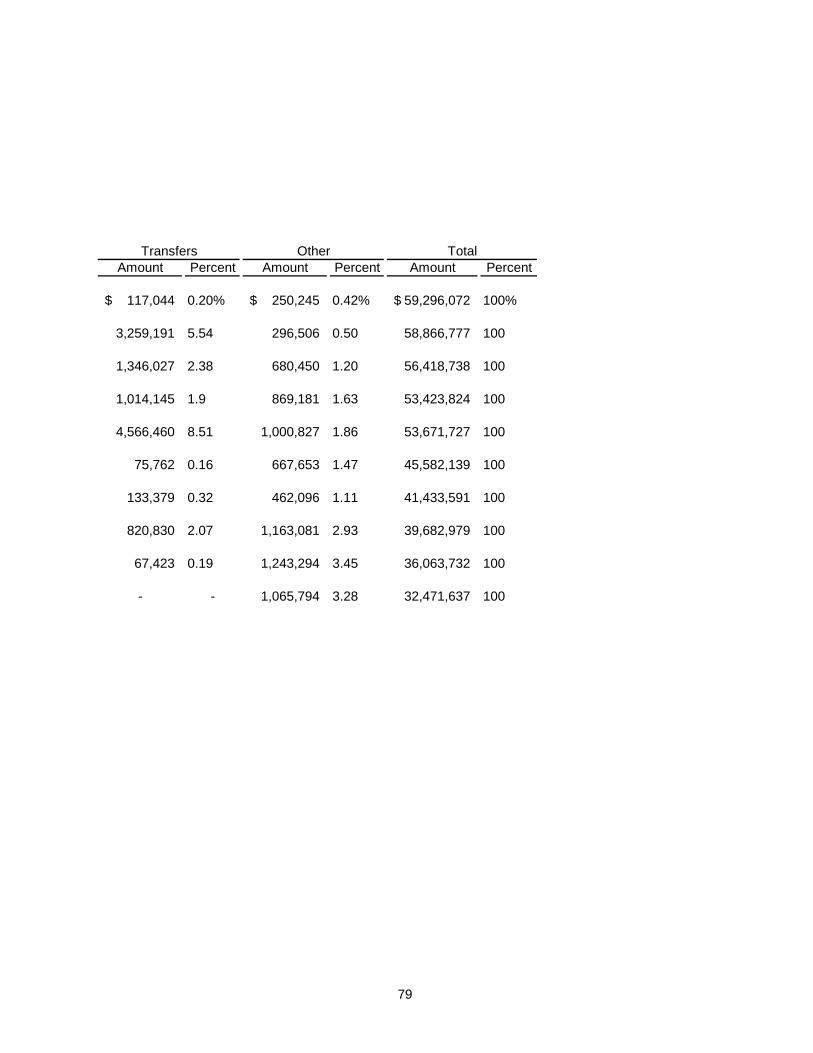
79
Transfers Other TotalAmount Percent Amount Percent Amount Percent
117,044$ 0.20% 250,245$ 0.42% 59,296,072$ 100%
3,259,191 5.54 296,506 0.50 58,866,777 100
1,346,027 2.38 680,450 1.20 56,418,738 100
1,014,145 1.9 869,181 1.63 53,423,824 100
4,566,460 8.51 1,000,827 1.86 53,671,727 100
75,762 0.16 667,653 1.47 45,582,139 100
133,379 0.32 462,096 1.11 41,433,591 100
820,830 2.07 1,163,081 2.93 39,682,979 100
67,423 0.19 1,243,294 3.45 36,063,732 100
- - 1,065,794 3.28 32,471,637 100
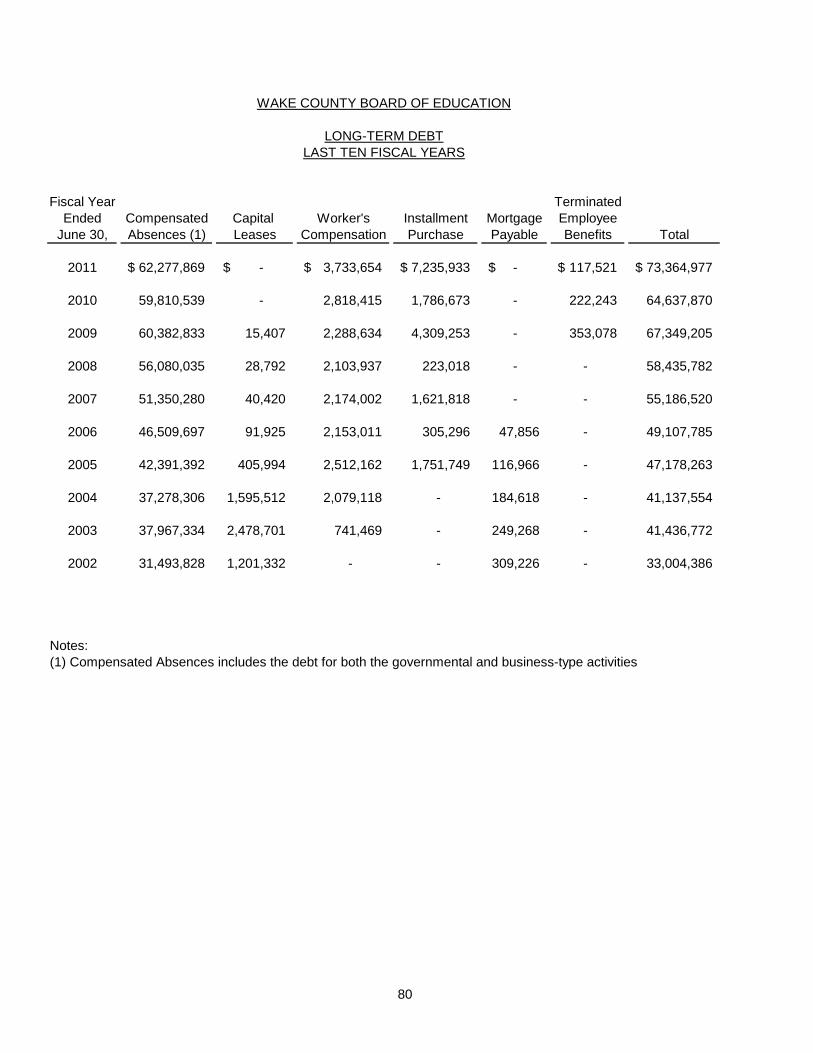
80
WAKE COUNTY BOARD OF EDUCATION
LONG-TERM DEBTLAST TEN FISCAL YEARS
Fiscal Year TerminatedEnded Compensated Capital Worker's Installment Mortgage Employee
June 30, Absences (1) Leases Compensation Purchase Payable Benefits Total
2011 62,277,869$ -$ 3,733,654$ 7,235,933$ -$ 117,521$ 73,364,977$
2010 59,810,539 - 2,818,415 1,786,673 - 222,243 64,637,870
2009 60,382,833 15,407 2,288,634 4,309,253 - 353,078 67,349,205
2008 56,080,035 28,792 2,103,937 223,018 - - 58,435,782
2007 51,350,280 40,420 2,174,002 1,621,818 - - 55,186,520
2006 46,509,697 91,925 2,153,011 305,296 47,856 - 49,107,785
2005 42,391,392 405,994 2,512,162 1,751,749 116,966 - 47,178,263
2004 37,278,306 1,595,512 2,079,118 - 184,618 - 41,137,554
2003 37,967,334 2,478,701 741,469 - 249,268 - 41,436,772
2002 31,493,828 1,201,332 - - 309,226 - 33,004,386
Notes:(1) Compensated Absences includes the debt for both the governmental and business-type activities
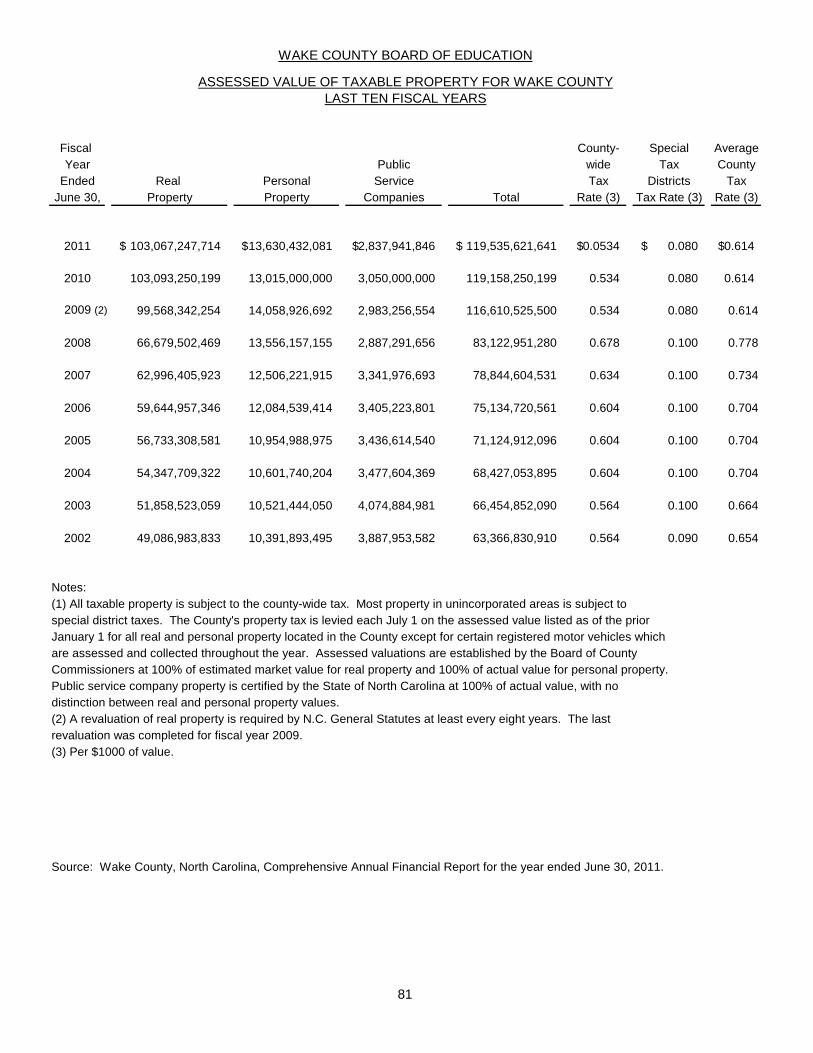
81
Fiscal County- Special AverageYear Public wide Tax County
Ended Real Personal Service Tax Districts TaxJune 30, Property Property Companies Total Rate (3) Tax Rate (3) Rate (3)
2011 103,067,247,714$ 13,630,432,081$ 2,837,941,846$ 119,535,621,641$ 0.0534$ 0.080$ 0.614$
2010 103,093,250,199 13,015,000,000 3,050,000,000 119,158,250,199 0.534 0.080 0.614
2009 (2) 99,568,342,254 14,058,926,692 2,983,256,554 116,610,525,500 0.534 0.080 0.614
2008 66,679,502,469 13,556,157,155 2,887,291,656 83,122,951,280 0.678 0.100 0.778
2007 62,996,405,923 12,506,221,915 3,341,976,693 78,844,604,531 0.634 0.100 0.734
2006 59,644,957,346 12,084,539,414 3,405,223,801 75,134,720,561 0.604 0.100 0.704
2005 56,733,308,581 10,954,988,975 3,436,614,540 71,124,912,096 0.604 0.100 0.704
2004 54,347,709,322 10,601,740,204 3,477,604,369 68,427,053,895 0.604 0.100 0.704
2003 51,858,523,059 10,521,444,050 4,074,884,981 66,454,852,090 0.564 0.100 0.664
2002 49,086,983,833 10,391,893,495 3,887,953,582 63,366,830,910 0.564 0.090 0.654
Notes:(1) All taxable property is subject to the county-wide tax. Most property in unincorporated areas is subject to special district taxes. The County's property tax is levied each July 1 on the assessed value listed as of the prior January 1 for all real and personal property located in the County except for certain registered motor vehicles whichare assessed and collected throughout the year. Assessed valuations are established by the Board of CountyCommissioners at 100% of estimated market value for real property and 100% of actual value for personal property. Public service company property is certified by the State of North Carolina at 100% of actual value, with no distinction between real and personal property values.(2) A revaluation of real property is required by N.C. General Statutes at least every eight years. The last revaluation was completed for fiscal year 2009.(3) Per $1000 of value.
Source: Wake County, North Carolina, Comprehensive Annual Financial Report for the year ended June 30, 2011.
WAKE COUNTY BOARD OF EDUCATION
ASSESSED VALUE OF TAXABLE PROPERTY FOR WAKE COUNTYLAST TEN FISCAL YEARS
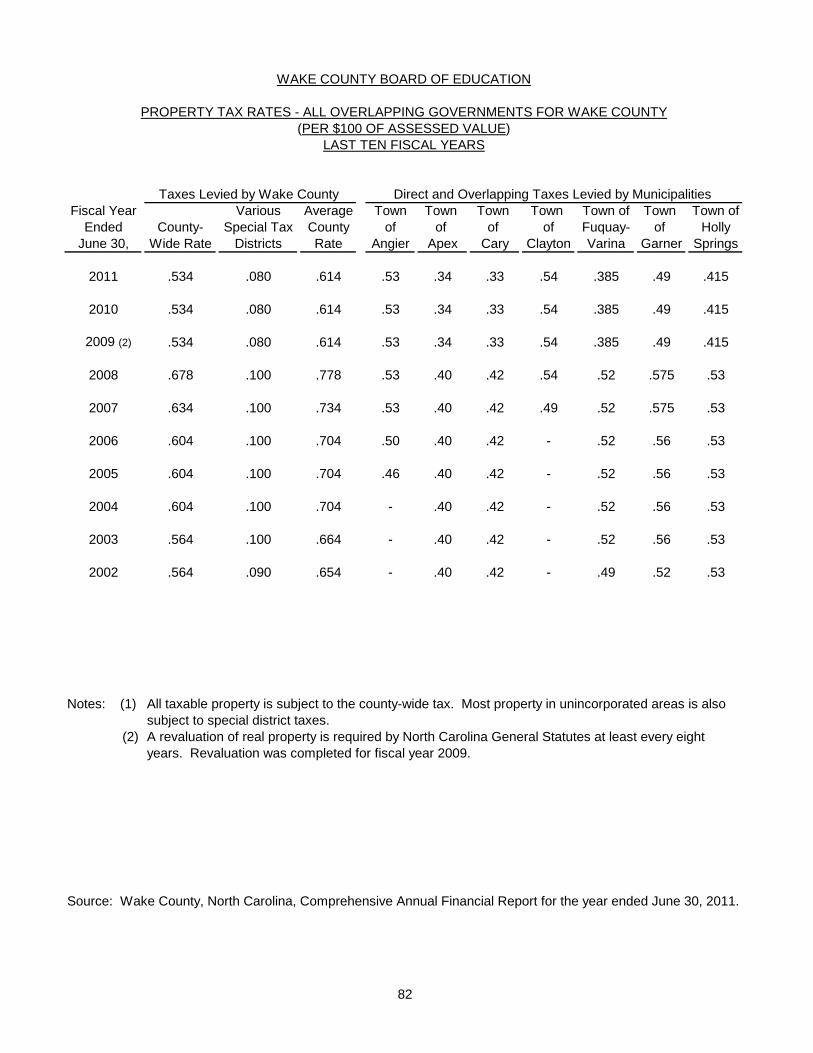
82
Taxes Levied by Wake County Fiscal Year Various Average Town Town Town Town Town of Town Town of
Ended County- Special Tax County of of of of Fuquay- of HollyJune 30, Wide Rate Districts Rate Angier Apex Cary Clayton Varina Garner Springs
2011 .534 .080 .614 .53 .34 .33 .54 .385 .49 .415
2010 .534 .080 .614 .53 .34 .33 .54 .385 .49 .415
2009 (2) .534 .080 .614 .53 .34 .33 .54 .385 .49 .415
2008 .678 .100 .778 .53 .40 .42 .54 .52 .575 .53
2007 .634 .100 .734 .53 .40 .42 .49 .52 .575 .53
2006 .604 .100 .704 .50 .40 .42 - .52 .56 .53
2005 .604 .100 .704 .46 .40 .42 - .52 .56 .53
2004 .604 .100 .704 - .40 .42 - .52 .56 .53
2003 .564 .100 .664 - .40 .42 - .52 .56 .53
2002 .564 .090 .654 - .40 .42 - .49 .52 .53
Notes: (1) All taxable property is subject to the county-wide tax. Most property in unincorporated areas is alsosubject to special district taxes.
(2) A revaluation of real property is required by North Carolina General Statutes at least every eightyears. Revaluation was completed for fiscal year 2009.
Source: Wake County, North Carolina, Comprehensive Annual Financial Report for the year ended June 30, 2011.
Direct and Overlapping Taxes Levied by Municipalities
WAKE COUNTY BOARD OF EDUCATION
PROPERTY TAX RATES - ALL OVERLAPPING GOVERNMENTS FOR WAKE COUNTY(PER $100 OF ASSESSED VALUE)
LAST TEN FISCAL YEARS
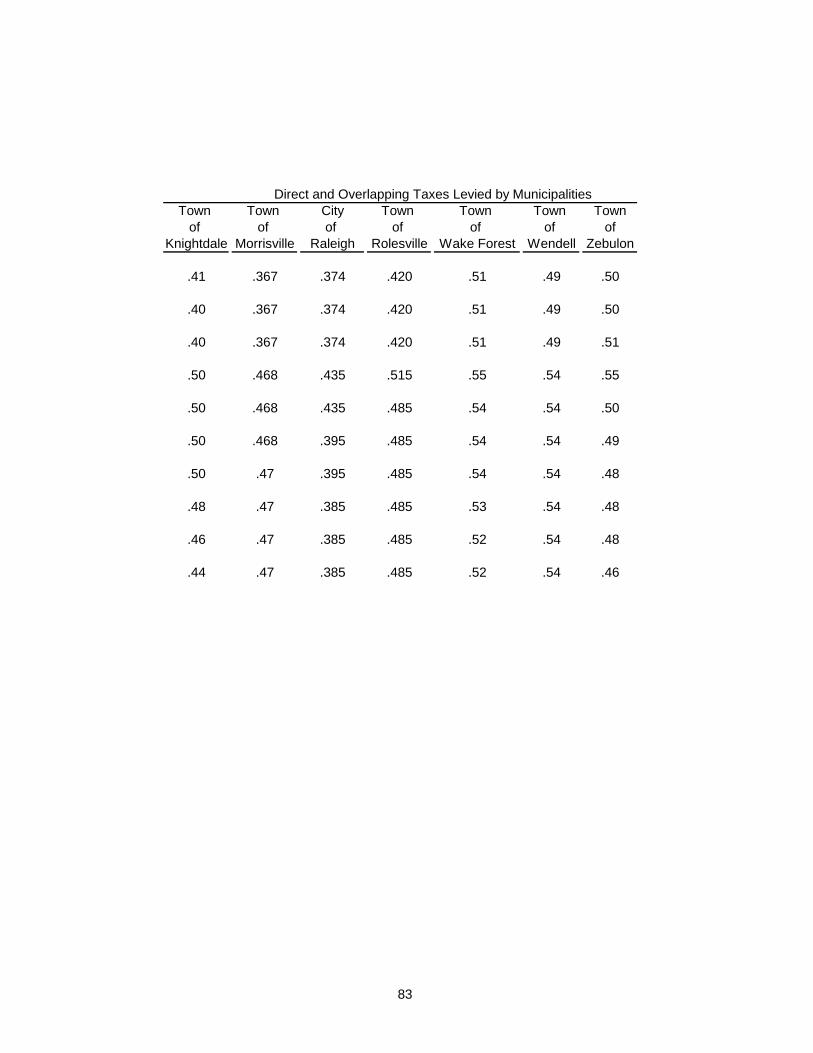
83
Town Town City Town Town Town Townof of of of of of of
Knightdale Morrisville Raleigh Rolesville Wake Forest Wendell Zebulon
.41 .367 .374 .420 .51 .49 .50
.40 .367 .374 .420 .51 .49 .50
.40 .367 .374 .420 .51 .49 .51
.50 .468 .435 .515 .55 .54 .55
.50 .468 .435 .485 .54 .54 .50
.50 .468 .395 .485 .54 .54 .49
.50 .47 .395 .485 .54 .54 .48
.48 .47 .385 .485 .53 .54 .48
.46 .47 .385 .485 .52 .54 .48
.44 .47 .385 .485 .52 .54 .46
Direct and Overlapping Taxes Levied by Municipalities
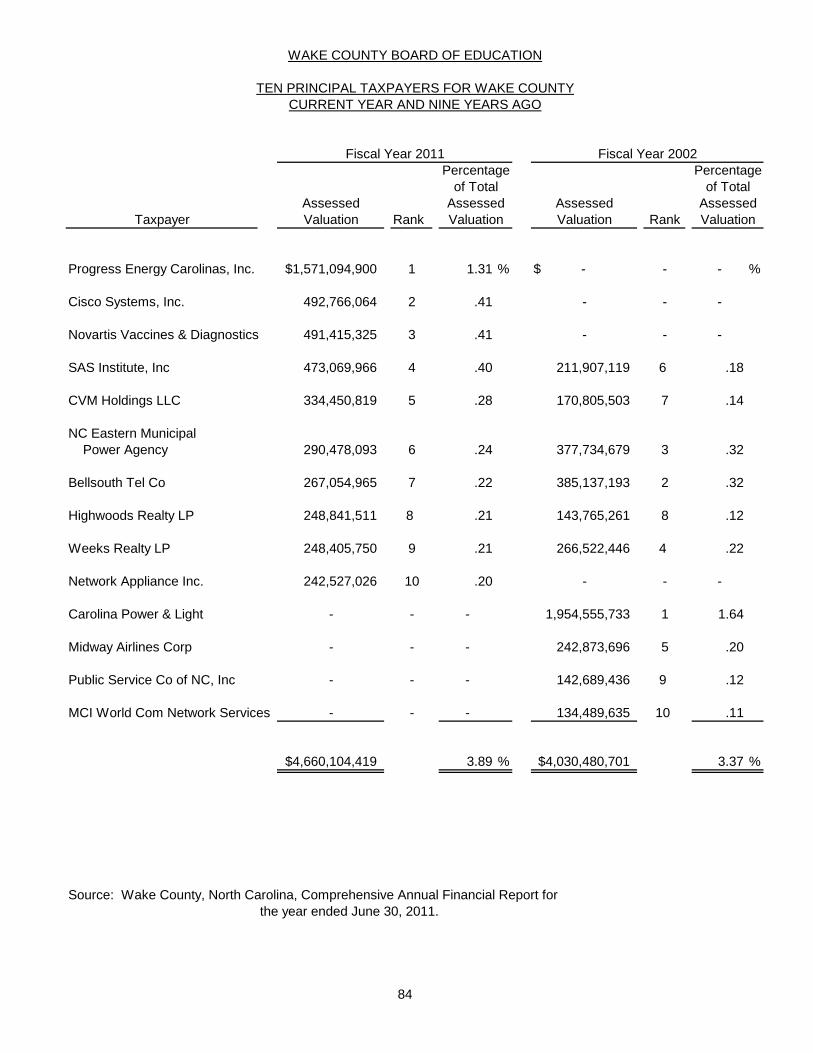
84
Percentage Percentageof Total of Total
Assessed Assessed Assessed AssessedTaxpayer Valuation Rank Valuation Valuation Rank Valuation
Progress Energy Carolinas, Inc. $1,571,094,900 1 1.31 % $ - - - %
Cisco Systems, Inc. 492,766,064 2 .41 - - -
Novartis Vaccines & Diagnostics 491,415,325 3 .41 - - -
SAS Institute, Inc 473,069,966 4 .40 211,907,119 6 .18
CVM Holdings LLC 334,450,819 5 .28 170,805,503 7 .14
NC Eastern Municipal Power Agency 290,478,093 6 .24 377,734,679 3 .32
Bellsouth Tel Co 267,054,965 7 .22 385,137,193 2 .32
Highwoods Realty LP 248,841,511 8 .21 143,765,261 8 .12
Weeks Realty LP 248,405,750 9 .21 266,522,446 4 .22
Network Appliance Inc. 242,527,026 10 .20 - - -
Carolina Power & Light - - - 1,954,555,733 1 1.64
Midway Airlines Corp - - - 242,873,696 5 .20
Public Service Co of NC, Inc - - - 142,689,436 9 .12
MCI World Com Network Services - - - 134,489,635 10 .11
$4,660,104,419 3.89 % $4,030,480,701 3.37 %
Source: Wake County, North Carolina, Comprehensive Annual Financial Report for the year ended June 30, 2011.
Fiscal Year 2011 Fiscal Year 2002
WAKE COUNTY BOARD OF EDUCATION
TEN PRINCIPAL TAXPAYERS FOR WAKE COUNTYCURRENT YEAR AND NINE YEARS AGO
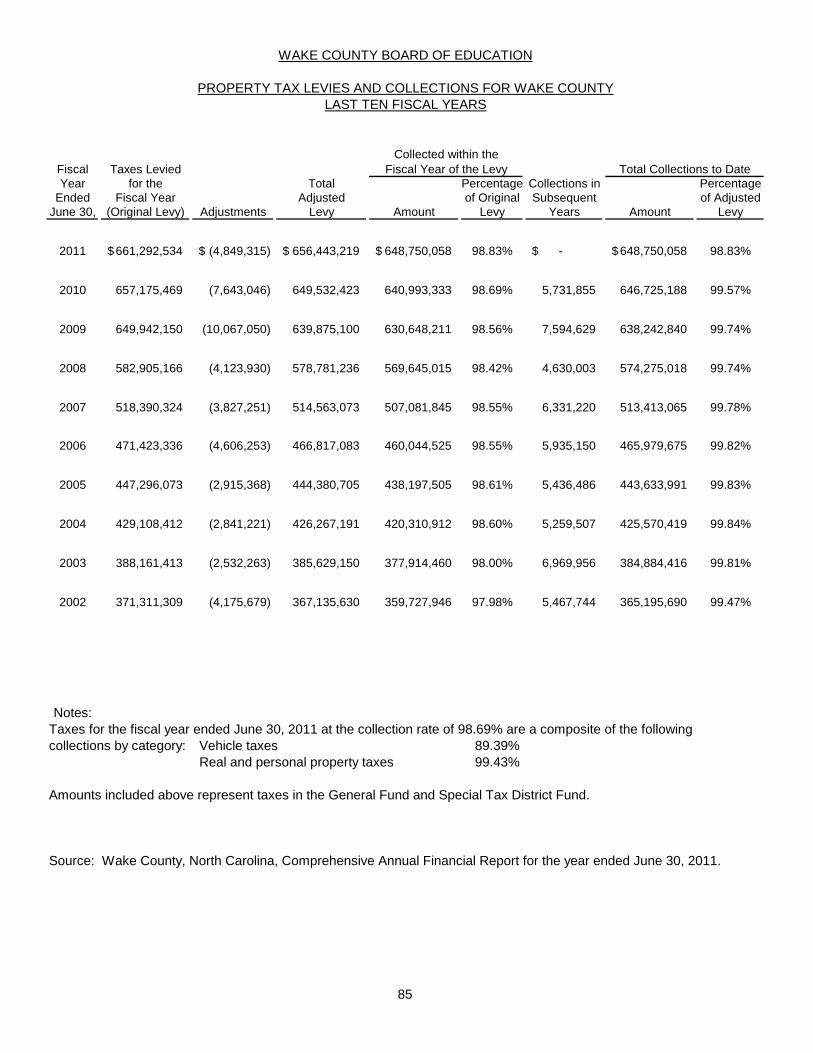
85
WAKE COUNTY BOARD OF EDUCATION
PROPERTY TAX LEVIES AND COLLECTIONS FOR WAKE COUNTYLAST TEN FISCAL YEARS
Fiscal Taxes LeviedYear for the Total Percentage Collections in Percentage
Ended Fiscal Year Adjusted of Original Subsequent of AdjustedJune 30, (Original Levy) Adjustments Levy Amount Levy Years Amount Levy
2011 661,292,534$ (4,849,315)$ 656,443,219$ 648,750,058$ 98.83% $ - 648,750,058$ 98.83%
2010 657,175,469 (7,643,046) 649,532,423 640,993,333 98.69% 5,731,855 646,725,188 99.57%
2009 649,942,150 (10,067,050) 639,875,100 630,648,211 98.56% 7,594,629 638,242,840 99.74%
2008 582,905,166 (4,123,930) 578,781,236 569,645,015 98.42% 4,630,003 574,275,018 99.74%
2007 518,390,324 (3,827,251) 514,563,073 507,081,845 98.55% 6,331,220 513,413,065 99.78%
2006 471,423,336 (4,606,253) 466,817,083 460,044,525 98.55% 5,935,150 465,979,675 99.82%
2005 447,296,073 (2,915,368) 444,380,705 438,197,505 98.61% 5,436,486 443,633,991 99.83%
2004 429,108,412 (2,841,221) 426,267,191 420,310,912 98.60% 5,259,507 425,570,419 99.84%
2003 388,161,413 (2,532,263) 385,629,150 377,914,460 98.00% 6,969,956 384,884,416 99.81%
2002 371,311,309 (4,175,679) 367,135,630 359,727,946 97.98% 5,467,744 365,195,690 99.47%
Notes:Taxes for the fiscal year ended June 30, 2011 at the collection rate of 98.69% are a composite of the followingcollections by category: Vehicle taxes 89.39%
Real and personal property taxes 99.43%
Amounts included above represent taxes in the General Fund and Special Tax District Fund.
Source: Wake County, North Carolina, Comprehensive Annual Financial Report for the year ended June 30, 2011.
Collected within theFiscal Year of the Levy Total Collections to Date
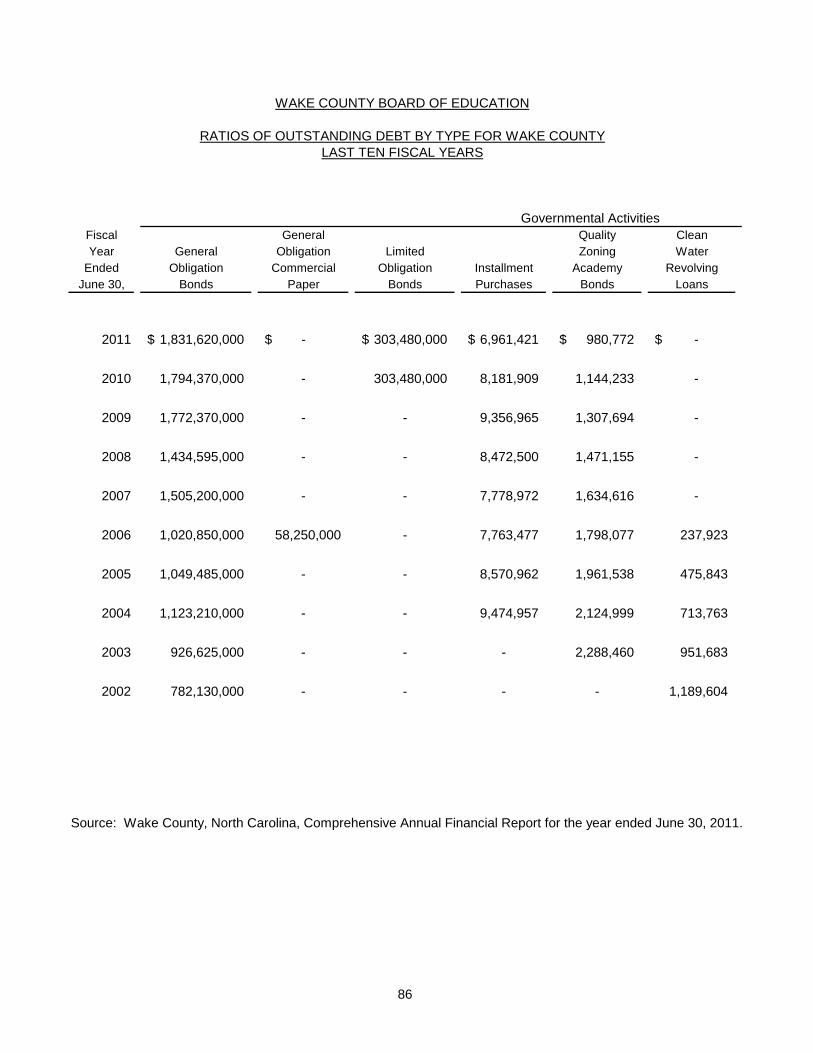
86
Fiscal General Quality CleanYear General Obligation Limited Zoning Water
Ended Obligation Commercial Obligation Installment Academy RevolvingJune 30, Bonds Paper Bonds Purchases Bonds Loans
2011 1,831,620,000$ $ - 303,480,000$ 6,961,421$ 980,772$ -$
2010 1,794,370,000 - 303,480,000 8,181,909 1,144,233 -
2009 1,772,370,000 - - 9,356,965 1,307,694 -
2008 1,434,595,000 - - 8,472,500 1,471,155 -
2007 1,505,200,000 - - 7,778,972 1,634,616 -
2006 1,020,850,000 58,250,000 - 7,763,477 1,798,077 237,923
2005 1,049,485,000 - - 8,570,962 1,961,538 475,843
2004 1,123,210,000 - - 9,474,957 2,124,999 713,763
2003 926,625,000 - - - 2,288,460 951,683
2002 782,130,000 - - - - 1,189,604
Source: Wake County, North Carolina, Comprehensive Annual Financial Report for the year ended June 30, 2011.
Governmental Activities
WAKE COUNTY BOARD OF EDUCATION
RATIOS OF OUTSTANDING DEBT BY TYPE FOR WAKE COUNTYLAST TEN FISCAL YEARS
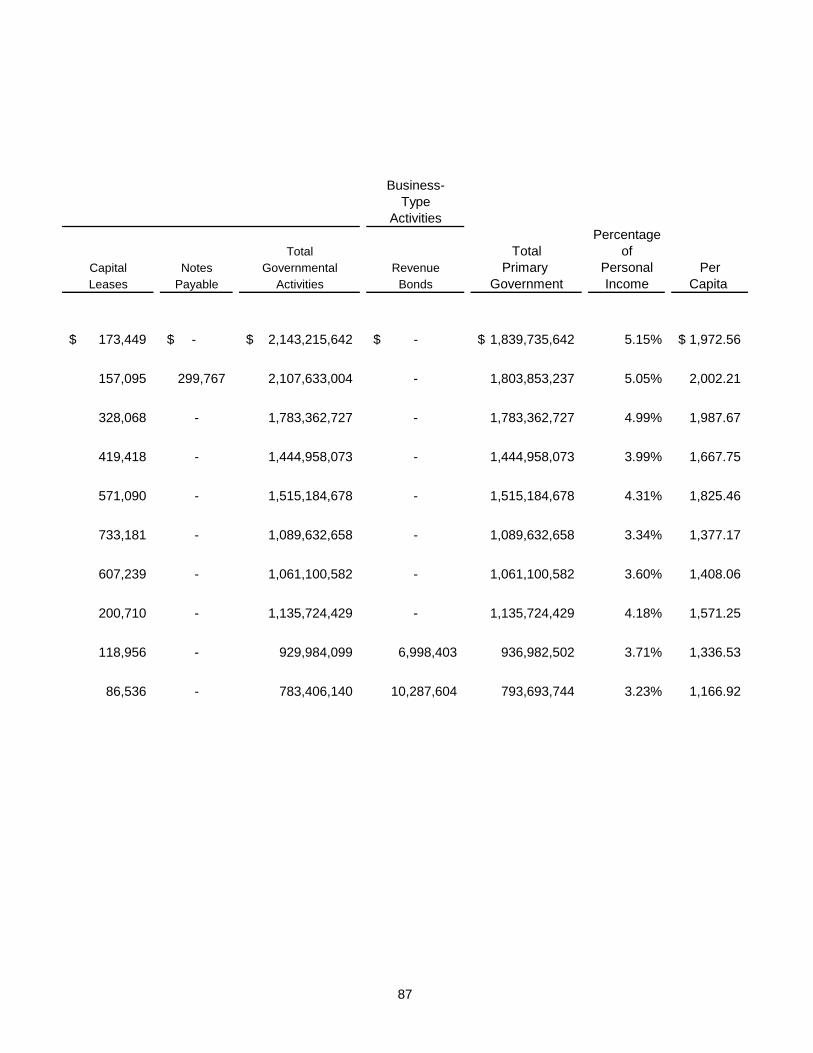
87
Business-Type
ActivitiesPercentage
Total Total ofCapital Notes Governmental Revenue Primary Personal PerLeases Payable Activities Bonds Government Income Capita
173,449$ -$ 2,143,215,642$ $ - 1,839,735,642$ 5.15% 1,972.56$
157,095 299,767 2,107,633,004 - 1,803,853,237 5.05% 2,002.21
328,068 - 1,783,362,727 - 1,783,362,727 4.99% 1,987.67
419,418 - 1,444,958,073 - 1,444,958,073 3.99% 1,667.75
571,090 - 1,515,184,678 - 1,515,184,678 4.31% 1,825.46
733,181 - 1,089,632,658 - 1,089,632,658 3.34% 1,377.17
607,239 - 1,061,100,582 - 1,061,100,582 3.60% 1,408.06
200,710 - 1,135,724,429 - 1,135,724,429 4.18% 1,571.25
118,956 - 929,984,099 6,998,403 936,982,502 3.71% 1,336.53
86,536 - 783,406,140 10,287,604 793,693,744 3.23% 1,166.92
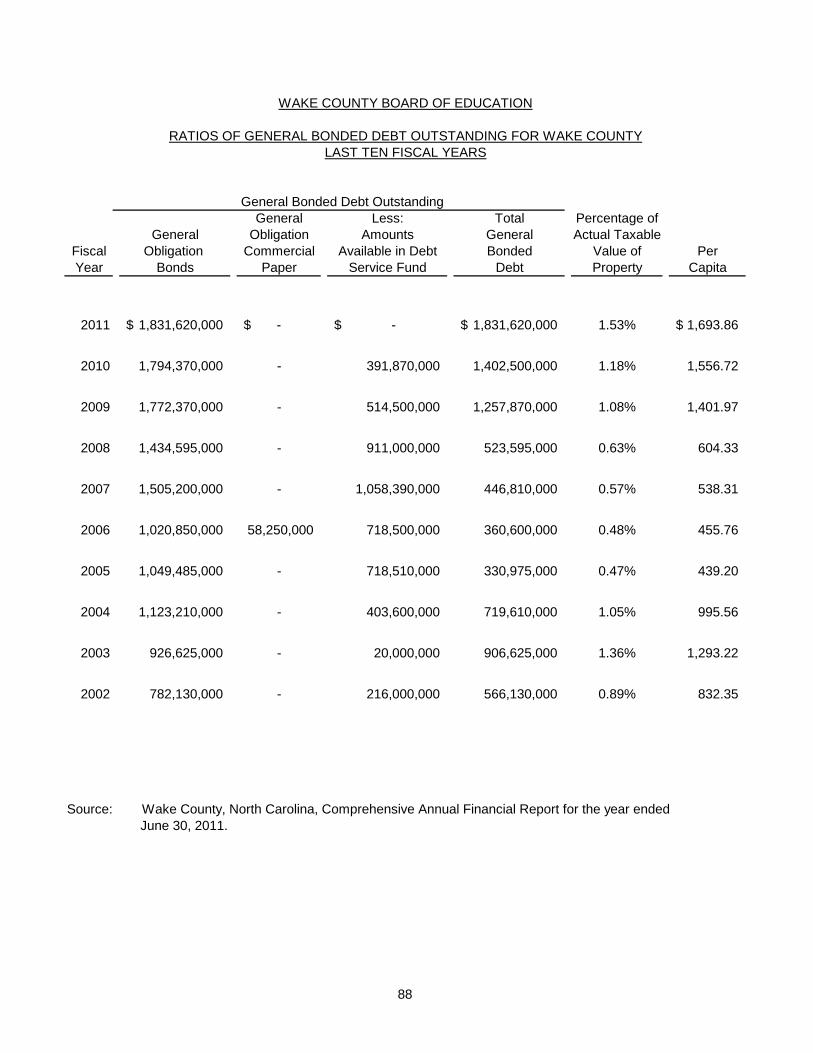
88
General Less: Total Percentage ofGeneral Obligation Amounts General Actual Taxable
Fiscal Obligation Commercial Available in Debt Bonded Value of PerYear Bonds Paper Service Fund Debt Property Capita
2011 1,831,620,000$ $ - -$ 1,831,620,000$ 1.53% 1,693.86$
2010 1,794,370,000 - 391,870,000 1,402,500,000 1.18% 1,556.72
2009 1,772,370,000 - 514,500,000 1,257,870,000 1.08% 1,401.97
2008 1,434,595,000 - 911,000,000 523,595,000 0.63% 604.33
2007 1,505,200,000 - 1,058,390,000 446,810,000 0.57% 538.31
2006 1,020,850,000 58,250,000 718,500,000 360,600,000 0.48% 455.76
2005 1,049,485,000 - 718,510,000 330,975,000 0.47% 439.20
2004 1,123,210,000 - 403,600,000 719,610,000 1.05% 995.56
2003 926,625,000 - 20,000,000 906,625,000 1.36% 1,293.22
2002 782,130,000 - 216,000,000 566,130,000 0.89% 832.35
Source: Wake County, North Carolina, Comprehensive Annual Financial Report for the year ended June 30, 2011.
WAKE COUNTY BOARD OF EDUCATION
RATIOS OF GENERAL BONDED DEBT OUTSTANDING FOR WAKE COUNTYLAST TEN FISCAL YEARS
General Bonded Debt Outstanding
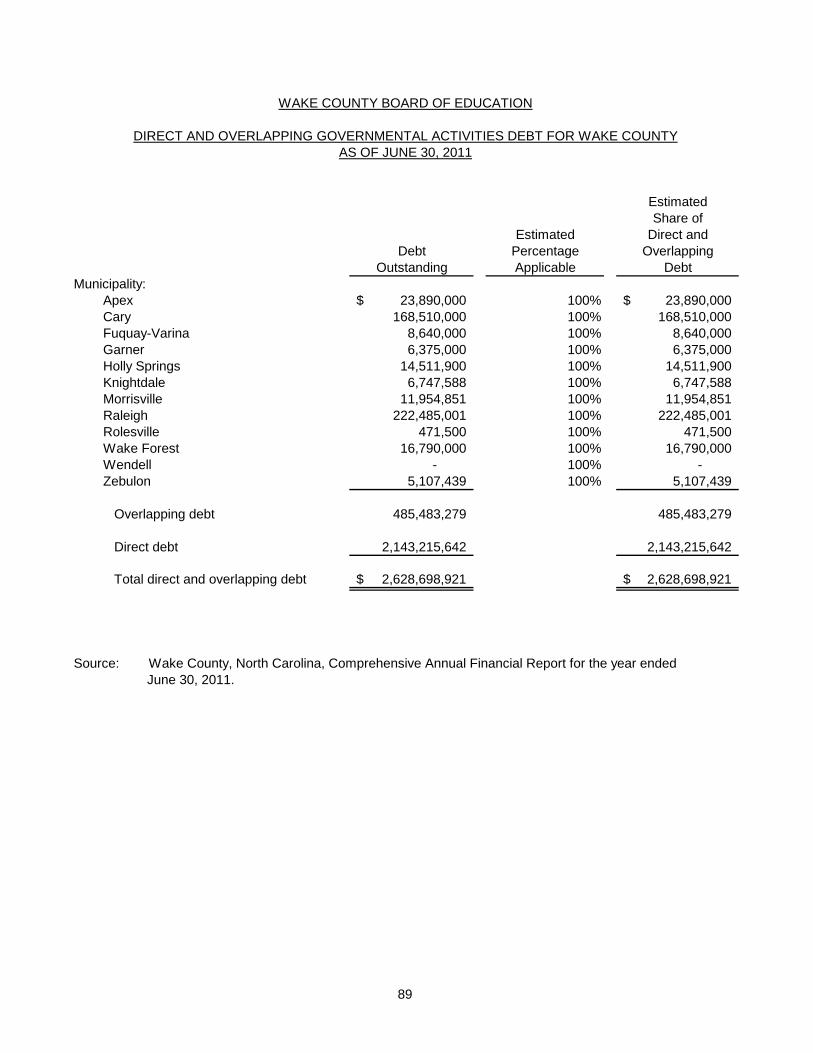
89
EstimatedShare of
Estimated Direct andDebt Percentage Overlapping
Outstanding Applicable DebtMunicipality:
Apex 23,890,000$ 100% 23,890,000$ Cary 168,510,000 100% 168,510,000 Fuquay-Varina 8,640,000 100% 8,640,000 Garner 6,375,000 100% 6,375,000 Holly Springs 14,511,900 100% 14,511,900 Knightdale 6,747,588 100% 6,747,588 Morrisville 11,954,851 100% 11,954,851 Raleigh 222,485,001 100% 222,485,001 Rolesville 471,500 100% 471,500 Wake Forest 16,790,000 100% 16,790,000 Wendell - 100% - Zebulon 5,107,439 100% 5,107,439
Overlapping debt 485,483,279 485,483,279
Direct debt 2,143,215,642 2,143,215,642
Total direct and overlapping debt 2,628,698,921$ 2,628,698,921$
Source: Wake County, North Carolina, Comprehensive Annual Financial Report for the year ended June 30, 2011.
WAKE COUNTY BOARD OF EDUCATION
DIRECT AND OVERLAPPING GOVERNMENTAL ACTIVITIES DEBT FOR WAKE COUNTYAS OF JUNE 30, 2011
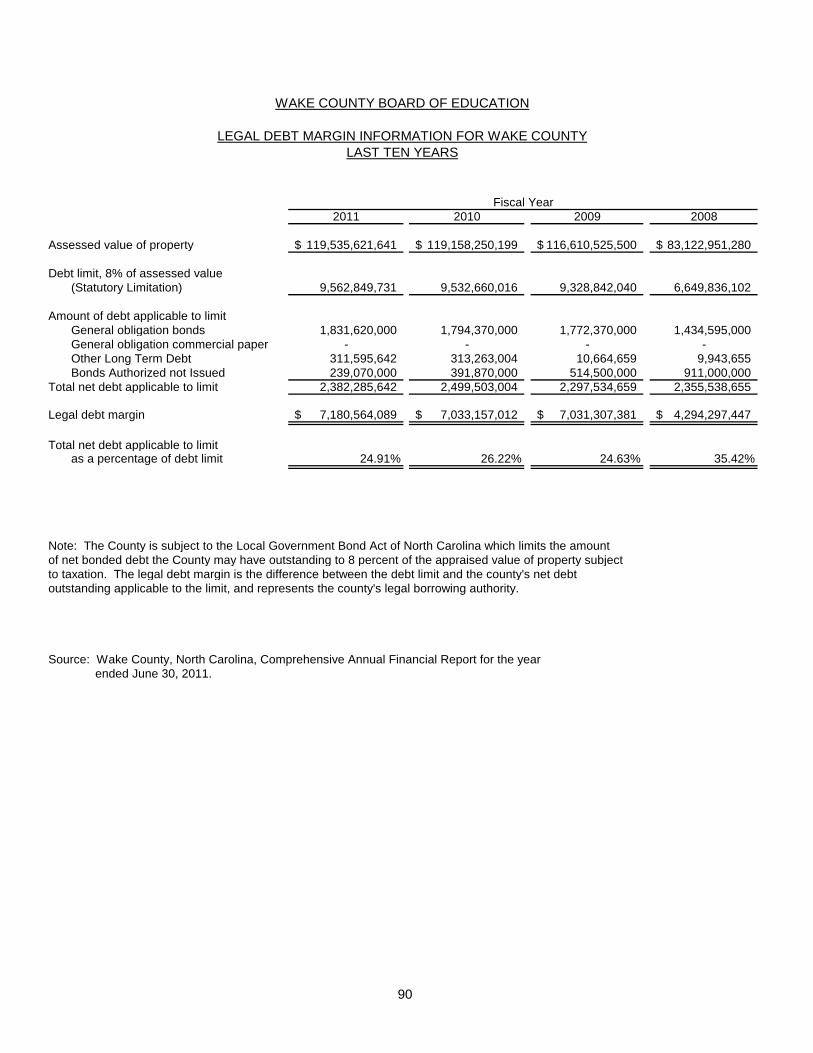
90
2011 2010 2009 2008
Assessed value of property 119,535,621,641$ 119,158,250,199$ 116,610,525,500$ 83,122,951,280$
Debt limit, 8% of assessed value(Statutory Limitation) 9,562,849,731 9,532,660,016 9,328,842,040 6,649,836,102
Amount of debt applicable to limitGeneral obligation bonds 1,831,620,000 1,794,370,000 1,772,370,000 1,434,595,000 General obligation commercial paper - - - -Other Long Term Debt 311,595,642 313,263,004 10,664,659 9,943,655 Bonds Authorized not Issued 239,070,000 391,870,000 514,500,000 911,000,000
Total net debt applicable to limit 2,382,285,642 2,499,503,004 2,297,534,659 2,355,538,655
Legal debt margin 7,180,564,089$ 7,033,157,012$ 7,031,307,381$ 4,294,297,447$
Total net debt applicable to limitas a percentage of debt limit 24.91% 26.22% 24.63% 35.42%
Note: The County is subject to the Local Government Bond Act of North Carolina which limits the amountof net bonded debt the County may have outstanding to 8 percent of the appraised value of property subject to taxation. The legal debt margin is the difference between the debt limit and the county's net debtoutstanding applicable to the limit, and represents the county's legal borrowing authority.
Source: Wake County, North Carolina, Comprehensive Annual Financial Report for the year ended June 30, 2011.
Fiscal Year
WAKE COUNTY BOARD OF EDUCATION
LEGAL DEBT MARGIN INFORMATION FOR WAKE COUNTYLAST TEN YEARS
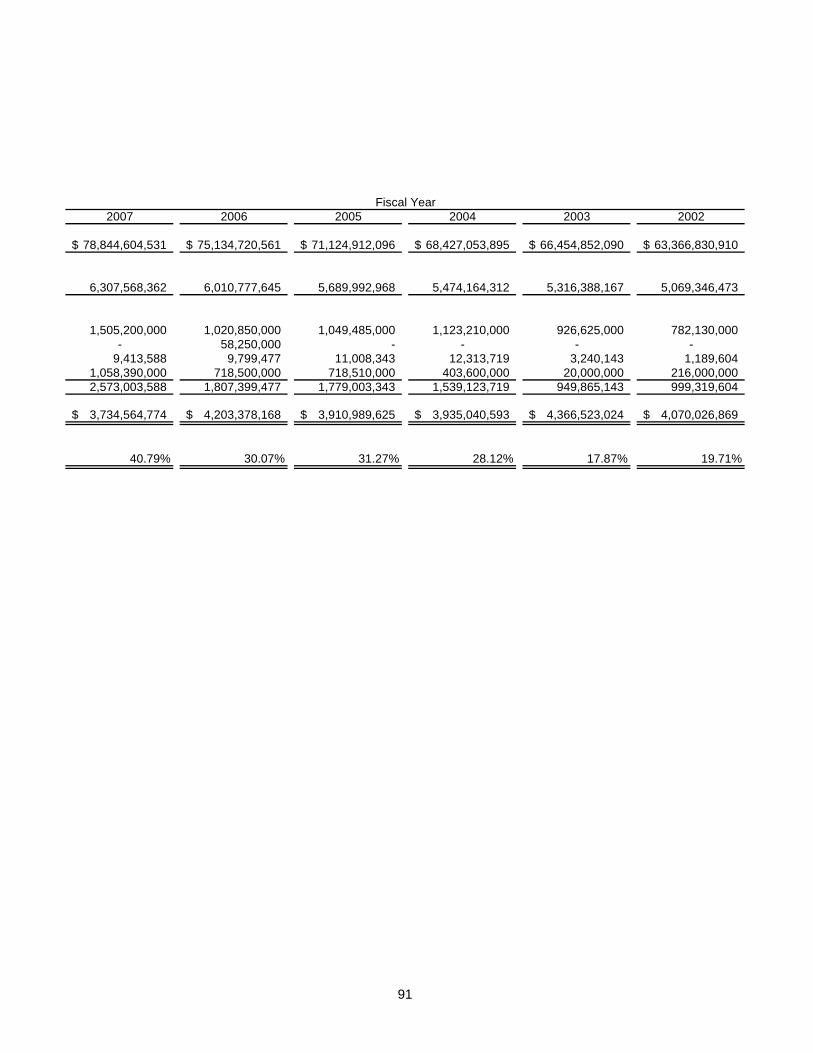
91
2007 2006 2005 2004 2003 2002
78,844,604,531$ 75,134,720,561$ 71,124,912,096$ 68,427,053,895$ 66,454,852,090$ 63,366,830,910$
6,307,568,362 6,010,777,645 5,689,992,968 5,474,164,312 5,316,388,167 5,069,346,473
1,505,200,000 1,020,850,000 1,049,485,000 1,123,210,000 926,625,000 782,130,000 - 58,250,000 - - - -
9,413,588 9,799,477 11,008,343 12,313,719 3,240,143 1,189,604 1,058,390,000 718,500,000 718,510,000 403,600,000 20,000,000 216,000,000 2,573,003,588 1,807,399,477 1,779,003,343 1,539,123,719 949,865,143 999,319,604
3,734,564,774$ 4,203,378,168$ 3,910,989,625$ 3,935,040,593$ 4,366,523,024$ 4,070,026,869$
40.79% 30.07% 31.27% 28.12% 17.87% 19.71%
Fiscal Year
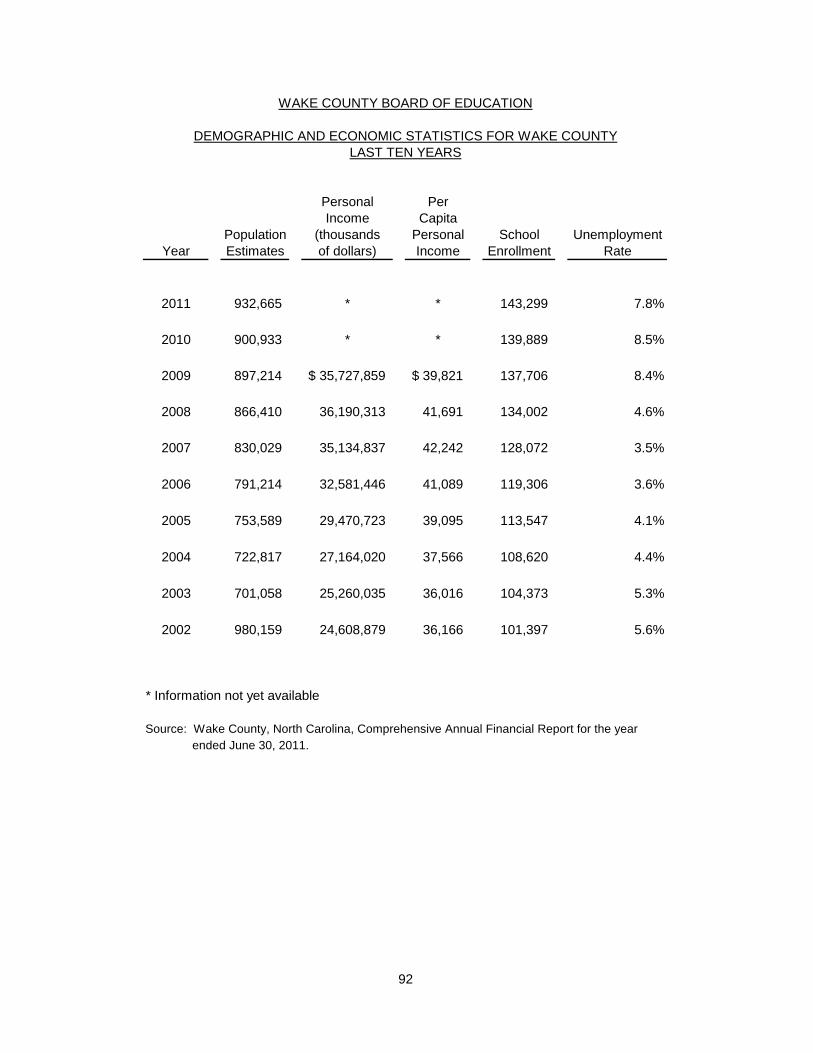
92
Personal PerIncome Capita
Population (thousands Personal School UnemploymentYear Estimates of dollars) Income Enrollment Rate
2011 932,665 * * 143,299 7.8%
2010 900,933 * * 139,889 8.5%
2009 897,214 35,727,859$ 39,821$ 137,706 8.4%
2008 866,410 36,190,313 41,691 134,002 4.6%
2007 830,029 35,134,837 42,242 128,072 3.5%
2006 791,214 32,581,446 41,089 119,306 3.6%
2005 753,589 29,470,723 39,095 113,547 4.1%
2004 722,817 27,164,020 37,566 108,620 4.4%
2003 701,058 25,260,035 36,016 104,373 5.3%
2002 980,159 24,608,879 36,166 101,397 5.6%
* Information not yet available
Source: Wake County, North Carolina, Comprehensive Annual Financial Report for the year ended June 30, 2011.
WAKE COUNTY BOARD OF EDUCATION
DEMOGRAPHIC AND ECONOMIC STATISTICS FOR WAKE COUNTYLAST TEN YEARS
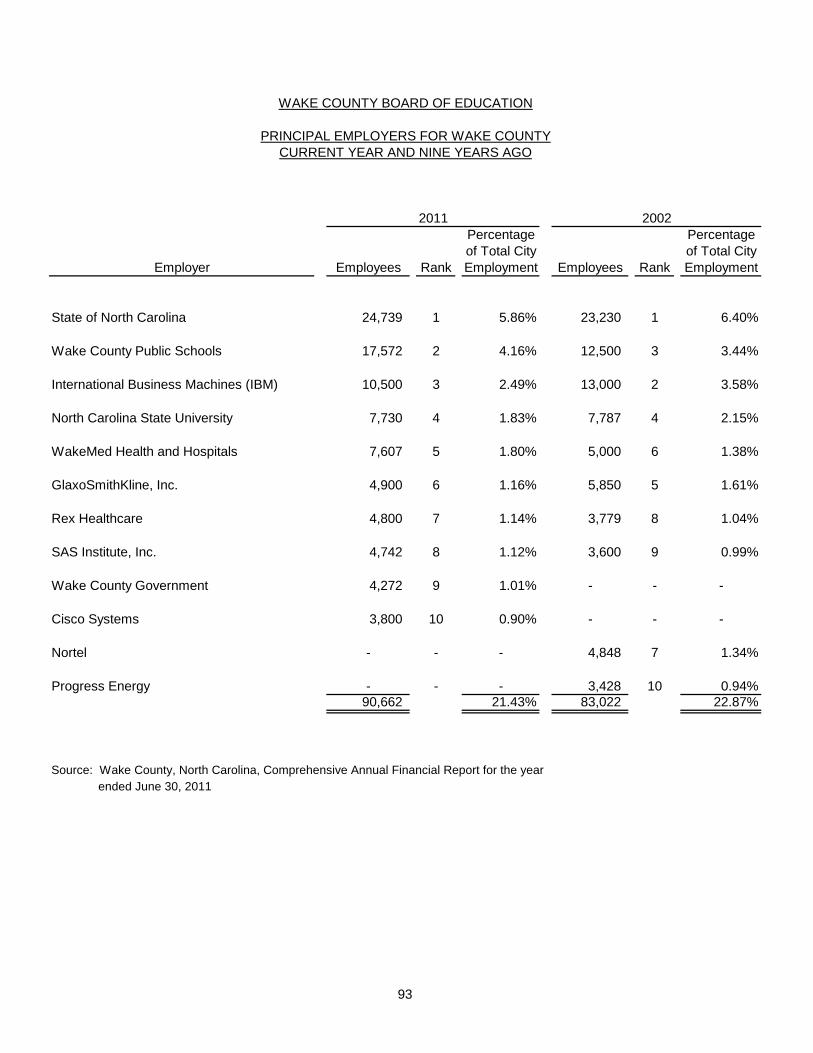
93
Percentage Percentageof Total City of Total City
Employer Employees Rank Employment Employees Rank Employment
State of North Carolina 24,739 1 5.86% 23,230 1 6.40%
Wake County Public Schools 17,572 2 4.16% 12,500 3 3.44%
International Business Machines (IBM) 10,500 3 2.49% 13,000 2 3.58%
North Carolina State University 7,730 4 1.83% 7,787 4 2.15%
WakeMed Health and Hospitals 7,607 5 1.80% 5,000 6 1.38%
GlaxoSmithKline, Inc. 4,900 6 1.16% 5,850 5 1.61%
Rex Healthcare 4,800 7 1.14% 3,779 8 1.04%
SAS Institute, Inc. 4,742 8 1.12% 3,600 9 0.99%
Wake County Government 4,272 9 1.01% - - -
Cisco Systems 3,800 10 0.90% - - -
Nortel - - - 4,848 7 1.34%
Progress Energy - - - 3,428 10 0.94%90,662 21.43% 83,022 22.87%
Source: Wake County, North Carolina, Comprehensive Annual Financial Report for the year ended June 30, 2011
2011 2002
WAKE COUNTY BOARD OF EDUCATION
CURRENT YEAR AND NINE YEARS AGOPRINCIPAL EMPLOYERS FOR WAKE COUNTY
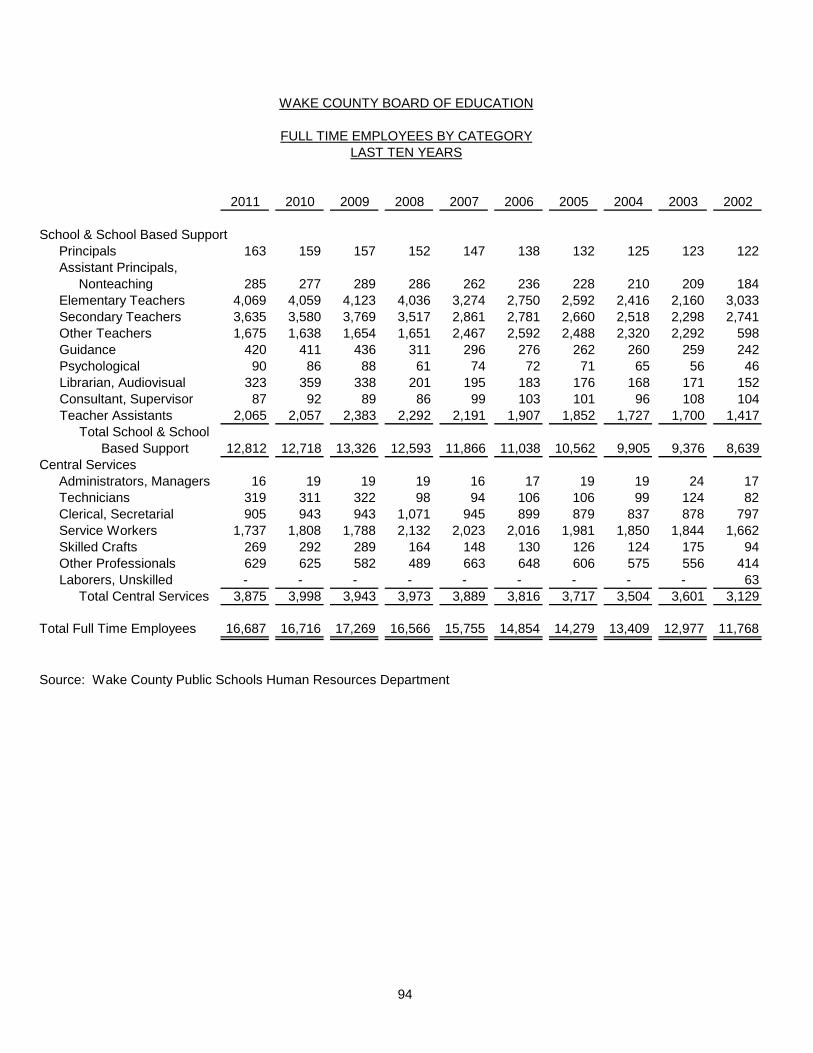
94
2011 2010 2009 2008 2007 2006 2005 2004 2003 2002
School & School Based SupportPrincipals 163 159 157 152 147 138 132 125 123 122Assistant Principals,
Nonteaching 285 277 289 286 262 236 228 210 209 184Elementary Teachers 4,069 4,059 4,123 4,036 3,274 2,750 2,592 2,416 2,160 3,033Secondary Teachers 3,635 3,580 3,769 3,517 2,861 2,781 2,660 2,518 2,298 2,741Other Teachers 1,675 1,638 1,654 1,651 2,467 2,592 2,488 2,320 2,292 598Guidance 420 411 436 311 296 276 262 260 259 242Psychological 90 86 88 61 74 72 71 65 56 46Librarian, Audiovisual 323 359 338 201 195 183 176 168 171 152Consultant, Supervisor 87 92 89 86 99 103 101 96 108 104Teacher Assistants 2,065 2,057 2,383 2,292 2,191 1,907 1,852 1,727 1,700 1,417
Total School & School Based Support 12,812 12,718 13,326 12,593 11,866 11,038 10,562 9,905 9,376 8,639
Central ServicesAdministrators, Managers 16 19 19 19 16 17 19 19 24 17Technicians 319 311 322 98 94 106 106 99 124 82Clerical, Secretarial 905 943 943 1,071 945 899 879 837 878 797Service Workers 1,737 1,808 1,788 2,132 2,023 2,016 1,981 1,850 1,844 1,662Skilled Crafts 269 292 289 164 148 130 126 124 175 94Other Professionals 629 625 582 489 663 648 606 575 556 414Laborers, Unskilled - - - - - - - - - 63
Total Central Services 3,875 3,998 3,943 3,973 3,889 3,816 3,717 3,504 3,601 3,129
Total Full Time Employees 16,687 16,716 17,269 16,566 15,755 14,854 14,279 13,409 12,977 11,768
Source: Wake County Public Schools Human Resources Department
WAKE COUNTY BOARD OF EDUCATION
FULL TIME EMPLOYEES BY CATEGORYLAST TEN YEARS
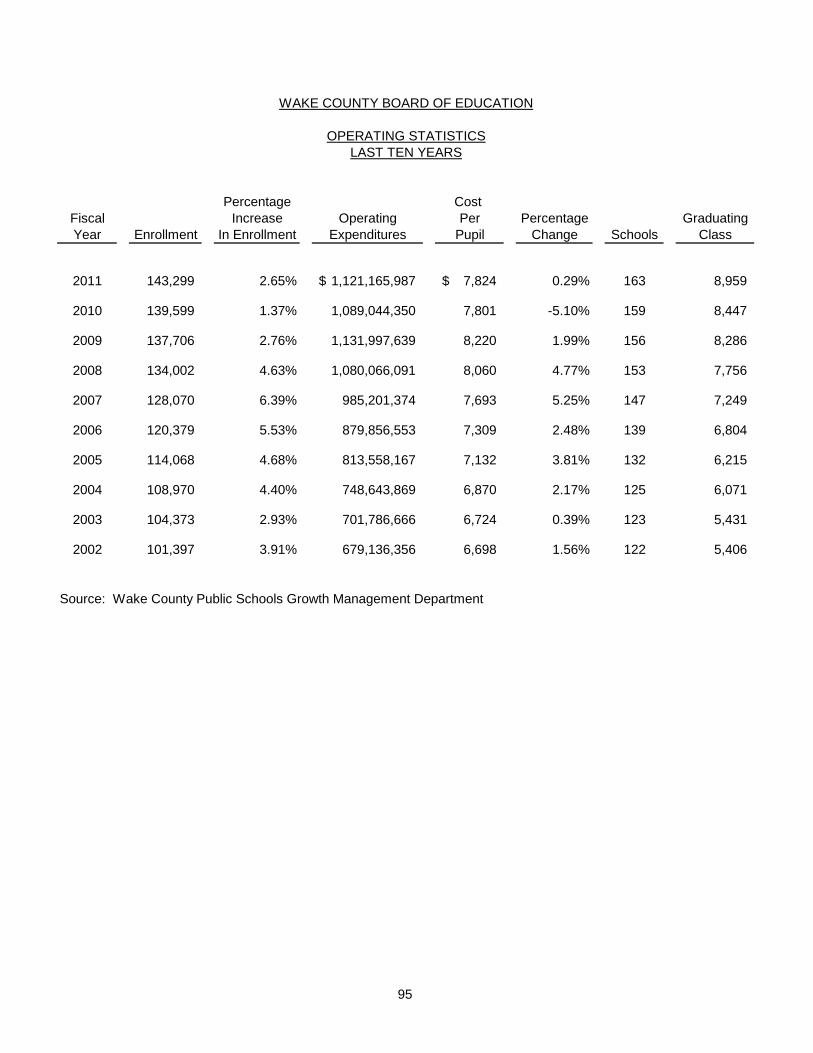
95
Percentage Cost Fiscal Increase Operating Per Percentage GraduatingYear Enrollment In Enrollment Expenditures Pupil Change Schools Class
2011 143,299 2.65% 1,121,165,987$ 7,824$ 0.29% 163 8,959
2010 139,599 1.37% 1,089,044,350 7,801 -5.10% 159 8,447
2009 137,706 2.76% 1,131,997,639 8,220 1.99% 156 8,286
2008 134,002 4.63% 1,080,066,091 8,060 4.77% 153 7,756
2007 128,070 6.39% 985,201,374 7,693 5.25% 147 7,249
2006 120,379 5.53% 879,856,553 7,309 2.48% 139 6,804
2005 114,068 4.68% 813,558,167 7,132 3.81% 132 6,215
2004 108,970 4.40% 748,643,869 6,870 2.17% 125 6,071
2003 104,373 2.93% 701,786,666 6,724 0.39% 123 5,431
2002 101,397 3.91% 679,136,356 6,698 1.56% 122 5,406
Source: Wake County Public Schools Growth Management Department
WAKE COUNTY BOARD OF EDUCATION
OPERATING STATISTICSLAST TEN YEARS
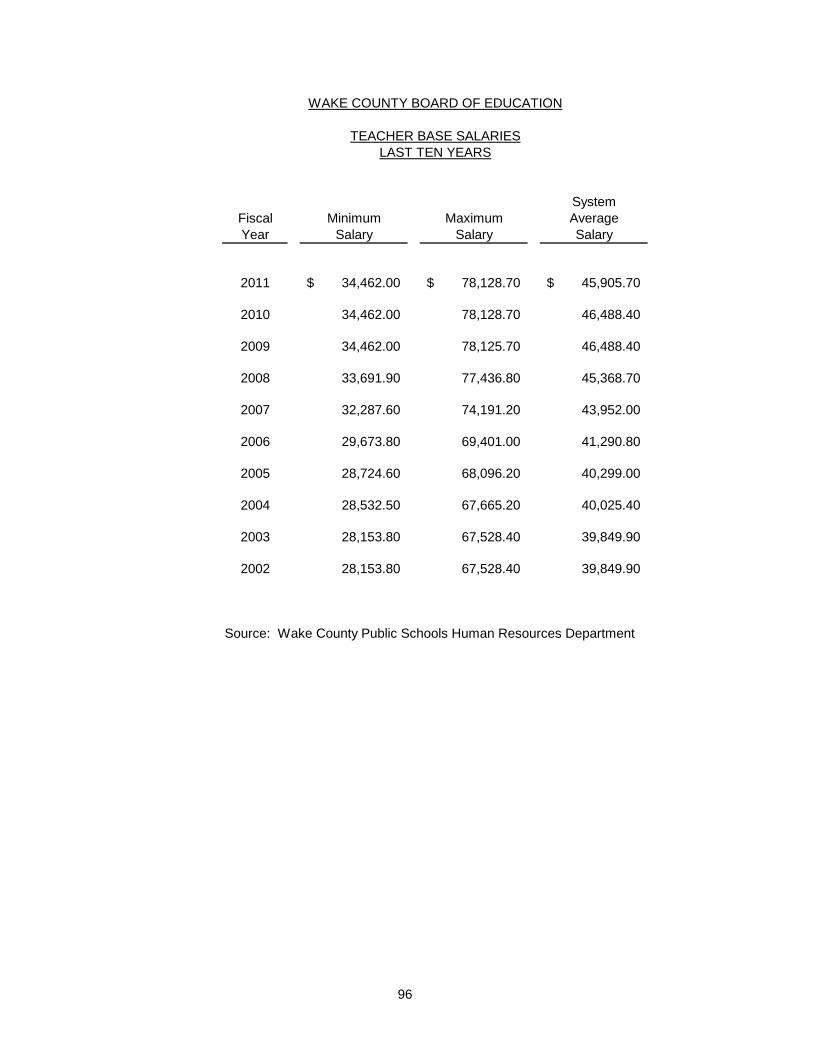
96
SystemFiscal Minimum Maximum AverageYear Salary Salary Salary
2011 34,462.00$ 78,128.70$ 45,905.70$
2010 34,462.00 78,128.70 46,488.40
2009 34,462.00 78,125.70 46,488.40
2008 33,691.90 77,436.80 45,368.70
2007 32,287.60 74,191.20 43,952.00
2006 29,673.80 69,401.00 41,290.80
2005 28,724.60 68,096.20 40,299.00
2004 28,532.50 67,665.20 40,025.40
2003 28,153.80 67,528.40 39,849.90
2002 28,153.80 67,528.40 39,849.90
Source: Wake County Public Schools Human Resources Department
WAKE COUNTY BOARD OF EDUCATION
TEACHER BASE SALARIESLAST TEN YEARS
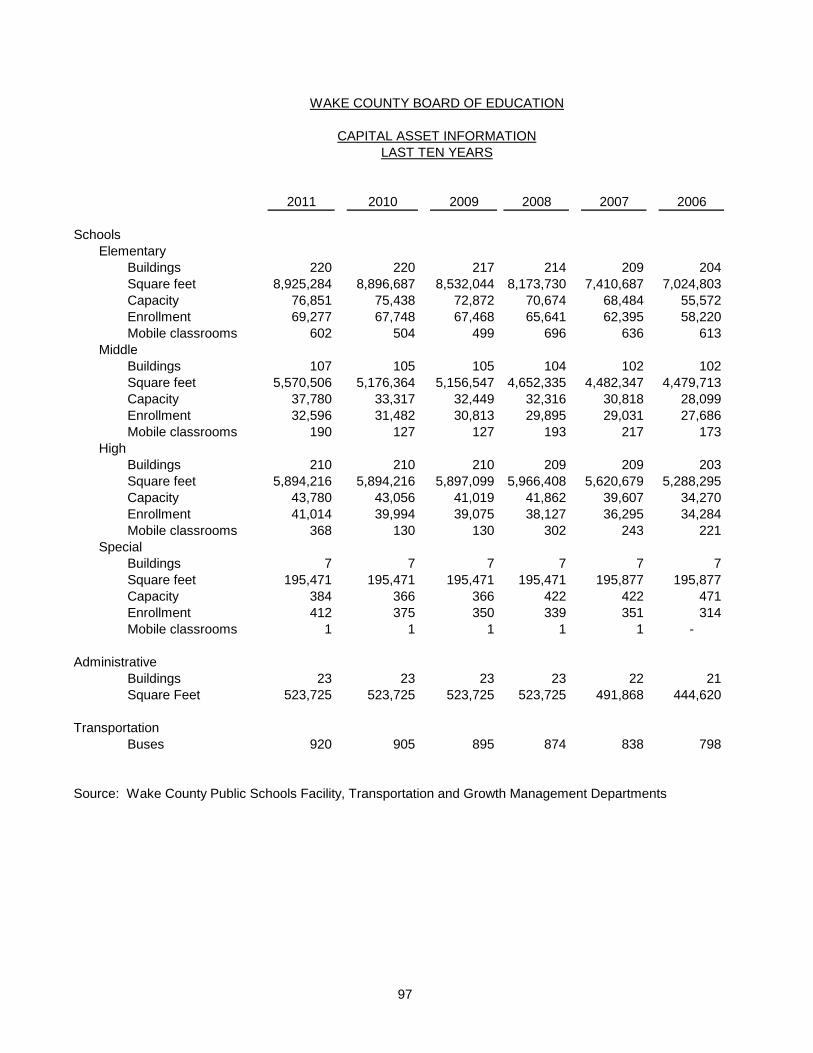
97
2011 2010 2009 2008 2007 2006
SchoolsElementary
Buildings 220 220 217 214 209 204Square feet 8,925,284 8,896,687 8,532,044 8,173,730 7,410,687 7,024,803Capacity 76,851 75,438 72,872 70,674 68,484 55,572Enrollment 69,277 67,748 67,468 65,641 62,395 58,220Mobile classrooms 602 504 499 696 636 613
MiddleBuildings 107 105 105 104 102 102Square feet 5,570,506 5,176,364 5,156,547 4,652,335 4,482,347 4,479,713Capacity 37,780 33,317 32,449 32,316 30,818 28,099Enrollment 32,596 31,482 30,813 29,895 29,031 27,686Mobile classrooms 190 127 127 193 217 173
HighBuildings 210 210 210 209 209 203Square feet 5,894,216 5,894,216 5,897,099 5,966,408 5,620,679 5,288,295Capacity 43,780 43,056 41,019 41,862 39,607 34,270Enrollment 41,014 39,994 39,075 38,127 36,295 34,284Mobile classrooms 368 130 130 302 243 221
SpecialBuildings 7 7 7 7 7 7Square feet 195,471 195,471 195,471 195,471 195,877 195,877Capacity 384 366 366 422 422 471Enrollment 412 375 350 339 351 314Mobile classrooms 1 1 1 1 1 -
AdministrativeBuildings 23 23 23 23 22 21Square Feet 523,725 523,725 523,725 523,725 491,868 444,620
TransportationBuses 920 905 895 874 838 798
Source: Wake County Public Schools Facility, Transportation and Growth Management Departments
WAKE COUNTY BOARD OF EDUCATION
CAPITAL ASSET INFORMATIONLAST TEN YEARS
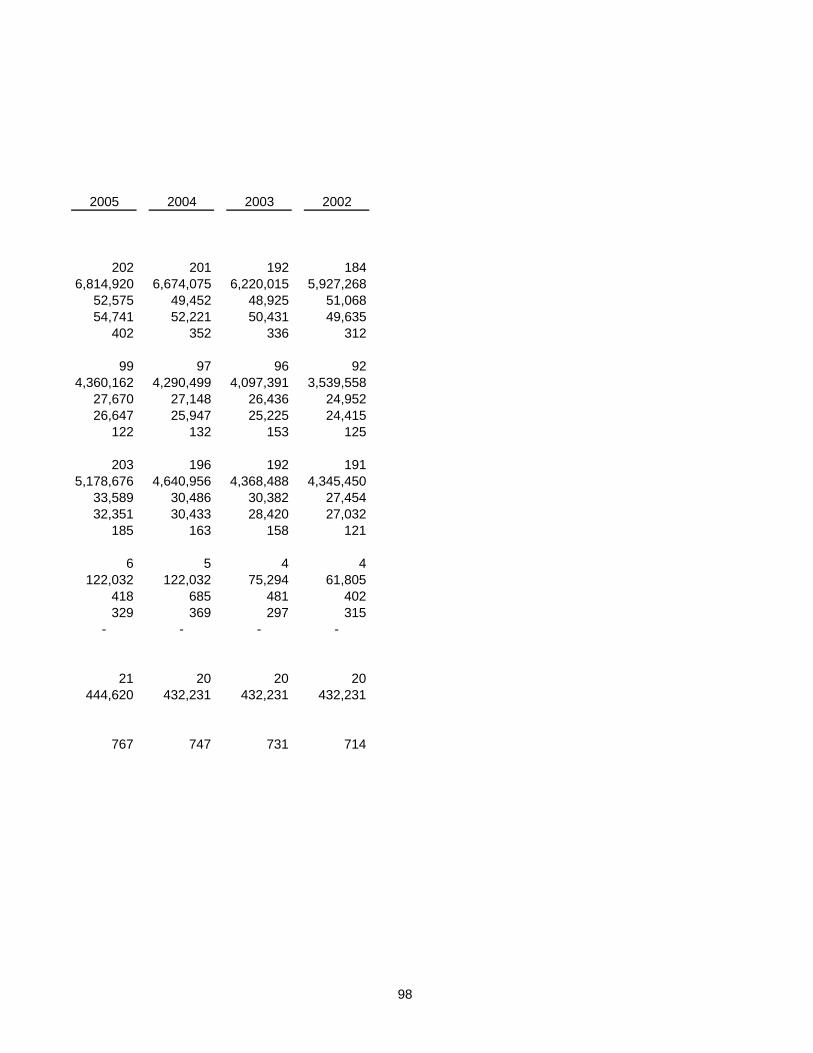
98
2005 2004 2003 2002
202 201 192 1846,814,920 6,674,075 6,220,015 5,927,268
52,575 49,452 48,925 51,06854,741 52,221 50,431 49,635
402 352 336 312
99 97 96 924,360,162 4,290,499 4,097,391 3,539,558
27,670 27,148 26,436 24,95226,647 25,947 25,225 24,415
122 132 153 125
203 196 192 1915,178,676 4,640,956 4,368,488 4,345,450
33,589 30,486 30,382 27,45432,351 30,433 28,420 27,032
185 163 158 121
6 5 4 4122,032 122,032 75,294 61,805
418 685 481 402329 369 297 315
- - - -
21 20 20 20444,620 432,231 432,231 432,231
767 747 731 714

FINANCIAL REPORT
FOR THE FISCAL YEAR ENDED JUNE 30, 2011
Prepared by the Finance Department
Cary, North Carolina
SIn
gle
au
dIt
Se
ct
Ion
S I n g l e a u d I t S e c t I o n
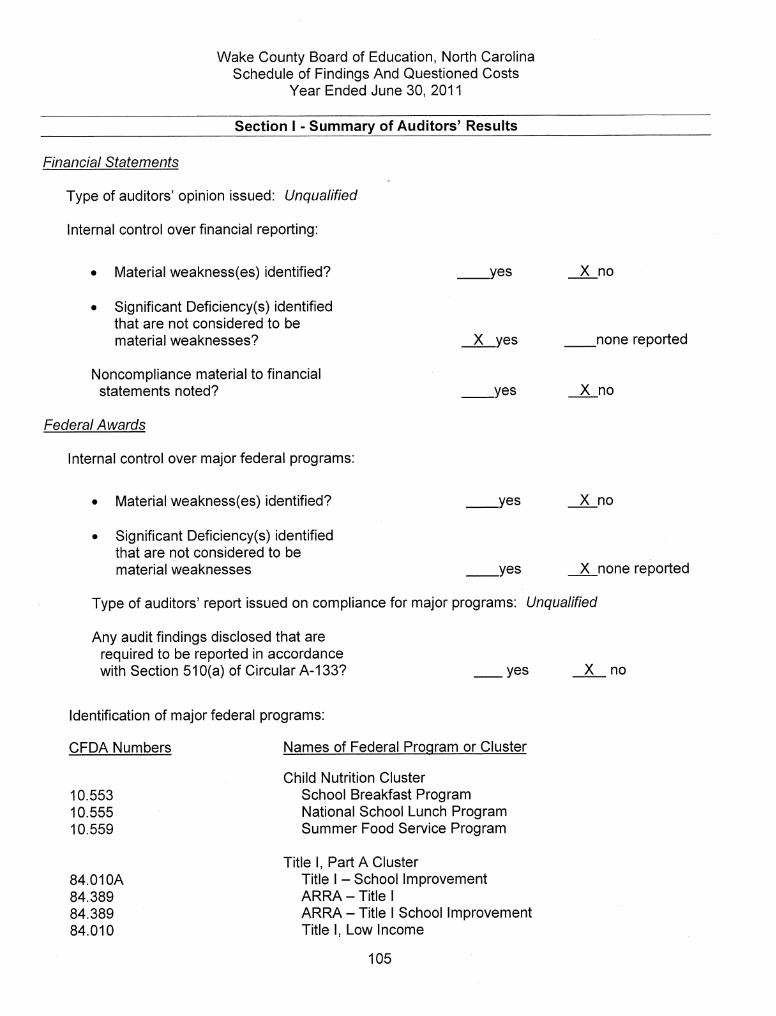
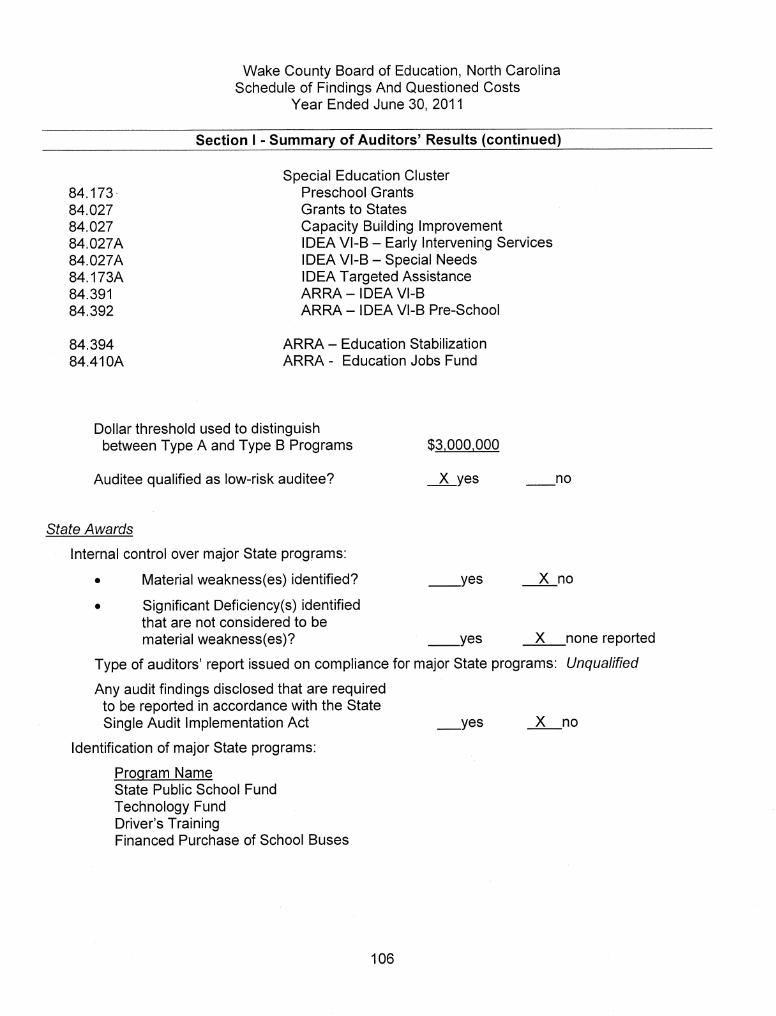
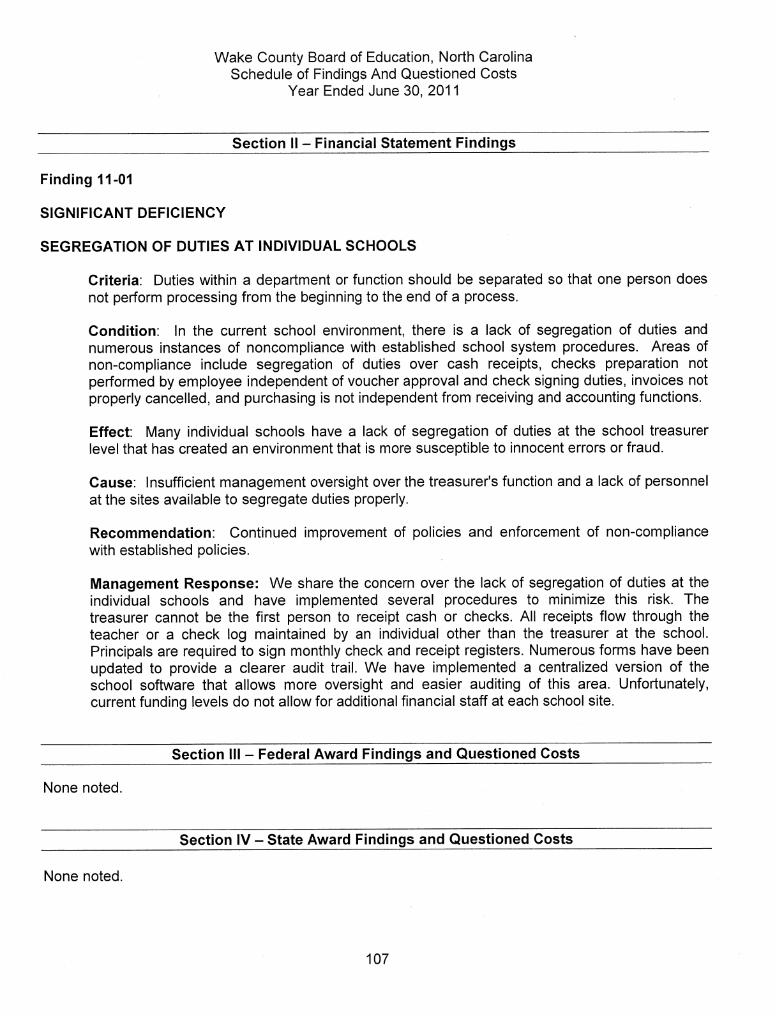
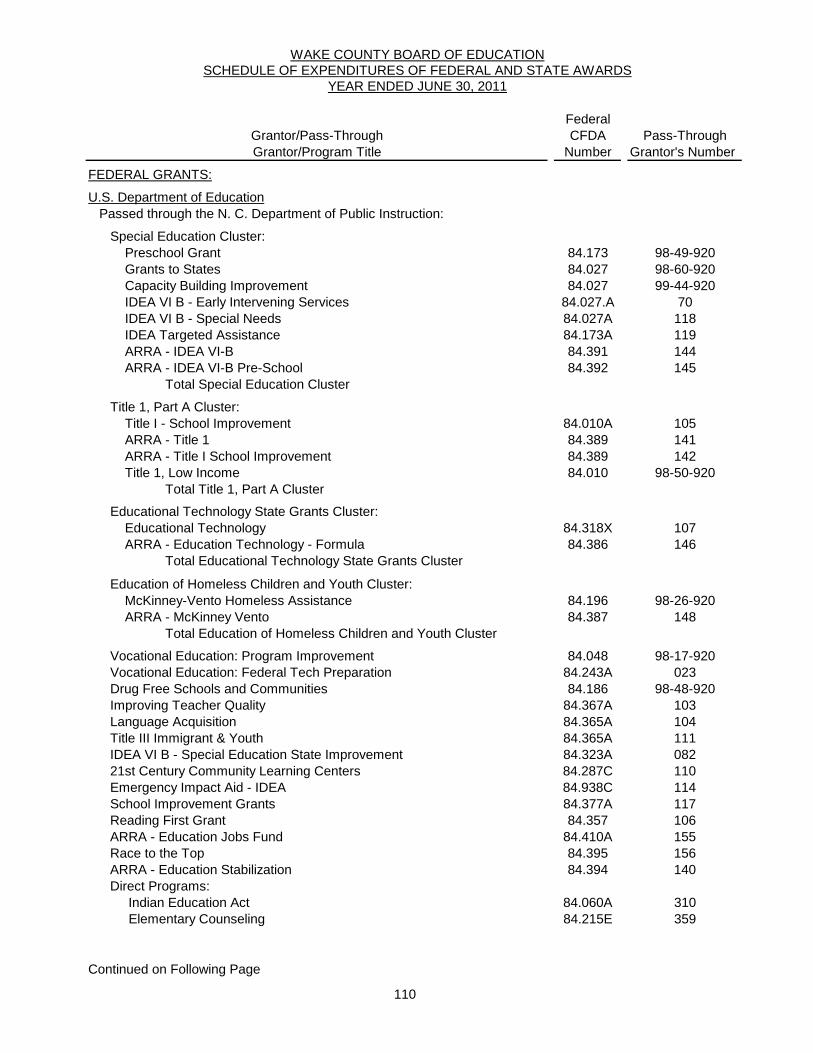
110
FederalGrantor/Pass-Through CFDA Pass-ThroughGrantor/Program Title Number Grantor's Number
FEDERAL GRANTS:
U.S. Department of Education Passed through the N. C. Department of Public Instruction:
Special Education Cluster: Preschool Grant 84.173 98-49-920 Grants to States 84.027 98-60-920 Capacity Building Improvement 84.027 99-44-920 IDEA VI B - Early Intervening Services 84.027.A 70 IDEA VI B - Special Needs 84.027A 118 IDEA Targeted Assistance 84.173A 119 ARRA - IDEA VI-B 84.391 144 ARRA - IDEA VI-B Pre-School 84.392 145 Total Special Education Cluster
Title 1, Part A Cluster: Title I - School Improvement 84.010A 105 ARRA - Title 1 84.389 141 ARRA - Title I School Improvement 84.389 142 Title 1, Low Income 84.010 98-50-920 Total Title 1, Part A Cluster
Educational Technology State Grants Cluster: Educational Technology 84.318X 10⁷ ARRA - Education Technology - Formula 84.386 146 Total Educational Technology State Grants Cluster
Education of Homeless Children and Youth Cluster: McKinney-Vento Homeless Assistance 84.196 98-26-920 ARRA - McKinney Vento 84.387 148 Total Education of Homeless Children and Youth Cluster
Vocational Education: Program Improvement 84.048 98-17-920 Vocational Education: Federal Tech Preparation 84.243A 023 Drug Free Schools and Communities 84.186 98-48-920 Improving Teacher Quality 84.367A 103 Language Acquisition 84.365A 104 Title III Immigrant & Youth 84.365A 111 IDEA VI B - Special Education State Improvement 84.323A 082 21st Century Community Learning Centers 84.287C 110 Emergency Impact Aid - IDEA 84.938C 114 School Improvement Grants 84.377A 117 Reading First Grant 84.357 106 ARRA - Education Jobs Fund 84.410A 155 Race to the Top 84.395 156 ARRA - Education Stabilization 84.394 140 Direct Programs: Indian Education Act 84.060A 310 Elementary Counseling 84.215E 359
Continued on Following Page
WAKE COUNTY BOARD OF EDUCATIONSCHEDULE OF EXPENDITURES OF FEDERAL AND STATE AWARDS
YEAR ENDED JUNE 30, 2011
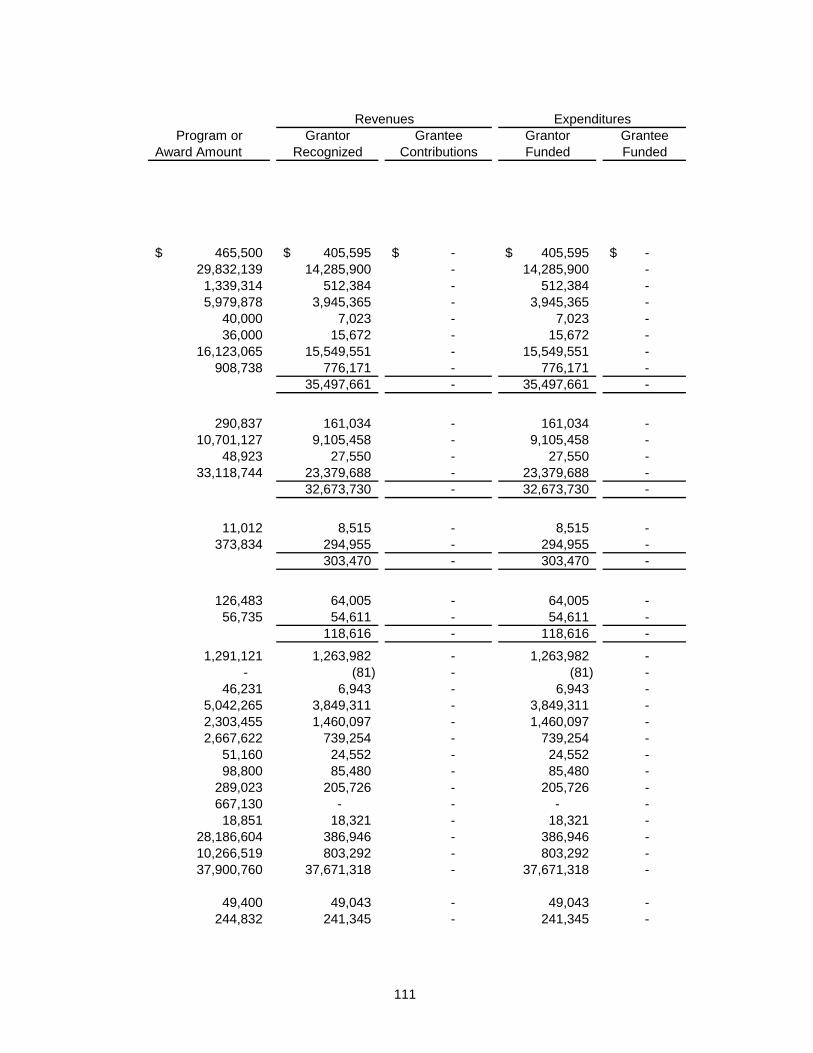
111
Revenues ExpendituresProgram or Grantor Grantee Grantor Grantee
Award Amount Recognized Contributions Funded Funded
465,500$ 405,595$ -$ 405,595$ -$ 29,832,139 14,285,900 - 14,285,900 - 1,339,314 512,384 - 512,384 - 5,979,878 3,945,365 - 3,945,365 -
40,000 7,023 - 7,023 - 36,000 15,672 - 15,672 -
16,123,065 15,549,551 - 15,549,551 - 908,738 776,171 - 776,171 -
35,497,661 - 35,497,661 -
290,837 161,034 - 161,034 - 10,701,127 9,105,458 - 9,105,458 -
48,923 27,550 - 27,550 - 33,118,744 23,379,688 - 23,379,688 -
32,673,730 - 32,673,730 -
11,012 8,515 - 8,515 - 373,834 294,955 - 294,955 -
303,470 - 303,470 -
126,483 64,005 - 64,005 - 56,735 54,611 - 54,611 -
118,616 - 118,616 -
1,291,121 1,263,982 - 1,263,982 - - (81) - (81) -
46,231 6,943 - 6,943 - 5,042,265 3,849,311 - 3,849,311 - 2,303,455 1,460,097 - 1,460,097 - 2,667,622 739,254 - 739,254 -
51,160 24,552 - 24,552 - 98,800 85,480 - 85,480 -
289,023 205,726 - 205,726 - 667,130 - - - - 18,851 18,321 - 18,321 -
28,186,604 386,946 - 386,946 - 10,266,519 803,292 - 803,292 - 37,900,760 37,671,318 - 37,671,318 -
49,400 49,043 - 49,043 - 244,832 241,345 - 241,345 -
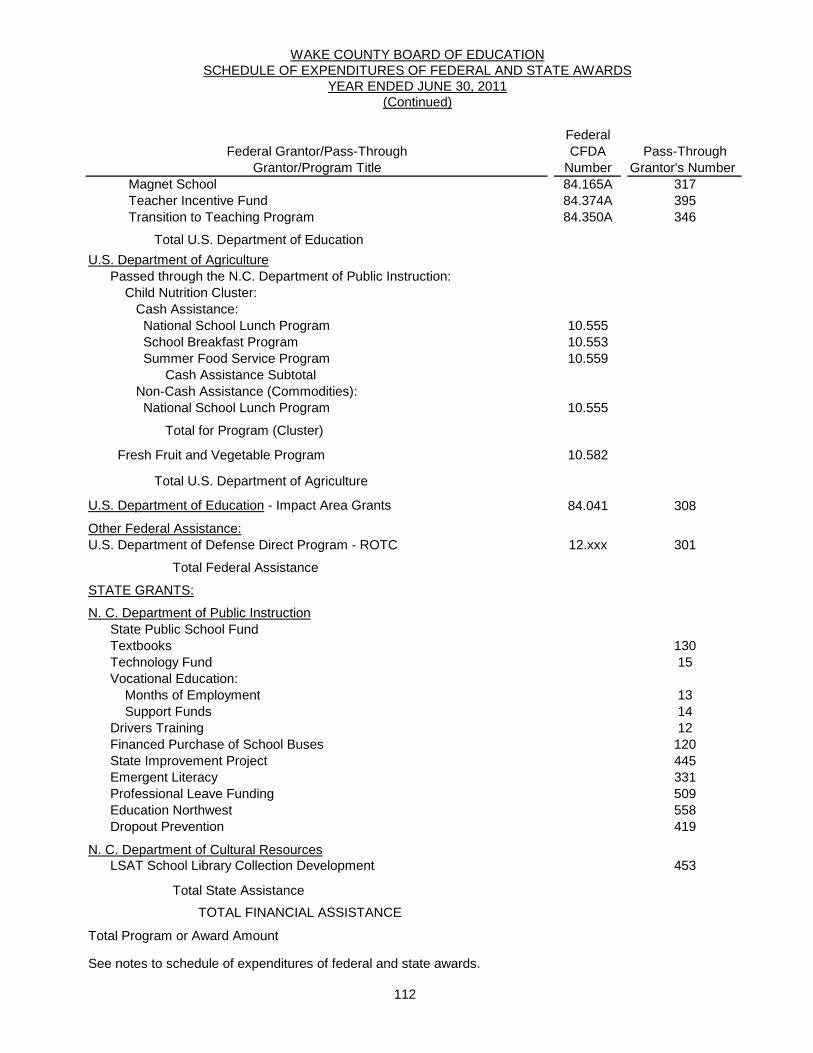
112
FederalFederal Grantor/Pass-Through CFDA Pass-Through
Grantor/Program Title Number Grantor's Number Magnet School 84.165A 317 Teacher Incentive Fund 84.374A 395 Transition to Teaching Program 84.350A 346
Total U.S. Department of EducationU.S. Department of Agriculture Passed through the N.C. Department of Public Instruction: Child Nutrition Cluster: Cash Assistance: National School Lunch Program 10.555 School Breakfast Program 10.553 Summer Food Service Program 10.559 Cash Assistance Subtotal Non-Cash Assistance (Commodities): National School Lunch Program 10.555
Total for Program (Cluster)
Fresh Fruit and Vegetable Program 10.582
Total U.S. Department of Agriculture
U.S. Department of Education - Impact Area Grants 84.041 308
Other Federal Assistance:U.S. Department of Defense Direct Program - ROTC 12.xxx 301
Total Federal Assistance
STATE GRANTS:
N. C. Department of Public Instruction State Public School Fund Textbooks 130 Technology Fund 15 Vocational Education: Months of Employment 13 Support Funds 14 Drivers Training 12 Financed Purchase of School Buses 120 State Improvement Project 445 Emergent Literacy 331 Professional Leave Funding 509 Education Northwest 558 Dropout Prevention 419
N. C. Department of Cultural Resources LSAT School Library Collection Development 453
Total State Assistance TOTAL FINANCIAL ASSISTANCE
Total Program or Award Amount
See notes to schedule of expenditures of federal and state awards.
(Continued)
WAKE COUNTY BOARD OF EDUCATIONSCHEDULE OF EXPENDITURES OF FEDERAL AND STATE AWARDS
YEAR ENDED JUNE 30, 2011
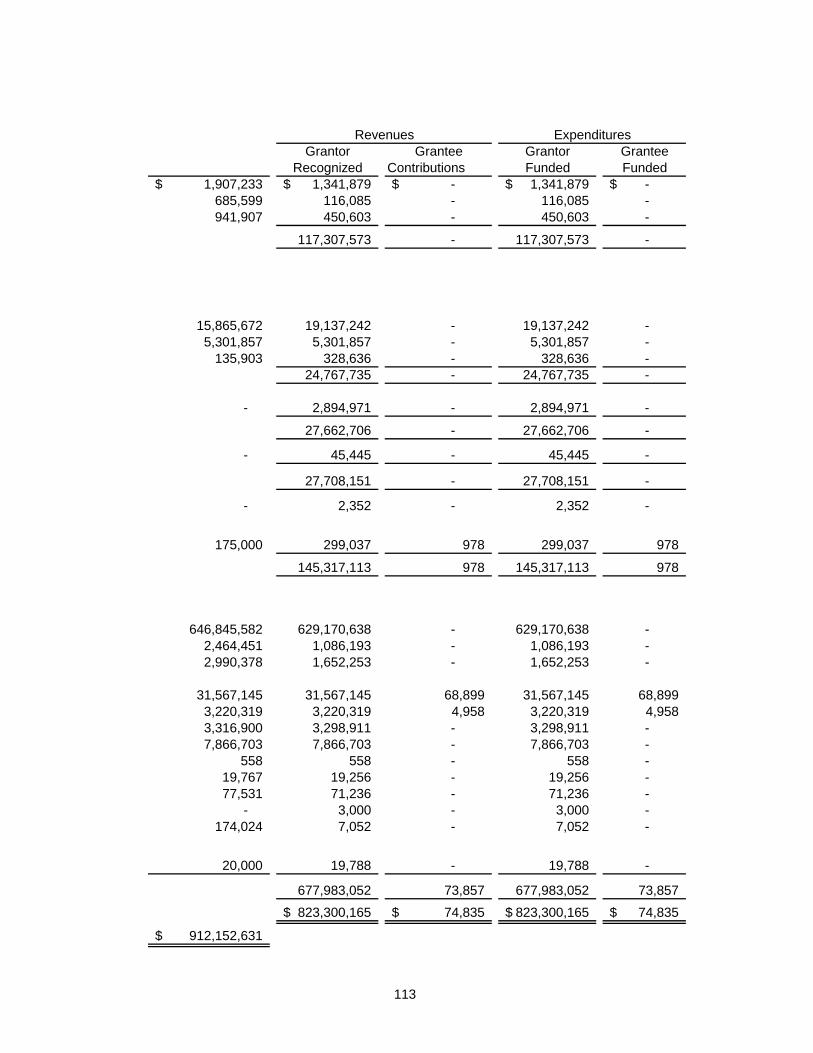
113
Revenues ExpendituresGrantor Grantee Grantor Grantee
Recognized Contributions Funded Funded1,907,233$ 1,341,879$ -$ 1,341,879$ -$
685,599 116,085 - 116,085 - 941,907 450,603 - 450,603 -
117,307,573 - 117,307,573 -
15,865,672 19,137,242 - 19,137,242 - 5,301,857 5,301,857 - 5,301,857 -
135,903 328,636 - 328,636 - 24,767,735 - 24,767,735 -
- 2,894,971 - 2,894,971 -
27,662,706 - 27,662,706 -
- 45,445 - 45,445 -
27,708,151 - 27,708,151 -
- 2,352 - 2,352 -
175,000 299,037 978 299,037 978
145,317,113 978 145,317,113 978
646,845,582 629,170,638 - 629,170,638 -
2,464,451 1,086,193 - 1,086,193 - 2,990,378 1,652,253 - 1,652,253 -
31,567,145 31,567,145 68,899 31,567,145 68,899 3,220,319 3,220,319 4,958 3,220,319 4,958 3,316,900 3,298,911 - 3,298,911 - 7,866,703 7,866,703 - 7,866,703 -
558 558 - 558 - 19,767 19,256 - 19,256 - 77,531 71,236 - 71,236 -
- 3,000 - 3,000 - 174,024 7,052 - 7,052 -
20,000 19,788 - 19,788 -
677,983,052 73,857 677,983,052 73,857 823,300,165$ 74,835$ 823,300,165$ 74,835$
912,152,631$
114
WAKE COUNTY BOARD OF EDUCATION
NOTES TO SCHEDULE OF EXPENDITURES OF FEDERAL AND STATE AWARDS
YEAR ENDED JUNE 30, 2011
Note 1. Basis of Presentation The accompanying Schedule of Expenditures of Federal and State Awards includes the federal and state grant activity of Wake County Board of Education and is presented on the modified accrual basis of accounting. The information in this schedule is presented in accordance with the requirements of OMB Circular A-133, Audits of States, Local Governments, and Non-Profit Organizations, and the North Carolina Single Audit Implementation Act. Therefore, some amounts presented in this schedule may differ from amounts presented in, or used in the preparation of, the basic financial statements. Note 2. Non-cash Assistance Included in the amounts reported on the Schedule of Expenditures of Federal and State Awards, Wake County Board of Education received non-cash assistance in the form of food commodities. Commodities with a fair value of $2,894,971 were received during the year ended June 30, 2011. These commodities received were included in the determination of federal awards expended for the year ended June 30, 2011.


![WCPSS Annual Report Student Discipline Datadig.abclocal.go.com/wtvd/docs/021716-wtvd-wcpss-suspension-repo… · 9,937 8,420 8,998 6,901 [VALUE] 0 2000 4000 6000 8000 10000 12000](https://img.pdfslide.net/doc/110x75/5f070a4f7e708231d41b0038/wcpss-annual-report-student-discipline-9937-8420-8998-6901-value-0-2000-4000.jpg)