Embed Size (px)
Citation preview

June 5, 2009
Comprehensive Bulky Waste Collection
Analysis Miami-Dade County
Office of Strategic Business Management

i
TABLE OF CONTENTS
Executive Summary 1
Introduction and Study Methodology 4
Curbside Bulky Waste Collection 8
Neighborhood Trash and Recycling Center Collection 21
Bulky Waste Enforcement 29
Data Sources 31
Appendices 32

ii
ACKNOWLEDGEMENTS
The Office of Strategic Business Management (OSBM) is grateful for the cooperation and assistance provided by the Department of Solid Waste Management (DSWM or department) throughout the development of this study. We would like to specifically recognize the supervisors and employees of the Trash Collection Division, as well as the efforts of the department’s Budget, Accounting, Human Resources, Enforcement and Service Development Divisions. Other County agencies that were critical to the success of this effort include: the General Services Administration (GSA), Fleet Management Division; the Enterprise Technology Services Department (ETSD), Geographic Information Systems Section; and the Government Information Center (GIC) and the County’s Development Coordinator. Outside agencies that graciously participated in this study include: the City of Miami Solid Waste Department, the City of Coral Gables Public Service Department, the City of Hialeah Solid Waste Department and the Broward County Waste and Recycling Services Department.

1
EXECUTIVE SUMMARY
In recent years, the Department of Solid Waste Management has greatly improved garbage and recyclables collection services through automation. This study focuses on the bulky waste collection service delivery model, which has remained unchanged for many years. While the service delivery model has not changed, it should be noted that the quality of service has improved markedly in recent years. The intent of this study is to provide the department with a set of findings and recommendations that can serve as the foundation for operational and administrative changes that will improve, and perhaps transform, the delivery of bulky waste collection services in Miami-Dade County. While this report is at times critical of current operations, the criticism is constructive and in no way diminishes the hard work and dedication of department management and staff.
The following study includes a comprehensive operational and financial assessment of the County’s bulky waste collection system. The three activities covered in the study include: (1) Curbside Bulky Waste Collection, (2) Neighborhood Trash and Recycling Center (TRC) Collection, and (3) Bulky Waste Enforcement. This Executive Summary highlights key findings from the study and provides recommendations for immediate implementation. Key Study Findings 1. Potential for Alternative Curbside Bulky Waste Collection Method The department’s current bulky waste collection service is an on demand or
“Scheduled” system, where customers call-in or email requests for service. The department’s capability to perform bulky waste collection using a “Sweep” system, which involves driving by each customer location on a set schedule, was evaluated using ProcessModel simulation software. The model estimates the number of bulky waste pick-ups that can be accomplished annually at a given service frequency (e.g. weekly, monthly, quarterly, etc.) based on variables such as (1) number of bulky waste collection crews, (2) bulky waste set-out rate, (3) pile size and (4) time between pick-ups.
The preliminary simulation results suggest that implementing a “Sweep” system may be
possible using the current level of crews and equipment on an every-other-month or monthly basis, provided that the average pile size is about half of the current 11 cubic yard average, the set-out rate is relatively low (10% to 15%) and the time between pick-ups is between 1 minute and one-half minute.1 Additional model inputs relative to pile sizes, set-out rates, development density and time between piles for other jurisdictions will be necessary to provide a sufficient basis for further consideration of “Sweeps.”
2. TRC Access Control The tonnage received at the TRCs has significantly increased since FY2004-05. This
increase in tonnage equates to $2.1 million in additional TRC disposal costs, which impacts the Collections Fund. Access control at TRCs is virtually non-existent.
1 Refer to Tables 6 & 7 in the Curbside Bulky Waste Collection Findings and Analysis Section of this report.

2
Consistent with OSBM field observations, the Countywide Secret Shopper – Phase II Final Recommendation report, July 2008, found that only 3% of shoppers at all 13 TRCs were asked to show proof of residency. TRC personnel do not have workable tools that would enable them to effectively control TRC access, such as an accurate large scale solid waste collection service area map or a database of customer addresses. Currently, there is no limit on the number of visits to a TRC an individual customer can make in a day, week, month or year.
3. Bulky Waste Collection Equipment Limitations In an effort to provide the best “Scheduled” bulky waste collection service, the
department may have inadvertently reduced its flexibility to collect bulky waste using alternative methods. The department has purchased 21 “Scorpion” cranes, at a cost of approximately $240,000 each, which are specifically designed for scheduled pick-up of large bulky waste piles (25 to 50 cubic yards). The department’s fleet replacement plan shows the purchase of 6 more “Scorpion” cranes in FY2008-09. The “Scorpion” cranes appear to be over dimensioned for the current service requirements, based upon approximately 80% of bulky waste piles collected being 15 cubic yards or less in size, and are not well suited for other more dynamic modes of bulky waste collection.2
4. Bulky Waste GIS Routing Issues When the department inputs customer addresses into its GIS based routing software
(Arc Logistics), some of the addresses are rejected because the GIS base data layer contains address and street segment errors. This problem makes the routing process less efficient. Approximately 17,000 address and street segment errors in the GIS base layer are pending resolution by ETSD. Work is currently underway to correct the known errors in the GIS base layer, however the number of latent errors remains unknown. The integrity of the GIS base layer is important to many service delivery functions of the County, including emergency response. A longer-term solution involving standardization of address creation/correction procedures is now being developed.
Recommendations for Immediate Implementation 1. Establish a Simulation Working Group
The department and OSBM have agreed to establish a Simulation Working Group that will validate the ProcessModel “Sweep” assumptions and refine the model inputs through additional data gathering and analysis. In the event that the updated model results indicate that “Sweeps” are possible at current resource levels, jointly prepared financial forecasts will be developed showing the impacts of at least two agreed upon “Sweep” scenarios. Any decision to change the current bulky waste collection method will be predicated on the outcome of this collaborative process.
2. Automate and Enforce Access Control at TRCs
The department should implement an automated system to control access to the TRCs. Using the County’s GIS database and a touch-screen/lap-top/card reader system similar to that used in Broward County, TRC staff will be able to effectively screen customers using the address indicated on their driver’s license. A separate proof of residency, such
2 See Pareto Analysis in figure 4.

3
as a current tax bill, utility bill, etc. should also be required to determine eligibility. A limitation on the number of visits per customer per week, month or year may be desirable to discourage TRC use by commercial businesses and encourage landscapers to apply for a landscaper permit and pay for landscaper disposal coupons. Any such limitation should be based upon TRC customer activity following implementation of the access control system. A 15% reduction in TRC tonnage will reduce collection costs by $1.7 million annually.3
3. Hold Crane Purchases
Due to concerns regarding over dimensioning, lack of versatility and high cost, plans for the purchase of additional “Scorpion” cranes should be placed on hold pending evaluation of other more suitable alternatives.
4. Participate in Address Matching Working Group
The department should be represented in the working group that is tasked with clearing the backlog of incorrect addresses in the GIS base layer and solving the address matching issue. The County’s development coordinator is leading this effort.
3 Refer to Table 10 in the TRC Findings and Analysis section of this report.

4
Introduction and Study Methodology INTRODUCTION This study includes a comprehensive operational and financial assessment of the County’s bulky waste collection system. Bulky waste is defined in the Miami-Dade County Code as: “Less than one (1) cubic yard of construction and demolition debris, large discarded items or large accumulations of trash. Bulky waste shall include without limitation, appliances, furniture, yard trash, crates, corrugated cardboard, and other similar items. Bulky waste shall not include tires or other solid waste requiring special handling.” The three integrated activities involved in bulky waste collection are: (1) Scheduled Curbside Collection, (2) Neighborhood Trash and Recycling Center (TRC) Collection, and (3) Bulky Waste Enforcement. This report provides background information on each of these activities followed by both a findings and analysis section and a recommendations section. For reference, Table 1 and Figure 1 below show the relative allocation of costs among the three waste collection activities performed by the department: TABLE 1
WASTE COLLECTION ACTIVITIES
TOTAL ACTIVITY COST4 COST PER TON
PERCENT OF DSWM RESIDENTIAL WASTE COLLECTION COST
CURBSIDE BULKY $16,822,000 $220 14% TRCS $26,614,000 $154 22% GARBAGE $76,751,000 $159 64% TOTAL $120,187,000 100% SOURCE: DSWM FULL COST DISCLOSURE REPORT FOR FY2006 - 07
FIGURE 1: PERCENT OF DSWM PROVIDED RESIDENTIAL WASTE COLLECTION COST
Curbside Bulky14%
TRCs22%
Garbage64%
Curbside BulkyTRCsGarbage
4 Costs for Illegal Dumping/Enforcement/Litter Control and Recycling are not included in the residential waste collection cost figures. Costs for TRC transportation are included.

5
Study Methodology The study methodology consisted of (1) a review of existing bulky waste collection studies and DSWM procedures, (2) comparison research on other jurisdictions, (3) original data gathering and analysis, (3) interviews with DSWM, GSA, ETSD, GIC and other County staff, (5) field visits to other jurisdictions, (6) analysis of existing financial and operational workload data, and (7) utilization of simulation software to model various bulky waste collection scenarios. Trash and Recycling Center Original Data Collection OSBM staff designed a sampling protocol to obtain original data on customer visits to the TRCs. The data was gathered May 30 – June 14, 2008 at the Palm Springs North, Snapper Creek and Eureka Drive TRCs. Through multiple observations, the survey team was able to accurately determine the number of customer visits required to fill a 40 cubic yard roll-off container (20.5 visits). Each container was weighed at the disposal site and an average of 3 tons per container was used to estimate the number of 6.8 visitors per ton of waste received at the TRCs, which ultimately yielded the estimated total of 1.3 million customer visits for FY2006-07 (Refer to Appendix I for customer visits data). Bulky Waste Collection Simulation Simulation models are a representation of an existing or proposed system used to identify and understand the factors that control the system and/or to predict the future behavior of the system. Due to the complexities in estimating the capacity of the department’s existing bulky waste collection operation (scheduled on-demand system) to perform bulky waste pick-ups using a “Sweep” system (all customers on a set pick-up schedule), a simulation software package was utilized. The following Figures 2 & 3 show the steps involved in the existing curbside bulky waste collection system and simulated bulky waste collection “Sweep” system.
Figure 2: Existing Scheduled Bulky Waste Collection

6
Figure 3: Bulky Waste Collection “Sweep” System
Supervisor
Crew
Crane
Truck
Drive from Start Location Collect Trash
Drive to Start Location
Drive to Pickup
Route
EOB?
Truck Available?
Drive toLandfill
YES
NO
YES
NO
Supervise Crews
Wait for Truck
Capacity full?
YES
NO
EOB?YES
NO Note: EOB – End of Business DSWM bulky waste crews were observed and data collected documenting the time to complete the many discrete tasks involved in the existing bulky waste collection process. This data was then aggregated and the results used as inputs for simulation. The field data gathered for the simulation included:
o Distance between bulky waste piles o Estimated pile size in cubic yards o Overall pick-up time for each pile o Crane set-up time o Crane start and stop time o Clean-up time o Paperwork time o Trash truck round trip time for disposal o Number of trash truck disposal cycles per day
Multiple scenarios were simulated for the “Sweep” system model by changing the variables shown in Table 2 below.
7
Table 2
Simulation Model Variables used in Bulky Waste Collection "Sweep" Scenarios Pile Size [cubic yards] 1 to 25 Set- Out Rate 10% - 50% Number of Bulky Crews 22 to 40 Frequency of Pick-up 2 times per month to 1 time per year Drive Time Between Pick-ups [min] 0.5 to 1
Other Simulation Factors: o Existing bulky waste crews typically arrive at the yard by approximately 6:30 a.m., but
do not leave the yard until their 7:00 a.m. departure time. All mobilization tasks are taken care of prior to departure, therefore mobilization time is not a factor in the simulation.
o The decision to return to the yard at the end of the day is influenced primarily by the time of day and whether the trash truck will have time to travel to the disposal facility and return to the yard by days’ end, approximately 5:30 p.m. Trash trucks must return to the yard empty in order to be ready for the next days’ work. The average time necessary for each trash truck to travel to the disposal site and return is approximately 1 hour and 15 minutes. Bulky waste pick-up delays due to trash truck delays at disposal sites were not observed during the study, therefore, the trash truck travel time was not used as a factor in the simulation. The turn-around time for trash trucks can vary depending on the day of the week, time of day, weather conditions and disposal facility conditions/status. All of these factors would exist under the simulated “Sweep” system.
Field Visits to Other Jurisdictions To observe automated TRC access control in an operational setting, the survey team visited the South Broward County TRC. To observe the “Sweep” method of bulky waste collection, the survey team visited the City of Coral Gables, City of Miami and City of Hialeah and observed their bulky waste collection operations. These observations allowed the survey team to effectively compare County’s existing bulky waste collection system and the “Sweep” system used by the cities. The cities visited did not keep records of bulky waste set-out rates, pile sizes or time between pick-ups. Their main focus was determining how large an area can be completed in one day’s time by one collection crew.

8
Curbside Bulky Waste Collection Background The approximately 320,000 residents of Miami-Dade County that pay the $439 annual waste fee are entitled to two bulky waste pick-ups each fiscal year (October 1 – September 30). The department will collect up to 25 cubic yards of bulky waste with each pick-up, or a resident may request that the two pick-ups be combined, for a single annual pick-up of 50 cubic yards. In order to schedule a bulky waste pick-up, residents are required to contact the department via the 311 answer center or the department’s website. Once a pick-up order has been placed, it is combined with other orders in the same general geographic area using Arc Logistics software to create a route for the bulky waste collection crew to follow. The department has established a performance goal of 9 calendar days from the day a bulky waste request is received until the pile is picked-up. As of September 8, 2008, the department had averaged 7.6 days for FY2007-08. A bulky waste collection crew is typically comprised of 4 employees - 1 Trash Crane Operator, 2 Trash Truck Drivers and 1 Waste Attendant, with 3 pieces of equipment - 1 crane and 2 trash trucks, allowing the crane to work continuously throughout the day. The resources available to the department for curbside bulky waste collection are shown in Table 3. Although the department has 54 cranes in inventory only the Scorpion cranes are fully utilized. The department plans to completely phase-out the Hydro Cranes and maintain only 6 Truck/Crane Combinations by 2015.5 Table 3 Curbside bulky waste collection crews are deployed in 22 geographic subareas (“Books”) of unincorporated Miami-Dade County and municipalities that receive County waste collection service. Bulky waste collection employees work 4 days x 10 hours weekly on either a B or C schedule (Mon. – Thurs. or Mon., Tues. & Thurs. Fri.), providing coverage for the 5 business days each week. Depending on the service demand, crews are deployed on the weekend to ensure adherence to the 9 day performance goal. With the exception of storm event years (FY2003-04, FY2004-05 & 2005-06), curbside bulky waste collection tonnage has increased gradually over time to its present level. Curbside bulky waste pick-up operational statistics are shown in Table 4.
5 Based on the DSWM Fleet Replacement Plan dated January 17, 2008.
Scheduled Curbside Bulky Waste Collection Resources Summary FY2006-07
Bulky Waste Collection Crews Based on a 4 day x 10 hour Work Week (Including Overtime Crews) 26 Truck/Crane Combinations 17 Hydro Cranes (cable mechanism) 16 Scorpion Cranes (hydraulic) 21 Total Cranes 54 Bulky Waste Collection Trucks 68

9
Table 4 Curbside Bulky Waste Collection Operational Statistics Summary FY2006-07 Total Bulky Waste Pick-ups 50,694 100% Scheduled Bulky Waste Pick-ups (“Called In”) 35,611 70% Illegal Dumping, Non-Compliance, Other Pick-ups 15,083 30% Average Bulky Waste Pick-ups per Crew per day (Based on a 4 day x 10 hour work week) 9 Average Number of Disposal Trips per Day per Crew 4 Average Tons per Bulky Waste Pick-up 1.5 Average Cubic Yards per Bulky Waste Pick-up 11* Total Tons of Bulky Waste Collected Curbside 76,375 * - Based on the department’s conversion factor of 7.2 cubic yards per ton.
While the average cubic yards per bulky waste pick-up is 11 cubic yards, 60% of the piles collected in FY2006-07 were 10 cubic yards or less and 80% were less than 15 cubic yards (refer to Figure 4). Figure 4
FY2006 - 07 Households Segmented by Volume Picked Up with Pareto Analysis
-
2,000
4,000
6,000
8,000
10,000
12,000
14,000
1 to 5 6 to 10 11 to 15 16 to 20 21 to 25 26 to 50 Over 50
Cubic Yards
# R
egul
ar W
O
0%
20%
40%
60%
80%
100%
120%
# Regular WO
Cumulative % ofTotal RegularWO

10
Curbside bulky waste collection costs represent 14% of department provided waste collection expenditures. All weekend bulky waste collection work is performed on an overtime basis. As of FY 2006-07, overtime is expended year round, with peak expenses typically occurring in the late summer months. Costs associated with curbside bulky waste collection are shown in Table 5. Complete curbside bulky waste collection cost calculations are included in Appendix II. Table 5
Scheduled Curbside Bulky Waste Collection Cost Summary FY2006-07
Total Activity Cost w/Overtime Cost 6 $16,821,664
Overtime Cost $334,627
Cost per 4 Person Crew 7
$194,992
Cost per Bulky Waste Pick-up (50,694 pick-ups) 8
$332
Cost per Ton of Bulky Waste Collected (76,375 tons) 9
$220 Curbside Bulky Waste Collection Findings & Analysis o Potential for Alternative Curbside Bulky Waste Collection Method - The
department’s current bulky waste collection service is an on-demand or “Scheduled” system, where customers call-in or email requests for service. The department’s capability to perform bulky waste collection using a “Sweep” system, which involves driving by each customer location on a set schedule, was evaluated using ProcessModel simulation software. The model estimates the number of bulky waste pick-ups that can be accomplished annually at a given frequency (e.g. weekly, monthly, quarterly, etc.) based on variables such as (1) number of bulky waste collection crews, (2) bulky waste set-out rate, (3) pile size and (4) time between pick-ups.
The simulation results suggest that implementing a “Sweep” system may be possible
using the existing level of crews and equipment on an every-other-month or monthly basis, provided that the average pile size is about half of the current 11 cubic yard average, the set-out rate is relatively low (10% to 15%) and the time between pick-ups is between 1 minute and one-half minute.10
o Customer Participation - Approximately 320,000 households paid the $439 annual
waste fee in FY2006-07. The department received 35,611 requests for bulky waste pick-up, including about 8,100 requests from repeat customers. Consequently, only
6 Derived from DSWM FULL COST DISCLOSURE REPORT FOR FY2006- 07. 7 Derived from FY2006-07 County Pay Plan and current pay step information from the DSWM. 8 Refer to Appendix I, page 3; Derived from DSWM Full Cost Disclosure Report for FY2006-07. 9 Refer to Appendix I, page 3; Derived from DSWM Full Cost Disclosure Report for FY2006-07. 10 Refer to Tables 6 & 7 in the Curbside Bulky Waste Collection Findings and Analysis Section of this report.

11
about 27,500 households or 9% of the rate payers received one or more bulky waste pick-ups during the fiscal year.
o Automated Routing - When the department inputs customer addresses into its GIS
based routing software (Arc Logistics), some of the addresses are rejected because the GIS base data layer contains address and street segment errors. This problem makes the routing process less efficient. Approximately 17,000 address and street segment errors in the GIS base layer are pending resolution by ETSD. Work is currently underway to correct the known errors in the GIS base layer, however the number of latent errors remains unknown. The integrity of the GIS base layer is important to many service delivery functions of the County, including emergency response. A longer-term solution involving standardization of address creation/correction procedures is now being developed.
o Distribution of Routing Packages - The department’s method of compiling bulky
waste routing information and distributing that information to its bulky waste collection crews is very paper intensive and inefficient. Routing packages “Books” are compiled at the department’s administrative offices. Paper copies of the “Books” are picked-up by bulky waste supervisors and delivered to field offices where they are modified to reflect unfinished work from the previous day prior to distribution to the crane operators. This process is completely manual (e.g. fax, email or other currently available technologies are not utilized to improve efficiency). Great strides toward efficiency in this area are possible with relatively little effort. Further, the inherent efficiency and integrity of the automated routing process is being routinely compromised by the department’s practice of including non-routed lists of priority “Special” pick-ups in the routing packages distributed daily to bulky waste collection crews. “Special” pick-ups include, but are not limited to, litter, illegal dumping, tires, non-compliance, traffic hazards, health hazards, and fee-for-service bulky waste removal. Based on field observations, “Special” pick-ups comprise approximately 25% of the total pick-ups.
o Automated Vehicle Locator - The department is planning to equip its entire on-road
vehicle fleet, including bulky waste collection vehicles, with Automatic Vehicle Locator (AVL) technology ($1.3 million estimated cost). AVL systems have been successfully deployed in other County departments, such as Building, to provide an enhanced level of customer service. The department’s justification stresses the use of AVL as a means to deal with day-to-day management/supervisory issues, such as drivers being off route, missed pick-ups and augmenting safety training and vehicle accident investigations, rather than tying its use to an initiative or set of initiatives that would enhance customer service. Using AVL technology to monitor the whereabouts of County employees that are under department supervision should not be the primary reason for employing this technology. OSBM has determined that the DSWM’s justification for deployment of AVL is insufficient. The full texts of the OSBM evaluation and the DSWM’s justification are included in Appendix III.
o Customer Interface - Approximately 10% of the time, trash piles are not set-out at the
pick-up location when the collection crew arrives. This inefficiency is commonly referred to as a “no-trash-out” (NTO) incident. While no single cause of this problem was identified, there are several probable contributing factors highlighted in the recommendations section that require attention.

12
o Comparison with Other Jurisdictions - Of the 15 jurisdictions surveyed for
comparison purposes, two-thirds (10) employ a “Sweep” system of bulky waste collection that does not involve customer scheduled pick-ups. Half (5) of the “Sweeps” are monthly, followed by 4 weekly and 1 quarterly. All but one jurisdiction using a “Sweep” system (Phoenix, AZ) have a smaller customer base than Miami-Dade County.
Sweep Collection Households
Broward Co., FL
Coral Gables, FL
4,000 (monthly)
11,000 (weekly)
Davie, FL
19,000 (monthly)
Hialeah, FL
37,000 (monthly)
Hollywood, FL
32,000 (monthly)
Honolulu, HI
Miami, FL
North Miami, FL
Phoenix, AZ
Sarasota County, FL*
180,000 (monthly)
68,000 (weekly)
1,300 (weekly)
386,000 (quarterly)
144,000 (weekly)
*Oversized is scheduled
Scheduled Collection Households
Hillsborough County, FL
Los Angeles County, CA
240,000
750,000
Miami Beach, FL
Miami-Dade County, Florida
Seattle, WA
6,500
320,000
166,000
Generally, the allowed set-out amount decreases as the pick-up frequency increases, however, there are exceptions (Hialeah, FL & Miami, FL - unlimited set-out/weekly sweep). The “Sweep” system is carried out much like garbage and recycling collection, where the collection vehicle passes by every household in a defined area at an

13
established frequency and collects all waste that is set-out in the proscribed manner (e.g. garbage collected 2 times per week/ automated container only; recyclables collected once every two weeks/automated container only, etc.).
The City of Coral Gables and City of Miami collect bulky waste using a weekly “Sweep” system, dividing the service area into sub-areas by day of the week (Coral Gables - 4 areas over 4 days with 5 Crews, and Miami - 5 areas over 5 days with 18 Crews). All available resources are used in the daily sub-area, and since the workload is fairly stable very little overtime is expended. Crews in Miami are on a task incentive system. Pile size is effectively limited to 8 cubic yards in the City of Coral Gables, above which a $10 fee per cubic yard is assessed. Pile size in Miami is unlimited. The City of Miami is considering a move to a monthly “Sweep,” complemented with up to 6 scheduled call-in pick-ups to serve areas of high yard trash generation, such as Coconut Grove. The Complete survey results are included in Appendix IV.
o Collection Equipment - Staff observed bulky waste collection operations in the cities of
Miami, Coral Gables and Hialeah, which utilize “Sweep” systems. The bulky waste collection equipment (cranes) used in Coral Gables and Miami are specifically designed for a “Sweep” environment, where the distances between piles are short and the piles are relatively small (i.e. 1-4 cubic yards; refer to photos below) The cities cranes are “rear steer,” meaning the crane operator works from a separate elevated rear-steer cab, continuously picking-up piles as it travels its route area. The driving cab is only used to transport the vehicle to and from the route. The unit is called a Lightning Rear Steer (Model RS-3) and costs approximately $130,000 - $140,000 per unit, depending on options (2008 City of Miami quote from Petersen Industries - $137,000).
City of Coral Gables 1 City of Coral Gables 2
City of Miami 1 City of Miami 2

14
Miami-Dade County 1 Miami-Dade County 2
o New Bulky Waste Cranes - The DSWM’s 21 new bulky waste collection “Scorpion”
cranes are specifically designed for a scheduled environment, where the distances between piles are longer and piles are larger (refer to photos above). In the department’s current operation, the crane is driven to an individual bulky waste pile and properly positioned with outriggers deployed. Once the collection activity is completed, the unit is made ready for travel and continues on to the next pile where the set-up and break-down process is repeated. This unit is over dimensioned for the existing service requirements (i.e. average pile size is only 11 cubic yards) and is not well suited for use in a “Sweep” system. The crane manufacturer, Automated Waste Equipment Co. Inc., manufactures approximately 200 American Hawk cranes each year, 80% of which are used in the logging industry. The department’s cranes cost approximately $240,000 each.
o Proximity Alarms - An incident occurred several years ago wherein a waste attendant
was electrocuted while touching a crane that was energized by coming into contact with a tree that was touching a power line. In response to this incident, all the department’s cranes are now equipped with “Proximity Alarms,” which indicate when the crane boom is in close proximity to a high voltage power source. The $10,000 multi-component alarm system is installed along the exterior of the crane boom by GSA after the equipment is delivered by the vendor (see photographs below). The system is easily damaged due to frequent contact with obstructions, such as tree limbs, and requires frequent maintenance, resulting in equipment down-time and repair cost. The annual repair cost per crane is approximately $2,000 or $70,000 annually for the active crane fleet, which amount appears to be increasing. GSA cranes are not equipped with proximity alarms, nor are those used by the City of Coral Gables and City of Miami. A check of the manufacturer’s website (www.sigalarm.com) indicates that the typical applications for this equipment are fire ladder trucks, heavy duty construction cranes and concrete pumping cranes. Miami-Dade County is mentioned in the web-video, but no other solid waste operations are cited as using this equipment.

15
Proximity Alarm Antenna at Boom End Proximity Alarm Control Unit
Cable Take-up Reel Cable Installed Along Crane Boom
o Simulation Modeling for a Bulky Waste Collection “Sweep” System – Multiple
“Sweep” system scenarios using variable pile sizes, set-out rates and number of crews are possible using the ProcessModel software. For purposes of clarity and simplicity, only the two “Sweep” system model scenarios that would not require additional crews are discussed in this finding. The first, shown in Table 6, is based on the following criteria: (a) 26 bulky waste collection crews, (b) 5 cubic yards per pick-up, and (c) a 1 minute interval between pick-ups. The second, shown in Table 7, is based on the same criteria, except the interval between stops has been reduced to 30 seconds. The 26 crews criterion used in these scenarios corresponds to the current number of crews deployed by the department, based on a 4 day x 10 hour work schedule.
The values in Tables 6 & 7 represent the minimum number of bulky waste pick-ups that must be accomplished annually by the department at each level for the “Sweep” system to work properly. The values in black (BOLD) indicate that the number of pick-ups accomplished surpasses the requirement for that criteria level. These values represent a cost neutral positive outcome, since the number of bulky waste collection crews does not change from the existing operation. The values in red (not bold) indicate that the minimum pick-up requirement cannot be met based on the specified criteria. In order to meet these criteria levels, additional resources (expenditures) would be required.

16
Table 6: One Minute Between Bulky Waste Piles Scenario Monthly/Yearly Pick-ups Pick-up Frequency
#Cubic Yards 5 Twice per
Month Once per
Month
Every Other Month
Once per
Quarter
Three Times
per Year Twice
per Year Once
per Year
Set-O
ut R
ate 50%
3,900,000
1,950,000
975,000
650,000
487,500
325,000
162,500
30% 2,340,000
1,170,000
585,000
390,000
292,500
195,000
97,500
15% 1,170,000
585,000
292,500
195,000
146,250 97,500
48,750
10% 780,000
390,000
195,000
130,000
97,500 65,000
32,500
Table 7: Thirty Seconds Between Bulky Waste Piles Scenario Monthly/Yearly Pick-ups Pick-up Frequency
# Cubic Yards 5 Twice per
Month Once per
Month
Every Other Month
Once per
Quarter
Three Times
per Year Twice
per Year Once
per Year
Set-O
ut R
ate 50%
3,900,000
1,950,000
975,000
650,000
487,500
325,000
162,500
30% 2,340,000
1,170,000
585,000
390,000
292,500
195,000
97,500
15% 1,170,000
585,000
292,500
195,000
146,250
97,500
48,750
10% 780,000
390,000
195,000
130,000
97,500
65,000
32,500
The black (BOLD) values in Table 6 suggest the department could collect bulky waste using an every-other-month (6 times per year) “Sweep” system at a 10% to 15% set-out rate (based on the scenario criteria). Reducing the drive time between pick-ups to 30 seconds in Table 7 suggests that a monthly “Sweep” is possible at a 10% set-out rate (based on the scenario criteria). Per pick-up and per ton cost comparisons for the three potential options mentioned above are included in Table 8 below. The table shows that the cost per pick-up and cost per ton for the bulky waste “Sweep” system would be significantly less than the current scheduled system.

17
Table 8
Bulky Waste Simulation "Sweep" System Cost Comparison
Pick-Up Frequency
Number of Annual
Pick-ups
Tons per
Pick-up
Cost per
Pick-up Total Tons Collected
Cost per Ton
Once per Month - 1 10% Set-Out Rate/5 Cubic Yards 390,000 0.69 $43 270,833 $62 Every Other Month - 2 15% Set-Out Rate/5 Cubic Yards 292,500 0.69 $58 203,125 $8310% Set-Out Rate/5 Cubic Yards 195,000 0.69 $86 135,417 $124 Current "Scheduled" System - 11 Cubic Yards 50,694 1.51 $332 76,375 $220 1 - 30 seconds between pick-ups 2 - 1 minute between pick-ups
The complete ProcessModel simulation results and estimates are included in Appendix V. It is not entirely clear what impact implementation of a “Sweep” system would have on bulky waste collection administrative costs. The routing clerk position in Figure 2 may no longer be required, but supervisory staff would probably remain. Since more residents would likely be served, complaint management/customer service may increase the demand for administrative personnel. It is unlikely that 311 Call Center staff would be reduced in the long-term, however short-term requirements for call center operators may increase during program implementation. As discussed earlier, the department and OSBM will work together to further refine the simulation model. Any decision to change the current bulky waste collection method will be predicated on the outcome of this collaborative process.
o Embedded Inefficiencies in the Scheduled Bulky Waste Collection System –
1. Since the geographic locations of bulky waste pick-ups are customer-selected, even using the automated routing software, the average distance between pick-ups is 1.5 miles (OSBM field sampling data 2008). This aspect of the current customer scheduled service results in approximately 10% of the work day being devoted to travel time between pick-up locations (8 minutes per interval between stops or 64 minutes per day, based on an average of 9 stops per crew per day).
2. Based on a field sample used to develop inputs for the simulation exercise, the
average bulky waste pick-up takes 23 minutes, including 15 minutes of pick-up time plus an 8 minute travel interval between stops. It should be noted that this level of performance would translate into approximately 22 pick-ups per day, based on 8.5 hours of actual working time in one day, however the average

18
number of pick-ups per crew per day for FY2006-07 was 9. This disparity is most likely due to route irregularities such as NTOs, improper set-out and routing inefficiencies such as “Special” pick-ups, etc. that decrease productivity over time.
o Obsolete Cranes - The bulky waste crane fleet includes 16 H3 Cranes, which employ a
cable mechanism no longer permitted by the Occupational Safety and Health Administration (OSHA). Replacement parts for the crane mechanism are no longer being manufactured and repairs often require fabrication of parts. As new cranes are purchased, the H3 Cranes are being phased-out. The cost to repair H3 Cranes is 46% higher than Trash/Dump Cranes and 44% higher than the new hydraulic “Scorpion” cranes manufactured by Automated Waste Equipment Co., Inc. The repair cost for four of the H3 Cranes exceeded $20,000 per year, one of which had over $30,000 in repair charges for the twelve month period September 2007 – August 2008.
o Servicestat Data - Bulky waste collection performance information is available in 311
Servicestat. In the vast majority of cases, the department is meeting or exceeding its bulky waste collection goal of 9 days, however, a handful of pick-ups in Servicestat are more than 20 days beyond the goal.
Curbside Bulky Waste Collection Recommendations Establish a Simulation Working Group The department and OSBM have agreed to establish a Simulation Working Group that will validate the ProcessModel “Sweep” assumptions and refine the model inputs though additional data gathering and analysis. In the event that the updated model results indicate that “Sweeps” are possible at current resource levels, jointly prepared financial forecasts will be developed showing the impacts of at least two agreed upon “Sweep” scenarios. Any decision to change the current bulky waste collection method will be predicated on the outcome of this collaborative process. Hold Future Crane Purchases/Reevaluate Specifications Due to concerns regarding over dimensioning, lack of versatility and high cost, the purchase of additional “Scorpion” cranes should be placed on hold until more suitable alternatives are identified and evaluated. The department should work with OSBM and GSA Fleet Management to reevaluate the specifications for bulky waste cranes. Issues to consider include: versatility, fuel efficiency, overall vehicle dimensions and maneuverability, and lifecycle cost. Place Automatic Vehicle Locator (AVL) Purchase on Hold Following a review of the department’s justification for the purchase of an AVL system for its entire on-road vehicle fleet, OSBM has determined insufficient justification exists to warrant this $1.3 million purchase. The department should first look for innovative ways to improve customer service, and subsequently determine if an AVL system is an appropriate tool that complements its overall customer service strategy.

19
Reduce or Eliminate Reliance on Proximity Alarms While the safety of our employees is paramount, there are reasonable limits in terms of the steps the County can and should take to guard against injury or death on the job. The core of the department’s defense against serious accidents should be proper employee supervision, education and training. The department should reevaluate its training program for bulky waste collection crews to ensure all crew members are aware of the dangers posed by working near power lines. Proper procedures should be developed and strictly adhered to (e.g. no one should be touching any part of the crane exterior when the crane is in use). Following this rigorous review, if the department determines that no better alternative to proximity alarms exists (e.g. grounding mechanism), the department should work with GSA to determine whether a proximity alarm can be fully integrated into cranes purchased in the future, so an exterior retrofit of the crane to install the proximity alarm post-purchase is no longer required. Automate Distribution of Bulky Waste Routing Packages The department should use readily available technology to improve the transmission of bulky waste routing information to field offices. As a first step, bulky waste routing packages “Books” should be transmitted via email rather than being picked-up by a supervisor. Discontinue the use of Special Pick-up Lists Special pick-up lists should either be discontinued or routed on a priority basis. Using non-routed special pick-up lists greatly diminishes the efficiency gains derived from the use of the Arc Logistics automated routing software. Better Communication with Customers The customer interface via 311 and the department’s website are contributors to the NTO problem, which is cutting into the efficiency of the bulky waste collection program. The department should reevaluate the bulky waste pick-up flex questions currently asked by the 311 call-taker. Particular attention should be paid to the clarity and sequencing of questions relating to when the pile will be set-out and picked-up. This also applies to the process of scheduling a bulky waste pick-up on the department’s website. After reviewing the standard questions asked by the 311 call taker when scheduling a bulky waste pick-up and the website scheduling screens and accompanying questions, some simple changes are required that will enhance customer service and increase operational efficiency as follows: o Current Process: During both conversations (phone & on-line), the customer is
advised that their bulky waste pile will be picked-up within 9 days, which is the department’s internal performance goal, however the 311 Servicestat data shows that pick-ups are taking place in as little as 1.5 days from the order date. Unless the bulky waste is already set-out when the customer calls or is placed out on or before the “ready date” given to the 311 call taker by the customer, an NTO will result. The website does not prompt the customer for a “ready date,” which further increases the likelihood of an NTO.
o Change to Current Process: The customer should not be told/informed that their pile
will be picked up within 9 days, they should instead be told/informed that their bulky

20
waste pile may be picked-up in as few as the minimum number of days it is taking the department to route and pick-up bulky waste piles. This timeframe will vary from time-to-time and the department must inform the 311 call center of any changes and update its website. If the customer will not be ready in the minimum number of days, they must be prompted to select a specific date when the pile will be ready for pick-up and the department must not route their address prior to that date in a manner that could result in an NTO. For example, if it is taking as few as 3 days from customer order to pick-up and the customer will be ready on the 18th day of the month, the department should not place the customer’s address in the routing process prior to the 15th day of the month.
Participate in Address Matching Working Group The department should be represented in the working group that is tasked with clearing the backlog of incorrect addresses in the GIS base layer and solving the address matching issue. The County’s development coordinator is leading this effort. Better Customer Information The process of collecting bulky waste piles could be made more efficient by providing customers with improved guidelines for proper set-out and enforcing those guidelines. The department’s website currently includes a list of answers to frequently asked questions about bulky waste collection. One of the answers concerns where to place bulky waste piles, however there are no photos or graphics that could better express what is permitted and what is not. Two examples of websites that provide a visual representation of proper and improper set-out include: http://phoenix.gov/GARBAGE/trshmain.html and http://www.davie-fl.gov/Pages/DavieFL_Programms/garbage/bulk. Further, the department’s Waste Collection Services brochure provides only cursory information on bulky waste set-out guidelines. The bulky waste section of the brochure should be enhanced in a similar fashion to the website. Review of Customer Service Information The department should review the 311 Servicestat bulky waste pick-up data on a periodic basis (at least monthly) to check for any orders that are well beyond the 9 day service goal. The department should determine the cause of the delay and use this information to improve service delivery.

21
Neighborhood Trash and Recycling Center Background The department operates 13 TRCs located throughout the waste collection service area where residents that pay the $439 annual waste fee can deposit their bulky waste in 40 cubic yard roll-off containers or larger transfer trucks, at no additional charge. The TRCs operate on a first come, first served, self-service basis. There is no limit to the number of visits a resident may make to a TRC in a day, week, month, or year. Permitted landscapers are allowed to use the TRCs provided they pay a per visit fee of approximately $21, using a disposal coupon purchased from the department. All 13 TRCs are open 7 days per week, 7:00 a.m. to 5:30 p.m. and close 3 days each year for holidays. The TRCs are typically staffed by 1 or 2 waste attendants and a supervisor. Most TRC roll-off truck drivers are assigned to a particular location, but some drivers work at multiple TRCs depending on service demands. TRC waste collection costs represent 22% of department provided waste collection expenditures. The cost per ton and cost per visit figures shown in Table 9 vary significantly between the higher and lower performing TRCs. The Total Annual Operating Cost per TRC ranges from a high of $3.8 million at Sunset Kendall to a low of $1.1 million at Richmond Heights. Richmond Heights has the highest cost per ton at $230 and the highest cost per visit at $34. Sunset Kendall has the lowest cost per ton at $100 and the lowest cost per visit at $15. Overall, the average cost per ton is $154 and the average cost per visit is $23. Complete TRC cost/operational calculations are included in Appendix VI. Table 9
TRC Operating Costs, Tonnage Throughput and Customer Utilization FY2006-07
TRCs North
Total Operating
Cost Tons
% of Total Tons
Est. Number of Visits
Cost per Ton
Est. Cost per
Visit
GOLDEN GLADES $1,396,589 7,729 4.0% 52,523 $181 $27
NORTH DADE $1,337,163 8,364 4.3% 56,839 $160 $24
NORWOOD $1,593,139 9,864 5.1% 67,032 $162 $24
PALM SPRINGS $1,644,563 10,201 5.3% 69,322 $161 $24
WEST LITTLE RIVER $2,234,961 16,328 8.5% 110,959 $137 $20
Subtotals $8,206,415 52,486 27.2% 356,675
TRCs South
RICHMOND HEIGHTS $1,133,054 4,936 2.6% 33,543 $230 $34
CHAPMAN FIELD $1,593,260 8,676 4.5% 58,959 $184 $27
EUREKA DRIVE $1,932,525 12,121 6.3% 82,370 $159 $23
SOUTH MIAMI HEIGHTS $1,835,115 12,874 6.7% 87,487 $143 $21
WEST PERRINE $2,217,484 15,285 7.9% 103,871 $145 $21

22
Neighborhood Trash and Recycling Center Findings & Analysis o TRC Access Control - The department’s Permitted Landscaper Program was
implemented on September 1, 2003, to address the problem of excessive clean yard trash infiltration through the TRCs by landscaping companies. In the first three fiscal years of the program the TRC tonnage declined by a total of 94,920 tons, resulting in a 4.9 million reduction in disposal fees for the Collections Fund. Since its low of 155,243 tons in FY2005-06, TRC tonnage has risen by 37,856 tons as of FY2006-07, which equates to $2.1 million in additional TRC disposal costs, which impacts the Collections Fund refer to Figure 5 below).
While gathering data on customer usage at 3 separate TRCs, staff observed that access control was minimal. This observation is further substantiated by the Countywide Secret Shopper – Phase II Final Recommendation report, July 2008, which found that only 3% of shoppers at all 13 TRCs were asked to show proof of residency. Given the
MOODY DRIVE $2,114,807 16,441 8.5% 111,727 $129 $19
SNAPPER CREEK $3,777,638 32,080 16.6% 218,003 $118 $17
SUNSET KENDALL $3,803,278 37,895 19.7% 257,520 $100 $15
Subtotals $18,407,161 140,308 72.8% 953,480
Totals $26,613,576 192,794 100%
1,310,154
Averages 14,830 100,781 $154 $23
FIGURE 5: Neighborhood Trash and Recycling Center (TRC) Tons & Landscaper Tons at Disposal Facilities
176,160
193,099
204,297
194,969
155,243
250,163
234,862
53,028
28,45437,46436,402
0
50,000
100,000
150,000
200,000
250,000
FY2000-1 FY2001-02 FY2002-03 FY2003-04* FY2004-05 FY2005-06 FY2006-07
Tons
Trash Recycling Center Tonnage Per Facility Permitted Lanscaper Tons at Disposal Facilities
*First Full Year ofLandscaper Program
TRC Tonnage Figures above from DSWM 2007 CAFR; Pgs. 86 & 87
23
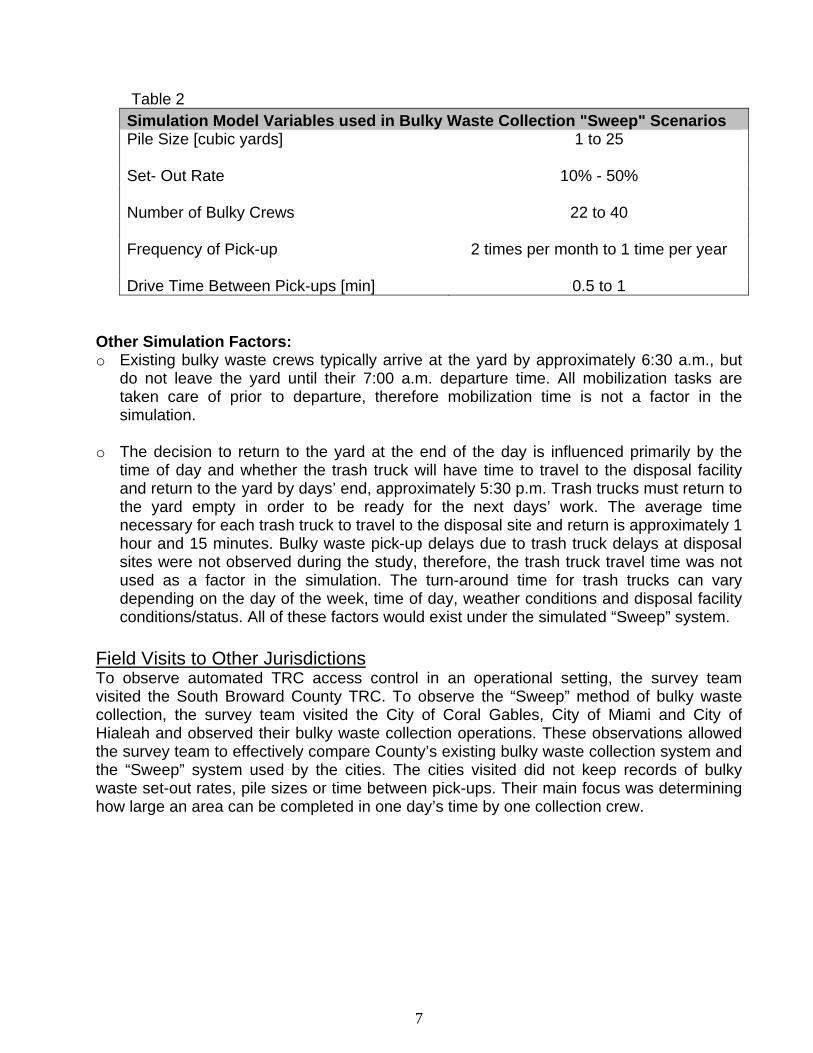
lack of effective eligibility verification, it is highly likely that ineligible waste, including commercial and non-permitted landscaper waste, is finding its way into the TRCs at the County’s expense. The Neighborhood Trash and Recycling Center Procedures Manual (revision 1999) Standard Operating Procedures Section, page 8, states “TRC employees are to check the ID of all customers entering the station to verify Miami-Dade County residency.” Unfortunately, the procedures manual is incorrect, as not all Miami-Dade County residents are eligible to use the TRCs. The universe of eligible TRC users includes all County waste collection customers and permitted landcapers. This covers residents of unincorporated Miami-Dade County and municipal residents of Aventura, Cutler Bay, Doral, Miami Gardens, Miami Lakes, Palmetto Bay, Pinecrest, Sunny Isles Beach and Sweetwater. TRCs are not equipped with street maps showing these eligible geographic areas, and even if they were, the process of determining the location of a specific address on a street map can be cumbersome and time consuming. To observe an automated TRC access control system in operation, staff visited the South Broward TRC and met with supervisory and line staff. The Broward model utilizes a field variety touch-screen lap-top computer equipped with a card reader to read addresses from driver licenses. Broward’s touch-screen interface was developed by in-house information technology personnel. The program instantly matches addresses with an eligible customer data base and can also capture data such as type of waste delivered and the number of visits per service address per month. Eligible residents are limited to 4 visits per month, which discourages delivery of non-residential/commercial waste. As a cross-verification measure, Broward County also requires that residents show a recent property tax bill or utility bill for the address that matches the driver’s license address.
South Broward TRC
A proposal and cost estimate from ETSD to equip all Miami-Dade County TRCs with similar technology is included in Appendix VII. The implementation cost estimate ranges from $56,000 to $81,000, with a monthly service fee for communications of

24
about $500. For the relatively modest investment in access control technology referenced above, the potential for a reduction in TRC disposal costs is very high. Table 10 below shows potential TRC disposal cost reductions at various access control impact levels.
Table 10
Potential TRC Access Control Cost Reductions
Tonnage Level
Scenario TRC
Tonnage
Annual Disposal
Cost Reduction
Annual Transportation Cost Reduction
Total Cost Reduction
FY2006-07 193,099 - -
15%
Reduction 164,000 $1.7 million $1 million* $2.7 million
25%
Reduction 145,000 $2.9 million $1.6 million* $4.5 million
35%
Reduction 125,000 $4 million $2.3 million* $6.3 million Note: The FY2008-09 disposal fee per ton is $60.43; The FY2006-07 transportation cost per ton is approximately $34. * - Affects the Disposal Fund (Fund 49); Does not affect the Collections Fund (Fund 47).
o Decline of the Permitted Landscaper Program - While the amount of waste delivered
to TRCs has been increasing in recent years, waste deliveries to disposal facilities by permitted landscapers, the number of permitted landscapers and landscaper coupon revenue are all in decline. The revenue drop between FY2005-06 and FY2006-07 was $539,195 (refer to Figure 6). While no conclusive explanation for this decline was identified during this study, it is likely that the lack of TRC access control has afforded landscapers the opportunity to use the TRCs without first obtaining a permit.

25
Figure 6
o TRC Cost & Efficiency - The conventional thinking has been that having residents deliver bulky waste to a TRC was more efficient and less costly than collecting the waste using County resources, and in terms of the overall average cost per ton this is still the case. A closer look at the daily operating costs of each individual TRC, however reveals that from 1 – 5 days each week, the cost per ton to operate 7 of the 13 TRCs is higher than the $220 cost per ton to pick-up bulky waste curbside.11 The high cost per ton is due to the low tonnage throughput during middle of the week. This means that on those high cost per ton days it would be more cost effective to pick-up the TRC customers’ bulky waste at their homes rather than having a TRC available for them to deliver the bulky waste using their own resources. The Palm Springs TRC example in Figure 7 below effectively illustrates this point. High cost per ton TRCs include: (1) Golden Glades, (2) Palm Springs North, (3) Norwood, (4) North Dade, (5) Chapman Field, (6) Eureka Drive and (7) Richmond Heights. A complete set of graphics showing the average daily cost per ton for all 13 TRCs is included in Appendix VIII.
11 Based on total bulky waste collection costs, both direct and indirect, including disposal costs. Derived from
the department’s FY2006-07 Full Cost Disclosure Report.
Neighborhood Trash and Recycling Center (TRC) Landscaper Coupon, Permit Fee and Disposal Fee Revenue
$182,131
$414,385$212,560
$261,520
$686,633$784,450
$508,051
$1,594,800
$2,009,900$1,902,000$1,889,148
$0
$500,000
$1,000,000
$1,500,000
$2,000,000
$2,500,000
FY2003-04 FY2004-05 FY2005-06 FY2006-07
* Permit Fee Revenue Coupon Revenue (TRC’s) Disposal Revenue (Landfills & RR)
*Permit fee revenue data for FY2003-04 was incomplete.

26
Figure 7
Average Daily Cost Per Ton
$218$229
$99
$184
$237
$104
$208
$0
$50
$100
$150
$200
$250
$300
Monday Tuesday Wednesday Thursday Friday Saturday Sunday
Palm Springs
Avg. Cost Per Ton For Bulky $220
Most of the TRCs have one or two waste attendants on duty on weekdays. It is likely that one waste attendant position could be eliminated at each of the above mentioned TRC’s if they were to close 3 days per week (Tuesday, Wednesday & Thursday). This level of personnel reduction would result in annual decrease in cost of approximately $270,000.
o TRC Transportation - Most TRC Transfer drivers are permanently assigned to
particular TRCs while others are assigned to TRCs on a where and when needed basis. This method of work assignment can result in transfer drivers waiting significant periods of time throughout the day for waste containers to fill. Field observations indicate that this waiting time ranges from approximately 15 minutes to 1 hour, 4 to 6 times per day.
o Disparity in TRC Utilization - It is important to note that the highest performing TRC,
Sunset-Kendall, is a prototype “Super Center” version that utilizes transfer trailers, as opposed to roll-off trucks, which carry about twice as much waste. Notwithstanding the operational differences, Snapper Creek, a conventional TRC with the next highest tonnage throughput for FY2006-07, received nearly the same amount of waste received at Sunset-Kendall (refer to Table 9). Furthermore, in 4 of the fiscal years since FY2000-01, Snapper Creek actually surpassed the Sunset-Kendall location in tonnage

27
throughput. This comparison indicates that utilization of the Snapper Creek TRC is extremely high in relation to the other conventional TRCs.
o TRC Comparisons - Miami-Dade County had the most TRCs (13) of the eight
communities surveyed that have TRCs. The most similar to Miami-Dade is Honolulu, Hawaii with ten. All communities surveyed limit access to residents of their jurisdictions and require proof of residency. Most limit the sizes and types of vehicles delivering waste and the types of waste accepted. Some limit the number of visits per day or month. Only one jurisdiction, Seattle WA, charges a fee per visit ($15 per visit for Clean Yard Trash; limited to automobiles and SUVs). The complete survey results are included in Appendix IX.
Neighborhood Trash and Recycling Center Recommendations Automate and Enforce Access Control at TRCs The department should implement an automated system to control access to the TRCs. Using the Property Appraiser’s database and a touch screen/lap-top/card reader system similar to that used in Broward County, TRC staff will be able to effectively screen customers using the address indicated on their driver’s license. A separate proof of residency along with the license, such as a current tax bill, utility bill, etc. should also be required to determine eligibility. A limitation on the number of visits per customer per week, month or year may be desirable to discourage TRC use by commercial businesses and encourage landscapers to apply for a landscaper permit and pay for landscaper disposal coupons. Any such limitation should be based upon TRC customer activity following implementation of the access control system. Additionally, the department should update and correct its TRC Procedures manual as discussed in this section. As mentioned earlier, a proposal and cost estimate from ETSD to equip all Miami-Dade County TRCs with similar technology is included in Appendix VII. The department should also contact the Department of Procurement Management Information Technology Unit to determine whether an off-the-shelf software exists that can provide the interface with the Property Appraisers data base, as an alternative to creating an in-house application. Adjust TRC Days of Operation Once the impacts of increased TRC access control have been assessed, the department should reevaluate adjustments to the days of operation for the following TRCs, particularly on Friday, Saturday, Sunday and Monday. Seasonal openings should also be considered.
1. Golden Glades 2. Palm Springs North 3. Norwood 4. North Dade 5. Chapman Field 6. Eureka Drive 7. Richmond Heights
Currently, TRC waste attendants work a 4 day x 10 hour schedule. Closing the above TRCs 3 days per week would allow the department to eliminate one waste attendant position at each TRC (7 total positions), resulting in an annual cost reduction of $270,000.

28
Six TRCs would remain open 7 days per week, 3 north of Kendall Drive and 3 south of Kendall Drive. Dynamic Modes of Transportation Currently, TRC roll-off trucks wait at an assigned TRC until a roll-off container is full. The department should pilot test a dynamic process whereby TRC managers communicate with roll-off drivers as they depart the disposal facility to direct them to the TRC that most needs transportation services at that particular time. This practice would reduce driver wait time at TRCs and may decrease the need for roll-off trucks and drivers, resulting in additional cost reductions.

29
Bulky Waste Enforcement Background The DSWM employs approximately 45 Enforcement Officers (EOs) to enforce the applicable provisions of Chapter 15 (Solid Waste Management) of the Miami-Dade County Code. Of the total number of EOs, 6 work exclusively at disposal facilities and 6 handle commercial recycling compliance. The remaining 33 EOs primarily handle compliance with bulky waste rules for the set-out of bulky waste for pick-up and illegal dumping on the rights-of-way in the waste collection service area. Most of their work is done in the field, but approximately 4 hours per week they must return to their office to complete paperwork. Each EO is assigned a geographic subarea of the waste collection service area to patrol. Generally, these areas mirror the 22 bulky waste collection subareas or “Books,” however some of the larger or more densely populated areas are further subdivided to balance workload. EOs work a 5 day per week schedule and patrol part of their assigned area each day, so the entire area is scheduled to be patrolled at least once per week. Lap-top computers are standard equipment in enforcement vehicles and allow the EO to determine whether a bulky waste pile on the right-of-way has been scheduled for pick-up in the department’s Waste Collection System (WCS). If a pile has not been scheduled or is illegally dumped, the EO begins the enforcement process. Generally, the enforcement process begins with a warning notice and is followed by a written citation, non-compliance pick-up and finally property lien. The process can be terminated at any point, once compliance has been achieved and any outstanding fines are paid. If a pile is illegally dumped, the EO must examine the pile for any evidence of its origin. Some enforcement work is also generated by citizen complaints via the 311 Answer Center. When an illegal dumping in progress complaint is received, the complaint is immediately referred to the MDPD Illegal Dumping Unit, which is funded by the DSWM (FY2006-07 $1.94 million; FY2008-09 $1.8 million estimated). Complaints involving bulky waste on private property are referred to the Office of Neighborhood Compliance (ONC) (formerly Team-Metro). The ONC will also notify the DSWM of bulky waste or illegal dumping on the right-of-way. Bulky Waste Enforcement Findings and Analysis o Illegal Dumping Concentrations - The 35,611 normal bulky waste pick-ups for
FY2006-07 were fairly evenly distributed across the waste collection service area, however, the approximately 15,000 enforcement related pick-ups, such as illegal dumping and non-compliance with bulky waste rules, were heavily concentrated in one specific area in Northwest Miami-Dade County and some outlying clusters [Refer to GIS Maps in Appendix X]. Other than more frequent patrol of areas with a disproportionate level of illegal dumping and posting of illegal dumping signs, there does not appear to be a more broad based effort on the part of the department to address the root causes/sources of illegal dumping (i.e. targeting waste tire generators and transporters [Chapter 15-17 of the Code], mini-storage businesses and high-turnover rental properties).

30
o MDPD Illegal Dumping Investigations - The department paid MDPD $1.8 million in
FY2006-07 to enforce illegal dumping laws (i.e. Chapter 15 of the County Code and Section 403.413 Florida Statutes; Florida Litter Law). MDPD recovered $233,000 in fines paid for a net cost of $1.567 million. There were 1,385 illegal dumping referrals from the 311 Call Center to MDPD in FY2006-07. MDPD made 565 illegal dumping arrests and issued 437 citations (1003 separate incidents).12 The net MDPD cost per arrest/citation is $1,560. Based on 311 call center referrals, the MDPD success rate in illegal dumping cases is 72%.
o DSWM enforcement staff indicated that their efforts to find the responsible party for
illegally dumped piles result in a successful outcome less than half of the time, and the actual percentage may in fact be very low.
o DSWM vs. ONC Enforcement - It is important to note that in 1998 responsibility for residential bulky waste enforcement was transferred from the DSWM to Team-Metro, only to be returned in the following year.
Bulky Waste Enforcement Recommendations Target Illegal Dumping The department should pursue initiatives that target areas of the waste collection service area where illegal dumping is concentrated. Initiatives should be tailored to address the root causes/sources of illegal dumping in the identified target areas. Raising public awareness of illegal dumping issues and the department’s efforts to combat it should be a primary consideration. Further Code Enforcement Analysis OSBM will pursue a more rigorous evaluation of the code enforcement functions provided by the DSWM, ONC and MDPD to identify potential consolidation scenarios and other efficiencies.
12 Referral, arrest and citation information was derived from MDPD provided actual data October 2006 to June 2007 prorated through September 2007.

31
Data Sources
Comparison Studies – Bulky Waste Collection, Trash and Recycling Centers, Enforcement Department of Solid Waste Management Full Cost Disclosure Report 2007 Data provided by DSWM: Budget, Accounting, Collection Operations, Enforcement Data provided by Neighborhood Compliance (Team Metro) Data provided by Miami-Dade Police Department (MDPD) 2005 Scheduled Zone Trash Collection Feasibility Analysis, May 2005, prepared by Planning and Economics Group Neighborhood Trash and Recycling Center Procedures Manual, Revision 1999 DSWM 2007 Comprehensive Annual Financial Report 311 Servicestat GSA Fleet visits EPA Report: Getting More for Less – Improving Collection Efficiency, November 1999 Original data collection at TRCs Field visits in the Cities of Coral Gables, Miami, Hialeah and Broward County Interviews with bulky waste collection equipment manufacturers

32
Appendix I: TRC Customer Visits Data
Appendix II: Curbside Bulky Waste Calculations
Appendix III: Evaluation of DSWM/ AVL Justification
Appendix IV: Bulky Waste Collection Comparison Chart
Appendix V: ProcessModel Simulation Data
Appendix VI: TRC Collection Calculations
Appendix VII: TRC Access Control Proposal and Cost Estimate from ETSD
Appendix VIII: TRC Average Daily Cost Per Ton Graphics
Appendix IX: TRC Comparison Chart
Appendix X: Illegal Dumping GIS maps
APPENDICES

Appendix I: TRC Customer Visits Data

Appendix II: Curbside Bulky Waste Calculations

Appendix III: Evaluation of DSWM/ AVL Justification

Appendix IV: Bulky Waste Collection Comparison Chart

Appendix V: ProcessModel Simulation Data

Appendix VI: TRC Collection Calculations

Appendix VII: TRC Access Control Proposal and Cost Estimate from
ETSD

Appendix VIII: TRC Average Daily Cost Per Ton Graphics
Appendix IX: TRC Comparison Chart

Appendix X: Illegal Dumping GIS maps