Embed Size (px)
Citation preview
RESEARCH ARTICLE Open Access
Comprehensive evaluation of methods toassess overall and cell-specific immuneinfiltrates in breast cancerIris Nederlof1,2†, Davide De Bortoli3†, Yacine Bareche4, Bastien Nguyen4, Michiel de Maaker2, Gerrit K. J. Hooijer1,Laurence Buisseret4, Marleen Kok5, Marcel Smid6, Gert G. G. M. Van den Eynden7, Arie B. Brinkman8, Jan Hudecek9,Jan Koster10, Christos Sotiriou4, Denis Larsimont11, John W. M. Martens6, Marc J. van de Vijver1, Hugo M. Horlings2,Roberto Salgado7,12, Elia Biganzoli3† and Christine Desmedt13*†
Abstract
Background: Breast cancer (BC) immune infiltrates play a critical role in tumor progression and response to treatment.Besides stromal tumor infiltrating lymphocytes (sTILs) which have recently reached level 1B evidence as a prognosticmarker in triple negative BC, a plethora of methods to assess immune infiltration exists, and it is unclear how thesecompare to each other and if they can be used interchangeably.
Methods: Two experienced pathologists scored sTIL, intra-tumoral TIL (itTIL), and 6 immune cell types (CD3+, CD4+,CD8+, CD20+, CD68+, FOXP3+) in the International Cancer Genomics Consortium breast cancer cohort usinghematoxylin and eosin-stained (n = 243) and immunohistochemistry-stained tissue microarrays (n = 254) and wholeslides (n = 82). The same traits were evaluated using transcriptomic- and methylomic-based deconvolution methods orsignatures.
Results: The concordance correlation coefficient (CCC) between pathologists for sTIL was very good (0.84) and for cell-specific immune infiltrates slightly lower (0.63–0.66). Comparison between tissue microarray and whole slide pathologyscores revealed systematically higher values in whole slides (ratio 2.60–5.98). The Spearman correlationsbetween microscopic sTIL and transcriptomic- or methylomic-based assessment of immune infiltrates werehighly variable (r = 0.01–0.56). Similar observations were made for cell type-specific quantifications (r = 0.001–0.54). We observed a strong inter-method variability between the omics-derived estimations, which is furthercell type dependent. Finally, we demonstrated that most methods more accurately identify highly infiltrated(sTIL ≥ 60%; area under the curve, AUC, 0.64–0.99) as compared to lowly infiltrated tumors (sTIL ≤ 10%; AUC0.52–0.82).
(Continued on next page)
© The Author(s). 2019 Open Access This article is distributed under the terms of the Creative Commons Attribution 4.0International License (http://creativecommons.org/licenses/by/4.0/), which permits unrestricted use, distribution, andreproduction in any medium, provided you give appropriate credit to the original author(s) and the source, provide a link tothe Creative Commons license, and indicate if changes were made. The Creative Commons Public Domain Dedication waiver(http://creativecommons.org/publicdomain/zero/1.0/) applies to the data made available in this article, unless otherwise stated.
* Correspondence: [email protected]†Iris Nederlof, Davide De Bortoli, Elia Biganzoli and Christine Desmedtcontributed equally to this work.13Department of Oncology, Laboratory for Translational Breast CancerResearch, KU Leuven, Leuven, BelgiumFull list of author information is available at the end of the article
Nederlof et al. Breast Cancer Research (2019) 21:151 https://doi.org/10.1186/s13058-019-1239-4
(Continued from previous page)
Conclusions: There is a lower inter-pathologist concordance for cell-specific quantification as compared tooverall infiltration quantification. Microscopic assessments are underestimated when considering small cores(tissue microarray) instead of whole slides. Results further highlight considerable differences between themicroscopic-, transcriptomic-, and methylomic-based methods in the assessment of overall and cell-specificimmune infiltration in BC. We therefore call for extreme caution when assessing immune infiltrates usingcurrent methods and emphasize the need for standardized immune characterization beyond TIL.
Keywords: Immune infiltrate, Breast cancer, Benchmarking, Methodology, Tumor infiltrating lymphocytes,Transcriptome, Methylome, Microscopy, Digital pathology
BackgroundIn breast cancer (BC), the presence of immune infiltrateand its composition affects prognosis and treatment effi-cacy, including response to novel immunotherapies [1–5].Specifically, increased levels of stromal tumor infiltratinglymphocytes (sTILs) are associated with response to neo-adjuvant chemotherapy and prognosis in triple negativeBC (TNBC) patients [4, 6–11]. In this context, sTIL hasnow been recognized as a valid prognostic biomarker bythe expert panel of the 16th St. Gallen Breast Cancer Con-ference. Clinical trials investigating immunotherapies inBC are also using TIL or CD8+ T cell scores either forscreening patients (e.g., NCT02997995) or as an endpoint(e.g., NCT03875573, NCT03815890, NCT03395899). Reli-able methods to estimate the amount and composition ofthe immune infiltrate are therefore critical, for cross-studycomparisons and future biomarker development.Over the past years, several waves of technology have
advanced the quantification and characterization of theimmune infiltrate in solid tumors. Pathologists have de-veloped methods to study the immune compositionthrough the microscope [12, 13], while advances in com-putational biology have enabled the inference of cell typecomposition of solid tumors by utilizing bulk transcrip-tomic and methylomic data [14]. Currently, thesemethods are often used interchangeably in translationaland fundamental research, assuming that they are pro-viding similar information. However, the differentmethods do have different properties and it may be chal-lenging to directly compare methods because of this. Tothe best of our knowledge, a detailed comprehensivecomparison of these methods, including cell type infer-ence using pathology, is still missing in BC, partly due tothe lack of centralized microscopic, transcriptomic, andmethylomic data.The primary objective of the current study was therefore
to compare the estimations of overall and cell-specific im-mune infiltration obtained by microscopic, transcriptomic,and methylomic methods in the International CancerGenomics Consortium (ICGC) BC cohort [15–17]. Thesecondary objective was to evaluate the reliability of thedifferent methods to classify tumors as highly or poorly
infiltrated [10], as stratification of patients according to se-verity of sTIL infiltration has proven prognostic import-ance and may become a clinical biomarker in the nearfuture [4, 10, 18].
MethodsPatients and datasetThis study is established on the ICGC BC cohort (https://dcc.icgc.org/) including 548 primary samples of female pa-tients, for whom transcriptomic and methylomic datawere available for 257 and 318 patients, respectively [15].Data access was granted by ICGC. The generated path-ology data, the type of data available for each patient, andthe distribution of clinical and pathological characteristicsare available at https://doi.org/https://doi.org/10.6084/m9.figshare.8234246.
Quantification of the tumor immune infiltrateWe collected tissue microarrays (TMAs; 3 cores/tumor,n = 254), whole slides (WS) for IHC (n = 82), andhematoxylin and eosin-stained WS (H&E; n = 243).TMAs and WS were stained for CD3, CD4, CD8, CD20,CD68, and FOXP3. Specific antibody clones, dilutions,and incubation times are listed in Additional file 1:Table S1. H&E slides were used to assess stromal TIL(sTIL) and intra-tumoral TIL (itTIL) for the whole slidesand the TMAs. Two experienced pathologists (RS,HMH) scored all slides using the online pathology plat-form Slidescore [19] and reported the percentage ofpositive immune cells in the stromal and intra-tumoralcompartment for each H&E- or IHC-stained slide, ac-cording to the existing guidelines [13]. A two-step digitalimage analysis (DIA) was performed using the Visio-pharm Integrator System Software (VIS; Visiopharm A/S, Hoersholm, Denmark) using two optimized applica-tions within the software to recognize positive DABstaining and tissue versus non-tissue. First, an applica-tion was used to detect the tissue and remove artifacts.With the second application, the positive-stained area(IHC-stained) was detected and the output variable isthe positive area. Detection of, for example, CD3 positiv-ity is based on the HDAB-DAB color deconvolution
Nederlof et al. Breast Cancer Research (2019) 21:151 Page 2 of 13
band. For all samples, the same threshold of positivitywas kept.For the computational analysis, we included methods
that provided an estimation of the immune infiltrationwith respect to the entire tumor (Table 1, Add-itional file 1: Table S2). This list includes techniquesused regularly for cell type inference. It should not beenseen as exhaustive as new techniques are constantly be-ing developed. We have included methods based ongene expression and methylation profiles, as both allowto study sample composition. Methods that estimate cel-lular populations from bulk data can be bluntly dividedinto two categories:
(1) Those based on marker genes, providing anindependent (semi-quantitative) assessment foreach cell type, enabling comparison betweensamples but not within samples
(2) Those based on deconvolution algorithms, inferringcell type fractions, enabling comparison betweenand within samples [14, 30]
To provide potential validation for immune infiltration,we calculated gene signatures specific for immune cell ac-tivity, namely cytolytic activity (CytAct) and interferon-gamma (IFNg) [31, 32]. All fractions of TIL and cell popu-lations for each method are available at https://doi.org/https://doi.org/10.6084/m9.figshare.8234246.Details for each method and processing are available
in Additional file 1, which also includes Additional file 1:Tables S2 and S3.
Statistical analysisStatistical analyses were performed using R version 3.5.1.Values for immune infiltration were log transformedwith an offset of 0.05. The agreement between observersand methods was assessed using the Bland-Altmanmethod and Passing-Bablok regression analyses. Specif-ically, the geometric mean of the two scores from thesame stained tumor section (x axis) is plotted against theratio between the two methods or observers (y axis),considering the overall geometric mean of the ratios(center line) and the approximate 95% limits of agree-ment (horizontal lines), and Loess fitted curves wereincorporated. Analysis was performed on all sampleswith available information for the methods taken intoconsideration. The concordance correlation coefficient(CCC) was used as a summary measure of reproducibil-ity between observations [33] for each cell type. To es-tablish the contribution of the itTIL and sTIL values toall TIL, a combined “averaged” TIL score was calculatedby taking the arithmetic mean of the sTIL and itTILscores for each sample and the Passing-Bablok regres-sion was used for the comparison between TIL scores.To assess replicability, correlations between methods
for tumor immune infiltration were measured using thenon-parametric Spearman’s rho coefficient, and a Loesssmoothing was used for flexible interpolation. The 95%confidence intervals (CI) were calculated using the boot-strapping procedure with 1000 bootstrap samples (over-lapping the results from the asymptotic approximation).Both the Spearman’s rho coefficient and Linn’s CCC
were interpreted according to qualifiers as “very poor”
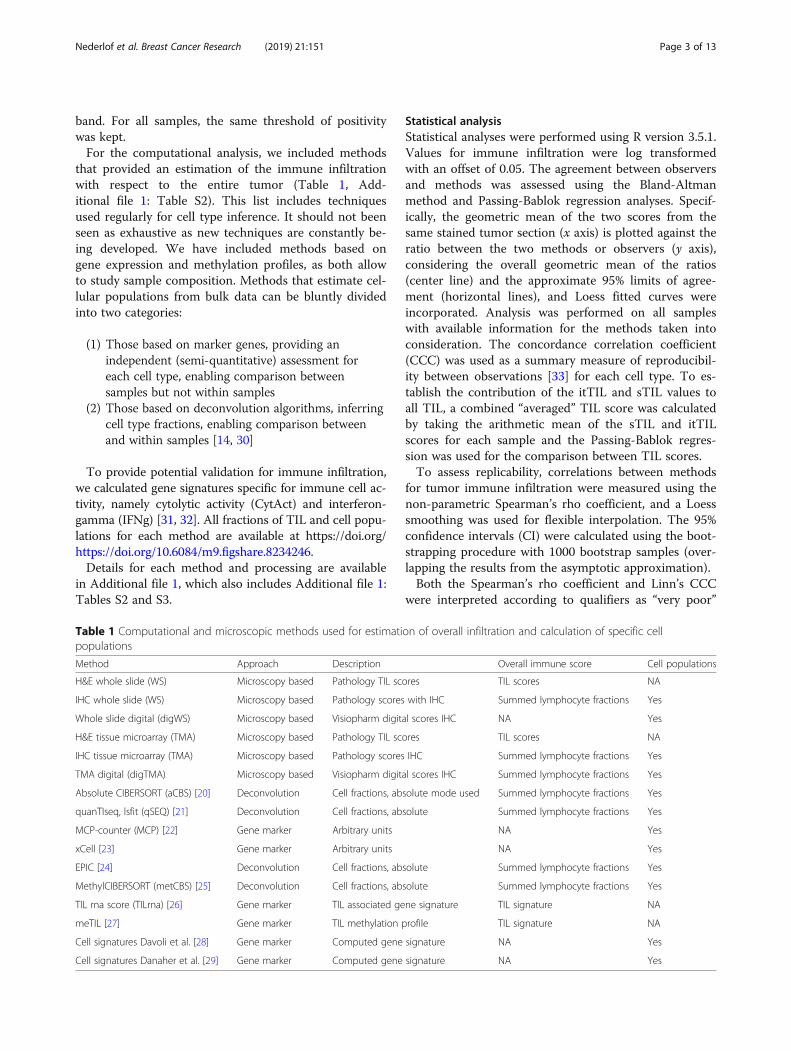
Table 1 Computational and microscopic methods used for estimation of overall infiltration and calculation of specific cellpopulations
Method Approach Description Overall immune score Cell populations
H&E whole slide (WS) Microscopy based Pathology TIL scores TIL scores NA
IHC whole slide (WS) Microscopy based Pathology scores with IHC Summed lymphocyte fractions Yes
Whole slide digital (digWS) Microscopy based Visiopharm digital scores IHC NA Yes
H&E tissue microarray (TMA) Microscopy based Pathology TIL scores TIL scores NA
IHC tissue microarray (TMA) Microscopy based Pathology scores IHC Summed lymphocyte fractions Yes
TMA digital (digTMA) Microscopy based Visiopharm digital scores IHC Summed lymphocyte fractions Yes
Absolute CIBERSORT (aCBS) [20] Deconvolution Cell fractions, absolute mode used Summed lymphocyte fractions Yes
quanTIseq, lsfit (qSEQ) [21] Deconvolution Cell fractions, absolute Summed lymphocyte fractions Yes
MCP-counter (MCP) [22] Gene marker Arbitrary units NA Yes
xCell [23] Gene marker Arbitrary units NA Yes
EPIC [24] Deconvolution Cell fractions, absolute Summed lymphocyte fractions Yes
MethylCIBERSORT (metCBS) [25] Deconvolution Cell fractions, absolute Summed lymphocyte fractions Yes
TIL rna score (TILrna) [26] Gene marker TIL associated gene signature TIL signature NA
meTIL [27] Gene marker TIL methylation profile TIL signature NA
Cell signatures Davoli et al. [28] Gene marker Computed gene signature NA Yes
Cell signatures Danaher et al. [29] Gene marker Computed gene signature NA Yes
Nederlof et al. Breast Cancer Research (2019) 21:151 Page 3 of 13
(< 0.20), “poor” (0.20–0.40), “moderate” (0.40–0.60),“good” (0.60–0.80), and “very good” (0.80–1.00) [34].To distinguish the highly and poorly infiltrated tu-
mors, the (calculated) overall immune infiltrationvalue (available at https://doi.org/https://doi.org/10.6084/m9.figshare.8234246) from each method was uti-lized. The thresholds used for the categorization arebased on the published meta-analysis on BC infiltra-tion [10]: sTIL ≤ 10% for poorly infiltrated tumors,11–59% for intermediately infiltrated tumors, and ≥60% for highly infiltrated tumors. To evaluate ifdifferent methods would classify the same tumor aspoorly or highly infiltrated, receiver operator charac-teristic curves were generated and area under thecurves (AUCs) of each classifier were calculated usingpROC package version 1.13.0. All tests were two-sided.
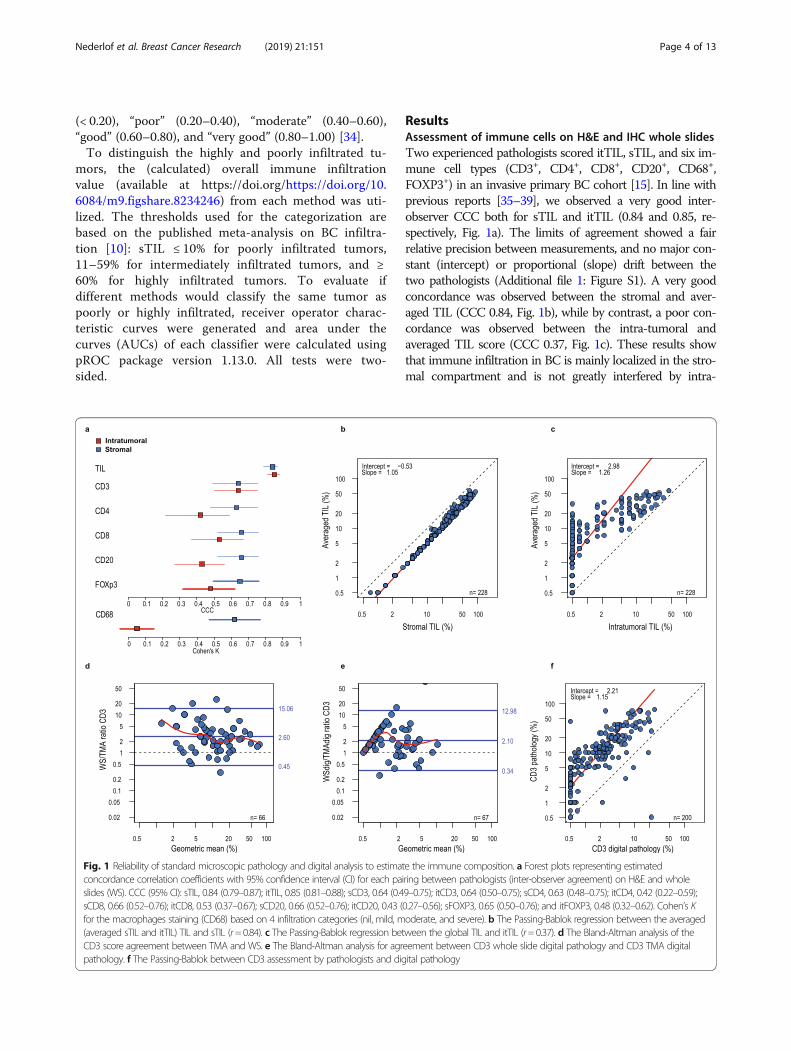
ResultsAssessment of immune cells on H&E and IHC whole slidesTwo experienced pathologists scored itTIL, sTIL, and six im-mune cell types (CD3+, CD4+, CD8+, CD20+, CD68+,FOXP3+) in an invasive primary BC cohort [15]. In line withprevious reports [35–39], we observed a very good inter-observer CCC both for sTIL and itTIL (0.84 and 0.85, re-spectively, Fig. 1a). The limits of agreement showed a fairrelative precision between measurements, and no major con-stant (intercept) or proportional (slope) drift between thetwo pathologists (Additional file 1: Figure S1). A very goodconcordance was observed between the stromal and aver-aged TIL (CCC 0.84, Fig. 1b), while by contrast, a poor con-cordance was observed between the intra-tumoral andaveraged TIL score (CCC 0.37, Fig. 1c). These results showthat immune infiltration in BC is mainly localized in the stro-mal compartment and is not greatly interfered by intra-
Fig. 1 Reliability of standard microscopic pathology and digital analysis to estimate the immune composition. a Forest plots representing estimatedconcordance correlation coefficients with 95% confidence interval (CI) for each pairing between pathologists (inter-observer agreement) on H&E and wholeslides (WS). CCC (95% CI): sTIL, 0.84 (0.79–0.87); itTIL, 0.85 (0.81–0.88); sCD3, 0.64 (0.49–0.75); itCD3, 0.64 (0.50–0.75); sCD4, 0.63 (0.48–0.75); itCD4, 0.42 (0.22–0.59);sCD8, 0.66 (0.52–0.76); itCD8, 0.53 (0.37–0.67); sCD20, 0.66 (0.52–0.76); itCD20, 0.43 (0.27–0.56); sFOXP3, 0.65 (0.50–0.76); and itFOXP3, 0.48 (0.32–0.62). Cohen’s Kfor the macrophages staining (CD68) based on 4 infiltration categories (nil, mild, moderate, and severe). b The Passing-Bablok regression between the averaged(averaged sTIL and itTIL) TIL and sTIL (r=0.84). c The Passing-Bablok regression between the global TIL and itTIL (r=0.37). d The Bland-Altman analysis of theCD3 score agreement between TMA and WS. e The Bland-Altman analysis for agreement between CD3 whole slide digital pathology and CD3 TMA digitalpathology. f The Passing-Bablok between CD3 assessment by pathologists and digital pathology
Nederlof et al. Breast Cancer Research (2019) 21:151 Page 4 of 13
tumoral infiltration. Of note, some tumors with a high over-all infiltration could still lack itTIL, as depicted in Fig. 1c, andinclude most probably tumors where the immune infiltrate isrestricted to the stroma or to the tumor margin. The inter-observer analysis demonstrated a moderate CCC for the im-munohistochemical (IHC) assessments, where stromal scor-ing performed overall better and more precisely than intra-tumoral scoring (Fig. 1a). All stromal IHC CCC values werelower for immune cell subtypes than for sTIL and itTIL as-sessment on H&E, ranging from 0.63 to 0.66 (Fig. 1a). Theintra-tumoral IHC methods had a CCC below 0.6, except foritCD3 (CCC= 0.64). We therefore only considered the morereliable and abundant stromal estimates for further analyses.
Comparison of tumor immune infiltration estimatesbetween tissue microarrays and whole slides (H&E and IHC)When stromal TIL was scored on both whole H&E slidesand TMA H&E, the correlation was moderate (0.56) (Fig. 3).The CCC between WS and TMA was only 0.26, where over-all a lower (5.98× lower) percentage was scored on H&E
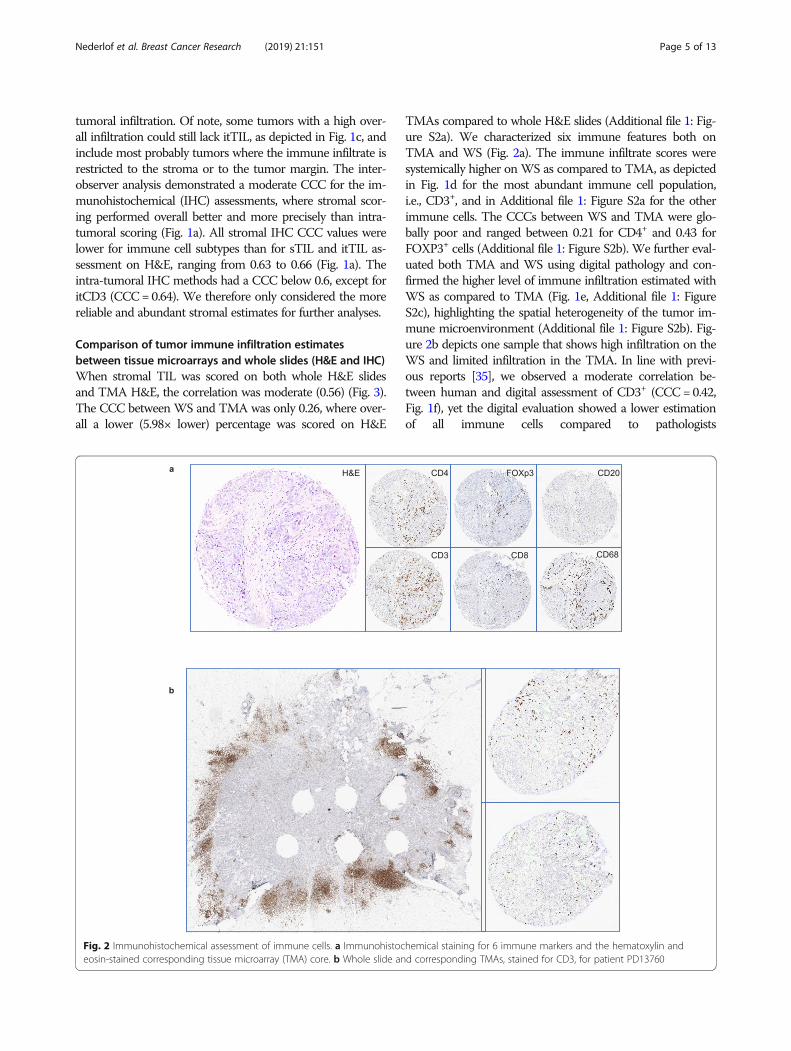
TMAs compared to whole H&E slides (Additional file 1: Fig-ure S2a). We characterized six immune features both onTMA and WS (Fig. 2a). The immune infiltrate scores weresystemically higher on WS as compared to TMA, as depictedin Fig. 1d for the most abundant immune cell population,i.e., CD3+, and in Additional file 1: Figure S2a for the otherimmune cells. The CCCs between WS and TMA were glo-bally poor and ranged between 0.21 for CD4+ and 0.43 forFOXP3+ cells (Additional file 1: Figure S2b). We further eval-uated both TMA and WS using digital pathology and con-firmed the higher level of immune infiltration estimated withWS as compared to TMA (Fig. 1e, Additional file 1: FigureS2c), highlighting the spatial heterogeneity of the tumor im-mune microenvironment (Additional file 1: Figure S2b). Fig-ure 2b depicts one sample that shows high infiltration on theWS and limited infiltration in the TMA. In line with previ-ous reports [35], we observed a moderate correlation be-tween human and digital assessment of CD3+ (CCC= 0.42,Fig. 1f), yet the digital evaluation showed a lower estimationof all immune cells compared to pathologists
Fig. 2 Immunohistochemical assessment of immune cells. a Immunohistochemical staining for 6 immune markers and the hematoxylin andeosin-stained corresponding tissue microarray (TMA) core. b Whole slide and corresponding TMAs, stained for CD3, for patient PD13760
Nederlof et al. Breast Cancer Research (2019) 21:151 Page 5 of 13
(Additional file 1: Figure S2d,), suggesting a relative humanoverestimation or digital underestimation of tumor immuneinfiltration.
Comparison of microscopic, transcriptomic, andmethylomic evaluation of overall tumor immuneinfiltrationTo evaluate if different data types could estimate overallimmune infiltration consistently, we compared the (calcu-lated) score of several microscopic-, transcriptomic-, and
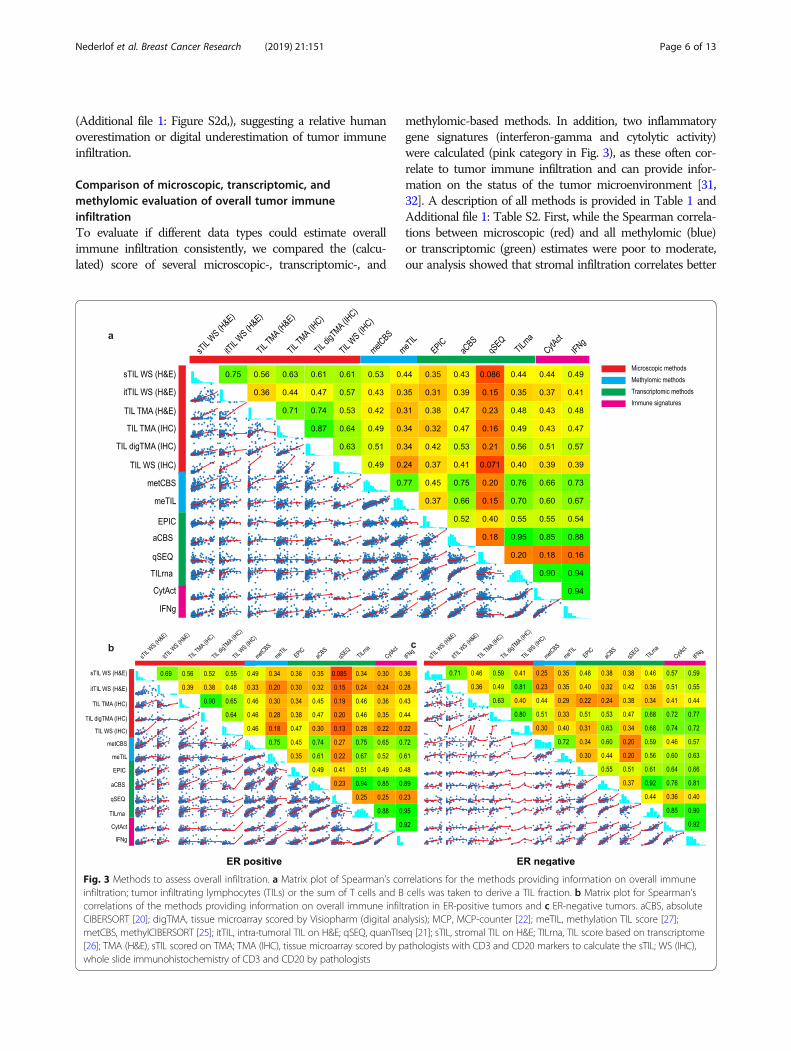
methylomic-based methods. In addition, two inflammatorygene signatures (interferon-gamma and cytolytic activity)were calculated (pink category in Fig. 3), as these often cor-relate to tumor immune infiltration and can provide infor-mation on the status of the tumor microenvironment [31,32]. A description of all methods is provided in Table 1 andAdditional file 1: Table S2. First, while the Spearman correla-tions between microscopic (red) and all methylomic (blue)or transcriptomic (green) estimates were poor to moderate,our analysis showed that stromal infiltration correlates better
Fig. 3 Methods to assess overall infiltration. a Matrix plot of Spearman’s correlations for the methods providing information on overall immuneinfiltration; tumor infiltrating lymphocytes (TILs) or the sum of T cells and B cells was taken to derive a TIL fraction. b Matrix plot for Spearman’scorrelations of the methods providing information on overall immune infiltration in ER-positive tumors and c ER-negative tumors. aCBS, absoluteCIBERSORT [20]; digTMA, tissue microarray scored by Visiopharm (digital analysis); MCP, MCP-counter [22]; meTIL, methylation TIL score [27];metCBS, methylCIBERSORT [25]; itTIL, intra-tumoral TIL on H&E; qSEQ, quanTIseq [21]; sTIL, stromal TIL on H&E; TILrna, TIL score based on transcriptome[26]; TMA (H&E), sTIL scored on TMA; TMA (IHC), tissue microarray scored by pathologists with CD3 and CD20 markers to calculate the sTIL; WS (IHC),whole slide immunohistochemistry of CD3 and CD20 by pathologists
Nederlof et al. Breast Cancer Research (2019) 21:151 Page 6 of 13
with all other methods, including transcriptomic and methy-lomic methods, as compared to the intra-tumoral infiltration(Fig. 3a). We tested the possibility that higher itTIL may leadto more pronounced inflammatory gene expression thansTIL as itTIL may have a crucial anti-tumor role [40–44].Yet, we observed no higher correlation between intra-tumoral infiltration and inflammation-associated signatures(immune signatures, pink label Fig. 3a). Secondly, a good cor-relation was observed between stromal microscopy assess-ment on H&E-stained (sTIL) and IHC-stained WS, wherethe sum of T (CD3+) and B (CD20+) cells were considered(r= 0.61). Thirdly, the correlation with the immune gene sig-natures, cytolytic activity (r= 0.51) and IFNg (r= 0.57), im-proved slightly when the infiltrate was scored with digitalpathology compared to the other microscopic (red) methods(Fig. 3a). This is most probably because both the immunesignatures (CytAct and IFNg) and the digital assessment ofthe TMA do not consider the type of infiltrates (intra-tu-moral vs stromal). The same trend was observed betweenthe digital assessment of the TIL on TMA (digTMA) andtranscriptomic TIL methods (green), where the Spearmancorrelations with EPIC (r= 0.42), aCBS (r= 0.53), and TILrna(r= 0.56) were again the highest compared to all othermicroscopic (red) methods. Fourthly, as expected, methodsusing the same modality for input of data showed better cor-relations. For example, several transcriptomic estimatesshowed a very good correlation with each other (r >0.80), and methylCIBERSORT [25] and the methylo-mic TIL score, meTIL [27], showed a reassuring goodagreement (r = 0.77). The correlation between tran-scriptomic and methylomics was variable, but methyl-CIBERSORT showed good correlations with absoluteCIBERSORT (r = 0.75) and TILrna [26] (r = 0.76), andsimilar observations could be made for meTIL andCIBERSORT(r = 0.66) and meTIL and TILrna (r =0.70). Fifthly, of the transcriptomic and methylomicmethods, TILrna, methylCIBERSORT, and absoluteCIBERSORT [20] showed the highest correlationswith microscopy scores, though the correlations werestill not perfect with the highest being 0.56 betweendigTMA and TILrna, 0.53 considering sTIL andmethylCIBERSORT, and 0.53 between digTMA andabsolute CIBERSORT. These numbers were howeverin line with a recently published lung cancer study[45]. Finally, of the methods that predict global im-mune infiltration based on the transcriptome (greenlabel in Fig. 3a), TILrna showed the highest correla-tions with the various immune gene signatures (pinklabel, r = 0.90–0.94), while quanTIseq [21] showed thepoorest correlations (r = 0.16–0.18). Similar analyseswere further carried on separately for ER-negativeand ER-positive tumors as the biological significanceof the immune infiltrate may be different [46, 47](Fig. 3b, c). The correlations for the microscopic-
versus methylomic- and transcriptomic-based methodswere in general slightly higher in the ER-negativecompared to the ER-positive subgroup. Nevertheless,compared to all samples, the ER-negative tumors didnot necessarily show higher correlations.Following the analysis at the continuous level (Fig. 3a–
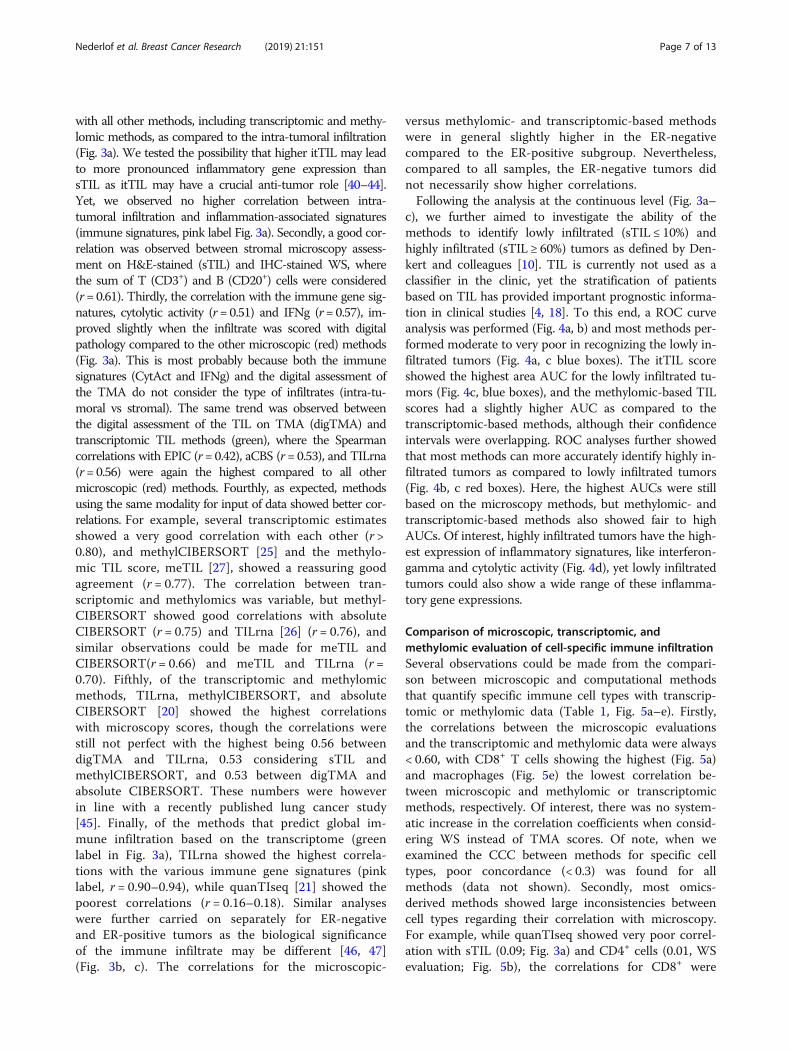
c), we further aimed to investigate the ability of themethods to identify lowly infiltrated (sTIL ≤ 10%) andhighly infiltrated (sTIL ≥ 60%) tumors as defined by Den-kert and colleagues [10]. TIL is currently not used as aclassifier in the clinic, yet the stratification of patientsbased on TIL has provided important prognostic informa-tion in clinical studies [4, 18]. To this end, a ROC curveanalysis was performed (Fig. 4a, b) and most methods per-formed moderate to very poor in recognizing the lowly in-filtrated tumors (Fig. 4a, c blue boxes). The itTIL scoreshowed the highest area AUC for the lowly infiltrated tu-mors (Fig. 4c, blue boxes), and the methylomic-based TILscores had a slightly higher AUC as compared to thetranscriptomic-based methods, although their confidenceintervals were overlapping. ROC analyses further showedthat most methods can more accurately identify highly in-filtrated tumors as compared to lowly infiltrated tumors(Fig. 4b, c red boxes). Here, the highest AUCs were stillbased on the microscopy methods, but methylomic- andtranscriptomic-based methods also showed fair to highAUCs. Of interest, highly infiltrated tumors have the high-est expression of inflammatory signatures, like interferon-gamma and cytolytic activity (Fig. 4d), yet lowly infiltratedtumors could also show a wide range of these inflamma-tory gene expressions.
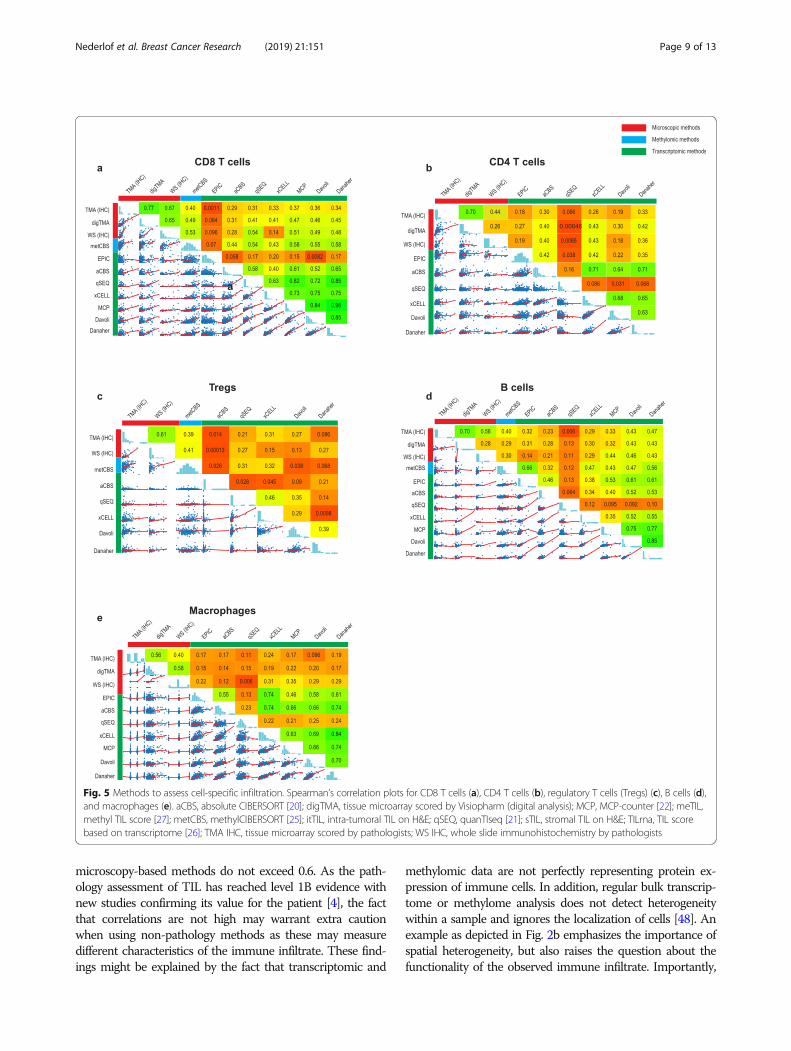
Comparison of microscopic, transcriptomic, andmethylomic evaluation of cell-specific immune infiltrationSeveral observations could be made from the compari-son between microscopic and computational methodsthat quantify specific immune cell types with transcrip-tomic or methylomic data (Table 1, Fig. 5a–e). Firstly,the correlations between the microscopic evaluationsand the transcriptomic and methylomic data were always< 0.60, with CD8+ T cells showing the highest (Fig. 5a)and macrophages (Fig. 5e) the lowest correlation be-tween microscopic and methylomic or transcriptomicmethods, respectively. Of interest, there was no system-atic increase in the correlation coefficients when consid-ering WS instead of TMA scores. Of note, when weexamined the CCC between methods for specific celltypes, poor concordance (< 0.3) was found for allmethods (data not shown). Secondly, most omics-derived methods showed large inconsistencies betweencell types regarding their correlation with microscopy.For example, while quanTIseq showed very poor correl-ation with sTIL (0.09; Fig. 3a) and CD4+ cells (0.01, WSevaluation; Fig. 5b), the correlations for CD8+ were
Nederlof et al. Breast Cancer Research (2019) 21:151 Page 7 of 13
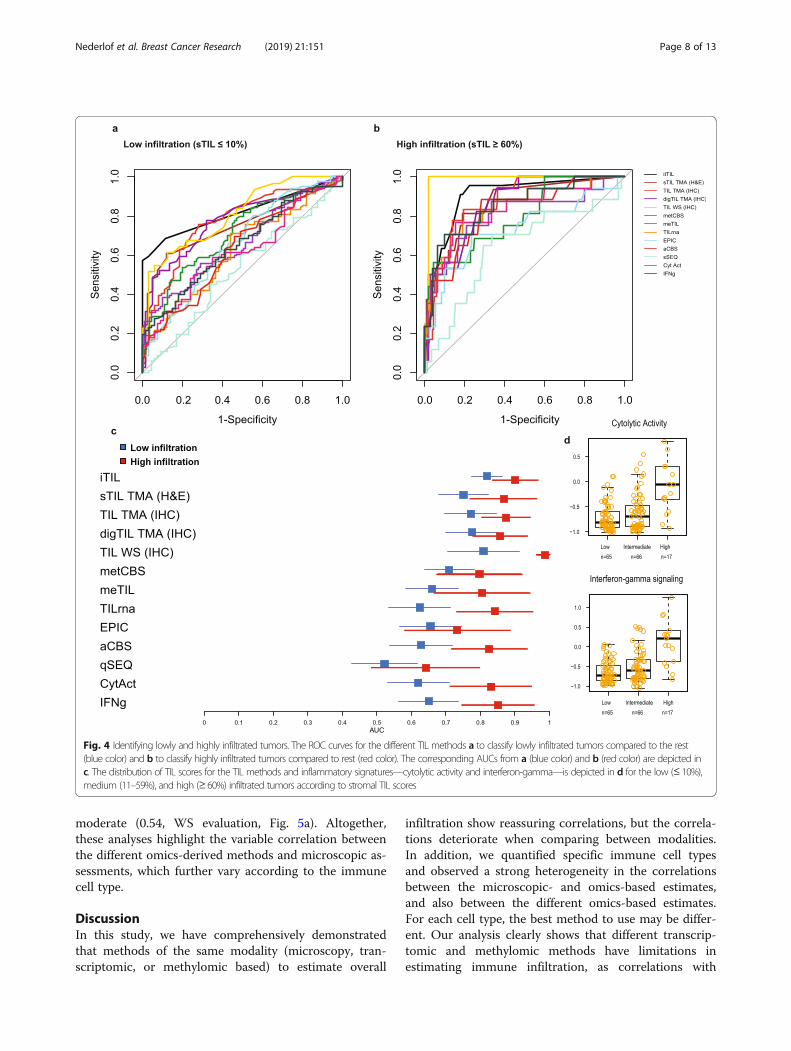
moderate (0.54, WS evaluation, Fig. 5a). Altogether,these analyses highlight the variable correlation betweenthe different omics-derived methods and microscopic as-sessments, which further vary according to the immunecell type.
DiscussionIn this study, we have comprehensively demonstratedthat methods of the same modality (microscopy, tran-scriptomic, or methylomic based) to estimate overall
infiltration show reassuring correlations, but the correla-tions deteriorate when comparing between modalities.In addition, we quantified specific immune cell typesand observed a strong heterogeneity in the correlationsbetween the microscopic- and omics-based estimates,and also between the different omics-based estimates.For each cell type, the best method to use may be differ-ent. Our analysis clearly shows that different transcrip-tomic and methylomic methods have limitations inestimating immune infiltration, as correlations with
Fig. 4 Identifying lowly and highly infiltrated tumors. The ROC curves for the different TIL methods a to classify lowly infiltrated tumors compared to the rest(blue color) and b to classify highly infiltrated tumors compared to rest (red color). The corresponding AUCs from a (blue color) and b (red color) are depicted inc. The distribution of TIL scores for the TIL methods and inflammatory signatures—cytolytic activity and interferon-gamma—is depicted in d for the low (≤ 10%),medium (11–59%), and high (≥ 60%) infiltrated tumors according to stromal TIL scores
Nederlof et al. Breast Cancer Research (2019) 21:151 Page 8 of 13
microscopy-based methods do not exceed 0.6. As the path-ology assessment of TIL has reached level 1B evidence withnew studies confirming its value for the patient [4], the factthat correlations are not high may warrant extra cautionwhen using non-pathology methods as these may measuredifferent characteristics of the immune infiltrate. These find-ings might be explained by the fact that transcriptomic and
methylomic data are not perfectly representing protein ex-pression of immune cells. In addition, regular bulk transcrip-tome or methylome analysis does not detect heterogeneitywithin a sample and ignores the localization of cells [48]. Anexample as depicted in Fig. 2b emphasizes the importance ofspatial heterogeneity, but also raises the question about thefunctionality of the observed immune infiltrate. Importantly,
Fig. 5 Methods to assess cell-specific infiltration. Spearman’s correlation plots for CD8 T cells (a), CD4 T cells (b), regulatory T cells (Tregs) (c), B cells (d),and macrophages (e). aCBS, absolute CIBERSORT [20]; digTMA, tissue microarray scored by Visiopharm (digital analysis); MCP, MCP-counter [22]; meTIL,methyl TIL score [27]; metCBS, methylCIBERSORT [25]; itTIL, intra-tumoral TIL on H&E; qSEQ, quanTIseq [21]; sTIL, stromal TIL on H&E; TILrna, TIL scorebased on transcriptome [26]; TMA IHC, tissue microarray scored by pathologists; WS IHC, whole slide immunohistochemistry by pathologists
Nederlof et al. Breast Cancer Research (2019) 21:151 Page 9 of 13
transcriptomic or methylomic methods may be biased to-wards a specific cell state, as they are often based on cellschallenged with experimental processes (e.g., tissue digestionor flow cytometry) or from different origin (e.g., peripheralblood or different tumors), which may contribute to the ob-served discordance with microscopy.More research into the contribution and spatial distribu-
tion of specific immune cells in the context of clinical out-come is warranted to understand beneficial and detrimentalimmune cell profiles. Spatially resolved methods, measuringgenetic and phenotypic diversity, would support advances forclinical studies [49]. Moreover, integration of deep learningapproaches with morphological features, in conjunction withgenomic-derived data, will probably be needed to derive afull comprehensive evaluation of the immune environmentin solid tumors. Our data provided us with insightful obser-vations that can guide future research using digital imageanalysis. First, we showed that stromal evaluation of severalimmune cell types is reliable with an acceptable concordanceobserved between pathologists, especially for stromal infiltra-tion. Second, values may also be estimated with a digital ap-proach, taking into account the systematically lowernumerical values for digital estimates [35]. Third, our resultsraise caution for the evaluation of immune markers on TMA(or biopsies) as small punches of the tumor may obscure in-formation of infiltration and WS showed overall a higher in-filtration than TMA. Our results on immune infiltrate are incontrast with several studies which demonstrated that TMAsare reliable for the evaluation of several prognostic epithelial-based tumor markers [50–53].Our second objective was to stratify patients into lowly in-
filtrated and highly infiltrated tumors, as more clinical studiesshowed that sTIL-based stratification could serve as an im-portant prognosticator [4, 18]. We observed that microscopicmethods (itTIL, WS, TMA IHC, digTMA) were better in thestratification of patients into lowly or highly infiltrates, as ex-pected due to their common modality as sTIL (as opposedto, for example, gene expression-based methods). We alsoshowed here that the majority of the methods are better inrecognizing highly infiltrated tumors as compared to lowlyinfiltrated tumors. The lower accuracy for identification oflowly infiltrated tumors may be problematic as the majorityof the breast tumors will have infiltration above 0% but farbelow 60%, as shown by Loi et al. [4] in early TNBC. Thesefindings should be taken into consideration in developing in-clusion and stratification criteria, as well as endpoints in thecontext of clinical trials.Strengths of this study include the large number of pa-
tients and extensive central evaluation of immune cells,together with the availability of transcriptomic andmethylomic data. A limitation of our study is that tissueanalysis (FFPE) and DNA/RNA isolation (FF) were notperformed on the exact same area from the tumor. Infil-tration may be affected by heterogeneity and partially
explain the correlations not exceeding 0.6. We mini-mized this effect by studying multiple cores spreadthroughout the tumor in the TMA and large sections ofthe tumors in WS, far exceeding the area usually evalu-ated with biopsies. Nevertheless, correlation with variousomics-based methods did not systematically increasewhen considering WS versus TMA. In addition, thedigital analyses of the immune cells were calculated asan area, while pathologists report a cellular percentage,leading to pre-analytical factors that affect the results.We were however not able to calculate the cellular per-centage due to visual cell segmentation problems. An-other limitation is that the omics-based methodsconsidered in this manuscript do not consider thelocalization of the cells in the tumors. In this context, arecent study conducted in TNBC suggested that tran-scriptomics might have the potential to derive thisspatial information [54]. Finally, this cohort does notprovide follow-up or therapy response data. Future stud-ies may test superiority of specific measures with the ul-timate goal to better guide precision medicine.
ConclusionThis study highlights an important heterogeneity in the vari-ous estimates of immune infiltrates in BC and calls for cau-tion when used in the clinical context. This study furtherprovides an important resource of multi-level data of thetumor immune microenvironment to researchers for futureinvestigations. Ultimately, there is an urgent need for the de-velopment of international guidelines to categorize breast tu-mors according to their immune infiltrate in both aquantitative and a qualitative manner. Combining the valu-able information from multiple methods, e.g., the spatial in-formation from pathology and transcriptomic informationon cellular activity, may elucidate the role of immune infiltra-tion in disease progression in a more accurate manner.
Supplementary informationSupplementary information accompanies this paper at https://doi.org/10.1186/s13058-019-1239-4.
Additional file 1: Supplementary Methods. Figure S1. The inter-observer analysis for all the stromal and intratumoral immune cell scores.Figure S2. Comparison between (dig) WS and (dig)TMA. Table S1. Theprocedures, clones, manufacturer and dilution used for the immunohisto-chemistry on tissue micro array (TMA) and Whole Slides (WS). Table S2.Description of all methods used in the manuscript to estimate immunecell infiltration. Table S3. Overview of used cell fractions for overall im-mune infiltration and specific immune subtypes.
AbbreviationsAUC: Area under the curve; BC: Breast cancer; CCC: Concordance correlationcoefficient; ER: Estrogen receptor; FF: Fresh frozen; FFPE: Formalin-fixedparaffin-embedded; H&E: Hematoxylin and eosin; HER2: Human epidermalgrowth factor receptor 2; ICGC: International Cancer Genomics Consortium;IHC: Immunohistochemistry; itTIL: Intra-tumoral tumor infiltrating lymphocyte;sTIL: Stromal tumor infiltrating lymphocyte; TIL: Tumor infiltrating
Nederlof et al. Breast Cancer Research (2019) 21:151 Page 10 of 13
lymphocyte; TMA: Tissue microarray; TNBC: Triple negative breast cancer;Tregs: Regulatory T cells; WS: Whole slide
AcknowledgementsThe authors thank all the many patients and families who contributed to thisstudy, and all researchers, clinician, technicians, and administrative staff whohave enabled this work to be carried out. Special thanks goes to the ICGCBreast Cancer Consortium for allowing us to access this dataset and use thevaluable abundance of data. Of the ICGC Breast Cancer Consortium, we wantto specially acknowledge the core group composed by Michael R. Stratton(Wellcome Trust Sanger Institute, UK), Ewan Birney (Wellcome Trust GenomeCampus, UK), Ake Borg (Lund University, Sweden), Anne-Lise Borresen-Dale(Oslo University Hospital, Norway), Hendrik G. Stunnenberg (Radboud Univer-sity, The Netherlands), Andrea L. Richardson (Johns Hopkins Hospital, USA),Alastair M. Thompson (University of Texas MD Anderson Cancer Center, USA),Jorunn E. Eyfjord (University of Iceland, Iceland), Andrew P. Futreal (Universityof Texas MD Anderson Cancer Center, USA), Sancha Martin (University ofGlasgow, UK), Serena Nik-Zainal (University of Cambridge, UK.), Andrew Tutt(King’s College London, UK), Sunil R. Lakhani (The University of Queensland,Australia), Steven Van Laere (University of Antwerp, Belgium), Paul N. Span(Radboud University Medical Center, The Netherlands), Laura van ’t Veer (Uni-versity of California San Francisco, USA), Alain Viari (Fondation Synergie LyonCancer, France), and Gu Kong (Hanyang University, South Korea), as well asall the investigators who contributed patients and samples, and all the pa-thologists who participated to the central pathology revision. The authorswould also like to acknowledge the Core Facility Molecular Pathology andBiobanking (CFMPB) from the Netherlands Cancer Institute.
Authors’ contributionsCD, EB, RS, HH, and IN conceived the study. GKJH and MM selected thetumor blocks, and constructed and stained the TMAs. RS and HH did all theanatomic pathological scoring on the slides. JH provided an online platformto enable pathology scoring. LB and IN generated, interpreted, andsupervised the digital analysis of the tissue slides. YB, BN, JK, and DBprocessed the transcriptomic and methylomic data for the various methods.DB performed the statistical analysis under the supervision of EB and CD. DB,EB, CD, and IN interpreted the data. IN drafted the manuscript under thesupervision of EB and CD. All other authors contributed data and/ormaterials; all authors critically commented and approved the final version.
FundingThis work was supported by the Dutch Cancer Society (grant 10510, receivedby M.J.vdV), Les Amis de Bordet (C.S. and C.D.), Fondation Cancer Luxemburg(C.D.), and Associazione Italiana per la Ricerca sul Cancro AIRC (E.B.). Y.B.reports funding from the Télévie and the Fonds National de la RechercheScientifique (F.R.S.-FNRS). RS was supported by a grant from the BreastCancer Research Foundation (BCRF no. 17-194). The funders had no role inthe study design, data collection and analysis, decision to publish, or prepar-ation of the manuscript.
Availability of data and materialsThe clinical, pathologic, transcriptomic, genomic, and methylation data usedin this study was already publicly available upon request to the ICGC dataaccess committee (https://icgc.org/daco).The microscopic data that were generated specifically for this study areincluded in this published article and its additional information files.
Ethics approval and consent to participateThis ICGC Breast Cancer dataset is hosted by the ICGC and deposited athttps://dcc.icgc.org/. Data access was granted by the International CancerGenome Consortium (ICGC).
Consent for publicationNot applicable
Competing interestsJ.H. is the owner of Slide Score B.V. L.B. reports participating fee paid by BMSfor its R&D day. MK reports funding to the institute from BMS, Roche and anadvisory role for BMS, outside the submitted work. CS reports an advisoryrole for Astellas Pharma, Cepheid, Vertex, Puma Biotechnology, SeattleGenetics, and Amgen, as well as travel funds from Roche and Genentech,
and intellectual property including epigenetic portraits of human breastcancer (PCT/EP2012/050836, WO2012/098215); a companion diagnostic forCDK4/CDK6 inhibitory drugs that is based on CDK4 phosphorylation, whichpatient to be treated and how (PCT/EP2017/061780) Speakers’ Bureau: Eisai,Prime Oncology, Teva, Foundation Medicine. M.J.vd. V reports researchfunding from MSD research and an advisory role for Hoffmann-La Roche. R.S.reports research funding from Merck and Roche, as well as travel funds fromAstra Zeneca, Roche, Merck, and BMS and an advisory role for BMS andRoche, outside the scope of this work. C.D. reports speakers fee paid directlyto the institution from Roche Diagnostics. The other authors declare thatthey have no competing interests.
Author details1Department of Pathology, Amsterdam University Medical Centre,Meibergdreef 9, 1105 AZ Amsterdam, The Netherlands. 2Division ofMolecular Pathology, The Netherlands Cancer Institute, Plesmanlaan 121,1066 CX Amsterdam, The Netherlands. 3Unit of Medical Statistics, Biometryand Bioinformatics “Giulio A. Maccacaro,” Department of Clinical Sciencesand Community Health and DSRC, University of Milan, Campus Cascina Rosa,Fondazione IRCCS Istituto Nazionale Tumori, Milan, Italy. 4J.C. Heuson BreastCancer Translational Research Laboratory, Université Libre de Bruxelles,Institut Jules Bordet, 1000 Brussels, Belgium. 5Departments of MedicalOncology and Tumor Biology and Immunology, The Netherlands CancerInstitute, Amsterdam, The Netherlands. 6Department of Medical Oncologyand Cancer Genomics Centre Netherlands, Erasmus MC Cancer Institute,Erasmus University Medical Center, 3015 CN Rotterdam, The Netherlands.7Department of Pathology, GZA-ZNA Ziekenhuizen, Wilrijk, Belgium.8Department of Molecular Biology, Nijmegen Centre for Molecular LifeSciences, Faculty of Science, Radboud University, 6500 HB Nijmegen, TheNetherlands. 9Department of Research IT, The Netherlands Cancer Institute –Antoni van Leeuwenhoek, Amsterdam, The Netherlands. 10Department ofOncogenomics, Amsterdam University Medical Centre, Meibergdreef 9, 1105AZ Amsterdam, The Netherlands. 11Pathology Department, Institut JulesBordet, 1000 Brussels, Belgium. 12Division of Research, Peter MacCallumCancer Centre, University of Melbourne, Melbourne, Victoria, Australia.13Department of Oncology, Laboratory for Translational Breast CancerResearch, KU Leuven, Leuven, Belgium.
Received: 5 August 2019 Accepted: 16 December 2019
References1. Schmid P, Adams S, Rugo HS, Schneeweiss A, Barrios CH, Iwata H,
et al. Atezolizumab and nab-paclitaxel in advanced triple-negativebreast cancer. N Engl J Med. 2018;NEJMoa1809615.
2. Emens LA, Cruz C, Eder JP, Braiteh F, Chung C, Tolaney SM, et al.Long-term clinical outcomes and biomarker analyses of atezolizumabtherapy for patients with metastatic triple-negative breast cancer.JAMA Oncol. 2019;5(1):74-82.
3. Savas P, Virassamy B, Ye C, Salim A, Mintoff CP, Caramia F, et al.Single-cell profiling of breast cancer T cells reveals a tissue-residentmemory subset associated with improved prognosis. Nat Med. 2018;24(7):986–93.
4. Loi S, Drubay D, Adams S, Pruneri G, Francis PA, Lacroix-Triki M, et al.Tumor-infiltrating lymphocytes and prognosis: a pooled individual patientanalysis of early-stage triple-negative breast cancers. J Clin Oncol. 2019;16:JCO1801010.
5. Ali HR, Chlon L, Pharoah PDP, Markowetz F, Caldas C. Patterns of immuneinfiltration in breast cancer and their clinical implications: a gene-expression-based retrospective study. Ladanyi M, editor. PLOS Med. 2016;13(12):e1002194.
6. Teschendorff AE, Miremadi A, Pinder SE, Ellis IO, Caldas C. An immuneresponse gene expression module identifies a good prognosissubtype in estrogen receptor negative breast cancer. Genome Biol.2007;8(8):R157.
7. Desmedt C, Haibe-Kains B, Wirapati P, Buyse M, Larsimont D, Bontempi G,et al. Biological processes associated with breast cancer clinical outcomedepend on the molecular subtypes. Clin Cancer Res. 2008;14(16):5158–65.
8. Ignatiadis M, Singhal SKSK, Desmedt C, Haibe-Kains B, Criscitiello C, Andre F,et al. Gene modules and response to neoadjuvant chemotherapy in breastcancer subtypes: a pooled analysis. J Clin Oncol. 2012;30(16):1996–2004.
Nederlof et al. Breast Cancer Research (2019) 21:151 Page 11 of 13
9. Solinas C, Gombos A, Latifyan S, Piccart-Gebhart M, Kok M, Buisseret L.Targeting immune checkpoints in breast cancer: an update of early results.ESMO Open. 2017;2(5):e000255.
10. Denkert C, von Minckwitz G, Darb-Esfahani S, Lederer B, Heppner BI, WeberKE, et al. Tumour-infiltrating lymphocytes and prognosis in differentsubtypes of breast cancer: a pooled analysis of 3771 patients treated withneoadjuvant therapy. Lancet Oncol. 2018;19(1):40–50.
11. Dieci M V, Conte P, Bisagni G, Brandes AA, Frassoldati A, Cavanna L, et al.Association of tumor-infiltrating lymphocytes with distant disease-freesurvival in the ShortHER randomized adjuvant trial for patients with earlyHER2+ breast cancer. Ann Oncol. 2019;30(3):418-23.
12. Hendry S, Salgado R, Gevaert T, Russell PA, John T, Thapa B, et al. Assessingtumor-infiltrating lymphocytes in solid tumors: a practical review forpathologists and proposal for a standardized method from the InternationalImmunooncology Biomarkers Working Group: part 1: assessing the hostimmune response, TILs in Invasi. Adv Anat Pathol. 2017;24(5):235-51.
13. Salgado R, Denkert C, Demaria S, Sirtaine N, Klauschen F, Pruneri G, et al.The evaluation of tumor-infiltrating lymphocytes (TILs) in breast cancer:recommendations by an International TILs Working Group 2014. Ann Oncol.2014;26(2):259–71.
14. Finotello F, Trajanoski Z. Quantifying tumor-infiltrating immune cells fromtranscriptomics data. Cancer Immunol Immunother. 2018 Jul;67(7):1031–40.
15. Nik-Zainal S, Davies H, Staaf J, Ramakrishna M, Glodzik D, Zou X, et al.Landscape of somatic mutations in 560 breast cancer whole-genomesequences. Nature. 2016;534(7605):47–54.
16. Smid M, Rodríguez-González FGG, Sieuwerts AMAM, Salgado R, Prager-VanDer Smissen WJCWJC, Vlugt-Daane MVDM van der, et al. Breast cancergenome and transcriptome integration implicates specific mutationalsignatures with immune cell infiltration. Nat Commun. 2016;7:12910.
17. Brinkman AB, Nik-Zainal S, Simmer F, Rodríguez-González FG, Smid M,Alexandrov LB, et al. Partially methylated domains are hypervariable inbreast cancer and fuel widespread CpG island hypermethylation. NatCommun. 2019;10(1):1749.
18. Park JH, Jonas SF, Bataillon G, Criscitiello C, Salgado R, Loi S, et al. Prognostic value oftumor-infiltrating lymphocytes in patients with early-stage triple-negative breastcancers (TNBC) who did not receive adjuvant chemotherapy. Ann Oncol Off J EurSoc Med Oncol. 2019.
19. www.slidescore.com.20. Newman AM, Liu CL, Green MR, Gentles AJ, Feng W, Xu Y, et al. Robust
enumeration of cell subsets from tissue expression profiles. Nat Methods.2015;12(5):453–7.
21. Finotello F, Mayer C, Plattner C, et al. Molecular and pharmacologicalmodulators of the tumor immune contexture revealed by deconvolution ofRNA-seq data. Genome Med. 2019;11:34. https://doi.org/10.1186/s13073-019-0638-6.
22. Becht E, Giraldo NA, Lacroix L, Buttard B, Elarouci N, Petitprez F, et al.Estimating the population abundance of tissue-infiltrating immune andstromal cell populations using gene expression. Genome Biol. 2016;17(1):218.
23. Aran D, Hu Z, Butte AJ. xCell: digitally portraying the tissue cellularheterogeneity landscape. Genome Biol. 2017;18(1):220.
24. Racle J, de Jonge K, Baumgaertner P, Speiser DE, Gfeller D. Simultaneousenumeration of cancer and immune cell types from bulk tumor geneexpression data. Elife. 2017;6.
25. Chakravarthy A, Furness A, Joshi K, Ghorani E, Ford K, Ward MJ, et al. Pan-cancer deconvolution of tumour composition using DNA methylation. NatCommun. 2018;9(1):3220.
26. Massink MPG, Kooi IE, Martens JWM, Waisfisz Q, Meijers-Heijboer H.Genomic profiling of CHEK2*1100delC-mutated breast carcinomas. BMCCancer. 2015;15(1):877.
27. Jeschke J, Bizet M, Desmedt C, Calonne E, Dedeurwaerder S, Garaud S,et al. DNA methylation-based immune response signature improvespatient diagnosis in multiple cancers. J Clin Invest. 2017;127(8):3090–102.
28. Davoli T, Uno H, Wooten EC, Elledge SJ. Tumor aneuploidy correlates withmarkers of immune evasion and with reduced response to immunotherapy.Science (80- ). 2017;355(6322):eaaf8399.
29. Danaher P, Warren S, Dennis L, D’Amico L, White A, Disis ML, et al. Geneexpression markers of tumor infiltrating leukocytes. J Immunother Cancer.2017;5(1):18.
30. Sturm G, Finotello F, Petitprez F, Zhang JD, Baumbach J, Fridman WH, ListM, Aneichyk T. Comprehensive evaluation of transcriptome-based cell-type
quantification methods for immuno-oncology. Bioinformatics. 2019;15;35(14):i436-45.
31. Rooney MS, Shukla SA, Wu CJ, Getz G, Hacohen N. Molecular and geneticproperties of tumors associated with local immune cytolytic activity. Cell.2015;160(1–2):48–61.
32. Ayers M, Lunceford J, Nebozhyn M, Murphy E, Loboda A, Kaufman DR, et al.IFN-γ–related mRNA profile predicts clinical response to PD-1 blockade. JClin Invest. 2017;127(8):2930–40.
33. Lin LH, Hedayat A WW. Statistical tools for measuring agreement. 2012thed. New York: Springer; 2012.
34. Douglas G. Altman practical statistics for medical research; 1991. p. 1–624.35. Buisseret L, Desmedt C, Garaud S, Fornili M, Wang X, Van den Eyden G,
et al. Reliability of tumor-infiltrating lymphocyte and tertiary lymphoidstructure assessment in human breast cancer. Mod Pathol. 2017;30(9):1204-12.
36. Khoury T, Peng X, Yan L, Wang D, Nagrale V. Tumor-infiltrating lymphocytesin breast cancer. Am J Clin Pathol. 2018;150(5):441–50.
37. Swisher SK, Wu Y, Castaneda CA, Lyons GR, Yang F, Tapia C, et al.Interobserver agreement between pathologists assessing tumor-infiltrating lymphocytes (TILs) in breast cancer using methodologyproposed by the international TILs working group. Ann Surg Oncol.2016;23(7):2242–8.
38. O’Loughlin M, Andreu X, Bianchi S, Chemielik E, Cordoba A, Cserni G, et al.Reproducibility and predictive value of scoring stromal tumour infiltratinglymphocytes in triple-negative breast cancer: a multi-institutional study.Breast Cancer Res Treat. 2018;171(1):1–9.
39. Tramm T, Di Caterino T, Jylling A-MB, Lelkaitis G, Lænkholm A-V, Ragó P,et al. Standardized assessment of tumor-infiltrating lymphocytes in breastcancer: an evaluation of inter-observer agreement between pathologists.Acta Oncol (Madr). 2018;57(1):90–4.
40. Chen Z, Chen X, Zhou E, Chen G, Qian K, Wu X, et al. IntratumoralCD8+ cytotoxic lymphocyte is a favorable prognostic marker innode-negative breast cancer. Filleur S, editor. PLoS One. 2014;9(4):e95475.
41. Catacchio I, Silvestris N, Scarpi E, Schirosi L, Scattone A, Mangia A.Intratumoral, rather than stromal, CD8+ T cells could be a potentialnegative prognostic marker in invasive breast cancer patients. Transl Oncol.2019;12(3):585–95.
42. Catacchio I, Scattone A, Silvestris N, Mangia A. Immune prophets of lungcancer: the prognostic and predictive landscape of cellular and molecularimmune markers. Transl Oncol. 2018;11(3):825–35.
43. Galon J, Costes A, Sanchez-Cabo F, Kirilovsky A, Mlecnik B, Lagorce-Pagès C, et al. Type, density, and location of immune cells withinhuman colorectal tumors predict clinical outcome. Science (80- ).2006;313(5795):1960–4.
44. Zhang L, Conejo-Garcia JR, Katsaros D, Gimotty PA, Massobrio M, Regnani G,et al. Intratumoral T cells, recurrence, and survival in epithelial ovariancancer. N Engl J Med. 2003;348(3):203–13.
45. Rosenthal R, Cadieux EL, Salgado R, Bakir M, Moore DA, Hiley CT, et al.Neoantigen-directed immune escape in lung cancer evolution. Nature.2019;567(7749):479–85.
46. Sobral-Leite M, Salomon I, Opdam M, Kruger DT, Beelen KJ, van der Noort V,et al. Cancer-immune interactions in ER-positive breast cancers: PI3Kpathway alterations and tumor-infiltrating lymphocytes. Breast Cancer Res.2019;21(1):90.
47. Kurozumi S, Matsumoto H, Kurosumi M, Inoue K, Fujii T, Horiguchi J, et al.Prognostic significance of tumour-infiltrating lymphocytes for oestrogenreceptor-negative breast cancer without lymph node metastasis. Oncol Lett.2019;17(3):2647–56.
48. Ståhl PL, Salmén F, Vickovic S, Lundmark A, Navarro JF, Magnusson J, et al.Visualization and analysis of gene expression in tissue sections by spatialtranscriptomics. Science. 2016;353(6294):78–82.
49. Crosetto N, Bienko M, van Oudenaarden A. Spatially resolvedtranscriptomics and beyond. Nat Rev Genet. 2015;16(1):57–66.
50. Kündig P, Giesen C, Jackson H, Bodenmiller B, Papassotirolopus B, FreibergerSN, et al. Limited utility of tissue micro-arrays in detecting intra-tumoralheterogeneity in stem cell characteristics and tumor progression markers inbreast cancer. J Transl Med. 2018;16(1):118.
51. Kyndi M, Sørensen FB, Knudsen H, Overgaard M, Nielsen HM, Andersen J,et al. Acta Oncologica Tissue microarrays compared with whole sectionsand biochemical analyses. A subgroup analysis of DBCG 82 b&c. 2009;
Nederlof et al. Breast Cancer Research (2019) 21:151 Page 12 of 13
52. Khouja MH, Baekelandt M, Sarab A, Nesland JM, Holm R. Limitations oftissue microarrays compared with whole tissue sections in survival analysis.Oncol Lett. 2010;1(5):827–31.
53. Camp RL, Charette LA, Rimm DL. Validation of tissue microarray technologyin breast carcinoma. Lab Investig. 2000;80(12):1943–9.
54. Gruosso T, Gigoux M, Manem VSK, Bertos N, Zuo D, Perlitch I, et al. Spatiallydistinct tumor immune microenvironments stratify triple-negative breastcancers. J Clin Invest. 2019;129(4):1785–800.
Publisher’s NoteSpringer Nature remains neutral with regard to jurisdictional claims inpublished maps and institutional affiliations.
Nederlof et al. Breast Cancer Research (2019) 21:151 Page 13 of 13