Embed Size (px)
Citation preview
ARTICLE
Comprehensive genomic resources related todomestication and crop improvement traits in LimabeanTatiana Garcia1,7,11, Jorge Duitama 2,11,12✉, Stephanie Smolenski Zullo3, Juanita Gil 2,8, Andrea Ariani3,9,
Sarah Dohle3, Antonia Palkovic3, Paola Skeen 1,10, Clara Isabel Bermudez-Santana 4, Daniel G. Debouck5,
Jaime Martínez-Castillo6, Paul Gepts 3 & Maria Isabel Chacón-Sánchez 1,12✉
Lima bean (Phaseolus lunatus L.), one of the five domesticated Phaseolus bean crops, shows a
wide range of ecological adaptations along its distribution range from Mexico to Argentina.
These adaptations make it a promising crop for improving food security under predicted
scenarios of climate change in Latin America and elsewhere. In this work, we combine long
and short read sequencing technologies with a dense genetic map from a biparental popu-
lation to obtain the chromosome-level genome assembly for Lima bean. Annotation of 28,326
gene models show high diversity among 1917 genes with conserved domains related to
disease resistance. Structural comparison across 22,180 orthologs with common bean reveals
high genome synteny and five large intrachromosomal rearrangements. Population genomic
analyses show that wild Lima bean is organized into six clusters with mostly non-overlapping
distributions and that Mesomerican landraces can be further subdivided into three sub-
clusters. RNA-seq data reveal 4275 differentially expressed genes, which can be related to
pod dehiscence and seed development. We expect the resources presented here to serve as
a solid basis to achieve a comprehensive view of the degree of convergent evolution of
Phaseolus species under domestication and provide tools and information for breeding for
climate change resiliency.
https://doi.org/10.1038/s41467-021-20921-1 OPEN
1 Departamento de Agronomía, Facultad de Ciencias Agrarias, Universidad Nacional de Colombia, Bogotá, Colombia. 2 Systems and Computing EngineeringDepartment, Universidad de los Andes, Bogotá, Colombia. 3 Department of Plant Sciences/MS1, University of California, Davis, CA, USA. 4Departamento deBiología, Facultad de Ciencias, Universidad Nacional de Colombia, Bogotá, Colombia. 5 Centro Internacional de Agricultura Tropical, Cali, Colombia. 6 Centrode Investigación Científica de Yucatán, Yucatán, Mexico. 7Present address: Biochemistry and Molecular Biology, Michigan State University, East Lansing, MI,USA. 8Present address: Department of Entomology and Plant Pathology, University of Arkansas, Fayetteville, AR, USA. 9Present address: BASF BBCC -Innovation Center, Gent, Belgium. 10Present address: Nunhems USA, Vegetable Seeds BASF, Acampo, CA, USA. 11These authors contributed equally: TatianaGarcia, Jorge Duitama. 12These authors jointly supervised: Jorge Duitama, Maria Isabel Chacón-Sánchez. ✉email: [email protected];[email protected]
NATURE COMMUNICATIONS | (2021) 12:702 | https://doi.org/10.1038/s41467-021-20921-1 | www.nature.com/naturecommunications 1
1234
5678
90():,;

The Phaseolus genus comprises more than 70 species, ofwhich five have been domesticated, namely P. acutifoliusA. Gray (tepary bean), P. coccineus L. (ayocote or runner
bean), P. dumosus Macfady (num, piloy, or year bean), P. lunatusL. (Lima bean), and P. vulgaris L. (common bean)1. Lima beanand common bean are the two agronomically and economicallymost significant species within the Phaseolus genus2–4. Lima beanprovides a vital source of nutrients globally; its seeds contain atleast 20% protein, more than 50% carbohydrates; it is a richsource of amino acids such as tryptophan, lysine, methionine,phenylalanine, threonine, valine, isoleucine, and leucine5,6.
Wild and domesticated Lima beans are found in a wide varietyof climatic conditions along with their range of distribution fromnorthern Mexico to northern Argentina7–9. Wild Lima beans arestructured into three major gene pools according to genomicdata10: two Mesoamerican (MI and MII) and one Andean (AI)gene pool. While MI occurs mainly in central-western Mexico,MII is more widely distributed from southern Mexico and CentralAmerica to tropical South America. The Andean gene pool AI isrestricted to southern Ecuador and northern Peru, where thisspecies apparently originated11. The possible existence of anotherAndean gene pool, the AII gene pool restricted to the Andes incentral Colombia has been proposed, although this requires fur-ther confirmation. At least two domestication processes tookplace in Lima bean, one in Mesoamerica and one in theAndes10,12–17. The Andean domestication occurred from genepool AI and gave rise to the Andean varieties characterized bylarge and flat seeds (Big Lima cultivars). The second eventoccurred in central-western Mexico from gene pool MI and gaverise to the Mesoamerican varieties characterized by having smallrounded or oval-shaped seeds (Potato and Sieva cultivars,respectively)18,19. Lima bean is a good example of convergentevolution since both Mesoamerican and Andean landracesevolved similar traits under domestication, mainly larger podsand seeds, reduction or loss of pod dehiscence, loss of seeddormancy, determinate growth habit and reduced content ofantinutritional seed compounds, among others.
Lima bean is a species of great interest for evolutionaryresearch not only because it provides an opportunity to study themolecular basis of convergent phenotypic adaptation, but alsobecause it shows adaptation to a wider range of ecological con-ditions compared to common bean9, especially to heat anddrought stresses, traits that are key in scenarios of adaptation toclimate change20. For these reasons, it is important to documentthe domestication process in Lima bean, since a good under-standing of the phenotypic adaptations involved and their geneticcontrol may lead to the identification of the related genes andalleles and efficient use of these alleles for future breeding activ-ities. Lima bean genetic research has previously relied on thecommon bean reference genomes21–24. Lima and common beanare both diploid species (2n= 2x= 22 chromosomes; DNA: ~622Mbp/1 C) with high levels of homozygosity throughout theirgenomes because of predominant autogamy25. Previous cytoge-netic research confirms a high degree of synteny between the twospecies26. However, relying on a P. vulgaris genome alone mayhave consequences for downstream diversity analyses due toreference bias, produces loss of information and could even bemisleading for predictions of genomic loci related to traits. Thedevelopment of a whole-genome reference sequence for P.lunatus would provide a groundbreaking genetic resource forLima bean research, while highlighting genomic differencesamong its domesticated relatives25–29.
In this research, we describe a large collaborative effort toprovide high-quality genomic resources for Lima bean geneticsand breeding. These include a high-quality reference genome,gene expression information in different tissues, accessions and
developmental stages, and the most comprehensive assessment ofgenomic variability in a sample of close to 500 wild anddomesticated accessions. By combining approaches based oncomparative genomics and population genetics, we reveal acomplete view of the distribution of genomic variability across thespecies and its relationship with the common bean. Moreover, weprovide gene functional annotations and genetic loci associationsfor different traits relevant to domestication processes andbreeding in Lima beans.
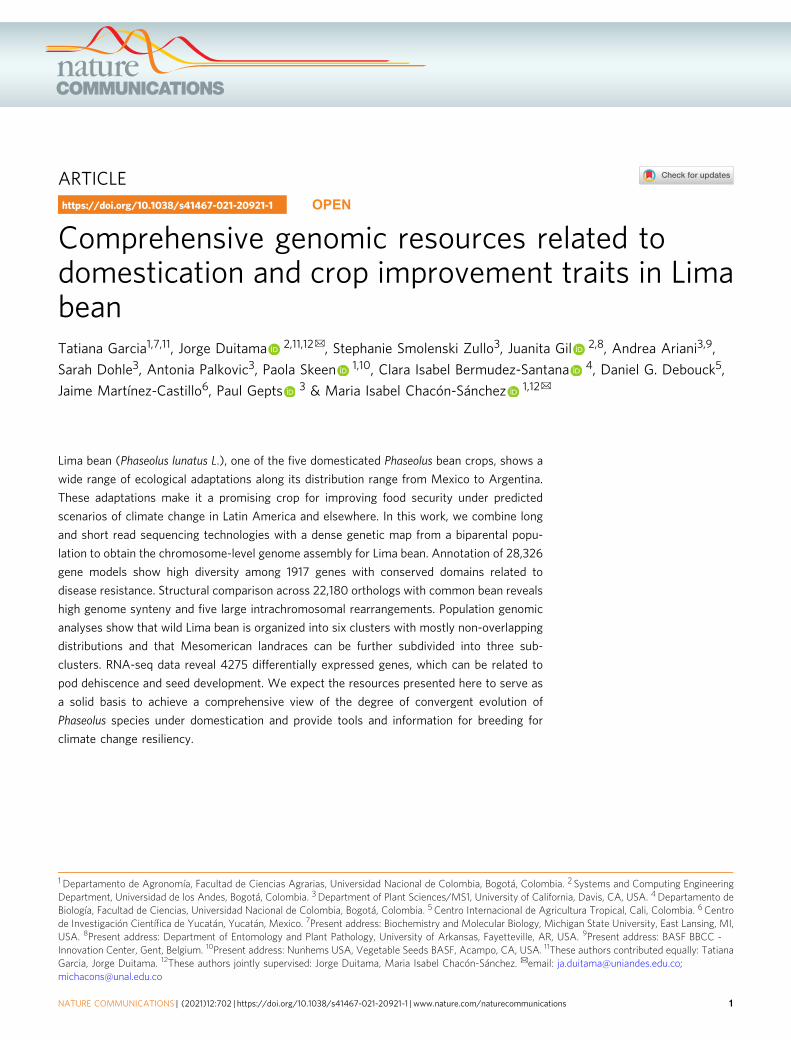
ResultsA chromosome-level high-quality assembly for Lima bean. Wegenerated a chromosome-level assembly of the Lima bean gen-ome from G27455, a domesticated accession from the Mesoa-merican gene pool MI collected in northern Colombia. Data fromthe use of Pacific Biosciences and Illumina sequencing technol-ogies and four experimental protocols, namely paired-end wholegenome sequencing (WGS), 10x, genotyping-by-sequencing(GBS), and RNA sequencing, were combined to achieve thecontiguity and base quality of this assembly. An initial backboneassembly of PacBio WGS reads polished using paired-end Illu-mina reads produced a draft assembly with 512 contigs adding upto 542 Mbp. A total of 206 of these contigs—totaling 512 Mbp—were further assembled in scaffolds, sorted, and oriented in 11pseudomolecules based on an analysis of linked reads obtainedfrom the G27455 accession following the 10x protocol and ana-lysis of GBS data from the F8 generation of UC 92–UC Haskellrecombinant inbred line population. A linkage map was devel-oped for this population with 10,497 SNPs across 522 unique lociwith an estimated genetic length of 1064 cM (SupplementaryFig. 1). Linkage groups were established for each of the 11chromosomes (Supplementary Fig. 2 and SupplementaryTable 1). This linkage map had an average genetic and physicalspacing between loci of 2.18 cM and 1.10 Mbp, respectively.Genetic gaps larger than 20 cM were observed on three linkagegroups: Pl01, Pl02, and Pl09, with 20.5, 24.4, and 32.8 cM gaps,respectively. Marker coverage varied across and within linkagegroups with the densest marker coverage observed in the peri-centromeric regions of Pl02, Pl05, Pl07, and Pl11, and the sparsestmarker coverage observed in the pericentromeric regions of Pl01and Pl09. Recombination rates varied within linkage groups, withthe lowest rates of recombination in the centromeric and peri-centromeric regions and the highest rates towards the telomericends (Fig. 1a and Supplementary Table 2). The Pl03 linkagegroup had the highest average recombination rate, with recom-bination events occurring every 662 kbp. The Pl10 linkage grouphad the lowest average recombination rate, with recombinationevents occurring on average every 2074 kbp, which may beinfluenced by the high degree of segregation distortion observedin the pericentromeric region towards the UC Haskell haplotype.The largest spans of the pericentromeric regions were on the Pl04,Pl10, and Pl11 linkage groups, and the shortest spans were onPl03 and Pl06 (Fig. 1b and Supplementary Table 2). The Pl01 andPl09 linkage groups had particularly sparse marker coverageacross the pericentromeric regions, which likely reduced theaccuracy of the recombination rates in these regions and thedefinition of the pericentromeric regions for these linkage groups.
Base-pair-level quality was assessed by the mapping of Illuminareads to the assembly, which reached 99% of the raw reads afterpolishing. In addition, the identification of orthologs reached98.8% of 1614 genes known to be conserved in a single copyacross plant species (Supplementary Fig. 3). Annotation ofrepetitive elements was performed using repeat masker30 andbased on a common bean library of 796 transposable elements31.A total of 656,928 events were identified covering 225 Mbp (41%
ARTICLE NATURE COMMUNICATIONS | https://doi.org/10.1038/s41467-021-20921-1
2 NATURE COMMUNICATIONS | (2021) 12:702 | https://doi.org/10.1038/s41467-021-20921-1 | www.nature.com/naturecommunications
of the assembly). More than half of these regions (174 Mbp) werecovered by long terminal repeats (LTRs). Additional 8 Mbp werecovered by other class I retrotransposons, namely LINE and SINEelements. DNA (Class II) transposons covered 25 Mbp of theassembly and other 6 Mbp was covered by other unclassifiedtransposable elements (Supplementary Table 3). Repetitiveelements are more abundant within pericentromeric regions ofthe genome (Fig. 1c).
To perform automated structural and functional annotation ofgene models for the Lima bean genome, repeat elements weremasked and Illumina RNA-seq data from three tissues (leaf,flower, and pod), two developmental stages (initiation of podelongation and before seed filling), and two accessions (G25230:wild from Manzanillo, Colima, Mexico; and G27455) were
analyzed. In contrast to repetitive elements, gene density andobserved number of SNPs is higher outside pericentromericregions (Fig. 1d, e). By integrating publicly available RNA-seqdata and gene models from the common bean genome, a total of28,326 gene models and 35,881 transcripts were predicted with anaverage total length of 3.7 kbp, and an average protein length of413 amino acids. Distributions of gene and protein length areconsistent with the current gene annotation for P. vulgaris(Supplementary Fig. 4). Gene ontology functional annotationscould be recognized for 21,642 (76%) of the gene models byortholog identification from other plant species. Commonontology terms included response to stress, different metabolicprocesses, transport, anatomical structure development, signaltransduction, cellular component assembly, and homeostasis
Fig. 1 Chromosome-level genome assembly for Lima bean. a Genetic distance (cM) and recombination rate (cM/Mbp) by physical position (Mbp) on theLima bean reference genome for the UC 92–UC Haskell RIL population. Chromosomes are labeled as Pl01-Pl11. b Chromosome lengths and pericentromericregions. c Density of repetitive elements. d Density of gene models. e Density of SNPs. f–i. LOD scores of QTL for four different traits screened in the RILpopulation. Colored zones represent LOD scores greater than 3 for determinacy (green), flowering time (blue), hundred seed weight (red), and volatilecyanide (yellow). j Phenotypic distribution of traits in the RIL population with parental phenotypes represented by vertical lines. Source data are provided asa Source Data file.
NATURE COMMUNICATIONS | https://doi.org/10.1038/s41467-021-20921-1 ARTICLE
NATURE COMMUNICATIONS | (2021) 12:702 | https://doi.org/10.1038/s41467-021-20921-1 | www.nature.com/naturecommunications 3
(Supplementary Fig. 5). A total of 19,554 gene models wereannotated with pathways from the Kyoto Encyclopedia of Genesand Genomes (KEGG). In total, functional annotations wereassigned to 22,634 (80%) gene models. Gene expression wasevidenced in at least one RNA-seq dataset for 26,295 (93%) genemodels. Moreover, orthologs with P. vulgaris within syntenyblocks were identified for 22,180 (78%) gene models (details inthe next section). Considering only gene expression andorthology with P. vulgaris in synteny blocks, direct evidencecould be identified for 27,029 (95%) of the annotated genemodels. From the remaining gene models, 416 show at least 50%protein sequence similarity with P. vulgaris genes outside syntenyblocks. The remaining 3% are either paralogs of genes with directevidence or have functional annotations from other plant species.
QTL mapping of agronomic-related traits in Lima bean.Quantitative trait loci (QTL) were mapped in the biparentalpopulation UC Haskell–UC 92 used to build the genetic map forgenome assembly (Fig. 1f–i and Supplementary Table 4). Deter-minacy and three quantitative traits (flowering time, FT;hundred-seed weight, HSW; and cyanide content) were screenedin this population (Fig. 1j). Nine quantitative trait loci (QTL)were identified in the biparental population. One major QTL fordeterminacy was identified on the long arm of chromosome Pl01,explaining 78% of the phenotypic variation. The peak LOD scorefor determinacy was located at the first marker on the long arm,after a nearly 20 cM and 20 Mbp gap in the pericentromericregion of chromosome Pl01. A likely causative gene for this locusis an ortholog of the Arabidopsis gene TFL1. The common beanortholog PvTFL1y was previously mapped at 45Mbp of chro-mosome Pv0132,33. We identified the ortholog PlTFL1 in Limabean at 41Mbp of Pl01 (Supplementary Data 1). For floweringtime, transgressive segregation was observed for both earlier andlater progenies than the UC 92 and UC Haskell parents,respectively (Fig. 1j). A major QTL was also found on chromo-some Pl01 and it is likely that the causative gene for this QTL isalso PlTFL1. However, this QTL explained only 30% of thephenotypic variation, which suggests that other genes influenceflowering time in this population.
Regarding seed weight, transgressive segregation was observedfor seed weights below the small-seeded parent UC Haskell, butnot for larger seed weights. This observation is consistent withprior results showing a shift towards smaller-seeded segregants,observed in common bean34,35. Four additive minor QTL wereidentified collectively explaining 28% of the phenotypic variation,including one on the long arm of chromosome Pl10 thatexplained 11% of the phenotypic variation. Finally, a major QTLfor cyanogenesis in floral bud tissue was found on the long arm ofchromosome Pl05 and explained 93% of the phenotypic variation,and collectively with two other minor QTL explained 97.5% ofthe total phenotypic variation for cyanogenesis. The UC 92variety did not show measurable cyanide content in contrast withUC Haskell. There was transgressive segregation for cyanidecontent above the levels observed in UC Haskell. The three QTLshowed epistatic interactions: the UC 92 allele of the larger QTLon Pl05, causal of the absence of cyanogenic glucosidase,prevented the expression of the two QTLs on Pl08 and Pl10(Supplementary Fig. 6). The significance interval of the QTL forcyanide content on Pl05 includes a sequence for a glucosidasewith homology to a cyanogenic glucosidase in white clover36,37.
Evolution of paralogs and orthologs and speciation events.Predicted proteins for representative transcripts of all annotatedgenes were aligned to each other to build 3499 paralog clustersrepresenting the gene families generated through different
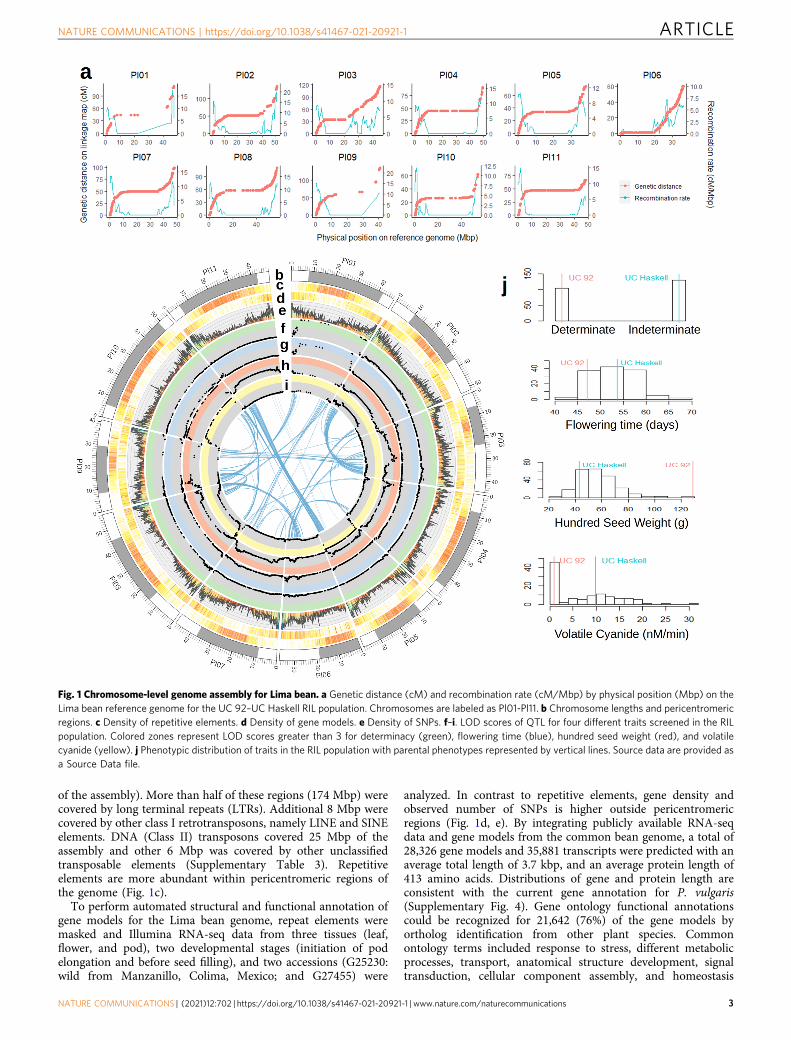
genome evolution processes. Classification of paralog relation-ships and interchromosomal synteny analysis revealed 1647genes with paralogs generated by the ancient whole-genomeduplication events documented in the history of Fabaceae38.Chromosome pairing inferred from these paralogs is consistentwith that reported in the genome of P. vulgaris23 (Internal linksin Fig. 1). Intrachromosomal duplication events were identifiedfor a total of 7285 genes. Even after removing highly repeatedgenes (with more than ten paralogs), 5849 genes were involvedin intrachromosomal duplication events. Figure 2a shows thatthe Ks values for these cases are significantly smaller than thoseof whole-genome duplication (WGD) paralogs (p-value < 10−15
for a Wilcoxon rank test), meaning that intrachromosomalduplications are more recent than WGD paralogs. Proteinevolution among the two types of paralogs was assessed bycalculating the Ka/Ks ratio between pairs of paralogs to identifypatterns of selection. In contrast to Ks values, Ka/Ks values ofintrachromosomal duplications are significantly larger thanthose of WGD paralogs (p-value < 10−15 for a Wilcoxon ranktest), which means that these duplications are diverging fasterthan WGD paralogs (Fig. 2b). Moreover, 12% of the localduplications seem to experience a rapid sequence divergenceshowing Ka/Ks ratios above 1. Functional enrichment of 368genes involved in recent duplications with high Ka/Ks ratiosrevealed a relatively large set of interconnected biological pro-cesses mostly related to immune response, including cell death,cell communication, and signaling (Supplementary Fig. 7).These findings are consistent with those reported by Qiaoet al.38 for other plant species. Other processes enriched inevolving intrachromosomal duplications include lipid transportand metabolism of lignan.
We compared the genome of Lima bean assembled in thisstudy with that of common bean v1.023 based on theidentification of orthologs between the two species and syntenyblocks. Orthologs could be identified for 25,564 (94%) of the P.vulgaris genes and 26,009 (92%) of the P. lunatus genes. Asreported in previous studies26, a high collinearity was observedbetween the P. lunatus and P. vulgaris genomes (Fig. 2c). Themost important structural events identified in this study are aninversion of the short arm of chromosome Pl10 and a largetranslocation of the pericentromeric region of Pv02 within theshort arm of chromosome Pl02. Other large events include a5Mbp inversion within the long arm of chromosome Pl03, a10Mbp inversion within the long arm of chromosome Pl07, anda complex translocation within the short arm of chromosomePl09. The rearrangements in Pl02 and Pl10 confirm previousworks suggesting pericentromeric inversions in these chromo-somes based on Fluorescence in situ hybridization (FISH)assays28. As seen in other species, some of these rearrangementscould be related to the previously observed reproductive isolationbetween Lima bean and common bean39,40.
Figure 2a shows that the Ks distribution of 22,180 orthologsbetween P. lunatus and P. vulgaris identified in synteny blocks iscentered around 0.05. This is about half of the average obtainedfor paralogs generated by the recent (about 13 MYA) WGD eventwithin the G. max genome41, suggesting that the speciationbetween P. vulgaris and P. lunatus occurred around 6 MYA. Thisdate is close to the age of the Phaseolus crown clade B (thatcontains P. vulgaris and P. lunatus) estimated on the basis ofevolutionary rates of the chloroplast trnK locus (5.0 ± 0.7 MYA)and older than the date estimated from ITS/5.8 S sequences (3.4± 0.4 MYA)2. Comparing the genomes of Lima bean and Vignaunguiculata42, the separation of Phaseolus from Vigna could bedated right before the WGD of G. max, around 15 MYA. Thisdate is much older than that estimated by Delgado-Salinas et al.43
for the Vigna sensu lato crown clade (9.1 ± 1.0 MYA) from
ARTICLE NATURE COMMUNICATIONS | https://doi.org/10.1038/s41467-021-20921-1
4 NATURE COMMUNICATIONS | (2021) 12:702 | https://doi.org/10.1038/s41467-021-20921-1 | www.nature.com/naturecommunications
chloroplast trnK sequences. Protein evolution between orthologswas also assessed by calculating the Ka/Ks ratio, in this case, toidentify patterns of selection after the speciation event separatingP. vulgaris and P. lunatus. In line with previous studies in otherspecies38, the distribution of Ka/Ks was centered far below 1,suggesting that most gene coding sequences evolve underpurifying selection (Fig. 2b). Conversely, 656 gene pairs withinthe main synteny blocks showed rapid sequence divergence withKa/Ks values larger than 1. Functional enrichment of these genesshows ontologies related to the metabolism of aminoglycan,
chitin, and lignan (Supplementary Fig. 7). As described in the lastsection, genes related to these processes have increased expressionvalues during the development of the pod.
Orthologs of genes related to agronomic characteristics. Genesof agronomic interest were predicted by ortholog relationships ofgenes associated with agronomically relevant traits in other crops(Supplementary Data 1). We identified Lima bean orthologs of 30genes having reported associations with traits in previous studies,
Fig. 2 Comparative genomics between P. lunatus and P. vulgaris. a Ks and b Ka/Ks statistics for P. lunatus and G. max paralogs, as well as orthologsbetween P. lunatus and P. vulgaris and orthologs between P. lunatus and V. unguiculata. WGD: Whole Genome Duplication. Sample sizes (N) correspond togene pairs. Middle lines are medians and box limits represent first (Q1) and third (Q3) quartiles. Lines are drawn from Q1 minus 1.5 of the interquartilerange (IQR) to Q3+ 1.5*IQR. c Chromosome by chromosome synteny between P. lunatus and P. vulgaris for detailed visualization of structuralrearrangements. P. lunatus chromosomes are labeled as Pl01-Pl11 and P. vulgaris chromosomes are labeled as Pv01-Pv11. d Number of homologs ofresistance genes by chromosome. e NJ Radial tree diagram showing genetic variability among LRR type resistance genes. Light blue is proteins withdomains NB-ARC and LRR, purple is proteins with domains TIR, NB-ARC, and LRR, orange is proteins with the TIR and LRR domains. Source data areprovided as a Source Data file.
NATURE COMMUNICATIONS | https://doi.org/10.1038/s41467-021-20921-1 ARTICLE
NATURE COMMUNICATIONS | (2021) 12:702 | https://doi.org/10.1038/s41467-021-20921-1 | www.nature.com/naturecommunications 5
27 of which were reported in common bean. Traits included dueto their importance in plant breeding are yield44, nutritionalquality45, herbicide resistance46, plant architecture47, tolerance toabiotic stresses48, among others. Moreover, seed coat color andgrowth habit, important characteristics needed to meet consumerand farmer preferences in Lima bean and common bean breedingand marketing, were also included.
In particular, 1917 genes distributed across the 11 chromo-somes were related to resistance to biotic stresses predicted on thebase of bioinformatics analysis and the presence of the LRR(leucine-rich repeat-containing) and other important domains fordisease resistance such as toll/interleukin-1 receptor (TIR),leucine zipper (LZ), coiled-coil (CC), nucleotide-binding site(NBS/NB) shared by ARC (Apaf-1, R proteins, and CED-4)(NBS/NB-ARC) domain, serine–threonine kinase, and WRKY(Fig. 2d and Supplementary Fig. 8). Serine–threonine and otherreceptor-like protein kinases were one of the most abundant typesamong the selected disease resistance candidate genes (828). TheWRKY domain was present in 91 genes and the leucine zipperdomain in 74. The CC domain was only found in 11 genes.However, a low number of CNL (CC-NBS-LRR) genes has beenpreviously observed and reported in dicots49. In contrast, 98TNLs (TIR-NB-LRR) were identified in the annotated genemodels. Furthermore, 631 genes contained the LRR domain, 151the NB-ARC domain, and 91 both domains (SupplementaryData 2). Large numbers of predicted disease resistance genes werelocalized to chromosomes Pl02, Pl04, Pl08, Pl10, and Pl11.
The subset of genes with the LRR domain tended to beclustered in discrete regions of the genome (SupplementaryFig. 9). This subset includes the following domain arrangements:LRR, NB-ARC-LRR, TIR-NB-ARC-LRR, and TIR-LRR. Neighborjoining clustering of this family showed some correspondencebetween chromosome clustering and sequence similarity (Fig. 2e).Proteins with the domains NB-ARC-LRR formed a large cluster,but five of them were nested into the TNL group that alsocontained the three proteins with the TIR and LRR domains only.Common bean orthologs were identified for most of the predictedgenes related to biotic stress resistance. These orthologs werelocated on the same chromosomes and were mainly collinear.Also, motifs were mostly conserved between the gene sequencesof both species. Furthermore, the genomic positions of the genescorrespond with resistance loci associated by previous studieswith some of the most important diseases affecting the commonbean. For instance, we found clusters of genes within or close toresistance loci for anthracnose50–54, angular leaf spot51,52,55, haloblight52,56, bean golden yellow mosaic virus51; as well as otherviral diseases, rust, and mildew23,52.
Population structure analysis reveals genetic clusters in Limabean. Wild Lima bean presumably originated in the northernAndes, during Pleistocene times, and from there it expanded toother areas in the Andes and Mesoamerica11. As a result, wildLima bean reached a widespread distribution, from northernMexico to northern Argentina, and became differentiated intothree major gene pools (MI, MII, and AI) with mostly non-overlapping distributions, as documented by previous studies.Later, humans domesticated this species twice, once in Mesoa-merica from gene pool MI and once in the Andes from gene poolAI10,15,16. To investigate in greater detail the genetic structure ofLima bean, we combined previously analyzed genotyping-by-sequencing (GBS) data from 270 Lima bean accessions10 withGBS data for 212 additional samples to increase the amount ofvariation (Supplementary Data 3). From a raw number of 116,030biallelic SNVs, 12,398 were selected for diversity analysis (Sup-plementary Data 4).
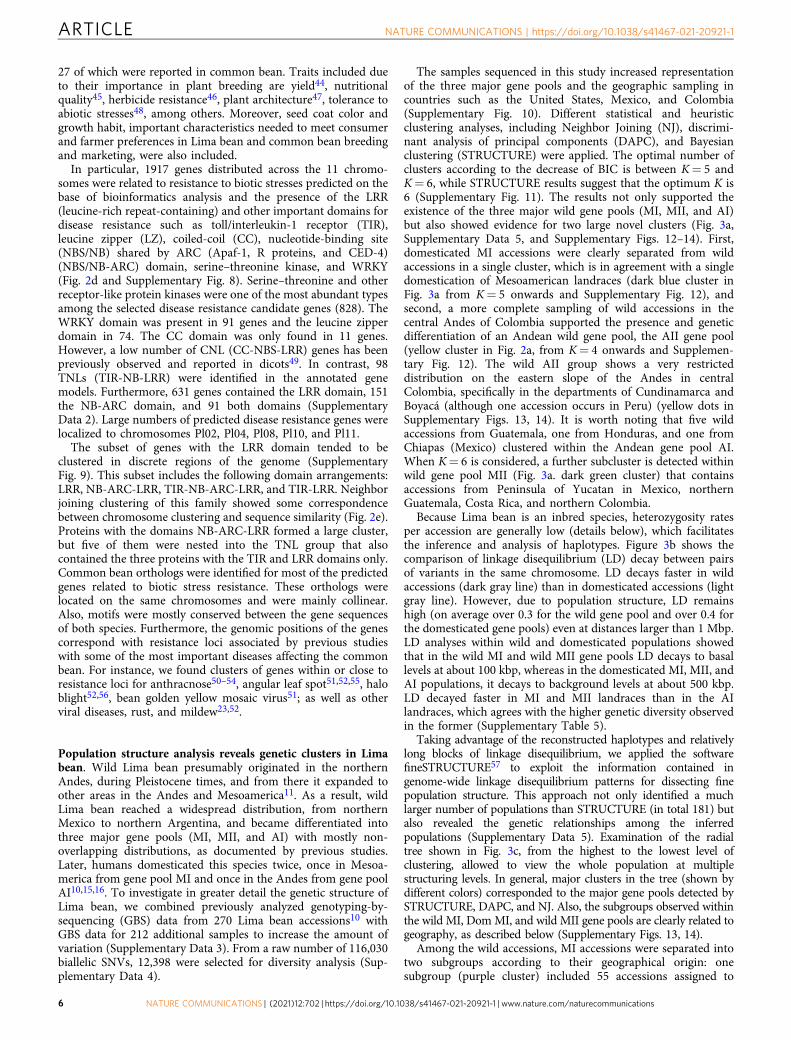
The samples sequenced in this study increased representationof the three major gene pools and the geographic sampling incountries such as the United States, Mexico, and Colombia(Supplementary Fig. 10). Different statistical and heuristicclustering analyses, including Neighbor Joining (NJ), discrimi-nant analysis of principal components (DAPC), and Bayesianclustering (STRUCTURE) were applied. The optimal number ofclusters according to the decrease of BIC is between K= 5 andK= 6, while STRUCTURE results suggest that the optimum K is6 (Supplementary Fig. 11). The results not only supported theexistence of the three major wild gene pools (MI, MII, and AI)but also showed evidence for two large novel clusters (Fig. 3a,Supplementary Data 5, and Supplementary Figs. 12–14). First,domesticated MI accessions were clearly separated from wildaccessions in a single cluster, which is in agreement with a singledomestication of Mesoamerican landraces (dark blue cluster inFig. 3a from K= 5 onwards and Supplementary Fig. 12), andsecond, a more complete sampling of wild accessions in thecentral Andes of Colombia supported the presence and geneticdifferentiation of an Andean wild gene pool, the AII gene pool(yellow cluster in Fig. 2a, from K= 4 onwards and Supplemen-tary Fig. 12). The wild AII group shows a very restricteddistribution on the eastern slope of the Andes in centralColombia, specifically in the departments of Cundinamarca andBoyacá (although one accession occurs in Peru) (yellow dots inSupplementary Figs. 13, 14). It is worth noting that five wildaccessions from Guatemala, one from Honduras, and one fromChiapas (Mexico) clustered within the Andean gene pool AI.When K= 6 is considered, a further subcluster is detected withinwild gene pool MII (Fig. 3a. dark green cluster) that containsaccessions from Peninsula of Yucatan in Mexico, northernGuatemala, Costa Rica, and northern Colombia.
Because Lima bean is an inbred species, heterozygosity ratesper accession are generally low (details below), which facilitatesthe inference and analysis of haplotypes. Figure 3b shows thecomparison of linkage disequilibrium (LD) decay between pairsof variants in the same chromosome. LD decays faster in wildaccessions (dark gray line) than in domesticated accessions (lightgray line). However, due to population structure, LD remainshigh (on average over 0.3 for the wild gene pool and over 0.4 forthe domesticated gene pools) even at distances larger than 1 Mbp.LD analyses within wild and domesticated populations showedthat in the wild MI and wild MII gene pools LD decays to basallevels at about 100 kbp, whereas in the domesticated MI, MII, andAI populations, it decays to background levels at about 500 kbp.LD decayed faster in MI and MII landraces than in the AIlandraces, which agrees with the higher genetic diversity observedin the former (Supplementary Table 5).
Taking advantage of the reconstructed haplotypes and relativelylong blocks of linkage disequilibrium, we applied the softwarefineSTRUCTURE57 to exploit the information contained ingenome-wide linkage disequilibrium patterns for dissecting finepopulation structure. This approach not only identified a muchlarger number of populations than STRUCTURE (in total 181) butalso revealed the genetic relationships among the inferredpopulations (Supplementary Data 5). Examination of the radialtree shown in Fig. 3c, from the highest to the lowest level ofclustering, allowed to view the whole population at multiplestructuring levels. In general, major clusters in the tree (shown bydifferent colors) corresponded to the major gene pools detected bySTRUCTURE, DAPC, and NJ. Also, the subgroups observed withinthe wild MI, DomMI, and wild MII gene pools are clearly related togeography, as described below (Supplementary Figs. 13, 14).
Among the wild accessions, MI accessions were separated intotwo subgroups according to their geographical origin: onesubgroup (purple cluster) included 55 accessions assigned to
ARTICLE NATURE COMMUNICATIONS | https://doi.org/10.1038/s41467-021-20921-1
6 NATURE COMMUNICATIONS | (2021) 12:702 | https://doi.org/10.1038/s41467-021-20921-1 | www.nature.com/naturecommunications
Fig. 3 Lima bean genetic diversity. a STRUCTURE analysis of the genetic variability between 482 wild and domesticated Lima bean accessions collectedacross the Americas. Wild accessions are organized (from left to right) into a south-north geographic pattern. DOM domesticated, MEX Mexico, GUAGuatemala, CR Costa Rica, COL Colombia. Classification of accessions into gene pools MI, MII, AI, or AI is shown. b Linkage disequilibrium decay withindifferent subgroups of wild and domesticated accessions. DOM domesticated, DOM-AND Andean landraces. c Radial clustering of the 482 accessionsaccording to the analysis performed by fineSTRUCTURE. Major gene pools are shown by different colors (purple cluster: wild MI from northern-westernMexico (NORTH MEXICO); pink cluster: wild MI from southern-western Mexico (SOUTH MEXICO); medium blue cluster: domesticated MI from SouthAmerica; dark blue cluster: domesticated MI from Mexico and Central America (MEXICO/CA); light blue cluster: domesticated MI from YucatanPeninsula; yellow cluster: AII gene pool; red cluster: AI gene pool; green cluster: MII gene pool from Yucatan, Central America, and Colombia (YUCATANCOL-CR); light green cluster: MII gene pool from southern and central Mexico. d Distribution of chromosomal segments contributed by different genepools in a set of 15 wild and domesticated accessions. Wild accessions are marked in bold. Lima bean chromosomes are labeled as Pl01-Pl11. Source dataare provided as a Source Data file.
NATURE COMMUNICATIONS | https://doi.org/10.1038/s41467-021-20921-1 ARTICLE
NATURE COMMUNICATIONS | (2021) 12:702 | https://doi.org/10.1038/s41467-021-20921-1 | www.nature.com/naturecommunications 7
ten populations mainly distributed in northern-western Mexico,from the states of Sinaloa to Colima, and the other subgroup(pink cluster) included 34 accessions assigned to 13 populationsmainly distributed in southern-western Mexico, from the state ofMichoacan to Oaxaca. MII accessions were also separated intotwo subclusters: one of them (light green cluster) contained 66accessions mainly distributed in Mexico and southern Guatemala,and the other one (dark green) contained 49 accessions fromnorthern Guatemala, Costa Rica, northern Colombia, and nineaccessions from the Peninsula of Yucatan. Among the domes-ticated accessions, MI landraces were separated into threesubgroups according to their geographical origin: one subgroup(dark blue cluster) included 43 accessions assigned to 13populations mainly distributed in Mexico and Central America,with only 12 accessions from other countries (United States,Colombia, and Ecuador), a second subgroup (medium bluecluster) included 51 accessions assigned to nine populationsmainly distributed in South America, with only 8 accessions fromthe United States and one from Mexico, and the third subgroup(light blue cluster) contained 59 accessions assigned to fivepopulations (numbers 19, 60, 80, 88, and 101. See SupplementaryData 5 and supplementary Fig. 15 for population numbers)distributed in the Yucatan Peninsula in Mexico. This thirdsubgroup was also observed in the STRUCTURE results at K= 7(Fig. 3a). By examining in more detail the landraces contained ineach one of these five populations from the Yucatan Peninsula,there is some tendency to group accessions by variety or seedshape. According to the Mayan nomenclature registered byMartinez-Castillo et al.58, population 88 comprises 14 accessionsthat belong to four landrace varieties known as Bacalar-ib, Chak-saak, Chak-ib, and Bayo-ib, all of them with small and flattenedor semi-flattened seeds (the typical morphotype of the Sievacultigroup). Population 101 includes 24 accessions that belong tolandrace varieties known as Putsica-Sutsuy, Mulicion blanco,Mulicion rojo, Box-ib, Pool-santo, Kan-ib, Morado-ib, Yete Bochib, Kolbihi, and Chak ib, most of them characterized by havingsmall rounded or semi-rounded seeds (the typical morphotype ofthe Potato cultigroup). Population 60 comprises 13 accessionsthat belong to varieties known as Sac-ib, Chak-chi, Bayo-ib,Mejen-ib, Bacalar, and Madza-kitam with seed morphologyintermediate between both cultigroups. Population 80 containsfour landrace accessions that belong to the variety known as Box-ib that carry small purple-black semi-flattened or rounded seeds.Population 19 contains 4 accessions of the landrace varietyknown as Chak-chi with white-red small seeds with seedmorphology also intermediate. The intermediate forms may ariseby the fact that some farmers in the Yucatan Peninsula may growup to seven different landrace varieties together, which maypromote opportunities for crossing58,59.
Supplementary Table 5 shows basic diversity statistics for allmajor gene pools in wild and domesticated accessions. Observedheterozygosity was much lower than expected heterozygosity, asexpected for an inbred species as Lima bean (Bartlett’s K-squared= 18257, df = 1, p value < 2.2e-16; paired-t test t= 165.28, df =12397, p value < 2.2e-16). Among the wild clusters, the mostdiverse were the Mesoamerican MI and MII gene pools (HE=0.128 and HE= 0.133, respectively), while the least diverse werethe Andean AI (HE= 0.040) and AII gene pool (HE= 0.052). Thegenetic diversity of the seven wild accessions from Chiapas,Guatemala, and Honduras, clustered within the AI gene pool, wasalso low (HE= 0.053). Domestication brought a reduction ingenetic diversity in landraces (the domestication founder effect).When measured in the whole sample, this reduction was about25%, but when measured within major gene pools, the reductionwas more drastic for the Mesoamerican domestication (MI genepool, 55%) than for the Andean domestication, where no
reduction was observed. It is worth noting that the geneticdiversity of MI landraces from the Yucatan Peninsula (HE=0.029) is significantly lower than other MI landraces (HE=0.065). This result is in agreement with a late introduction of thecrop in the Yucatan Peninsula from its area of origin in central-western Mexico, as well as a late development (or introduction) ofagriculture in the Maya Lowlands60.
Pairwise FST distances among gene pools showed that the wildgene pool most closely related to the Mesoamerican landraces isMI (FST= 0.33), distributed in central-western Mexico (Supple-mentary Table 6). As for the Andean landraces, the most closelyrelated wild gene pool is AI (FST= 0.21), mostly distributed in theAndes of Ecuador-northern Peru. FST values also showed that thewild cluster, AII is most closely related to the Mesoamerican genepools (FST values ranged from 0.56 to 0.65) than to the Andeangene pool AI (FST= 0.86). Such a close relationship was alsoshown by Caicedo et al.61 on the basis of AFLP polymorphismsand Toro et al.62 on the basis of electrophoretic patterns ofphaseolin. STRUCTURE results also suggest a close relationshipof gene pool AII with gene pool MII (Fig. 3a), however, theanalysis of fineSTRUCTURE shows that gene pool AII is mostclosely related to gene pool AI (Fig. 3c).
As stated above, FST values showed high genetic differentiationamong gene pools, and consistent with this, haplotype introgres-sion analyses clustered most of the accessions within theirrespective gene pools. However, there were 103 instances ofchromosomal segments distributed in 35 accessions (9 wild and26 domesticated) that could represent genetic contributions fromdifferent gene pools (Supplementary Data 6). The 103 chromo-somal segments varied in size from 1 to 53 Mbp. In six accessionsthese chromosomal segments occupy more than 25% of theirgenome length, and concordantly these accessions were classifiedby STRUCTURE as admixed. Figure 3d shows the 58 chromo-somal segments that were larger than 5 Mbp and that wereobserved in 15 accessions. Most of these segments representgenetic contributions between Mesoamerican gene pools (MI andMII) or between Andean gene pools (AI and AII), and morerarely between Mesoamerican and Andean gene pools.
These genetic contributions may be the result of recent contactbetween wild and domesticated accessions, or between domes-ticated accessions of different origin. We found examples whereintroduced domesticated populations may have contributedchromosomal segments to the genetic makeup of wild accessions.For example, five MII wild accessions, distributed in the Mexicanstates of Chiapas and Campeche, in Guatemala, and in northernColombia, all carry chromosomal segments that could have beenpotentially introgressed from introduced MI domesticatedaccessions. In all these geographical places, wild MII and MIdomesticated accessions are distributed. Two AII wild accessionsfrom central Colombia carry chromosomal segments potentiallyderived from domesticated AI accessions. We also observed 18MI domesticated accessions carrying chromosomal segmentspotentially derived from the MII gene pool. These could representcases of introgression from MII wild accessions into MI landracesin places where both kinds of accessions coexist such as theMexican states of Veracruz and Chiapas, Costa Rica, El Salvador,and the Caribbean coast in northern Colombia. Interestingly, wedetected four MI landraces from the United States and one fromColombia with chromosomal segments potentially derived fromAndean AI landraces. At least in Colombia and Ecuador MI andAI landraces coexist. We also found two AI landraces, G25172and G26184 collected in Ica, Peru, where the foreign haplotypesbelong to the MI gene pool suggesting that these accessions mightbe the result of an interbreeding occurrence, maybe due to thepresence of both Andean and Mesoamerican landraces in Ica,Peru. An early introduction of Mesoamerican landraces in coastal
ARTICLE NATURE COMMUNICATIONS | https://doi.org/10.1038/s41467-021-20921-1
8 NATURE COMMUNICATIONS | (2021) 12:702 | https://doi.org/10.1038/s41467-021-20921-1 | www.nature.com/naturecommunications
Peru has been suggested by the occurrence of pod remains(typical of small-seeded landraces) in association with theceramics of the Guanape Period (from 1200 B.C. to 400 B.C.)and Cupisnique Period (from 1500 B.C. to 500 B.C.) in HuacaPrieta, Peru63, although more recent introductions cannot beexcluded. Finally, an interesting pattern that we observed was thata single 2.6 Mbp MII segment located in chromosome Pl07 wasshared by six MI landraces from different departments inColombia, and that a second 2.2 Mbp MII segment located inchromosome Pl08 was shared by seven different MI landracescultivated in different places of Central America and Colombia(Supplementary Data 6).
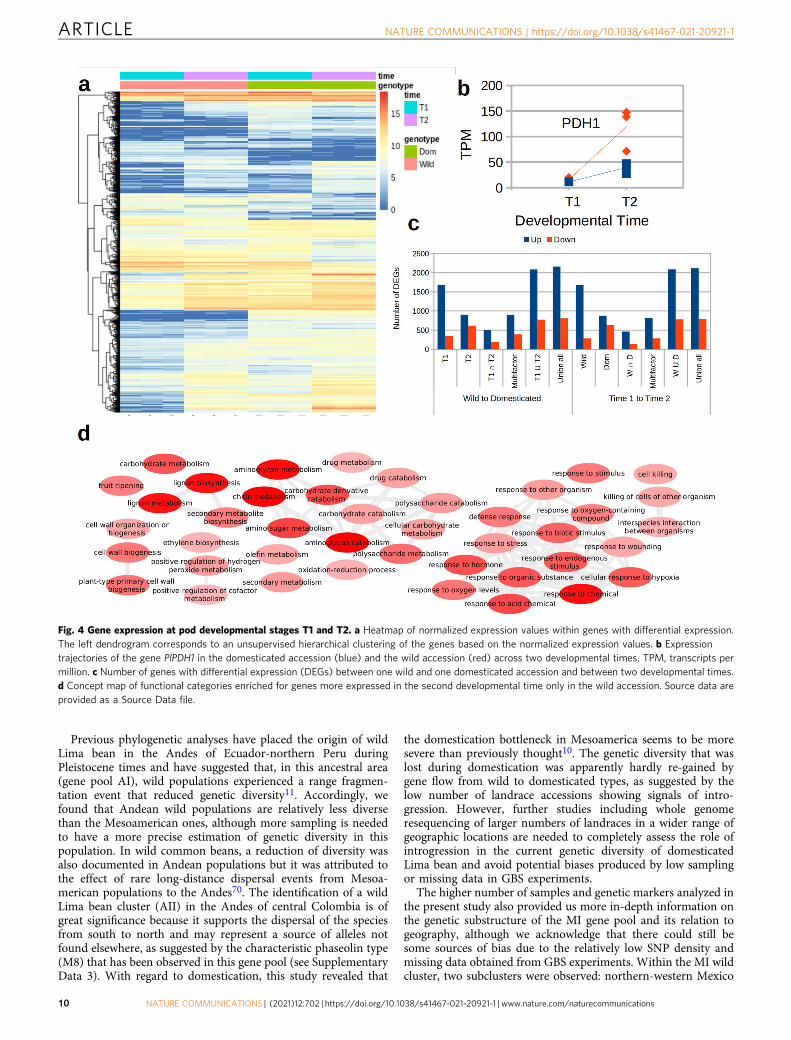
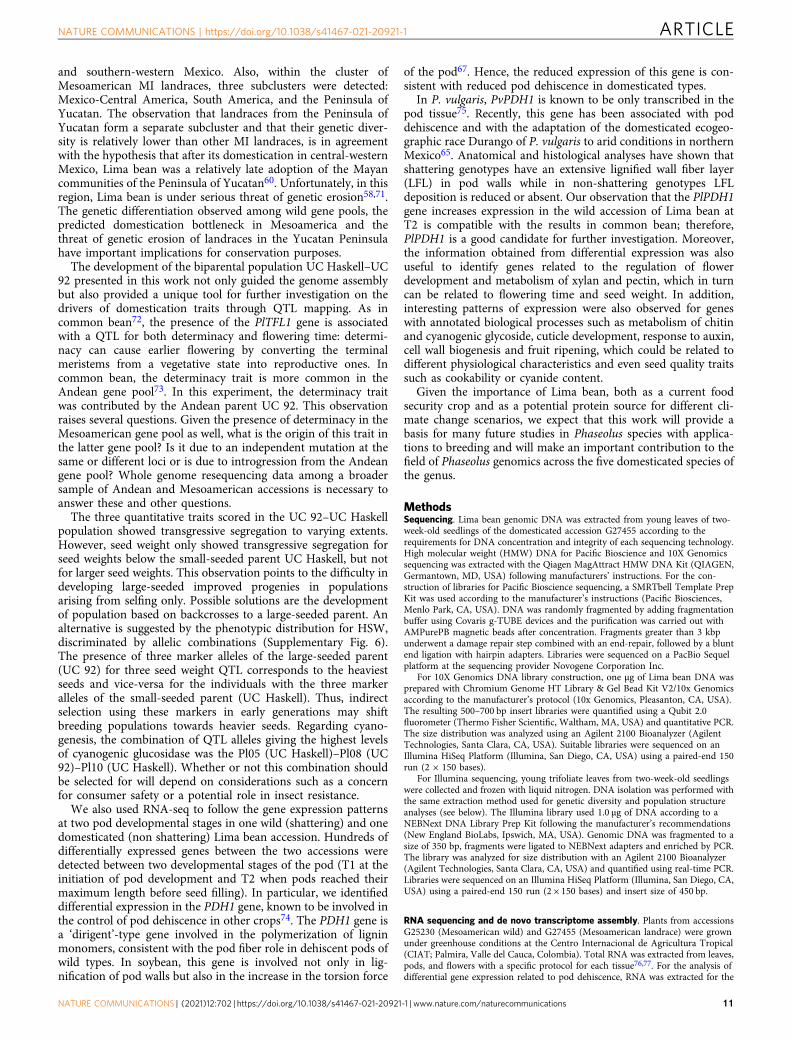
Gene expression during pod development. Reduction or loss ofpod dehiscence is one of the key domestication traits in Limabean, and also a trait of agronomic importance64,65. To obtaininformation on the genetic regulation of the pod development, wecarried out an RNA-seq experiment measuring expression levelsat the initiation of pod elongation (T1) and before seed filling(T2) in one wild and one domesticated accession. At the devel-opmental stage T1, pod valves become visible with the flowercorolla still attached (or recently detached). At the developmentalstage T2 pods reach their maximum length and weight (excludingthe seeds) before the initiation of seed filling. Principal compo-nent analysis of expression values inferred from RNA-seq reads,including publicly available reads from a previous study66 con-sistently clustered replicates of each library with only one outlierwhich was removed for downstream analysis (SupplementaryFig. 16). Differential expression (DE) analyses revealed a total of4275 genes with patterns of differential expression either acrossdevelopmental stages or between the wild and the domesticatedaccession (Supplementary Data 7). Figure 4a shows a generalheatmap of normalized expression values for these genes. Hier-archical clustering based on these values distinguished betweenfive and seven gene clusters following different expressionpatterns.
Looking at genes previously identified as related to poddehiscence, the PDH1 gene significantly increased expressionbetween T1 and T2 (Fig. 4b). The expression at the second stagewas over 2-fold higher in the wild accession compared to thedomesticated accession but the difference between accessions wasnot significant due to a relatively low expression value of one ofthe replicates. The PDH1 gene is involved in the formation offibrous, strongly lignified cell layers between the inner and outerparenchyma of the pod, thus increasing the torsion force of podsin shattering genotypes67. Furthermore, it has been recentlyidentified as a strong pod dehiscence QTL on chromosome Pv03in common bean65.
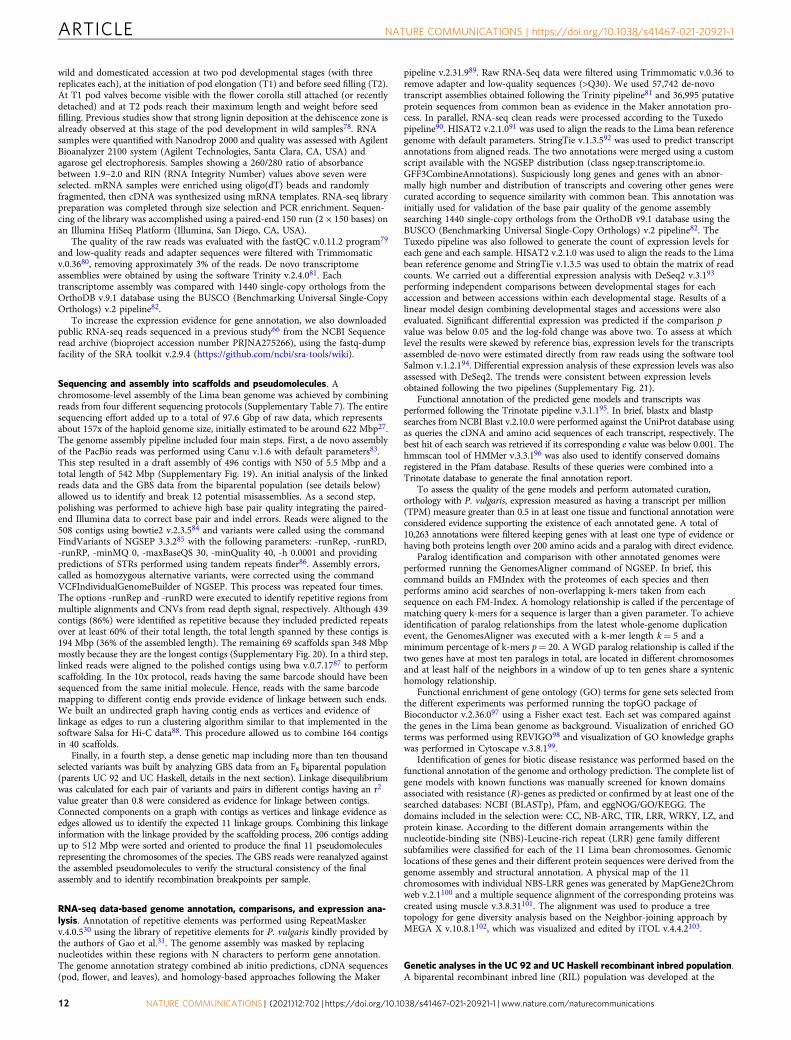
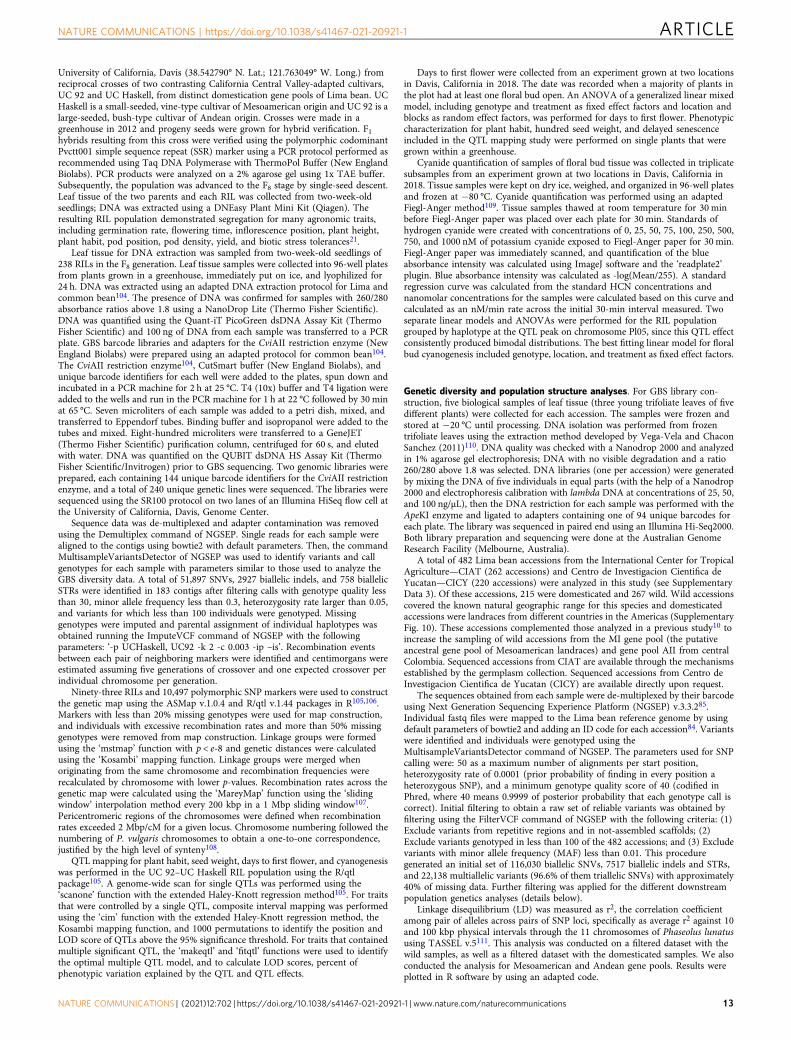
The ratio of gene expression between developmental stages oraccessions showed that in general the domesticated accession hadincreased expression values for a larger number of genes than thewild accession (especially at T1) and that the number of geneswith increased expression is larger than the number of genes withdecreased expression between T1 and T2, especially in the wildaccession (Fig. 4c). These patterns are collectively explained byabout 1500 genes increasing expression between T1 and T2 in thewild accession. Genes with consistently increased expressionbetween T1 and T2 in both the wild and the domesticatedaccession are enriched for terms that include cell wall biogenesisand organization, which is related to the biosynthesis ofpolysaccharides, particularly xylan and lignin, important compo-nents of the seed (Supplementary Fig. 17). Conversely, genes thatonly increase expression between T1 and T2 in the wild accessionare enriched for metabolism-related genes of lignan, chitin, andaminoglycan and the fruit ripening process (Fig. 4d). Enrichment
of chitin metabolism-related genes was mainly generated by acluster of seven genes located at 38 Mbp of chromosome Pl09.Lignan metabolism-related genes were also enriched in thissubset, mainly due to an array of nine genes with increasedexpression located at 9 Mbp of Pl11. Genes that remained moreexpressed in the domesticated accession only at T2 showenrichment of functions related to the development of thereproductive system, and particularly with the development of thefruit (Supplementary Fig. 18). Finally, genes with consistentlyreduced expression between T1 and T2 were enriched fordevelopmental processes such as cuticle development andmetabolism of different compounds, including cyanogenic glyco-side. These findings are expected because the plant completed theformation of the pod and is about to start filling the seed.
DiscussionIn this work, we conducted a large collaborative effort to providea comprehensive set of genetic and genomic information for Limabean. This effort resulted in information on the content, orga-nization, and function of chromosomes and sequences, evolu-tionary relationships with close relatives at different taxonomiclevels, population genomics of wild and cultivated accessions, andinheritance of agronomic traits. The analysis of this informationrevealed, at a greater detail, the genetic structure of wild anddomesticated Lima beans across their large distribution range inthe Americas, and provided insights on the genetic basis ofvariability in different agronomically relevant traits. Knowing thegenes controlling these traits represents a great advantage forbreeding programs and could potentially accelerate the develop-ment and release of improved Lima bean varieties in the future.
The backbone of these achievements is the chromosome-levelgenome assembly for P. lunatus and a comprehensive genotyping ofthe available genetic variability within the species. The effort tobuild a high-quality reference genome sequence, both in terms ofcontiguity and base-pair quality, was rewarded by the assembly andfunctional prediction of large clusters of genes related to differenttraits. Although these predictions must be experimentally validated,the information provided is useful to prioritize genes to performexperimental validation as a community effort. Genes that conferresistance to biotic stresses on plants show large nucleotide diversitybut good correspondence with common bean resistance genesbased on orthology predictions and literature. As observed in pre-vious studies in species with high-quality genomes such as rice, thevariability of disease resistance genes is a key component of thedefense mechanisms in plants68 and can contribute to functionalredundancy favoring durability of resistance in the field69. More-over, local gene duplication was also observed in genes performingfunctions such as metabolism of xyloglucan and chitin and reg-ulation of flower development, which are directly related to yieldtraits such as seed weight and flowering time.
The evolutionary history of plant genomes is shaped by severalWGD and local duplication events, characterized by a wide rangeof evolutionary rates within and between gene families withimportant consequences in gene expression and function38. A fullunderstanding of these processes is only possible through thedevelopment of high-quality genome sequences29. In the case ofPhaseolus species, a synteny analysis of our assembly with that ofP. vulgaris not only confirms the high degree of chromosomeconservation between these genomes but also provides a detailedview of five major rearrangements between these genomes. Thus,this work makes a significant contribution to ongoing genomeassembly and resequencing efforts to allow a full reconstructionof the evolution of genomes within the legume family, includingthe complete characterization of potential convergent evolutionprocesses triggered by multiple domestication events.
NATURE COMMUNICATIONS | https://doi.org/10.1038/s41467-021-20921-1 ARTICLE
NATURE COMMUNICATIONS | (2021) 12:702 | https://doi.org/10.1038/s41467-021-20921-1 | www.nature.com/naturecommunications 9
Previous phylogenetic analyses have placed the origin of wildLima bean in the Andes of Ecuador-northern Peru duringPleistocene times and have suggested that, in this ancestral area(gene pool AI), wild populations experienced a range fragmen-tation event that reduced genetic diversity11. Accordingly, wefound that Andean wild populations are relatively less diversethan the Mesoamerican ones, although more sampling is neededto have a more precise estimation of genetic diversity in thispopulation. In wild common beans, a reduction of diversity wasalso documented in Andean populations but it was attributed tothe effect of rare long-distance dispersal events from Mesoa-merican populations to the Andes70. The identification of a wildLima bean cluster (AII) in the Andes of central Colombia is ofgreat significance because it supports the dispersal of the speciesfrom south to north and may represent a source of alleles notfound elsewhere, as suggested by the characteristic phaseolin type(M8) that has been observed in this gene pool (see SupplementaryData 3). With regard to domestication, this study revealed that
the domestication bottleneck in Mesoamerica seems to be moresevere than previously thought10. The genetic diversity that waslost during domestication was apparently hardly re-gained bygene flow from wild to domesticated types, as suggested by thelow number of landrace accessions showing signals of intro-gression. However, further studies including whole genomeresequencing of larger numbers of landraces in a wider range ofgeographic locations are needed to completely assess the role ofintrogression in the current genetic diversity of domesticatedLima bean and avoid potential biases produced by low samplingor missing data in GBS experiments.
The higher number of samples and genetic markers analyzed inthe present study also provided us more in-depth information onthe genetic substructure of the MI gene pool and its relation togeography, although we acknowledge that there could still besome sources of bias due to the relatively low SNP density andmissing data obtained from GBS experiments. Within the MI wildcluster, two subclusters were observed: northern-western Mexico
Fig. 4 Gene expression at pod developmental stages T1 and T2. a Heatmap of normalized expression values within genes with differential expression.The left dendrogram corresponds to an unsupervised hierarchical clustering of the genes based on the normalized expression values. b Expressiontrajectories of the gene PlPDH1 in the domesticated accession (blue) and the wild accession (red) across two developmental times. TPM, transcripts permillion. c Number of genes with differential expression (DEGs) between one wild and one domesticated accession and between two developmental times.d Concept map of functional categories enriched for genes more expressed in the second developmental time only in the wild accession. Source data areprovided as a Source Data file.
ARTICLE NATURE COMMUNICATIONS | https://doi.org/10.1038/s41467-021-20921-1
10 NATURE COMMUNICATIONS | (2021) 12:702 | https://doi.org/10.1038/s41467-021-20921-1 | www.nature.com/naturecommunications
and southern-western Mexico. Also, within the cluster ofMesoamerican MI landraces, three subclusters were detected:Mexico-Central America, South America, and the Peninsula ofYucatan. The observation that landraces from the Peninsula ofYucatan form a separate subcluster and that their genetic diver-sity is relatively lower than other MI landraces, is in agreementwith the hypothesis that after its domestication in central-westernMexico, Lima bean was a relatively late adoption of the Mayancommunities of the Peninsula of Yucatan60. Unfortunately, in thisregion, Lima bean is under serious threat of genetic erosion58,71.The genetic differentiation observed among wild gene pools, thepredicted domestication bottleneck in Mesoamerica and thethreat of genetic erosion of landraces in the Yucatan Peninsulahave important implications for conservation purposes.
The development of the biparental population UC Haskell–UC92 presented in this work not only guided the genome assemblybut also provided a unique tool for further investigation on thedrivers of domestication traits through QTL mapping. As incommon bean72, the presence of the PlTFL1 gene is associatedwith a QTL for both determinacy and flowering time: determi-nacy can cause earlier flowering by converting the terminalmeristems from a vegetative state into reproductive ones. Incommon bean, the determinacy trait is more common in theAndean gene pool73. In this experiment, the determinacy traitwas contributed by the Andean parent UC 92. This observationraises several questions. Given the presence of determinacy in theMesoamerican gene pool as well, what is the origin of this trait inthe latter gene pool? Is it due to an independent mutation at thesame or different loci or is due to introgression from the Andeangene pool? Whole genome resequencing data among a broadersample of Andean and Mesoamerican accessions is necessary toanswer these and other questions.
The three quantitative traits scored in the UC 92–UC Haskellpopulation showed transgressive segregation to varying extents.However, seed weight only showed transgressive segregation forseed weights below the small-seeded parent UC Haskell, but notfor larger seed weights. This observation points to the difficulty indeveloping large-seeded improved progenies in populationsarising from selfing only. Possible solutions are the developmentof population based on backcrosses to a large-seeded parent. Analternative is suggested by the phenotypic distribution for HSW,discriminated by allelic combinations (Supplementary Fig. 6).The presence of three marker alleles of the large-seeded parent(UC 92) for three seed weight QTL corresponds to the heaviestseeds and vice-versa for the individuals with the three markeralleles of the small-seeded parent (UC Haskell). Thus, indirectselection using these markers in early generations may shiftbreeding populations towards heavier seeds. Regarding cyano-genesis, the combination of QTL alleles giving the highest levelsof cyanogenic glucosidase was the Pl05 (UC Haskell)–Pl08 (UC92)–Pl10 (UC Haskell). Whether or not this combination shouldbe selected for will depend on considerations such as a concernfor consumer safety or a potential role in insect resistance.
We also used RNA-seq to follow the gene expression patternsat two pod developmental stages in one wild (shattering) and onedomesticated (non shattering) Lima bean accession. Hundreds ofdifferentially expressed genes between the two accessions weredetected between two developmental stages of the pod (T1 at theinitiation of pod development and T2 when pods reached theirmaximum length before seed filling). In particular, we identifieddifferential expression in the PDH1 gene, known to be involved inthe control of pod dehiscence in other crops74. The PDH1 gene isa ‘dirigent’-type gene involved in the polymerization of ligninmonomers, consistent with the pod fiber role in dehiscent pods ofwild types. In soybean, this gene is involved not only in lig-nification of pod walls but also in the increase in the torsion force
of the pod67. Hence, the reduced expression of this gene is con-sistent with reduced pod dehiscence in domesticated types.
In P. vulgaris, PvPDH1 is known to be only transcribed in thepod tissue75. Recently, this gene has been associated with poddehiscence and with the adaptation of the domesticated ecogeo-graphic race Durango of P. vulgaris to arid conditions in northernMexico65. Anatomical and histological analyses have shown thatshattering genotypes have an extensive lignified wall fiber layer(LFL) in pod walls while in non-shattering genotypes LFLdeposition is reduced or absent. Our observation that the PlPDH1gene increases expression in the wild accession of Lima bean atT2 is compatible with the results in common bean; therefore,PlPDH1 is a good candidate for further investigation. Moreover,the information obtained from differential expression was alsouseful to identify genes related to the regulation of flowerdevelopment and metabolism of xylan and pectin, which in turncan be related to flowering time and seed weight. In addition,interesting patterns of expression were also observed for geneswith annotated biological processes such as metabolism of chitinand cyanogenic glycoside, cuticle development, response to auxin,cell wall biogenesis and fruit ripening, which could be related todifferent physiological characteristics and even seed quality traitssuch as cookability or cyanide content.
Given the importance of Lima bean, both as a current foodsecurity crop and as a potential protein source for different cli-mate change scenarios, we expect that this work will provide abasis for many future studies in Phaseolus species with applica-tions to breeding and will make an important contribution to thefield of Phaseolus genomics across the five domesticated species ofthe genus.
MethodsSequencing. Lima bean genomic DNA was extracted from young leaves of two-week-old seedlings of the domesticated accession G27455 according to therequirements for DNA concentration and integrity of each sequencing technology.High molecular weight (HMW) DNA for Pacific Bioscience and 10X Genomicssequencing was extracted with the Qiagen MagAttract HMW DNA Kit (QIAGEN,Germantown, MD, USA) following manufacturers’ instructions. For the con-struction of libraries for Pacific Bioscience sequencing, a SMRTbell Template PrepKit was used according to the manufacturer’s instructions (Pacific Biosciences,Menlo Park, CA, USA). DNA was randomly fragmented by adding fragmentationbuffer using Covaris g-TUBE devices and the purification was carried out withAMPurePB magnetic beads after concentration. Fragments greater than 3 kbpunderwent a damage repair step combined with an end-repair, followed by a bluntend ligation with hairpin adapters. Libraries were sequenced on a PacBio Sequelplatform at the sequencing provider Novogene Corporation Inc.
For 10X Genomics DNA library construction, one μg of Lima bean DNA wasprepared with Chromium Genome HT Library & Gel Bead Kit V2/10x Genomicsaccording to the manufacturer’s protocol (10x Genomics, Pleasanton, CA, USA).The resulting 500–700 bp insert libraries were quantified using a Qubit 2.0fluorometer (Thermo Fisher Scientific, Waltham, MA, USA) and quantitative PCR.The size distribution was analyzed using an Agilent 2100 Bioanalyzer (AgilentTechnologies, Santa Clara, CA, USA). Suitable libraries were sequenced on anIllumina HiSeq Platform (Illumina, San Diego, CA, USA) using a paired-end 150run (2 × 150 bases).
For Illumina sequencing, young trifoliate leaves from two-week-old seedlingswere collected and frozen with liquid nitrogen. DNA isolation was performed withthe same extraction method used for genetic diversity and population structureanalyses (see below). The Illumina library used 1.0 μg of DNA according to aNEBNext DNA Library Prep Kit following the manufacturer’s recommendations(New England BioLabs, Ipswich, MA, USA). Genomic DNA was fragmented to asize of 350 bp, fragments were ligated to NEBNext adapters and enriched by PCR.The library was analyzed for size distribution with an Agilent 2100 Bioanalyzer(Agilent Technologies, Santa Clara, CA, USA) and quantified using real-time PCR.Libraries were sequenced on an Illumina HiSeq Platform (Illumina, San Diego, CA,USA) using a paired-end 150 run (2 × 150 bases) and insert size of 450 bp.
RNA sequencing and de novo transcriptome assembly. Plants from accessionsG25230 (Mesoamerican wild) and G27455 (Mesoamerican landrace) were grownunder greenhouse conditions at the Centro Internacional de Agricultura Tropical(CIAT; Palmira, Valle del Cauca, Colombia). Total RNA was extracted from leaves,pods, and flowers with a specific protocol for each tissue76,77. For the analysis ofdifferential gene expression related to pod dehiscence, RNA was extracted for the
NATURE COMMUNICATIONS | https://doi.org/10.1038/s41467-021-20921-1 ARTICLE
NATURE COMMUNICATIONS | (2021) 12:702 | https://doi.org/10.1038/s41467-021-20921-1 | www.nature.com/naturecommunications 11
wild and domesticated accession at two pod developmental stages (with threereplicates each), at the initiation of pod elongation (T1) and before seed filling (T2).At T1 pod valves become visible with the flower corolla still attached (or recentlydetached) and at T2 pods reach their maximum length and weight before seedfilling. Previous studies show that strong lignin deposition at the dehiscence zone isalready observed at this stage of the pod development in wild samples78. RNAsamples were quantified with Nanodrop 2000 and quality was assessed with AgilentBioanalyzer 2100 system (Agilent Technologies, Santa Clara, CA, USA) andagarose gel electrophoresis. Samples showing a 260/280 ratio of absorbancebetween 1.9–2.0 and RIN (RNA Integrity Number) values above seven wereselected. mRNA samples were enriched using oligo(dT) beads and randomlyfragmented, then cDNA was synthesized using mRNA templates. RNA-seq librarypreparation was completed through size selection and PCR enrichment. Sequen-cing of the library was accomplished using a paired-end 150 run (2 × 150 bases) onan Illumina HiSeq Platform (Illumina, San Diego, CA, USA).
The quality of the raw reads was evaluated with the fastQC v.0.11.2 program79
and low-quality reads and adapter sequences were filtered with Trimmomaticv.0.3680, removing approximately 3% of the reads. De novo transcriptomeassemblies were obtained by using the software Trinity v.2.4.081. Eachtranscriptome assembly was compared with 1440 single-copy orthologs from theOrthoDB v.9.1 database using the BUSCO (Benchmarking Universal Single-CopyOrthologs) v.2 pipeline82.
To increase the expression evidence for gene annotation, we also downloadedpublic RNA-seq reads sequenced in a previous study66 from the NCBI Sequenceread archive (bioproject accession number PRJNA275266), using the fastq-dumpfacility of the SRA toolkit v.2.9.4 (https://github.com/ncbi/sra-tools/wiki).
Sequencing and assembly into scaffolds and pseudomolecules. Achromosome-level assembly of the Lima bean genome was achieved by combiningreads from four different sequencing protocols (Supplementary Table 7). The entiresequencing effort added up to a total of 97.6 Gbp of raw data, which representsabout 157x of the haploid genome size, initially estimated to be around 622 Mbp27.The genome assembly pipeline included four main steps. First, a de novo assemblyof the PacBio reads was performed using Canu v.1.6 with default parameters83.This step resulted in a draft assembly of 496 contigs with N50 of 5.5 Mbp and atotal length of 542 Mbp (Supplementary Fig. 19). An initial analysis of the linkedreads data and the GBS data from the biparental population (see details below)allowed us to identify and break 12 potential misassemblies. As a second step,polishing was performed to achieve high base pair quality integrating the paired-end Illumina data to correct base pair and indel errors. Reads were aligned to the508 contigs using bowtie2 v.2.3.584 and variants were called using the commandFindVariants of NGSEP 3.3.285 with the following parameters: -runRep, -runRD,-runRP, -minMQ 0, -maxBaseQS 30, -minQuality 40, -h 0.0001 and providingpredictions of STRs performed using tandem repeats finder86. Assembly errors,called as homozygous alternative variants, were corrected using the commandVCFIndividualGenomeBuilder of NGSEP. This process was repeated four times.The options -runRep and -runRD were executed to identify repetitive regions frommultiple alignments and CNVs from read depth signal, respectively. Although 439contigs (86%) were identified as repetitive because they included predicted repeatsover at least 60% of their total length, the total length spanned by these contigs is194 Mbp (36% of the assembled length). The remaining 69 scaffolds span 348 Mbpmostly because they are the longest contigs (Supplementary Fig. 20). In a third step,linked reads were aligned to the polished contigs using bwa v.0.7.1787 to performscaffolding. In the 10x protocol, reads having the same barcode should have beensequenced from the same initial molecule. Hence, reads with the same barcodemapping to different contig ends provide evidence of linkage between such ends.We built an undirected graph having contig ends as vertices and evidence oflinkage as edges to run a clustering algorithm similar to that implemented in thesoftware Salsa for Hi-C data88. This procedure allowed us to combine 164 contigsin 40 scaffolds.
Finally, in a fourth step, a dense genetic map including more than ten thousandselected variants was built by analyzing GBS data from an F8 biparental population(parents UC 92 and UC Haskell, details in the next section). Linkage disequilibriumwas calculated for each pair of variants and pairs in different contigs having an r2
value greater than 0.8 were considered as evidence for linkage between contigs.Connected components on a graph with contigs as vertices and linkage evidence asedges allowed us to identify the expected 11 linkage groups. Combining this linkageinformation with the linkage provided by the scaffolding process, 206 contigs addingup to 512 Mbp were sorted and oriented to produce the final 11 pseudomoleculesrepresenting the chromosomes of the species. The GBS reads were reanalyzed againstthe assembled pseudomolecules to verify the structural consistency of the finalassembly and to identify recombination breakpoints per sample.
RNA-seq data-based genome annotation, comparisons, and expression ana-lysis. Annotation of repetitive elements was performed using RepeatMaskerv.4.0.530 using the library of repetitive elements for P. vulgaris kindly provided bythe authors of Gao et al.31. The genome assembly was masked by replacingnucleotides within these regions with N characters to perform gene annotation.The genome annotation strategy combined ab initio predictions, cDNA sequences(pod, flower, and leaves), and homology-based approaches following the Maker
pipeline v.2.31.989. Raw RNA-Seq data were filtered using Trimmomatic v.0.36 toremove adapter and low-quality sequences (>Q30). We used 57,742 de-novotranscript assemblies obtained following the Trinity pipeline81 and 36,995 putativeprotein sequences from common bean as evidence in the Maker annotation pro-cess. In parallel, RNA-seq clean reads were processed according to the Tuxedopipeline90. HISAT2 v.2.1.091 was used to align the reads to the Lima bean referencegenome with default parameters. StringTie v.1.3.592 was used to predict transcriptannotations from aligned reads. The two annotations were merged using a customscript available with the NGSEP distribution (class ngsep.transcriptome.io.GFF3CombineAnnotations). Suspiciously long genes and genes with an abnor-mally high number and distribution of transcripts and covering other genes werecurated according to sequence similarity with common bean. This annotation wasinitially used for validation of the base pair quality of the genome assemblysearching 1440 single-copy orthologs from the OrthoDB v9.1 database using theBUSCO (Benchmarking Universal Single-Copy Orthologs) v.2 pipeline82. TheTuxedo pipeline was also followed to generate the count of expression levels foreach gene and each sample. HISAT2 v.2.1.0 was used to align the reads to the Limabean reference genome and StringTie v.1.3.5 was used to obtain the matrix of readcounts. We carried out a differential expression analysis with DeSeq2 v.3.193
performing independent comparisons between developmental stages for eachaccession and between accessions within each developmental stage. Results of alinear model design combining developmental stages and accessions were alsoevaluated. Significant differential expression was predicted if the comparison pvalue was below 0.05 and the log-fold change was above two. To assess at whichlevel the results were skewed by reference bias, expression levels for the transcriptsassembled de-novo were estimated directly from raw reads using the software toolSalmon v.1.2.194. Differential expression analysis of these expression levels was alsoassessed with DeSeq2. The trends were consistent between expression levelsobtained following the two pipelines (Supplementary Fig. 21).
Functional annotation of the predicted gene models and transcripts wasperformed following the Trinotate pipeline v.3.1.195. In brief, blastx and blastpsearches from NCBI Blast v.2.10.0 were performed against the UniProt database usingas queries the cDNA and amino acid sequences of each transcript, respectively. Thebest hit of each search was retrieved if its corresponding e value was below 0.001. Thehmmscan tool of HMMer v.3.3.196 was also used to identify conserved domainsregistered in the Pfam database. Results of these queries were combined into aTrinotate database to generate the final annotation report.
To assess the quality of the gene models and perform automated curation,orthology with P. vulgaris, expression measured as having a transcript per million(TPM) measure greater than 0.5 in at least one tissue and functional annotation wereconsidered evidence supporting the existence of each annotated gene. A total of10,263 annotations were filtered keeping genes with at least one type of evidence orhaving both proteins length over 200 amino acids and a paralog with direct evidence.
Paralog identification and comparison with other annotated genomes wereperformed running the GenomesAligner command of NGSEP. In brief, thiscommand builds an FMIndex with the proteomes of each species and thenperforms amino acid searches of non-overlapping k-mers taken from eachsequence on each FM-Index. A homology relationship is called if the percentage ofmatching query k-mers for a sequence is larger than a given parameter. To achieveidentification of paralog relationships from the latest whole-genome duplicationevent, the GenomesAligner was executed with a k-mer length k= 5 and aminimum percentage of k-mers p= 20. A WGD paralog relationship is called if thetwo genes have at most ten paralogs in total, are located in different chromosomesand at least half of the neighbors in a window of up to ten genes share a syntenichomology relationship.
Functional enrichment of gene ontology (GO) terms for gene sets selected fromthe different experiments was performed running the topGO package ofBioconductor v.2.36.097 using a Fisher exact test. Each set was compared againstthe genes in the Lima bean genome as background. Visualization of enriched GOterms was performed using REVIGO98 and visualization of GO knowledge graphswas performed in Cytoscape v.3.8.199.
Identification of genes for biotic disease resistance was performed based on thefunctional annotation of the genome and orthology prediction. The complete list ofgene models with known functions was manually screened for known domainsassociated with resistance (R)-genes as predicted or confirmed by at least one of thesearched databases: NCBI (BLASTp), Pfam, and eggNOG/GO/KEGG. Thedomains included in the selection were: CC, NB-ARC, TIR, LRR, WRKY, LZ, andprotein kinase. According to the different domain arrangements within thenucleotide-binding site (NBS)-Leucine-rich repeat (LRR) gene family differentsubfamilies were classified for each of the 11 Lima bean chromosomes. Genomiclocations of these genes and their different protein sequences were derived from thegenome assembly and structural annotation. A physical map of the 11chromosomes with individual NBS-LRR genes was generated by MapGene2Chromweb v.2.1100 and a multiple sequence alignment of the corresponding proteins wascreated using muscle v.3.8.31101. The alignment was used to produce a treetopology for gene diversity analysis based on the Neighbor-joining approach byMEGA X v.10.8.1102, which was visualized and edited by iTOL v.4.4.2103.
Genetic analyses in the UC 92 and UC Haskell recombinant inbred population.A biparental recombinant inbred line (RIL) population was developed at the
ARTICLE NATURE COMMUNICATIONS | https://doi.org/10.1038/s41467-021-20921-1
12 NATURE COMMUNICATIONS | (2021) 12:702 | https://doi.org/10.1038/s41467-021-20921-1 | www.nature.com/naturecommunications
University of California, Davis (38.542790° N. Lat.; 121.763049° W. Long.) fromreciprocal crosses of two contrasting California Central Valley-adapted cultivars,UC 92 and UC Haskell, from distinct domestication gene pools of Lima bean. UCHaskell is a small-seeded, vine-type cultivar of Mesoamerican origin and UC 92 is alarge-seeded, bush-type cultivar of Andean origin. Crosses were made in agreenhouse in 2012 and progeny seeds were grown for hybrid verification. F1hybrids resulting from this cross were verified using the polymorphic codominantPvctt001 simple sequence repeat (SSR) marker using a PCR protocol performed asrecommended using Taq DNA Polymerase with ThermoPol Buffer (New EnglandBiolabs). PCR products were analyzed on a 2% agarose gel using 1x TAE buffer.Subsequently, the population was advanced to the F8 stage by single-seed descent.Leaf tissue of the two parents and each RIL was collected from two-week-oldseedlings; DNA was extracted using a DNEasy Plant Mini Kit (Qiagen). Theresulting RIL population demonstrated segregation for many agronomic traits,including germination rate, flowering time, inflorescence position, plant height,plant habit, pod position, pod density, yield, and biotic stress tolerances21.
Leaf tissue for DNA extraction was sampled from two-week-old seedlings of238 RILs in the F8 generation. Leaf tissue samples were collected into 96-well platesfrom plants grown in a greenhouse, immediately put on ice, and lyophilized for24 h. DNA was extracted using an adapted DNA extraction protocol for Lima andcommon bean104. The presence of DNA was confirmed for samples with 260/280absorbance ratios above 1.8 using a NanoDrop Lite (Thermo Fisher Scientific).DNA was quantified using the Quant-iT PicoGreen dsDNA Assay Kit (ThermoFisher Scientific) and 100 ng of DNA from each sample was transferred to a PCRplate. GBS barcode libraries and adapters for the CviAII restriction enzyme (NewEngland Biolabs) were prepared using an adapted protocol for common bean104.The CviAII restriction enzyme104, CutSmart buffer (New England Biolabs), andunique barcode identifiers for each well were added to the plates, spun down andincubated in a PCR machine for 2 h at 25 °C. T4 (10x) buffer and T4 ligation wereadded to the wells and run in the PCR machine for 1 h at 22 °C followed by 30 minat 65 °C. Seven microliters of each sample was added to a petri dish, mixed, andtransferred to Eppendorf tubes. Binding buffer and isopropanol were added to thetubes and mixed. Eight-hundred microliters were transferred to a GeneJET(Thermo Fisher Scientific) purification column, centrifuged for 60 s, and elutedwith water. DNA was quantified on the QUBIT dsDNA HS Assay Kit (ThermoFisher Scientific/Invitrogen) prior to GBS sequencing. Two genomic libraries wereprepared, each containing 144 unique barcode identifiers for the CviAII restrictionenzyme, and a total of 240 unique genetic lines were sequenced. The libraries weresequenced using the SR100 protocol on two lanes of an Illumina HiSeq flow cell atthe University of California, Davis, Genome Center.
Sequence data was de-multiplexed and adapter contamination was removedusing the Demultiplex command of NGSEP. Single reads for each sample werealigned to the contigs using bowtie2 with default parameters. Then, the commandMultisampleVariantsDetector of NGSEP was used to identify variants and callgenotypes for each sample with parameters similar to those used to analyze theGBS diversity data. A total of 51,897 SNVs, 2927 biallelic indels, and 758 biallelicSTRs were identified in 183 contigs after filtering calls with genotype quality lessthan 30, minor allele frequency less than 0.3, heterozygosity rate larger than 0.05,and variants for which less than 100 individuals were genotyped. Missinggenotypes were imputed and parental assignment of individual haplotypes wasobtained running the ImputeVCF command of NGSEP with the followingparameters: ‘-p UCHaskell, UC92 -k 2 -c 0.003 -ip –is’. Recombination eventsbetween each pair of neighboring markers were identified and centimorgans wereestimated assuming five generations of crossover and one expected crossover perindividual chromosome per generation.
Ninety-three RILs and 10,497 polymorphic SNP markers were used to constructthe genetic map using the ASMap v.1.0.4 and R/qtl v.1.44 packages in R105,106.Markers with less than 20% missing genotypes were used for map construction,and individuals with excessive recombination rates and more than 50% missinggenotypes were removed from map construction. Linkage groups were formedusing the ‘mstmap’ function with p < e-8 and genetic distances were calculatedusing the ‘Kosambi’ mapping function. Linkage groups were merged whenoriginating from the same chromosome and recombination frequencies wererecalculated by chromosome with lower p-values. Recombination rates across thegenetic map were calculated using the ‘MareyMap’ function using the ‘slidingwindow’ interpolation method every 200 kbp in a 1 Mbp sliding window107.Pericentromeric regions of the chromosomes were defined when recombinationrates exceeded 2 Mbp/cM for a given locus. Chromosome numbering followed thenumbering of P. vulgaris chromosomes to obtain a one-to-one correspondence,justified by the high level of synteny108.
QTL mapping for plant habit, seed weight, days to first flower, and cyanogenesiswas performed in the UC 92–UC Haskell RIL population using the R/qtlpackage105. A genome-wide scan for single QTLs was performed using the‘scanone’ function with the extended Haley-Knott regression method105. For traitsthat were controlled by a single QTL, composite interval mapping was performedusing the ‘cim’ function with the extended Haley-Knott regression method, theKosambi mapping function, and 1000 permutations to identify the position andLOD score of QTLs above the 95% significance threshold. For traits that containedmultiple significant QTL, the ‘makeqtl’ and ‘fitqtl’ functions were used to identifythe optimal multiple QTL model, and to calculate LOD scores, percent ofphenotypic variation explained by the QTL and QTL effects.
Days to first flower were collected from an experiment grown at two locationsin Davis, California in 2018. The date was recorded when a majority of plants inthe plot had at least one floral bud open. An ANOVA of a generalized linear mixedmodel, including genotype and treatment as fixed effect factors and location andblocks as random effect factors, was performed for days to first flower. Phenotypiccharacterization for plant habit, hundred seed weight, and delayed senescenceincluded in the QTL mapping study were performed on single plants that weregrown within a greenhouse.
Cyanide quantification of samples of floral bud tissue was collected in triplicatesubsamples from an experiment grown at two locations in Davis, California in2018. Tissue samples were kept on dry ice, weighed, and organized in 96-well platesand frozen at −80 °C. Cyanide quantification was performed using an adaptedFiegl-Anger method109. Tissue samples thawed at room temperature for 30 minbefore Fiegl-Anger paper was placed over each plate for 30 min. Standards ofhydrogen cyanide were created with concentrations of 0, 25, 50, 75, 100, 250, 500,750, and 1000 nM of potassium cyanide exposed to Fiegl-Anger paper for 30 min.Fiegl-Anger paper was immediately scanned, and quantification of the blueabsorbance intensity was calculated using ImageJ software and the ‘readplate2’plugin. Blue absorbance intensity was calculated as -log(Mean/255). A standardregression curve was calculated from the standard HCN concentrations andnanomolar concentrations for the samples were calculated based on this curve andcalculated as an nM/min rate across the initial 30-min interval measured. Twoseparate linear models and ANOVAs were performed for the RIL populationgrouped by haplotype at the QTL peak on chromosome Pl05, since this QTL effectconsistently produced bimodal distributions. The best fitting linear model for floralbud cyanogenesis included genotype, location, and treatment as fixed effect factors.
Genetic diversity and population structure analyses. For GBS library con-struction, five biological samples of leaf tissue (three young trifoliate leaves of fivedifferent plants) were collected for each accession. The samples were frozen andstored at −20 °C until processing. DNA isolation was performed from frozentrifoliate leaves using the extraction method developed by Vega-Vela and ChaconSanchez (2011)110. DNA quality was checked with a Nanodrop 2000 and analyzedin 1% agarose gel electrophoresis; DNA with no visible degradation and a ratio260/280 above 1.8 was selected. DNA libraries (one per accession) were generatedby mixing the DNA of five individuals in equal parts (with the help of a Nanodrop2000 and electrophoresis calibration with lambda DNA at concentrations of 25, 50,and 100 ng/µL), then the DNA restriction for each sample was performed with theApeKI enzyme and ligated to adapters containing one of 94 unique barcodes foreach plate. The library was sequenced in paired end using an Illumina Hi-Seq2000.Both library preparation and sequencing were done at the Australian GenomeResearch Facility (Melbourne, Australia).
A total of 482 Lima bean accessions from the International Center for TropicalAgriculture—CIAT (262 accessions) and Centro de Investigacion Cientifica deYucatan—CICY (220 accessions) were analyzed in this study (see SupplementaryData 3). Of these accessions, 215 were domesticated and 267 wild. Wild accessionscovered the known natural geographic range for this species and domesticatedaccessions were landraces from different countries in the Americas (SupplementaryFig. 10). These accessions complemented those analyzed in a previous study10 toincrease the sampling of wild accessions from the MI gene pool (the putativeancestral gene pool of Mesoamerican landraces) and gene pool AII from centralColombia. Sequenced accessions from CIAT are available through the mechanismsestablished by the germplasm collection. Sequenced accessions from Centro deInvestigacion Cientifica de Yucatan (CICY) are available directly upon request.
The sequences obtained from each sample were de-multiplexed by their barcodeusing Next Generation Sequencing Experience Platform (NGSEP) v.3.3.285.Individual fastq files were mapped to the Lima bean reference genome by usingdefault parameters of bowtie2 and adding an ID code for each accession84. Variantswere identified and individuals were genotyped using theMultisampleVariantsDetector command of NGSEP. The parameters used for SNPcalling were: 50 as a maximum number of alignments per start position,heterozygosity rate of 0.0001 (prior probability of finding in every position aheterozygous SNP), and a minimum genotype quality score of 40 (codified inPhred, where 40 means 0.9999 of posterior probability that each genotype call iscorrect). Initial filtering to obtain a raw set of reliable variants was obtained byfiltering using the FilterVCF command of NGSEP with the following criteria: (1)Exclude variants from repetitive regions and in not-assembled scaffolds; (2)Exclude variants genotyped in less than 100 of the 482 accessions; and (3) Excludevariants with minor allele frequency (MAF) less than 0.01. This proceduregenerated an initial set of 116,030 biallelic SNVs, 7517 biallelic indels and STRs,and 22,138 multiallelic variants (96.6% of them triallelic SNVs) with approximately40% of missing data. Further filtering was applied for the different downstreampopulation genetics analyses (details below).
Linkage disequilibrium (LD) was measured as r2, the correlation coefficientamong pair of alleles across pairs of SNP loci, specifically as average r2 against 10and 100 kbp physical intervals through the 11 chromosomes of Phaseolus lunatususing TASSEL v.5111. This analysis was conducted on a filtered dataset with thewild samples, as well as a filtered dataset with the domesticated samples. We alsoconducted the analysis for Mesoamerican and Andean gene pools. Results wereplotted in R software by using an adapted code.
NATURE COMMUNICATIONS | https://doi.org/10.1038/s41467-021-20921-1 ARTICLE
NATURE COMMUNICATIONS | (2021) 12:702 | https://doi.org/10.1038/s41467-021-20921-1 | www.nature.com/naturecommunications 13
To estimate the number of clusters in Lima bean useful to describe the geneticdata, we used algorithmic approaches and model-based approaches. For this, webuilt a multilocus-genotype matrix containing the 482 accessions (267 wild and 215domesticated) described earlier. The raw VCF file described in the previous sectionwas filtered keeping only biallelic SNVs with a distance of more than 10 bp fromother variants, genotyped with quality at least 40 in at least 450 individuals andwith minor allele frequency larger than 0.03. A total of 12,398 SNVs were retainedafter these filters with only 5.3% of missing data. For each sample, genotype callsbased on read data were present for at least 75% of the SNPs and this percentage isless than 90% for only six samples (Supplementary Data 4).
The algorithmic approaches were carried out with the software Darwinv.6.0.021112 and the R package Adegenet v.2.1.2113. In Darwin, a pairwise distancematrix was calculated by estimating the proportion of matching alleles per locus forevery pair of individuals. For the representation of the genetic structure, we used threemethods: a principal coordinate analysis (PCoA in Darwin), a tree method (neighbor-joining -NJ- algorithm in Darwin), and a discriminant analysis of principalcomponents114 (DAPC in Adegenet), that unlike PCoA, optimizes the variancebetween groups while minimizing the variance within groups. In Adegenet, thefunction ‘find.clusters’ was used to identify the optimal number of clusters based onthe Bayesian information criterion (BIC), 500 principal components were retained,four discriminant functions were used and the proportion of conserved variance was0.95. For statistical support of NJ tree structure, 1000 bootstrapped matrices wereobtained. The tree was visualized using iTol103.
The software STRUCTURE v.2.3.4115 was used as an alternative approach toinfer the population structure of the sequenced accessions. The filtered VCF filewas converted to the input format of STRUCTURE using the ConvertVCFcommand of NGSEP. A total of 200 STRUCTURE runs were executed varying thenumber of clusters (K parameter) from 1 to 10 and performing 20 repetitions foreach K value. For each run, 10,000 burn-in iterations and 30,000 samplingiterations were executed. The main and extra parameters were left with defaultvalues with the exception of the option ‘ONEROWPERIND’ which was set to 1 tomake it consistent with the format provided by the VCF converter of NGSEP.Stability of the Markov chain was assessed looking at the variance of the likelihoodof the clustering achieved by each repetition. The solution with the best likelihoodwas selected for each K value between 2 and 8 and cluster numbers werereorganized to visually assess the cluster stability across different K values (Fig. 3a).The Evanno test was performed to predict the optimal number of clusters116.
Haplotype based population structure was assessed with the softwarefineSTRUCTURE v.4.1.057. In brief, this software builds a sample relationship matrixcapturing the haplotype similarity across the genome. This matrix is then used to runa Markov chain to sample group configurations and tree topologies consistent withthe similarity matrix. For this analysis, the VCF file with population information wasfiltered keeping only biallelic SNVs with a distance of more than 10 bp from othervariants, genotyped with quality at least 40 in at least 300 individuals, MAF largerthan 0.02, and observed heterozygosity (OH) below 0.5. A total of 28,753 SNVs wereretained after these filters with 11% missing data and 332,817 (2.4%) heterozygousdata points. Imputation of missing data and statistical haplotyping was performedusing Beagle 5.0117 setting the phase states to 50, the imputation states to 400, and theeffective population size to 100,000. For each chromosome, the VCF was converted tothe input format of fineSTRUCTURE using the command VCFConverter of NGSEP.The four steps pipeline of fineSTRUCTURE was executed using default parametersfollowing the user manual and providing genetic distances inferred from the geneticmap developed from the biparental population.
Basic diversity statistics for populations, namely observed heterozygosity (HO),expected heterozygosity (HE), endogamy (FIS), global FST, and pairwise FST118 wereestimated using the R packages Adegenet113 and Hierfstat v.0.5119 from the samedataset used to run STRUCTURE. Difference between HO and HE was assessed bymeans of the Bartlett test and paired t test. The significance of populationdifferentiation was tested by means of a likelihood ratio G-statistic120.
Introgression analysis was performed running the ‘IntrogressionAnalysis’command of NGSEP. The input VCF for this analysis was the same used to runSTRUCTURE. The input file with population assignments contained geneticpopulations inferred by STRUCTURE at K= 4, which separates the MI, MII, AI,and AII populations. Only 448 samples with clear assignments were included inthis file. The analysis was executed with default parameters (non-overlappingwindows of 50 SNPs discriminating at least one pair of populations). The raw set ofpredicted introgression events called with this procedure was filtered keeping onlyevents that span more than one contiguous window or, for a single window of 50SNPs, if the similarity score between the haplotype of the sample and the consensushaplotype of the sample background population was below 15. Then, the D-statisticimplemented in the ANGSD package v.0.93121 was calculated to assess significanceof the introgression events. GBS reads from common bean were aligned to the P.lunatus genome to use them as an outgroup for this analysis. Events with Z-scoreslarger than 2 were retained. Additionally, the introgression called for the MIIsample JMC_1097 was retained because it spanned 53Mbp over fourchromosomes. Finally, two introgressions of about 2Mbp called at 36 Mbp of Pl07and 4.6Mbp of Pl08 were retained because they were consistently called in six andseven accessions, respectively. Although the D-statistic probably did not haveenough power to assess significance of these introgressions, they were validated by
construction of neighbor-joining clusters within the specific regions(Supplementary Fig. 22).
Reporting Summary. Further information on research design is available inthe Nature Research Reporting Summary linked to this article.
Data availabilityData supporting the findings of this work are available within the paper and itsSupplementary Information files. A reporting summary for this article is available as aSupplementary Information file. The datasets and plant materials generated and analyzedduring the current study are available from the corresponding author upon request.Accession codes and passport data for the 482 wild and domesticated accessions analyzedin this study are shown in Supplementary Data 3 (CIAT’s and CICY’s accessionnumbers). Accessions from CIAT can be requested at https://genebank.ciat.cgiar.org.Raw sequence data generated in this study have been deposited in the NCBI SequenceRead Archive (SRA) under the Bioproject accession number PRJNA596114. The genomeassembled in this study is available at the NCBI assembly database with accessionnumber JAAFYQ000000000. The genome assembly and its corresponding annotation arealso available at Phytozome v.13. Other relevant data are available in SupplementaryData files. We reanalyzed RNA-seq data publicly available at NCBI SRA with bioprojectaccession number PRJNA275266. Source data are provided with this paper.
Code availabilitySoftware developed for this work is available as part of the open-source software solutionNGSEP. Stable releases of NGSEP are available through sourceforge [http://ngsep.sf.net].Live development is constantly made available through our github repositories [http://github.com/NGSEP].
Received: 20 October 2020; Accepted: 22 December 2020;
References1. Bitocchi, E. et al. Beans (Phaseolus ssp.) as a model for understanding crop
evolution. Front. Plant Sci. 8, 722–722 (2017).2. Delgado-Salinas, A., Bibler, R. & Lavin, M. Phylogeny of the genus Phaseolus
(Leguminosae): a recent diversification in an ancient landscape. Syst. Bot. 31,779–791 (2006).
3. Freytag, G. & Debouck, D. G. Taxonomy, distribution, and ecology of the genusPhaseolus (Leguminosae-Papilionoideae) in North America, Mexico andCentral America (Botanical Research Institute of Texas (BRIT), 2002).
4. Gepts, P. The contribution of genetic and genomic approaches to plantdomestication studies. Curr. Opin. Plant Biol. 18, 51–59 (2014).
5. Holland, B., Unwin, I. D. & Buss, D. H. Vegetables, Herbs and Spices: FifthSupplement to McCance and Widdowson’s The Composition of Foods 4th edn(1991).
6. Jones, D. B., Gersdorff, C. E. F., Johns, C. O. & Finks, A. J. The proteins of theLima bean, Phaseolus lunatus. J. Biol. Chem. 53, 231–240 (1922).
7. Baudoin, J. P., Rocha, O., Degreef, J., Maquet, A. & Guarino, L. Ecogeography,Demography, Diversity and Conservation of Phaseolus lunatus L. in the CentralValley of Costa Rica (International Plant Genetic Resources Institute, 2004).
8. Cerda-Hurtado, I. M. et al. Climatic adaptation and ecological descriptors ofwild beans from Mexico. Ecol. Evol. 8, 6492–6504 (2018).
9. Delgado-Salinas, A. & Gama-López S. Diversidad y distribución de los frijolessilvestres en México. Revista Digital Universitaria 16. http://www.revista.unam.mx/vol.16/num12/art10/index.html (2015).
10. Chacón-Sánchez, M. I. & Martínez-Castillo, J. Testing domestication scenariosof Lima bean (Phaseolus lunatus L.) in mesoamerica: insights from genome-wide genetic markers. Front. Plant Sci. 8, 1551–1551 (2017).
11. Serrano-Serrano, M. L., Hernández-Torres, J., Castillo-Villamizar, G.,Debouck, D. G. & Chacón Sánchez, M. I. Gene pools in wild Lima bean(Phaseolus lunatus L.) from the Americas: evidences for an Andean origin andpast migrations. Mol. Phylogenet. Evol. 54, 76–87 (2010).
12. Andueza-Noh, R. H., Martínez-Castillo, J. & Chacón-Sánchez, M. I.Domestication of small-seeded Lima bean (Phaseolus lunatus L.) landraces inMesoamerica: evidence from microsatellite markers. Genetica 143, 557–669(2015).
13. Andueza-Noh, R. H. et al. Multiple domestications of the Mesoamerican genepool of Lima bean (Phaseolus lunatus L.): evidence from chloroplast DNAsequences. Genet. Resour. Crop Evol. 60, 1069–1086 (2013).
14. Baudoin, J. P. In Genetic Resources of Phaseolus Beans. Current Plant Scienceand Biotechnology in Agriculture (ed. Gepts, P.) (Springer, Dordrecht, 1988).
ARTICLE NATURE COMMUNICATIONS | https://doi.org/10.1038/s41467-021-20921-1
14 NATURE COMMUNICATIONS | (2021) 12:702 | https://doi.org/10.1038/s41467-021-20921-1 | www.nature.com/naturecommunications
15. Gutiérrez Salgado, A., Gepts, P. & Debouck, D. G. Evidence for two gene poolsof the Lima bean, Phaseolus lunatus L., in the Americas. Genet. Resour. CropEvol. 42, 15–28 (1995).
16. Motta-Aldana, J. R. et al. Multiple origins of Lima bean landraces in theAmericas: evidence from chloroplast and nuclear DNA polymorphisms. CropSci. 50, 1773–1787 (2010).
17. Serrano-Serrano, M. L., Andueza-Noh, R. H., Martínez-Castillo, J., Debouck,D. G. & Chacón, S. M. I. Evolution and domestication of Lima bean inMexico: evidence from ribosomal DNA. Crop Sci. 52, 1698–1712 (2012).
18. Baudet, J. C. The taxonomical status of cultivated types of Lima bean(Phaseolus lunatus L.). Trop. Grain Legume Bull. 7, 29–30 (1977).
19. Mackie, W. Origin, dispersal, and variability of the Lima bean, Phaseoluslunatus. Hilgardia 15, 1–29 (1943).
20. Porch, G. T. et al. Use of wild relatives and closely related species to adaptcommon bean to climate change. Agronomy 3, 433–461 (2013).
21. Dohle, S. Development of Resources for Lima Bean (Phaseolus lunatus)Breeding and Genetics Research. Doctoral Dissertation, University ofCalifornia Davis (2017).
22. Rendón-Anaya, M. et al. Genomic history of the origin and domestication ofcommon bean unveils its closest sister species. Genome Biol. 18, 60 (2017).
23. Schmutz, J. et al. A reference genome for common bean and genome-wideanalysis of dual domestications. Nat. Genet. 46, 707–713 (2014).
24. Vlasova, A. et al. Genome and transcriptome analysis of the Mesoamericancommon bean and the role of gene duplications in establishing tissue andtemporal specialization of genes. Genome Biol. 17, 32 (2016).
25. Mercado-Ruaro, P. & Delgado-Salinas, A. Karyotypic studies on species ofPhaseolus (Fabaceae: Phaseolinae). Am. J. Bot. 85, 1–9 (1998).
26. Almeida, C. & Pedrosa-Harand, A. High macro-collinearity between Limabean (Phaseolus lunatus L.) and the common bean (P. vulgaris L.) as revealedby comparative cytogenetic mapping. Theor. Appl. Genet. 126, 1909–1916(2013).
27. Arumuganathan, K. & Earle, E. D. Nuclear DNA content of some importantplant species. Plant Mol. Biol. Report. 9, 208–218 (1991).
28. Bonifácio, E. M., Fonseca, A., Almeida, C., dos Santos, K. G. B. & Pedrosa-Harand, A. Comparative cytogenetic mapping between the Lima bean(Phaseolus lunatus L.) and the common bean (P. vulgaris L.). Theor. Appl.Genet. 124, 1513–1520 (2012).
29. Schreiber, M., Stein, N. & Mascher, M. Genomic approaches for studying cropevolution. Genome Biol. 19, 140 (2018).
30. Bergman, C. M. & Quesneville, H. Discovering and detecting transposableelements in genome sequences. Brief. Bioinform. 8, 382–392 (2007).
31. Gao, D., Abernathy, B., Rohksar, D., Schmutz, J. & Jackson, S. A. Annotationand sequence diversity of transposable elements in common bean (Phaseolusvulgaris). Front. Plant Sci. 5, 339–339 (2014).
32. Campa, A., Murube, E. & Ferreira, J. J. Genetic diversity, population structure,and linkage disequilibrium in a Spanish common bean diversity panel revealedthrough genotyping-by-sequencing. Genes 9, 518 (2018).
33. Repinski, S. L., Kwak, M. & Gepts, P. The common bean growth habit genePvTFL1y is a functional homolog of Arabidopsis TFL1. Theor. Appl. Genet.124, 1539–1547 (2012).
34. Blair, M. W., Iriarte, G. & Beebe, S. QTL analysis of yield traits in an advancedbackcross population derived from a cultivated Andean x wild common bean(Phaseolus vulgaris L.) cross. Theor. Appl. Genet. 112, 1149–1163 (2006).
35. Checa, O. E. & Blair, M. W. Inheritance of yield-related traits in climbingbeans (Phaseolus vulgaris L.). Crop Sci. 52, 1998–2013 (2012).
36. Olsen, K. M., Sutherland, B. L. & Small, L. L. Molecular evolution of the Li/lichemical defence polymorphism in white clover (Trifolium repens L.). Mol.Ecol. 16, 4180–4193 (2007).
37. Oxtoby, E., Dunn, M. A., Pancoro, A. & Hughes, M. A. Nucleotide andderived amino acid sequence of the cyanogenic β-glucosidase (linamarase)from white clover (Trifolium repens L.). Plant Mol. Biol. 17, 209–219 (1991).
38. Qiao, X. et al. Gene duplication and evolution in recurringpolyploidization–diploidization cycles in plants. Genome Biol. 20, 38 (2019).
39. Kuboyama, T., Shintaku, Y. & Takeda, G. Hybrid plants of Phaseolus vulgarisL. and P. lunatus L. obtained by means of embryo rescue and confirmed byrestriction endonuclease analysis of rDNA. Euphytica 54, 177–182 (1991).
40. Leonard, M. F., Stephens, L. C. & Summers, W. L. Effect of maternal genotypeon development of Phaseolus vulgaris L. × P. lunatus L. interspecific hybridembryos. Euphytica 36, 327–332 (1987).
41. Schmutz, J. et al. Genome sequence of the palaeopolyploid soybean. Nature463, 178–183 (2010).
42. Lonardi, S. et al. The genome of cowpea (Vigna unguiculata [L.] Walp.). PlantJ. 98, 767–782 (2019).
43. Delgado-Salinas, A., Thulin, M., Pasquet, R., Weeden, N. & Lavin, M. Vigna(Leguminosae) sensu lato: the names and identities of the American segregategenera. Am. J. Bot. 98, 1694–1715 (2011).
44. Wang, B. & Li, J. Understanding the molecular bases of agronomic traitimprovement in rice. Plant Cell 31, 1416–1417 (2019).
45. Sánchez-Pérez, R. et al. Mutation of a bHLH transcription factor allowedalmond domestication. Science 364, 1095–1098 (2019).
46. Thompson, C. & Tar’an, B. Genetic characterization of the acetohydroxyacidsynthase (AHAS) gene responsible for resistance to imidazolinone in chickpea(Cicer arietinum L.). Theor. Appl. Genet. 127, 1583–1591 (2014).
47. Cai, G. et al. Genetic dissection of plant architecture and yield-related traits inBrassica napus. Sci. Rep. 6, 21625 (2016).
48. Konzen, E. R. et al. DREB genes from common bean (Phaseolus vulgaris L.)show broad to specific abiotic stress responses and distinct levels of nucleotidediversity. Int. J. Genomics 2019, 9520642 (2019).
49. Song, H. et al. Comparative analysis of NBS-LRR genes and their response toAspergillus flavus in Arachis. PLoS One 12, e0171181 (2017).
50. Chen, N. W. G. et al. Common bean subtelomeres are hot spots of recombinationand favor resistance gene evolution. Front. Plant Sci. 9, 1185 (2018).
51. López, C. E. et al. Identifying resistance gene analogs associated with resistancesto different pathogens in common bean. Phytopathology 93, 88–95 (2003).
52. Meziadi, C. et al. Development of molecular markers linked to diseaseresistance genes in common bean based on whole genome sequence. Plant Sci.242, 351–357 (2016).
53. Murube, E., Campa, A. & Ferreira, J. J. Integrating genetic and physicalpositions of the anthracnose resistance genes described in bean chromosomesPv01 and Pv04. PLoS One 14, e0212298 (2019).
54. Richard, M. M. S. et al. Genomic and epigenomic immunity in common bean:the unusual features of NB-LRR gene family. DNA Res. 25, 161–172 (2018).
55. Gil, J. et al. Fine-mapping of angular leaf spot resistance gene Phg-2 incommon bean and development of molecular breeding tools. Theor. Appl.Genet. 132, 2003–2016 (2019).
56. González, A. M., Godoy, L. & Santalla, M. Dissection of resistance genes toPseudomonas syringae pv. phaseolicola in UI3 common bean cultivar. Int. J.Mol. Sci. 18, 2503 (2017).
57. Lawson, D. J., Hellenthal, G., Myers, S. & Falush, D. Inference of populationstructure using dense haplotype data. PLoS Genet. 8, e1002453 (2012).
58. Martínez-Castillo, J., Zizumbo-Villarreal, D., Perales-Rivera, H. & Colunga-Garcíamarin, P. Intraspecific diversity and morpho-phenological variation inPhaseolus lunatus L. from the Yucatan Peninsula, Mexico. Economic Bot. 58,354–380 (2004). 327.
59. Dzul-Tejero, F., Coello-Coello, J. & Martínez-Castillo, J. Wild to cropintrogression and genetic diversity in Lima bean (Phaseolus lunatus L.) intraditional Mayan milpas from Mexico. Conserv. Genet. 15, 1315–1328 (2014).
60. Colunga-GarcíaMarín, P. & Zizumbo-Villarreal, D. Domestication of plants inMaya lowlands. Economic Bot. 58, S101–S110 (2004).
61. Caicedo, A. L. et al. AFLP fingerprinting of Phaseolus lunatus L. and relatedwild species from South America. Crop Sci. 39, 1497–1507 (1999).
62. Toro Chica, O., Lareo, L. & Debouck, D. G. Observations on a noteworthywild Lima bean, Phaseolus lunatus L., from Colombia. Annu. Rep. BeanImprov. Coop. 36, 53–54 (1993).
63. Towle, M. A. The Ethnobotany of pre-Columbian Peru (Wenner-GrenFoundation for Anthropological Research, Inc., 1961).
64. Ogutcen, E. et al. Pod shattering: a homologous series of variation underlyingdomestication and an avenue for crop improvement. Agronomy 8, 137 (2018).
65. Parker, T. A., Berny Mier y Teran, J. C., Palkovic, A., Jernstedt, J. & Gepts, P.Pod indehiscence is a domestication and aridity resilience trait in commonbean. New Phytol. 225, 558–570 (2020).
66. Li, F., Cao, D., Liu, Y., Yang, T. & Wang, G. Transcriptome sequencing ofLima bean (Phaseolus lunatus) to Identify putative positive selection inPhaseolus and legumes. Int. J. Mol. Sci. 16, 15172–15187 (2015).
67. Funatsuki, H. et al. Molecular basis of a shattering resistance boosting globaldissemination of soybean. Proc. Natl Acad. Sci. 111, 17797 (2014).
68. Zhang, X. et al. A genome-wide survey reveals abundant rice blast R genes inresistant cultivars. Plant J. 84, 20–28 (2015).
69. Gallois, J.-L., Moury, B. & German-Retana, S. Role of the genetic backgroundin resistance to plant viruses. Int. J. Mol. Sci. 19, 2856 (2018).
70. Ariani, A., Berny Mier y Teran, J. C. & Gepts, P. Spatial and temporal scales ofrange expansion in wild Phaseolus vulgaris. Mol. Biol. Evol. 35, 119–131 (2018).
71. Martínez-Castillo, J., Colunga-GarcíaMarín, P. & Zizumbo-Villarreal, D.Genetic erosion and in situ conservation of Lima bean (Phaseolus lunatus L.)landraces in its Mesoamerican diversity center. Genet. Resour. Crop Evol. 55,1065–1077 (2008).
72. Koinange, E. M. K., Singh, S. P. & Gepts, P. Genetic control of thedomestication syndrome in common bean. Crop Sci. 36, 1037–1045 (1996).
73. Kwak, M., Toro, O., Debouck, D. G. & Gepts, P. Multiple origins of thedeterminate growth habit in domesticated common bean (Phaseolus vulgaris).Ann. Bot. 110, 1573–1580 (2012).
74. Zhang, J. & Singh, A. K. Genetic control and geo-climate adaptation of poddehiscence provide novel insights into soybean domestication. G3 10, 545–554(2020).
75. O’Rourke, J. A. et al. An RNA-Seq based gene expression atlas of the commonbean. BMC Genomics 15, 866 (2014).
NATURE COMMUNICATIONS | https://doi.org/10.1038/s41467-021-20921-1 ARTICLE
NATURE COMMUNICATIONS | (2021) 12:702 | https://doi.org/10.1038/s41467-021-20921-1 | www.nature.com/naturecommunications 15
76. Behnam, B. et al. An optimized isolation protocol yields high-quality RNAfrom cassava tissues (Manihot esculenta Crantz). FEBS Open Bio 9, 814–825(2019).
77. Wang, X., Tian, W. & Li, Y. Development of an efficient protocol of RNAisolation from recalcitrant tree tissues. Mol. Biotechnol. 38, 57–64 (2008).
78. Murgia, M. L. et al. A comprehensive phenotypic investigation of the “pod-shattering syndrome” in common bean. Front. Plant Sci. 8, 251 (2017).
79. Andrews, S. FastQC: A Quality Control Tool for High Throughput SequenceData [Online] (2010).
80. Bolger, A. M., Lohse, M. & Usadel, B. Trimmomatic: a flexible trimmer forIllumina sequence data. Bioinformatics 30, 2114–2120 (2014).
81. Grabherr, M. G. et al. Full-length transcriptome assembly from RNA-Seq datawithout a reference genome. Nat. Biotechnol. 29, 644–652 (2011).
82. Simão, F. A., Waterhouse, R. M., Ioannidis, P., Kriventseva, E. V. & Zdobnov,E. M. BUSCO: assessing genome assembly and annotation completeness withsingle-copy orthologs. Bioinformatics 31, 3210–3212 (2015).
83. Koren, S. et al. Canu: scalable and accurate long-read assembly via adaptive k-mer weighting and repeat separation. Genome Res. 27, 722–736 (2017).
84. Langmead, B. & Salzberg, S. L. Fast gapped-read alignment with Bowtie 2. Nat.Methods 9, 357–359 (2012).
85. Tello, D. et al. NGSEP3: accurate variant calling across species and sequencingprotocols. Bioinformatics 35, 4716–4723 (2019).
86. Benson, G. Tandem repeats finder: a program to analyze DNA sequences.Nucleic Acids Res. 27, 573–580 (1999).
87. Li, H. & Durbin, R. Fast and accurate short read alignment withBurrows–Wheeler transform. Bioinformatics 25, 1754–1760 (2009).
88. Ghurye, J., Pop, M., Koren, S., Bickhart, D. & Chin, C.-S. Scaffolding of longread assemblies using long range contact information. BMC Genomics 18,527 (2017).
89. Campbell, M. S., Holt, C., Moore, B. & Yandell, M. Genome annotation andcuration using MAKER and MAKER-P. Curr. Protoc. Bioinformatics 48,4.11.1–4.11.39 (2014).
90. Trapnell, C. et al. Differential gene and transcript expression analysis of RNA-seq experiments with TopHat and Cufflinks. Nat. Protoc. 7, 562–578(2012).
91. Kim, D., Langmead, B. & Salzberg, S. L. HISAT: a fast spliced aligner with lowmemory requirements. Nat. Methods 12, 357–360 (2015).
92. Pertea, M. et al. StringTie enables improved reconstruction of a transcriptomefrom RNA-seq reads. Nat. Biotechnol. 33, 290–295 (2015).
93. Love, M. I., Huber, W. & Anders, S. Moderated estimation of fold change anddispersion for RNA-seq data with DESeq2. Genome Biol. 15, 550 (2014).
94. Patro, R., Duggal, G., Love, M. I., Irizarry, R. A. & Kingsford, C. Salmonprovides fast and bias-aware quantification of transcript expression. Nat.Methods 14, 417–419 (2017).
95. Bryant, D. M. et al. A tissue-mapped axolotl de novo transcriptome enablesidentification of limb regeneration factors. Cell Rep. 18, 762–776 (2017).
96. Mistry, J., Finn, R. D., Eddy, S. R., Bateman, A. & Punta, M. Challenges inhomology search: HMMER3 and convergent evolution of coiled-coil regions.Nucleic Acids Res. 41, e121 (2013).
97. Alexa, A., Rahnenführer, J. & Lengauer, T. Improved scoring of functionalgroups from gene expression data by decorrelating GO graph structure.Bioinformatics 22, 1600–1607 (2006).
98. Supek, F., Bošnjak, M., Škunca, N. & Šmuc, T. REVIGO summarizes andvisualizes long lists of gene ontology terms. PLoS One 6, e21800 (2011).
99. Shannon, P. et al. Cytoscape: a software environment for integrated models ofbiomolecular interaction networks. Genome Res. 13, 2498–2504 (2003).
100. Jiangtao, C. et al. MapGene2Chrom, a tool to draw gene physical map basedon Perl and SVG languages. Yi chuan 37, 91–97 (2015).
101. Edgar, R. C. MUSCLE: multiple sequence alignment with high accuracy andhigh throughput. Nucleic Acids Res. 32, 1792–1797 (2004).
102. Kumar, S., Stecher, G., Li, M., Knyaz, C. & Tamura, K. MEGA X: molecularevolutionary genetics analysis across computing platforms. Mol. Biol. Evol. 35,1547–1549 (2018).
103. Letunic, I. & Bork, P. Interactive Tree Of Life (iTOL) v4: recent updates andnew developments. Nucleic Acids Res. 47, W256–W259 (2019).
104. Ariani, A., Berny Mier, Y., Teran, J. C. & Gepts, P. Genome-wide identificationof SNPs and copy number variation in common bean (Phaseolus vulgaris L.)using genotyping-by-sequencing (GBS). Mol. Breed. 36, 87 (2016).
105. Broman, K. W., Wu, H., Sen & Churchill, G. A. R/qtl: QTL mapping inexperimental crosses. Bioinformatics 19, 889–890 (2003).
106. Taylor, J. & Butler, D. R package ASMap: efficient genetic linkage mapconstruction and diagnosis. arXiv preprint arXiv:170506916 (2017).
107. Rezvoy, C., Charif, D., Guéguen, L. & Marais, G. A. B. MareyMap: an R-basedtool with graphical interface for estimating recombination rates.Bioinformatics 23, 2188–2189 (2007).
108. Pedrosa-Harand, A., Porch, T. & Gepts, P. Standard nomenclature forcommon bean chromosomes and linkage groups. Annu. Rep. Bean Improv.Coop. 51, 106–107 (2008).
109. Takos, A. et al. Genetic screening identifies cyanogenesis-deficient mutants ofLotus japonicus and reveals enzymatic specificity in hydroxynitrile glucosidemetabolism. Plant Cell 22, 1605–1619 (2010).
110. Vega-Vela, N. E. & Chacón-Sánchez, M. I. Isolation of high-quality DNA in16 aromatic and medicinal Colombian species using silica-based extractioncolumns. Agron. Colomb. 29, 349–357 (2011).
111. Bradbury, P. J. et al. TASSEL: software for association mapping of complextraits in diverse samples. Bioinformatics 23, 2633–2635 (2007).
112. Perrier, X. & Jacquemoud-Collet, J. P. DARwin software http://darwin.cirad.fr/(2006).
113. Jombart, T. Adegenet: a R package for the multivariate analysis of geneticmarkers. Bioinformatics 24, 1403–1405 (2008).
114. Jombart, T., Devillard, S. & Balloux, F. Discriminant analysis of principalcomponents: a new method for the analysis of genetically structuredpopulations. BMC Genet. 11, 94 (2010).
115. Pritchard, J. K., Stephens, M. & Donnelly, P. Inference of population structureusing multilocus genotype data. Genetics 155, 945–959 (2000).
116. Evanno, G., Regnaut, S. & Goudet, J. Detecting the number of clusters ofindividuals using the software structure: a simulation study. Mol. Ecol. 14,2611–2620 (2005).
117. Browning, B. L., Zhou, Y. & Browning, S. R. A one-penny imputed genome fromnext-generation reference panels. Am. J. Hum. Genet. 103, 338–348 (2018).
118. Weir, B. S. & Cockerham, C. C. Estimating F-statistics for the analysis ofpopulation structure. Evolution 38, 1358–1370 (1984).
119. Goudet, J. Hierfstat, a package for R to compute and test hierarchical F-statistics. Mol. Ecol. Notes 5, 184–186 (2005).
120. Goudet, J., Raymond, M., de Meeüs, T. & Rousset, F. Testing differentiation indiploid populations. Genetics 144, 1933 (1996).
121. Korneliussen, T. S., Albrechtsen, A. & Nielsen, R. ANGSD: analysis of nextgeneration sequencing data. BMC Bioinformatics 15, 356 (2014).
AcknowledgementsWe acknowledge the DSIT high performance computing unit at Universidad de losAndes for their support to conduct most of the bioinformatic analysis presented in themanuscript. We also acknowledge Daniel Tello, Rogelio Garcia, Maria del Rosario Leon,and all current and former members of the NGSEP development team for discussionsand general software contributions. We acknowledge Matilde M. Ortiz for her support inthe extraction of DNA and Rogelio Lepiz Ph.D. and Jose Lopez Ph.D. for their support inthe collection of germplasm. We also acknowledge Adriana Bohorquez, Eliana Macea,and Maria Eugenia Recio from CIAT for her valuable help in providing protocols forRNA extraction and Laura Marcela Torres for her support in the lab work. Funding forthis work was provided by Colciencias [contract number FP44842-009-2015 and projectcode 1101-658-42502 awarded to MICS], by Fundacion para la Promocion de laInvestigacion y la Tecnologia del Banco de la Republica de Colombia [Project code 3404awarded to MICS], internal funding from Universidad Nacional de Colombia [projectcodes 34419, 34690 and 40843 awarded to MICS], internal funding from Universidad delos Andes, the California Dry Bean Advisory Board award to PG, and by CONACYT-Mexico [project code CB2014-240984 awarded to JMC], which provided support to carryout collecting trips of Lima bean populations in Mexico and GBS experiments.
Author contributionsM.I.C.S., J.D., P.G., J.M.C., and D.D. conceived the study. M.I.C.S., J.D., P.G., D.D., andC.B. provided guidance and scientific support. M.I.C.S., P.G., J.M.C., and D.D. con-tributed plant materials and lab equipment. T.G., S.S.Z., S.D., A.P., J.M.C., and P.S.performed field and lab work. T.G., J.D., S.S.Z., J.G., A.A., P.S., C.B., and M.I.C.S. carriedon bioinformatic and statistical analyses. J.D., T.G., and A.A. developed software foranalysis tasks. M.I.C.S., J.D., P.G., T.G., J.G., and S.S.Z. drafted the manuscript. Allauthors read and approved the final version of the manuscript.
Competing interestsThe authors declare no competing interests.
Additional informationThe online version contains supplementary material available at https://doi.org/10.1038/s41467-021-20921-1.
Correspondence and requests for materials should be addressed to J.D. or M.I.Cón-S.
Peer review information Nature Communications thanks Matthew Hudson, and theother, anonymous, reviewer(s) for their contribution to the peer review of this work. Peerreviewer reports are available.
Reprints and permission information is available at http://www.nature.com/reprints
Publisher’s note Springer Nature remains neutral with regard to jurisdictional claims inpublished maps and institutional affiliations.
ARTICLE NATURE COMMUNICATIONS | https://doi.org/10.1038/s41467-021-20921-1
16 NATURE COMMUNICATIONS | (2021) 12:702 | https://doi.org/10.1038/s41467-021-20921-1 | www.nature.com/naturecommunications
Open Access This article is licensed under a Creative CommonsAttribution 4.0 International License, which permits use, sharing,
adaptation, distribution and reproduction in any medium or format, as long as you giveappropriate credit to the original author(s) and the source, provide a link to the CreativeCommons license, and indicate if changes were made. The images or other third partymaterial in this article are included in the article’s Creative Commons license, unlessindicated otherwise in a credit line to the material. If material is not included in thearticle’s Creative Commons license and your intended use is not permitted by statutoryregulation or exceeds the permitted use, you will need to obtain permission directly fromthe copyright holder. To view a copy of this license, visit http://creativecommons.org/licenses/by/4.0/.
© The Author(s) 2021
NATURE COMMUNICATIONS | https://doi.org/10.1038/s41467-021-20921-1 ARTICLE
NATURE COMMUNICATIONS | (2021) 12:702 | https://doi.org/10.1038/s41467-021-20921-1 | www.nature.com/naturecommunications 17