Embed Size (px)
Citation preview

ACKNOWLEDGEMENT
I would like to thank my parents, Ms. Yanhua Duan and Mr. Bilin Shao, for their unyielding support all the way along. Those sincere suggestions and
encouragement from Mr. Bojin Zhu is also greatly appreciated.
I would also like to thank Prof. Leah Meisterlin, Prof. Fan Yang, Prof. Chen Chen, Prof. Chun-Ming Hsieh, Prof. Bing Liu, Prof. Lan Wang, Prof. Huizhi Geng, Prof.
Zhenwei Peng for their valuable instructions, and my friends Ms. Chenge Liu, Mr. Xuan Zhou, Ms. Danqing Li for their precious companion.
02 | 11
12 | 25
26 | 39
40 | 59
CONTENTS
URBAN PLANNING AND DESIGN
COMPREHENSIVE PLANNING OF WUJING SUB-DISTRICT
7th-semester, undergraduate core studio, Tongji University
RESTITCHING: URBAN DESIGN OF AREA AROUND EAST BEIJING ROAD
9th-semester, undergraduate core studio, Tongji University
URBAN COURTYARDS: RESIDENTIAL PLANNING IN RUIHONG AREA
6th-semester, undergraduate core studio, Tongji University
URBAN SPATIAL ANALYSIS TOWARDS A HEALTHIER NEW YORK CITY: ASSESSING FARMERS MARKETS
1st-semester, graduate GIS course, GSAPP, Columbia University
OTHER WORKS
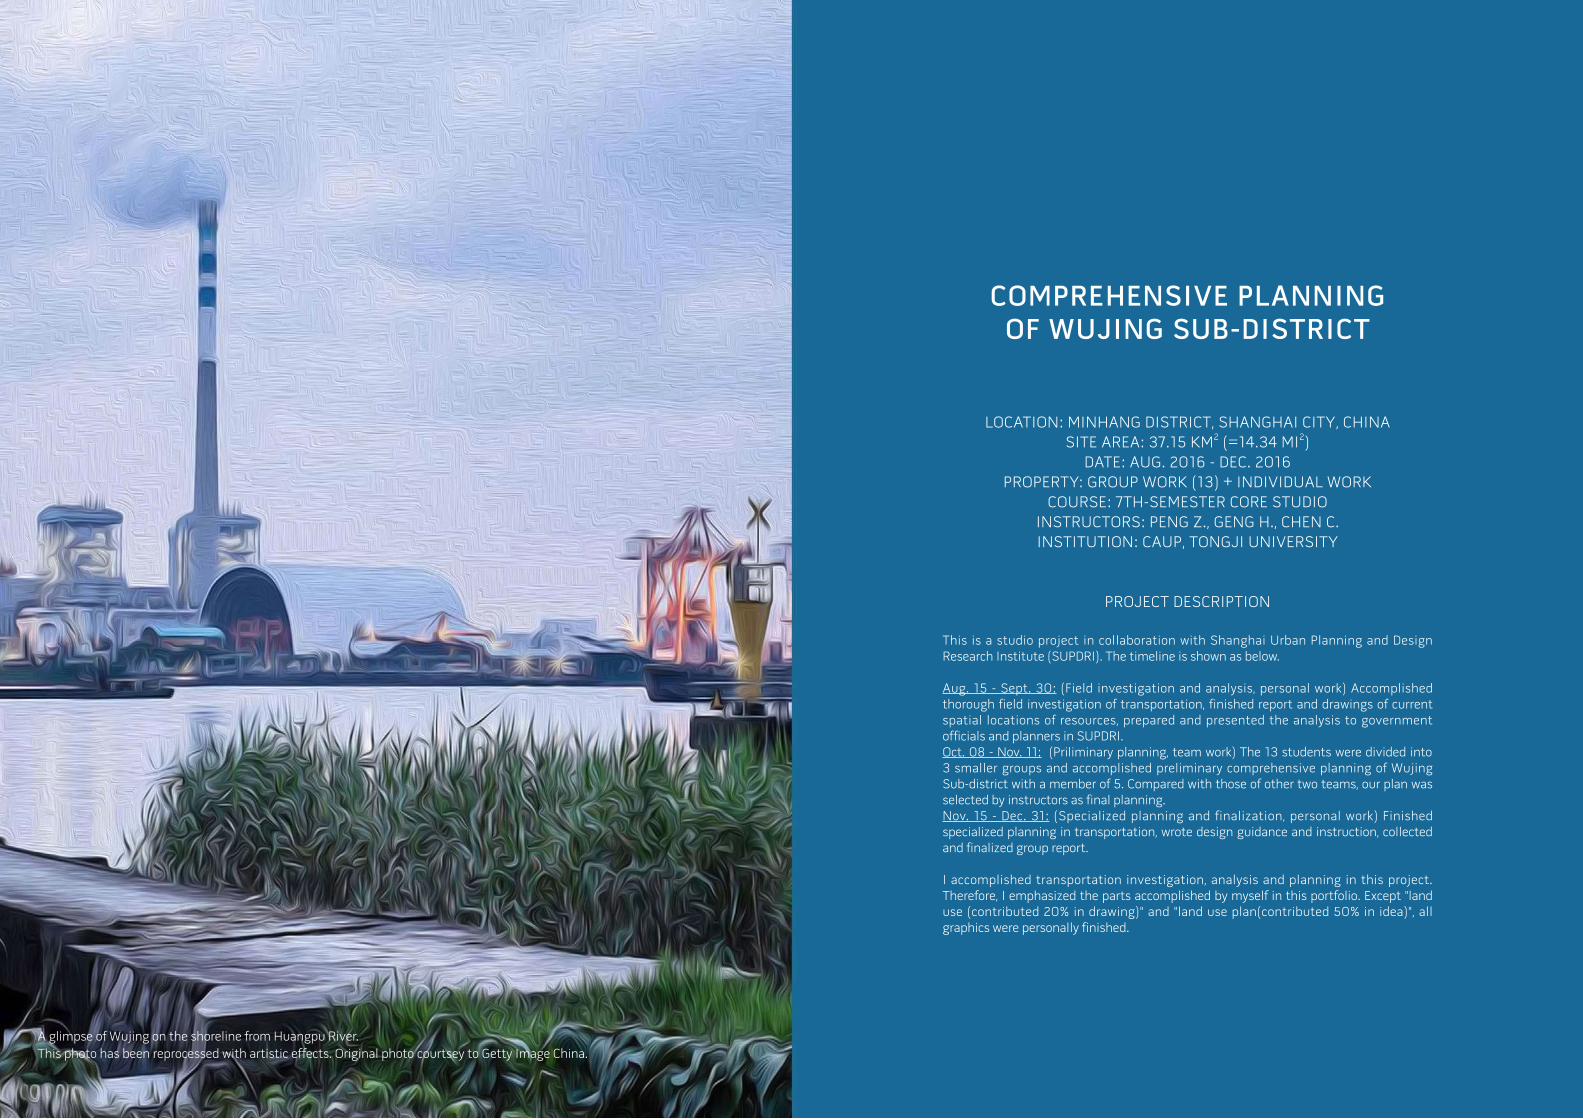
A glimpse of Wujing on the shoreline from Huangpu River.
This photo has been reprocessed with artistic effects. Original photo courtsey to Getty Image China.
COMPREHENSIVE PLANNING OF WUJING SUB-DISTRICT
LOCATION: MINHANG DISTRICT, SHANGHAI CITY, CHINA
SITE AREA: 37.15 KM2 (=14.34 MI2)
DATE: AUG. 2016 - DEC. 2016
PROPERTY: GROUP WORK (13) + INDIVIDUAL WORK
COURSE: 7TH-SEMESTER CORE STUDIO
INSTRUCTORS: PENG Z., GENG H., CHEN C.
INSTITUTION: CAUP, TONGJI UNIVERSITY
PROJECT DESCRIPTION
This is a studio project in collaboration with Shanghai Urban Planning and Design Research Institute (SUPDRI). The timeline is shown as below.
Aug. 15 - Sept. 30: (Field investigation and analysis, personal work) Accomplished thorough field investigation of transportation, finished report and drawings of current spatial locations of resources, prepared and presented the analysis to government officials and planners in SUPDRI.Oct. 08 - Nov. 11: (Priliminary planning, team work) The 13 students were divided into 3 smaller groups and accomplished preliminary comprehensive planning of Wujing Sub-district with a member of 5. Compared with those of other two teams, our plan was selected by instructors as final planning.Nov. 15 - Dec. 31: (Specialized planning and finalization, personal work) Finished specialized planning in transportation, wrote design guidance and instruction, collected and finalized group report.
I accomplished transportation investigation, analysis and planning in this project. Therefore, I emphasized the parts accomplished by myself in this portfolio. Except "land use (contributed 20% in drawing)" and "land use plan(contributed 50% in idea)", all graphics were personally finished.
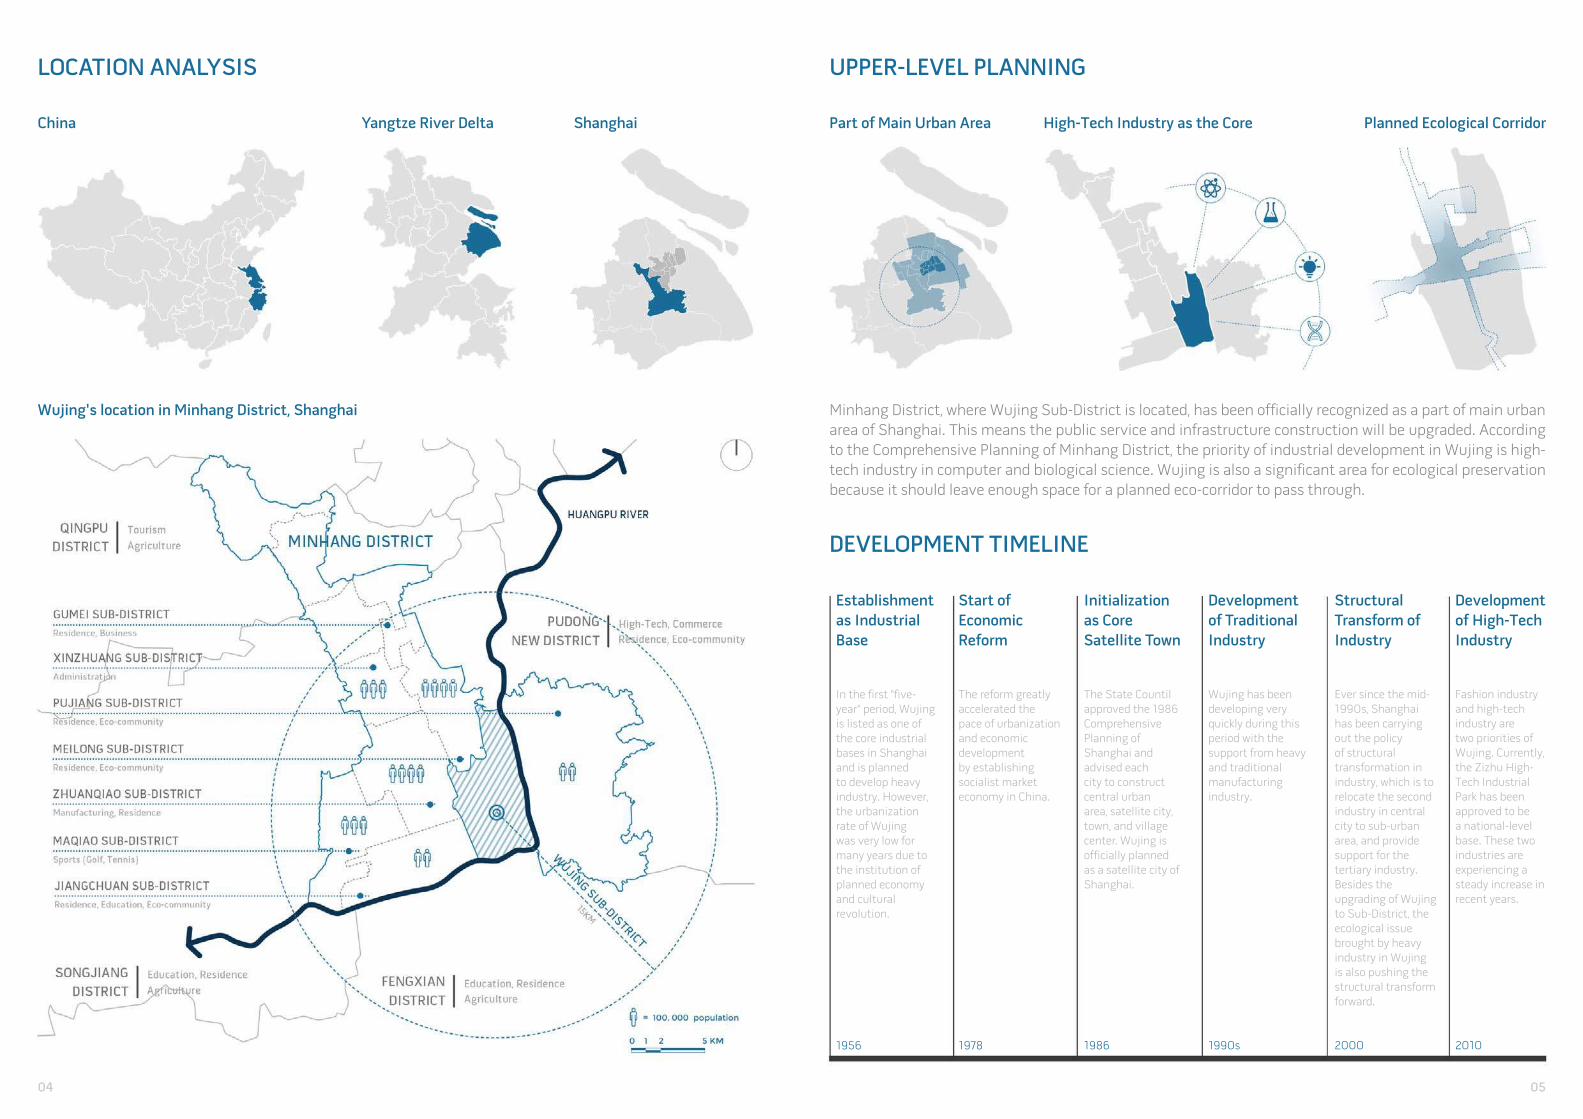
LOCATION ANALYSIS
China Yangtze River Delta Shanghai
Wujing's location in Minhang District, Shanghai
UPPER-LEVEL PLANNING
Part of Main Urban Area High-Tech Industry as the Core Planned Ecological Corridor
Establishment
as Industrial
Base
Start of
Economic
Reform
Initialization
as Core
Satellite Town
Development
of Traditional
Industry
Development
of High-Tech
Industry
Structural
Transform of
Industry
DEVELOPMENT TIMELINE
Minhang District, where Wujing Sub-District is located, has been officially recognized as a part of main urban
area of Shanghai. This means the public service and infrastructure construction will be upgraded. According
to the Comprehensive Planning of Minhang District, the priority of industrial development in Wujing is high-
tech industry in computer and biological science. Wujing is also a significant area for ecological preservation
because it should leave enough space for a planned eco-corridor to pass through.
In the first "five-year" period, Wujing is listed as one of the core industrial bases in Shanghai and is planned to develop heavy industry. However, the urbanization rate of Wujing was very low for many years due to the institution of planned economy and cultural revolution.
1956
The reform greatly accelerated the pace of urbanization and economic development by establishing socialist market economy in China.
1978
The State Countil approved the 1986 Comprehensive Planning of Shanghai and advised each city to construct central urban area, satellite city, town, and village center. Wujing is officially planned as a satellite city of Shanghai.
1986
Wujing has been developing very quickly during this period with the support from heavy and traditional manufacturing industry.
1990s
Ever since the mid-1990s, Shanghai has been carrying out the policy of structural transformation in industry, which is to relocate the second industry in central city to sub-urban area, and provide support for the tertiary industry. Besides the upgrading of Wujing to Sub-District, the ecological issue brought by heavy industry in Wujing is also pushing the structural transform forward.
2000
Fashion industry and high-tech industry are two priorities of Wujing. Currently, the Zizhu High-Tech Industrial Park has been approved to be a national-level base. These two industries are experiencing a steady increase in recent years.
2010
04 05
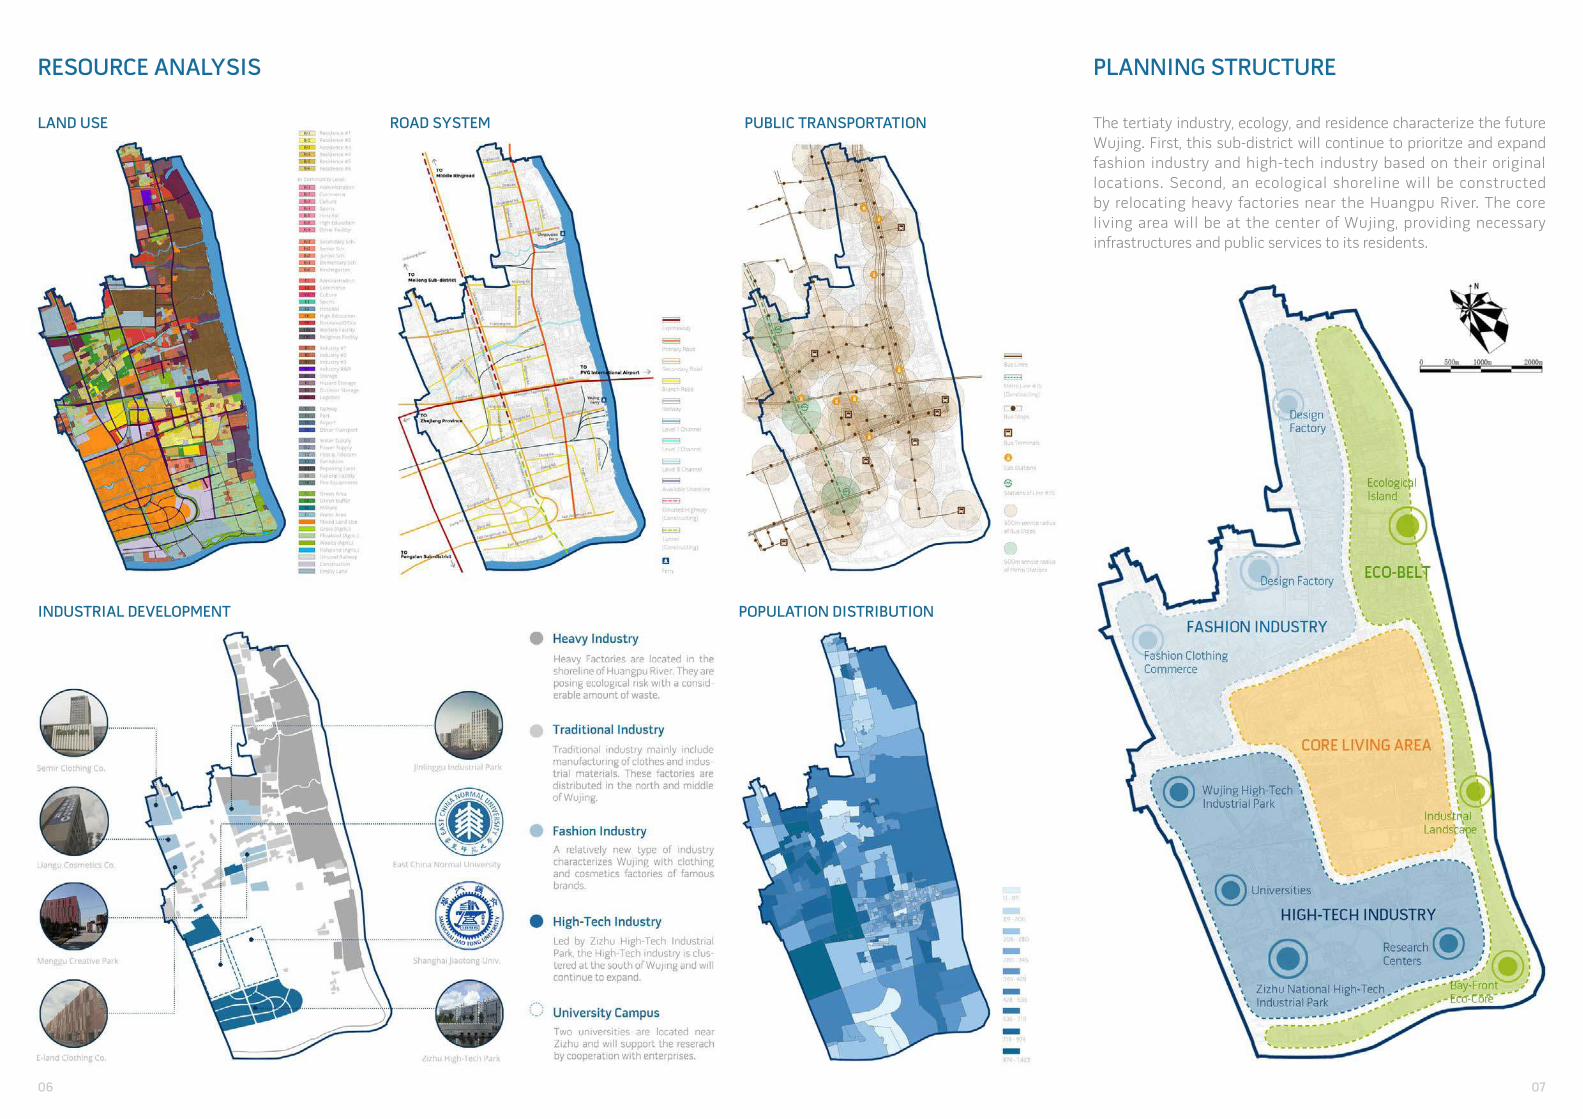
RESOURCE ANALYSIS
LAND USE ROAD SYSTEM PUBLIC TRANSPORTATION
INDUSTRIAL DEVELOPMENT POPULATION DISTRIBUTION
PLANNING STRUCTURE
The tertiaty industry, ecology, and residence characterize the future
Wujing. First, this sub-district will continue to prioritze and expand
fashion industry and high-tech industry based on their original
locations. Second, an ecological shoreline will be constructed
by relocating heavy factories near the Huangpu River. The core
living area will be at the center of Wujing, providing necessary
infrastructures and public services to its residents.
06 07
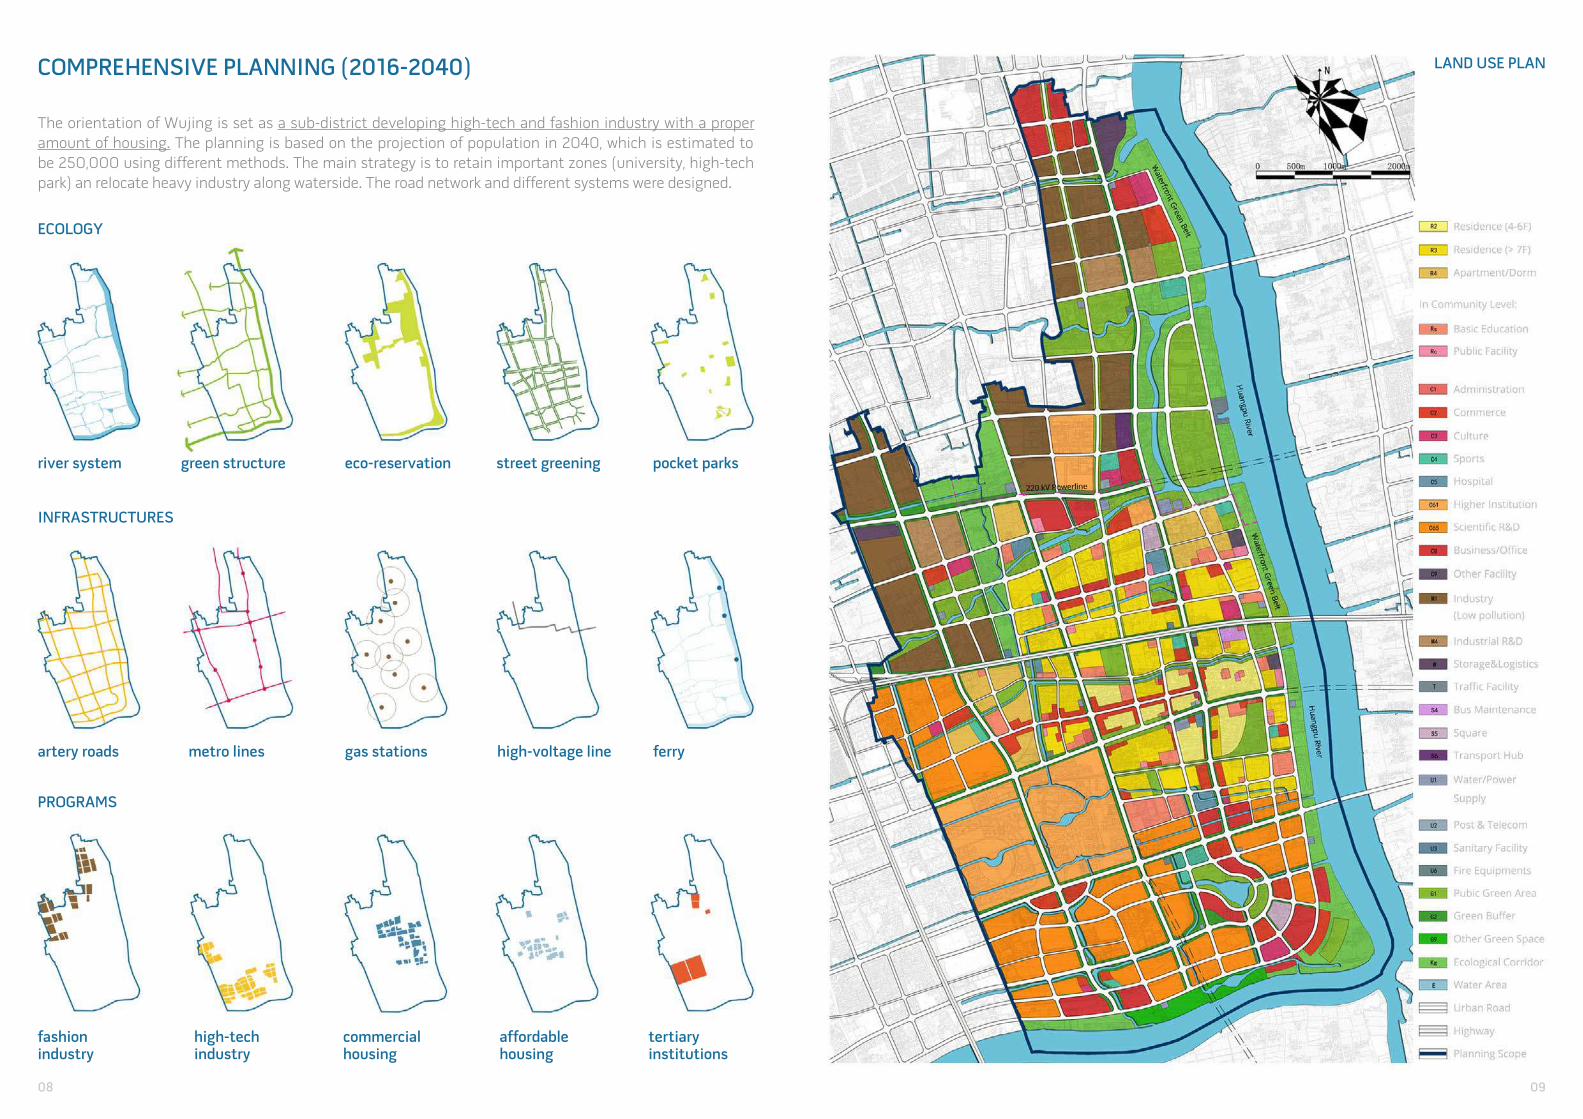
COMPREHENSIVE PLANNING (2016-2040)
The orientation of Wujing is set as a sub-district developing high-tech and fashion industry with a proper
amount of housing. The planning is based on the projection of population in 2040, which is estimated to
be 250,000 using different methods. The main strategy is to retain important zones (university, high-tech
park) an relocate heavy industry along waterside. The road network and different systems were designed.
ECOLOGY
river system green structure eco-reservation street greening pocket parks
INFRASTRUCTURES
artery roads metro lines gas stations high-voltage line ferry
PROGRAMS
fashion industry
high-techindustry
commercialhousing
affordablehousing
tertiaryinstitutions
LAND USE PLAN
08 09
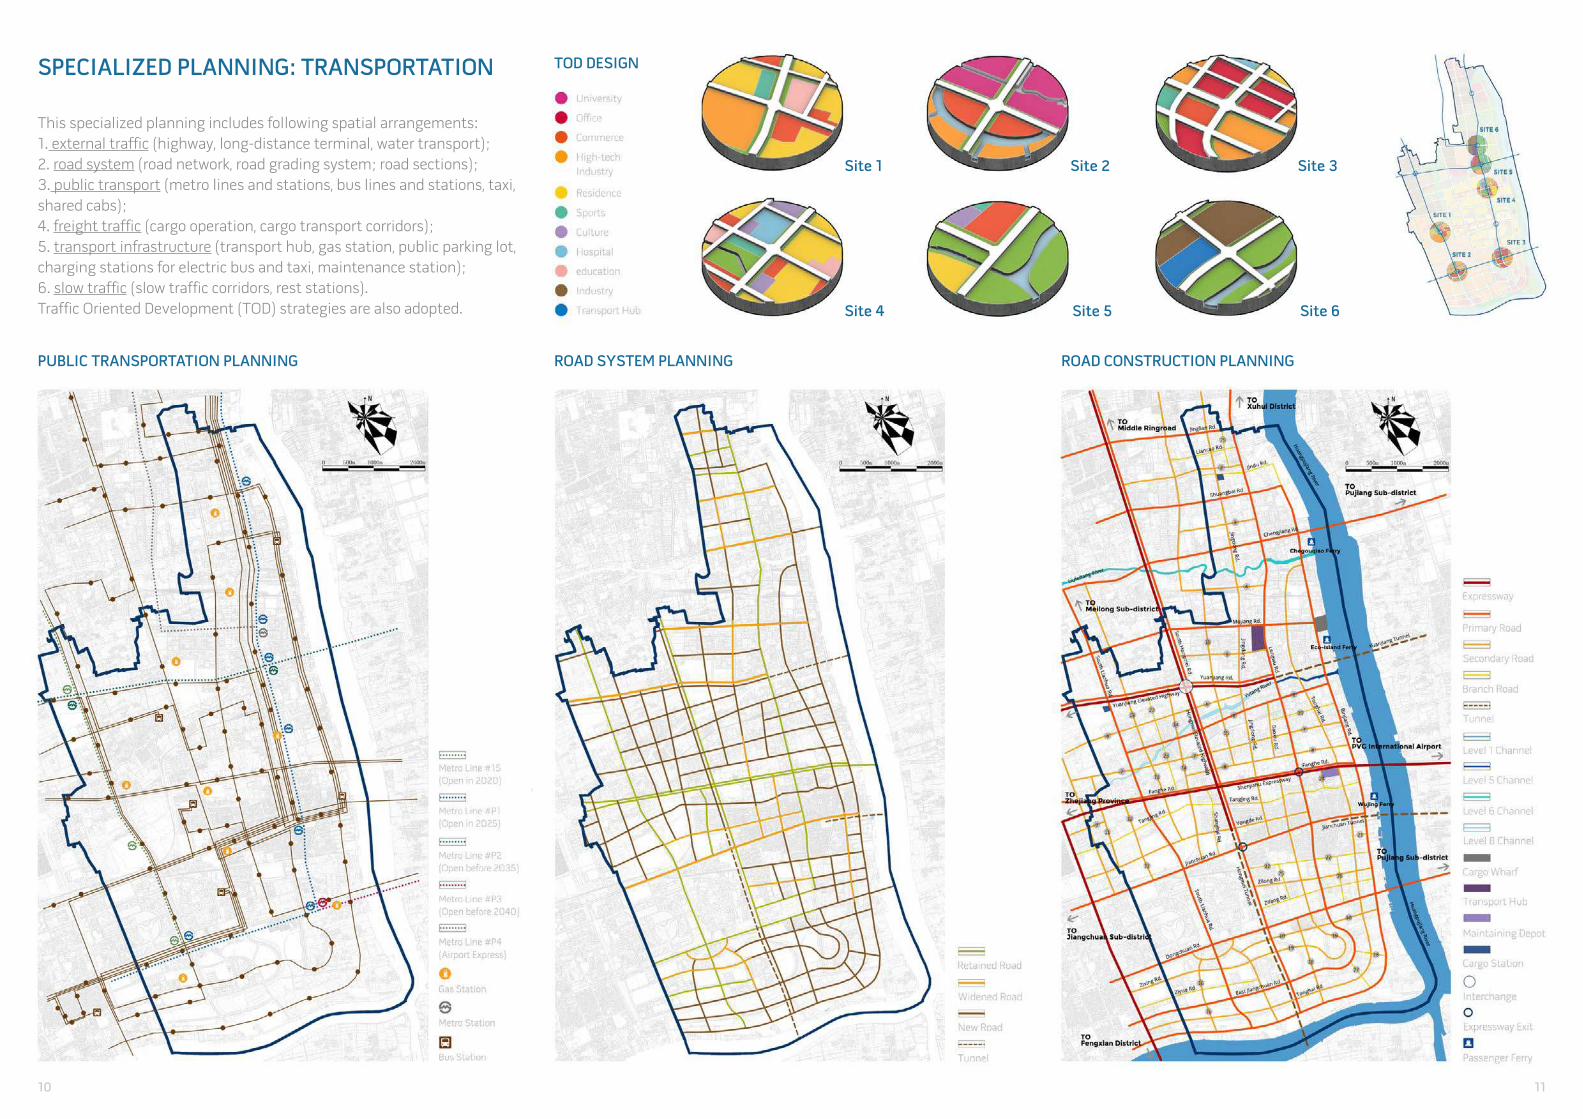
SPECIALIZED PLANNING: TRANSPORTATION
This specialized planning includes following spatial arrangements:
1. external traffic (highway, long-distance terminal, water transport);
2. road system (road network, road grading system; road sections);
3. public transport (metro lines and stations, bus lines and stations, taxi,
shared cabs);
4. freight traffic (cargo operation, cargo transport corridors);
5. transport infrastructure (transport hub, gas station, public parking lot,
charging stations for electric bus and taxi, maintenance station);
6. slow traffic (slow traffic corridors, rest stations).
Traffic Oriented Development (TOD) strategies are also adopted.
TOD DESIGN
ROAD SYSTEM PLANNINGPUBLIC TRANSPORTATION PLANNING ROAD CONSTRUCTION PLANNING
Site 1 Site 2 Site 3
Site 4 Site 5 Site 6
10 11
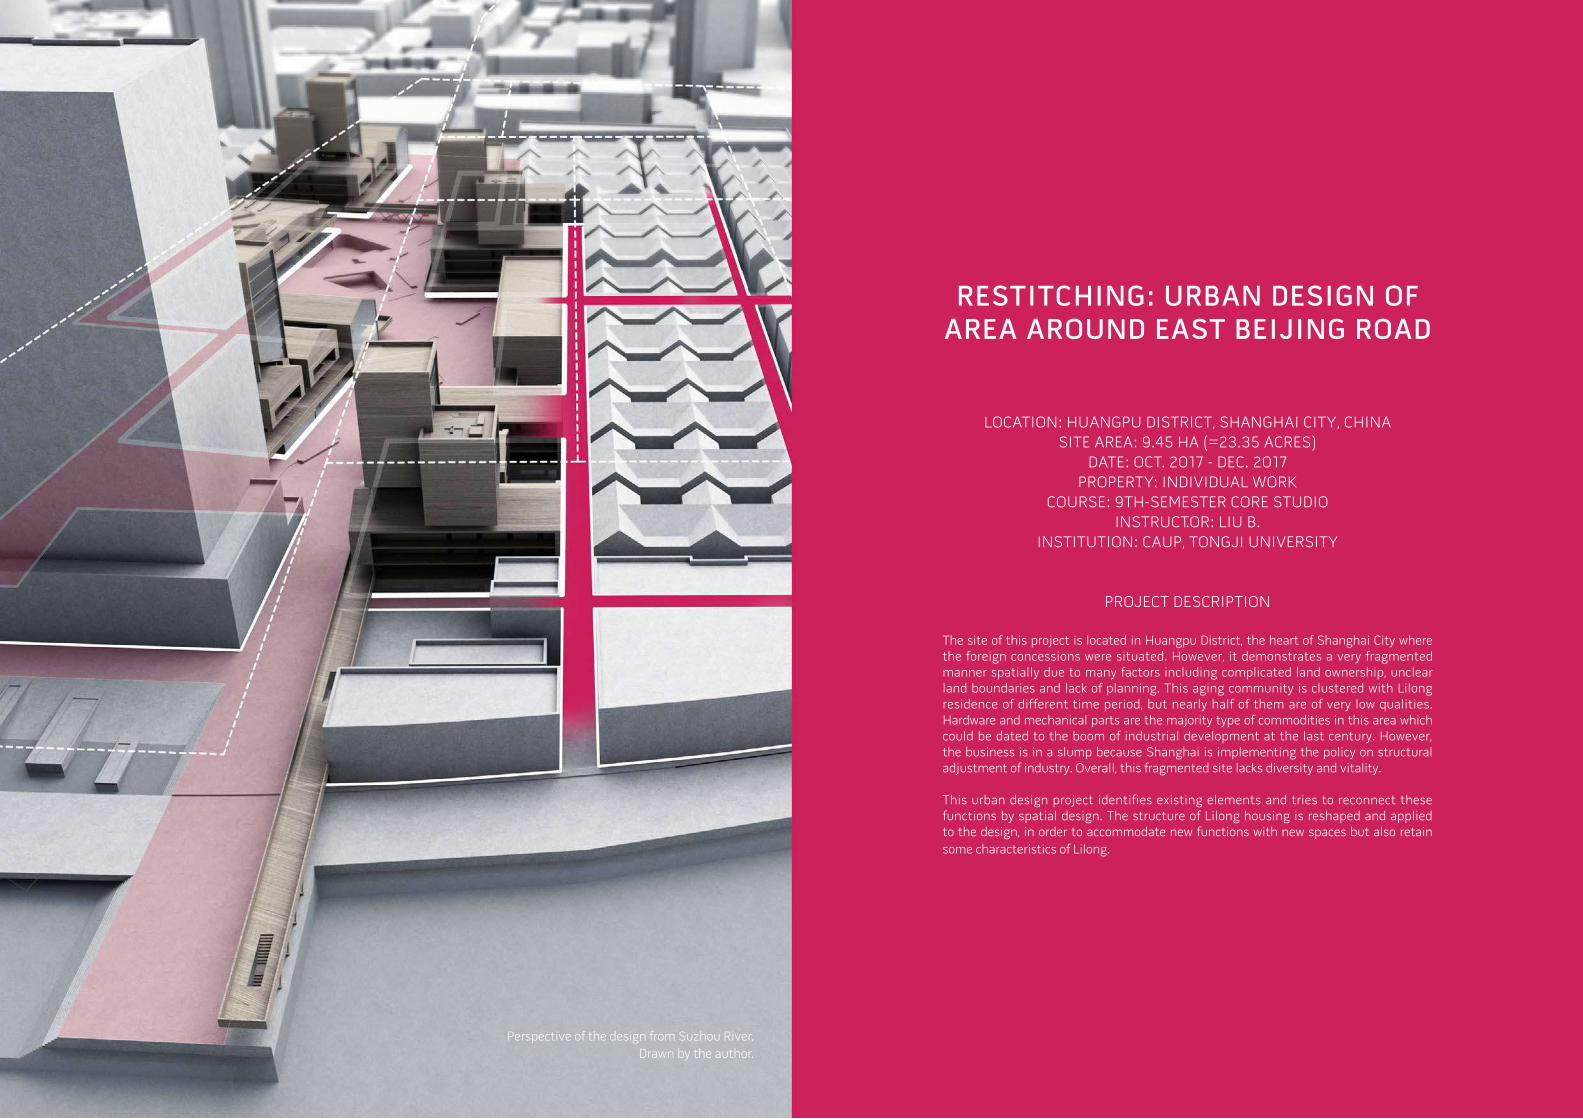
Perspective of the design from Suzhou River.
Drawn by the author.
RESTITCHING: URBAN DESIGN OF AREA AROUND EAST BEIJING ROAD
LOCATION: HUANGPU DISTRICT, SHANGHAI CITY, CHINA
SITE AREA: 9.45 HA (=23.35 ACRES)
DATE: OCT. 2017 - DEC. 2017
PROPERTY: INDIVIDUAL WORK
COURSE: 9TH-SEMESTER CORE STUDIO
INSTRUCTOR: LIU B.
INSTITUTION: CAUP, TONGJI UNIVERSITY
PROJECT DESCRIPTION
.
The site of this project is located in Huangpu District, the heart of Shanghai City where the foreign concessions were situated. However, it demonstrates a very fragmented manner spatially due to many factors including complicated land ownership, unclear land boundaries and lack of planning. This aging community is clustered with Lilong residence of different time period, but nearly half of them are of very low qualities. Hardware and mechanical parts are the majority type of commodities in this area which could be dated to the boom of industrial development at the last century. However, the business is in a slump because Shanghai is implementing the policy on structural adjustment of industry. Overall, this fragmented site lacks diversity and vitality.
This urban design project identifies existing elements and tries to reconnect these functions by spatial design. The structure of Lilong housing is reshaped and applied to the design, in order to accommodate new functions with new spaces but also retain
some characteristics of Lilong.
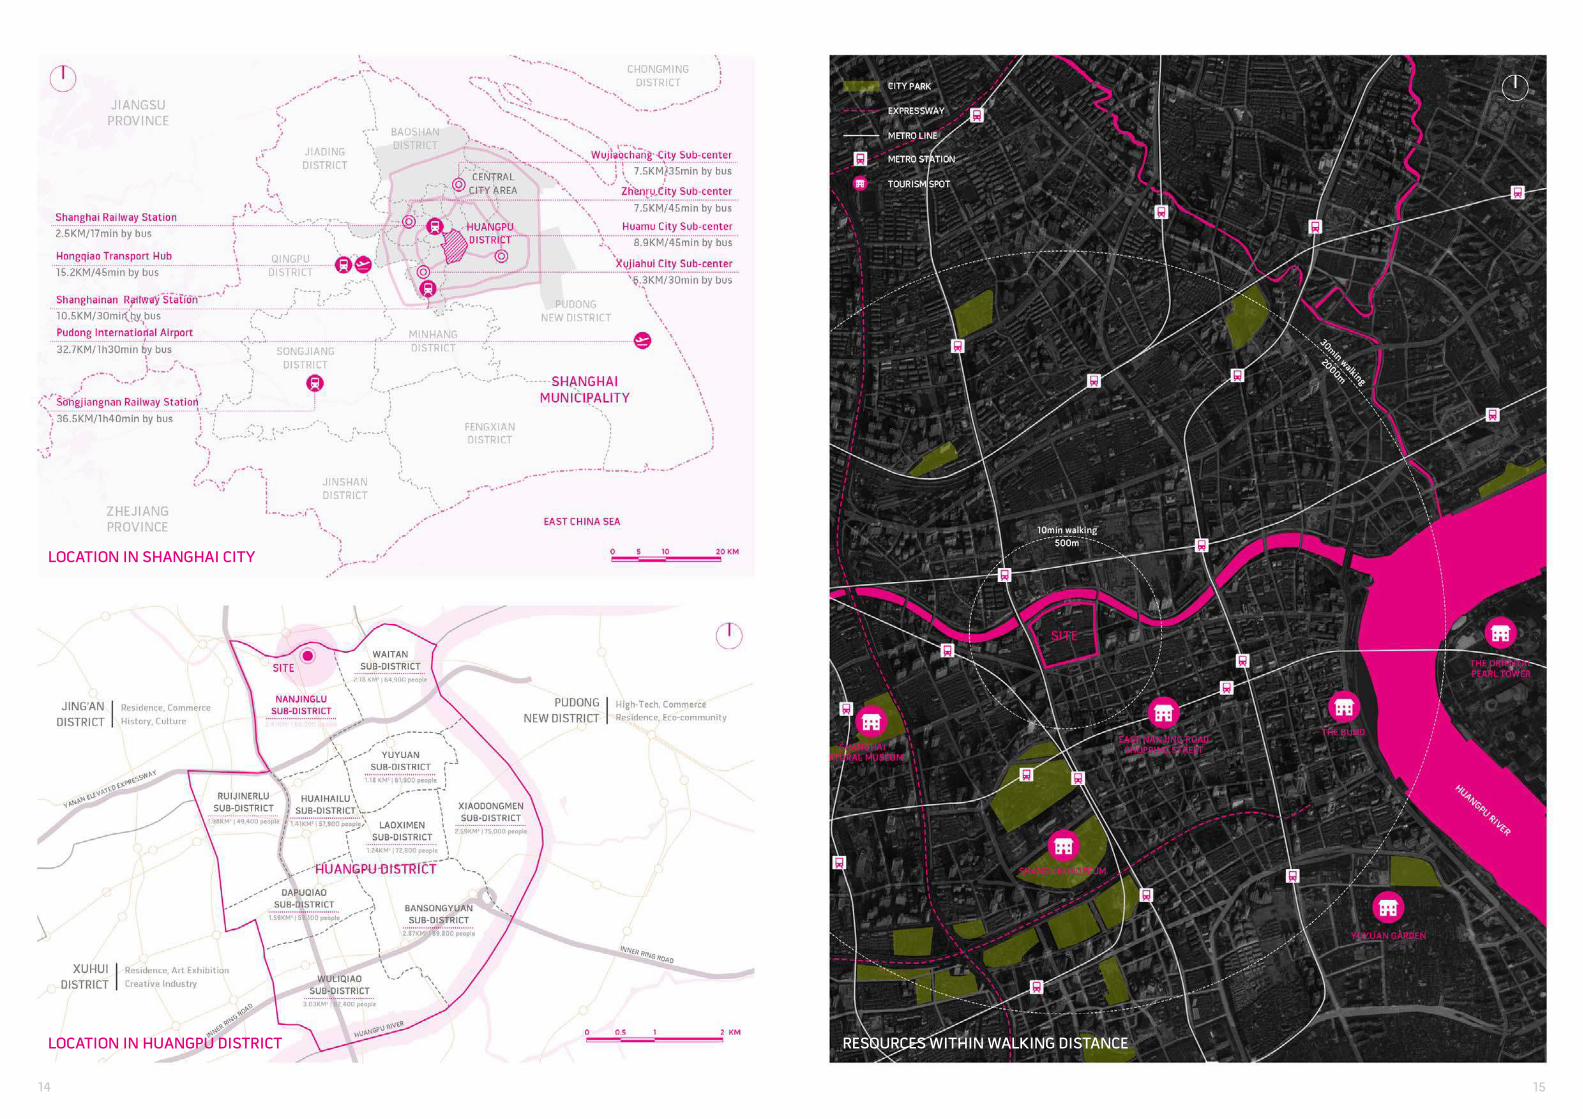
LOCATION IN SHANGHAI CITY
LOCATION IN HUANGPU DISTRICT RESOURCES WITHIN WALKING DISTANCE
14 15
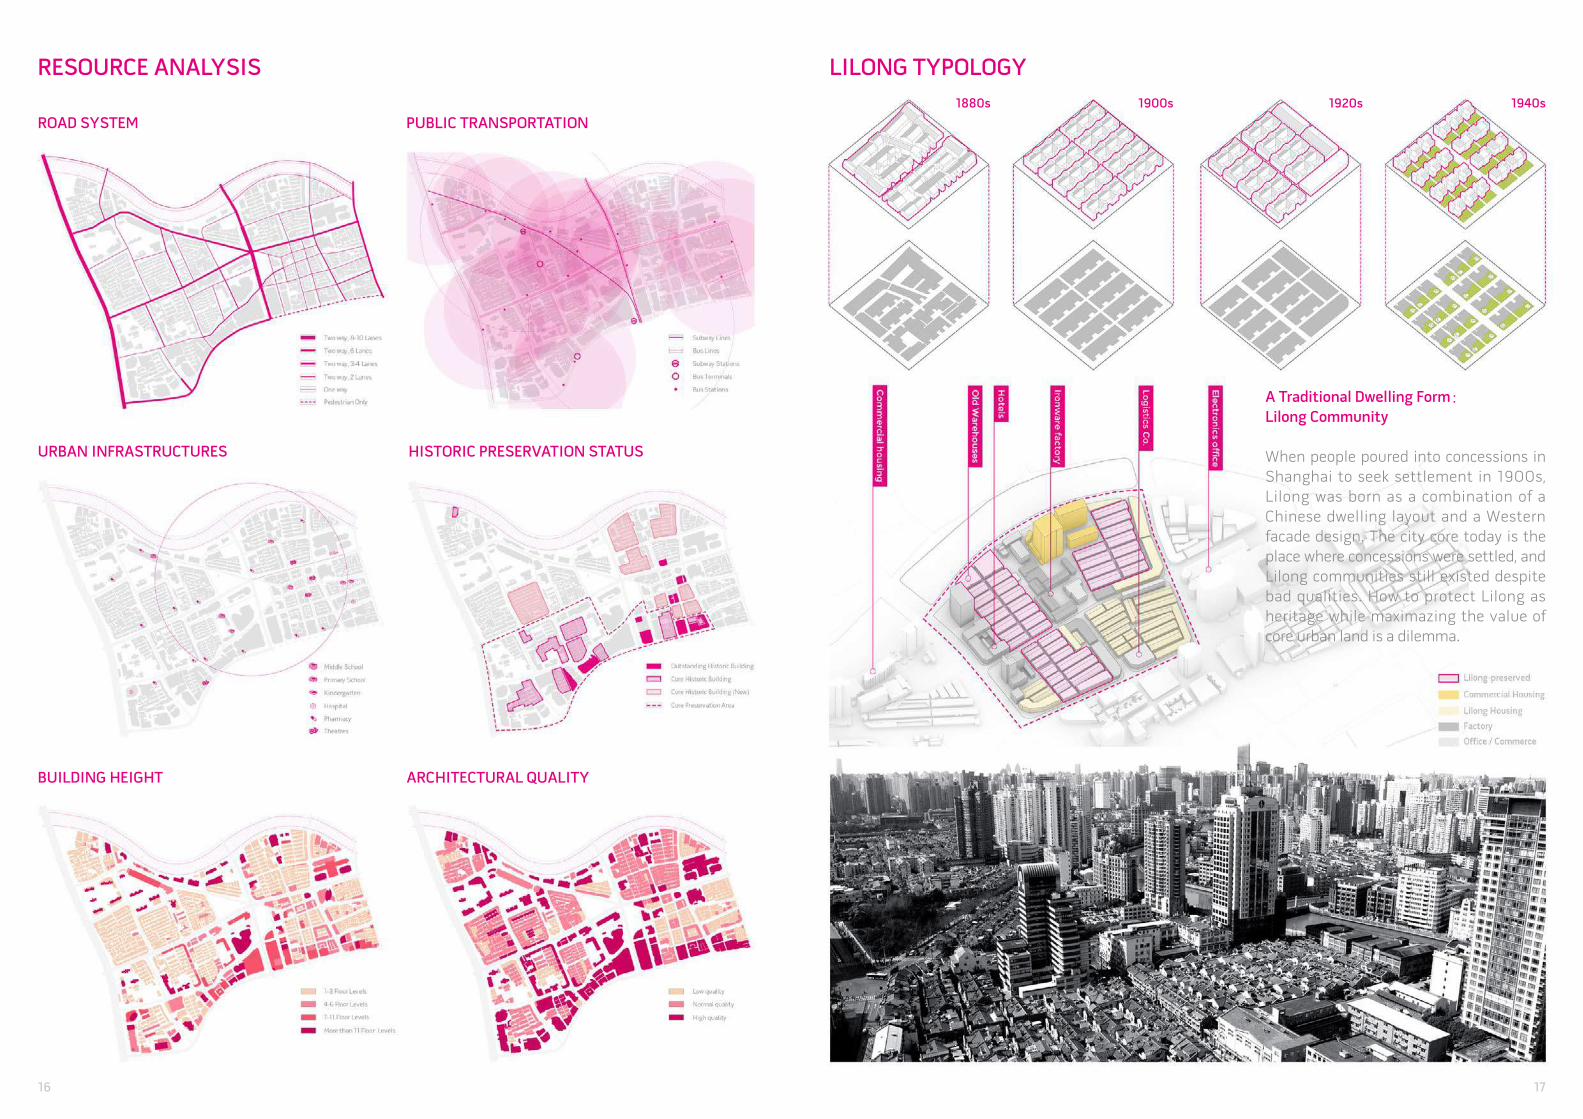
RESOURCE ANALYSIS
ROAD SYSTEM PUBLIC TRANSPORTATION
URBAN INFRASTRUCTURES HISTORIC PRESERVATION STATUS
BUILDING HEIGHT ARCHITECTURAL QUALITY
LILONG TYPOLOGY
1880s 1900s 1920s 1940s
A Traditional Dwelling Form:Lilong Community
When people poured into concessions in
Shanghai to seek settlement in 1900s,
Lilong was born as a combination of a
Chinese dwelling layout and a Western
facade design. The city core today is the
place where concessions were settled, and
Lilong communities still existed despite
bad qualities. How to protect Lilong as
heritage while maximazing the value of
core urban land is a dilemma.
16 17
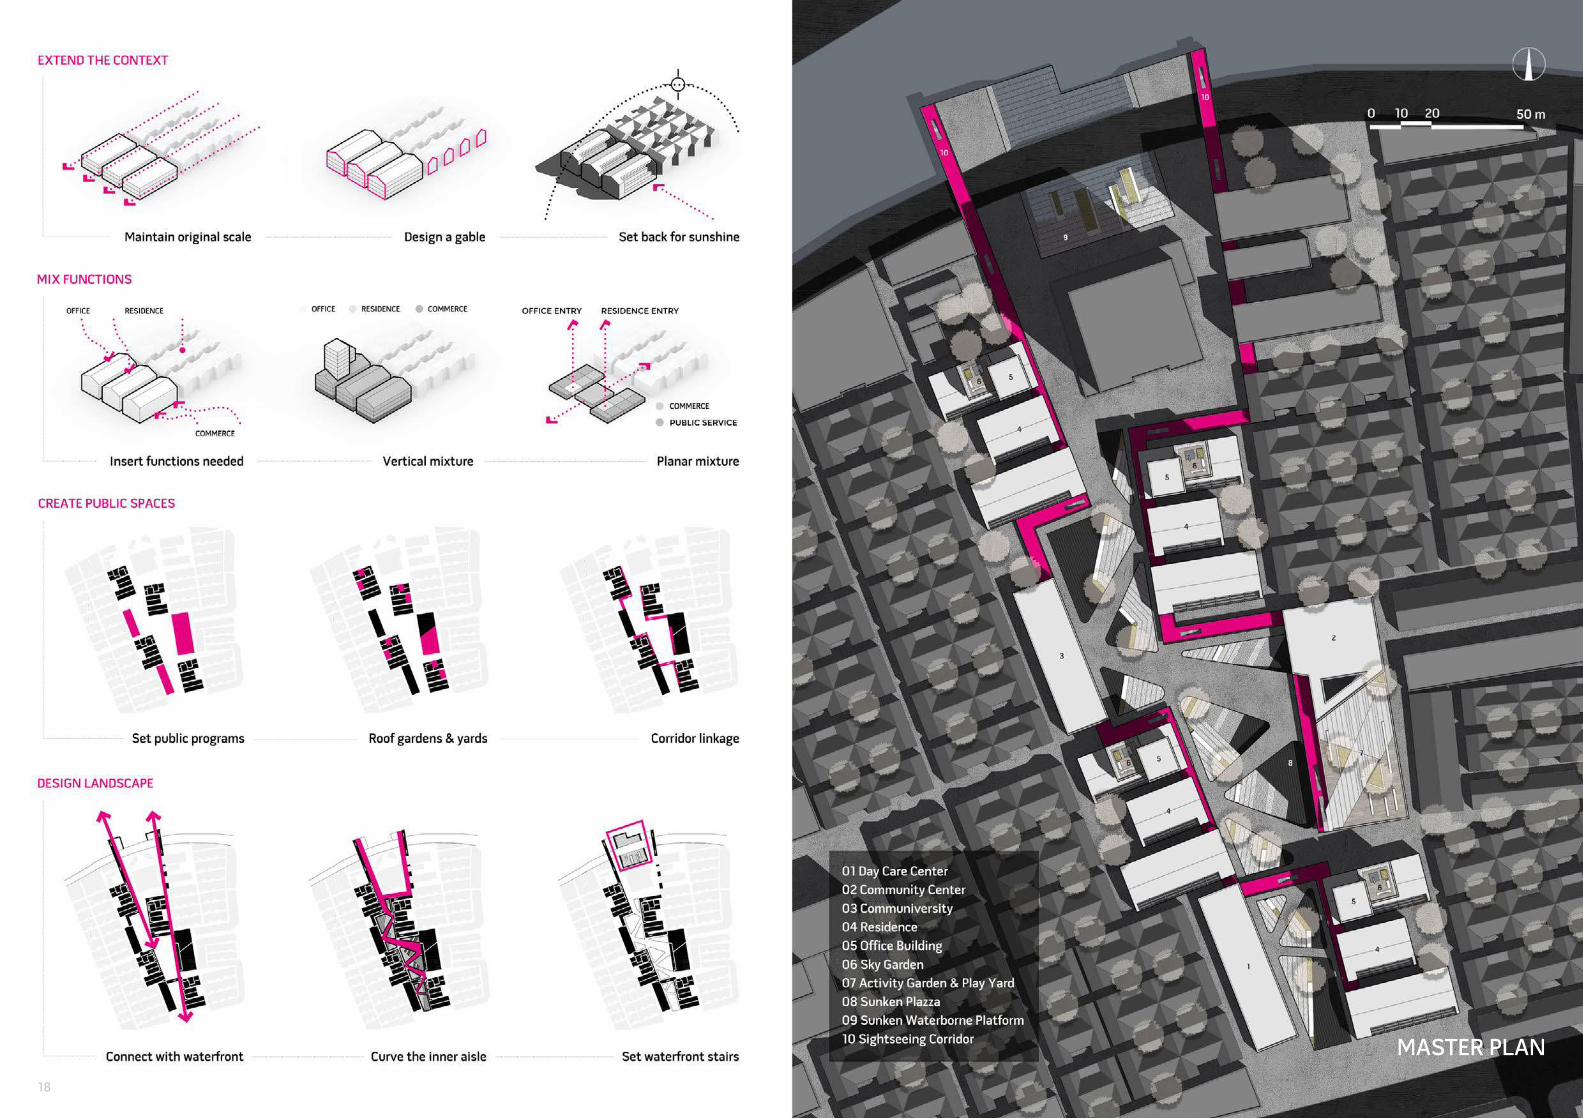
MASTER PLAN
18
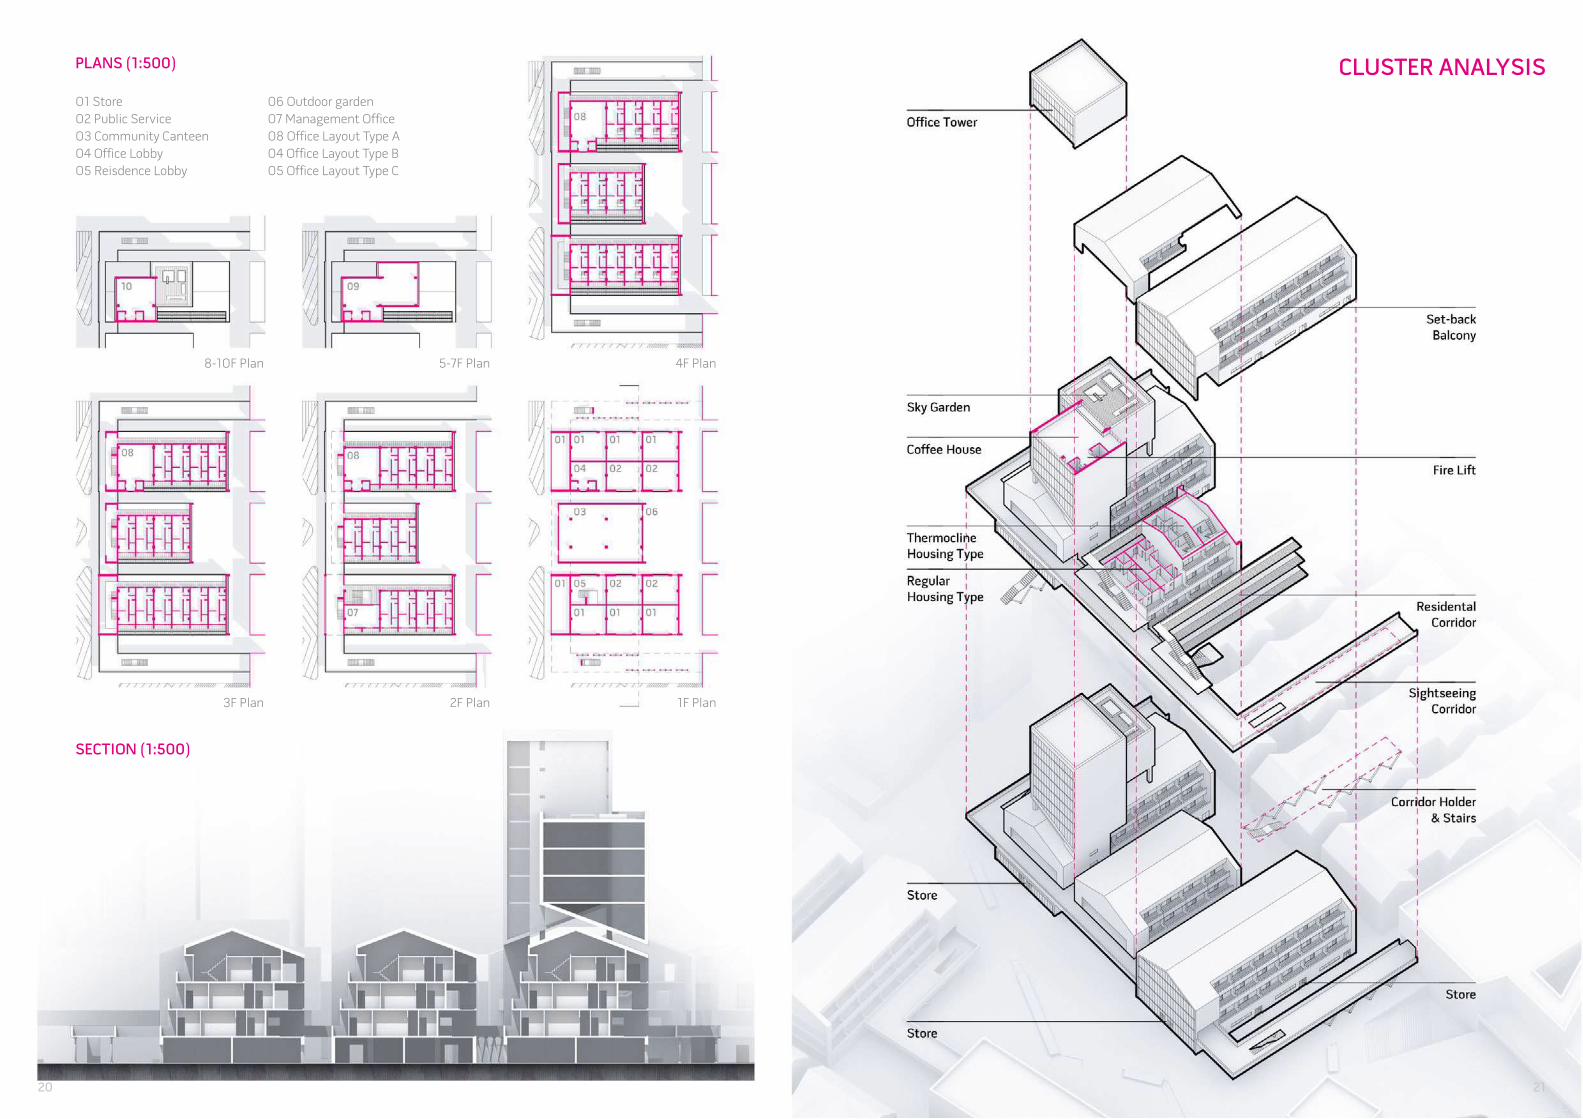
01 Store
02 Public Service
03 Community Canteen
04 Office Lobby
05 Reisdence Lobby
06 Outdoor garden
07 Management Office
08 Office Layout Type A
04 Office Layout Type B
05 Office Layout Type C
SECTION (1:500)
PLANS (1:500)
1F Plan2F Plan3F Plan
4F Plan5-7F Plan8-10F Plan
CLUSTER ANALYSIS
20 21
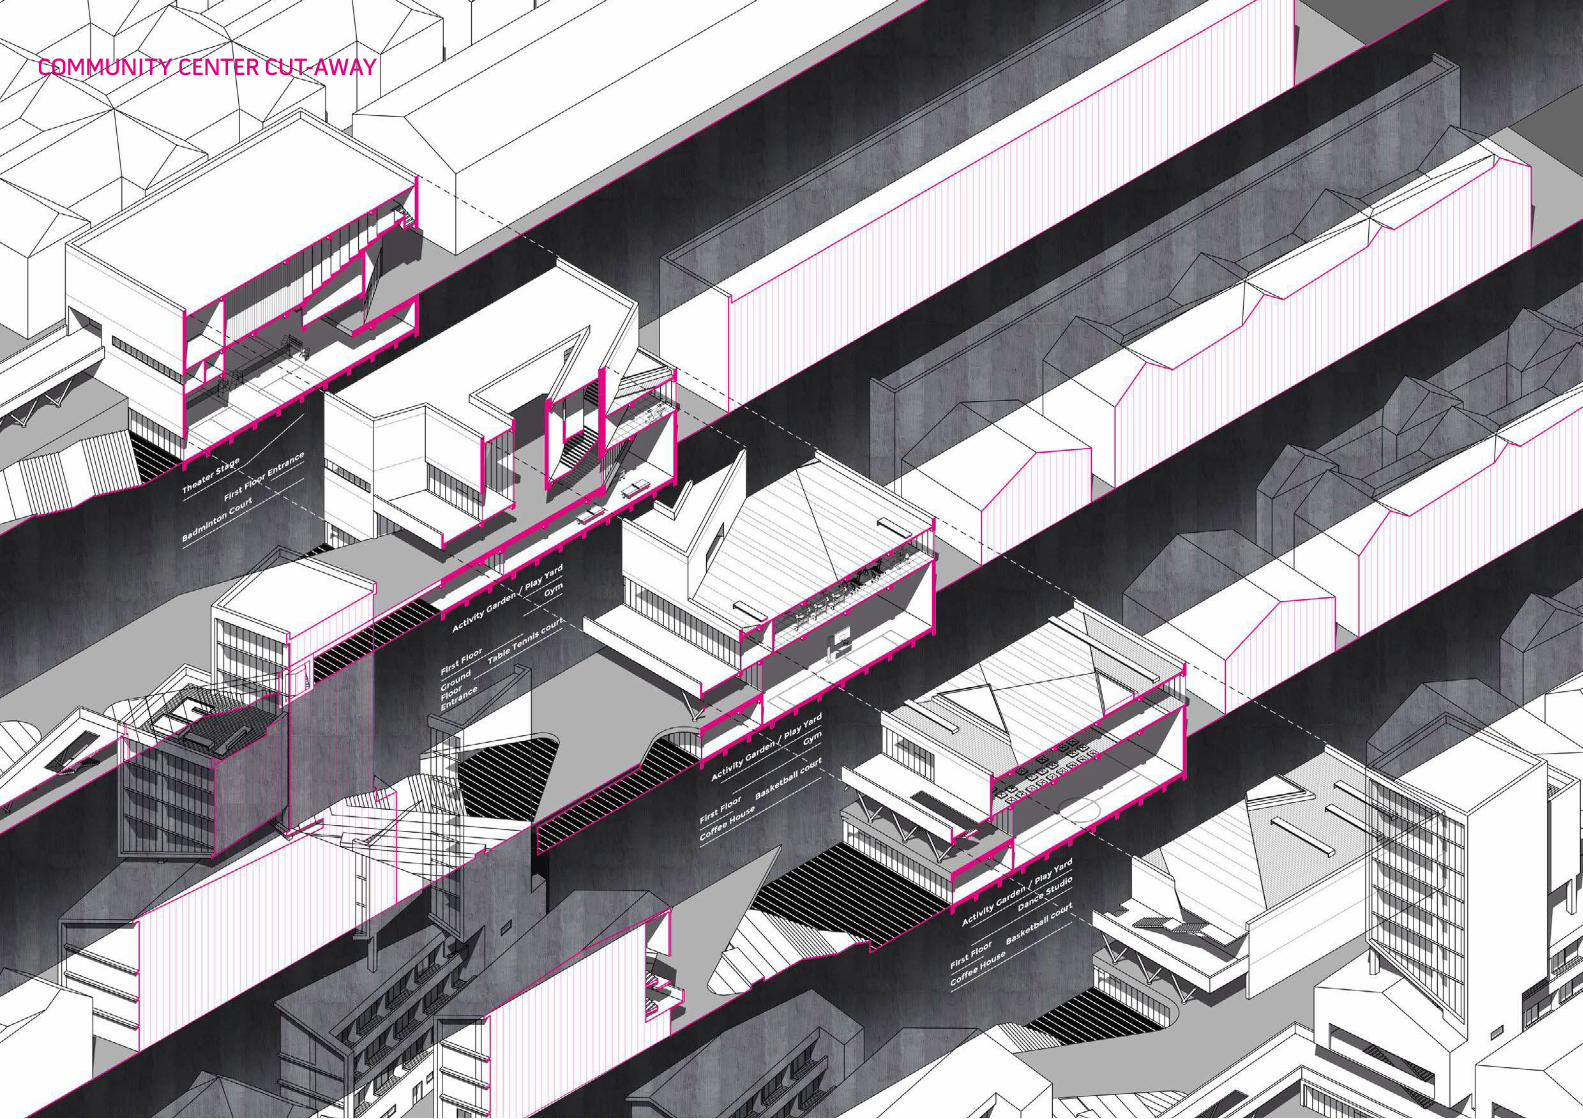
COMMUNITY CENTER CUT-AWAY
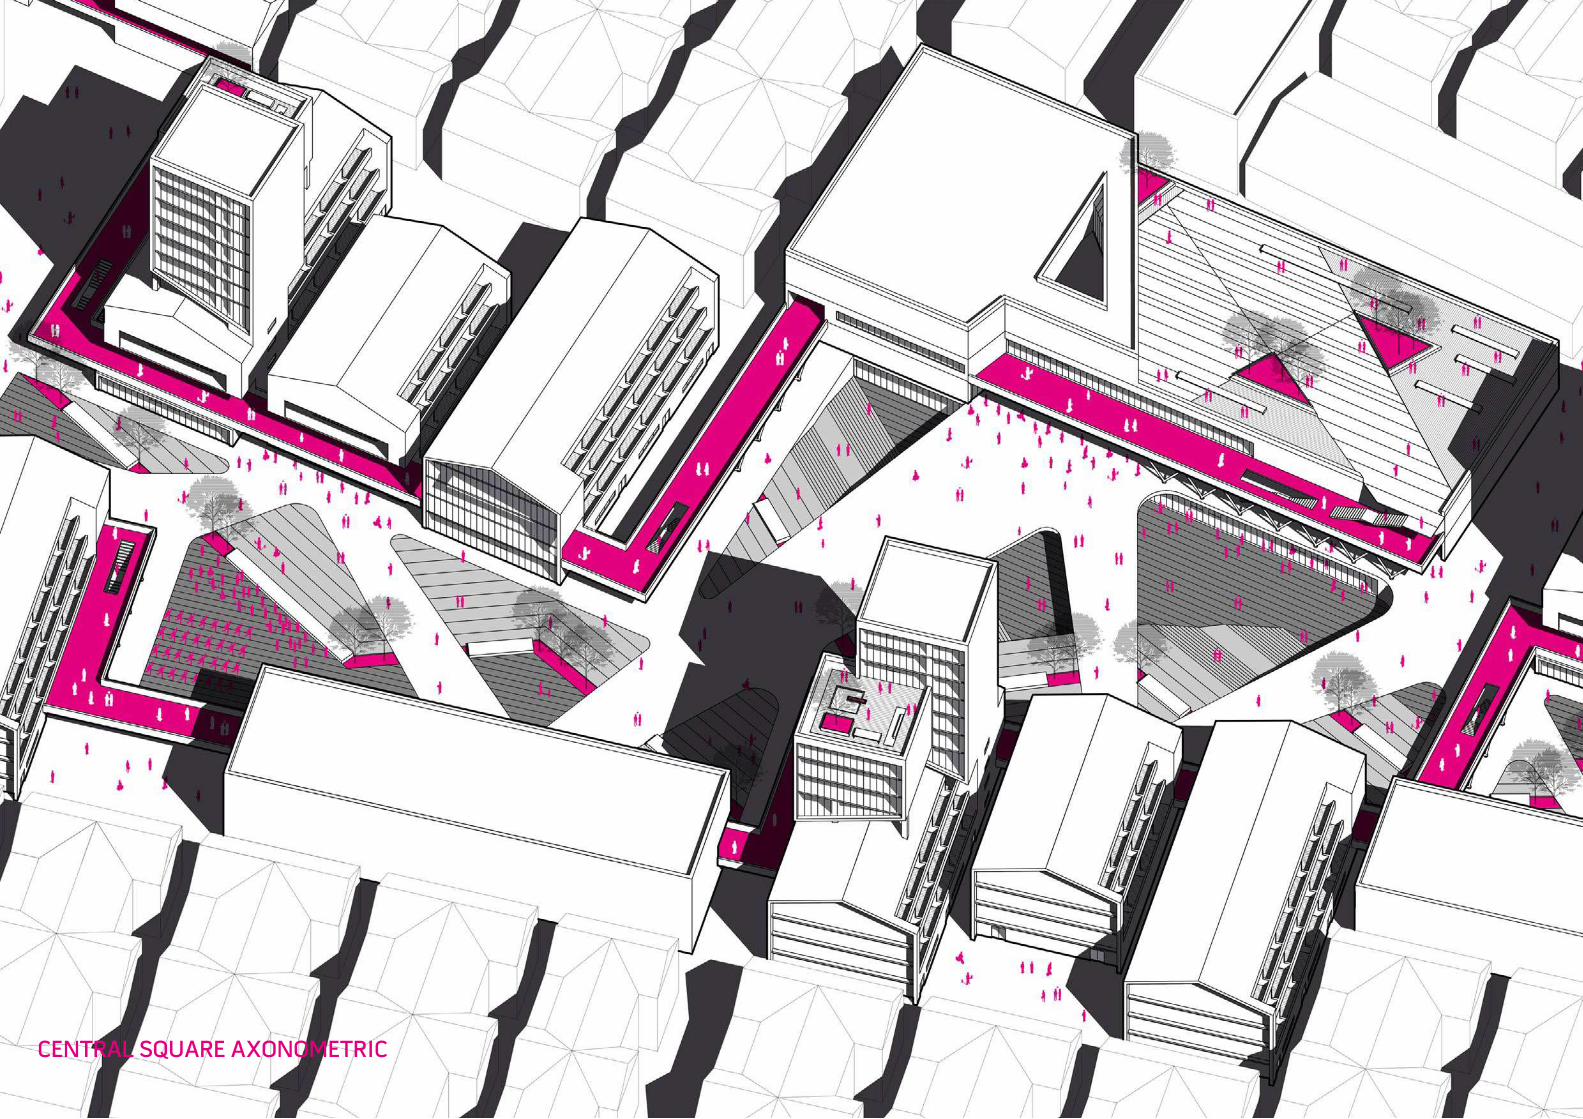
CENTRAL SQUARE AXONOMETRIC
Birdview of the design.
Drawn by the author.
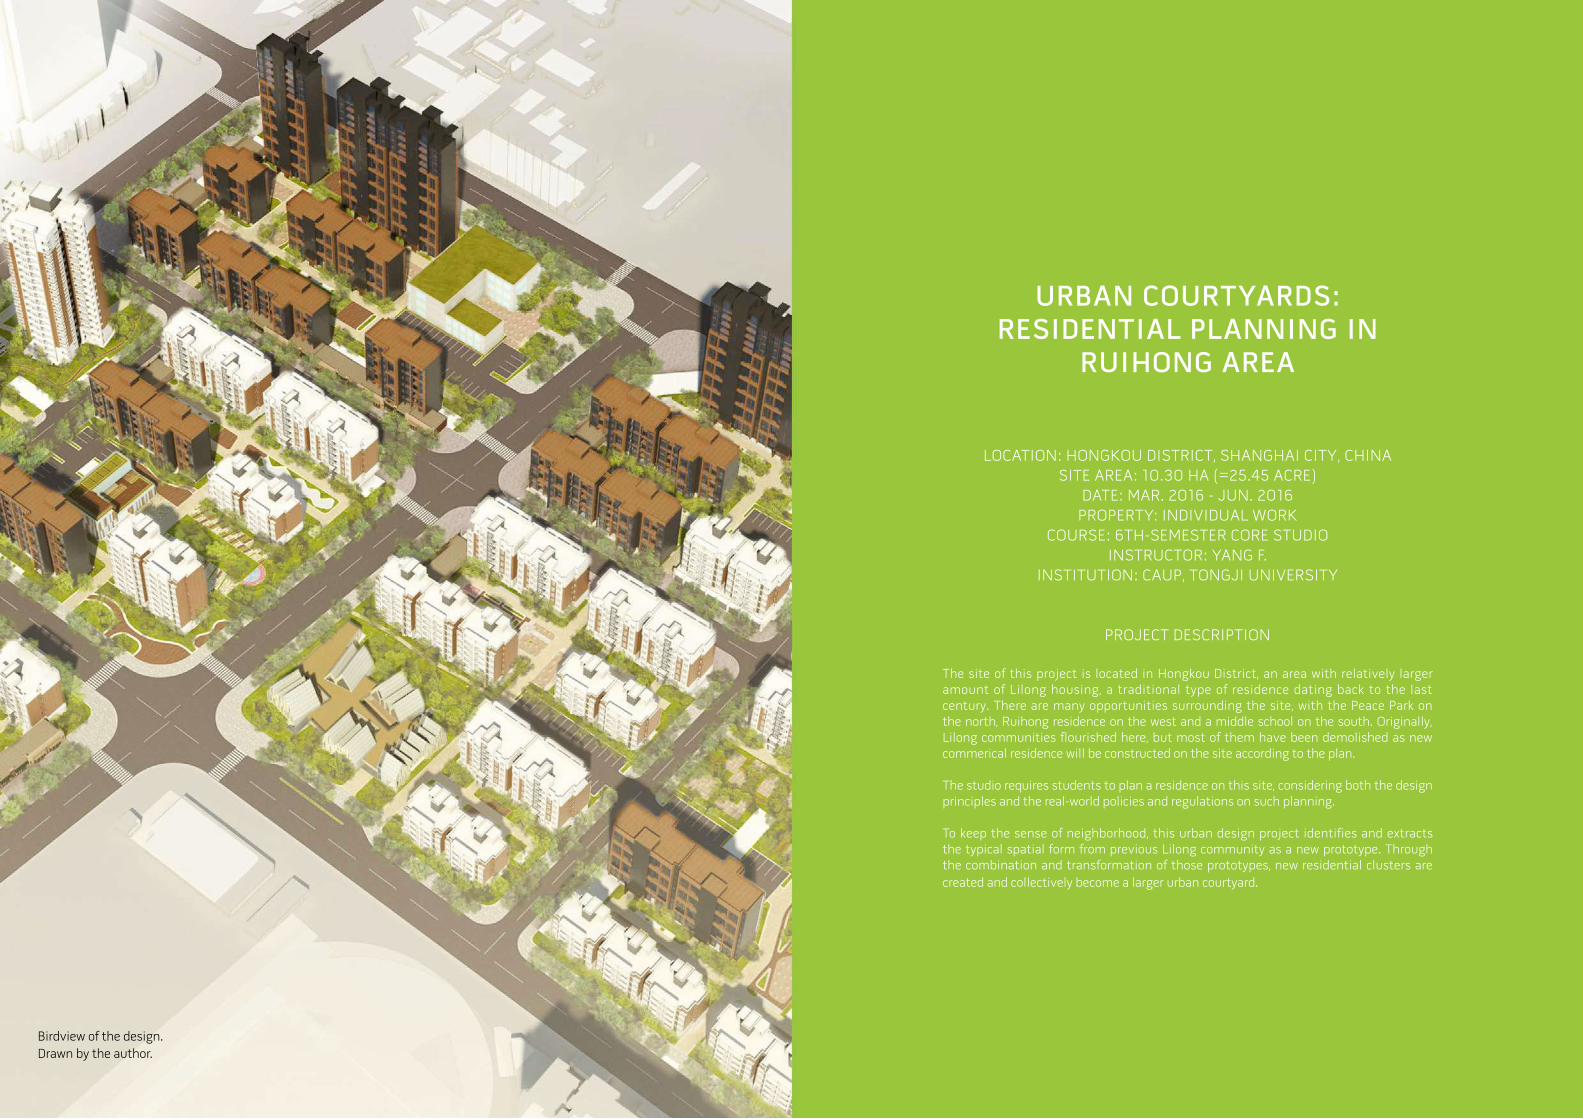
URBAN COURTYARDS: RESIDENTIAL PLANNING IN
RUIHONG AREA
LOCATION: HONGKOU DISTRICT, SHANGHAI CITY, CHINA
SITE AREA: 10.30 HA (=25.45 ACRE)
DATE: MAR. 2016 - JUN. 2016
PROPERTY: INDIVIDUAL WORK
COURSE: 6TH-SEMESTER CORE STUDIO
INSTRUCTOR: YANG F.
INSTITUTION: CAUP, TONGJI UNIVERSITY
PROJECT DESCRIPTION
The site of this project is located in Hongkou District, an area with relatively larger amount of Lilong housing, a traditional type of residence dating back to the last century. There are many opportunities surrounding the site, with the Peace Park on the north, Ruihong residence on the west and a middle school on the south. Originally, Lilong communities flourished here, but most of them have been demolished as new commerical residence will be constructed on the site according to the plan.
The studio requires students to plan a residence on this site, considering both the design principles and the real-world policies and regulations on such planning.
To keep the sense of neighborhood, this urban design project identifies and extracts the typical spatial form from previous Lilong community as a new prototype. Through the combination and transformation of those prototypes, new residential clusters are
created and collectively become a larger urban courtyard.
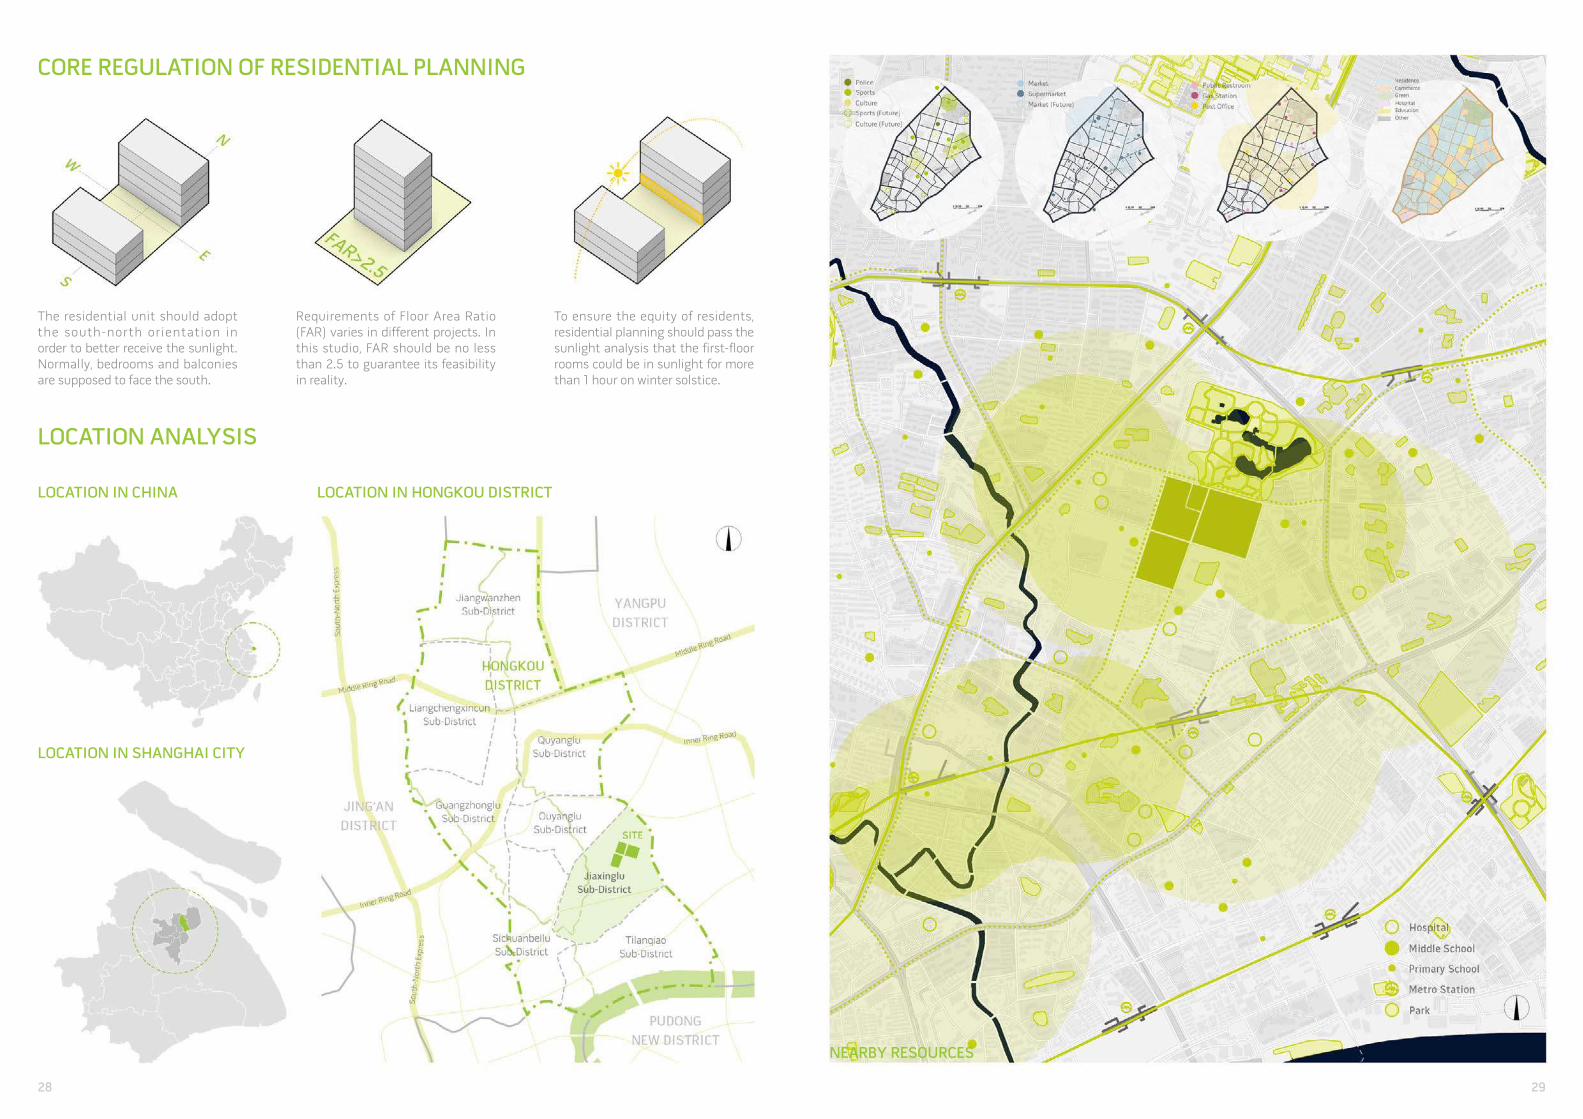
LOCATION ANALYSIS
LOCATION IN CHINA LOCATION IN HONGKOU DISTRICT
LOCATION IN SHANGHAI CITY
CORE REGULATION OF RESIDENTIAL PLANNING
The residential unit should adopt the south-north orientation in order to better receive the sunlight. Normally, bedrooms and balconies are supposed to face the south.
To ensure the equity of residents, residential planning should pass the sunlight analysis that the first-floor rooms could be in sunlight for more than 1 hour on winter solstice.
Requirements of Floor Area Ratio (FAR) varies in different projects. In this studio, FAR should be no less than 2.5 to guarantee its feasibility in reality.
NEARBY RESOURCES
28 29
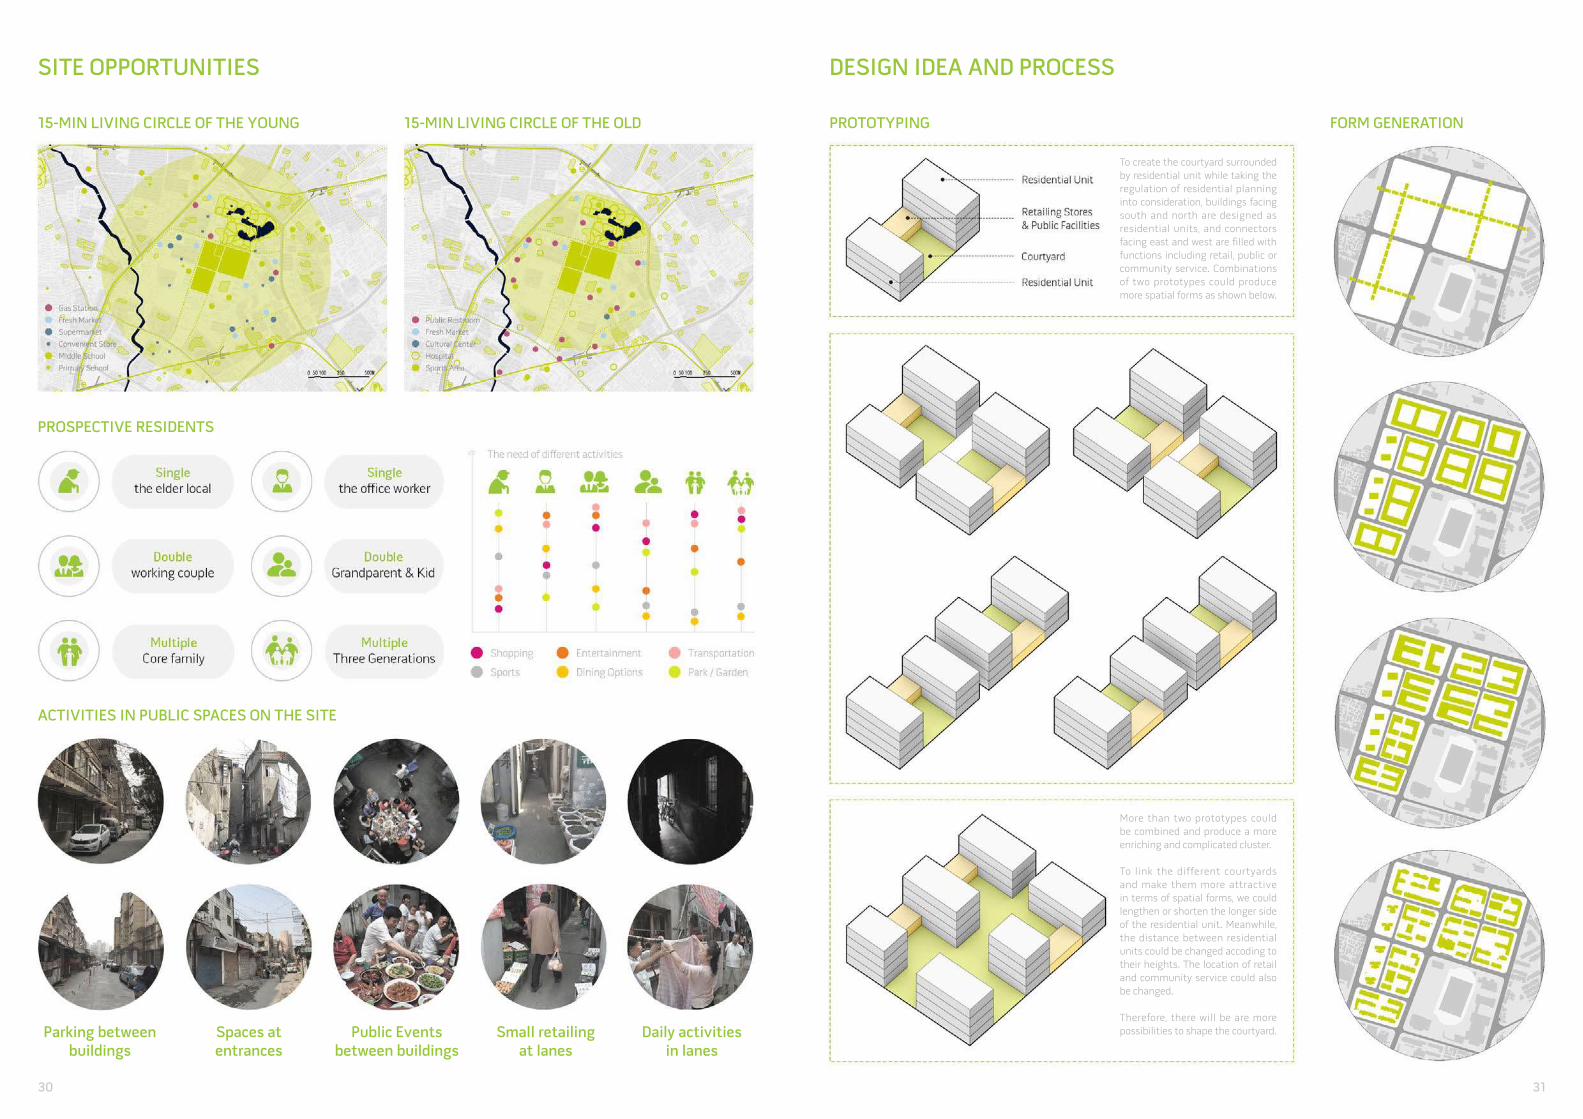
SITE OPPORTUNITIES
15-MIN LIVING CIRCLE OF THE YOUNG 15-MIN LIVING CIRCLE OF THE OLD
PROSPECTIVE RESIDENTS
ACTIVITIES IN PUBLIC SPACES ON THE SITE
Parking betweenbuildings
Spaces atentrances
Public Events between buildings
Small retailingat lanes
Daily activitiesin lanes
DESIGN IDEA AND PROCESS
PROTOTYPING FORM GENERATION
To create the courtyard surrounded
by residential unit while taking the
regulation of residential planning
into consideration, buildings facing
south and north are designed as
residential units, and connectors
facing east and west are filled with
functions including retail, public or
community service. Combinations
of two prototypes could produce
more spatial forms as shown below.
More than two prototypes could
be combined and produce a more
enriching and complicated cluster.
To link the different courtyards
and make them more attractive
in terms of spatial forms, we could
lengthen or shorten the longer side
of the residential unit. Meanwhile,
the distance between residential
units could be changed accoding to
their heights. The location of retail
and community service could also
be changed.
Therefore, there will be are more
possibilities to shape the courtyard.
30 31
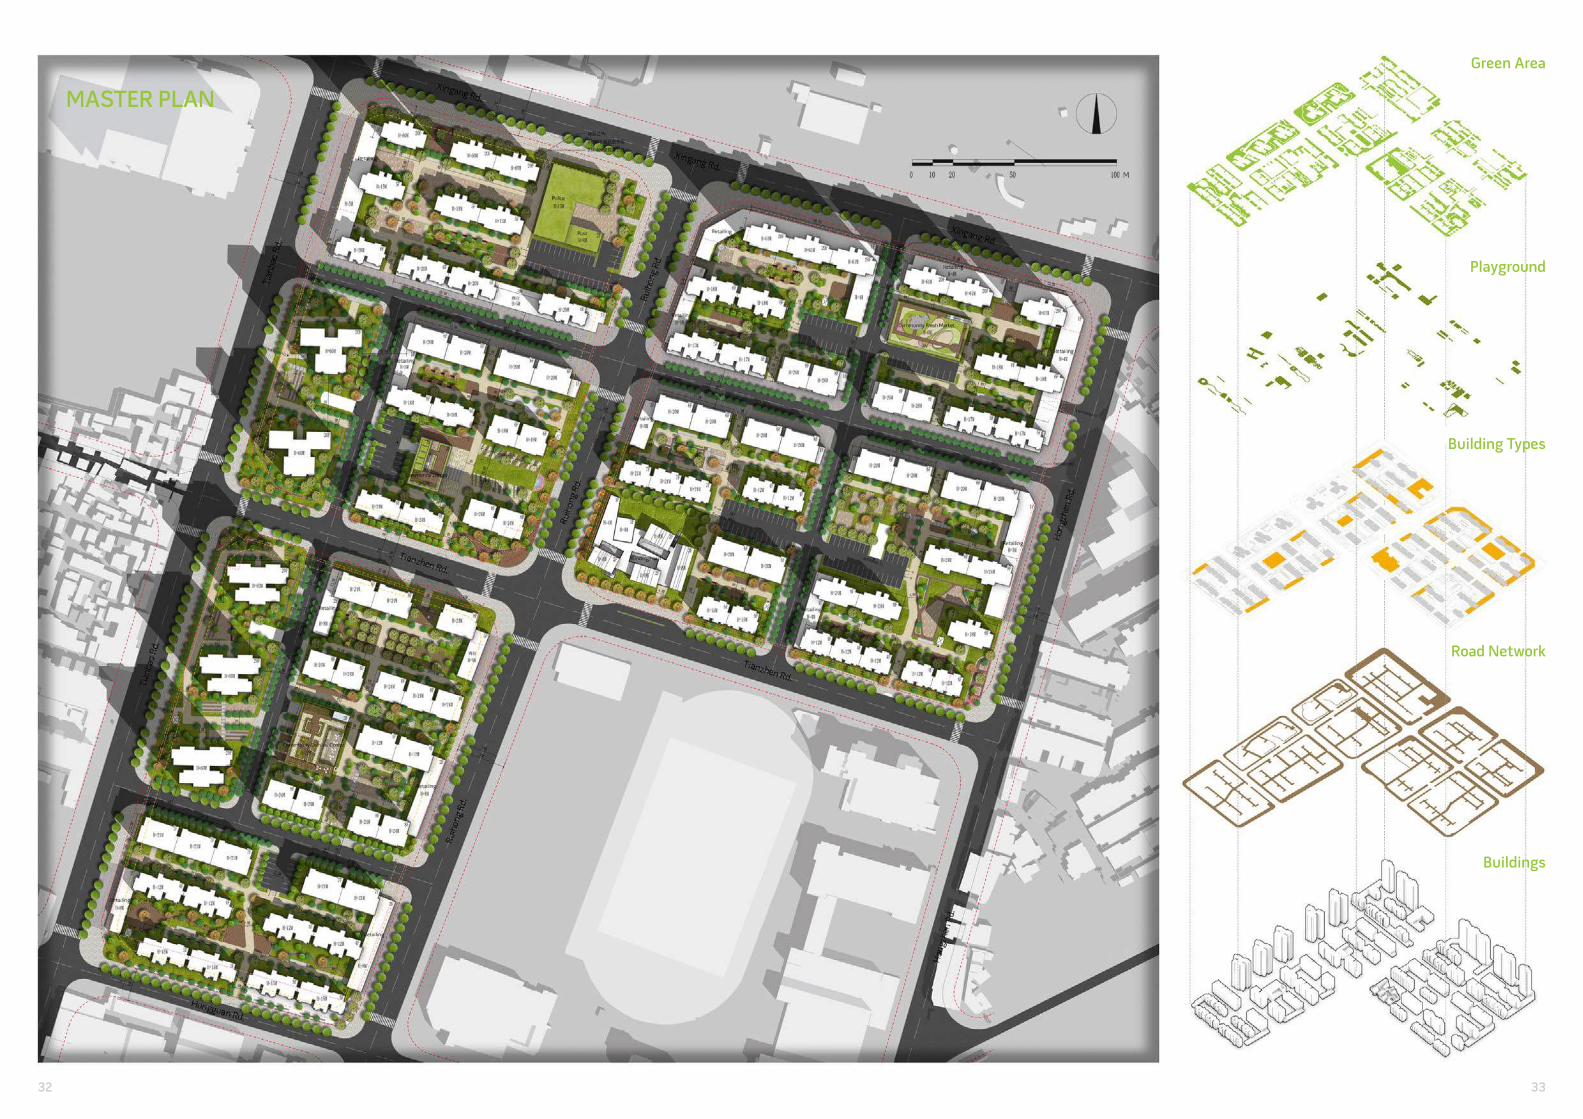
MASTER PLAN
Green Area
Playground
Building Types
Road Network
Buildings
32 33
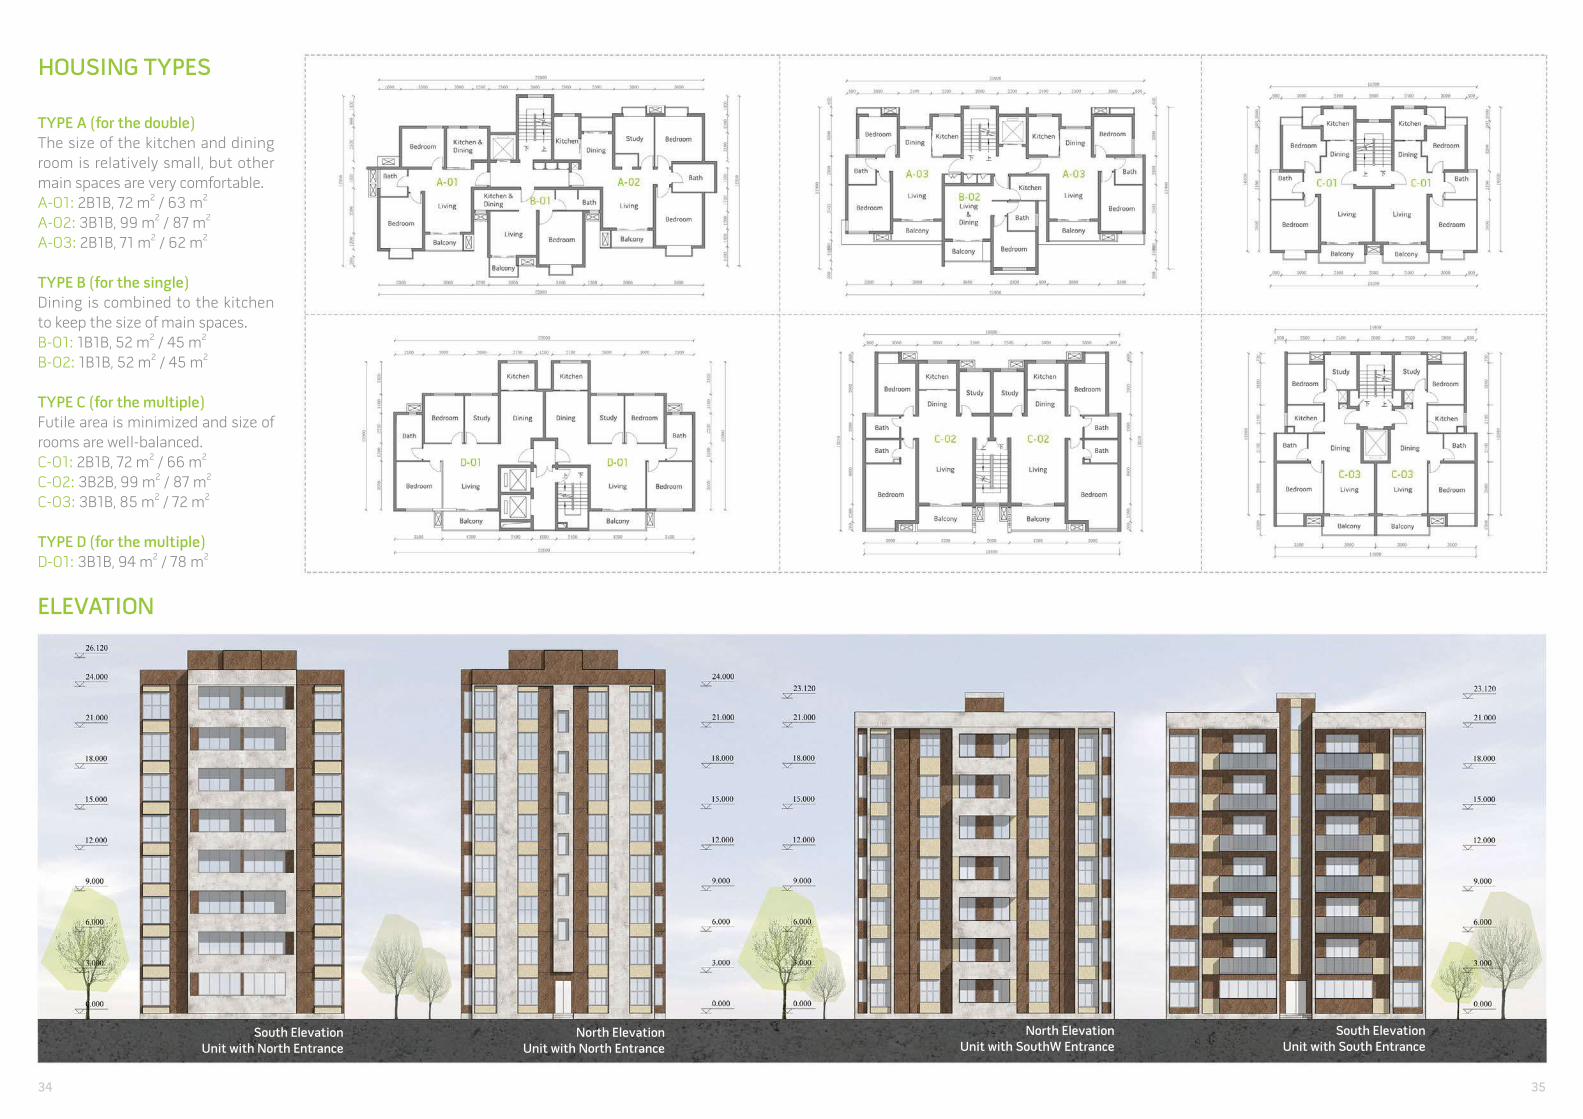
HOUSING TYPES
TYPE A (for the double)
The size of the kitchen and dining
room is relatively small, but other
main spaces are very comfortable.
A-01: 2B1B, 72 m2 / 63 m2
A-02: 3B1B, 99 m2 / 87 m2
A-03: 2B1B, 71 m2 / 62 m2
TYPE B (for the single)
Dining is combined to the kitchen
to keep the size of main spaces.
B-01: 1B1B, 52 m2 / 45 m2
B-02: 1B1B, 52 m2 / 45 m2
TYPE C (for the multiple)
Futile area is minimized and size of
rooms are well-balanced.
C-01: 2B1B, 72 m2 / 66 m2
C-02: 3B2B, 99 m2 / 87 m2
C-03: 3B1B, 85 m2 / 72 m2
TYPE D (for the multiple)
D-01: 3B1B, 94 m2 / 78 m2
ELEVATION
South Elevation Unit with North Entrance
North Elevation Unit with North Entrance
North Elevation Unit with SouthW Entrance
South Elevation Unit with South Entrance
34 35
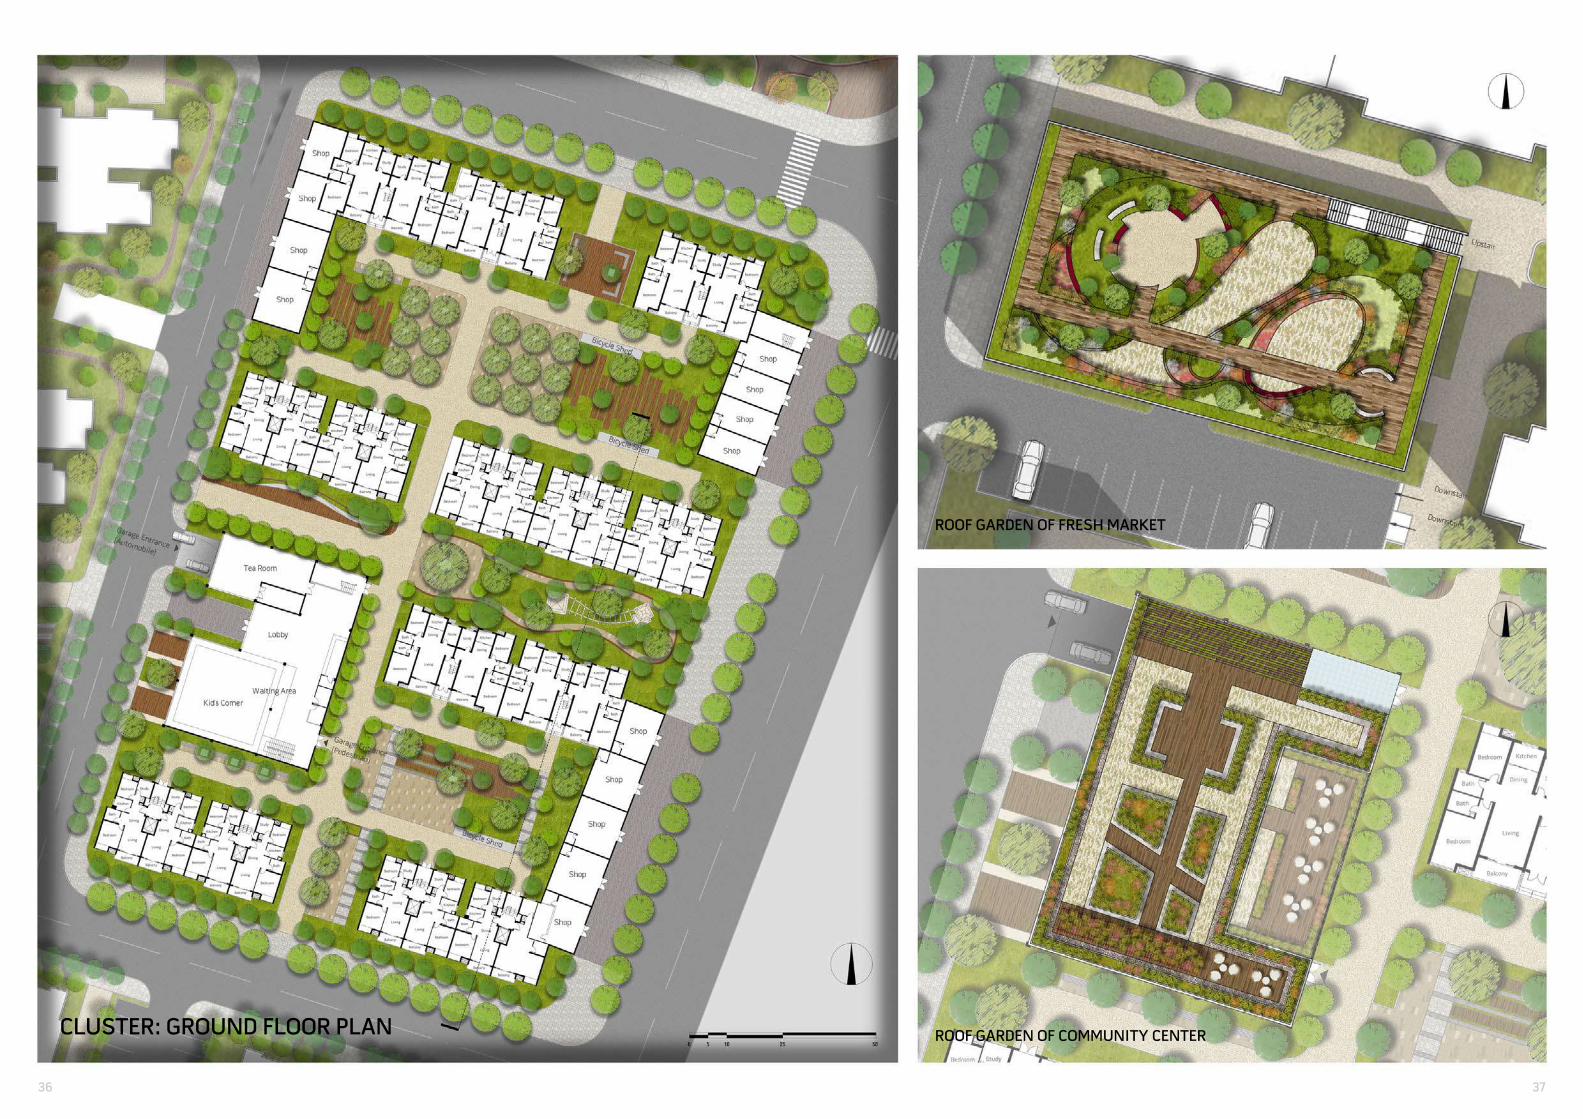
CLUSTER: GROUND FLOOR PLAN
ROOF GARDEN OF FRESH MARKET
ROOF GARDEN OF COMMUNITY CENTER
36 37
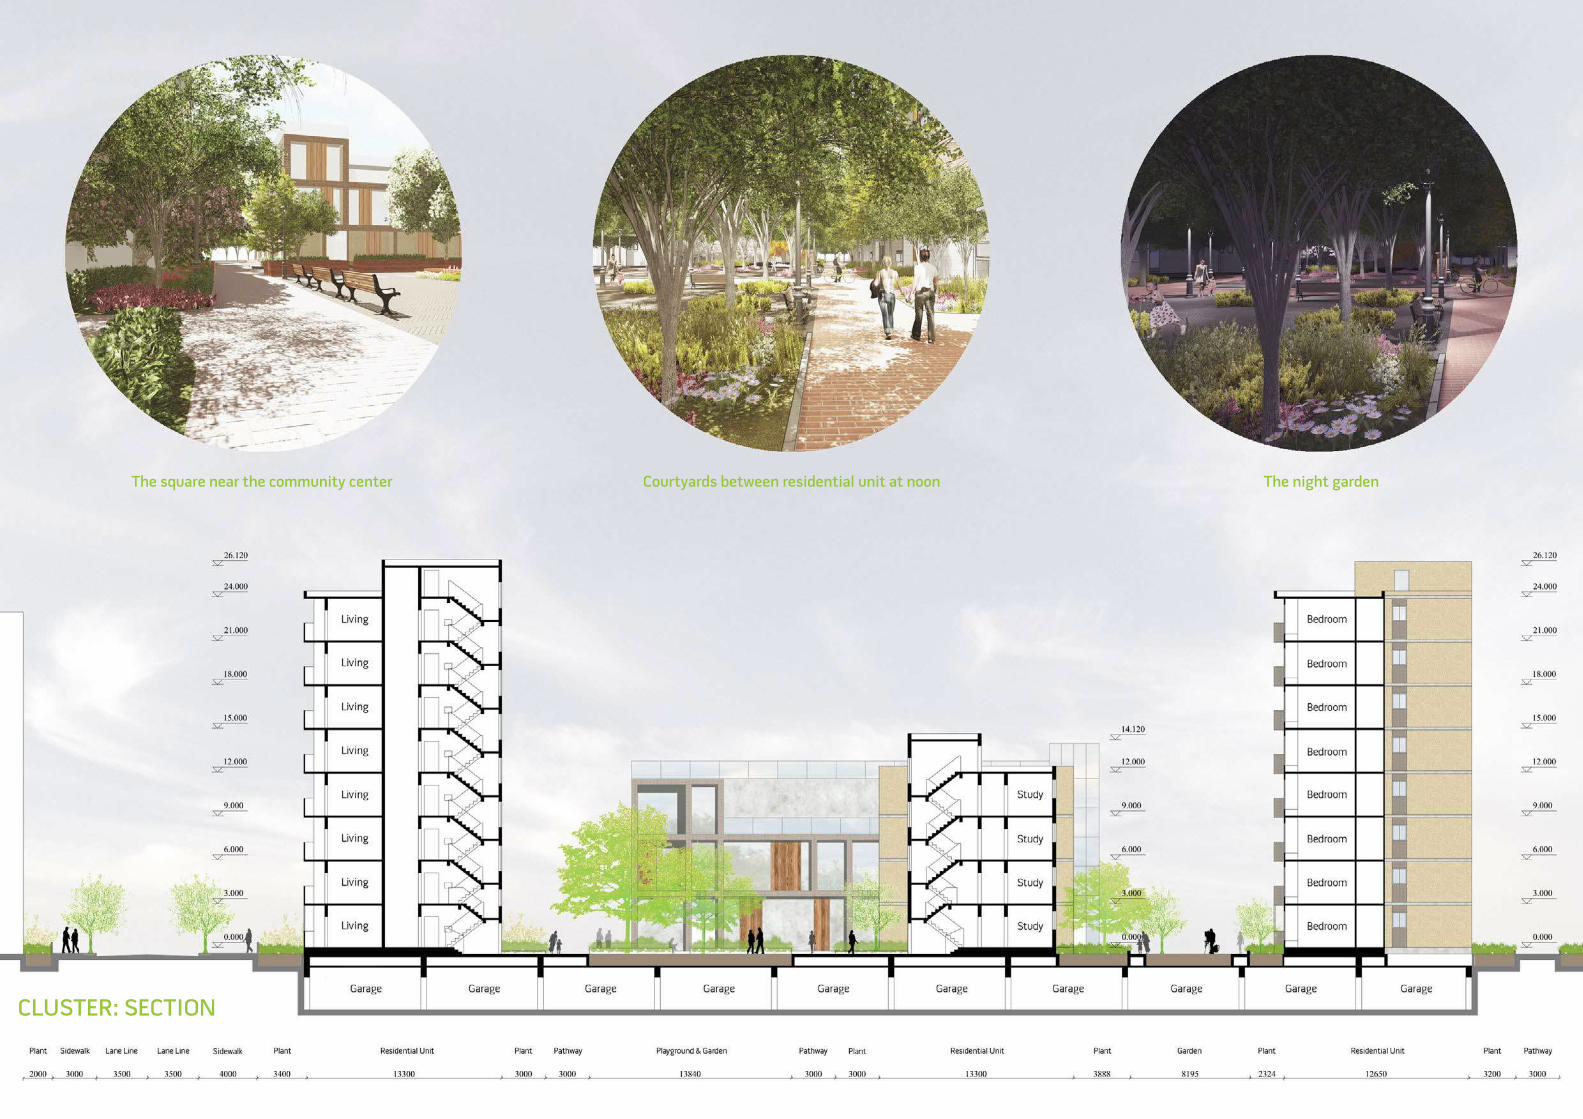
CLUSTER: SECTION
The square near the community center Courtyards between residential unit at noon The night garden
A typical farmers market in Europe.
This photo has been reprocessed. Original photo courtsey to Cruise Insider.
TOWARDS A HEALTHIER NEW YORK CITY:
ASSESSING FARMERS MARKETS
LOCATION: NEW YORK CITY, THE UNITED STATES
DATE: NOV. 2018 - DEC. 2018
PROPERTY: INDIVIDUAL WORK
INSTRUCTOR: MEISTERLIN L.
COURSE: GEOGRAPHIC INFORMATION SYSTEMS
INSTITUTION: GSAPP, COLUMBIA UNIVERSITY
PROJECT DESCRIPTION
This is the final assignment of the course Geographic Information Systems (GIS), which requires students to design, research and complete a small project. It is a three-week, self-directed research the skills learned through the semester to a topic and the according questions.
Besides this written and graphic report, I have also finished the topic proposals with data sources, as well as a presentation before a panel of invited guests.
INTRODUCTION
Limited access to sources of health, fresh and affordable food may impede the ability of people to have
a healthy diet (USDA, 2017). A wide body of social and scientific research has linked lack of nutritious,
affordable, fresh food to higher rates of diet-related diseases, including heart disease, diabetes, and obesity.
In the meantime, these findings have been validated by the New York City Department of Health and Mental
Hygiene through studies of New York City neighborhoods (AECOM, 2010).
Farmers market, as a supplement to traditional supermarkets and grocery stores, provides healthy fresh food
for its surrounding residents. In 2013, farmers markets in United States grown to 8,144 from 1,755 in 1993
(Bell, 2013).
However, factors including income, age, distance, commuting and even family structure may impact food
access for certain people. Promoting people’s access to the farmers market is never just a matter of the
count; the location greatly influences the number of benefits that people can actually enjoy. Therefore, it is
meaningful to understand the demographics of surrounding communities of the farmers market, and worth
investigating whether there are communities without ready access to a convenient farmers market.
Therefore, two research questions are posed.
First, What are the racial and economic demographics surrounding the farmers markets in New York City?
Second, considering the current distribution of farmers markets, density of housing units, population
targeted and the cost to operate such market, where might a new farmers market be sited in New York City?
This study investigates all farmers markets located in New York City that have been developed before May
2018. While the demographic characteristics will be examined within the network service areas of each
farmers market, the site suitability selection of a new farmers market will be performed for all the five
boroughs of New York City.
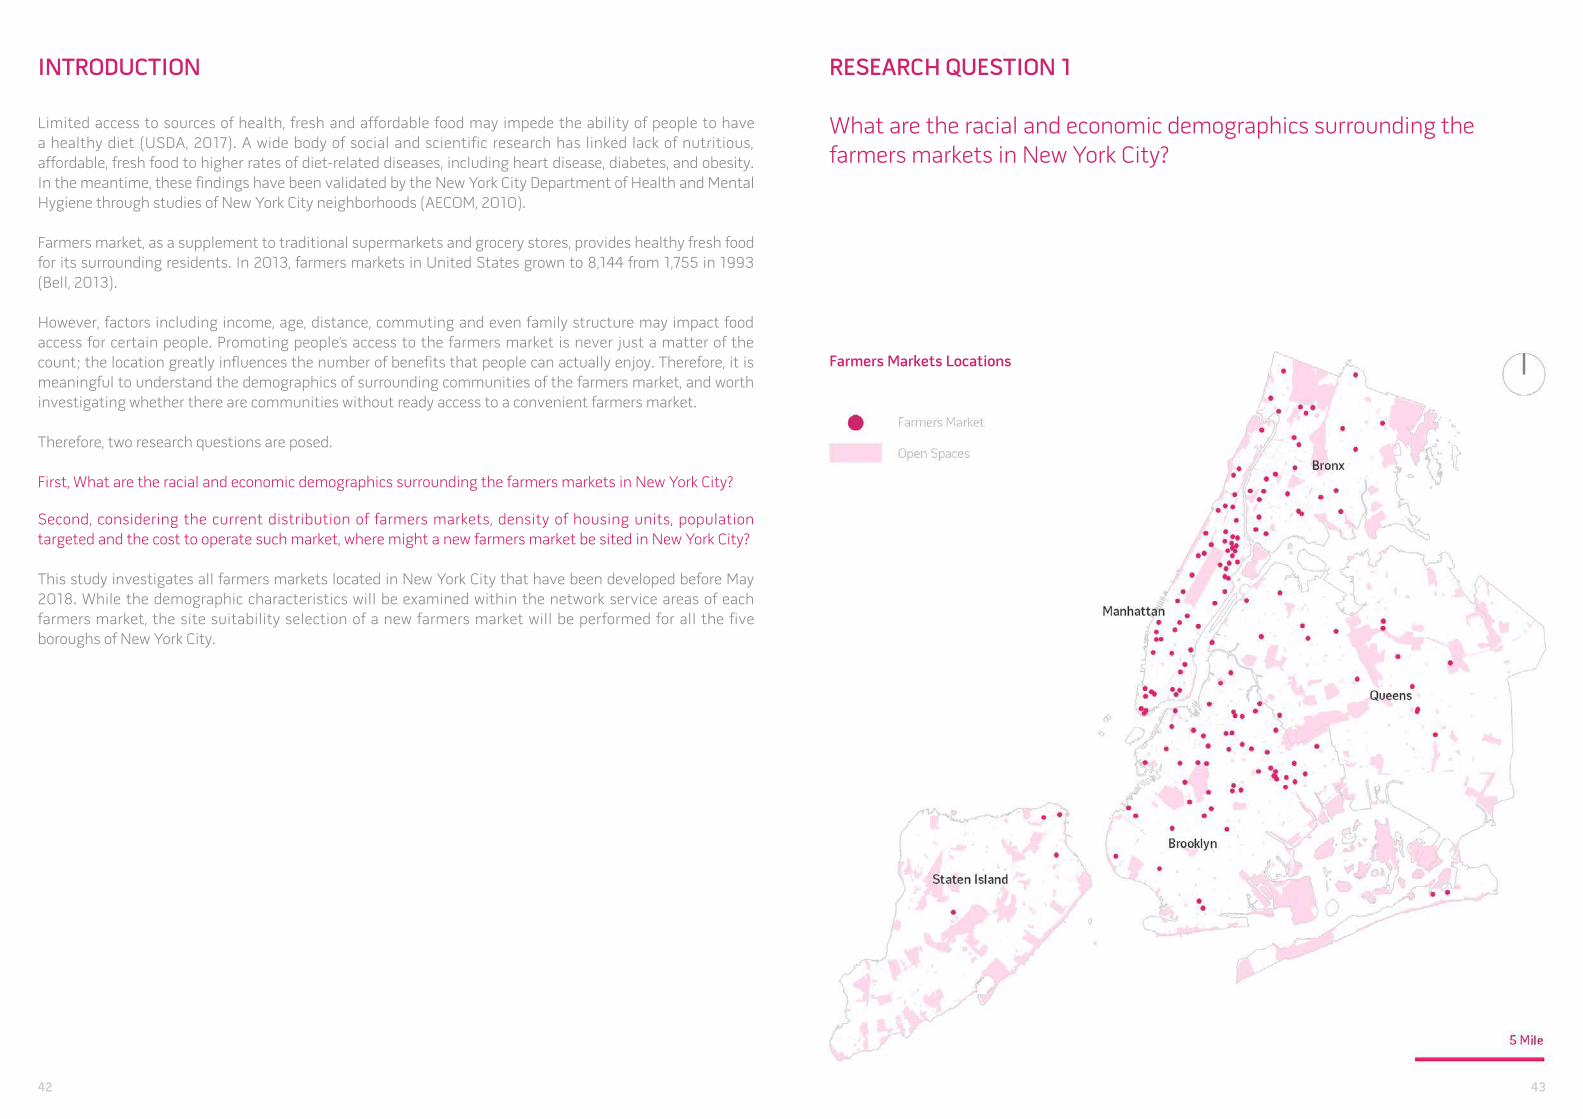
RESEARCH QUESTION 1
What are the racial and economic demographics surrounding the farmers markets in New York City?
Farmers Markets Locations
42 43
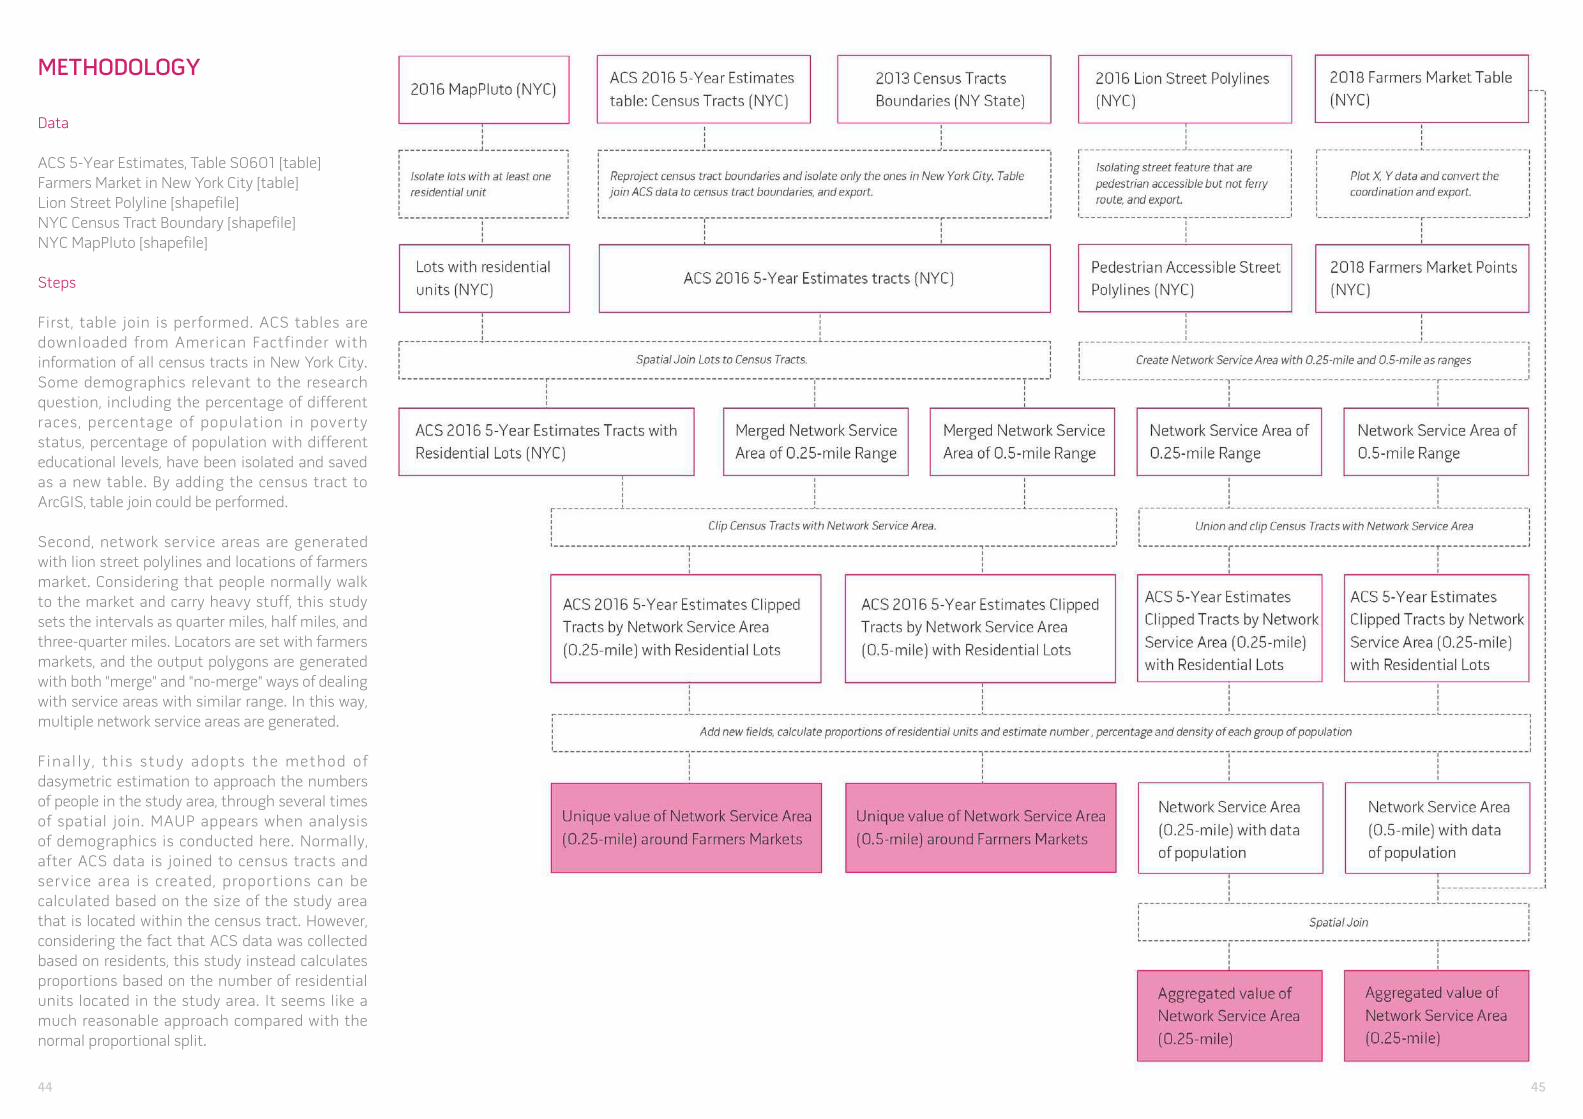
METHODOLOGY
Data
ACS 5-Year Estimates, Table S0601 [table]
Farmers Market in New York City [table]
Lion Street Polyline [shapefile]
NYC Census Tract Boundary [shapefile]
NYC MapPluto [shapefile]
Steps
First, table join is performed. ACS tables are
downloaded from American Factfinder with
information of all census tracts in New York City.
Some demographics relevant to the research
question, including the percentage of different
races, percentage of population in poverty
status, percentage of population with different
educational levels, have been isolated and saved
as a new table. By adding the census tract to
ArcGIS, table join could be performed.
Second, network service areas are generated
with lion street polylines and locations of farmers
market. Considering that people normally walk
to the market and carry heavy stuff, this study
sets the intervals as quarter miles, half miles, and
three-quarter miles. Locators are set with farmers
markets, and the output polygons are generated
with both "merge" and "no-merge" ways of dealing
with service areas with similar range. In this way,
multiple network service areas are generated.
Final ly , this study adopts the method of
dasymetric estimation to approach the numbers
of people in the study area, through several times
of spatial join. MAUP appears when analysis
of demographics is conducted here. Normally,
after ACS data is joined to census tracts and
service area is created, proportions can be
calculated based on the size of the study area
that is located within the census tract. However,
considering the fact that ACS data was collected
based on residents, this study instead calculates
proportions based on the number of residential
units located in the study area. It seems like a
much reasonable approach compared with the
normal proportional split.
44 45
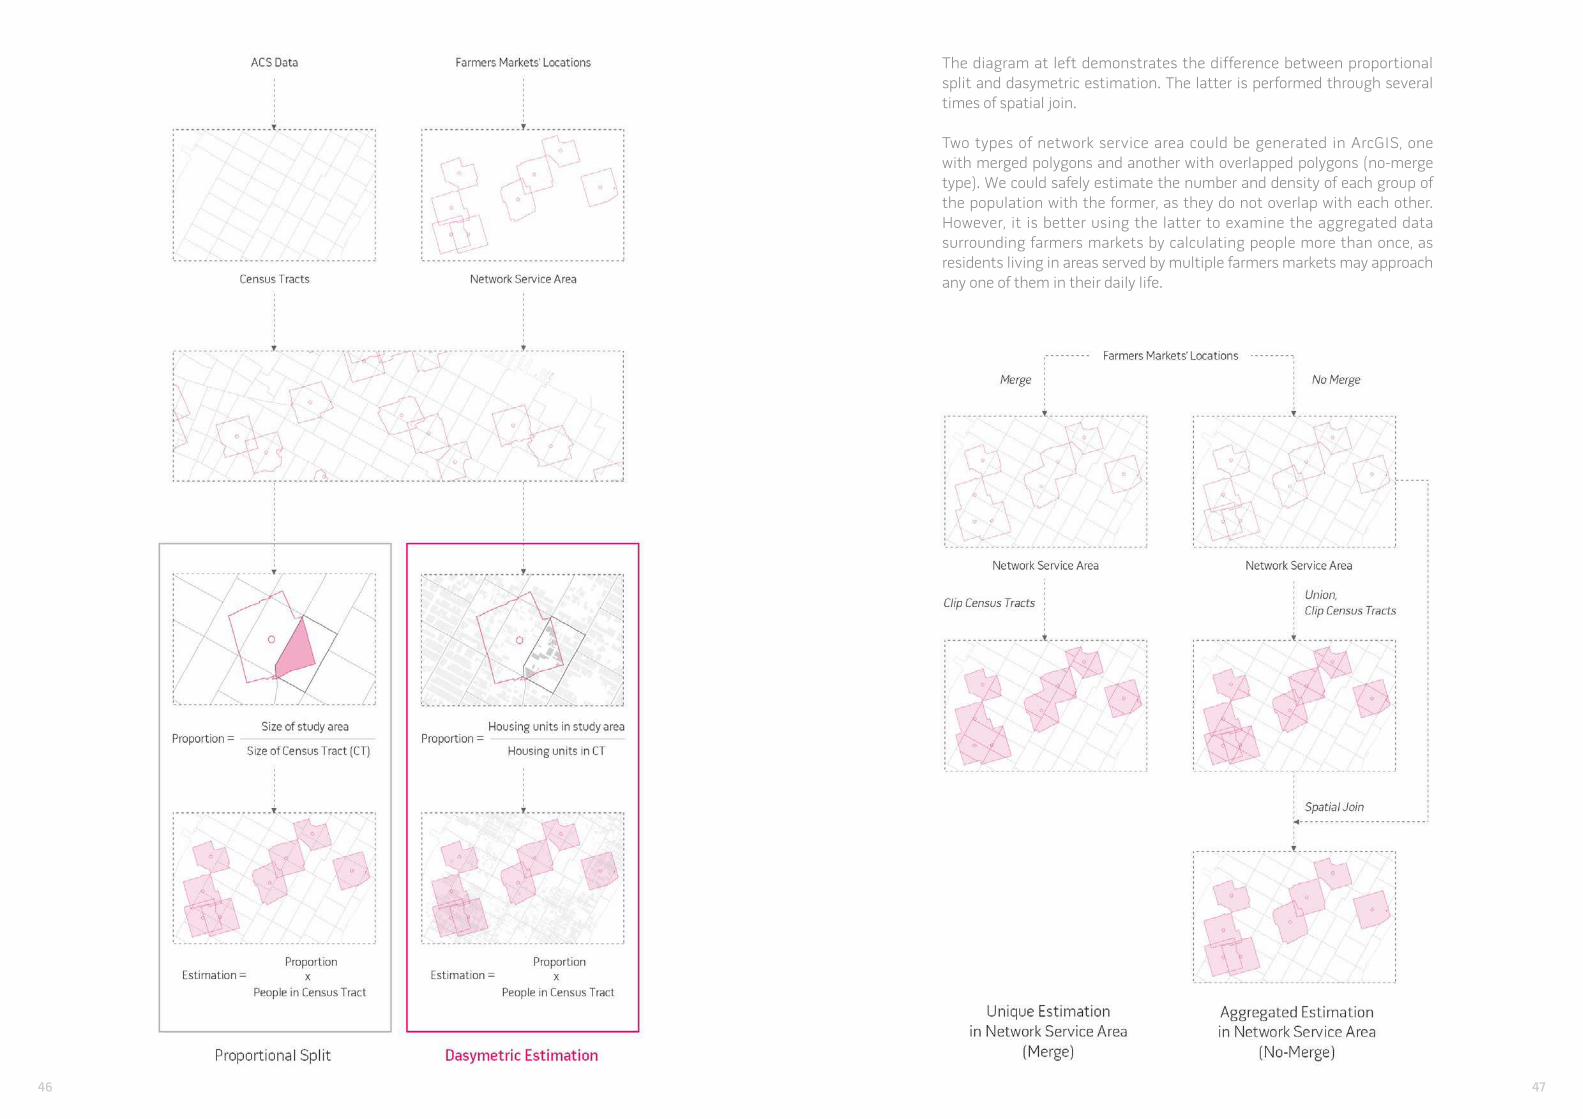
The diagram at left demonstrates the difference between proportional
split and dasymetric estimation. The latter is performed through several
times of spatial join.
Two types of network service area could be generated in ArcGIS, one
with merged polygons and another with overlapped polygons (no-merge
type). We could safely estimate the number and density of each group of
the population with the former, as they do not overlap with each other.
However, it is better using the latter to examine the aggregated data
surrounding farmers markets by calculating people more than once, as
residents living in areas served by multiple farmers markets may approach
any one of them in their daily life.
46 47
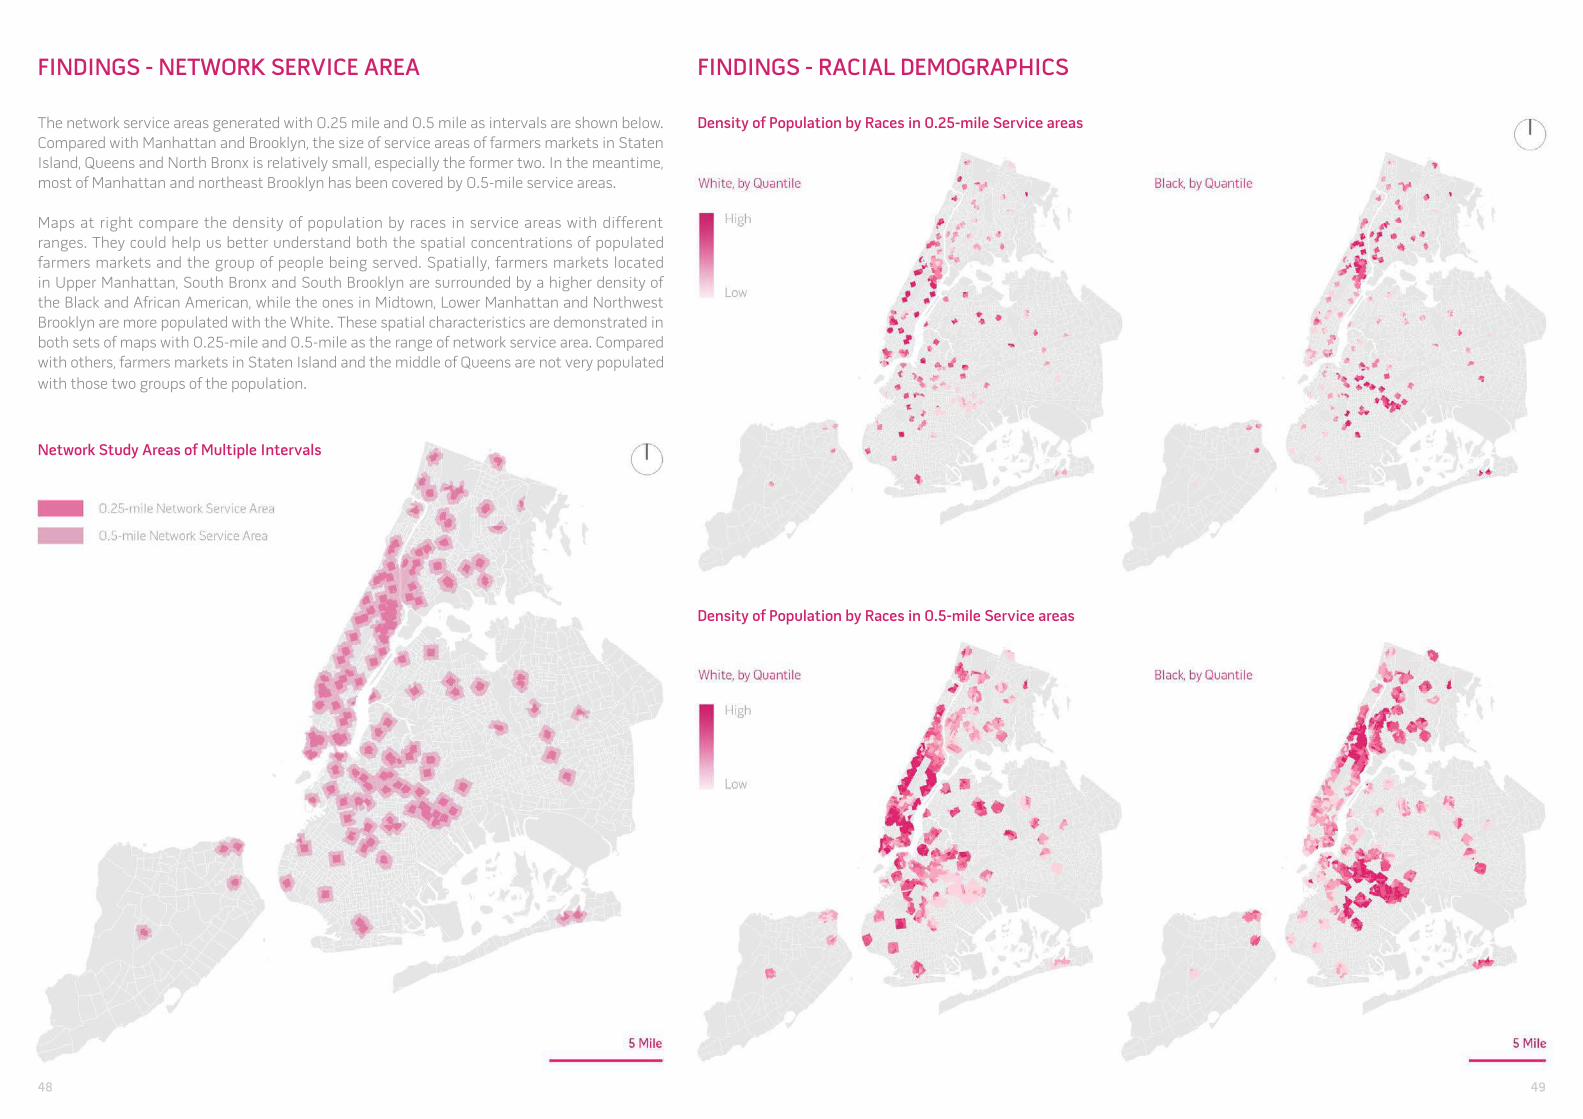
FINDINGS - NETWORK SERVICE AREA
The network service areas generated with 0.25 mile and 0.5 mile as intervals are shown below.
Compared with Manhattan and Brooklyn, the size of service areas of farmers markets in Staten
Island, Queens and North Bronx is relatively small, especially the former two. In the meantime,
most of Manhattan and northeast Brooklyn has been covered by 0.5-mile service areas.
Maps at right compare the density of population by races in service areas with different
ranges. They could help us better understand both the spatial concentrations of populated
farmers markets and the group of people being served. Spatially, farmers markets located
in Upper Manhattan, South Bronx and South Brooklyn are surrounded by a higher density of
the Black and African American, while the ones in Midtown, Lower Manhattan and Northwest
Brooklyn are more populated with the White. These spatial characteristics are demonstrated in
both sets of maps with 0.25-mile and 0.5-mile as the range of network service area. Compared
with others, farmers markets in Staten Island and the middle of Queens are not very populated
with those two groups of the population.
Network Study Areas of Multiple Intervals
FINDINGS - RACIAL DEMOGRAPHICS
Density of Population by Races in 0.25-mile Service areas
Density of Population by Races in 0.5-mile Service areas
48 49
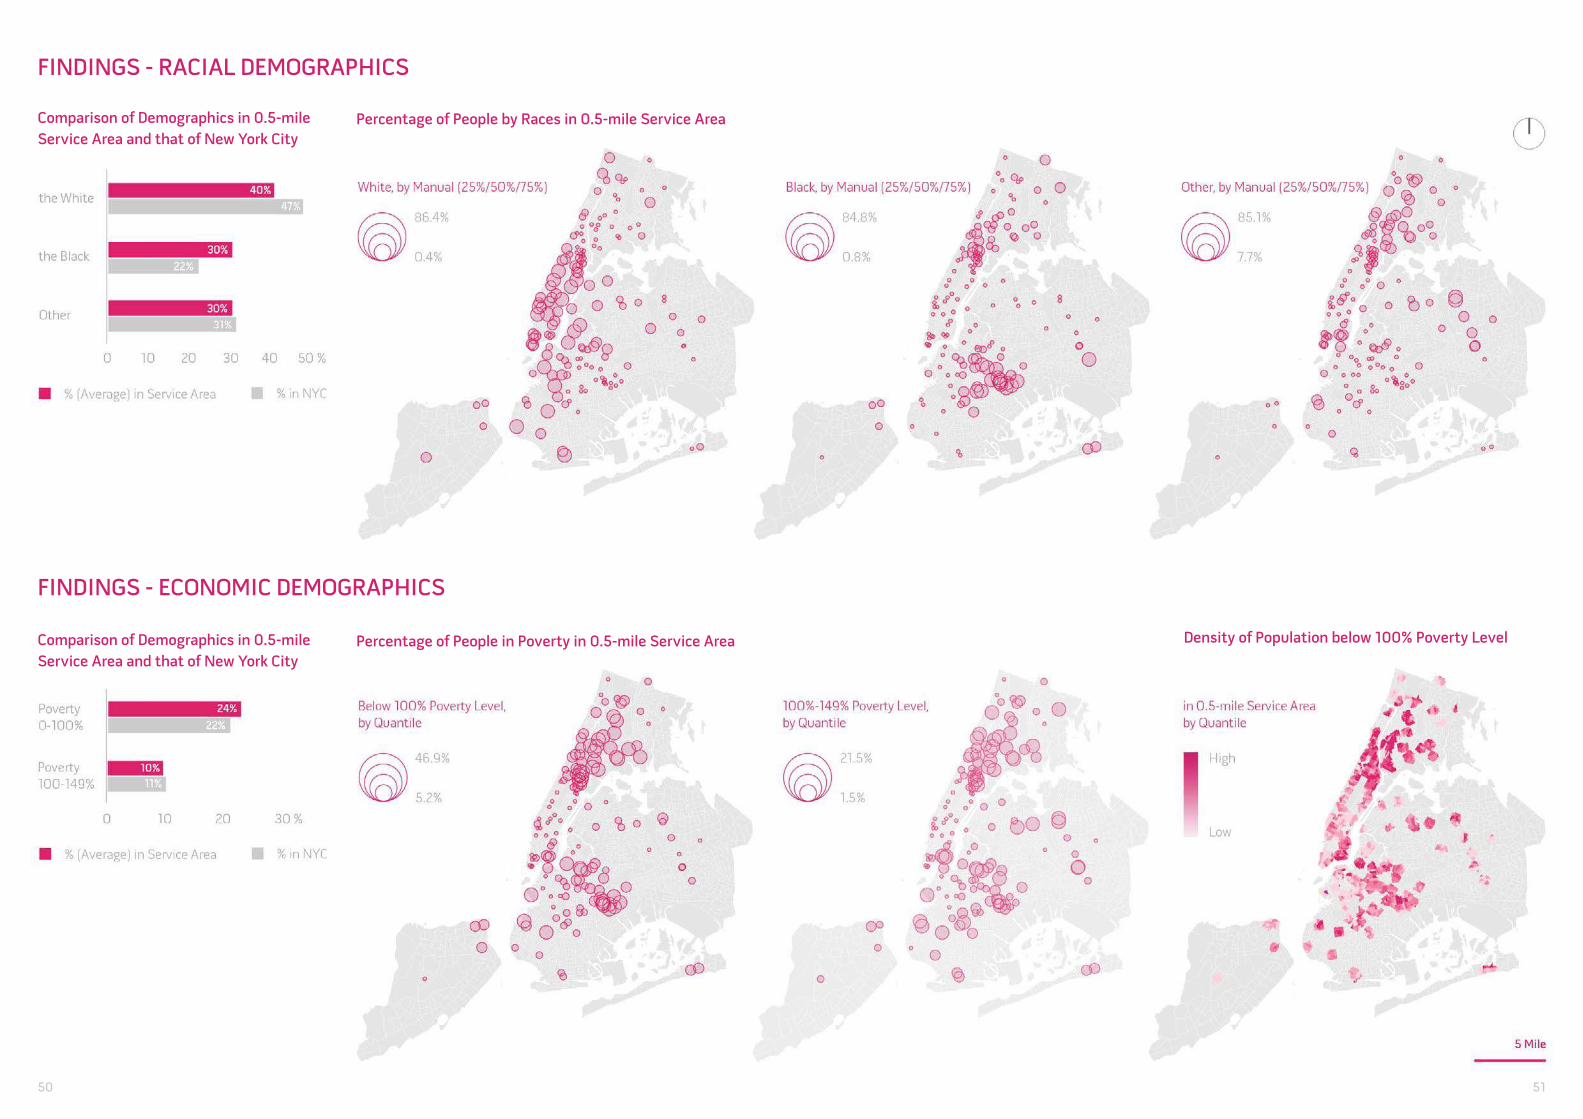
FINDINGS - RACIAL DEMOGRAPHICS
FINDINGS - ECONOMIC DEMOGRAPHICS
Comparison of Demographics in 0.5-mile
Service Area and that of New York City
Comparison of Demographics in 0.5-mile
Service Area and that of New York City
Percentage of People in Poverty in 0.5-mile Service Area
Percentage of People by Races in 0.5-mile Service Area
Density of Population below 100% Poverty Level
50 51
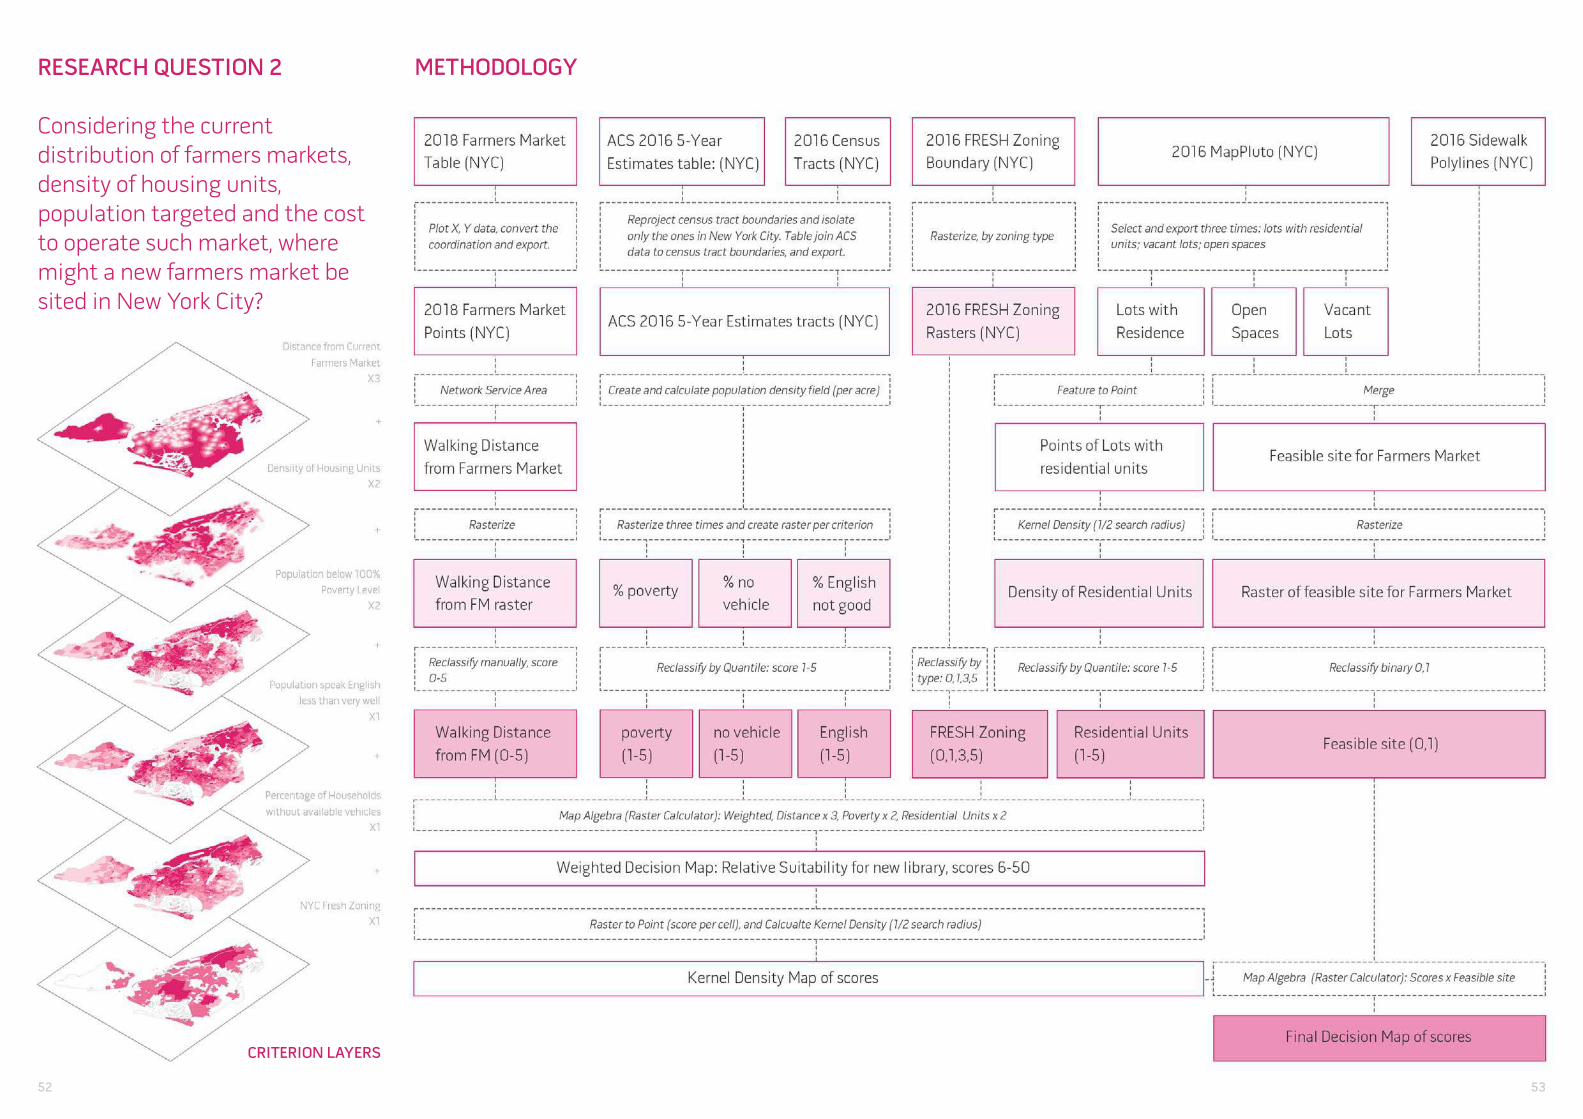
RESEARCH QUESTION 2
Considering the current distribution of farmers markets, density of housing units, population targeted and the cost to operate such market, where might a new farmers market be sited in New York City?
METHODOLOGY
CRITERION LAYERS
52 53
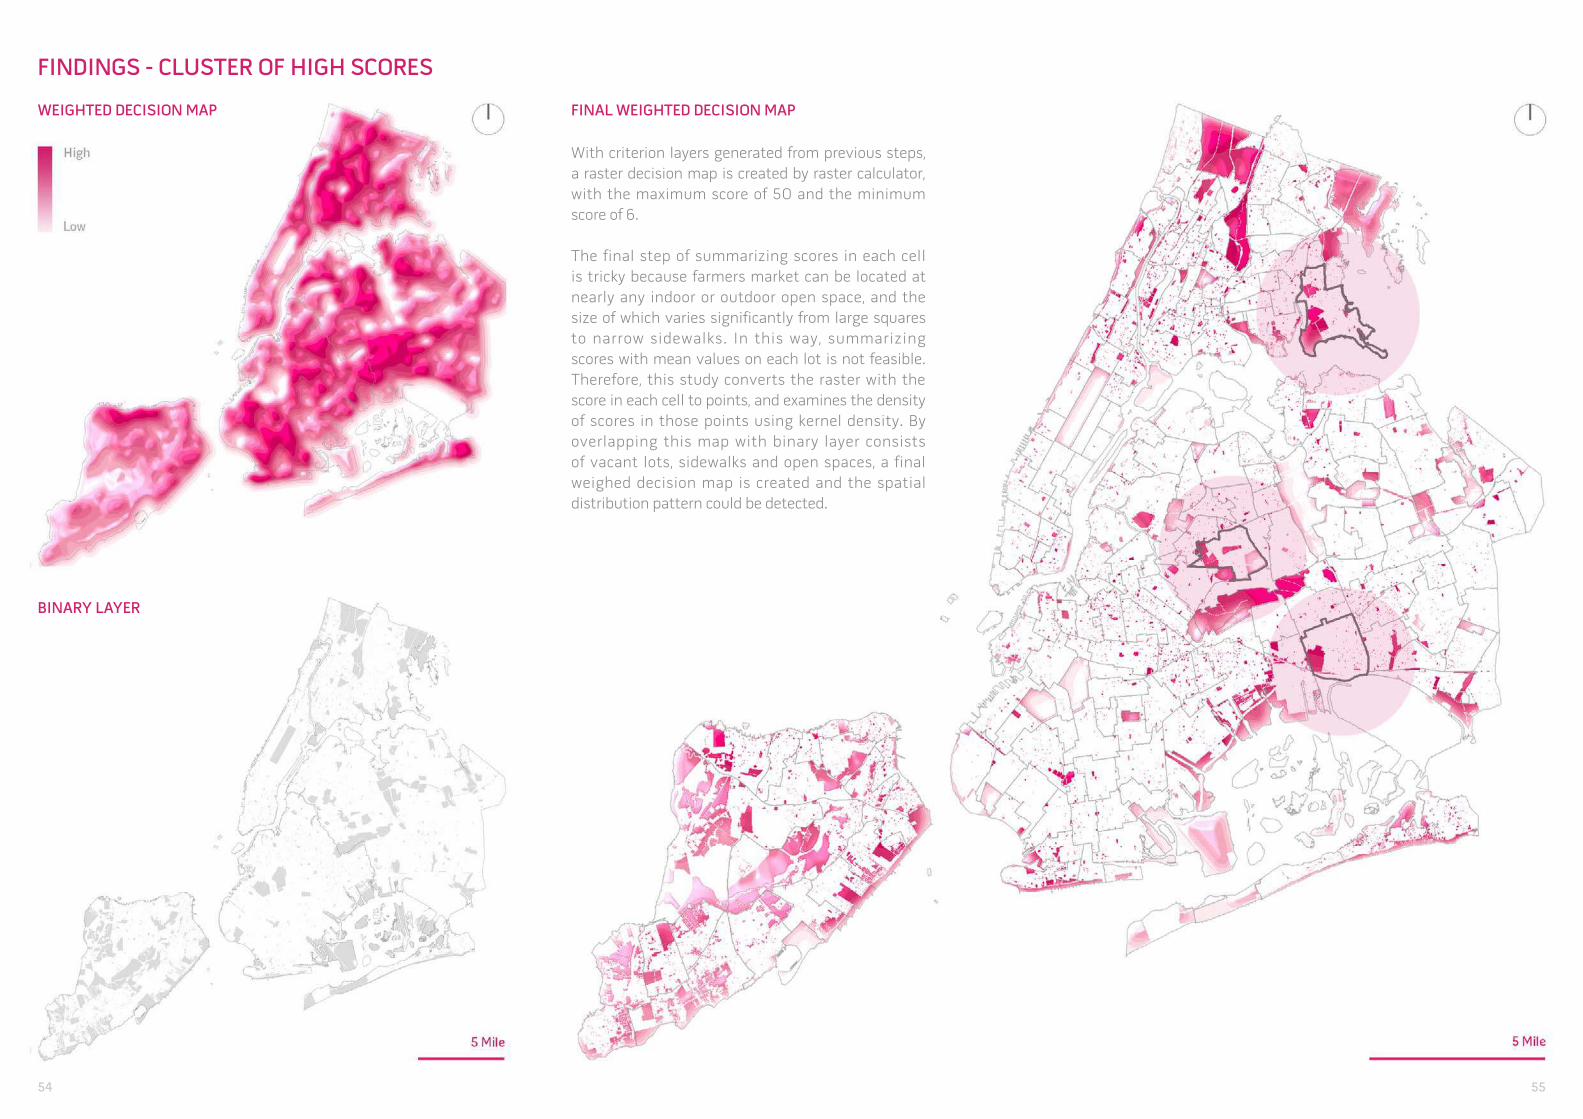
FINDINGS - CLUSTER OF HIGH SCORES
WEIGHTED DECISION MAP
BINARY LAYER
FINAL WEIGHTED DECISION MAP
With criterion layers generated from previous steps,
a raster decision map is created by raster calculator,
with the maximum score of 50 and the minimum
score of 6.
The final step of summarizing scores in each cell
is tricky because farmers market can be located at
nearly any indoor or outdoor open space, and the
size of which varies significantly from large squares
to narrow sidewalks. In this way, summarizing
scores with mean values on each lot is not feasible.
Therefore, this study converts the raster with the
score in each cell to points, and examines the density
of scores in those points using kernel density. By
overlapping this map with binary layer consists
of vacant lots, sidewalks and open spaces, a final
weighed decision map is created and the spatial
distribution pattern could be detected.
54 55
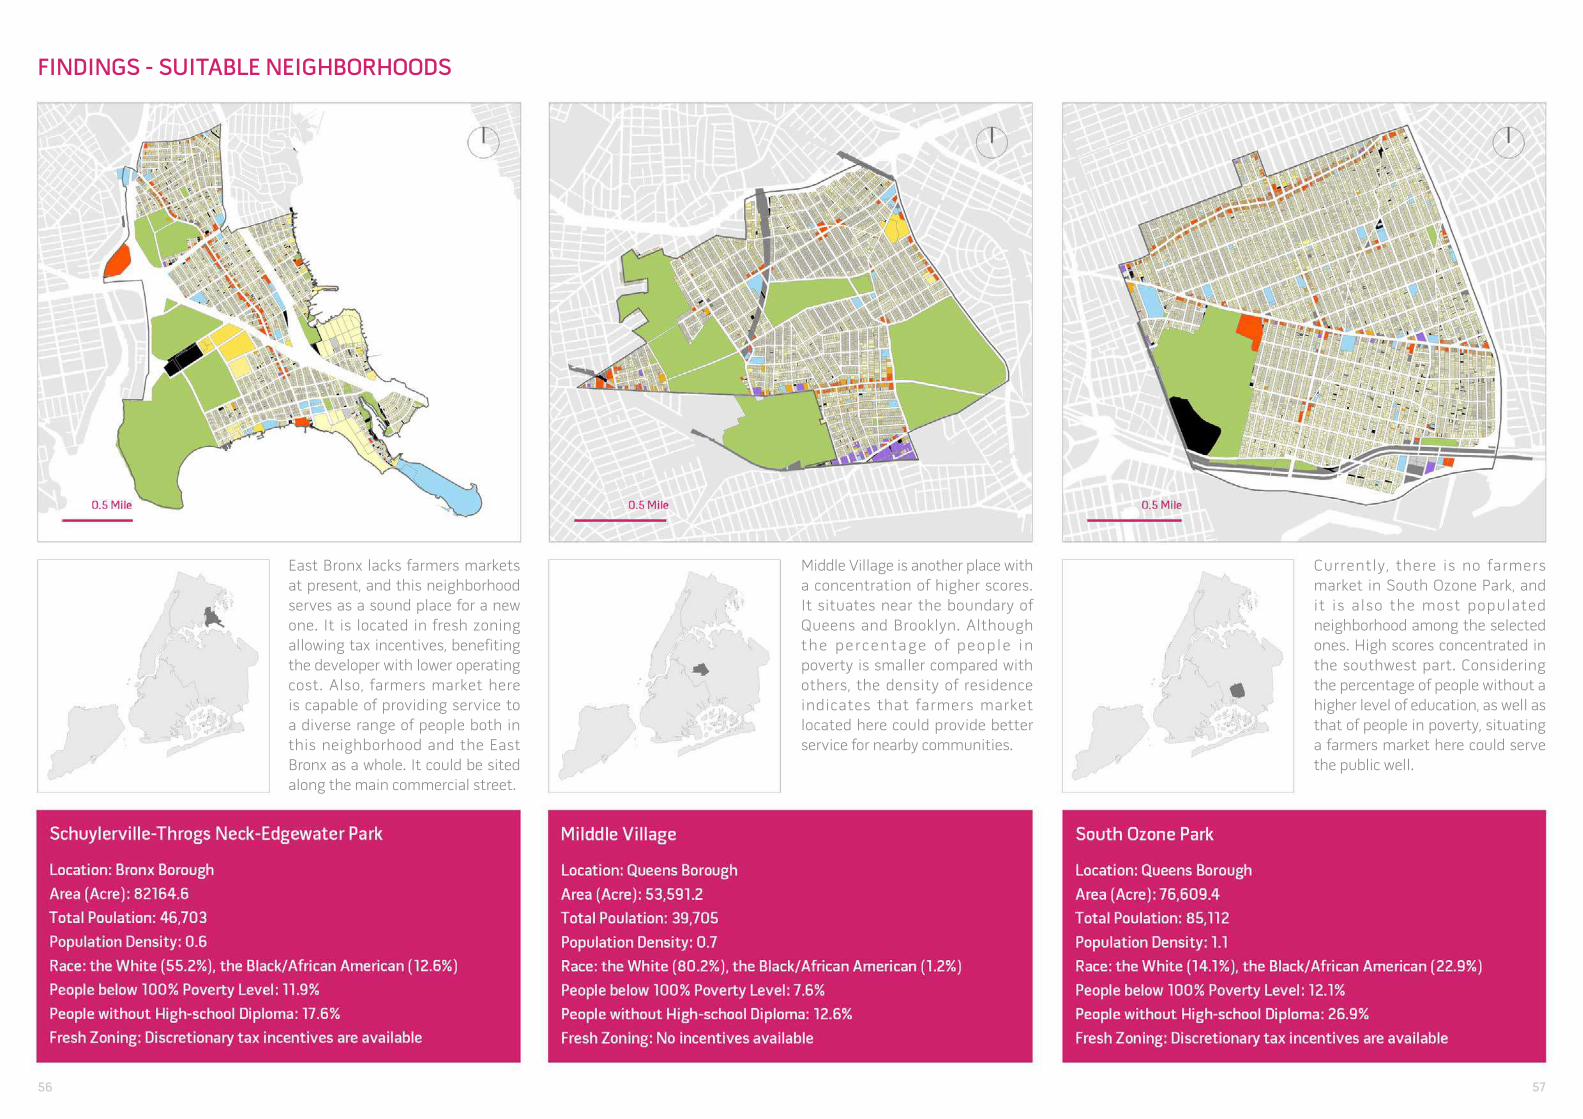
FINDINGS - SUITABLE NEIGHBORHOODS
East Bronx lacks farmers markets
at present, and this neighborhood
serves as a sound place for a new
one. It is located in fresh zoning
allowing tax incentives, benefiting
the developer with lower operating
cost. Also, farmers market here
is capable of providing service to
a diverse range of people both in
this neighborhood and the East
Bronx as a whole. It could be sited
along the main commercial street.
Middle Village is another place with
a concentration of higher scores.
It situates near the boundary of
Queens and Brooklyn. Although
t h e p e r c e n t a g e o f p e o p l e i n
poverty is smaller compared with
others, the density of residence
indicates that farmers market
located here could provide better
service for nearby communities.
Currently, there is no farmers
market in South Ozone Park, and
it is also the most populated
neighborhood among the selected
ones. High scores concentrated in
the southwest part. Considering
the percentage of people without a
higher level of education, as well as
that of people in poverty, situating
a farmers market here could serve
the public well.
56 57
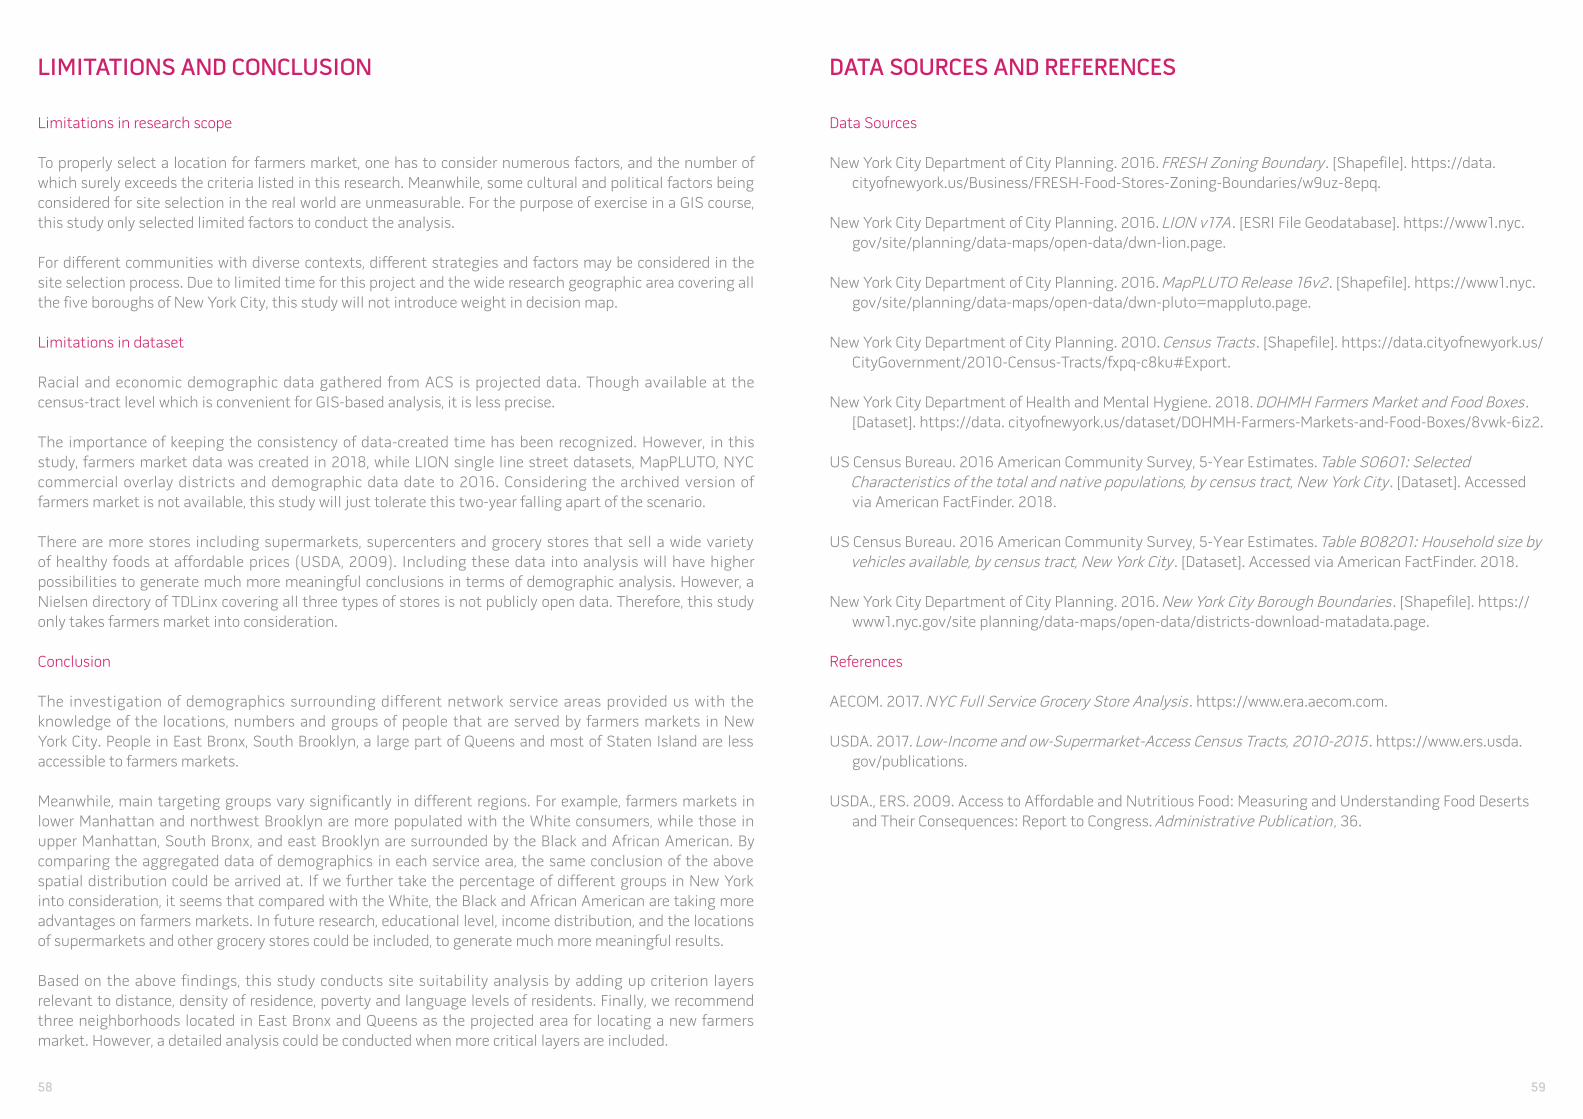
LIMITATIONS AND CONCLUSION
Limitations in research scope
To properly select a location for farmers market, one has to consider numerous factors, and the number of
which surely exceeds the criteria listed in this research. Meanwhile, some cultural and political factors being
considered for site selection in the real world are unmeasurable. For the purpose of exercise in a GIS course,
this study only selected limited factors to conduct the analysis.
For different communities with diverse contexts, different strategies and factors may be considered in the
site selection process. Due to limited time for this project and the wide research geographic area covering all
the five boroughs of New York City, this study will not introduce weight in decision map.
Limitations in dataset
Racial and economic demographic data gathered from ACS is projected data. Though available at the
census-tract level which is convenient for GIS-based analysis, it is less precise.
The importance of keeping the consistency of data-created time has been recognized. However, in this
study, farmers market data was created in 2018, while LION single line street datasets, MapPLUTO, NYC
commercial overlay districts and demographic data date to 2016. Considering the archived version of
farmers market is not available, this study will just tolerate this two-year falling apart of the scenario.
There are more stores including supermarkets, supercenters and grocery stores that sell a wide variety
of healthy foods at affordable prices (USDA, 2009). Including these data into analysis will have higher
possibilities to generate much more meaningful conclusions in terms of demographic analysis. However, a
Nielsen directory of TDLinx covering all three types of stores is not publicly open data. Therefore, this study
only takes farmers market into consideration.
Conclusion
The investigation of demographics surrounding different network service areas provided us with the
knowledge of the locations, numbers and groups of people that are served by farmers markets in New
York City. People in East Bronx, South Brooklyn, a large part of Queens and most of Staten Island are less
accessible to farmers markets.
Meanwhile, main targeting groups vary significantly in different regions. For example, farmers markets in
lower Manhattan and northwest Brooklyn are more populated with the White consumers, while those in
upper Manhattan, South Bronx, and east Brooklyn are surrounded by the Black and African American. By
comparing the aggregated data of demographics in each service area, the same conclusion of the above
spatial distribution could be arrived at. If we further take the percentage of different groups in New York
into consideration, it seems that compared with the White, the Black and African American are taking more
advantages on farmers markets. In future research, educational level, income distribution, and the locations
of supermarkets and other grocery stores could be included, to generate much more meaningful results.
Based on the above findings, this study conducts site suitability analysis by adding up criterion layers
relevant to distance, density of residence, poverty and language levels of residents. Finally, we recommend
three neighborhoods located in East Bronx and Queens as the projected area for locating a new farmers
market. However, a detailed analysis could be conducted when more critical layers are included.
DATA SOURCES AND REFERENCES
Data Sources
New York City Department of City Planning. 2016. FRESH Zoning Boundary. [Shapefile]. https://data.
cityofnewyork.us/Business/FRESH-Food-Stores-Zoning-Boundaries/w9uz-8epq.
New York City Department of City Planning. 2016. LION v17A. [ESRI File Geodatabase]. https://www1.nyc.
gov/site/planning/data-maps/open-data/dwn-lion.page.
New York City Department of City Planning. 2016. MapPLUTO Release 16v2. [Shapefile]. https://www1.nyc.
gov/site/planning/data-maps/open-data/dwn-pluto=mappluto.page.
New York City Department of City Planning. 2010. Census Tracts. [Shapefile]. https://data.cityofnewyork.us/
CityGovernment/2010-Census-Tracts/fxpq-c8ku#Export.
New York City Department of Health and Mental Hygiene. 2018. DOHMH Farmers Market and Food Boxes.
[Dataset]. https://data. cityofnewyork.us/dataset/DOHMH-Farmers-Markets-and-Food-Boxes/8vwk-6iz2.
US Census Bureau. 2016 American Community Survey, 5-Year Estimates. Table S0601: Selected Characteristics of the total and native populations, by census tract, New York City. [Dataset]. Accessed
via American FactFinder. 2018.
US Census Bureau. 2016 American Community Survey, 5-Year Estimates. Table B08201: Household size by vehicles available, by census tract, New York City. [Dataset]. Accessed via American FactFinder. 2018.
New York City Department of City Planning. 2016. New York City Borough Boundaries. [Shapefile]. https://
www1.nyc.gov/site planning/data-maps/open-data/districts-download-matadata.page.
References
AECOM. 2017. NYC Full Service Grocery Store Analysis. https://www.era.aecom.com.
USDA. 2017. Low-Income and ow-Supermarket-Access Census Tracts, 2010-2015. https://www.ers.usda.
gov/publications.
USDA., ERS. 2009. Access to Affordable and Nutritious Food: Measuring and Understanding Food Deserts
and Their Consequences: Report to Congress. Administrative Publication, 36.
58 59
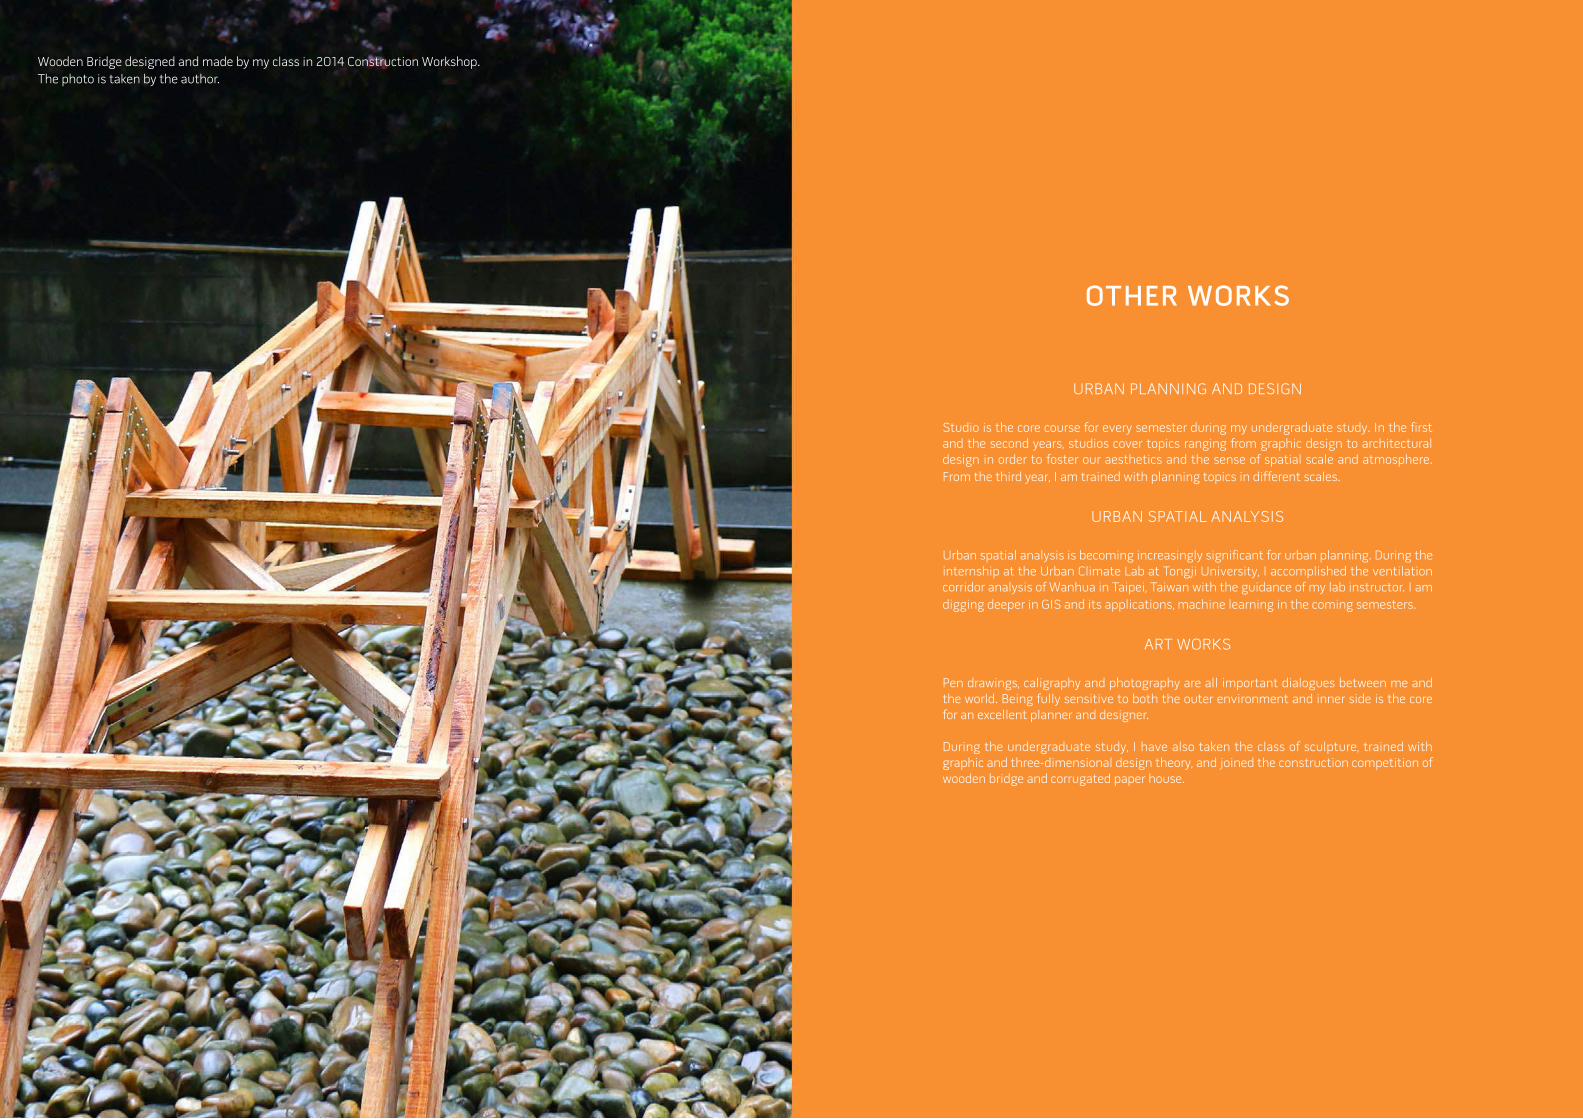
OTHER WORKS
URBAN PLANNING AND DESIGN
URBAN SPATIAL ANALYSIS
ART WORKS
Studio is the core course for every semester during my undergraduate study. In the first and the second years, studios cover topics ranging from graphic design to architectural design in order to foster our aesthetics and the sense of spatial scale and atmosphere.
From the third year, I am trained with planning topics in different scales.
Urban spatial analysis is becoming increasingly significant for urban planning. During the internship at the Urban Climate Lab at Tongji University, I accomplished the ventilation corridor analysis of Wanhua in Taipei, Taiwan with the guidance of my lab instructor. I am
digging deeper in GIS and its applications, machine learning in the coming semesters.
Pen drawings, caligraphy and photography are all important dialogues between me and the world. Being fully sensitive to both the outer environment and inner side is the core for an excellent planner and designer.
During the undergraduate study, I have also taken the class of sculpture, trained with graphic and three-dimensional design theory, and joined the construction competition of wooden bridge and corrugated paper house.
Wooden Bridge designed and made by my class in 2014 Construction Workshop.
The photo is taken by the author.
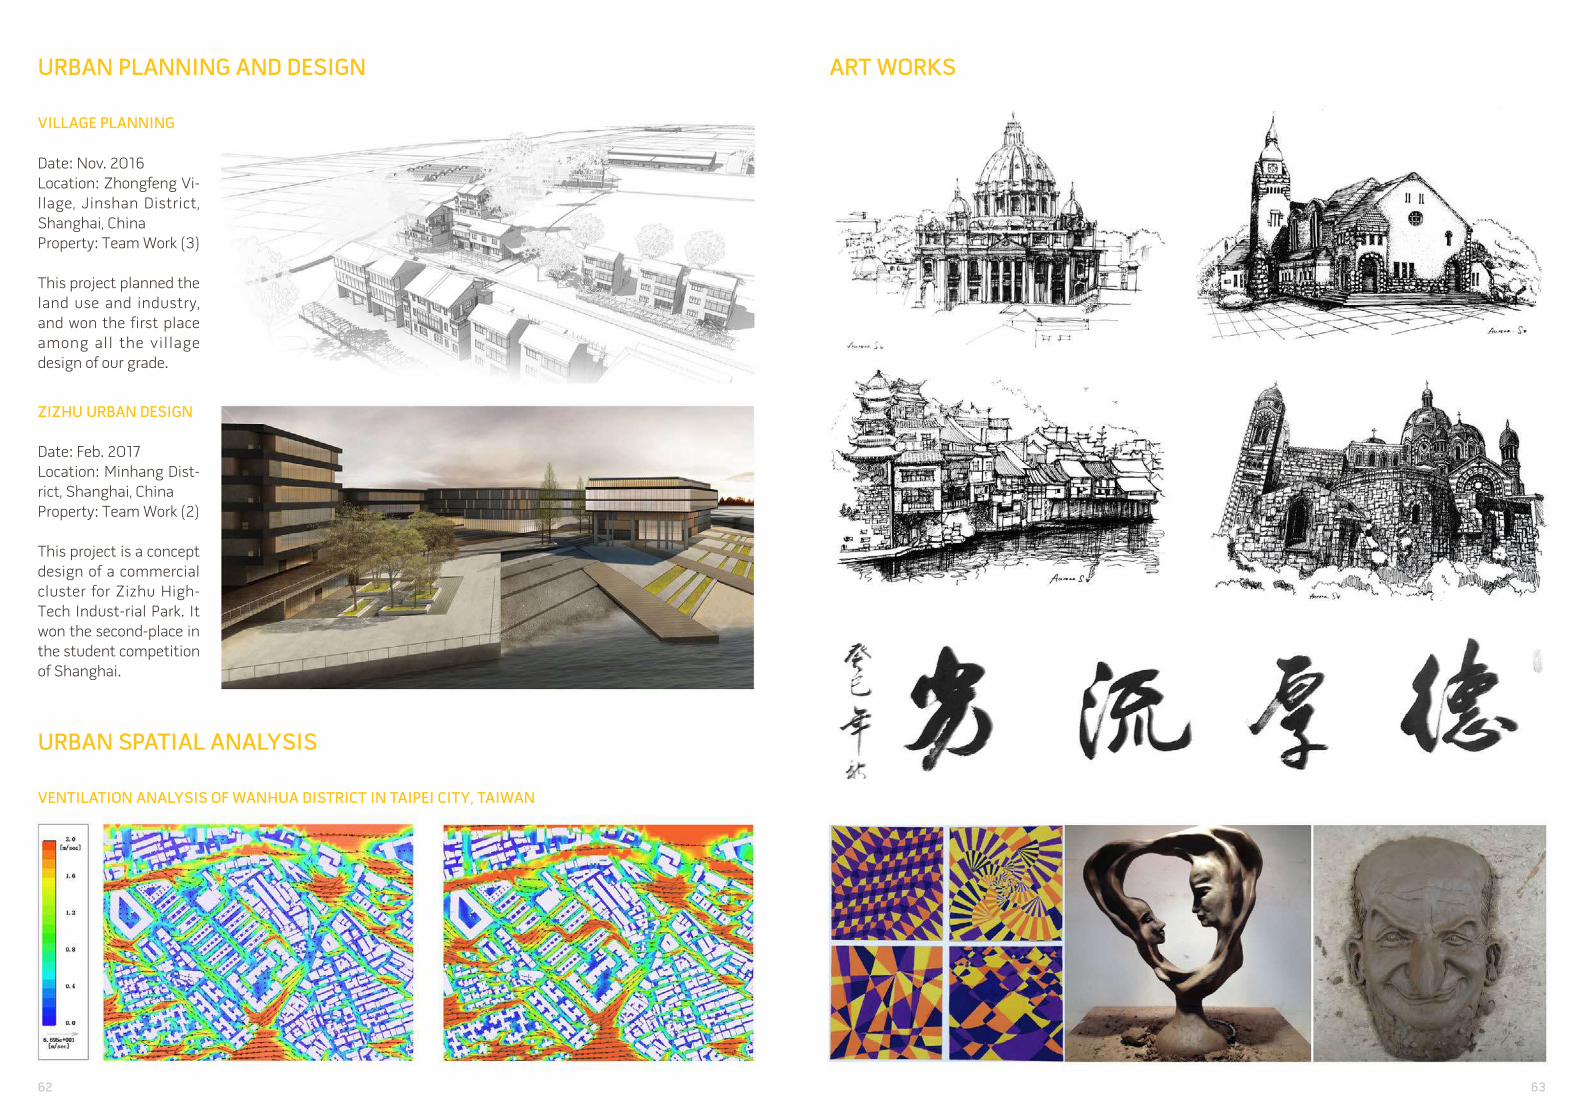
URBAN PLANNING AND DESIGN
VILLAGE PLANNING
URBAN SPATIAL ANALYSIS
VENTILATION ANALYSIS OF WANHUA DISTRICT IN TAIPEI CITY, TAIWAN
ZIZHU URBAN DESIGN
Date: Feb. 2017
Location: Minhang Dist-
rict, Shanghai, China
Property: Team Work (2)
This project is a concept
design of a commercial
cluster for Zizhu High-
Tech Indust-rial Park. It
won the second-place in
the student competition
of Shanghai.
Date: Nov. 2016
Location: Zhongfeng Vi-
llage, Jinshan District,
Shanghai, China
Property: Team Work (3)
This project planned the
land use and industry,
and won the first place
among all the village
design of our grade.
ART WORKS
62 63