Embed Size (px)
Citation preview
Computational Analysis of USA Swimming Data
Junfu XuSchool of Computer Engineering and Science,
Shanghai University
Outline
Data Set Description And Representation
Statistical Analysis
Machine Learning
Summary And Outlook
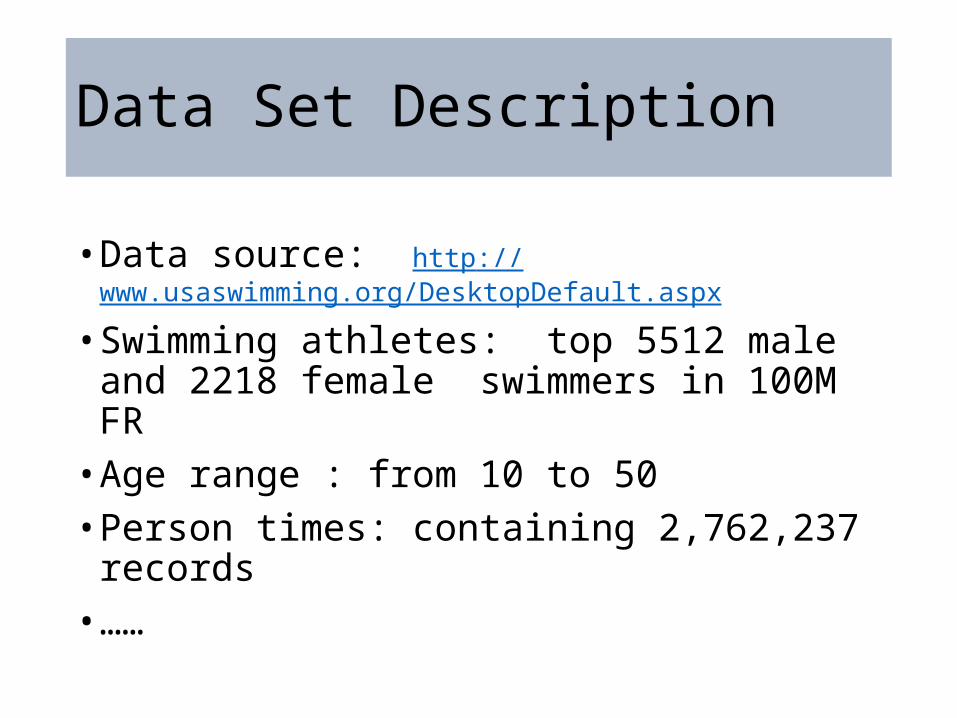
Data Set Description
• Data source: http://www.usaswimming.org/DesktopDefault.aspx
• Swimming athletes: top 5512 male and 2218 female swimmers in 100M FR • Age range : from 10 to 50• Person times: containing 2,762,237 records• ……
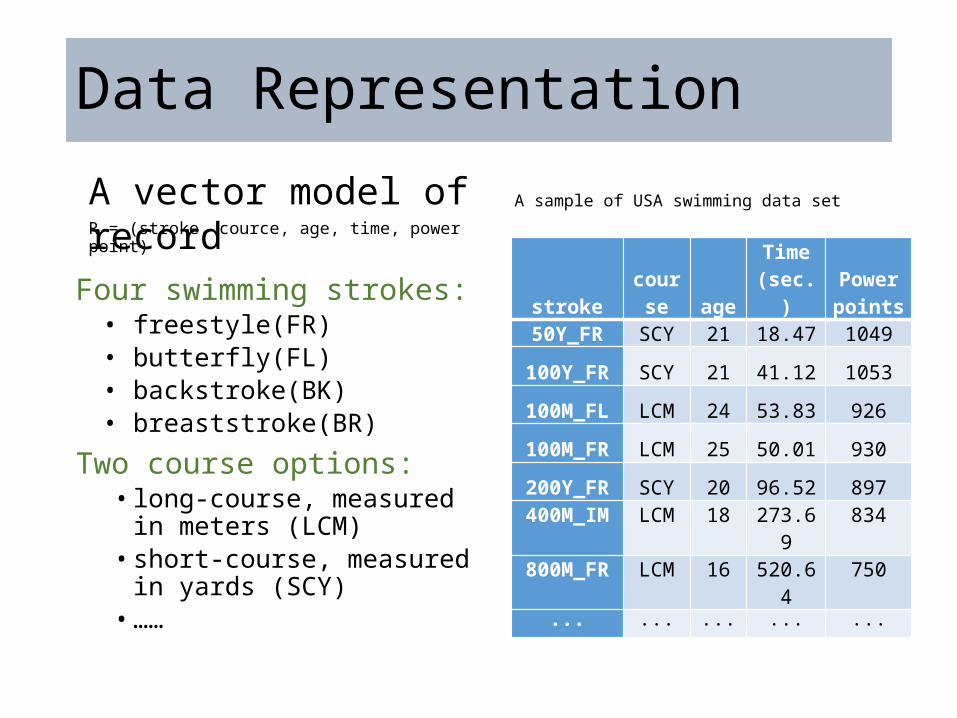
Data Representation
Four swimming strokes: • freestyle(FR)• butterfly(FL)• backstroke(BK) • breaststroke(BR)
Two course options: • long-course, measured in
meters (LCM) • short-course, measured in
yards (SCY)• ……
A sample of USA swimming data set
stroke course ageTime (sec.)
Power points
50Y_FR SCY 21 18.47 1049
100Y_FR SCY 21 41.12 1053
100M_FL LCM 24 53.83 926
100M_FR LCM 25 50.01 930
200Y_FR SCY 20 96.52 897400M_IM LCM 18 273.69 834
800M_FR LCM 16 520.64 750
··· ··· ··· ··· ···
A vector model of recordR = (stroke, cource, age, time, power point)
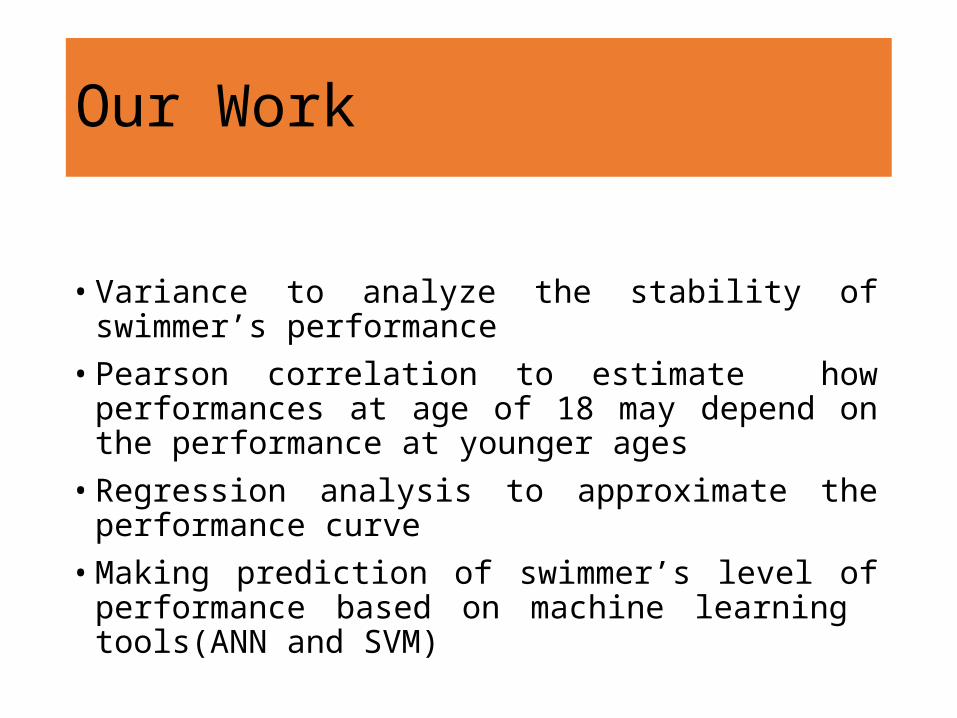
Our Work
• Variance to analyze the stability of swimmer’s performance• Pearson correlation to estimate how performances at age
of 18 may depend on the performance at younger ages• Regression analysis to approximate the performance curve• Making prediction of swimmer’s level of performance based
on machine learning tools(ANN and SVM)
Statistical Analysis
Variance analysis
Pearson correlation coefficient
Regression analysis
Variance Analysis
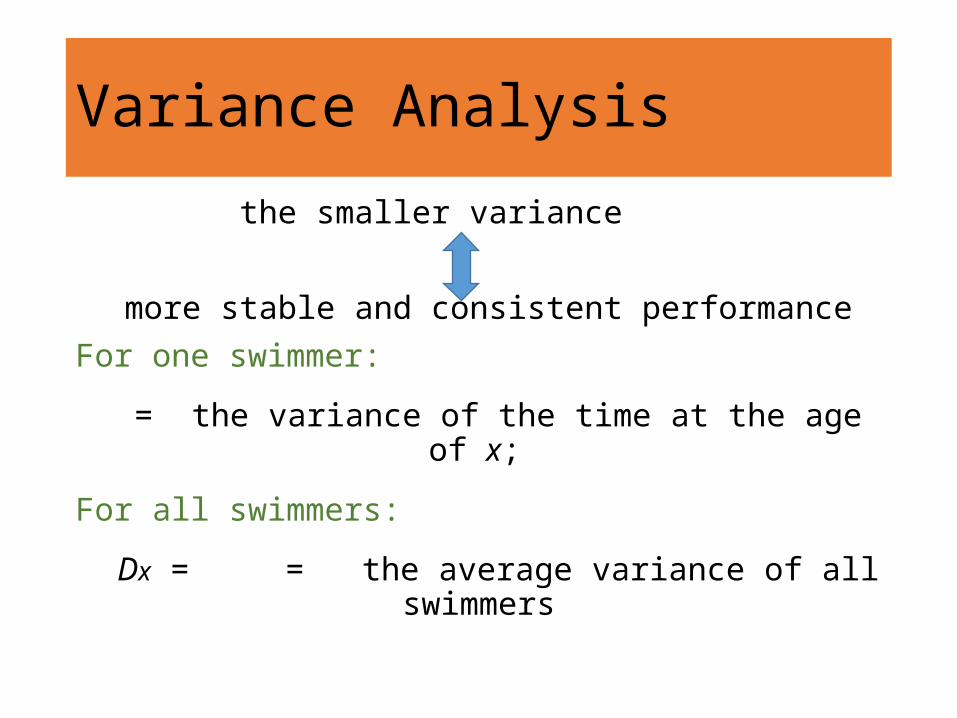
the smaller variance
more stable and consistent performanceFor one swimmer:
= the variance of the time at the age of x;
For all swimmers:
Dx = = the average variance of all swimmers
Variance of Performance
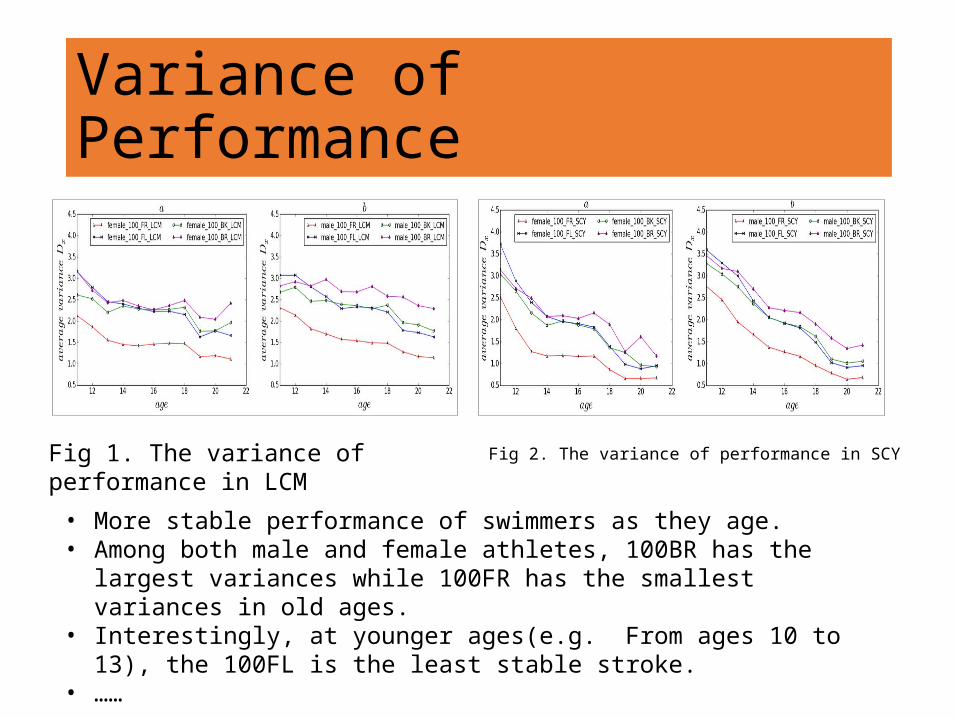
• More stable performance of swimmers as they age.• Among both male and female athletes, 100BR has the largest variances while
100FR has the smallest variances in old ages.• Interestingly, at younger ages(e.g. From ages 10 to 13), the 100FL is the least
stable stroke.• ……
Fig 1. The variance of performance in LCM Fig 2. The variance of performance in SCY
Variances of Time in Different Distances
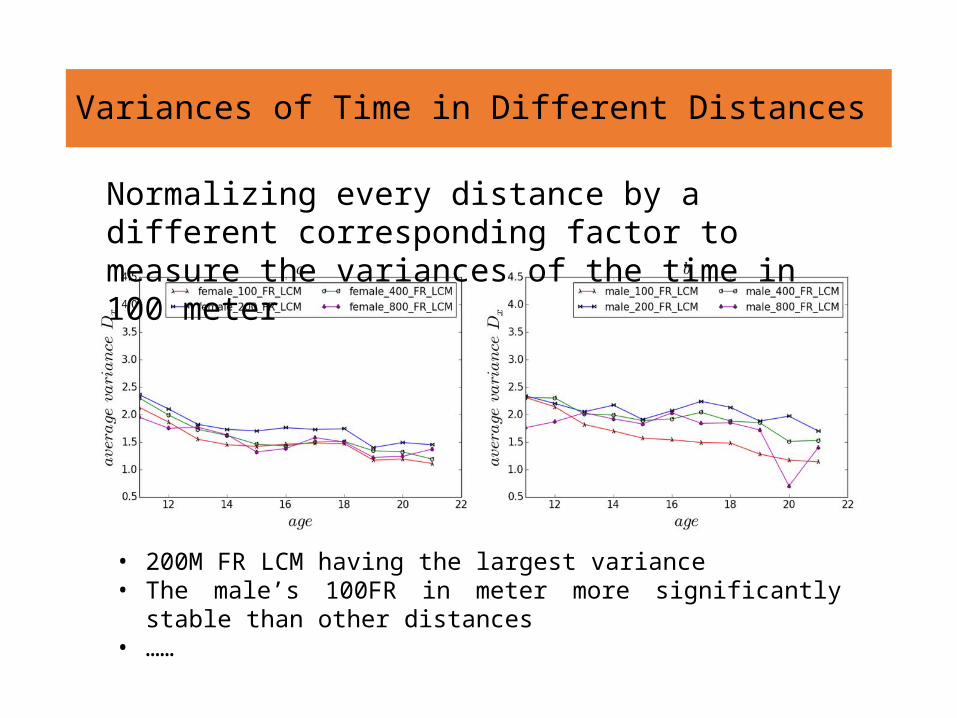
• 200M FR LCM having the largest variance• The male’s 100FR in meter more significantly stable than other
distances• ……
Normalizing every distance by a different corresponding factor to measure the variances of the time in 100 meter
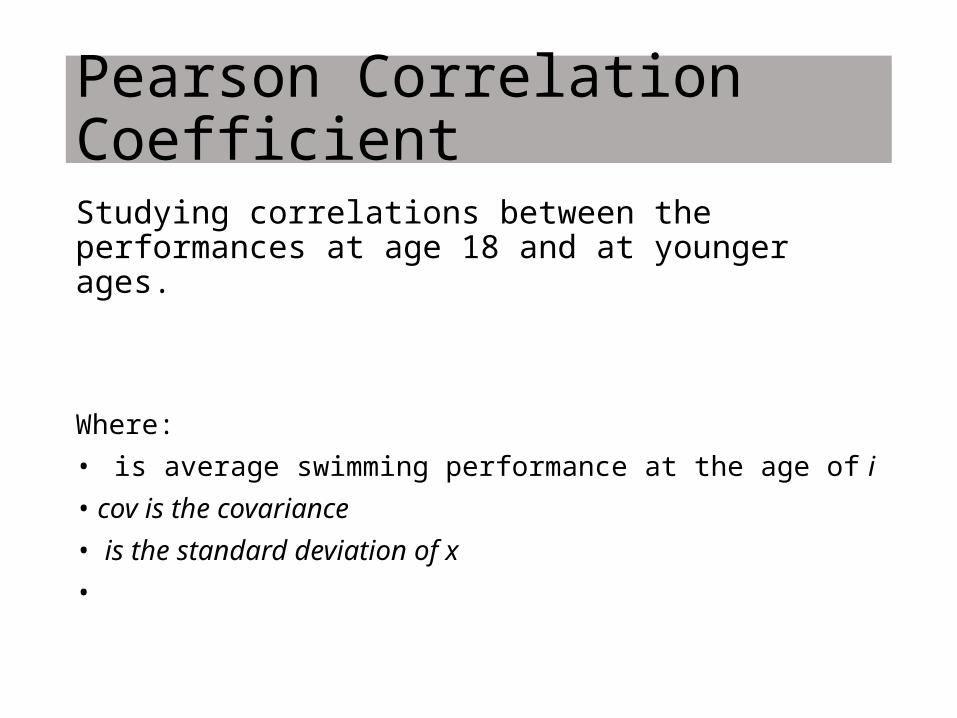
Pearson Correlation CoefficientStudying correlations between the performances at age 18 and at younger ages.
Where:• is average swimming performance at the age of i• cov is the covariance• is the standard deviation of x•
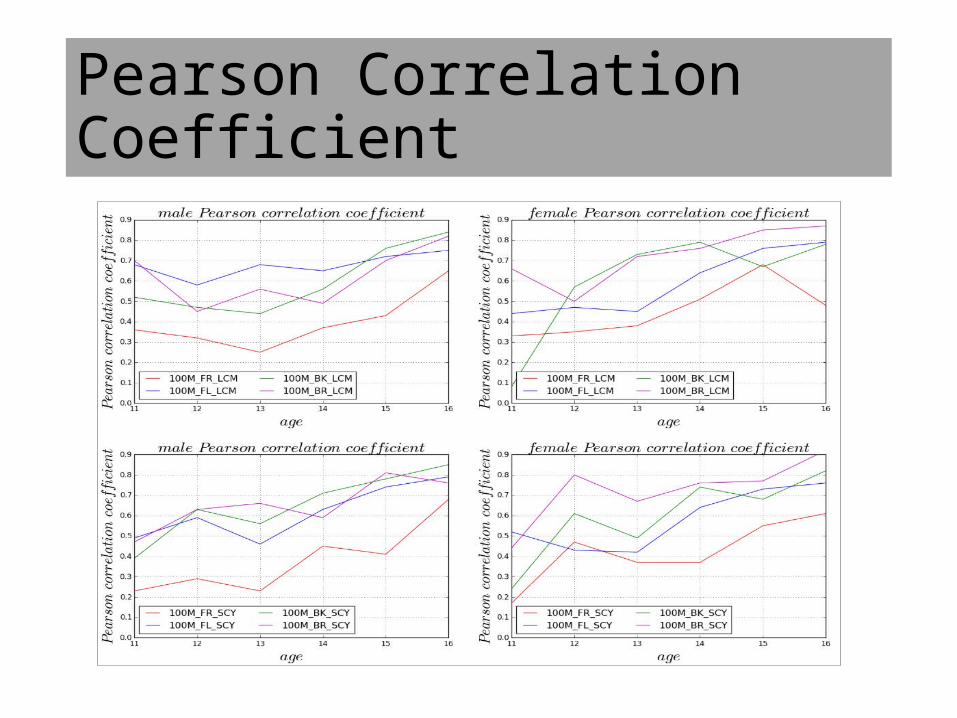
Pearson Correlation Coefficient
Regression Analysis
1. Dividing the athletes into four groups• The top 25%: Group 1; • The top 25-50% : Group 2; • and so on
2. Plotting and fitting• Plotting scatter diagram of swimmers’
performances • Fitting performance with a quadratic polynomial
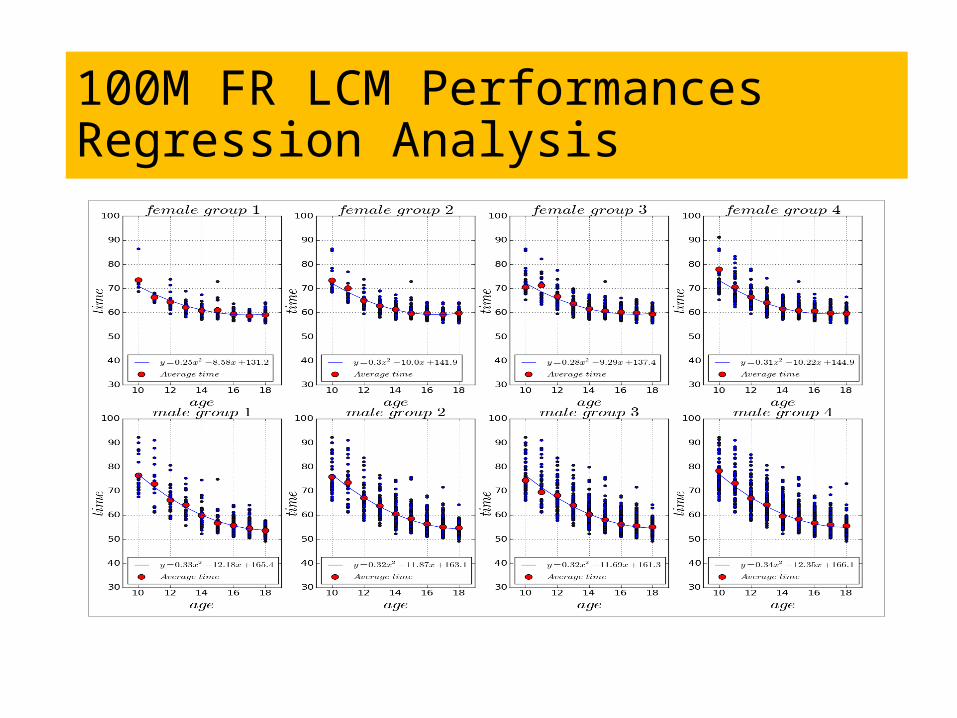
100M FR LCM Performances Regression Analysis
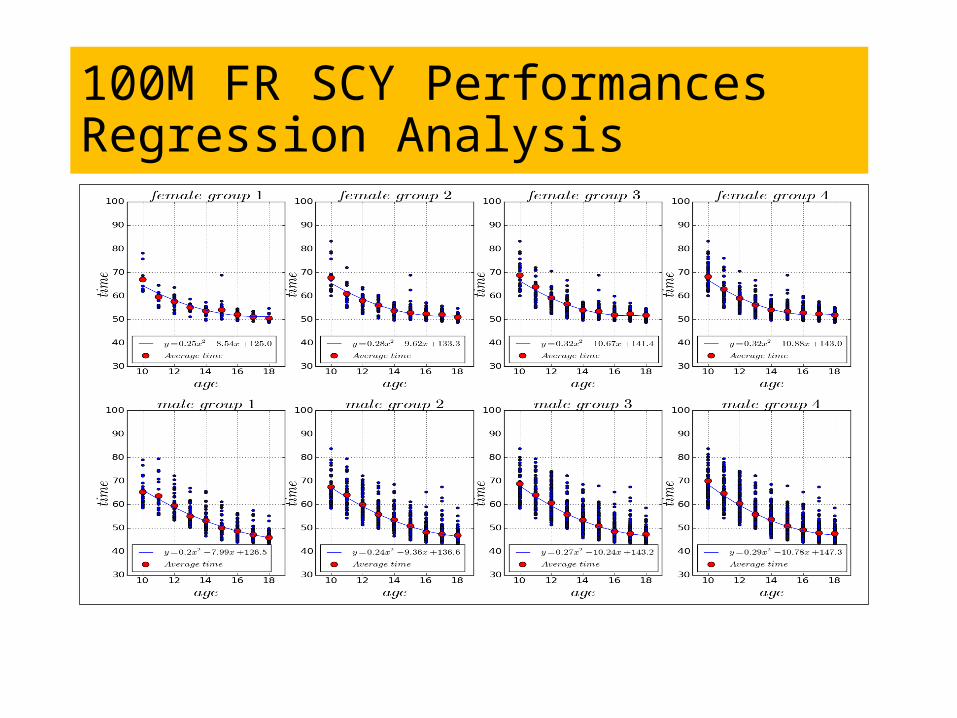
100M FR SCY Performances Regression Analysis
Machine Learning
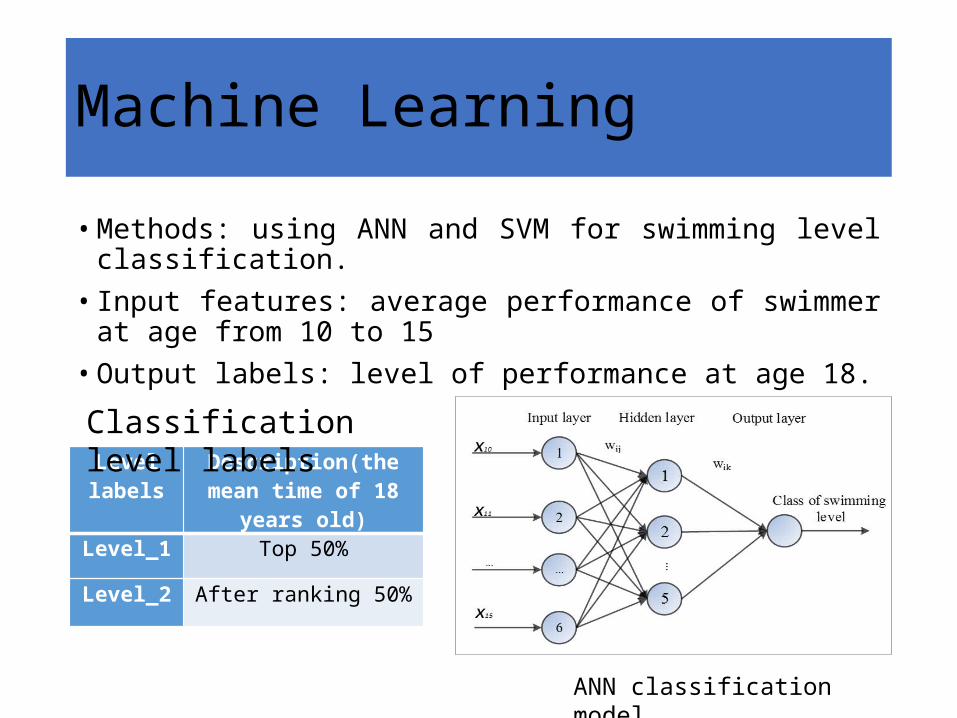
• Methods: using ANN and SVM for swimming level classification.• Input features: average performance of swimmer at age from
10 to 15• Output labels: level of performance at age 18.
Level labels
Description(the mean time of 18 years old)
Level_1 Top 50%
Level_2 After ranking 50%
Classification level labels
ANN classification model
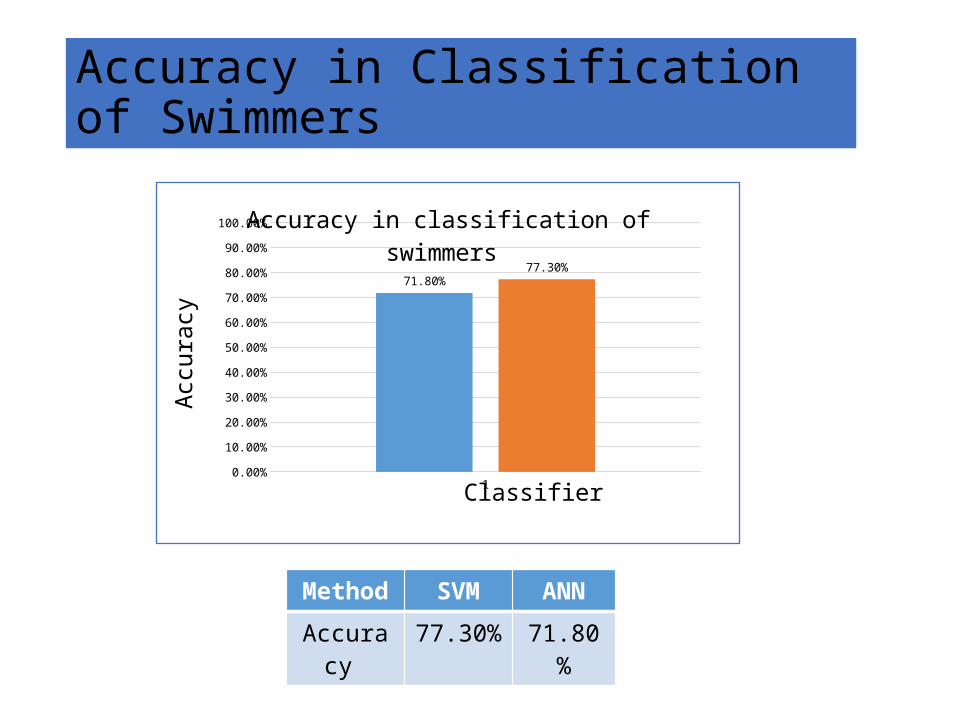
Accuracy in Classification of Swimmers
10.00%
10.00%
20.00%
30.00%
40.00%
50.00%
60.00%
70.00%
80.00%
90.00%
100.00%
71.80%77.30%
Accuracy in classification of swimmers
Classifier
Accu
racy
Method SVM ANN
Accuracy 77.30% 71.80%
Summary And Outlook Summary: We analyze the relationship between swimming performances and ages, strokes and gender. • measuring the stable by variance; • studying the linear correlation by using Pearson correlation;• quadratic curve regression method is used to analysis the
time. • Forecasting and classifying the swimming level via machine
learning tools.
Outlook:• Adding other impact factors, such as height, weight and so
on; • drawing a better conclusion;