Embed Size (px)
Citation preview

COMPUTER VISION APPROACHES FOR BIG GEO-SPATIAL DATA: QUALITY ASSESSMENT OF RASTER TILED WEB MAPS
FOR SMART CITY SOLUTIONS
Alexey Noskov
Dr. Alexey Noskov, GIScience Research Group, Heidelberg University, Im Neuenheimer Feld 348, Heidelberg, Germany, +49 6221 54-5506, [email protected]
Abstract Interactive maps are an important component of Smart City solutions. Most of map services rely on Raster Tiled Web Maps (RTWM). Despite of high popularity of interactive maps, the RTWM quality assessment problem remains unsolved. Two main reasons of this situation are as follows. First, commercial companies do not provide access to the source vector layers and restrict massive access to raster tiles. Usually, they allow users to access raster tiled maps only through official APIs. Thus, massive retrieval of web map raster pieces is prohibited. Second, ground-truth reference datasets, in the most cases, are not available and expensive. In this work, an approach to automatic quality assessment of RMWM is proposed. The approach is based on Canny edge detection algorithm. This algorithm enables to extract edges from raster images. Extracted edges allow users to calculate quantity of information. The method was applied for raster tiles of zoom level 19 in a pilot sites. OpenStreetMap and Google Maps tiles were evaluated. 55693 raster files were assessed two times in May 2017 and February 2018. HTML5 facilities provided by modern web browsers and official APIs were used for development. Implemented solutions enable to estimate completeness of information, positional accuracy and timeliness comparably. This approach will be utilized by a number of Smart City solutions based on interactive web maps in tree pilot sites for decision making processes. The results of analysis will be portrayed in a form of interactive web maps available for public access and will be a part of the Geo-Spatial Data Repository (GSDR, https://wgn.gsdr.gq) for quality assessment of open data. GSDR is implemented as part of the WeGovNow (http://www.wegovnow.eu/) web platform developed for a number of Smart City solutions in Europe.
Keywords: Data quality, Computer Vision, Big Data, Smart City, Tiled Web Maps
INTRODUCTION
The WeGovNow (WGN) project (Boella et al., 2018) can be considered as an e-Government smart city solution integrating a number map-centered web applications designed to increase citizens’ involvement into government and improvement of urban areas. Several applications for collaborative decision making support, on-line voting, dissemination of initiatives and reporting/solving actual urban problems are developed and integrated into a holistic web portal.
It has been decided to use OpenStreetMap (OSM) as a background map for all applications delivered by WGN. Thus, OSM’s Raster Tiled Web Maps (RTWM) are intensively used by all WGN components. The most of applications are map-centered. Most of time users see OSM tiles occupying almost whole screens of devices. Hence, it is extremely important to assess the quality of OSM tiles.
Originally, some WGN components utilized Google Maps (GM) RTWM. GM remains, probably, the most popular base web map. Today, the biggest players (e.g., Booking.com) build their services on a top of Google Maps. At the same time, non-profit and government funded services are often relied on OSM.
It is important to know the quality of OSM RTWM in comparison to GM. It allows defining problematic areas on OSM. Low quality of RTWM leads to problems with usability of the services. Only few works tried to resolve this problem. This work introduces a prototype framework for automatic quality assessment of OSM tiles in comparison to GM.
In the frame of the WGN project, 3 pilot sites are considered: London (Southwark), Turin (Italy) and San Donà di Piave (Italy). The areas of the pilot sites are too big for any king of a manual analysis. Therefore, a novel automatic approach to comparable quality assessment of RTWM is proposed in this article.
The work is implemented as a part of Geo-Spatial Data Repository for quality assessment of WGN data (Noskov and Zipf, 2018). In the future, the results will be delivered by GSDR.
Proceedings, 7th International Conference on Cartography and GIS, 18-23 June 2018, Sozopol, Bulgaria ISSN: 1314-0604, Eds: Bandrova T., Konečný M.
296

RELATED WORK
(Liu and Zhenghong, 2014) stated that aside from agreeing that smart cities are built on intelligent sensing technology, and decision platforms characterized by the Internet of Things (IoT) and cloud computing, and that they enrich material and cultural life and promote economic and social progress, practitioners and academics have not reached a clear and uniform conceptual understanding of 'smart'. (Meijer and Bolivar, 2016) defines the smartness of a city as “ability to attract human capital and to mobilize this human capital in collaborations between the various (organized and individual) actors through the use of information and communication technologies”.
(Bertot et al., 2014) discussed the big and open data issues, policies and recommendations in the context of e-Government. They specify several important questions actual for this paper. They noticed that Open Data are based on the idea that certain kinds of data should exist beyond the limits of copyright, patents, censorship, or other parameters often placed around data. In the considered work they define that Big Data are datasets that are extremely large and/or complex, offering the possibilities of identifying previously impossible levels of insights, granularity of analysis, and relationships between elements in the dataset. Big Data sets have become possible due to recent increases storage and processing capacity, as well as increases in the number of devices collecting and sharing data. Big Data require three key infrastructure ingredients: 1) a platform for organizing, storing, and making data accessible; 2) computing technology and power that can process large-scale datasets; and 3) data formats that are structured and usable.
(Ciepłuch et al., 2010) proved that “there is very few peer-reviewed reports and articles which look to compare OpenStreetMap with proprietary web mapping systems; this is potentially due in no small part to the difficulty of accessing vector data from proprietary systems such as Google Maps and Bing Maps”. They propose a manual approach for quality assessment. Many works devoted to comparison of OSM data with ground-truth reference datasets (e.g., (Haklay, 2008)).
For the implementation of the main approach based on computer vision algorithms a Canny Edge Detection approach is utilized in the frame this article (Canny, 1986; Sonka et al., 1999; Zimmermann, 2000).
SOURCE DATA
In the frame of the WeGovNow (WGN) project, OpenStreetMap (OSM) is utilized as a background map in all web applications. Thus, it is necessary to assess the quality of raster tiles provided by OSM. Ground-truth reverence datasets are not available in the frame of the project. Therefore, we decided to use raster tile data delivered by other providers for comparable tile evaluation. Google Maps (GM) tiles are used for this. Google Maps is the most popular tile provider for web maps. Thus, comparison of GM and OSM allows indicating problematic areas.
OSM RTWM are rendered from zoom level 0 to zoom level 19. Zoom level 19 provides the largest scale maps; tiles of this zoom levels were used for quality assessment. Tiles in zoom level 19 have been assessed for the area of San Donà di Piave. San Donà di Piave is a city and commune of province of Venice, Veneto, northern Italy. The city is one of the pilot sites of the WGN project. The municipality of San Donà di Piave is deeply involved into the project. In Figure 1, overview maps are presented. The left map represents a blue boundary of the pilot site. The right map depicts considered OSM and GM tiles in zoom level 19.
Proceedings, 7th International Conference on Cartography and GIS, 18-23 June 2018, Sozopol, Bulgaria ISSN: 1314-0604, Eds: Bandrova T., Konečný M.
297
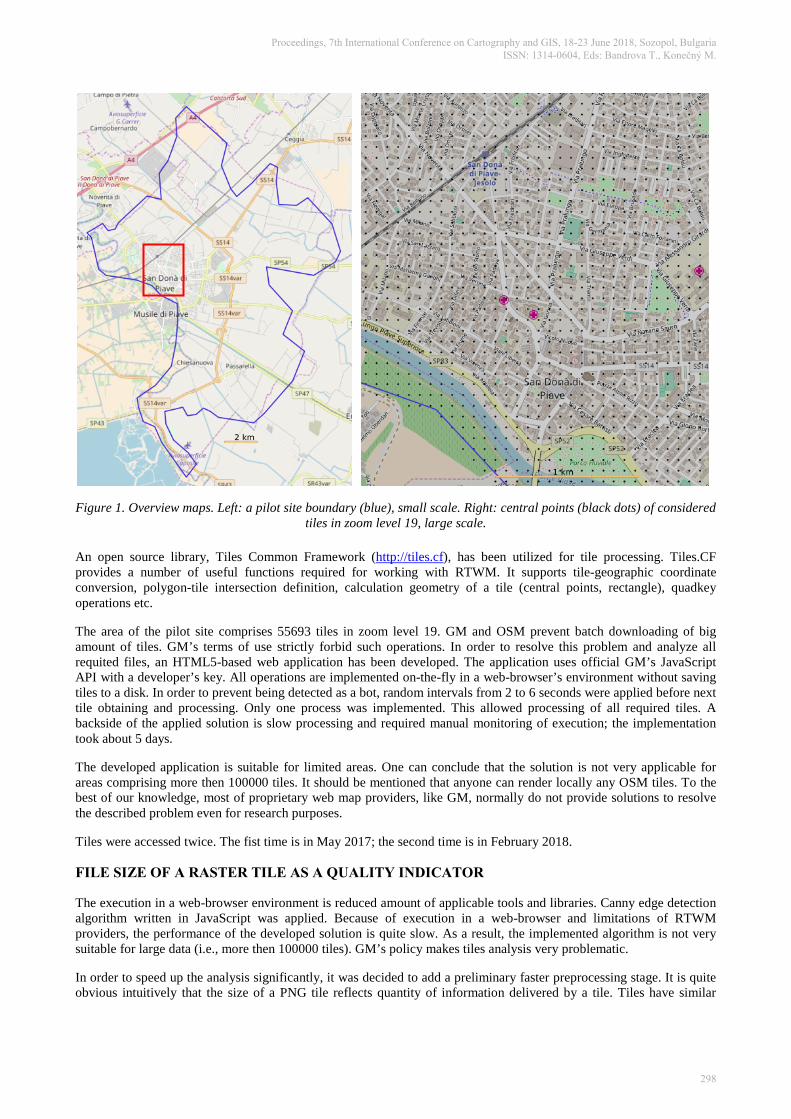
Figure 1. Overview maps. Left: a pilot site boundary (blue), small scale. Right: central points (black dots) of considered tiles in zoom level 19, large scale.
An open source library, Tiles Common Framework (http://tiles.cf), has been utilized for tile processing. Tiles.CF provides a number of useful functions required for working with RTWM. It supports tile-geographic coordinate conversion, polygon-tile intersection definition, calculation geometry of a tile (central points, rectangle), quadkey operations etc.
The area of the pilot site comprises 55693 tiles in zoom level 19. GM and OSM prevent batch downloading of big amount of tiles. GM’s terms of use strictly forbid such operations. In order to resolve this problem and analyze all requited files, an HTML5-based web application has been developed. The application uses official GM’s JavaScript API with a developer’s key. All operations are implemented on-the-fly in a web-browser’s environment without saving tiles to a disk. In order to prevent being detected as a bot, random intervals from 2 to 6 seconds were applied before next tile obtaining and processing. Only one process was implemented. This allowed processing of all required tiles. A backside of the applied solution is slow processing and required manual monitoring of execution; the implementation took about 5 days.
The developed application is suitable for limited areas. One can conclude that the solution is not very applicable for areas comprising more then 100000 tiles. It should be mentioned that anyone can render locally any OSM tiles. To the best of our knowledge, most of proprietary web map providers, like GM, normally do not provide solutions to resolve the described problem even for research purposes.
Tiles were accessed twice. The fist time is in May 2017; the second time is in February 2018.
FILE SIZE OF A RASTER TILE AS A QUALITY INDICATOR
The execution in a web-browser environment is reduced amount of applicable tools and libraries. Canny edge detection algorithm written in JavaScript was applied. Because of execution in a web-browser and limitations of RTWM providers, the performance of the developed solution is quite slow. As a result, the implemented algorithm is not very suitable for large data (i.e., more then 100000 tiles). GM’s policy makes tiles analysis very problematic.
In order to speed up the analysis significantly, it was decided to add a preliminary faster preprocessing stage. It is quite obvious intuitively that the size of a PNG tile reflects quantity of information delivered by a tile. Tiles have similar
Proceedings, 7th International Conference on Cartography and GIS, 18-23 June 2018, Sozopol, Bulgaria ISSN: 1314-0604, Eds: Bandrova T., Konečný M.
298

widths and heights (256x256 pixels). Thus, if a tile has bigger size it provides more information. In other words, the size of tiles can be used as data completeness indicator.
In Figure 3, tile updates from May 2017 to February 2018 are depicted. Tiles were compared by size. The same size indicates unchanged tiles. Unchanged tiles are depicted by gray; updated tiles are green. According to the maps, OSM provides more updates than GM.
Figure 2. Tile updates from 2017 to 2018. Green - updated tiles, Grey - same tiles. Left – OSM, Right - GM
Tiles were updated in city areas and around roads. Bigger roads are distinguished by the wider updated buffer around. In general, the both maps are very similar. This indicates that the both maps do not comprise significant lack of data and poorly mapped areas. GM and OSM were intensively updated and only unpopulated areas remained unchanged. Moreover, the maps demonstrate effectiveness of proposed size-based analysis for evaluation of data timeliness.
In Figure 3, tile sizes in bytes are presented. Features were classified using the Natural Breaks (Jenks) algorithm. 10 classes are distinguished. All the following maps use the same approach to classification of map features. According to Figure 3, one can conclude, that OSM provide recognizably more information then GM. A big red-yellow spot in the center of the map shows high completeness of OSM data in comparison to GM. The red-yellow spot is much wider and occupies almost whole area of the city.
Proceedings, 7th International Conference on Cartography and GIS, 18-23 June 2018, Sozopol, Bulgaria ISSN: 1314-0604, Eds: Bandrova T., Konečný M.
299

Figure 3. Size of tiles in bytes. Left - OSM, Right - GM. Grey - empty tiles. February 2018
In Table 1, overall file sizes are compared. The sizes of tiles were summarized according tiles providers and years. The table allows comparing quantity of information. According to the table, the overall sizes of tiles in the considered pilot site were slightly increased for OSM (+1.4%) and significantly for GM (+9.1%). That indicated improvement of GM data completeness in the considered period. In comparison to GM, OSM tiles have bigger size (+57.3% in 2017 and +46.16% in 2018). It should be mentioned, that the gap between providers was significantly decreased (ca. 10%) from 2017 to 2018. That is indicated significant improvement of GM data.
Table 1.OSM and GM overall file sizes comparison
OSM GM OSM/GM
May 2017 195984684 124626288 157.3%
February 2018 198682476 135936882 146.16%
2018/2017 101.4% 109.1%
Figure 4 represents a histogram of sizes of accessed tiles (both OSM and GM). It should be mentioned that the left part of the histogram comprises mainly tiles providing low quantity information. The most of such tiles are empty or comprise background patterns without boundaries of map features. These tiles can be indicated by groups of tiles with the similar size. The distribution of tile with sizes more then 1500 bytes is decreased exponentially. Big size of tiles represents high quality of data. In Figure 5, tiles with maximal sizes are represented. The upper row depicts a GM time with maximal size. Two GM tiles are presented for 2017 and 2018. Additionally, a correspondent OSM tiles are shown. From left to right (upper row) sizes are as follows (in bytes): 12901, 10780, 3889 and 3822. The lower row represents a biggest OSM tile for 2 years in comparison to GM. From left to right (lower row) sizes are as follows (in bytes): 12014, 11935, 3091 and 3419. Note that the size of GM tiles (the lower row) was decreased; it is happened because removal of a redundant (duplicating) road label. The upper row represents a shopping mall area. GM provides multiple POI and good partitioning details, while the OSM tile depicts only one POI and quite poor partitioning details. In the lower row, road infrastructure is mainly presented. OSM provides much richer geometric and semantic information then GM.
Proceedings, 7th International Conference on Cartography and GIS, 18-23 June 2018, Sozopol, Bulgaria ISSN: 1314-0604, Eds: Bandrova T., Konečný M.
300
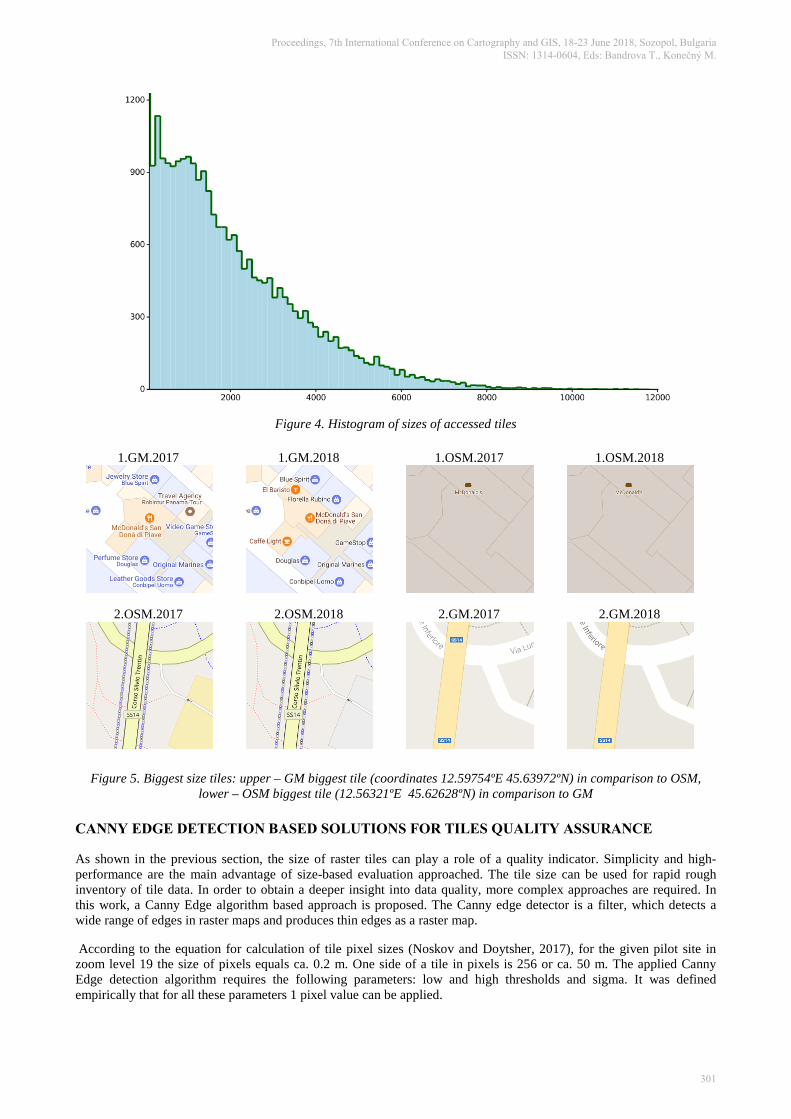
Figure 4. Histogram of sizes of accessed tiles
1.GM.2017
1.GM.2018
1.OSM.2017
1.OSM.2018
2.OSM.2017
2.OSM.2018
2.GM.2017
2.GM.2018
Figure 5. Biggest size tiles: upper – GM biggest tile (coordinates 12.59754ºE 45.63972ºN) in comparison to OSM, lower – OSM biggest tile (12.56321ºE 45.62628ºN) in comparison to GM
CANNY EDGE DETECTION BASED SOLUTIONS FOR TILES QUALITY ASSURANCE
As shown in the previous section, the size of raster tiles can play a role of a quality indicator. Simplicity and high-performance are the main advantage of size-based evaluation approached. The tile size can be used for rapid rough inventory of tile data. In order to obtain a deeper insight into data quality, more complex approaches are required. In this work, a Canny Edge algorithm based approach is proposed. The Canny edge detector is a filter, which detects a wide range of edges in raster maps and produces thin edges as a raster map.
According to the equation for calculation of tile pixel sizes (Noskov and Doytsher, 2017), for the given pilot site in zoom level 19 the size of pixels equals ca. 0.2 m. One side of a tile in pixels is 256 or ca. 50 m. The applied Canny Edge detection algorithm requires the following parameters: low and high thresholds and sigma. It was defined empirically that for all these parameters 1 pixel value can be applied.
Proceedings, 7th International Conference on Cartography and GIS, 18-23 June 2018, Sozopol, Bulgaria ISSN: 1314-0604, Eds: Bandrova T., Konečný M.
301

In Figure 6, it is demonstrated how the algorithm works. It generates a raster map comprising detected edges (depicted by yellow). In order to utilize the generated edges in the future calculation and simplify the process, the raster edges are converted to a vector format. Each pixel is converted to a point. Number of point represents quantity of information delivered by a tile. Moreover, the points can be used to compare tiles delivered by different providers. To implement this, OSM and GM tile edges were converted to points. Then, shortest distances from each point of an OSM tile to the closest point of a GM tile were calculated. These distances are utilized for further calculations.
Figure 6. The Canny edge detector implementation (left – original tile, right - result)
Several measures for each tile are defined using shortest distances. Average, median and maximal shortest distances were calculated for every tile. Moreover, the standard deviation of the shortest distances was calculated. It makes no sense to calculate the minimal shortest distance, because in the most cases it equals 0. The selected parameters allows estimating positional accuracy comparably. OSM data are mainly base on digitalized contours on Bing Imagery and GPS tracks. The both ways may lead to low positional accuracy of map features. In contrast to this, GM tiles often rely on accurate statutory data. Thus, comparison of OSM and GM contour allows indicating positional accuracy of map features. It is not applicable for other types of accuracy. Moreover, the defined parameters provide an insight into the shortest distance distribution in a tile.
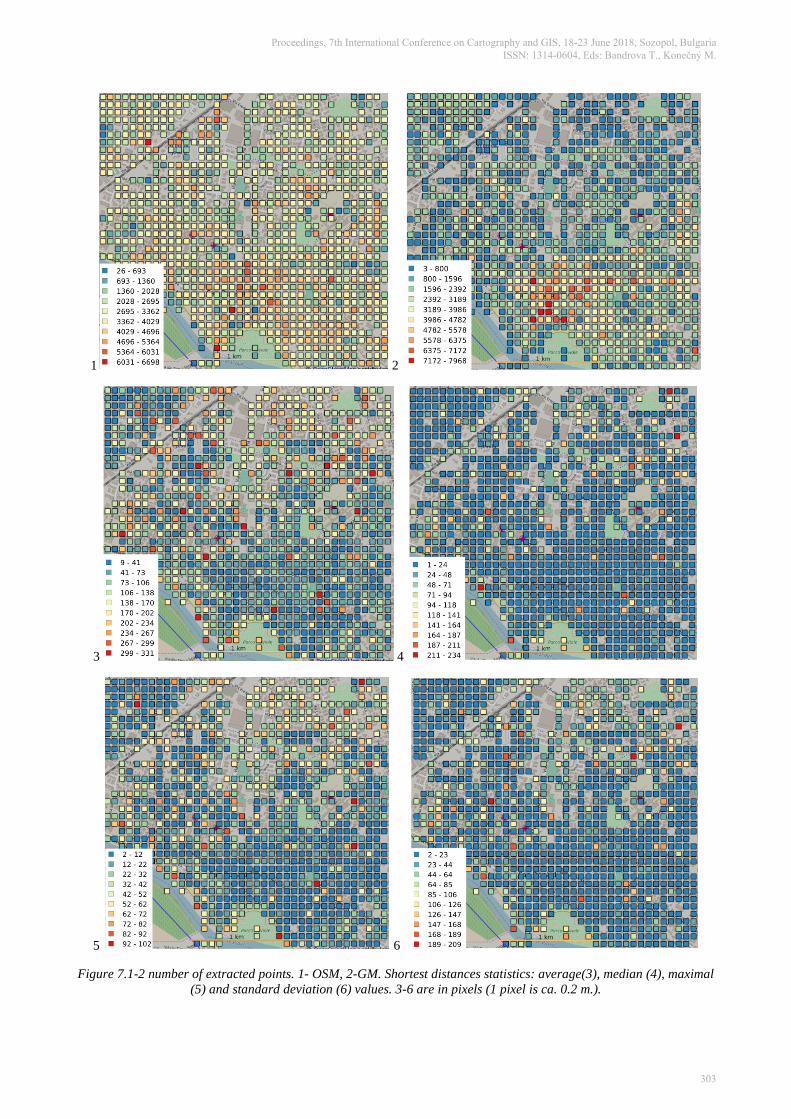
The results of the calculation are utilized for building series of maps presented in Figure 7. Maps 1-2 depict a number of extracted point. It can be used for comparable assessment of data completeness. In general, OSM provide more information then GM. It proves applicability of the proposed (see the previous section) tile-size approach.
The maps 2-6 (Figure 7) depict average, median, maximal shortest distances between points of the two tile types and the standard deviation correspondingly. Average and median values allows users to approximately evaluate positional accuracy of the OSM data in comparison to GM. Blue rectangle indicates tiles with high accuracy. From the maps one can conclude that in the most cases the positional discrepancies are up to 2 meters. It allows us to conclude that OSM provides data, which are accurate enough for the considered solutions. The maps 5-6 allow estimating the applicability of the parameters depicted by the maps 3-4 (average and median). Blue tiles represent higher applicability.
It should be mentioned that the further research and involvement of more pilot sites are required. Currently, only basic and empirical analysis is conducted. Using the proposed solutions only comparable results could be obtained. Further improvement of the framework is required.
As mentioned earlier, the implementation on the Canny Edge detection algorithm in JavaScript was utilized. Because of imperfections of the implementations about 8% of tiles were not analyzed.
Proceedings, 7th International Conference on Cartography and GIS, 18-23 June 2018, Sozopol, Bulgaria ISSN: 1314-0604, Eds: Bandrova T., Konečný M.
302
1 2
3 4
5 6
Figure 7.1-2 number of extracted points. 1- OSM, 2-GM. Shortest distances statistics: average(3), median (4), maximal (5) and standard deviation (6) values. 3-6 are in pixels (1 pixel is ca. 0.2 m.).
Proceedings, 7th International Conference on Cartography and GIS, 18-23 June 2018, Sozopol, Bulgaria ISSN: 1314-0604, Eds: Bandrova T., Konečný M.
303

CONCLUSIONS
This paper introduces solutions for automatic analysis of raster tile data. Results of such analyst are suitable for comparable quality assessment of tile data. The two main stages are proposed. The first is based on tile size analysis; the second utilizes computer vision algorithms.
The size-based analysis provides very promising results. Because simplicity and high performance, it can be applied for large datasets. The approach allows estimating timeliness and completeness of tile data. Properties of the PNG format enable to consider the size of a tile as a measure representing quantity of the information. Moreover, periodical tile access make possible to indicate timeliness of data. The size-based analysis can be applied as a preliminary step.
In order to obtain advanced measures, computer vision algorithms are applied. Edges recognized in raster tiles are extracted and analyzed. The calculated parameters enable to assess completeness, timeliness and positional accuracy comparably in a more advanced manner.
The current implementation is relatively slow and not suitable for more than 100000 tiles. The edge detection implementation is not perfect and requires further improvements. The proposed approach requires further verification and improvement. More pilot sites should be involved.
ACKNOWLEDGMENTS
This work has been funded by the European Union's Horizon 2020 research and innovation programme under grant greement n. 693514 ("WeGovNow"). The article reflects only the authors' view and the European Commission is not responsible for any use that may be made of the information it contains.
REFERENCES
Boella, G., Francis, L., Grassi, E., Kistner, A., Nitsche, A., Noskov, A., Sanasi, L., Savoca, A., Schifanella, C., and Tsampoulatidis, I., “Wegovnow: a map based platform to engage the local civic society,” Proceedings of the 8th International Workshop on Location and the Web - LocWeb‘18 (2018).
Noskov, A. and Zipf, A., “Backend and Frontend Strategies for Deployment of WebGIS Services”, Proceedings of the Sixth International Conference on Remote Sensing and Geoinformation of Environment 26-29 March, 2018 – Cyprus (2018).
Meijer, Albert, and Manuel Pedro Rodríguez Bolívar. "Governing the smart city: a review of the literature on smart urban governance." International Review of Administrative Sciences 82.2 (2016): 392-408.
Bertot, John Carlo, et al. "Big data, open government and e-government: Issues, policies and recommendations." Information Polity 19.1, 2 (2014): 5-16.
Ciepłuch, Błażej, Ricky Jacob, Peter Mooney, and Adam C. Winstanley. "Comparison of the accuracy of OpenStreetMap for Ireland with Google Maps and Bing Maps." In Proceedings of the Ninth International Symposium on Spatial Accuracy Assessment in Natural Resuorces and Enviromental Sciences 20-23rd July 2010, p. 337. University of Leicester, 2010.
Noskov A. and Doytsher Y., "A Linear Approach to Improving the Accuracy of City Planning and OpenStreetMap Road Datasets" International Journal on Advances in Systems and Measurements, vol. 10, Number 1&2, ISSN: 1942-261x, pp. 23-34, (2017).
J. Canny. A Computational Approach to Edge Detection. In: IEEE Trans. Pattern Anal. Mach. Intell. 8.6 (June 1986), pp. 679-698. issn: 0162-8828.
M. Sonka, V. Hlavac, and R. Boyle. Image processing, analysis, and machine vision. PWS Pub. Pacific Grove (1999).
P. Zimmermann. A new framework for automatic building detection analysing multiple cue data. In: International Archives of Photogrammetry and Remote Sensing 33.B3/2; PART 3 (2000), pp. 1063-1070.
Alenezi, H., Tarhini, A. and Masa'deh, R., “Investigating the Strategic Relationship between Information Quality and E-Government Benefits: A Literature Review”, International Review of Social Sciences and Humanities, ISSN: 2248-9010, vol.9, num.1, pp.33-50, 2015.
Proceedings, 7th International Conference on Cartography and GIS, 18-23 June 2018, Sozopol, Bulgaria ISSN: 1314-0604, Eds: Bandrova T., Konečný M.
304

BIOGRAPHY
Dr. Alexey Noskov is a PostDoc Researcher at the GIScience Research Group of the Institute of Geography in Heidelberg University. He obtained MSc in the Lomonosov Moscow State University in 2007. His PhD degree was granted at Israel Institute of Technology (The Technion) for the work “3D Generalization of Urban Environment” in 2016. Currently, he is working on the WeGovNow project.
Proceedings, 7th International Conference on Cartography and GIS, 18-23 June 2018, Sozopol, Bulgaria ISSN: 1314-0604, Eds: Bandrova T., Konečný M.
305