Embed Size (px)
Citation preview
�A Geo Spatial Analysis
Presented by: Kiran Sharma andChandrakant Pawe
NORTH EASTERN HILL UNIVERSITY,Shillong , Meghalaya
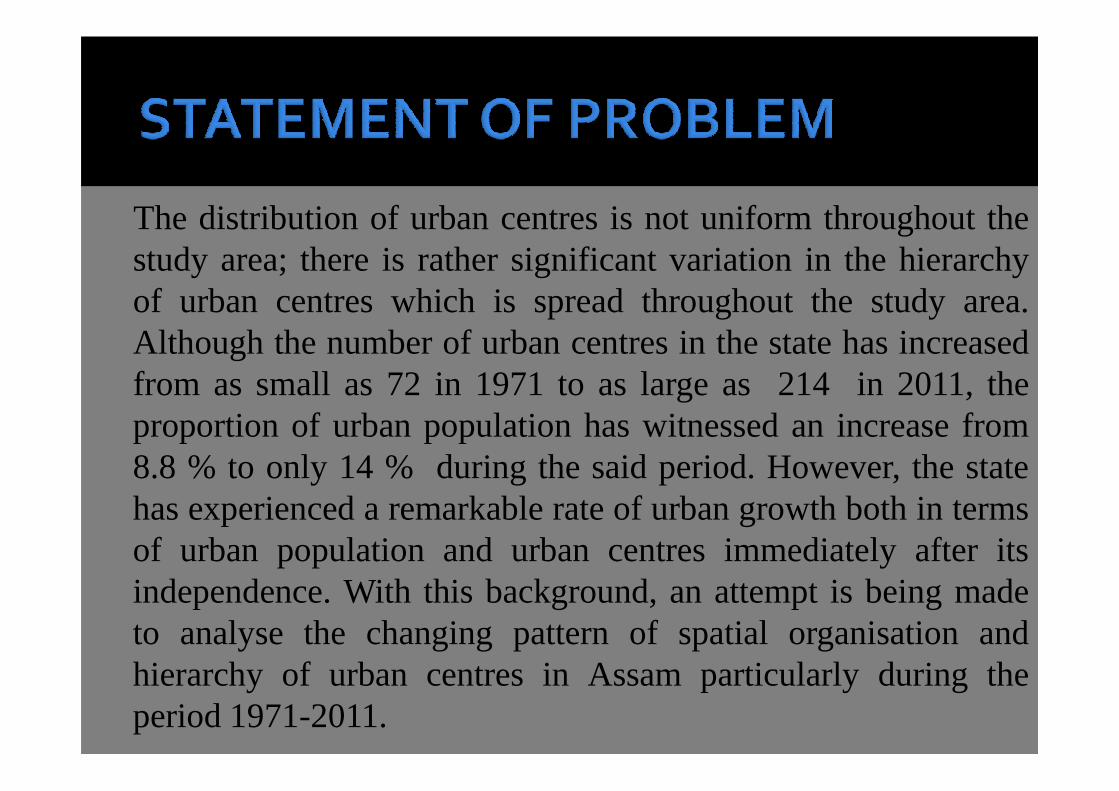
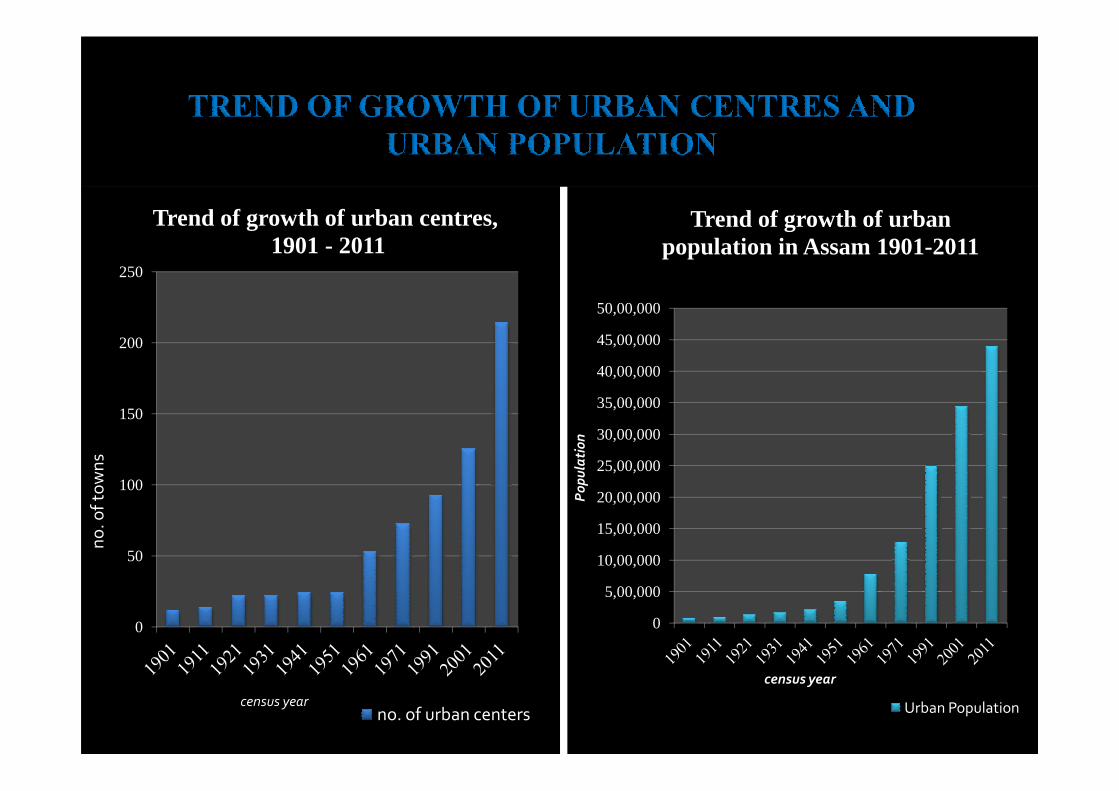
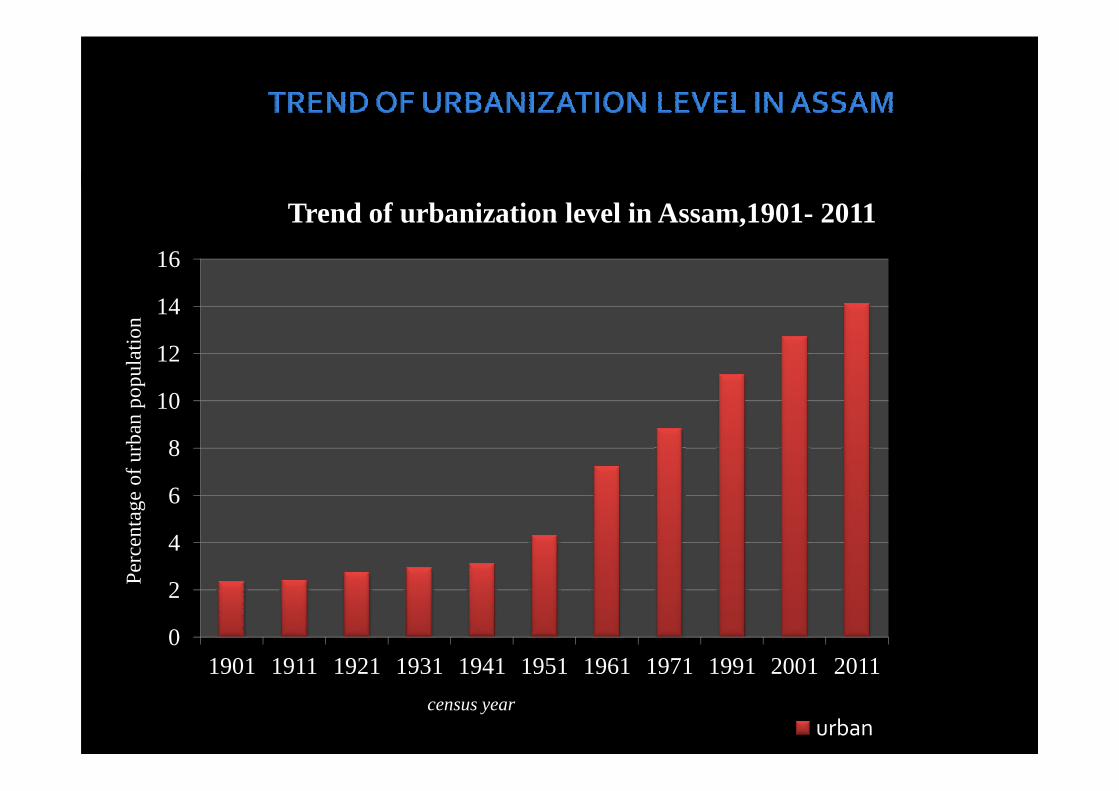
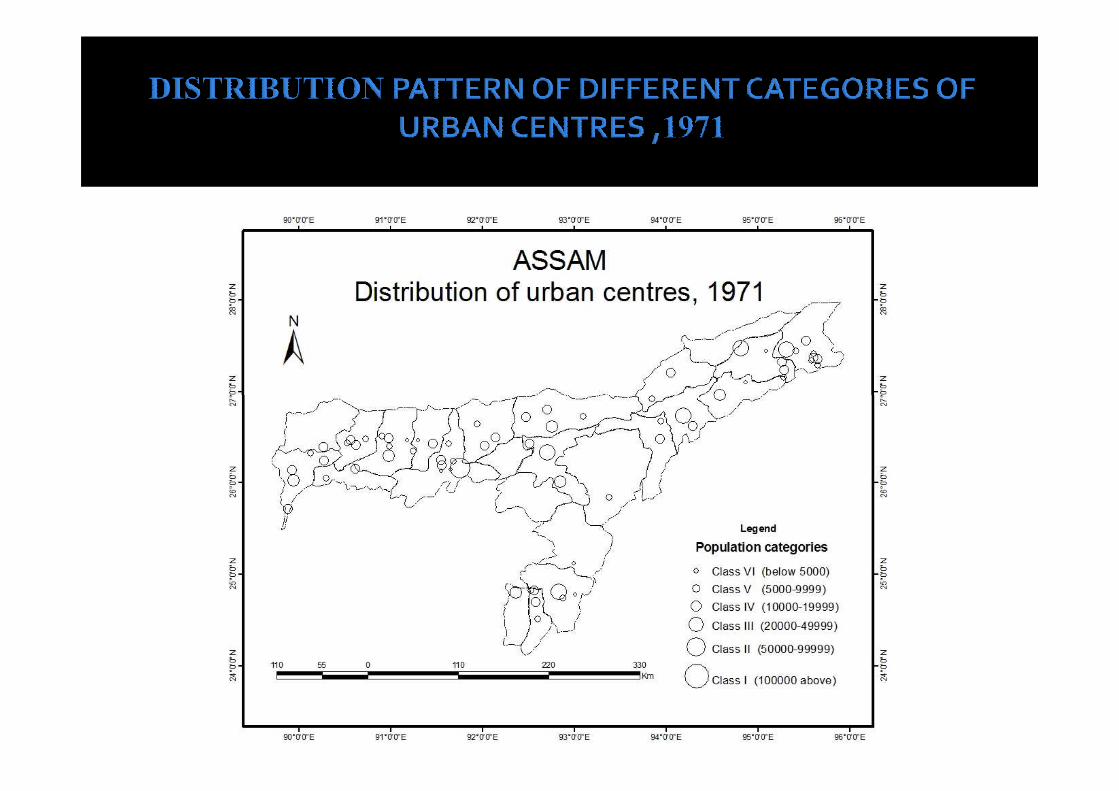
The distribution of urban centres is not uniformthroughout thestudy area; there is rather significant variation in the hierarchyof urban centres which is spread throughout the study area.Although the number of urban centres in the state has increasedfrom as small as 72 in 1971 to as large as 214 in 2011, thefrom as small as 72 in 1971 to as large as 214 in 2011, theproportion of urban population has witnessed an increase from8.8 % to only 14 % during the said period. However, the statehas experienced a remarkable rate of urban growth both in termsof urban population and urban centres immediately after itsindependence. With this background, an attempt is being madeto analyse the changing pattern of spatial organisation andhierarchy of urban centres in Assamparticularly during theperiod 1971-2011.
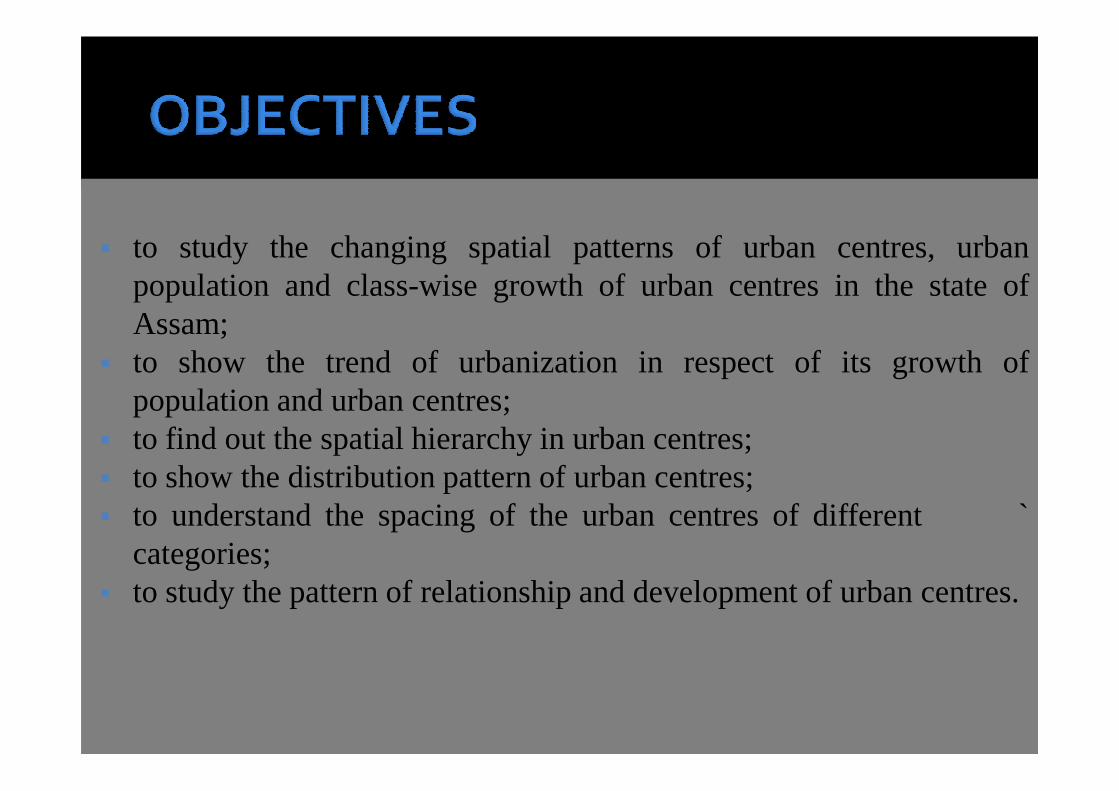
� to study the changing spatial patterns of urban centres, urbanpopulation and class-wise growth of urban centres in the state ofAssam;
� to show the trend of urbanization in respect of its growth ofpopulationandurbancentres;populationandurbancentres;
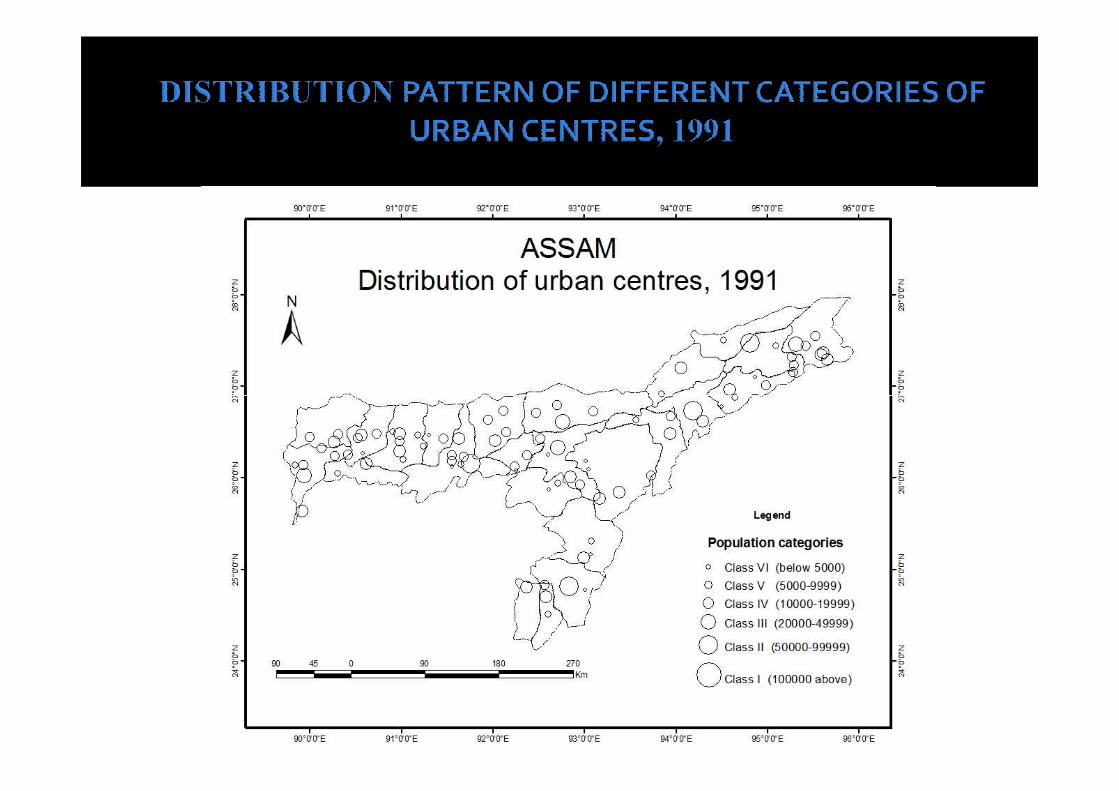
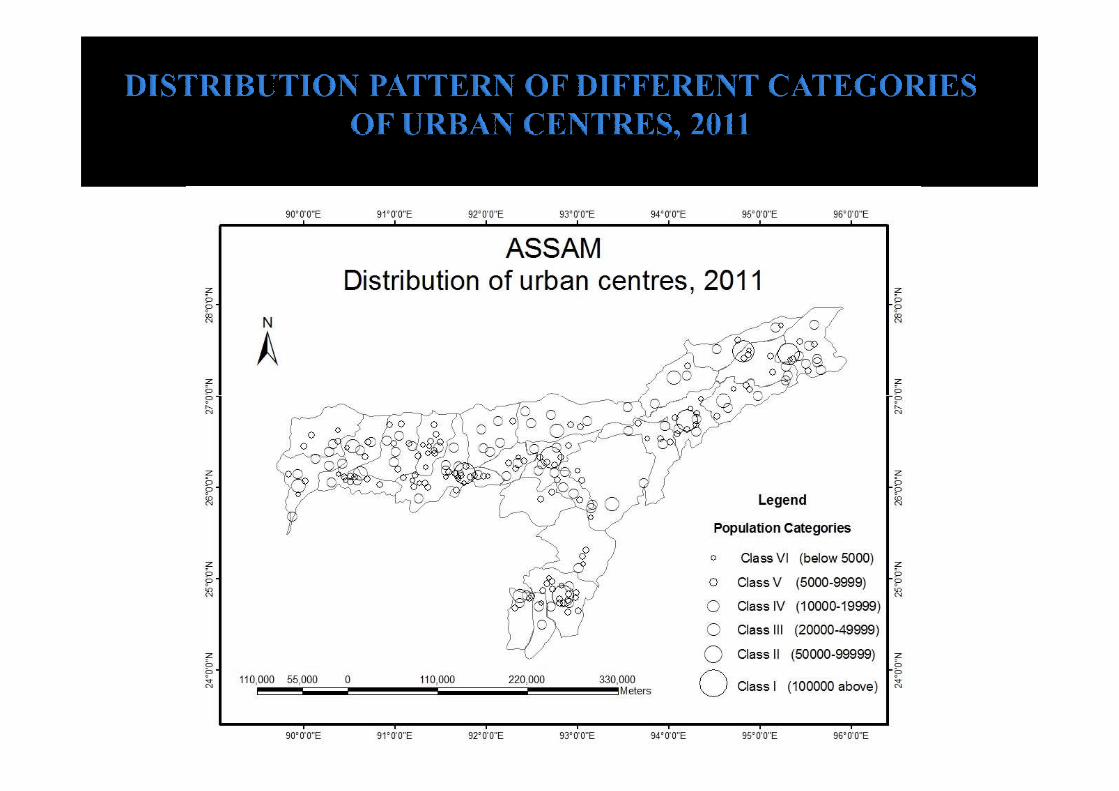
� to find out the spatial hierarchy in urban centres;� to showthe distribution pattern of urban centres;� to understand the spacing of the urban centres of different `
categories;� to study the pattern of relationship and development of urban centres.
� Secondary sources particularly the analysis is made on the basis
of information and data collected from the Economic Survey,
Govt. Of Assam, Statistical Handbook of Assam, and has consulted
various journals, periodicals, internet and books related to
research problem.
Different techniques of tabulation & calculation,Different techniques of tabulation & calculation,
cartographic representation & map preparation have constituted
the essential part of analysis. The cartographic techniques such as
maps & tables have proved helpful in giving the geographical
treatment to the study on a sound base.
� Carl O Sauer became influential in urban geography as he motivated geographers to study a city's population and economic aspects with regard to its physical location.
� In terms of a hierarchy of cities — a tradition that goes all the way back to Walter Christaller's classic work written in 1933, Central Places in Southern Germany.
� O.H.K Spate and E. Ahmad (1950) their article was published in Geographical review under the title of “five cities of Gangetic Plain”.
� R.L singh in 1995 studied the Slums of Allahabad under low urbanization.
� Ashish Bose (1980) studied the India’s Urbanization 1901-2001. Amitabh kundu (1992) published his book urban development and Urban Research in India. R. Ramachandran(1995) studied Urbanization and Urban System in India.
� J.B Ganguly (1995) authored a book “Urbanization and development in North East India”.
� . B.K Prasad (2003) he outline the various factors affecting the urban development pattern in Assam.
Census Year No. of Urban Centres
Urban Population %Urban population to the total population
Growth Rate of Urban Population (%)
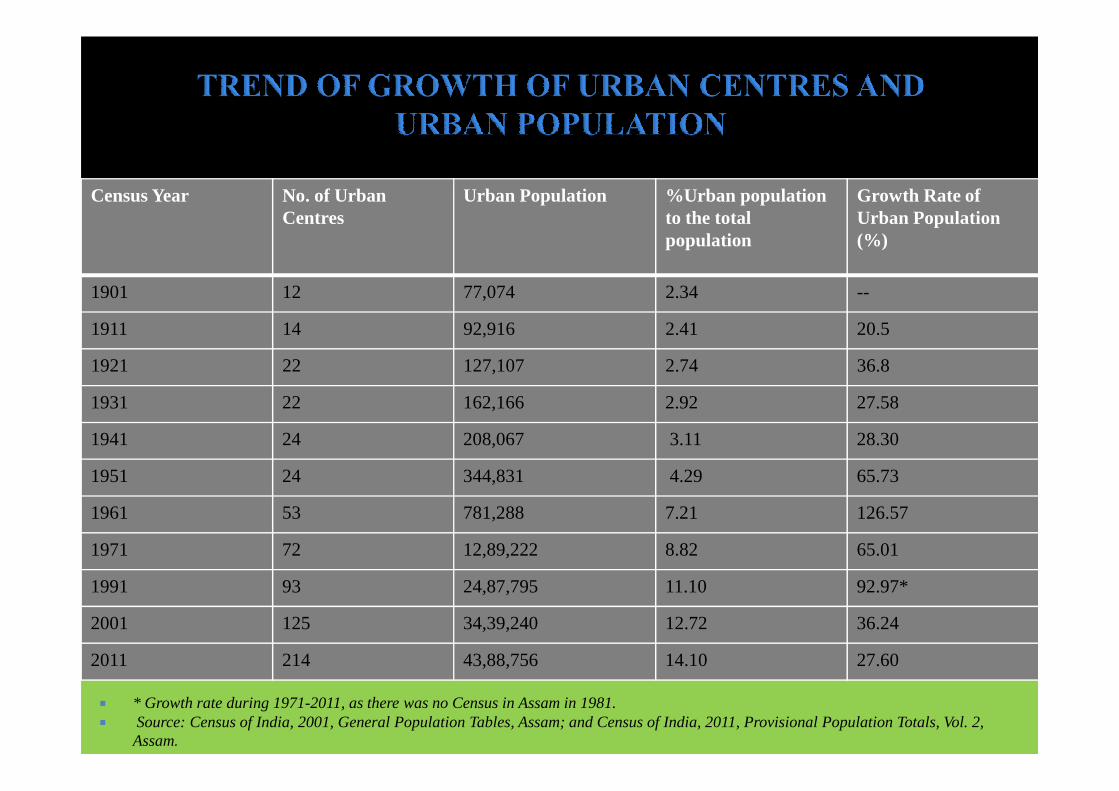
1901 12 77,074 2.34 --
1911 14 92,916 2.41 20.5
1921 22 127,107 2.74 36.8
1931 22 162,166 2.92 27.58
� * Growth rate during 1971-2011, as there was no Census in Assam in 1981.� Source: Census of India, 2001, General Population Tables, Assam; and Census of India, 2011, Provisional Population Totals, Vol. 2,
Assam.
1931 22 162,166 2.92 27.58
1941 24 208,067 3.11 28.30
1951 24 344,831 4.29 65.73
1961 53 781,288 7.21 126.57
1971 72 12,89,222 8.82 65.01
1991 93 24,87,795 11.10 92.97*
2001 125 34,39,240 12.72 36.24
2011 214 43,88,756 14.10 27.60
200
250
Trend of growth of urban centres,1901 - 2011
35,00,000
40,00,000
45,00,000
50,00,000
Trend of growth of urban population in Assam 1901-2011
0
50
100
150
no. of urban centerscensus year
no
.of
tow
ns
0
5,00,000
10,00,000
15,00,000
20,00,000
25,00,000
30,00,000
35,00,000
Urban Population
Population
census year
10
12
14
16
Trend of urbanization level in Assam,1901- 2011
Per
cen
tag
e o
f u
rban
po
pu
latio
n
0
2
4
6
8
10
1901 1911 1921 1931 1941 1951 1961 1971 1991 2001 2011
urban
Per
cen
tag
e o
f u
rban
po
pu
latio
n
census year
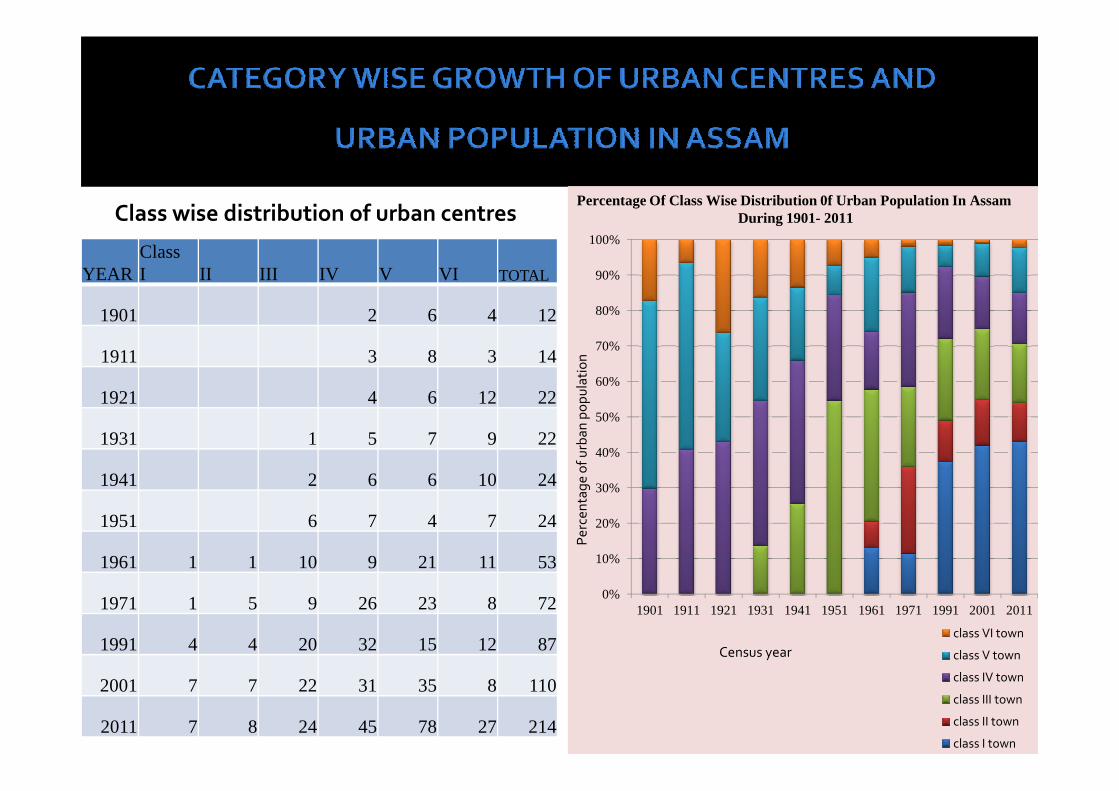
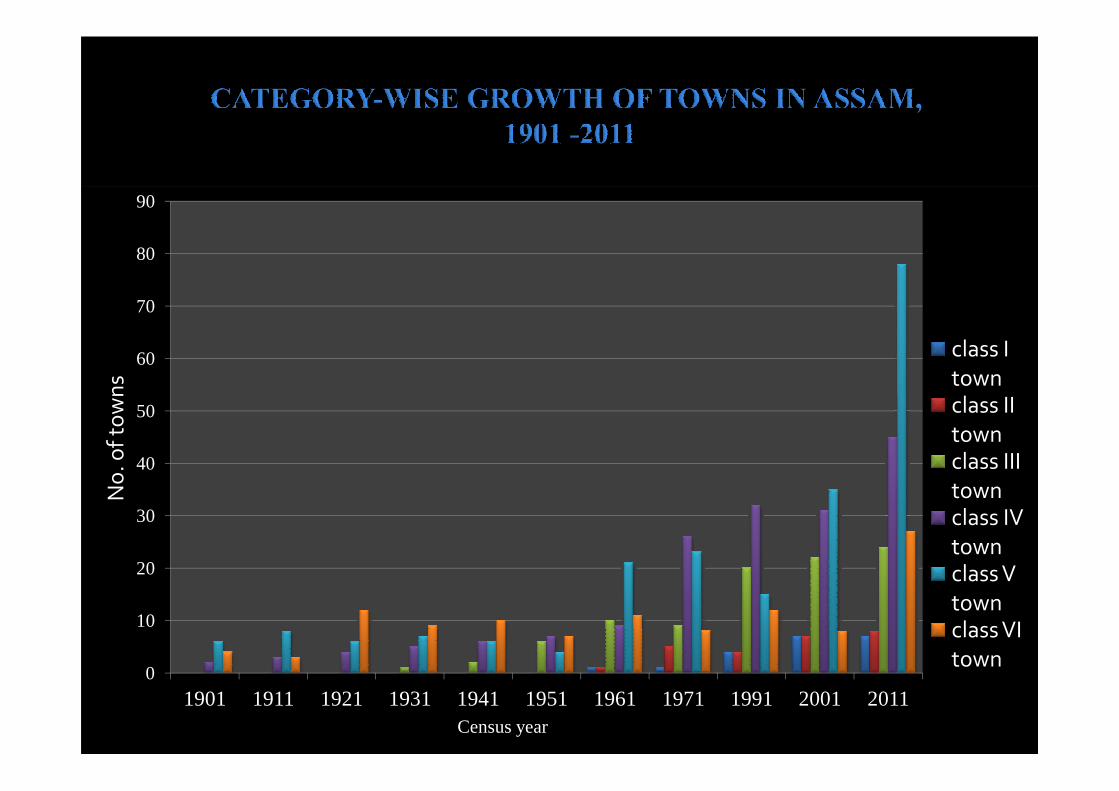
YEARClassI II III IV V VI TOTAL
1901 2 6 4 12
1911 3 8 3 14
1921 4 6 12 2260%
70%
80%
90%
100%
Pe
rce
nta
ge
of
urb
an
po
pu
lati
on
Percentage Of Class Wise Distribution 0f Urban Population In Assam During 1901- 2011Class wise distribution of urban centres
1921 4 6 12 22
1931 1 5 7 9 22
1941 2 6 6 10 24
1951 6 7 4 7 24
1961 1 1 10 9 21 11 53
1971 1 5 9 26 23 8 72
1991 4 4 20 32 15 12 87
2001 7 7 22 31 35 8 110
2011 7 8 24 45 78 27 214
0%
10%
20%
30%
40%
50%
1901 1911 1921 1931 1941 1951 1961 1971 1991 2001 2011
class VI town
class V town
class IV town
class III town
class II town
class I town
Pe
rce
nta
ge
of
urb
an
po
pu
lati
on
Census year
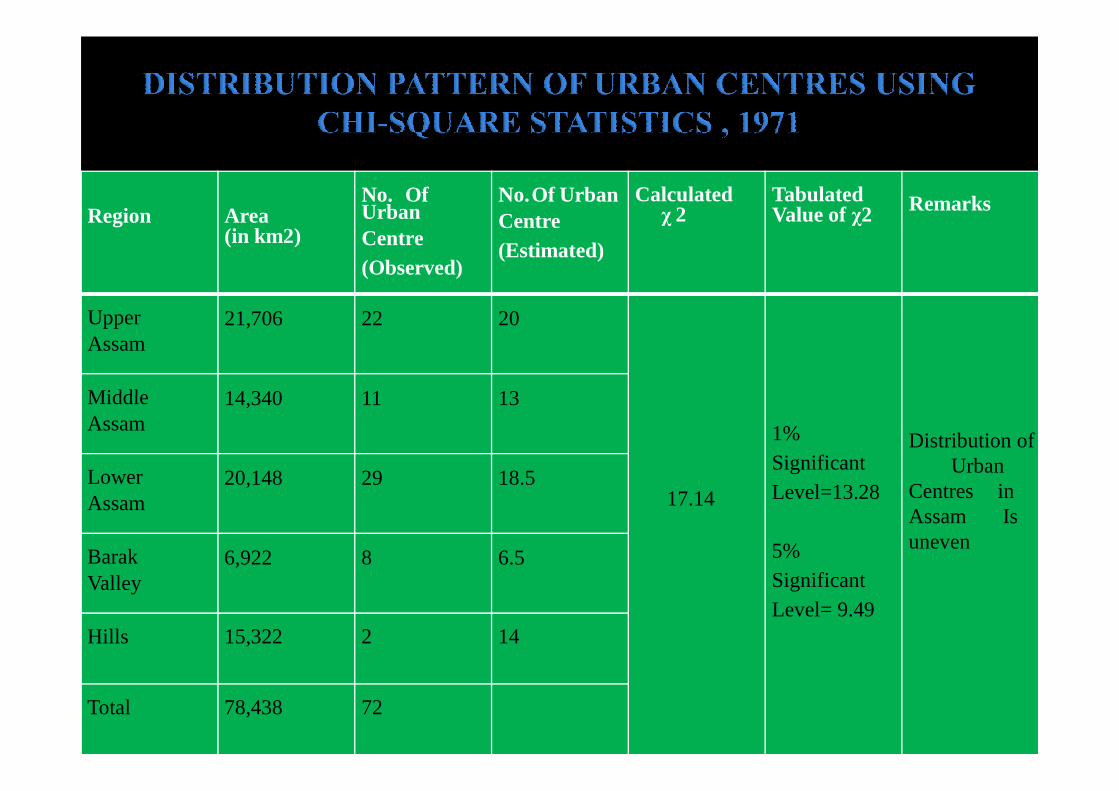
Region Area(in km2)
No. Of UrbanCentre(Observed)
No.Of UrbanCentre(Estimated)
Calculatedχ 2
TabulatedValue of χ2 Remarks
UpperAssam
21,706 22 20
Middle 14,340 11 13
17.14
1% Significant Level=13.28
5% Significant Level= 9.49
Distribution ofUrban
Centres in Assam Is uneven
MiddleAssam
14,340 11 13
LowerAssam
20,148 29 18.5
BarakValley
6,922 8 6.5
Hills 15,322 2 14
Total 78,438 72
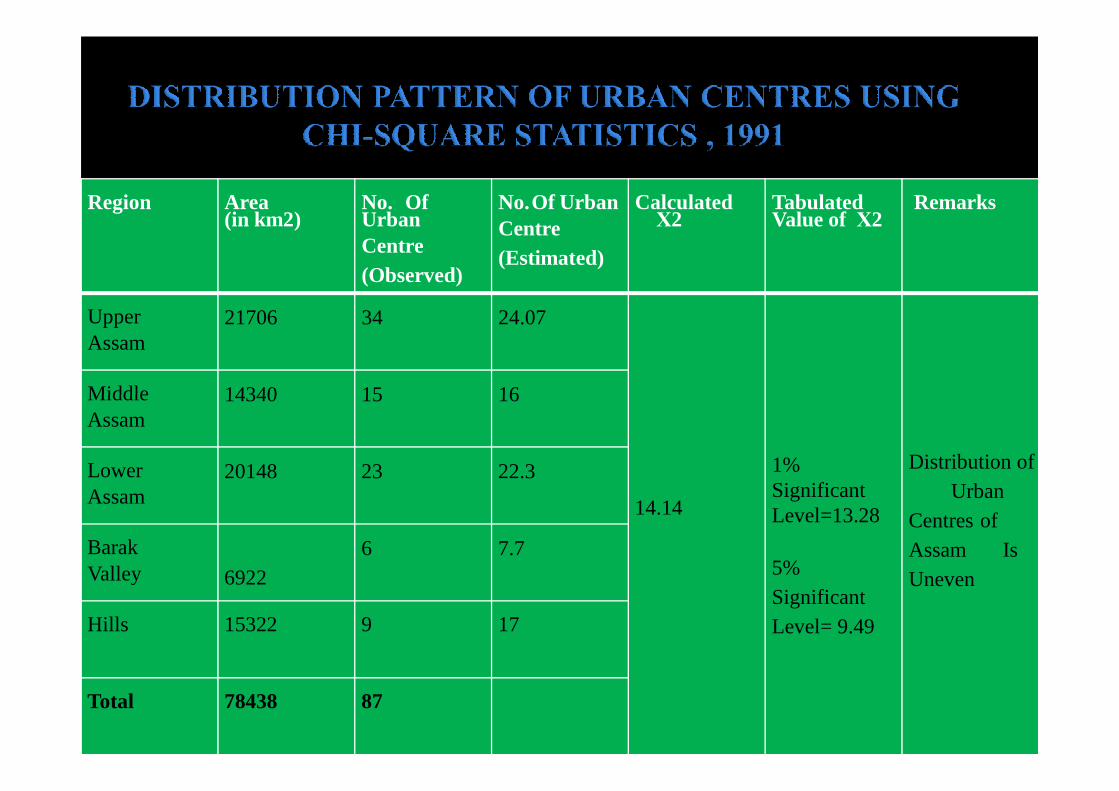
Region Area(in km2)
No. Of UrbanCentre(Observed)
No.Of UrbanCentre(Estimated)
CalculatedΧ2
TabulatedValue of Χ2
Remarks
UpperAssam
21706 34 24.07
Middle 14340 15 16
14.14
1% Significant Level=13.28
5% Significant Level= 9.49
Distribution ofUrban
Centres of Assam Is Uneven
MiddleAssam
14340 15 16
LowerAssam
20148 23 22.3
BarakValley 6922
6 7.7
Hills 15322 9 17
Total 78438 87
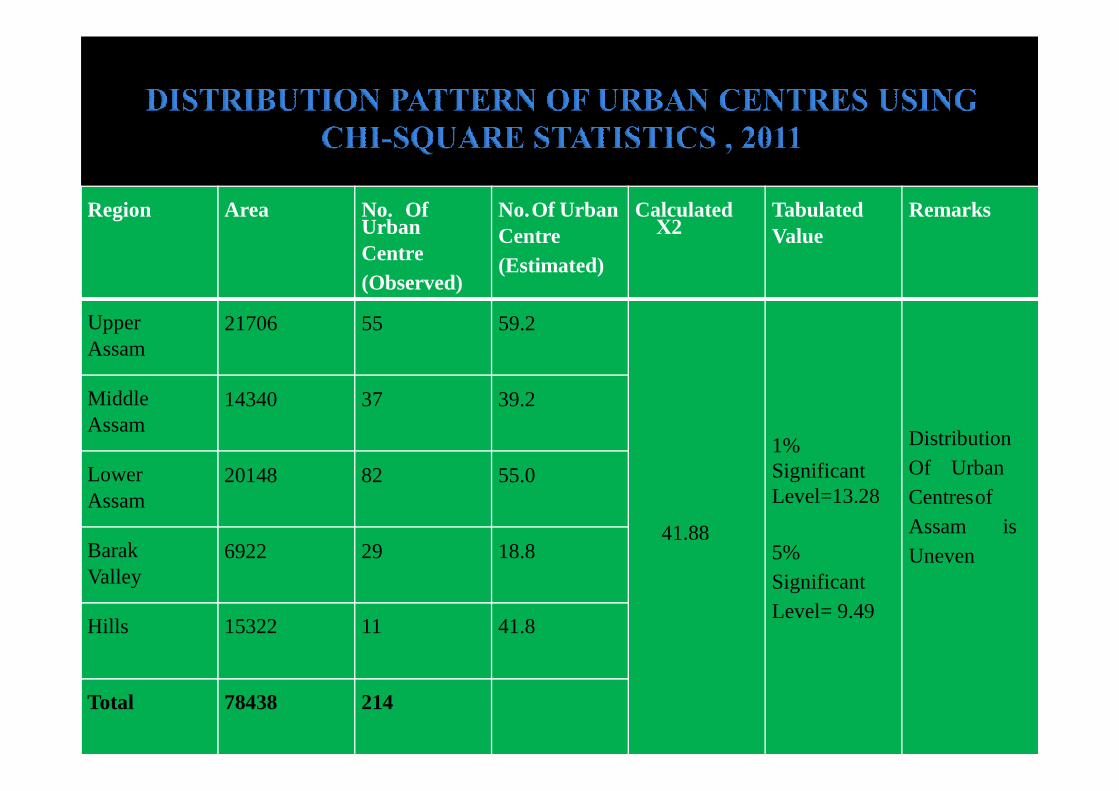
Region Area No. Of UrbanCentre(Observed)
No.Of UrbanCentre(Estimated)
CalculatedΧ2
TabulatedValue
Remarks
UpperAssam
21706 55 59.2
Middle 14340 37 39.2
41.88
1% Significant Level=13.28
5% Significant Level= 9.49
Distribution Of Urban Centresof Assam is Uneven
MiddleAssam
14340 37 39.2
LowerAssam
20148 82 55.0
BarakValley
6922 29 18.8
Hills 15322 11 41.8
Total 78438 214
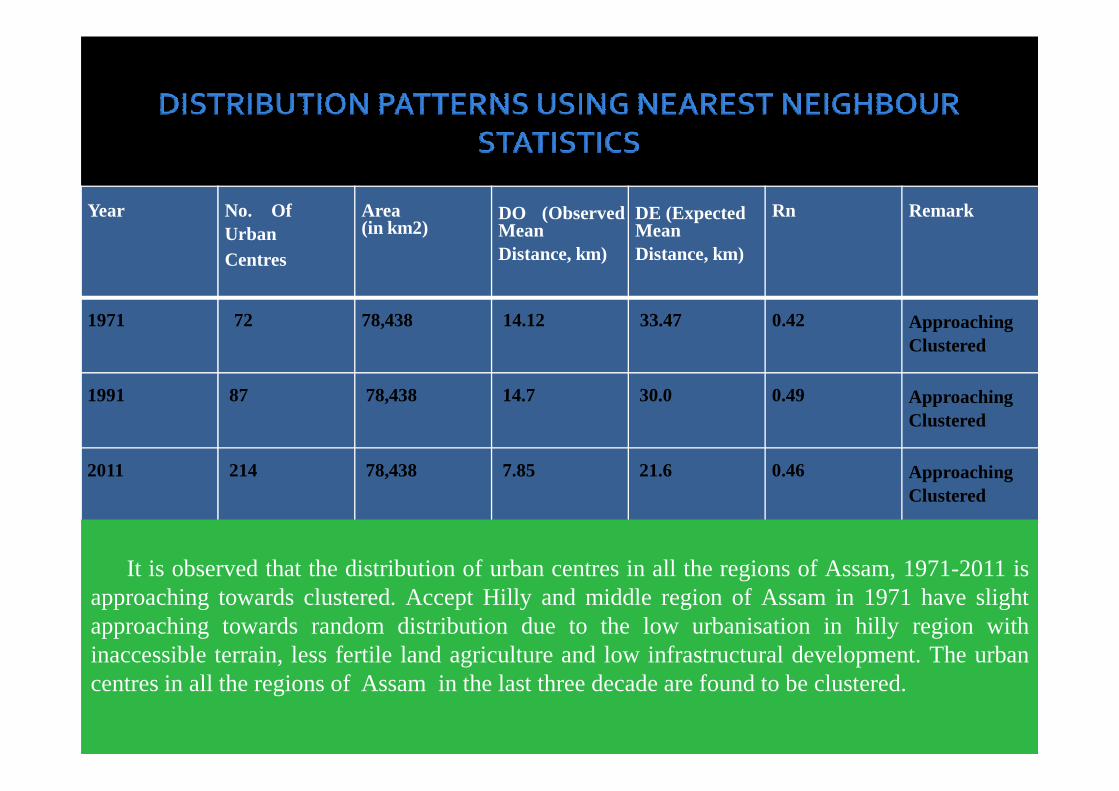
Year No. OfUrbanCentres
Area(in km2)
DO (ObservedMeanDistance, km)
DE (ExpectedMeanDistance, km)
Rn Remark
1971 72 78,438 14.12 33.47 0.42 ApproachingClustered
1991 87 78,438 14.7 30.0 0.49 Approaching1991 87 78,438 14.7 30.0 0.49 ApproachingClustered
2011 214 78,438 7.85 21.6 0.46 ApproachingClustered
It is observed that the distribution of urban centres in all the regions of Assam, 1971-2011 isapproaching towards clustered. Accept Hilly and middle region of Assam in 1971have slightapproaching towards random distribution due to the low urbanisation in hilly region withinaccessible terrain, less fertile land agriculture and low infrastructural development. The urbancentres in all the regions of Assam in the last three decade are found to be clustered.
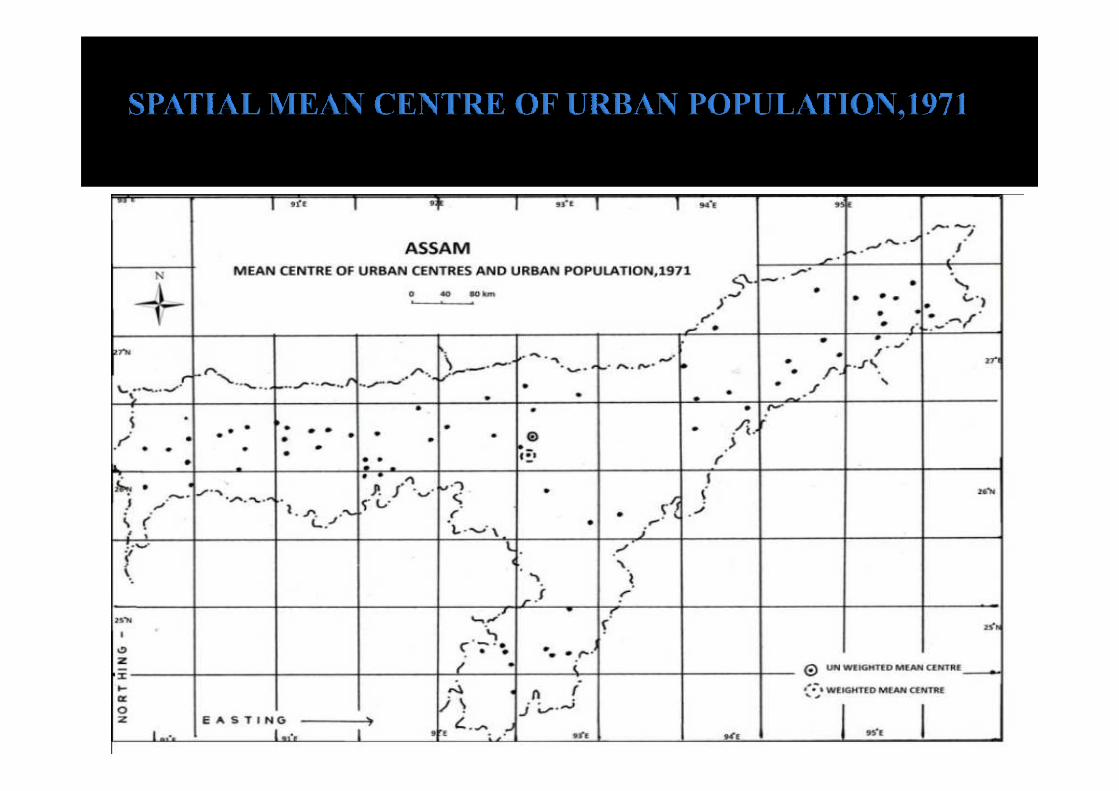
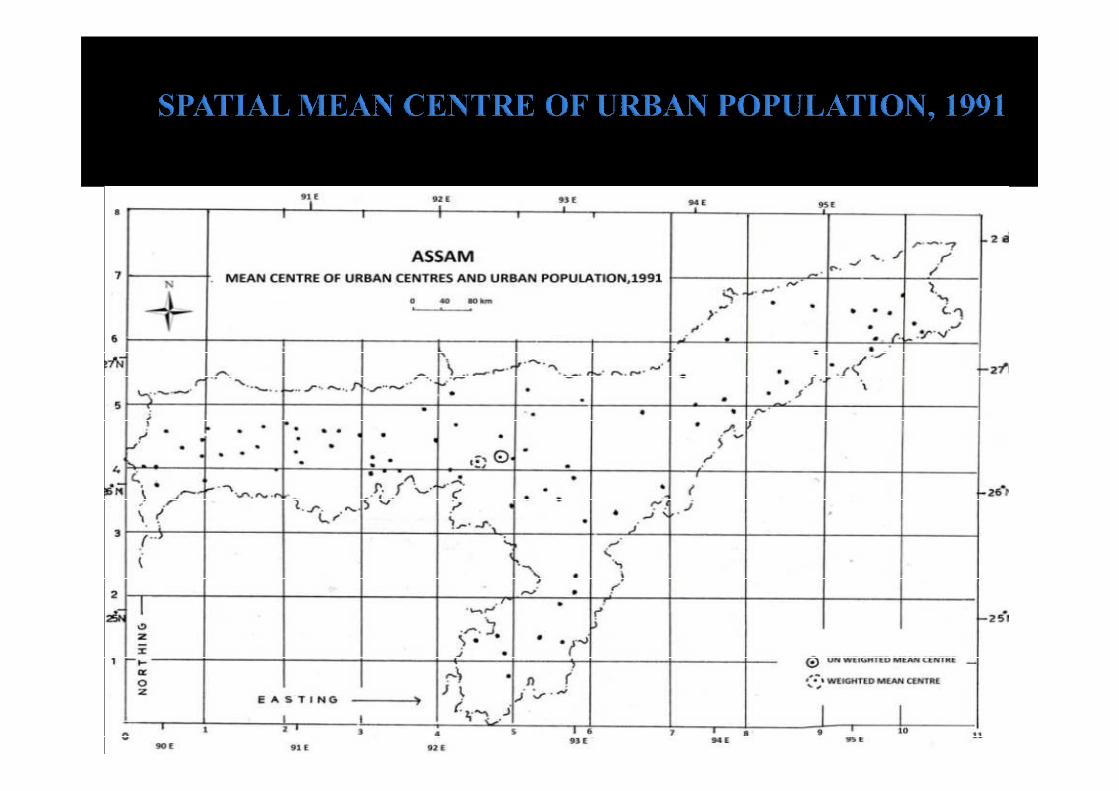
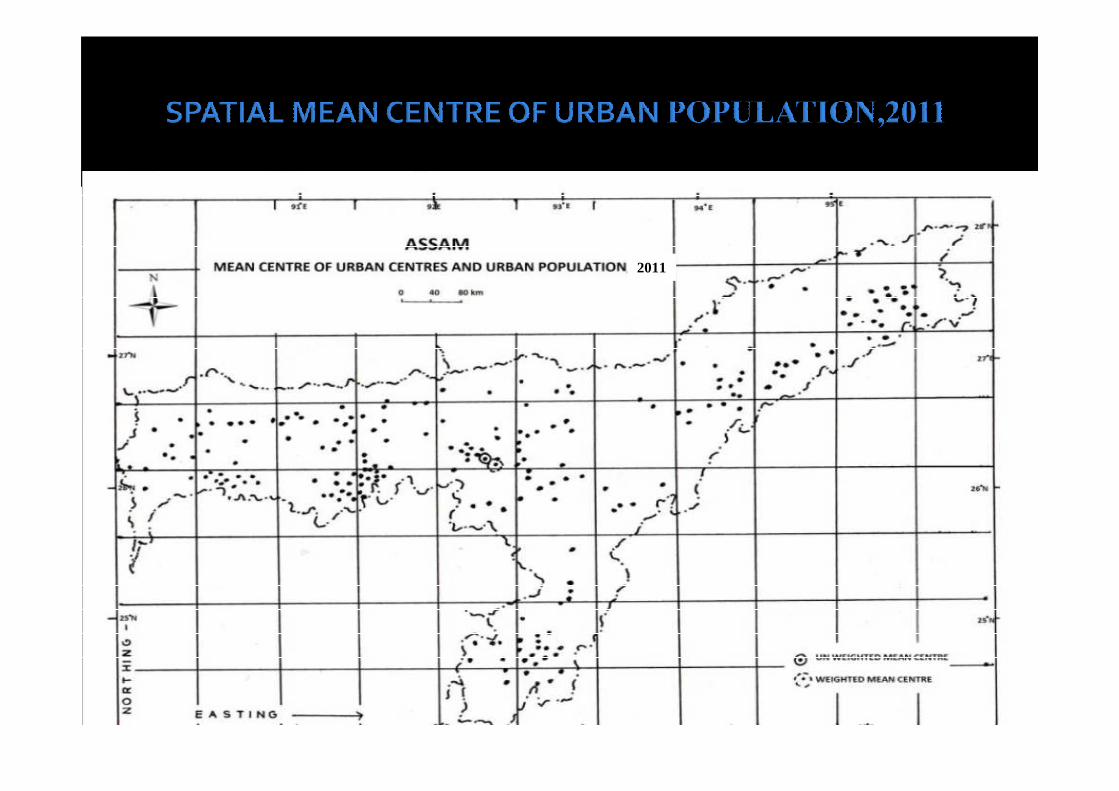
� Mean centre of population may be defined as the centre ofgravity of population of an area implying the point upon whichthe place would be balanced. It is also called as the point ofequilibrium.
� The mean centre of urban population in 1971 falls slightly� The mean centre of urban population in 1971 falls slightlytowards west, indicating the high urban population towardswestwhere Guwahati has the highest urban population in the stateAssam. In 1991, the mean centre of urban population boththe weighted and unweighted falls in the district of Marigaon.From the above Figures, the temporal variation in the Meancentre of urban population can be seen shifting towards west,indicating the high concentration of urban population whichbecame the centre of gravity.
the point upon which the place would be balanced. It is also called as the point of equilibrium.the point upon which the place would be balanced. It is also called as the point of equilibrium.the point upon which the place would be balanced. It is also called as the point of equilibrium.
2011
80
100
120
0
20
40
60
1971 1991 2011
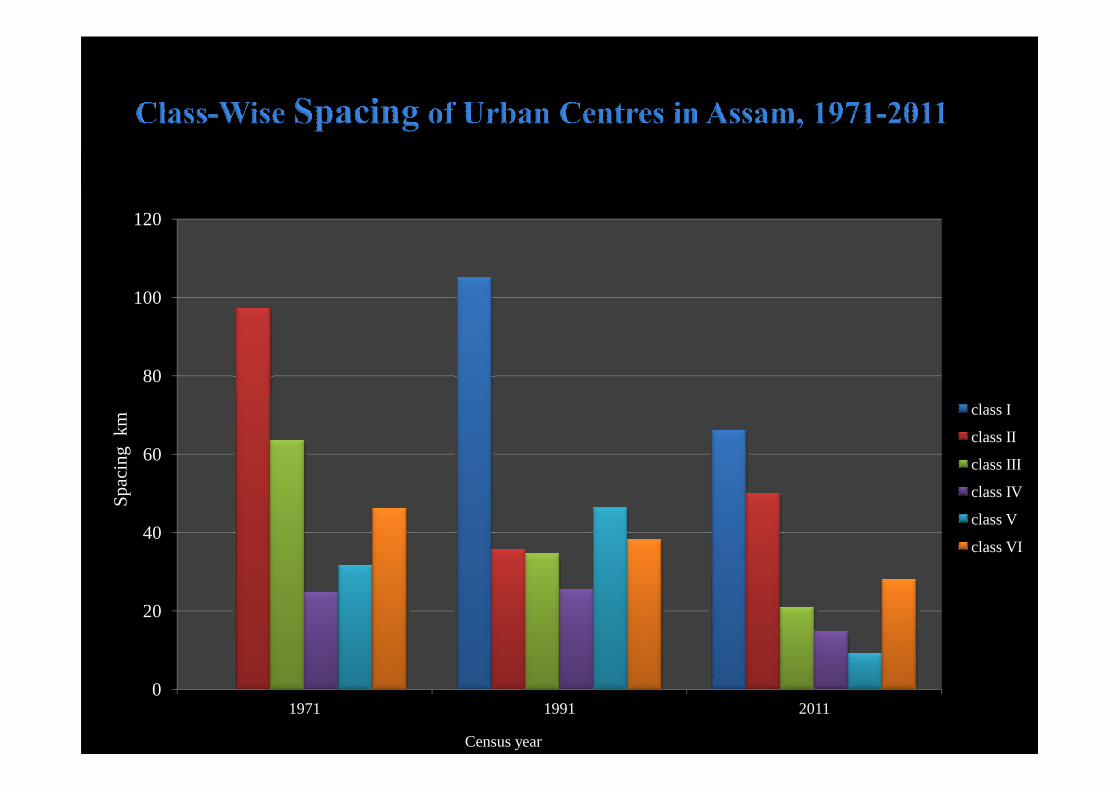
class I
class II
class III
class IV
class V
class VI
Sp
acin
g(km
)
Census year
60
70
80
90
class I
townclass II
No
. of
tow
ns
0
10
20
30
40
50
1901 1911 1921 1931 1941 1951 1961 1971 1991 2001 2011
class II
townclass III
townclass IV
townclass V
townclass VI
town
Census year
No
. of
tow
ns
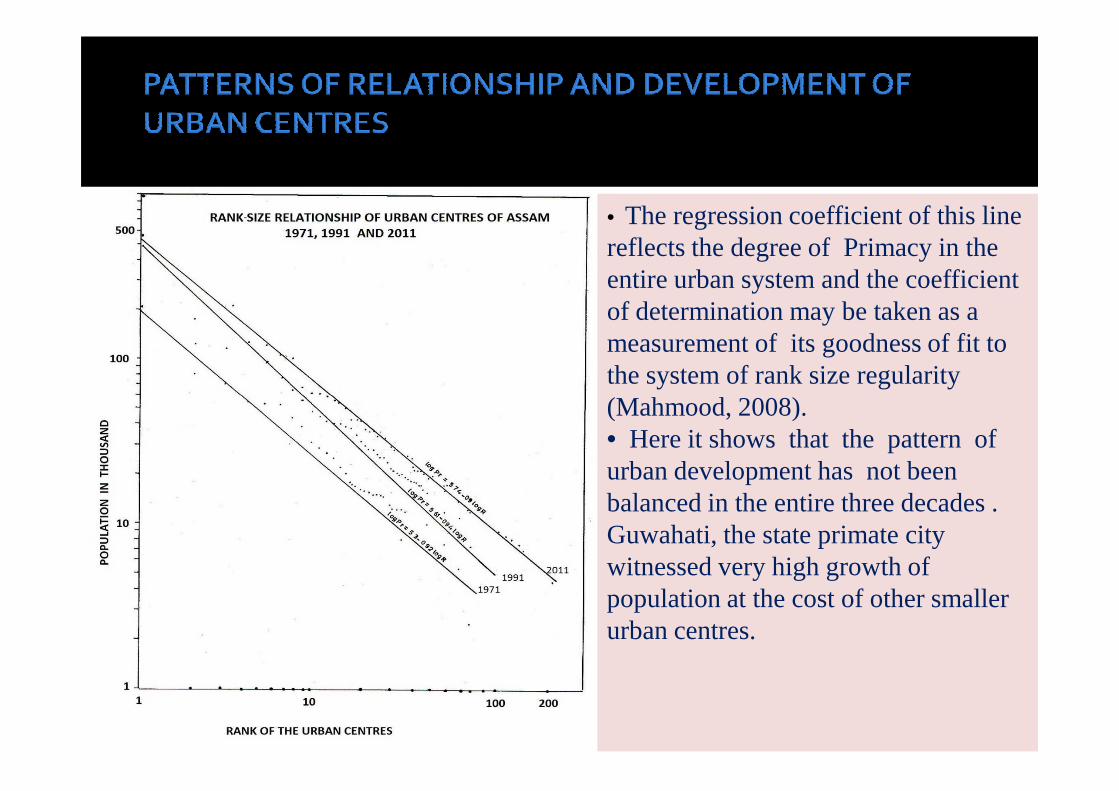
�CHANGING RANK-SIZE RELATIONSHIP PATTERN
• The regression coefficient of this line reflects the degree of Primacy in the entire urban system and the coefficient of determination may be taken as a measurement of its goodness of fit to the system of rank size regularity (Mahmood, 2008).(Mahmood, 2008).• Here it shows that the pattern of urban development has not been balanced in the entire three decades . Guwahati, the state primate city witnessed very high growth of population at the cost of other smaller urban centres.
The striking feature is the wide inequalities observed inurbanization in terms of share of urban population inthe district of Assam. Guwahati has maintained itsdominance and lead as the prominent town with bothhigh urbanizationandhigh populationgrowthrate. Thehigh urbanizationandhigh populationgrowthrate. Theinequalities of urbanization among the districts ofAssam may be addressed by giving impetus for abalanced infrastructural development in small andmedium towns of Assam. Spatial distribution ofurban centres in the study region reveals unevenpattern and high concentration around the primatecity and industrial town.

THANK YOUTHANK YOU