Embed Size (px)
Citation preview
Computer Vision based Correlation Assessment of 30
World Sign Languages 1G. Hithasree,
2P.T.L. Jagarnithi,
3E. Aditya Chowdary,
4M.D. Nihitha,
5M.V.D. Prasad and
6E. Kiran Kumar
1,2,3,4,5,6 Department of Electronics and Communications Engineering, K.L.
University, Green Fields, Vaddeswaram, Guntur – DT, Andhra Pradesh, India.
Abstract This paper proposes to find similarity between sign language finger
spellings of alphabets from 30 countries with computer vision and support
vector machine(SVM) classifier. A database of 30 world sign language
alphabets is created in laboratory conditions with 9 test subjects per
country. Binarization of sign images and subsequent feature extraction with
histogram of oriented gradients (HOG) gives a feature vector. Classification
with SVM provides insight into the similarity between world sign
languages. The results show a similarity of 61% between Indian sign
language and Bangladesh sign language belonging to the same continent.
Whereas the similarity is 11% and 7% with American and French sign
languages in different continents. Several feature extraction models such as
SIFT, SURF, LBP, Haar, MSER etc. were tested for accuracy and speed. The
overall classification rate of multi class SVM is 95% with HOG features
when compared to other feature types. Cross validation of the classifier is
performed by finding an image structural similarity measure with
Structural Similarity Index Measure (SSIM). This study enables hearing
impaired to significantly learn new sign language in less time through sign
similarity and the sign-to-sign translator enables them to effectively
communicate with their communities in different countries effortlessly.
Key Words:Sign language recognition, world sign languages comparison,
feature extraction, support vector machines, sign - to - sign translator.
International Journal of Pure and Applied MathematicsVolume 117 No. 15 2017, 275-286ISSN: 1311-8080 (printed version); ISSN: 1314-3395 (on-line version)url: http://www.ijpam.euSpecial Issue ijpam.eu
275
1. Introduction
Language translator form google is helping 200 million people to communicate
from all over the word. Although there are many such language translators [1],
the primary goal is translation of words and sentences in one language to
another language. The program compares language structures instead of word or
sentence features in both languages. The language is modelled through vector
spaces and the transformations happen by vector space mapping between
different languages. The rate of accuracy for a 5-word conversion is around
90%. There are many such models for language converters in speech and text
[2], but this paper articulates a sign language translator between multiple
countries.
The Ethnologue–language encyclopaedia of the world lists 6909 living
languages from which only 130 are deaf sign languages. Before exploring the
possibility of a sign-to-sign translator that transforms one countries sign
language into another, this work focuses on identifying a similarity between
these visual languages. We have carefully chosen 30 countries whose sign
languages are popular and extensive research is going on in developing machine
translation of these sign languages with non – visual (Glove based) and visual
(Video Camera based) techniques [3-9]. The countries are American, Mexican,
Indian, Bangladesh, Pakistan, Srilanka, Chinese, Philippines, Indonesia, British,
French, Irish, Spanish, Czech, Estonian, Finnish, German, Hungarian,
Nederland, Norwegian, Polish, Chile, Australian, New Zealand, Iceland, Brazil,
Kenya, South African, Uganda and Zambian.
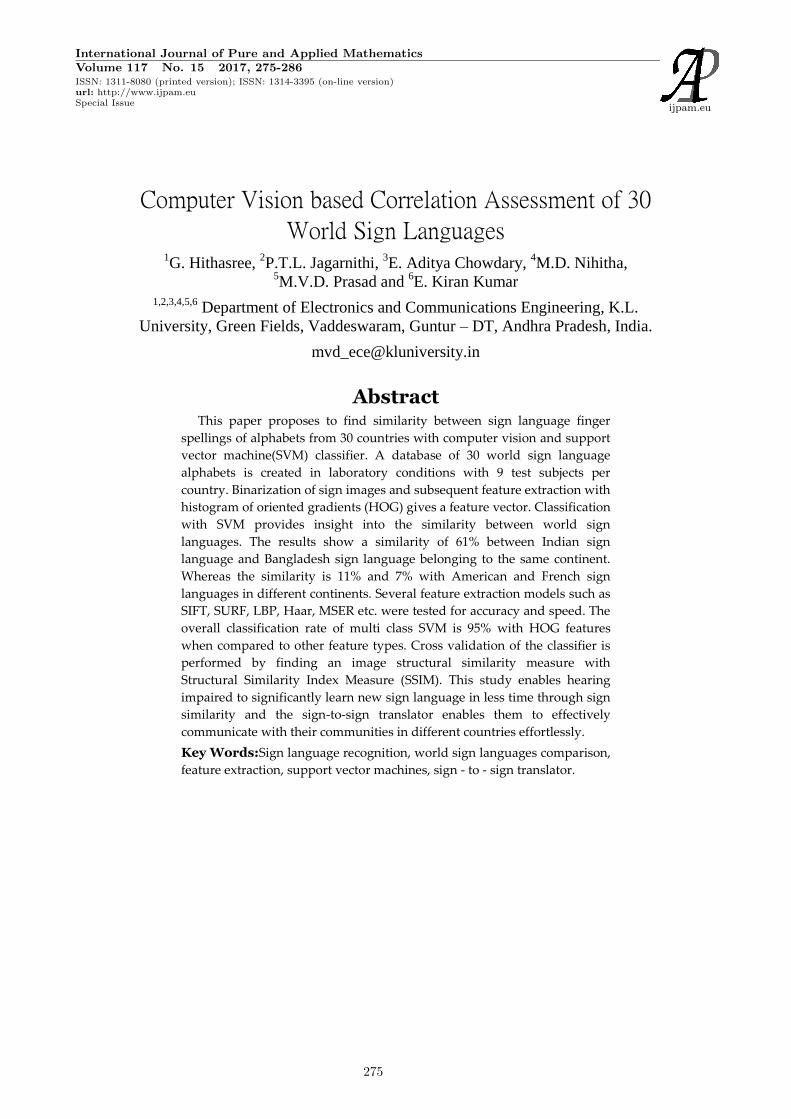
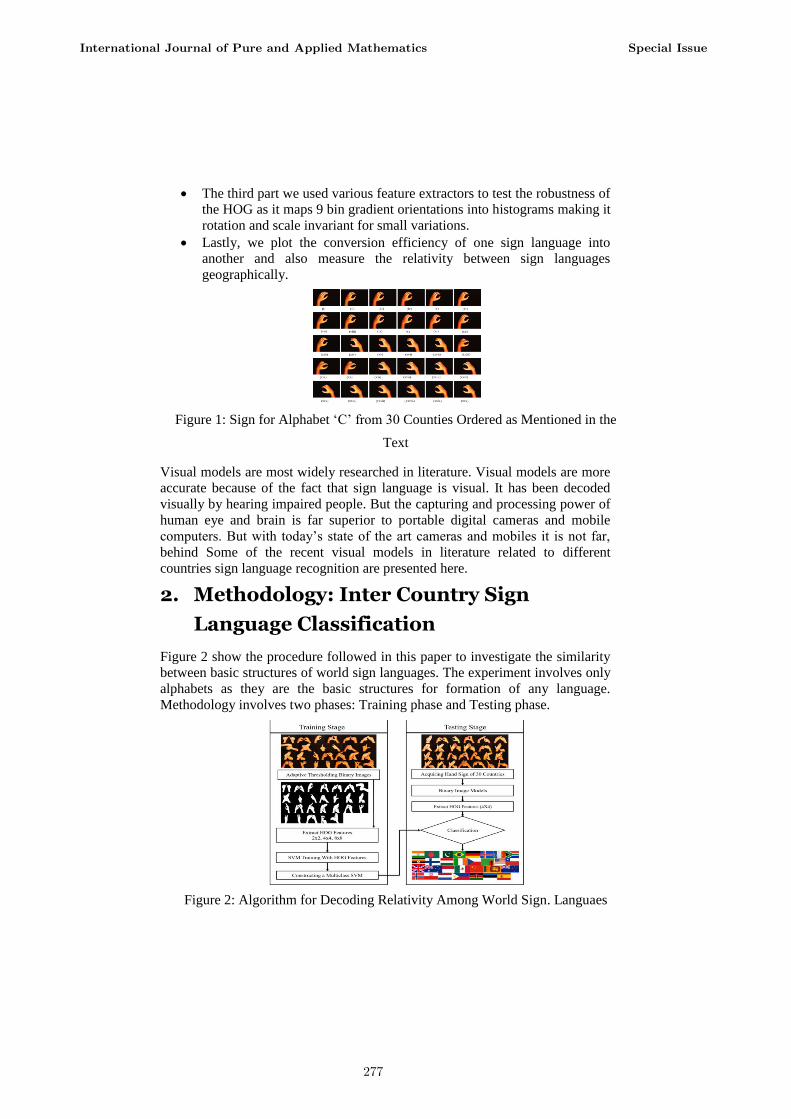
The lighting and background are carefully controlled during capture using a 12
mega pixel Sony Dslr camera. Each alphabet of a particular country is captured
9 times to test the robustness of the feature extraction algorithms and the
classifier. Figure 1 shows the alphabet ‘C’ from the entire set of 30 sign
languages, which is found to be common in all the sign languages used for
comparison. Visually the structural similarity between the letters can be
decoded by the human brain with some efforts but it is quite a challenge for the
computer. In an experiment at our lab even the humans who learned one sign
language found it difficult to follow signs from another sign language. Their
failure rate was 60% for other sign languages, but again this is a subjective
evaluation. This visual decoding and mapping of signs to text or speech is
challenging researchers for around two and half decades. For an efficient sign –
to – sign translation between countries the following are important factors for
evaluation.
The first part is to find a similarity between 30 world sign languages
using Histogram of oriented gradients (HOG) features and Support
vector machine (SVM).
To draw a confusion matrix for these 30 countries and to evaluate the
performance of the classifier.
International Journal of Pure and Applied Mathematics Special Issue
276
The third part we used various feature extractors to test the robustness of
the HOG as it maps 9 bin gradient orientations into histograms making it
rotation and scale invariant for small variations.
Lastly, we plot the conversion efficiency of one sign language into
another and also measure the relativity between sign languages
geographically.
Figure 1: Sign for Alphabet ‘C’ from 30 Counties Ordered as Mentioned in the
Text
Visual models are most widely researched in literature. Visual models are more
accurate because of the fact that sign language is visual. It has been decoded
visually by hearing impaired people. But the capturing and processing power of
human eye and brain is far superior to portable digital cameras and mobile
computers. But with today’s state of the art cameras and mobiles it is not far,
behind Some of the recent visual models in literature related to different
countries sign language recognition are presented here.
2. Methodology: Inter Country Sign
Language Classification
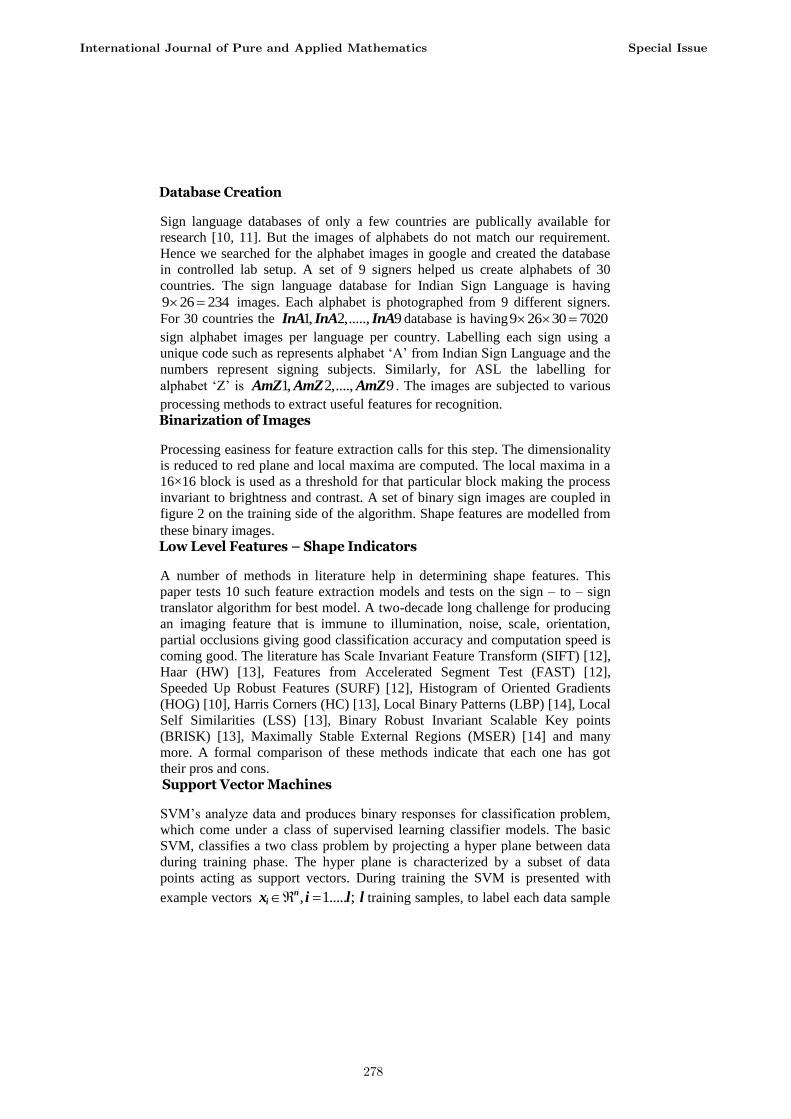
Figure 2 show the procedure followed in this paper to investigate the similarity
between basic structures of world sign languages. The experiment involves only
alphabets as they are the basic structures for formation of any language.
Methodology involves two phases: Training phase and Testing phase.
Figure 2: Algorithm for Decoding Relativity Among World Sign. Languaes
International Journal of Pure and Applied Mathematics Special Issue
277
Database Creation
Sign language databases of only a few countries are publically available for
research [10, 11]. But the images of alphabets do not match our requirement.
Hence we searched for the alphabet images in google and created the database
in controlled lab setup. A set of 9 signers helped us create alphabets of 30
countries. The sign language database for Indian Sign Language is having
9 26 234 images. Each alphabet is photographed from 9 different signers.
For 30 countries the 1, 2,....., 9InA InA InA database is having9 26 30 7020
sign alphabet images per language per country. Labelling each sign using a
unique code such as represents alphabet ‘A’ from Indian Sign Language and the
numbers represent signing subjects. Similarly, for ASL the labelling for
alphabet ‘Z’ is 1, 2,...., 9AmZ AmZ AmZ . The images are subjected to various
processing methods to extract useful features for recognition.
Binarization of Images
Processing easiness for feature extraction calls for this step. The dimensionality
is reduced to red plane and local maxima are computed. The local maxima in a
16×16 block is used as a threshold for that particular block making the process
invariant to brightness and contrast. A set of binary sign images are coupled in
figure 2 on the training side of the algorithm. Shape features are modelled from
these binary images. Low Level Features – Shape Indicators
A number of methods in literature help in determining shape features. This
paper tests 10 such feature extraction models and tests on the sign – to – sign
translator algorithm for best model. A two-decade long challenge for producing
an imaging feature that is immune to illumination, noise, scale, orientation,
partial occlusions giving good classification accuracy and computation speed is
coming good. The literature has Scale Invariant Feature Transform (SIFT) [12],
Haar (HW) [13], Features from Accelerated Segment Test (FAST) [12],
Speeded Up Robust Features (SURF) [12], Histogram of Oriented Gradients
(HOG) [10], Harris Corners (HC) [13], Local Binary Patterns (LBP) [14], Local
Self Similarities (LSS) [13], Binary Robust Invariant Scalable Key points
(BRISK) [13], Maximally Stable External Regions (MSER) [14] and many
more. A formal comparison of these methods indicate that each one has got
their pros and cons.
Support Vector Machines
SVM’s analyze data and produces binary responses for classification problem,
which come under a class of supervised learning classifier models. The basic
SVM, classifies a two class problem by projecting a hyper plane between data
during training phase. The hyper plane is characterized by a subset of data
points acting as support vectors. During training the SVM is presented with
example vectors , 1..... ; nix i l l training samples, to label each data sample
International Journal of Pure and Applied Mathematics Special Issue
278
as either +1 or -1 class label which forms the indicator vector 1, 1iy .
SVM formulates the optimization problem as a decision boundary D x such
that
, . 1
1min
2
l
Ti
w b i
D x w w C
Subjected to 1Ti i iy w x b with 0, 1,2,...., ;i i l (1)
Where C is a positive constant defining regularization. The terms w and b are
weight and bias. is the misclassification handler. The function
:m x x x maps feature vector x to a higher dimensional space. The
mapping function m x maps x into a dot product of feature space that satisfies
1 1, Ti i i im x x x x .
Multi Class SVM
The most widely used multi class SVM models are One Vs All (OVA), One Vs
One (OVO) [12], Directed Acyclic Graph (DAG) and Error Correcting Output
Codes (ECOC). OVA creates N binary SVM’s for all categories where N is
class number. For a nth SVM, only examples in that class are positive and
reaming are negative. The computation time is less but at a compromised
efficiency. OVO creates a pairwise 0.5N(N-1) SVM’s and pairwise voting to
accommodate new samples for solving multi class problems. DAG training is
from OVO model and testing is from binary acyclic graph model. ECOC
disambiguates output binary codes to construct a code word matrix which is
compared with generated bit vectors by selecting a row as a class having
minimum hamming distance. This method gives good classification rates
compared to other four at the cost of execution speed. The slower speed is due
to the increased length of code words to disambiguates N classes. The minimum
code words in ECOC is 2log N to a maximum of 12 1N bits. Comparing the
multi class SVM methods from MALAB implementation, we found ECOC
performs better at optimum speeds.
The similarity measure for 30 different world sign language alphabets using
computer vision model and machine learning algorithms is proposed.
Experimental results show the sign language relativity between countries and
continents. Validation is through human expert identification and structural
similarity index measure (SSIM).
3. Results and Discussion
The captured sign images are large and cubic interpolations trimmed their size
to 64 64 . The RGB colour images have large R (red) content and hence R
International Journal of Pure and Applied Mathematics Special Issue
279
plane is extracted for processing. Block thresholding with in a 16-pixel block
separates foreground hand regions from background. Ten features are extracted
from these binary images. For each country a feature matrix is build. The size of
each feature matrix is f fm n , where 26m , i.e. the number of alphabets and
n is variable column vector that captures feature values. f - consists of country
and test subject indicator.
The first problem encountered during feature matrix creation is the inability of
our algorithm to control the length of n , where n is intital length of the feature
vector. For each image the length of the feature vector changes due to number
of feature points detected during the feature extraction phage. For 26 different
images we have 26 different feature lengths. Feature length normalization has
been challenging, as it is difficult to decide on the number of features required
to produce good classification rate.
The first part is to find the similarity between sign languages from 30 different
countries. For this the feature matrices of all countries from all feature vector
models is prepared. A multiclass SVM with ECOC model is trained with one
country and tested with all other countries for each feature type.
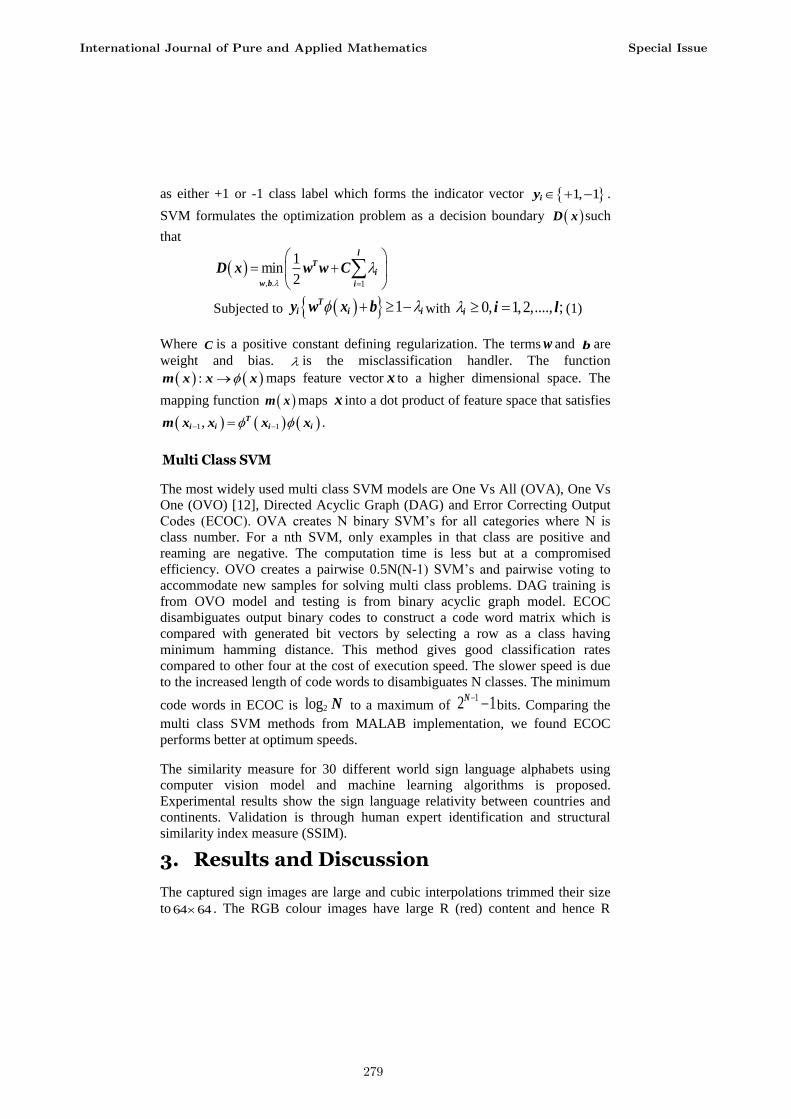
Testing results in a classification matrix or a confusion matrix between two
countries. All countries sign languages are tested against one trained country
and cross verification is done by testing the multiclass SVM for all other
countries. figure 3 shows values in number of matches and total percentage of
matching of one country with other countries in the set. The SVM is trained
with single sample and tested with a different sample form our database.
Multiple testing of this kind produced more or less similar results with a
deviation of ±3%.
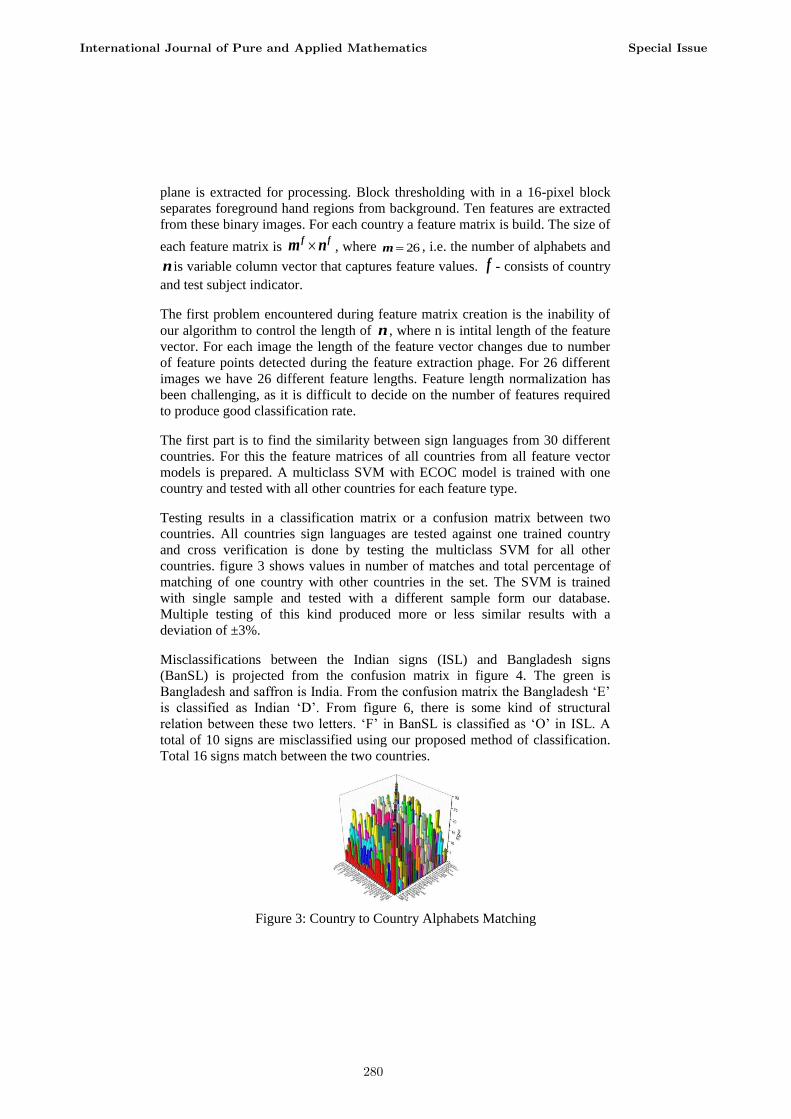
Misclassifications between the Indian signs (ISL) and Bangladesh signs
(BanSL) is projected from the confusion matrix in figure 4. The green is
Bangladesh and saffron is India. From the confusion matrix the Bangladesh ‘E’
is classified as Indian ‘D’. From figure 6, there is some kind of structural
relation between these two letters. ‘F’ in BanSL is classified as ‘O’ in ISL. A
total of 10 signs are misclassified using our proposed method of classification.
Total 16 signs match between the two countries.
Figure 3: Country to Country Alphabets Matching
International Journal of Pure and Applied Mathematics Special Issue
280
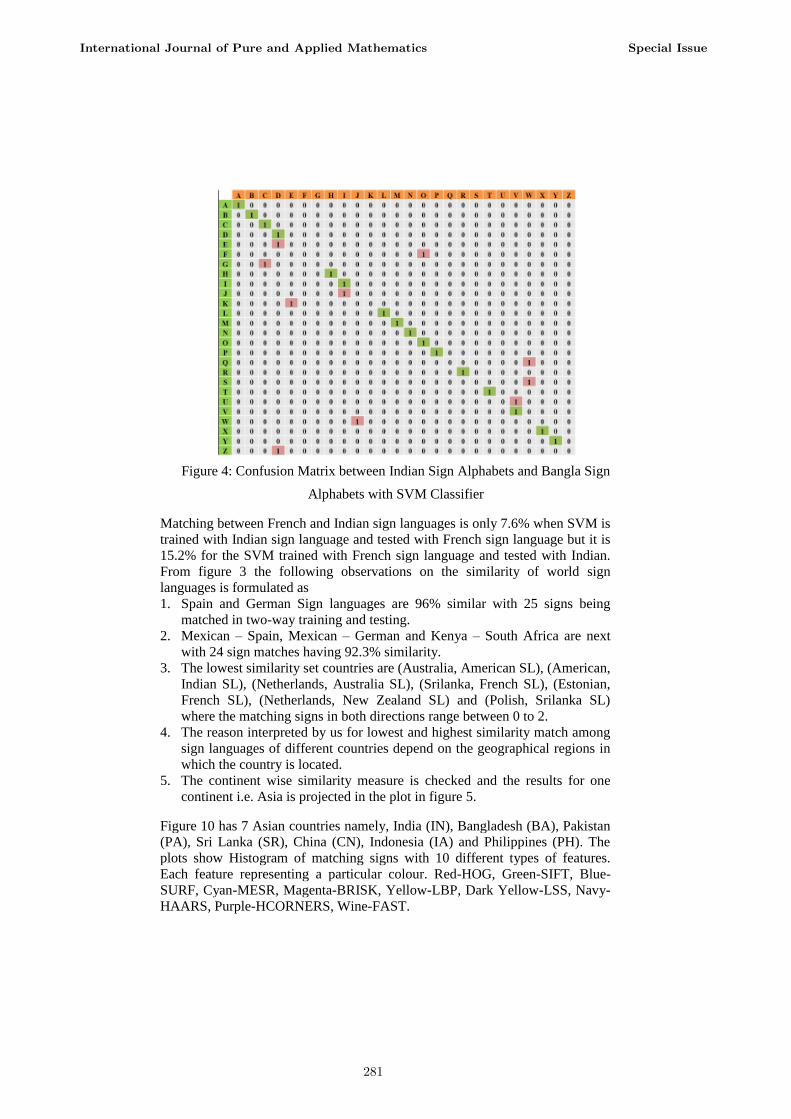
Figure 4: Confusion Matrix between Indian Sign Alphabets and Bangla Sign
Alphabets with SVM Classifier
Matching between French and Indian sign languages is only 7.6% when SVM is
trained with Indian sign language and tested with French sign language but it is
15.2% for the SVM trained with French sign language and tested with Indian.
From figure 3 the following observations on the similarity of world sign
languages is formulated as
1. Spain and German Sign languages are 96% similar with 25 signs being
matched in two-way training and testing.
2. Mexican – Spain, Mexican – German and Kenya – South Africa are next
with 24 sign matches having 92.3% similarity.
3. The lowest similarity set countries are (Australia, American SL), (American,
Indian SL), (Netherlands, Australia SL), (Srilanka, French SL), (Estonian,
French SL), (Netherlands, New Zealand SL) and (Polish, Srilanka SL)
where the matching signs in both directions range between 0 to 2.
4. The reason interpreted by us for lowest and highest similarity match among
sign languages of different countries depend on the geographical regions in
which the country is located.
5. The continent wise similarity measure is checked and the results for one
continent i.e. Asia is projected in the plot in figure 5.
Figure 10 has 7 Asian countries namely, India (IN), Bangladesh (BA), Pakistan
(PA), Sri Lanka (SR), China (CN), Indonesia (IA) and Philippines (PH). The
plots show Histogram of matching signs with 10 different types of features.
Each feature representing a particular colour. Red-HOG, Green-SIFT, Blue-
SURF, Cyan-MESR, Magenta-BRISK, Yellow-LBP, Dark Yellow-LSS, Navy-
HAARS, Purple-HCORNERS, Wine-FAST.
International Journal of Pure and Applied Mathematics Special Issue
281
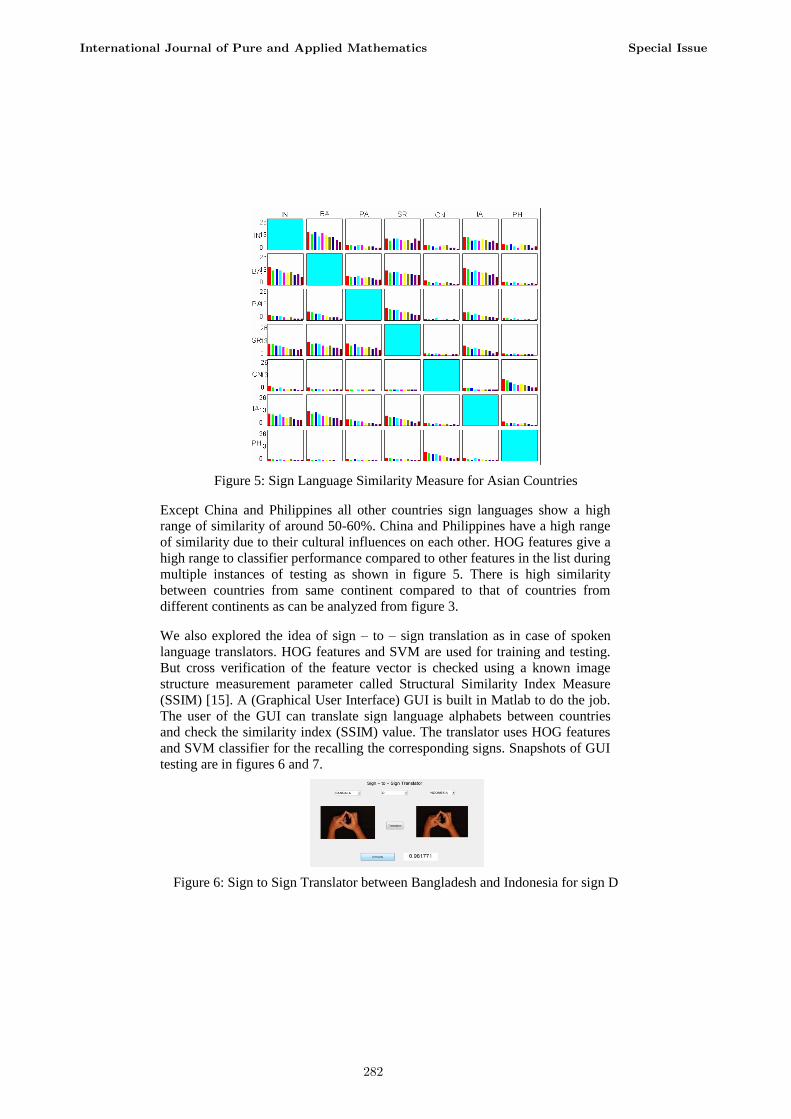
Figure 5: Sign Language Similarity Measure for Asian Countries
Except China and Philippines all other countries sign languages show a high
range of similarity of around 50-60%. China and Philippines have a high range
of similarity due to their cultural influences on each other. HOG features give a
high range to classifier performance compared to other features in the list during
multiple instances of testing as shown in figure 5. There is high similarity
between countries from same continent compared to that of countries from
different continents as can be analyzed from figure 3.
We also explored the idea of sign – to – sign translation as in case of spoken
language translators. HOG features and SVM are used for training and testing.
But cross verification of the feature vector is checked using a known image
structure measurement parameter called Structural Similarity Index Measure
(SSIM) [15]. A (Graphical User Interface) GUI is built in Matlab to do the job.
The user of the GUI can translate sign language alphabets between countries
and check the similarity index (SSIM) value. The translator uses HOG features
and SVM classifier for the recalling the corresponding signs. Snapshots of GUI
testing are in figures 6 and 7.
Figure 6: Sign to Sign Translator between Bangladesh and Indonesia for sign D
International Journal of Pure and Applied Mathematics Special Issue
282
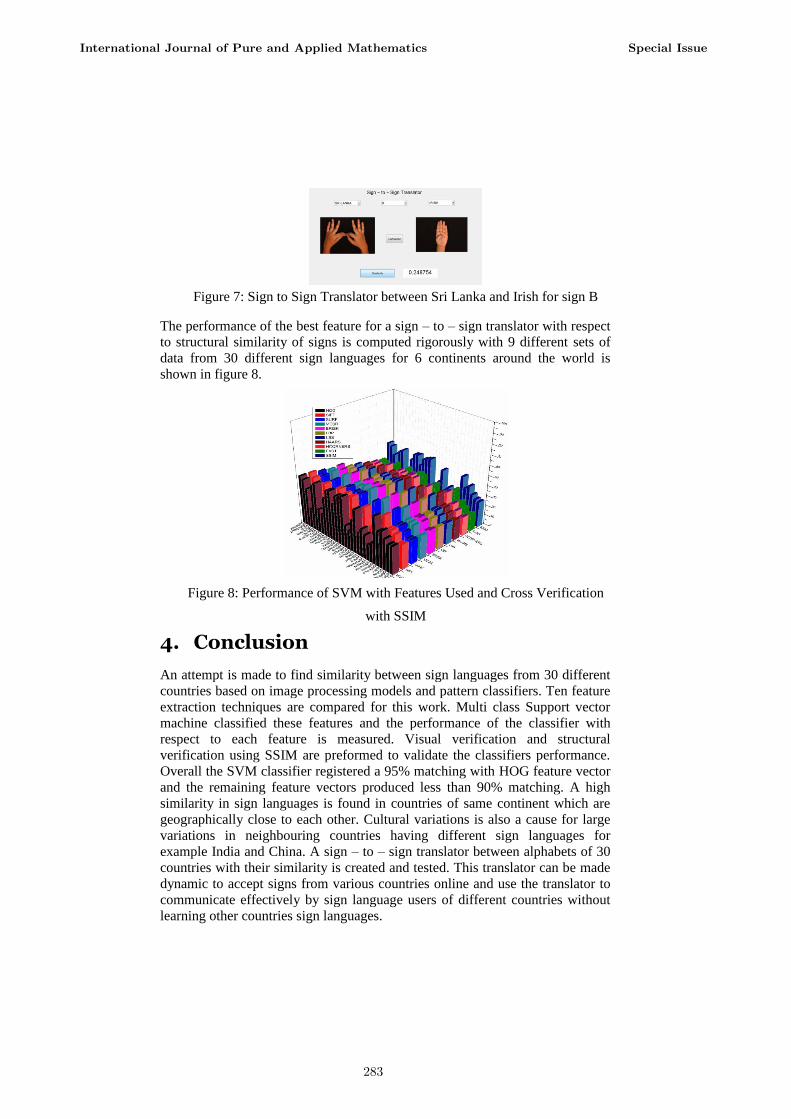
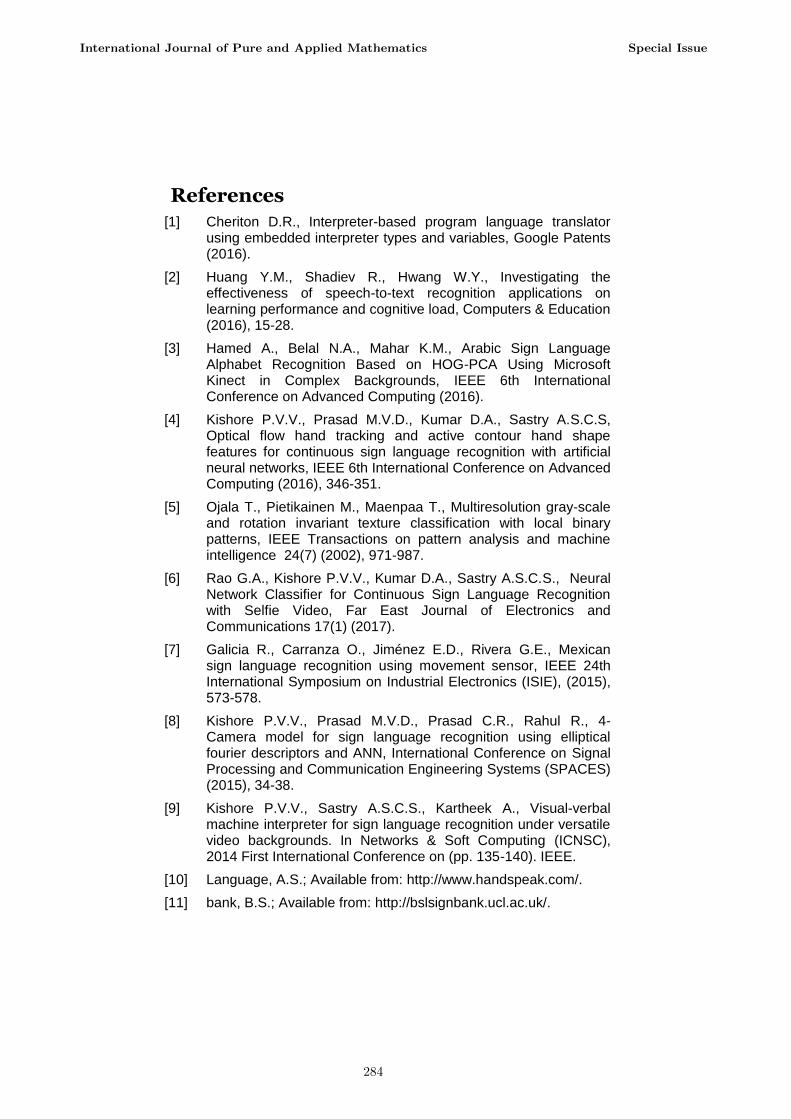
Figure 7: Sign to Sign Translator between Sri Lanka and Irish for sign B
The performance of the best feature for a sign – to – sign translator with respect
to structural similarity of signs is computed rigorously with 9 different sets of
data from 30 different sign languages for 6 continents around the world is
shown in figure 8.
Figure 8: Performance of SVM with Features Used and Cross Verification
with SSIM
4. Conclusion
An attempt is made to find similarity between sign languages from 30 different
countries based on image processing models and pattern classifiers. Ten feature
extraction techniques are compared for this work. Multi class Support vector
machine classified these features and the performance of the classifier with
respect to each feature is measured. Visual verification and structural
verification using SSIM are preformed to validate the classifiers performance.
Overall the SVM classifier registered a 95% matching with HOG feature vector
and the remaining feature vectors produced less than 90% matching. A high
similarity in sign languages is found in countries of same continent which are
geographically close to each other. Cultural variations is also a cause for large
variations in neighbouring countries having different sign languages for
example India and China. A sign – to – sign translator between alphabets of 30
countries with their similarity is created and tested. This translator can be made
dynamic to accept signs from various countries online and use the translator to
communicate effectively by sign language users of different countries without
learning other countries sign languages.
International Journal of Pure and Applied Mathematics Special Issue
283
References
[1] Cheriton D.R., Interpreter-based program language translator using embedded interpreter types and variables, Google Patents (2016).
[2] Huang Y.M., Shadiev R., Hwang W.Y., Investigating the effectiveness of speech-to-text recognition applications on learning performance and cognitive load, Computers & Education (2016), 15-28.
[3] Hamed A., Belal N.A., Mahar K.M., Arabic Sign Language Alphabet Recognition Based on HOG-PCA Using Microsoft Kinect in Complex Backgrounds, IEEE 6th International Conference on Advanced Computing (2016).
[4] Kishore P.V.V., Prasad M.V.D., Kumar D.A., Sastry A.S.C.S, Optical flow hand tracking and active contour hand shape features for continuous sign language recognition with artificial neural networks, IEEE 6th International Conference on Advanced Computing (2016), 346-351.
[5] Ojala T., Pietikainen M., Maenpaa T., Multiresolution gray-scale and rotation invariant texture classification with local binary patterns, IEEE Transactions on pattern analysis and machine intelligence 24(7) (2002), 971-987.
[6] Rao G.A., Kishore P.V.V., Kumar D.A., Sastry A.S.C.S., Neural Network Classifier for Continuous Sign Language Recognition with Selfie Video, Far East Journal of Electronics and Communications 17(1) (2017).
[7] Galicia R., Carranza O., Jiménez E.D., Rivera G.E., Mexican sign language recognition using movement sensor, IEEE 24th International Symposium on Industrial Electronics (ISIE), (2015), 573-578.
[8] Kishore P.V.V., Prasad M.V.D., Prasad C.R., Rahul R., 4-Camera model for sign language recognition using elliptical fourier descriptors and ANN, International Conference on Signal Processing and Communication Engineering Systems (SPACES) (2015), 34-38.
[9] Kishore P.V.V., Sastry A.S.C.S., Kartheek A., Visual-verbal machine interpreter for sign language recognition under versatile video backgrounds. In Networks & Soft Computing (ICNSC), 2014 First International Conference on (pp. 135-140). IEEE.
[10] Language, A.S.; Available from: http://www.handspeak.com/.
[11] bank, B.S.; Available from: http://bslsignbank.ucl.ac.uk/.
International Journal of Pure and Applied Mathematics Special Issue
284
[12] Kumar K.V.V., Kishore P.V.V., Indian Classical Dance Mudra Classification Using HOG Features and SVM Classifier, International Journal of Electrical and Computer Engineering 7(5) (2017).
[13] Sastry A.S.C.S., Kishore P.V.V., Kumar D.A., Kumar E.K. Sign Language Conversion Tool (SLCTooL) Between 30 World Sign Languages, Smart Computing and Informatics, 21-29.
[14] Kumar K.V.V., Kishore P.V.V., Anil Kumar D., Indian Classical Dance Classification with Adaboost Multiclass Classifier on Multifeature Fusion, Mathematical Problems in Engineering (2017).
[15] Prasad C.R., Kishore P.V.V., Performance of active contour models in train rolling stock part segmentation on high-speed video data, Cogent Engineering 4(1) (2017).
[16] RAJESH, M. "A SYSTEMATIC REVIEW OF CLOUD SECURITY CHALLENGES IN HIGHER EDUCATION." The Online Journal of
Distance Education and e‐Learning 5.4 (2017): 1.
[17] Rajesh, M., and J. M. Gnanasekar. "Protected Routing in Wireless Sensor Networks: A study on Aimed at Circulation." Computer Engineering and Intelligent Systems 6.8: 24-26.
[18] Rajesh, M., and J. M. Gnanasekar. "Congestion control in heterogeneous WANET using FRCC." Journal of Chemical and Pharmaceutical Sciences ISSN 974 (2015): 2115.
[19] Rajesh, M., and J. M. Gnanasekar. "Hop-by-hop Channel-Alert Routing to Congestion Control in Wireless Sensor Networks." Control Theory and Informatics 5.4 (2015): 1-11.
[20] Rajesh, M., and J. M. Gnanasekar. "Multiple-Client Information Administration via Forceful Database Prototype Design (FDPD)." IJRESTS 1.1 (2015): 1-6.
[21] Rajesh, M. "Control Plan transmit to Congestion Control for AdHoc Networks." Universal Journal of Management & Information Technology (UJMIT) 1 (2016): 8-11.
[22] Rajesh, M., and J. M. Gnanasekar. "Consistently neighbor detection for MANET." Communication and Electronics Systems (ICCES), International Conference on. IEEE, 2016.
International Journal of Pure and Applied Mathematics Special Issue
285

286