Embed Size (px)
Citation preview

1 / 15
Concept and Operating Results of a Higher-Level Automation System for the new C-Battery at the U. S. Steel Clairton Plant
Mr. Stephen Hlavach (author) Mr. Klaus-Peter Paul Leuchtmann (author)
Mr . James Zelazny (co-author) Mr. Marcel Schulz (co-author)
Integrated Mill Systems, Inc. ThyssenKrupp Industrial Solutions
Business Unit Process Technologies
(Formerly ThyssenKrupp Uhde GmbH)
CONTACT DATA
Mr. Stephen Hlavach, Mr. Klaus-Peter Paul Leuchtmann,
Integrated Mill Systems, Inc. ThyssenKrupp Industrial Solutions GmbH
8800 Barnes Lake Road, Suite 100 Friedrich-Uhde-Str. 15
15642 North Huntington, PA, USA 44141 Dortmund, NRW, Germany
Phone: +1 724-861-3500 Phone: +49 231 547-2810
E-Mail: [email protected] E-Mail: [email protected]
Mr. James Zelazny Mr. Marcel Schulz
Integrated Mill Systems, Inc. ThyssenKrupp Industrial Solutions GmbH
34525 Melinz Parkway Friedrich-Uhde-Str. 15
44095 Eastlake, OH, USA 44141 Dortmund, NRW, Germany
Phone: +1 440-918-9900x113 Phone: +49 231 547-3822
E-Mail: [email protected] E-Mail: [email protected]
KEY WORDS
Coke Plant Operation Automation, Level-1, Programmable Logic Controller, Human Machine Interface, Pusher Machine, Coal
Transfer Car, Coal Charge Car, Quench Car, Pushing and Emissions Control System, View Anywhere, Safety PLC, Redundant
PLC, Level-2, Battery Heating Control, Pushing and Charging Schedule, Heating Flue Temperatures, Coke Temperatures, Pushing
Force, COKEMASTER®, AutoTherm™, ManuTherm™, RamForce™, BatControl™, PushSched™, RamForce™, Wobbe Control,
O2-Control
ABSTRACT
A higher level automation system named COKEMASTER®
was installed on the new C-Battery. This system provides an automat-
ed and optimized machine scheduling system, smooth and efficient battery heating, continuous management of key operating data
including pushing forces and a data interface with the upper level Plant Information and Management System.
The lower level control systems, including oven machinery, were fully integrated in an unprecedented architecture. An overview of
how this improved the process along with a novel multi-phased testing approach that minimized field commissioning efforts will
be presented. This system improves operator workload, plant efficiency, and coke quality.
INTRODUCTION
In 2007 U. S. Steel decided to build a new coke oven battery with new coke oven machinery at Clairton Works near the town of
Pittsburgh. The battery was designed by ThyssenKrupp Uhde GmbH /Germany, one of the leaders in coke oven technology and
executed by Uhde Cooperation of America (UCA). The battery has 84 large oven chambers (20’-0” high, 52’- 1½” long and 18”
wide) and with 112 pushes per day the new battery alone can produce approx. 960,000 tons of coke annually. With this production
included, Clairton is now North America's largest coke plant, producing in total about 4.5 million tons annually. The new battery,
called “C-Battery” is in pair with the existing same sized B-Battery, so that the new machinery had to be designed to serve both
batteries, with one coal- tower in the middle. Two sets of pusher machines, transfer cars, and coal charging cars as well as one
2 / 15
quench locomotive, one quench-
ing car and one pushing emission
control system (PECS) have been
build. All machines are designed
to run in man-less operation,
however they are still staffed for
safety reasons. The coke from C-
Battery is quenched in a new
build quenching tower, whereas
this tower is also serving the B-
Battery. The new battery produc-
es and supplies an additional
amount of 28,700 [scfm] raw gas
to the existing by-product plant.
The ThyssenKrupp Uhde Double
Pair Heating Flue System for
coke oven gas heating enables
accurate distribution of the heat-
ing gases and air to be achieved,
thus ensures an even distribution
of temperature within the coke. It
was decided to equip this new
plant with “state of the art” automation systems, whereas most of the process control systems for the battery and machinery have
been designed and build by company IMS (Integrated Mill Systems Inc.) and the supervisory control system have been designed
and build by ThyssenKrupp Uhde GmbH. The C-Battery went into operation in November 2012 and is now in full production for
over approx. 1 ½ year.
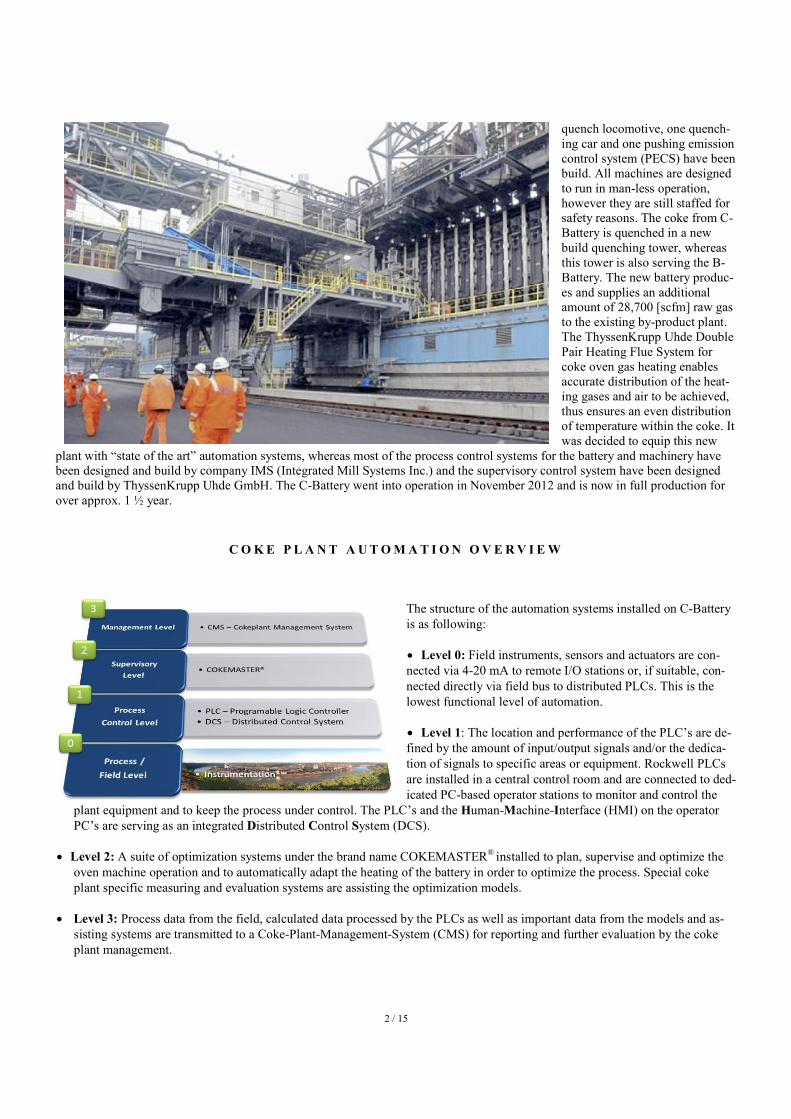
C O K E P L A N T A U T O M A T I O N O V E R V I E W
The structure of the automation systems installed on C-Battery
is as following:
• Level 0: Field instruments, sensors and actuators are con-
nected via 4-20 mA to remote I/O stations or, if suitable, con-
nected directly via field bus to distributed PLCs. This is the
lowest functional level of automation.
• Level 1: The location and performance of the PLC’s are de-
fined by the amount of input/output signals and/or the dedica-
tion of signals to specific areas or equipment. Rockwell PLCs
are installed in a central control room and are connected to ded-
icated PC-based operator stations to monitor and control the
plant equipment and to keep the process under control. The PLC’s and the Human-Machine-Interface (HMI) on the operator
PC’s are serving as an integrated Distributed Control System (DCS).
• Level 2: A suite of optimization systems under the brand name COKEMASTER®
installed to plan, supervise and optimize the
oven machine operation and to automatically adapt the heating of the battery in order to optimize the process. Special coke
plant specific measuring and evaluation systems are assisting the optimization models.
• Level 3: Process data from the field, calculated data processed by the PLCs as well as important data from the models and as-
sisting systems are transmitted to a Coke-Plant-Management-System (CMS) for reporting and further evaluation by the coke
plant management.
3 / 15
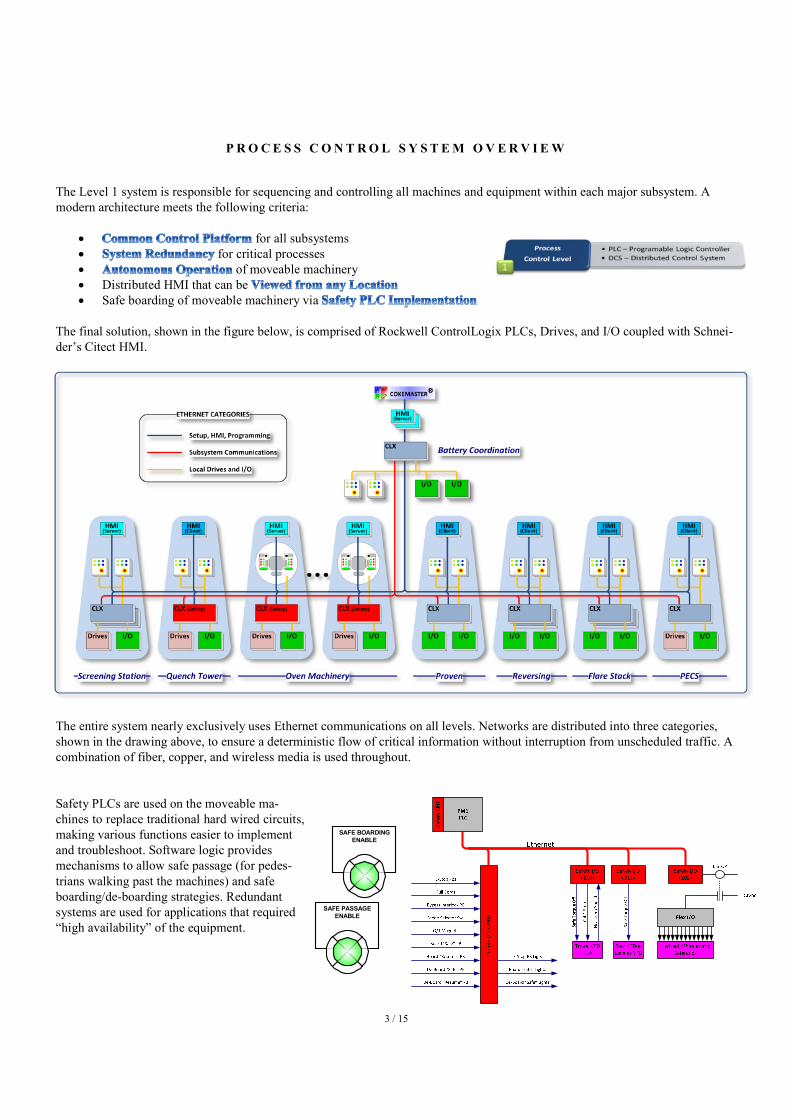
P R O C E S S C O N T R O L S Y S T E M O V E R V I E W
The Level 1 system is responsible for sequencing and controlling all machines and equipment within each major subsystem. A
modern architecture meets the following criteria:
• for all subsystems
• for critical processes
• of moveable machinery
• Distributed HMI that can be
• Safe boarding of moveable machinery via
The final solution, shown in the figure below, is comprised of Rockwell ControlLogix PLCs, Drives, and I/O coupled with Schnei-
der’s Citect HMI.
The entire system nearly exclusively uses Ethernet communications on all levels. Networks are distributed into three categories,
shown in the drawing above, to ensure a deterministic flow of critical information without interruption from unscheduled traffic. A
combination of fiber, copper, and wireless media is used throughout.
Safety PLCs are used on the moveable ma-
chines to replace traditional hard wired circuits,
making various functions easier to implement
and troubleshoot. Software logic provides
mechanisms to allow safe passage (for pedes-
trians walking past the machines) and safe
boarding/de-boarding strategies. Redundant
systems are used for applications that required
“high availability” of the equipment.
SAFE BOARDING
ENABLE
SAFE PASSAGE
ENABLE

4 / 15
H U M A N - M A C H I N E I N T E R F A C E ( H M I )
The HMI system follows a traditional client-server topology that is enhanced by using multiple servers in key locations; distributed
so that local areas can function even when communication to the rest of the system is interrupted. This is particularly important
where wireless networks are used to communicate with mobile equipment.
Given that the entire battery facility is spread over a large area and operated by several people in different locations, the entire HMI
system is built around the principle that any screen can be viewed from any location. This “View Anywhere” concept not only pro-
vides the ability to trouble-shoot a given system remotely, but also lets the production staff work together as a unit. Built-in securi-
ty ensures that only the appropriate user can control any given part of the system.
S U B S Y S T E M I N T E R A C T I O N S A N D C O O R D I N A T I O N
A “Coordinating” PLC (CCO) supervises the entire opera-
tion. It is a collection of level one control functions that
acts as the central arbiter of the schedule and equipment
interlocking. The diagram to the right illustrates the points
of functional synchronism between the major subsystems
of the C-Battery during each subsystems normal cycle of
autonomous operations.
For example, the oven charging sequence requires coordi-
nation between the active Coal Charging Car (CCC), the
active Pusher Machine (PM), and the PROven® system,
ThyssenKrupp Uhde´s system for single oven pressure
control of coke oven batteries. The machines are posi-
tioned at the “Next Oven to Charge” as determined by the
COKEMASTER® system. The coordinated charging ef-
fort begins when the CCC indicates that all four tele-
scopes are down and the seals are inflated. At this point
the PROven®
system is instructed to fully connect the cur-
rent oven to the collecting main and the pusher machine is
requested to prepare for level operation. The CCC is not
permitted to charge until the oven is fully connected to the
collecting main and the PM is aligned and ready to level.
Once both of these systems report “ready” status, the
CCO gives permission to the CCC operator to start the
feed cycle. The CCO is informed when the cycle begins
Quench
Car
Start Conveyors
Start Plow
Take SamplesOff Loadout
Fill Rail Cars
C B
atter
yPro
ven
Sys
tem C
oal
Charg
ing
Car Push
er
Mac
hin
e
SS4
&C
oke
Han
dling
Charge Oven
Replace Lids
Travel to CoalTower
Load Coal
Travel to Oven
Clean Oven Top
Pressure Reg
Disconnect
Full Suction
Coke
Tra
nsf
erC
ar
Level Coal
Travel to Oven
Remove Door
Clean Door
Push Coke
Clean Oven Jam
Replace OvenDoor
Open ChuckDoor
Replace Door
Remove Door
Attach Guide
Guide Coke
Retract Guide
Clean Jam
Clean Door
Travel to Oven
Travel to HoldingPosition
Travel Wharf
Dump Coke
Travel to Oven
Catch Coke
Travel to QuenchTower
Quench
"C"
Quen
chTow
er
Quench
Refill QuenchTanks
Refill SprayTanks
Flush Baffles andTrough
Backwash GravelFilters
Close ChuckDoor
Prepare toCharge

5 / 15
and the status is passed to the PM and PROven® system to ensure that the oven remains fully connected to the collecting main.
Coal leveling takes place during the slow feed portion of the oven charging cycle. The CCC indicates to the CCO when slow feed
is active and it, in turn, sends a command to the PM to start the leveling process. The CCO permits the CCC to finish the feed cycle
by confirming that the leveling process is underway. If the PM fails to report that it is leveling, the CCC is not permitted to feed the
remaining coal. The CCC reports when the oven is completely charged with coal and the CCO informs the COKEMASTER®
sys-
tem that the oven has been charged while also commanding the PM to stop the leveling cycle. The PM responds by extending the
level bar fully into the oven and finishing with a final sweep in the reverse direction. The charge weight of each hopper is calculat-
ed from the load cell measurements when the telescope is raised. This provides more accurate results as the force of the telescope
against the top of the oven tends to support some of the weight during the feed process. The oven is considered to be re-sealed after
the charge when the lids have been replaced and the chuck door is closed. At this point the PROven®
system is issued a message to
begin the coking cycle and start with controlling the oven-pressure.
A U T O M A T I C P O S I T I O N I N G
The machines are highly automated, including automatic spotting at the ovens. Each machine is propelled by Flux Vector Control
VFDs connected to vector duty AC motors equipped with encoder feedback. Coarse travel position feedback is derived from an ab-
solute rotary encoder mounted on a non-driven wheel with backup and cross-check using the transport drive(s) wheel encoder. Ma-
chine position is continuously reported to the CO-PLC and shown graphically via a sliding rule across the top of the screen.
Mapping arrays are used to store the locations of inter-
est along the battery. In the pusher machine, for exam-
ple, a single dimensional array of 1000 elements that
maps the travel length of C-Battery, including the
north and south maintenance areas. Each element of
the array represents one foot of distance, with element
1000 representing the centerline of B Coal Bunker.
6 / 15
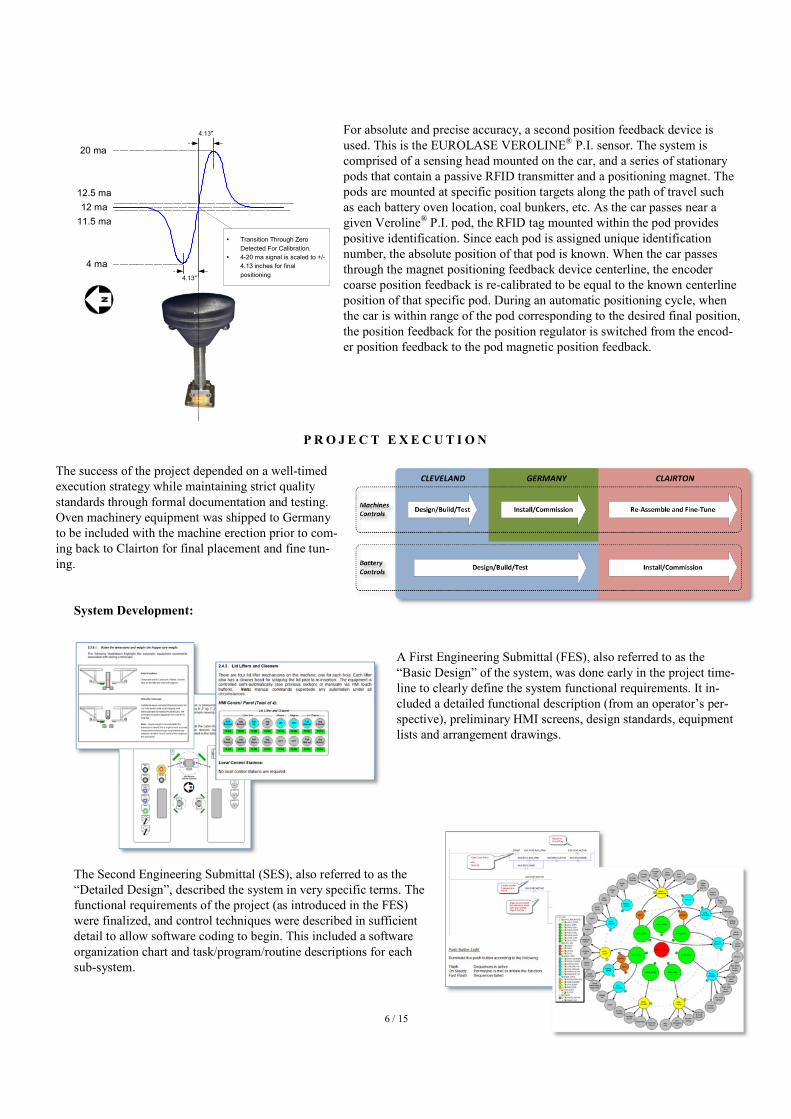
For absolute and precise accuracy, a second position feedback device is
used. This is the EUROLASE VEROLINE® P.I. sensor. The system is
comprised of a sensing head mounted on the car, and a series of stationary
pods that contain a passive RFID transmitter and a positioning magnet. The
pods are mounted at specific position targets along the path of travel such
as each battery oven location, coal bunkers, etc. As the car passes near a
given Veroline® P.I. pod, the RFID tag mounted within the pod provides
positive identification. Since each pod is assigned unique identification
number, the absolute position of that pod is known. When the car passes
through the magnet positioning feedback device centerline, the encoder
coarse position feedback is re-calibrated to be equal to the known centerline
position of that specific pod. During an automatic positioning cycle, when
the car is within range of the pod corresponding to the desired final position,
the position feedback for the position regulator is switched from the encod-
er position feedback to the pod magnetic position feedback.
P R O J E C T E X E C U T I O N
The success of the project depended on a well-timed
execution strategy while maintaining strict quality
standards through formal documentation and testing.
Oven machinery equipment was shipped to Germany
to be included with the machine erection prior to com-
ing back to Clairton for final placement and fine tun-
ing.
System Development:
A First Engineering Submittal (FES), also referred to as the
“Basic Design” of the system, was done early in the project time-
line to clearly define the system functional requirements. It in-
cluded a detailed functional description (from an operator’s per-
spective), preliminary HMI screens, design standards, equipment
lists and arrangement drawings.
The Second Engineering Submittal (SES), also referred to as the
“Detailed Design”, described the system in very specific terms. The
functional requirements of the project (as introduced in the FES)
were finalized, and control techniques were described in sufficient
detail to allow software coding to begin. This included a software
organization chart and task/program/routine descriptions for each
sub-system.
4 ma
20 ma
11.5 ma
4.13"
12 ma
12.5 ma
4.13"
� Transition Through Zero
Detected For Calibration.
� 4-20 ma signal is scaled to +/-
4.13 inches for final
positioning

7 / 15
System Testing:
The oven machinery Factory Acceptance Test (FAT) was held in Cleveland, OH. The equipment was staged and wired to rep-
resent, to the extent possible, the actual on-machine configuration(s). The electrical cabins were pre-wired with permanent ca-
bling to be easily re-installed at the erection site. Various motors and sensors as well as local control stations were temporarily
connected to illustrate system functions. Each PLC contained temporary software that simulated all significant feedback signals
pertinent to the test. Actual machine data was used to model the equipment so that each function looked and felt very realistic.
Special techniques were also used to keep the simulation code completely separate from the actual program to enhance the va-
lidity of the test. A subsequent “main” factory acceptance was done just prior to startup and employed similar techniques.
After the machinery factory test all of the equipment was sent to
Germany for installation on the machines. Some of the PLC
equipment was retained in Cleveland for the purpose of a final
totally integrated factory test. This "Main" factory test included
all the systems involved in the battery. The COKEMASTER®,
battery PLC's, machinery PLC's and HMI's were all setup for
this test. Simulation software was written in the machinery and
battery PLC's to support this FAT. The COKEMASTER® pro-
vided the oven scheduling information to the battery and ma-
chinery systems. A fully automatic machinery simulator was
developed that allowed all the machines to operate in a com-
pletely autonomous fashion. This allowed the system to be test-
ed continuously for days to verify all the functional require-
ments were met.

8 / 15
S U P E R V I S O R Y L E V E L - C O K E M A S T E R®
O V E R V I E W
COKEMASTER® is a modular automation framework that mainly serves to optimize the coke plant operation. It is structured as a
Level 2 System and is usually suited between a DCS and higher level management systems, in U. S. Steel’s case the CMS. The
COKEMASTER® framework for U. S. Steel Clairton contains the following modules:
• AutoTherm™-G: automatic coke cake temperature measurement
• BatControl™: dynamic heat quantity calculation
• ManuTherm™: manual heating flue temperature measurement
• PushSched™: dynamic pushing and charging schedule
• RamForce™: automatic pushing force measurement
For detailed information to the individual modules, please refer to the publications made during AISTech 2011 or the website of
ThyssenKrupp Industrial Solutions (http://www.thyssenkrupp-industrial-solutions.com/en/products-solutions/coke-plant-
technologies.html).
The following schema shows the interconnection between the individual COKEMASTER® models implemented in Clairton. Man-
ual heating flue temperature measurements with ManuTherm™ (hand held pyrometer with internal data storage) can be used as an
input to the Heat Quan-
tity Calculation (HQC)
inside BatControl™.
Also and preferable,
AutoTherm™-G is used
as continuous tempera-
ture feedback for HQC,
because it is an auto-
matic measurement sys-
tem. With each push of
a carbonized oven an
indication of the tem-
perature profile of the
coke cake from the re-
spective oven is given.
This information is
evaluated by automatic
calculation tasks and
provided for the down-
stream processes as the
average battery temper-
ature, so called
“Mean Battery Temperature” (MBT). The system design is described in detail in chapter “COKEMASTER®
- AutoTherm™-G“.
The dynamic pushing and charging schedule PushSched™ is tightly interlocked with the coordination PLC (CCO). The entire pro-
duction is based on the coordination of the pushing and charging and the Pusher Machines (PM) and Coal Charging Cars (CCC)
are interlocked to the calculated oven position and timestamps from this scheduling system. With this interaction to the operation
and the feedback from the production, another important input parameter for BatControl™, the expected coking time, can be calcu-
lated. So the heat quantity model receives the necessary performance information from of the process, generated by PushSched™,
to react in advance to the production demands. Please refer to the chapter “COKEMASTER®
- PushSched™“ for more details.
For the optimum heating of the C-Battery several additional parameters from the process are considered to support the use of un-
der-firing gas pressure control. To make pressure control work, two additional controllers were installed in the C-Battery heating
system.
1. Extended Wobbe control, which reacts on fluctuations of the calorific value in the under-firing Coke Oven Gas (COG).
2. Extended O2 control, to guarantee to any time an optimum combustion in the heating flues which prevents stack emissions.
The benefits of BatControl™ and its extensions can be found in the respective chapters. “COKEMASTER®
- BatControl™ and
Wobbe- & O2-Control“.
9 / 15
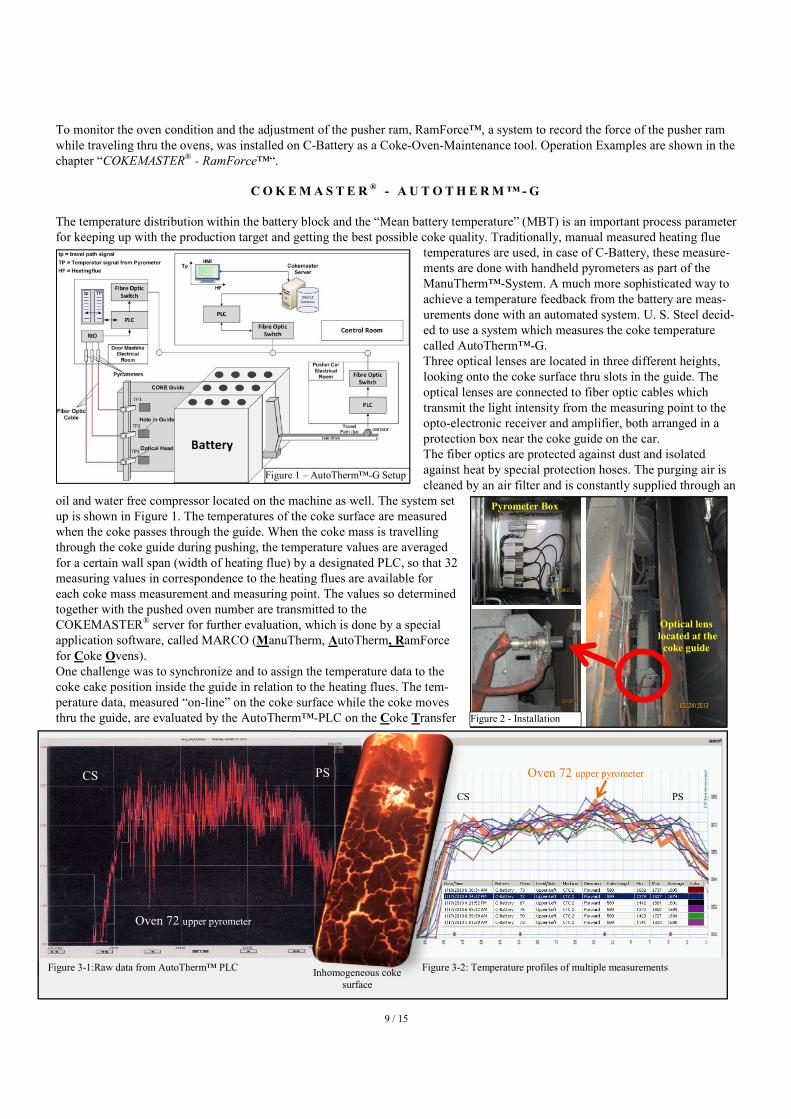
Figure 3-2: Temperature profiles of multiple measurements Figure 3-1:Raw data from AutoTherm™ PLC Inhomogeneous coke
surface
PS CS
Oven 72 upper pyrometer
Oven 72 upper pyrometer
CS PS
To monitor the oven condition and the adjustment of the pusher ram, RamForce™, a system to record the force of the pusher ram
while traveling thru the ovens, was installed on C-Battery as a Coke-Oven-Maintenance tool. Operation Examples are shown in the
chapter “COKEMASTER®
- RamForce™“.
C O K E M A S T E R®
- A U T O T H E R M ™ - G
The temperature distribution within the battery block and the “Mean battery temperature” (MBT) is an important process parameter
for keeping up with the production target and getting the best possible coke quality. Traditionally, manual measured heating flue
temperatures are used, in case of C-Battery, these measure-
ments are done with handheld pyrometers as part of the
ManuTherm™-System. A much more sophisticated way to
achieve a temperature feedback from the battery are meas-
urements done with an automated system. U. S. Steel decid-
ed to use a system which measures the coke temperature
called AutoTherm™-G.
Three optical lenses are located in three different heights,
looking onto the coke surface thru slots in the guide. The
optical lenses are connected to fiber optic cables which
transmit the light intensity from the measuring point to the
opto-electronic receiver and amplifier, both arranged in a
protection box near the coke guide on the car.
The fiber optics are protected against dust and isolated
against heat by special protection hoses. The purging air is
cleaned by an air filter and is constantly supplied through an
oil and water free compressor located on the machine as well. The system set
up is shown in Figure 1. The temperatures of the coke surface are measured
when the coke passes through the guide. When the coke mass is travelling
through the coke guide during pushing, the temperature values are averaged
for a certain wall span (width of heating flue) by a designated PLC, so that 32
measuring values in correspondence to the heating flues are available for
each coke mass measurement and measuring point. The values so determined
together with the pushed oven number are transmitted to the
COKEMASTER® server for further evaluation, which is done by a special
application software, called MARCO (ManuTherm, AutoTherm, RamForce
for Coke Ovens).
One challenge was to synchronize and to assign the temperature data to the
coke cake position inside the guide in relation to the heating flues. The tem-
perature data, measured “on-line” on the coke surface while the coke moves
thru the guide, are evaluated by the AutoTherm™-PLC on the Coke Transfer
Pyrometer Box
Optical lens
located at the
coke guide
Figure 1 – AutoTherm™-G Setup
Figure 2 - Installation

10 / 15
Car (CTC). The location of the coke inside the guide can only be calculated by using the ram position while the pusher ram moves
thru the oven-chamber. But the ram position is gathered by a PLC on the Pusher Machine (PM) only. This means, two different
signal sources from two different PLC’s, have to be connected with a high performance connection in order to allow a data ex-
change in “real time”. Another challenge was the evaluation of the temperature raw data. Figure 3-1 shows the temperature raw da-
ta in terms of time during one push. Due to the inhomogeneous temperature of the coke with hotter and colder spots inside the coke
surface structure, the measured temperatures are fluctuating in a wide range. This may lead to the conclusion, that the measuring
system is not suitable for detecting heating problems. But this is not the case. Due to sophisticated filter and averaging methods, an
acceptable temperature profile can be calculated (see orange curve in Figure 3-2). In Figure 3-2, a comparison of multiple tempera-
ture profiles from various ovens is shown.
Temperatures, displayed for multiple ovens, are sharing the same behavior. This means they follow similar profiles and show good
comparability between each other as well as a clear and visible correlation between the coke temperature profile and the heating
flue temperature profile. This proves that the measurement system is functioning properly and can be used to supervise and evalu-
ate the temperature distribution in each oven and to calculate the “Mean Battery Temperature” (MBT), for the C-Battery.
Figure 4 shows an example how to de-
tect irregularities in the heating process
with AutoTherm™-G System coke
temperature measurements. The evalu-
ation system provides at any time an
overview of the heat distribution of the
complete battery, using a “mosaic” -
graph. In this graph, each “mosaic -
stone” represents one heating flue. The
color of the mosaic stone represents
the coke cake temperature at the re-
spective heating flue position. Differ-
ent colors are assigned to different
temperature ranges. With the mosaic
graph, weak spots can be identified
quickly and then further investigated.
In this example, the temperatures of
the upper pyrometer are recorded as a
top view thru the battery block. It is
obvious that in the area of heating flue
6-10 extreme low temperatures
(“Blue”mosaic blocks) have been
measured in longitudinal direction of
the battery for nearly all ovens. Look-
ing to the individual temperature pro-
files, this temperature fault through is
also visible (see Figure 5). The tem-
perature drop is so steep, that it seems
doubtful to be the result of a heating
problem within the heating flues. A
graduated temperature transfer takes
place between each heating flue and
the wall and some equalization will
take place in the transfer process, so
that a “cold” heating flue will never show such a deep temperature drop in the coke cake. Further investigations have found out that
it was not a temperature problem but an undercharging between charging hole 1 and 2. This leads to a valley in the coke line. In
other words, in the level of the upper pyrometer there was simply no coke to be measured between charging hole 1 and 2. No coke
cake, no temperatures!
This example shows the benefit but also the limitations of the measuring system. Irregularities in the coke cake temperature profile
can be easily detected but also can be easily misinterpreted. However, an experienced operator should be able to distinguish be-
tween both troubles causes and will draw the right conclusions.
Figure 4 – AutoTherm™-G - PlantOverview HMI
Figure 5 – Evaluation HMI of AutoTherm™-G

11 / 15
1
4 5
2a
3
2b 2c
empty
C O K E M A S T E R®
- P U S H S C H E D ™
In the dynamic pushing and charging schedule application, named PushSched™ , all relevant production data, which means infor-
mation received from the CCO and calculated values from the dynamic pushing and charging schedule are displayed in an operator
interface client application as the human machine interface (HMI). This application is available for standard Microsoft Windows
environments and comes with the newest usability techniques, such as docking of tabs, auto sizing of all forms to the aspect ratio
and size of the window. On Unix based systems and on some automation systems (i.e. Siemens SIMATIC WinCC) this application
can be implemented as Microsoft .Net User Control.
PushSched™ is connected via an OPC connection to the CCO where all oven machine information is available and the cross-
battery interlocking is implemented. This interface is used for receiving and sending data from/to the machines.
Most important data-exchange:
Sending direction
(COKEMASTER to CCO):
� Push Oven No.
� Push Timestamp
� Charge Oven No.
� Charge Timestamp
Receiving direction
(CCO to COKEMASTER)
� Last Pushing Oven No.
� Last Pushing Timestamp
� Last Leveling Oven No.
� Last Leveling Timestamp
� Last Leveling StrokeCount
� Last Charging Oven No.
� Last Charging Timestamp
� Last Charging CoalWeight
There is a cyclic refresh of the HMI-Client application which brings the operators in the Control Room in the position to have near-
ly a real-time view to the operation outside. The example in Figure 6 shows a typical pushing and charging schedule where the in-
formation for pushing is shown in the yellow colored section, for leveling in green, for charging in blue and coking time infor-
mation in light orange. The last pushed oven, in this example oven #28, is marked by the red rectangle (item no. 1). The infor-
mation at the bottom (marked with item no. 2a-2c) shows additionally the last push oven, the last level oven and the last charge
oven. The bar graphs in the column “Coking Progress” shows the coking progress of the respective oven. Ovens to be operated
next, which have reached the scheduled coking time, are displayed as dark green going into dark red color if the target coking time
is exceeded (item no. 3). Ovens which are freshly charged are colored yellow, going to light green for ovens in the normal coking
process (item no. 4). These colors are configurable and can be stored as general or as user-dependent parameter. Each oven opera-
tion is recorded and any significant deviation to the target coking time is marked (item no. 5). Rules can be set to highlight incon-
stancy in the coke plant production at a glance.
The PushSchedTM
application is the scheduling tool for all changes in the production process. Implemented assistance functions
support the operation personnel to guarantee an efficient and balanced oven operation. Immediately after a machine operation is
executed the system automatically recognizes this action and considers it for the next update of the schedule. PushSchedTM
can
handle normal production planning as well as all types of special operation (i.e. compensation of breakdown, decreased production,
special handling of ovens for repair, ovens with extended coking times, etc.). A re-calculation can be triggered and remade any
time when there is a change in production, any operating trouble or any special need to do so. Several strategies are available to
handle a loss of production. The loss can be accepted or made up for by increasing production with shortening the coking time in a
careful and secure manner for keeping best heating performance and production. The main criteria are to treat the Battery and oven
machinery gently to achieve long service lifetimes while keeping up with the scheduled production.
The dynamic pushing and charging schedule is closely interlocked with the ThyssenKrupp Uhde GmbH PROven®
system to handle
the automatic disconnection from the collection main for pushing and reconnection to the collection main for charging.
Figure 6 – PushSched™ HMI – Oven States

12 / 15
Additionally the calculated expected coking time is used as set point for the different pressure steps over the coking process and is
used for the coking time based interlocking (oven carbonized / oven not carbonized).
In the rare and unpredictable case of communication lost between the COKEMASTER system and the CCO, a buffer of 20 opera-
tions for pushing and charging is implemented. After the communication disturbance is resolved, a process for buffer synchroniza-
tion is triggered, the dynamic pushing and charging schedule system will be updated with the latest machine actions (ovens operat-
ed during the outage), followed by a new schedule calculation to update the buffer in the CCO and to bring the system back into
full automatic mode.
In addition to this, there is a function in the CCO to drive the machines in Manual Mode. If this mode is selected, the buffer in the
CCO is deleted and respectively one pushing target and respectively one charging target can be inserted manually.
Figure 7 illustrates the interconnection between the COKEMASTER® Client application and the subsystems. From the
COKEMASTER® - PushSched™ Report (left side) the required information is forwarded to the CCO and from there to the ma-
chines and to PROven®.
C O K E M A S T E R®
- B A T C O N T R O L ™
The performance of the automatic heating control function of the BatControl™ system is displayed in Figure 8 over a period of 7
days. The black curve is the so called “expected Coking Time (eCT), which is an average of individual coking times of the next i.e.
45 ovens to be pushed. Therefore the expected coking time is a look into the future production. The target Coking Time (CT-black
line) is scheduled to be approx.18:30 hours, but due to commissioning work and other delays, in this case the production is fluctu-
ating between 18:00 hours minimum and 27 hours maximum (refer to time period A, B,C). If the coking time increases (i.e. due to
a delay in production), the heat input to the battery has to be decreased. If the coking time is decreased (i.e. to speed up the produc-
tion), the heat input to the battery has to be increased. The heat to the C-Battery is provided by manipulating and controlling the
under-firing Gas Pressure (GP - blue curve). If the pushing schedule program detects a delay in production, a new expected coking
time development in the future is calculated and the pushing schedule relays it to the heat control system. The heating calculation
determines a new heat demand for the battery and in this case the system will decrease the under-firing gas pressure. The same
procedure applies to a speed up of production. Therefore each increase or decrease of production (see black arrows) is automatical-
ly followed by a variation of the under-firing gas pressure (see blue arrows). It is obvious that a sudden unscheduled increase or
2 c0harging and pushing operations in CCO buffer Active Charging Car
Active Pusher Machine
PROven® Oven Disconnected – Ready to push Oven Connected – Ready to charge
Oven - 030
Oven - 030
Oven - 024
Oven - 024

13 / 15
C
A B
18:00
eCT
GP
CT=18:30h
--29:00 h
--17:00 h
27.00 h
Coke Temperature
Decrease
1060
Time Delay
Figure 8 – BatControl™ 7 day trend plot
Co
ke
cak
e te
mper
atu
re
Hea
tin
g f
lue
tem
per
atu
re
decrease of production will have a direct influence of the coke temperature. Ovens in a delay have extended coking times which
leads to over-carbonization and higher coke end temperatures after pushing. Making up for production too fast will result in low
coke temperatures, because the heat transfer from the heating flues to the coke cake is slow and needs time and can’t keep up with
the sudden heat demand. This interrelation leads to a certain fluctuation of the coke temperature (brown curve). Since the coke
temperature is measured on the surface of the coke cake during pushing (by AutoTherm™), a too hot coke is a permanent loss of
energy in the battery. The lost heat is no longer available in the battery brickwork, so ovens which are pushed too fast to make up
for production are maybe not well carbonized and can produce pollution during the pushing sequence. The heating control system
may compensate some of the lost heat automatically, but is limited by the time delay of the slow heat transfer. As the speed-up of
production start in period “C” the heat input (gas pressure) is increased immediately. The first ovens are over-carbonized and have
enough heat accumulated during the delay, therefore the decrease of temperatures starts with a time delay (green arrow) when the
buffered heat has been pushed out and wasted. As the coking time decreases further (from 27:00 hours to 18:00 hours), the coke
temperature drops from 1060 degC (=1940 degF) to 975 degC (=1787degF). This happens because the balance of heat supply, heat
transfer and heat loss (by decreased coking time) came out of sync. Therefore a fluctuation of production will always lead to a fluc-
tuation of coke temperatures and it is the goal of any automation to keep this fluctuation as small as possible. The red stepped curve
is the manually measured heating flue temperature. The heating wall temperatures are not so good for controlling the heat, because
they are sampled not so frequently and therefore they are not so reactive to production changes. But it is interesting to see that the
heating flue temperatures are not so much fluctuating as the coke temperature. They are more or less in a narrow band around the
orange dotted line. This shows that the control is on target and the automatic adaption of the under-firing gas pressure by the
BatControl™ system has been done well in advance to keep up with heat demands.
C O K E M A S T E R ® - W O B B E & O 2 - C O N T R O L
The under-firing pressure is only one out of multiple heating parameters which influences the burning of the gas. The heat input is
a multiplication of gas-volume and calorific value, whereas the gas volume is a direct function of the gas pressure. A measure for
the calorific value is the Wobbe-Index. If the Wobbe (=gas composition) is very stable, the production demand is the only influenc-
ing factor for the gas pressure controller. But if the Wobbe is not stable, the fluctuation of the Wobbe must be compensated as well.
This can be done by cascading a Wobbe control on top of the under-firing gas control. Wobbe fluctuations are compensated by
adapting the gas pressure to maintain under all circumstances a constant energy supply to the battery while having a complete
“smokeless” burning of the gas. To reach this goal, the waste gas pressure must additionally be adjusted to the changes in the un-
der-firing gas pressure to suck enough oxygen thru the heating system for getting an optimal burning result. For the given produc-
tion demand and the given gas quality, the heating control system BatControl™ calculates the optimal oxygen content for best
“smokeless” burning results. Best burning results can only be achieved with a gas to air ratio (Lambda) of 1.2, which means 20 %

14 / 15
105
mmH2O
-38
mmH2O
O2 below 4 %
instantaneous increase of chimney suction
Figure 9 – BatControl™ - Wobbe and O2 control
Coking Time
Ovens with regular coking time (~19h). Maximum current 123 – 133 Amps
Ovens with extended coking time (33h-41h) . Maximum current 151 – 166 Amps
Negative pushing force caused by
proper motion of the pusher ram
while lowering the scorpion tail
Pushing Force
Figure 10 – RamForce™ - ovens with extended coking
time (“hot” ovens) causes higher pushing forces
more oxygen as needed for stoi-
chiometric burning. Based on
figures of the Wobbe and un-
der-firing gas pressure, the final
result is a waste gas chimney
suction needed to pull the right
amount of oxygen thru the heat-
ing system. The result is send to
the waste gas controller as a set
point for execution. Figure 9
shows the operation results for
this combination of a cascaded
Wobbe control linked with an
advanced waste gas pressure
control. The red curve is the
Wobbe value measured by a
Wobbe Analyzer somewhere in
the gas supply system. The blue
curve is the corresponding un-
der-firing pressure calculated
for the basic heating requirements of the production but corrected for Wobbe fluctuations. As can be seen, the Wobbe fluctuations
are perfectly compensated by the gas pressure controller (black arrows). Whenever the Wobbe goes up, the gas pressure will be re-
duced accordingly and vice versa to maintain a balanced energy input. The green curve is the controlled chimney suction counted
as a negative value from the top (-15 mmH2O) to the bottom (-60 mmH2O) of the graph. The chimney suction works in the same
direction as the gas pressure (blue arrow). Whenever the gas pressure increases (=more gas to burn) the chimney suction is
increased accordingly to bring in more air
to the heating system. In the example in
Figure 9, the heating control has increased
the gas pressure to 105 mmH2O (blue ar-
rows) and at the same time the chimney
suction is raised to -38 mmH2O (green ar-
rows). To avoid incomplete combustion
and smoking of the chimney under all cir-
cumstances, a special safety mechanism
has been developed. The chimney suction
is automatically increased as soon as the
oxygen in the waste gas goes below 4%
(see red and orange markings). With these
special features of the C-Battery automa-
tion system, the combustion in the heating
system and the heat demand of C-Battery
is well controlled.
C O K E M A S T E R®
-
R A M F O R C E ™
RamForce™ is part of the
COKEMASTER®
-Framework and is a tool
to monitor the pushing performance and to
support the maintenance of the oven. The
pushing force is a good indicator for the
oven conditions (i.e. heating and wall
alignment) as well as pusher machine ram
condition (i.e. ram alignment and straight-
ness). The current consumption of the fre-
quency controlled ram drive motor is a

15 / 15
rect indication of the forces during the pushing progress. The Amperage values from the frequency converter are recorded by the
AutoTherm PLC and correlated to the travel path of the ram. The recording starts as soon as the ram move out of its home position.
This allows conclusions about all travel related forces as well as conclusions of mechanical performance of the ram drive system.
During the commissioning of the C-Battery, the pushing sequence for the coke oven battery was altered. This led for a short period
of time to ovens with extended coking times. How these ovens behaved while pushing was monitored by RamForce™ and evaluat-
ed by the persons responsible for operation as shown in Figure 10.
The pushing force curves above the red line shows the ovens on extended coking time (33-42 hours) with ~30Amps higher maxi-
mum pushing force in comparison to ovens with normal coking times (approx. 19 hours). This is caused by a structural change of
the coke in the ovens with longer coking time. Due to the over-heating of the coke cake, the coke granulation becomes smaller and
smaller which leads to a disintegration of the coke cake stability. This means the coke start to lean closer to the oven chamber walls
which creates additional friction during pushing. This leads to the effect that the coke cake needs additional force to be pushed out
smoothly.
C O N C L U S I O N
The coke plant process control level system from IMS in combination with ThyssenKrupp Uhde´s online process optimisation sys-
tem is a powerful software solution for the automation of the C-Battery in U. S. Steel’s Clairton coke plant. All systems from coke
plant operation level up to the coke plant management have been successfully taken into operation already before or shortly after
the start of production (first coke) and have fully met the requirements of the operation. With its sophisticated automation systems
the C-Battery is up to this date the most modern coke plant in the USA.
A B B R E V I A T I O N S
Abbreviation Explanation Abbreviation Explanation
CCC Coal Charge Car OPC OLE for process control
CCO Coordinating PLC OVN Oven number
CHGTM Charging time PAU Pause time between pushes
CMS Coke Plant Management System PC Personal Computer
COKTM Coking time PECS Pushing and Emissions Control System
CTC Coal Transfer Car PLC Programmable Logic Controller
CWT Charging weight PM Pusher Machine
degC…degF degree Celsius ….degree Fahrenheit PROven® Pressure Regulated Ovens
FAT Factory Acceptance Test PTIME Pushing time
FES First Engineering Submittal QC Quench Car
HMI Human Machine Interface RFID Radio Frequency Identification
HQC Herat Quantity Calculation SCADA Supervisory Control and Data Acquisition
I/O Input/Output (used for electrical signals) SES Second Engineering Submittal
ma….mA milliampere (1/1000 Ampere) WT Coal moisture
MBT Mean Battery Temperature VFD Variable Frequency Drive
O2 Oxygen
A C K N O W L E D G E M E N T S
We wish to thank U. S. Steel for their support during installation, commissioning and operation of the coke plant automation sys-
tem and for supporting us to compile this presentation for the AIStech 2014. We also like to thank Matt Kraeuter from Uhde Coop-
eration of America for his continues support.