Embed Size (px)
Citation preview
Concept Design Optimization Applied on a new semi-submersible
heavy transport vessel in the Dockwise S-class market
Benny Banen
Delft
Univ
ers
ity o
f Tech
nolo
gy

Concept Design Optimization Applied on a new semi-submersible heavy transport
vessel in the Dockwise S-class market
By
Benny Banen
In partial fulfilment of the requirements for the degree of
Master of Science in
Offshore and Dredging Engineering
for the specialization of Floating Structures at the
Delft University of Technology
to be defended publicly on Monday October 19th
, 2015 at 2:00 PM
The Thesis is approved by the Thesis Examination Committee. On behalf of Delft University of Technology: On behalf of Dockwise:
Maritime & Transport Technology Department Design, Tendering and Engineering Department ___________________________________ __________________________________ Prof. ir. J.J. Hopman (Chairman) Ir. R.L. Postma Section Ship Design, Production and Operations Lead Transport Engineer ___________________________________ __________________________________ Ir. J.W. Frouws. Ir. J. van Leuwen Section Ship Design, Production and Operations Specialist Transport Engineer ___________________________________ Dr.ir. H.P.M. Veeke Section Transport Engineering and Logistics
Delft University of Technology Dockwise Marine Contractor Faculty of Mechanical, Maritime & Materials Engineering Boskalis, Offshore Energy Department of Offshore and Dredging Engineering Design, Tendering and Engineering Department Mekelweg 2 Rosmolenweg 20 2628 CD Delft, The Netherlands 3356 LK Papendrecht, The Netherlands www.3me.tudelft.nl www.dockwise.com
This Thesis consists of 92 pages, is confidential and cannot be made public until 19-10-2018. After this date it may only be
reproduced literally and as a whole. For commercial purposes, it may only be reproduced with written authorization of Delft
University of Technology, Dockwise and the author. Requests for consult are only taken into consideration under the
condition that the applicant denies all legal rights on liabilities concerning the content of the advice.
PREFACE
The requirement to successfully finish the MSc. Offshore and Dredging Engineering with specialisation
Floating Structures at the Delft University of Technology has become a dedicated heavy transport industry
related study. The topic of this thesis is: “Concept design optimization applied on a new semi-submersible
heavy transport vessel in the Dockwise S-class market”.
This thesis contains the concept design optimization of a new Heavy Transport Vessel for Dockwise
Shipping BV. The main reason to start a market investigation, concept design study and economic
feasibility study, is the replacement of the S-class vessels that served the market of Dockwise for more
than thirty years. The optimum dimensions and hull shape together with optimum vessel speed for an initial
concept based on the current S-class and Dockwise market are identified. Attractive design add-ons are
taken into account, and with that an advice for a new heavy transport vessel is given.
During this thesis, Dockwise gave me the opportunity to gain operational experience by arranging a visit to
the Swan, during its loading and discharge operation of the Seajacks Hydra Liftboat. The transport of this
cargo was from Dubai, UAE to Rotterdam, The Netherlands.
The thesis committee is represented by the Delft University of Technology and the company Dockwise.
Representing Delft University of Technology:
Prof. ir. J.J. Hopman;
Ir. J.W. Frouws;
Dr.ir. H.P.M. Veeke.
Representing Dockwise:
Ir. R.L. Postma;
Ir. J. van Leuwen.
I would like to take the opportunity to write a few acknowledgements to the people that supported me
during this study. I appreciate and thank Ralph Postma and John van Leuwen as my supervisors, who
have coached me in a respectful and open minded way during my time at Dockwise and their support
towards a future career at Royal Boskalis Westminster. Appreciation towards Koos Frouws for his sharing
of dedicated shipping management experience and Professor Hans Hopman for his support throughout
the whole graduation process.
Although this adventure had its ups and downs, I felt blessed to have the privilege and opportunity to
accomplish this thesis. My wife, Lillian, is worth all thanks for supporting me with love, patience and the
fact that she had to live with a student for more than five years of marriage. My daughter, Philippa, for the
joy, love and happiness she brings in my life. My parents for all their love and support during these nine
years of study and the fact that they are proud, brought me motivation. My family and friends for all the
prayers and support.
Benny Banen Delft, October 2015
CONCEPT DESIGN OPTIMIZATION APPLIED ON A NEW SEMI-SUBMERSIBLE HEAVY TRANSPORT VESSEL IN THE S-CLASS MARKET
iii|xii
MSc. THESIS |
LIST OF CONTENTS PREFACE ................................................................................................................................................ II
LIST OF FIGURES .................................................................................................................................... V
LIST OF TABLES .................................................................................................................................... VI
LIST OF ABBREVIATIONS .................................................................................................................... VIII
LIST OF NOMENCLATURE ...................................................................................................................... IX
LIST OF DEFINITIONS .............................................................................................................................. X
ABSTRACT ............................................................................................................................................. XI
1 INTRODUCTION ............................................................................................................................ 1
1.1 BACKGROUND ................................................................................................................................ 1 1.2 OBJECTIVES .................................................................................................................................... 2 1.3 SCOPE ............................................................................................................................................. 2
1.3.1 MARKET ANALYSIS .................................................................................................................................................. 2 1.3.2 S-CLASS DESIGN EVALUATION ................................................................................................................................ 3 1.3.3 CONCEPT DESIGN EVALUATION ............................................................................................................................. 3 1.3.4 CONCEPT DESIGN OPTIMIZATION .......................................................................................................................... 4 1.3.5 CONCEPT SELECTION .............................................................................................................................................. 5
1.4 ACTIVITY PLAN................................................................................................................................ 5
2 MARKET ANALYSIS ........................................................................................................................ 7
2.1 DOCKWISE MARKET PROFILE ......................................................................................................... 7 2.1.1 SERVICES................................................................................................................................................................. 7 2.1.2 HEAVY TRANSPORT VESSELS .................................................................................................................................. 9
2.2 S-CLASS MARKET PROFILE ............................................................................................................ 12 2.2.1 INTRODUCTION .................................................................................................................................................... 12 2.2.2 S-CLASS MARKET INVESTIGATION ........................................................................................................................ 14 2.2.3 S-CLASS MARKET PROGNOSIS .............................................................................................................................. 19
2.3 BASE CASE DESIGN DRIVERS ........................................................................................................ 21 2.3.1 DESIGN DRIVERS OF ENERGY AND RESOURCES MARKETS.................................................................................... 21 2.3.2 P&M DESIGN DRIVERS .......................................................................................................................................... 24 2.3.3 SUMMARY DESIGN DRIVERS ................................................................................................................................. 25 2.3.4 CONCLUSION ........................................................................................................................................................ 26
3 S-CLASS DESIGN EVALUATION .................................................................................................... 29
3.1 INTRODUCTION ............................................................................................................................ 29 3.1.1 S-CLASS DESIGN PARTICULARS ............................................................................................................................. 29 3.1.2 LAY-OUT DISCRIPTION .......................................................................................................................................... 30 3.1.3 WEIGHT CALCULATIONS ....................................................................................................................................... 30 3.1.4 POWER CALCULATIONS ........................................................................................................................................ 32
3.2 S-CLASS REQUIRED FREIGHT RATE CALCULATION ....................................................................... 37 3.2.1 CAPITAL COSTS ..................................................................................................................................................... 37 3.2.2 VOYAGE COSTS ..................................................................................................................................................... 39 3.2.3 RUNNING COSTS ................................................................................................................................................... 42 3.2.4 REQUIRED FREIGHT RATE ASSUMPTIONS ............................................................................................................. 43
3.3 VERIFICATION AND VALIDATION .................................................................................................. 45 3.3.1 VERIFICATION OF WEIGHT ASSUMPTION ............................................................................................................. 45 3.3.2 VALIDATION OF SHIP RESISTANCE APPROXIMATION TOOL .................................................................................. 45 3.3.3 VERIFICATION OF ADDED WIND RESITANCE ......................................................................................................... 46 3.3.4 VERIFICATION OF BUILDING COSTS CALCULATION ............................................................................................... 46
4 CONCEPT DESIGN EVALUATION .................................................................................................. 47
4.1 BUSINESS OBJECTIVE .................................................................................................................... 47
iv|xii
4.2 INITIAL CONCEPT DESIGN ............................................................................................................. 48 4.2.1 GENERAL CONCEPT DESIGN DRIVERS ................................................................................................................... 48 4.2.2 LAY-OUT SELECTION ............................................................................................................................................. 49 4.2.3 HULL SELECTION ................................................................................................................................................... 55 4.2.4 WEIGHTS CALCULATIONS ..................................................................................................................................... 56 4.2.5 POWER CALCULATIONS ........................................................................................................................................ 59
4.3 VERIFICATION AND VALIDATION .................................................................................................. 65 4.3.2 CONCLUSION ........................................................................................................................................................ 66
5 CONCEPT DESIGN OPTIMIZATION ............................................................................................... 67
5.1 OPTIMIZING THEORY .................................................................................................................... 67 5.1.1 DIMENSIONAL AND SPEED REQUIREMENTS ......................................................................................................... 67 5.1.2 GENERAL REQUIREMENTS .................................................................................................................................... 69 5.1.3 SOLVER DISCRIPTION ............................................................................................................................................ 72 5.1.4 OPTIMIZING FUNCTION ........................................................................................................................................ 72 5.1.5 RESULTS ................................................................................................................................................................ 73
5.2 STABILITY ...................................................................................................................................... 74 5.2.1 HULL SHAPING ...................................................................................................................................................... 74
6 CONCEPT DESIGN SELECTION ...................................................................................................... 77
6.1 CONCEPT SUMMARY .................................................................................................................... 77 6.1.1 COSTS PER CONTRACT .......................................................................................................................................... 77
6.2 SCENARIOS ................................................................................................................................... 79 6.2.1 VESSEL SPEED ....................................................................................................................................................... 79 6.2.2 BUILDING COSTS FLUCTUATIONS ......................................................................................................................... 82 6.2.3 FUEL COSTS FLUCTUATIONS ................................................................................................................................. 84
6.3 CONCLUSION CONCEPT DESIGN SELECTION ................................................................................ 86
CONCLUSIONS AND RECOMMENDATIONS ........................................................................................... 87
CONCLUSIONS........................................................................................................................................ 87 RECOMMENDATIONS ............................................................................................................................ 88
REFERENCES ......................................................................................................................................... 89
CONCEPT DESIGN OPTIMIZATION APPLIED ON A NEW SEMI-SUBMERSIBLE HEAVY TRANSPORT VESSEL IN THE S-CLASS MARKET
v|xii
MSc. THESIS |
LIST OF FIGURES
FIGURE 1-1: THE DOCKWISE SWIFT, TRANSPORTING FOUR STS CONTAINER CRANES .................................................. 1 FIGURE 1-2: ACTIVITY PLAN OF CONCEPT DESIGN ......................................................................................................... 5 FIGURE 2-1: COMPETITORS IN TYPE II (TOP) AND III (BOTTOM) SEMI-SUBMERSIBLE HLV (SOURCE: DOCKWISE) ...... 11 FIGURE 2-2: THE S-CLASS LOADED WITH A TLP-HULL ((TOP)), AND MODULES ON AN FSP ((BOTTOM)) ..................... 13 FIGURE 2-3: S-CLASS LOADED WITH CCR (TOP LEFT) LIFTBOAT (CENTRE) AND BARGES (TOP RIGHT) ........................ 13 FIGURE 2-4: BREAKDOWN BY MARKET AND VESSEL TYPE (SOURCE: DOCKWISE) ....................................................... 14 FIGURE 2-5: P&M MARKET ANALYSIS FOR FUTURE DEVELOPMENTS (SOURCE: DOCKWISE) ...................................... 19 FIGURE 2-6: JACK-UPS MARKET SIZE AND OUTLOOK (SOURCE: DOCKWISE) ............................................................... 20 FIGURE 2-7: TOPSIDES MARKET OUTLOOK (SOURCE: DOCKWISE) .............................................................................. 20 FIGURE 2-8: NUMBER OF JACK-UPS TRANSPORTED BETWEEN 1998 AND 2014, BY WEIGHT ..................................... 21 FIGURE 2-9: VCG OF JACK-UPS TRANSPORTED BETWEEN 1998 – 2014 SORTED BY WEIGHT ...................................... 22 FIGURE 2-10: VCG X WEIGHT OF JACK-UPS TRANSPORTED BETWEEN 1998 – 2014 SORTED BY WEIGHT ................... 22 FIGURE 2-11: DIMENSIONS OF JACK-UPS TRANSPORTED BETWEEN 1998 – 2014....................................................... 23 FIGURE 2-12: DIMENSIONS OF MODULES FOR KITIMAT PROJECT ............................................................................... 23 FIGURE 3-1: S-CLASS GENERAL ARRANGEMENT (SIDE VIEW, TOP VIEW AND CROSS SECTION) .................................. 30 FIGURE 4-1: BUSINESS HIGH LEVEL OBJECTIVE WHEN ADDING FUNCTIONALITY TO THE DESIGN .............................. 47 FIGURE 4-2: SCHEMATIC VIEW FIRST CONCEPT IDEA .................................................................................................. 48 FIGURE 4-3: VESSEL LAY-OUT: (A) CLOSED STERN (B) OPEN STERN FIXED CASING (C) OPEN STERN (D) OPEN STERN
OPEN BOW ........................................................................................................................................................ 49 FIGURE 4-4: TOP VIEW OF SUPERSTRUCTURE AND PROJECTION OF DECK AREA OF DOCKWISE VANGUARD ............ 51 FIGURE 4-5: TOP VIEW OF SUPERSTRUCTURE AND PROJECTION OF DECK AREA OF CONCEPT DESIGN ..................... 51 FIGURE 4-6: OPEN STERN AND OPEN BOW CONCEPT WITH S-CLASS DIMENSIONS .................................................... 51 FIGURE 4-7: TOP VIEW OF FLOATING CARGO POSSIBILITIES ON OPEN STERN AND BOW LAY-OUT ............................ 52 FIGURE 4-8: TOP VIEW CARGO POSSIBILITIES FOR NON-FLOATING CARGOES ON OPEN STERN AND BOW LAY-OUT 52 FIGURE 4-9: TOP VIEW FORESHIP FJELL ....................................................................................................................... 53 FIGURE 4-10: TOP VIEW FORESHIP FJELL DECK SPACE, BLACK MARLIN ACCOMMODATION SPACE............................ 54 FIGURE 4-11: VESSEL OPEN STERN LAY-OUT ................................................................................................................ 54 FIGURE 4-12: TOP VIEW CARGO POSSIBILITIES FLOATING CARGOES ON OPEN STERN LAY-OUT ................................ 55 FIGURE 4-13: TOP VIEW CARGO POSSIBILITIES FLOATING CARGOES ON OPEN STERN LAY-OUT ................................ 55 FIGURE 4-14: LINES PLAN HULL GREEN MARLIN .......................................................................................................... 56 FIGURE 4-15: GREEN MARLIN MIDSHIP SECTION (LEFT) REPRESENTED BY AN I-BEAM WITH DOUBLE FLANGE (RIGHT)
........................................................................................................................................................................... 58 FIGURE 4-16: OVERVIEW LENGTHS FOR INPUT OF FREEBOARD CALCULATION .......................................................... 59 FIGURE 4-17: EXAMPLE 2-STROKE ENGINE PARAMETERS ........................................................................................... 60 FIGURE 4-18: EXAMPLE 4-STROKE ENGINE VALUES ..................................................................................................... 60 FIGURE 4-19: SCHEMATIC VIEW OF POWER CONFIGURATION LEFT DIRECT DRIVE, RIGHT GEARED DIRECT DRIVE ... 61 FIGURE 4-20: EXAMPLE OF POWER CONFIGURATION BASE-CASE DESIGN.................................................................. 61 FIGURE 4-21: SCHEMATIC TOP VIEW OF RP CONFIGURATION OF POSSIBLE DIESEL ELECTRIC CONFIGURATION ....... 62 FIGURE 4-22: EXAMPLE OF DIESEL ELECTRIC POWER CONFIGURATION CONCEPT DESIGN ........................................ 63 FIGURE 4-23: SCHEMATIC VIEW FIRST CONCEPT IDEA ................................................................................................ 63 FIGURE 4-24: SCHEMATIC VIEW FINAL CONCEPT CASES.............................................................................................. 66 FIGURE 5-1: STABILITY DRAWING ................................................................................................................................ 70 FIGURE 5-2: WEIGHT DISTRIBUTION SIMPLIFICATION AND ASSUMPTION .................................................................. 71 FIGURE 5-3: GHS PROFILE VIEW OF CRITICAL SUBMERGING STAGE ............................................................................ 75 FIGURE 6-1: NASDAQ CRUDE OIL BRENT $ PER BARREL FROM AUGUST 2014 TO AUGUST 2015. .............................. 84
vi|xii
LIST OF TABLES
TABLE 1-1: CARGO DESCRIPTION ................................................................................................................................... 2 TABLE 1-2: HOLTROP & MENNEN APPLICABILITY .......................................................................................................... 3 TABLE 1-3: SUMMARY OF DIMENSIONAL AND VESSEL SPEED CONSTRAINTS ............................................................... 4 TABLE 2-1: CLASSES SUBDIVISION FOR HTVS BY DOCKWISE (SOURCE: DOCKWISE) ...................................................... 9 TABLE 2-2: FLEET PARTICULARS (SOURCE: DOCKWISE SUMMARY VESSEL INFO 6.0.0) ................................................. 9 TABLE 2-3: VESSEL PARTICULARS COMPETITOR VESSELS. (SOURCE: DOCKWISE COMPETITOR DATABASE) ............... 12 TABLE 2-4: CARGO DESCRIPTION ................................................................................................................................. 15 TABLE 2-5: THE NUMBER OF CONTRACTS OF MARKET SEGMENTS S-CLASS 2006 – 2013 ........................................... 15 TABLE 2-6: AVERAGE UTILIZATION OF MARKET SEGMENTS S-CLASS 2006 – 2013 ...................................................... 16 TABLE 2-7: AVERAGE NUMBER OF DAYS OF MARKET SEGMENTS S-CLASS 2006 – 2013 ............................................. 16 TABLE 2-8: THE MARKET SHARE OF S-CLASS CARGO TYPES IN ACTUAL VESSEL DAYS FROM 2006-2013. ................... 17 TABLE 2-9: NON DIMENSIONAL NCI DAY RATE FOR S-CLASS MARKETS 2008-2012 ..................................................... 18 TABLE 2-10: TOTAL PROFIT S-CLASS MARKETS FROM 2008-2012 ............................................................................... 18 TABLE 2-11: MARKET SHARE OF MARKET CATEGORY’S S-CLASS ................................................................................. 19 TABLE 2-12: TECHNICAL DRIVEN VESSEL REQUIREMENTS FOR E&R CARGO. (SOURCE: DOCKWISE) .......................... 25 TABLE 2-13: TECHNICAL DRIVEN VESSEL REQUIREMENTS FOR P&M CARGO. ............................................................. 26 TABLE 2-14: SUMMARY OF CARGO DRIVEN VESSEL REQUIREMENTS FOR ADDITIONAL HMT FUNCTIONALITY .......... 27 TABLE 3-1: VESSEL PARTICULARS SWAN (S-CLASS). SOURCE: DOCKWISE.................................................................... 29 TABLE 3-2: CALCULATED WEIGHT DISTRIBUTION OF S-CLASS ..................................................................................... 31 TABLE 3-3: TOTAL TANK FILLINGS ................................................................................................................................ 32 TABLE 3-4: GROSS CARRYING CAPACITY ...................................................................................................................... 32 TABLE 3-5: HOLTROP & MENNEN APPLICABILITY ........................................................................................................ 32 TABLE 3-6: S-CLASS MAXIMUM AVERAGE SERVICE SPEED DURING ............................................................................ 33 TABLE 3-7: S-CLASS AVERAGE MOBILIZATION SPEED .................................................................................................. 33 TABLE 3-8: FORM COEFFICIENTS OF S-CLASS VESSELS ................................................................................................. 34 TABLE 3-9: RESULTS RESISTANCE, RT, S-CLASS, SPEED RANGE 12.0 TO 16.0 KNOTS. .................................................. 35 TABLE 3-10: POWER CALCULATION OUTCOMES FOR TRANSIT AND BALLAST CONDITION ......................................... 37 TABLE 3-11: WORK BREAK DOWN OF BUILDING COST CALCULATION......................................................................... 37 TABLE 3-12: INPUT COST CALCULATION S-CLASS ......................................................................................................... 38 TABLE 3-13: BUILDING COSTS OF THE S-CLASS ............................................................................................................ 39 TABLE 3-14: STANDARD OPERATIONAL PROFILE DISTRIBUTION S-CLASS .................................................................... 40 TABLE 3-15: STANDARD OPERATION PROFILE DISTRIBUTION S-CLASS ........................................................................ 40 TABLE 3-16: DURATION OF AVERAGE CONTRACT ........................................................................................................ 41 TABLE 3-17: ENERGY LOAD DISTRIBUTION PER SUB STATUS OF S-CLASS .................................................................... 41 TABLE 3-18: TOTAL CALCULATED FUEL COSTS S-CLASS ............................................................................................... 42 TABLE 3-19: TOTAL CALCULATED RUNNING COSTS 1
ST YEAR S-CLASS ......................................................................... 42
TABLE 3-20: DOCKING YEARS AND ESCALATION RATES ............................................................................................... 43 TABLE 3-21: NET PRESENT VALUE EQUATIONS ............................................................................................................ 44 TABLE 3-22:CALCULATED REQUIRED FREIGHT RATE OF S-CLASS VESSELS. .................................................................. 45 TABLE 3-23: HOLTROP & MENNEN EXCEL SHEET CALCULATIONS VALIDATION ........................................................... 46 TABLE 4-1: CANAL LIMITATIONS FOR THE DESIGN OF DOCKWISE VESSELS ................................................................. 49 TABLE 4-2: CASING PARTICULARS OPEN STERN AND BOW LAY-OUT........................................................................... 51 TABLE 4-3: MAIN PARTICULARS FJELL .......................................................................................................................... 53 TABLE 4-4: BLACK MARLIN ACCOMMODATION SIZE ................................................................................................... 54 TABLE 4-5: CASING PARTICULARS OPEN STERN LAY-OUT ............................................................................................ 54 TABLE 4-6: POWER LAY-OUT PRICES (SOURCE: SALES WARTSILA) ............................................................................... 63 TABLE 4-7: INITIAL HULL DIMENSIONS ......................................................................................................................... 65 TABLE 4-8: CWP CALCULATION BASED ON GREEN MARLIN HULL ................................................................................. 65 TABLE 5-1: SUMMARY OF DIMENSIONAL AND VESSEL SPEED CONSTRAINTS ............................................................. 69 TABLE 5-2: WEIGHT COMPARISON AS INPUT FOR DWT CALCULATION ....................................................................... 69 TABLE 5-3: RESULTS OF OPTIMIZING TOOL .................................................................................................................. 73 TABLE 5-4: RESULTS OF OPTIMIZING TOOL FOR LOWER LIMIT BLOCK COEFFICIENT OF CONCEPT 2 .......................... 73 TABLE 5-5: RESULTS OF OPTIMIZING TOOL FOR LOWER LIMIT TRANSIT SPEED OF CONCEPT 1 .................................. 74 TABLE 5-6: INTACT STABILITY REGULATIONS ............................................................................................................... 75 TABLE 5-7: WEATHER STABILITY REGULATIONS ........................................................................................................... 75 TABLE 5-8: IMO A.749 CH 4.5.6 INTACT STABILITY ...................................................................................................... 76
CONCEPT DESIGN OPTIMIZATION APPLIED ON A NEW SEMI-SUBMERSIBLE HEAVY TRANSPORT VESSEL IN THE S-CLASS MARKET
vii|xii
MSc. THESIS |
TABLE 5-9: IMO A749 CH.3.2 WEATHER STABILITY ...................................................................................................... 76 TABLE 5-10: SUBMERGED STABILITY ............................................................................................................................ 76 TABLE 6-1: CONCEPT VESSEL PARTICULARS COMPARISON ......................................................................................... 77 TABLE 6-2: CONCEPT COSTS COMPARISON ................................................................................................................. 77 TABLE 6-3: INCREASE IN DECK LENGTH AND BARGES FOR CONCEPT 2 AND 4 ............................................................ 78 TABLE 6-4: COSTS PER CONTRACT FOR DECK LENGTH INCREASE OF CONCEPT 2 AND 4 ............................................. 78 TABLE 6-5: COSTS PER CONTRACT FOR CONVERSION SAVINGS OF CONCEPT 3 AND 4 ............................................... 78 TABLE 6-6: RELATIVE COST PER CONTRACT SAVINGS PER CONTRACT FOR EACH CONCEPT ....................................... 80 TABLE 6-7: RELATIVE FICTIVE COST PER CONTRACT SAVINGS FOR DECK LENGTH INCREASE ...................................... 81 TABLE 6-8: RELATIVE FICTIVE COST PER CONTRACT SAVINGS FOR BALLAST SPEED FLUCTUATIONS .......................... 82 TABLE 6-9: RELATIVE CONTRACT COST DIFFERENCE FOR CAPITAL COSTS ................................................................... 82 TABLE 6-10: RELATIVE CONTRACT COST DIFFERENCE FOR VOYAGE COSTS CORRECTED FOR DECK LENGTH .............. 83 TABLE 6-11: RELATIVE CONTRACT COST DIFFERENCE FOR VOYAGE COSTS CORRECTED INCLUDING CRANE
CONVERSION COSTS .......................................................................................................................................... 83 TABLE 6-12: RELATIVE CONTRACT COST DIFFERENCE FOR VOYAGE COSTS ................................................................. 84 TABLE 6-13: RELATIVE CONTRACT COST DIFFERENCE FOR VOYAGE COSTS CORRECTED FOR DECK LENGTH .............. 85 TABLE 6-14: RELATIVE CONTRACT COST DIFFERENCE FOR VOYAGE COSTS CORRECTED INCLUDING CRANE
CONVERSION COSTS .......................................................................................................................................... 85
viii|xii
LIST OF ABBREVIATIONS
Market related
E&R Energy and Resources
FSP Floating Super Pallet
HMT Heavy Marine Transport
HTV Heavy Transport Vessel
LM Logistical Management
LNG Liquefied Natural Gas
P&M Ports and Marine
STS Ship-to-Shore
T&I Transport and Installation
Operational related
CoG Centre of Gravity
CPP Controllable Pitch Propeller
DNV Det Norske Veritas
DWT Deadweight tonnage
Fo-Fo Float-on Float-off
HFO Heavy Fuel Oil
GHS General Hydro Statics
GM Meta centric Height
IMO International Maritime Organization
LCB Longitudinal Centre of Buoyancy
LCG Longitudinal Centre of Gravity
Lo-Lo Lift-on Lift-off
LSA Life Saving Appliances
LSW Light Ship Weight
MDO Marine Diesel Oil
MCR Maximum Continuoous Rating
PS Portside
Ro-Ro Roll-on Roll-off
RP Redundant Propulsion
SB Starboard side
SM Sea Margin
So-So Skid-on Skid-off
TCG Transverse Centre of gravity
UCC Under Cargo Clearance
UKC Under Keel Clearance
VCG Vertical Centre of Gravity
Economic related
CAPEX Capital Expenditures
DF Discount Factor
NOPAT Net Operating Profit After Taxes
NPV Net Present Value
NCI Net Charter Income
OPEX Operational Expenditures
VOPEX Vessel Operating Expenditures
WACC Weighted Average Cost Of Capital
CONCEPT DESIGN OPTIMIZATION APPLIED ON A NEW SEMI-SUBMERSIBLE HEAVY TRANSPORT VESSEL IN THE S-CLASS MARKET
ix|xii
MSc. THESIS |
LIST OF NOMENCLATURE
Roman
B Width 𝑚 𝐶b Block coefficient − 𝐶𝑝 Prismatic coefficient −
𝐶𝑚 Midship coefficient − 𝐶wp Water plane area coefficient −
D Depth 𝑚 Fd Wind resistance kN g Gravitational constant 𝑚 /s
2
It Second moment of area of the water plane 𝑚4 Iyy Longitudinal sectional moment of inertia 𝑚4
Lbp Length between perpendiculars 𝑚
L𝑑𝑒𝑐𝑘 Length of main deck 𝑚 Loa Length overall 𝑚 L𝑤𝑙 Length of the waterline 𝑚 N Optimum propeller speed s
-1
P𝐵 Brake power 𝑘𝑊 P𝐷 Delivered power (all propellers) 𝑘𝑊 P𝐸 Effective power 𝑘𝑊 R Ship resistance kN t Thrust deduction factor − T Thrust kN T Draught 𝑚 va Advanced velocity 𝑚 /s vs Ship velocity 𝑚 /s vtransit Transit speed 𝑚 /s vballast Ballast speed 𝑚 /s w Wake factor − ws Steel weight t wo Outfitting weight t wd Weight of the machinery t wr Weight of the remainder t Greek ∇ Displaced volume 𝑚3 ∇𝑠𝑢𝑚𝑚𝑒𝑟𝑑𝑟𝑎𝑓𝑡 Displaced volume for summer draught 𝑚3
∆ Displacement 𝑡 𝜌 Density 𝑘𝑔 𝑚3⁄ 𝜑 Heel angle ° 𝜑𝑚𝑎𝑥 Maximum heel angle to freeboard ° η𝐺𝐵 Gear box efficiency − η𝐻 Hull efficiency − η𝐷 Propulsive efficiency − η𝑆 Shaft efficiency − η𝑂 Open water propeller efficiency − η𝑒𝑙 Diesel electric efficiency −
x|xii
LIST OF DEFINITIONS
Floating cargo Cargo that includes a buoyant hull with tanks e.g. jack-ups, barges, semi-
subs, spars and liftboats. This buoyant hull adds buoyancy to the vessel.
Non floating cargo Cargo that adds no buoyancy to the vessel (e.g. modules, topsides and
cranes).
Heavy transport vessel This is a vessel that is dedicated for the transport of very heavy cargoes on
deck.
Semi-submersible vessel A vessel that can submerge the deck under the waterline considering
regulations for reserve buoyancy.
Closed stern vessel A vessel of which the stern consists of a superstructure which decreases
operability for loading cargo over the stern.
Open stern vessel A vessel of which the deck is starting at the stern of the vessel and where
the stern is accessible for cargo during loading operation. An open stern
vessel can consist fixed casing(s) that decrease loading functionality over the
stern.
Deadweight The deadweight is the total carrying capacity in tonnes including tank fillings.
Lightship The lightship is the total weight of the vessel.
Discharge operation During this operation the cargo is loaded from the deck in to the water when
floating or on the quay side.
Loading operation During this operation the cargo is loaded from the water onto the deck
when floating cargo is considered or on the quay side for non-floating
cargoes.
Summer draught This is the draught defined as the worst-case loaded draught a ship can
have. This draught is corrected for the worst-case seasonal conditions.
Casings The open stern vessels have casings which are in fact ballast tanks that add
buoyancy during submerging. The casings are required to provide sufficient
buoyancy, stability and waterline surface once the vessel is submerged.
Ballasting The process by which sea water is taken in the vessel to increase the draught
or submerged draught.
De-ballasting The process by which sea water is taken out the vessel to decrease the
draught or submerged draught.
Capital costs Consists of building costs which are estimated based on weight estimations
for steel, outfitting, machinery and residue.
Voyage costs Consists of fuel costs which is based on an operational profile and fuel
consumption for each operation. Fuel consumption during sailing is
determined based on hull resistance calculation for a certain vessel speed
and sailing condition. The influence of ballast condition and transit condition
is taken into account.
Running costs Consist of all crew (including stores), maintenance, insurance and overhead
costs. Maintenance, insurance and overhead is roughly estimated based on
the building costs. Crew depends on wages and crew number. Lubricating
Oil, LO, consumption is related to the operational profile and specific
consumption for each operation.
Running days The number of annual days that the vessel is available for projects.
Required freight rate Day rate including voyage, running and capital costs.
CONCEPT DESIGN OPTIMIZATION APPLIED ON A NEW SEMI-SUBMERSIBLE HEAVY TRANSPORT VESSEL IN THE S-CLASS MARKET
xi|xii
MSc. THESIS |
ABSTRACT
This thesis includes a concept design optimization which is applied on a new semi-submersible heavy
transport vessel for Boskalis subsidiary Dockwise. Dockwise considers replacing four S-class semi-
submersible heavy transport vessels which are nearing their end of lifetime. These relatively small size and
low-end of the fleet vessels, transports a versatile and attractive market. The main objective of this thesis
is to advice Dockwise on a new heavy transport vessel to replace the S-class vessels. The introduction of
additional vessel functionality to increase market potential for heavy marine transport, logistical
management and transport & installation services in relation to the current markets served by the S-class
results in an initial concept that remains operational in the low-end of the market.
Within this thesis, an investigation is done to economically analyse effective design add-ons of the initial
concept to increase market potential. The current S-class is not capable of transporting four typical fully
extended container cranes with a weight of 1300 tons each. Two container cranes are reconstructed at the
fabrication yard to lower the overall Vertical Centre of Gravity, VCG, to reduce the possibility of capsizing.
Optimized stability could increase crane transportations which is currently 13% of the S-class market.
Secondly, the deck space can be optimized to increase market potential for deck space required cargoes.
Deck space required cargoes like dredging equipment, riverbarges, modules and workbarges currently
cover 40% of the S-class market.
These design add-ons results in four concept ideas, based on the initial concept design. These concepts
are optimized, in such a way that within the design requirements, the length, width, depth, block coefficient,
transit speed and ballast speed will result in minimum costs per average fictive contract in relation to the
contract duration. The design requirements are based on the markets that are served by the S-class
vessels and opportunities in those markets. The performance of the economically optimized concepts is
analysed by introducing stability requirements for intact and weather stability including container cranes on
deck and on submerged stability during ballasting operation.
A sensitivity analysis has been conducted, in which the following parameters were analysed:
Vessel speed in both ballast and transit condition;
Building cost fluctuations due to changes in the world economy or strategic choices of shipyard
for construction;
Fuel cost fluctuations due to unstable changes in the world oil price.
The results of the sensitivity analysis show that a 10 meter deck space increase results in the lowest
relative average costs per contract based on the cost per unit deck length. A combination of additional
stability and additional deck length also results in a beneficial relative average costs per contract based on
the cost per unit deck length. Unfortunately, the reconstruction costs for the container cranes is in relation
to the total costs per contract relatively low. This price difference between a concept that is capable of
transporting four fully extended container cranes or the conventional situation of two fully extended and
two semi extended cranes, results in higher costs per contract for the client compared to the current S-
class. Based on this result, the advice of this thesis is to optimize the concept for a deck length increase
that satisfies the potential cargo types on the market.
xii|xii
- This page intentionally left blank -
CONCEPT DESIGN OPTIMIZATION APPLIED ON A NEW SEMI-SUBMERSIBLE HEAVY TRANSPORT VESSEL IN THE S-CLASS MARKET
P A G E | 1 of 90
MSc. THESIS |
1 INTRODUCTION
This chapter introduces the background information about the thesis subject and formulates the main
research question, scope and activity plan.
1.1 BACKGROUND
Boskalis subsidiary Dockwise owns a versatile fleet of heavy transport vessels, operating anywhere
around the world. Dockwise holds an excellent position in the heavy marine transport industry as most
dominant operator (Latarche 2015). To maintain or enhance this position, Dockwise has to invest in smart,
innovative and competitive vessels. At the moment Dockwise is considering to replace four S-class semi-
submersible heavy transport vessels which are nearing their end of lifetime. These relatively small size,
low-end of the fleet, vessels are multi-purpose build, both heavy transport and product tanker vessels and
nowadays only operational as Heavy Transport Vessel, HTV. The S-class vessels have served the clients
since 1982 Swan (original name Dyvi Swan, renamed to Sea Swan and finally Swan), 1982 Tern, 1983
Swift and 1984 Teal (van Hoorn 2008).
A study towards the replacement of these S-class type of vessels is ongoing. Dockwise started a concept
design study for a new vessel. Although, the current S-class reaches the end of lifetime, these vessels can
still compete on relatively low costs. The replacement is planned based on the demand of the market, the
drive of serving the clients and maintaining a good position as Heavy Marine Transport, HMT, operator.
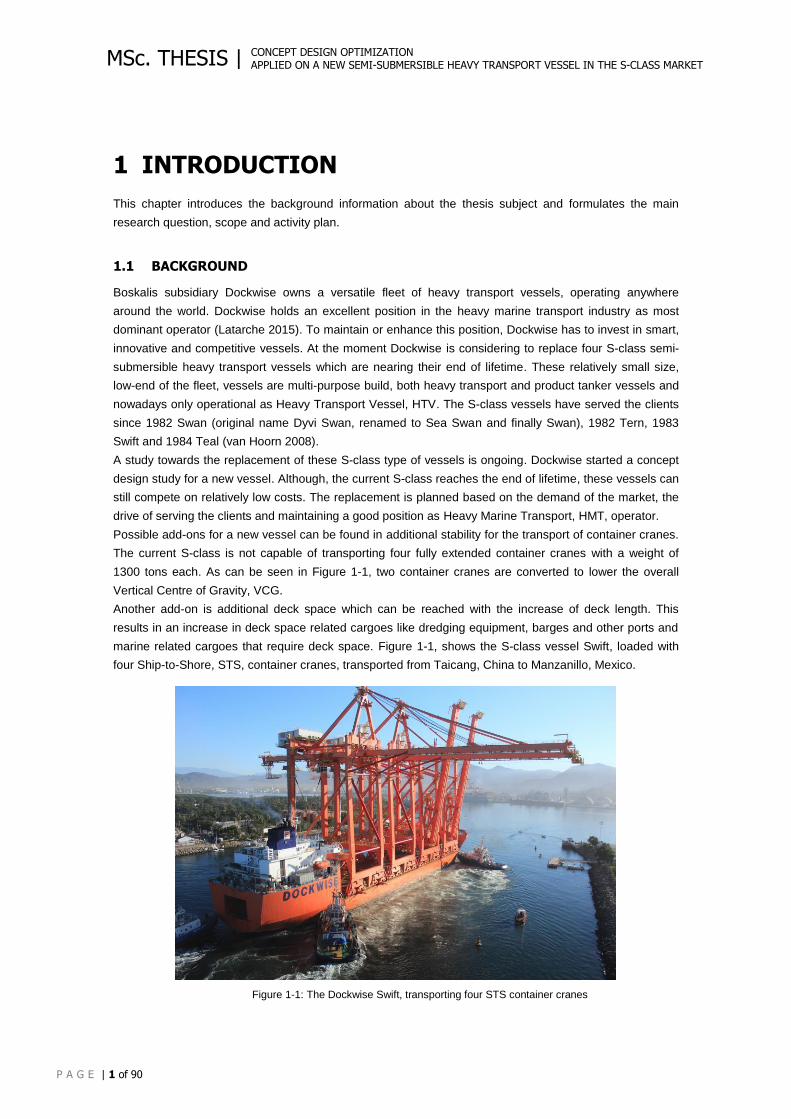
Possible add-ons for a new vessel can be found in additional stability for the transport of container cranes.
The current S-class is not capable of transporting four fully extended container cranes with a weight of
1300 tons each. As can be seen in Figure 1-1, two container cranes are converted to lower the overall
Vertical Centre of Gravity, VCG.
Another add-on is additional deck space which can be reached with the increase of deck length. This
results in an increase in deck space related cargoes like dredging equipment, barges and other ports and
marine related cargoes that require deck space. Figure 1-1, shows the S-class vessel Swift, loaded with
four Ship-to-Shore, STS, container cranes, transported from Taicang, China to Manzanillo, Mexico.
Figure 1-1: The Dockwise Swift, transporting four STS container cranes
CHAPTER 1 | INTRODUCTION
P A G E | 2 of 90
1.2 OBJECTIVES
The main objective of this thesis is to advice Dockwise on a new heavy transport vessel to replace the S-
class vessels. The introduction of additional vessel functionality to increase market potential for heavy
marine transport, logistical management and transport & installation services in relation to the current
markets served by the S-class results in concept alternatives. These concepts are optimized, in such a
way, that the length, width, depth, block coefficient, transit speed and ballast speed will result in a
minimum freight rate in relation to the contract duration and will satisfy the design requirements. These
design requirements are based on the markets that are served by the S-class vessels and opportunities in
those markets. Market changes like changing oil prices or building costs and different business objectives
like required sailing speed, will influence the total costs per contract. This influence is studied in a
sensitivity analysis for different fuel costs, building costs and transit speed and ballast speed.
1.3 SCOPE
This scope describes the limitations and delimitations of the concept design study. Starting with a market
analysis to find the main design requirements. Followed by the evaluation of the S-class to introduce the
used methods to determine the costs and corresponding data of this S-class. This can be compared with
the concepts based on the concept design evaluation. The concepts are economically optimized to ensure
the best hull shape and vessel speed based on the requirements for each concepts. These results are
evaluated in a sensitive analysis from which the best concept is selected.
1.3.1 MARKET ANALYSIS
The Dockwise market is investigated to find market potential based on vessels of competitors. This
investigation is done for vessels with corresponding DWT and deck space. The size of the new fleet and
fleet composition is based on the current S-class fleet. From there the market served by the S-class is
investigated. This is done for a period from 2007 to 2013. The market, served by the S-class is shown in
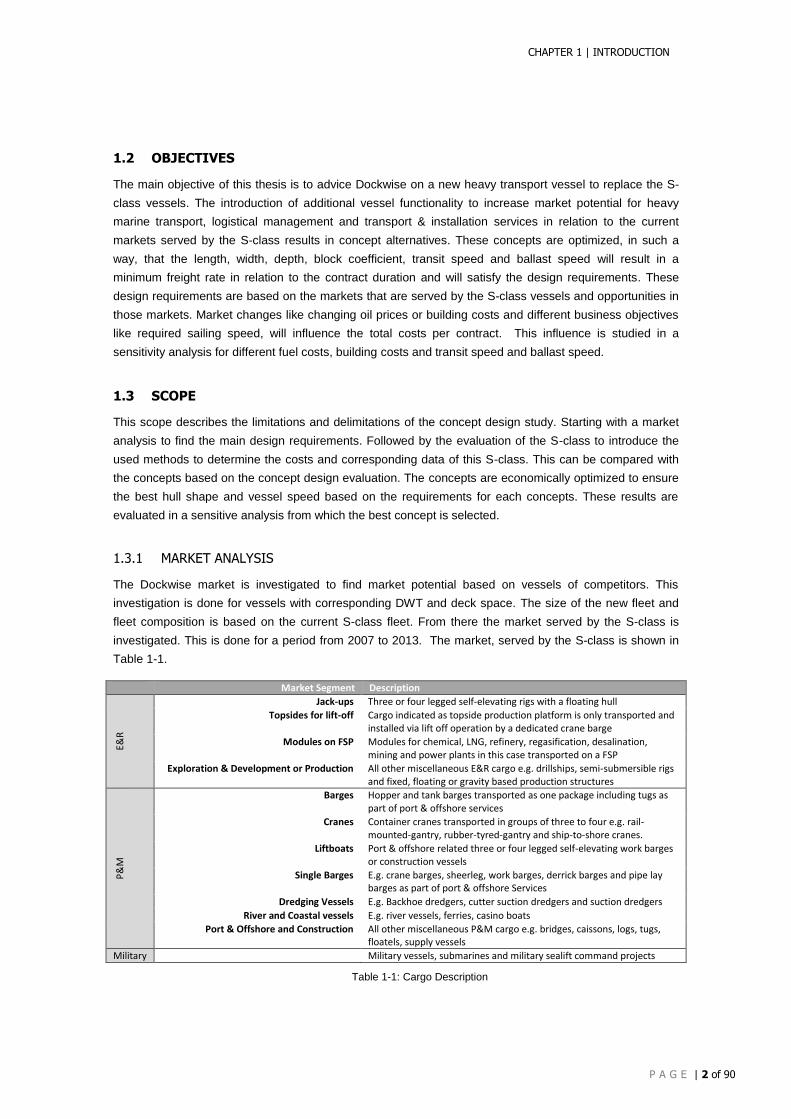
Table 1-1.
Market Segment Description
E&R
Jack-ups Three or four legged self-elevating rigs with a floating hull
Topsides for lift-off Cargo indicated as topside production platform is only transported and installed via lift off operation by a dedicated crane barge
Modules on FSP Modules for chemical, LNG, refinery, regasification, desalination, mining and power plants in this case transported on a FSP
Exploration & Development or Production All other miscellaneous E&R cargo e.g. drillships, semi-submersible rigs and fixed, floating or gravity based production structures
P&
M
Barges
Hopper and tank barges transported as one package including tugs as part of port & offshore services
Cranes Container cranes transported in groups of three to four e.g. rail-mounted-gantry, rubber-tyred-gantry and ship-to-shore cranes.
Liftboats Port & offshore related three or four legged self-elevating work barges or construction vessels
Single Barges E.g. crane barges, sheerleg, work barges, derrick barges and pipe lay barges as part of port & offshore Services
Dredging Vessels E.g. Backhoe dredgers, cutter suction dredgers and suction dredgers
River and Coastal vessels E.g. river vessels, ferries, casino boats
Port & Offshore and Construction All other miscellaneous P&M cargo e.g. bridges, caissons, logs, tugs, floatels, supply vessels
Military Military vessels, submarines and military sealift command projects
Table 1-1: Cargo Description
CONCEPT DESIGN OPTIMIZATION APPLIED ON A NEW SEMI-SUBMERSIBLE HEAVY TRANSPORT VESSEL IN THE S-CLASS MARKET
P A G E | 3 of 90
MSc. THESIS |
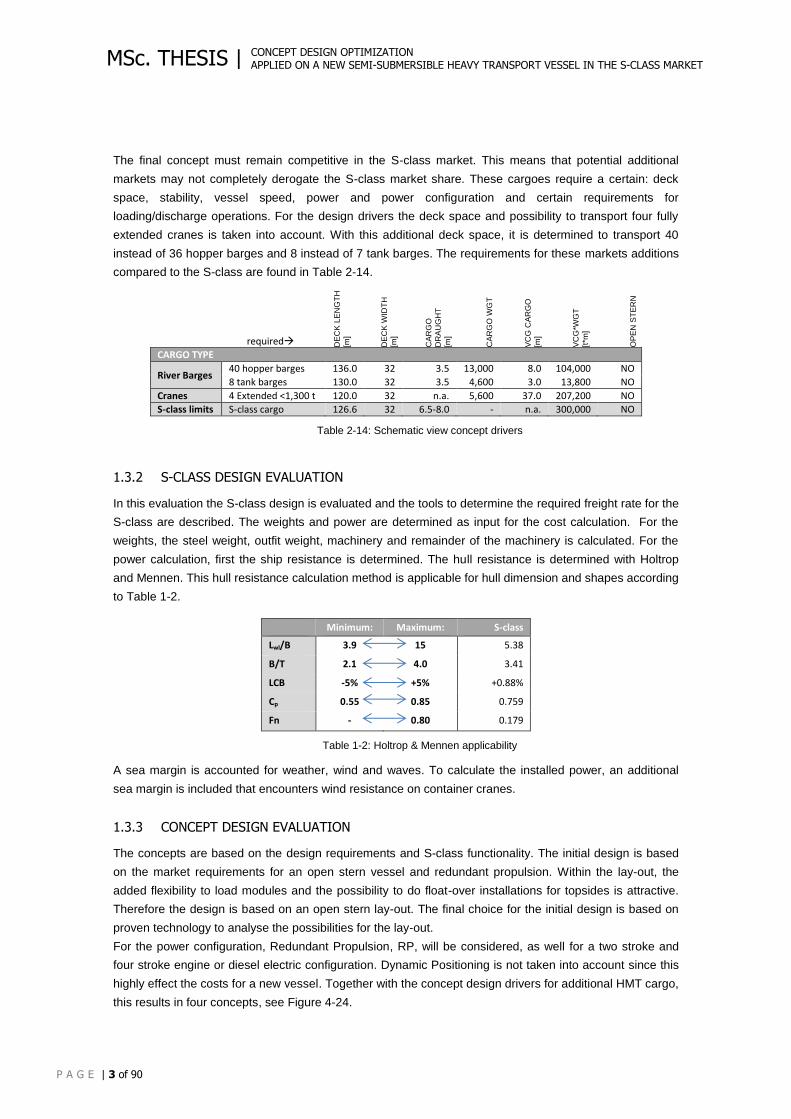
The final concept must remain competitive in the S-class market. This means that potential additional
markets may not completely derogate the S-class market share. These cargoes require a certain: deck
space, stability, vessel speed, power and power configuration and certain requirements for
loading/discharge operations. For the design drivers the deck space and possibility to transport four fully
extended cranes is taken into account. With this additional deck space, it is determined to transport 40
instead of 36 hopper barges and 8 instead of 7 tank barges. The requirements for these markets additions
compared to the S-class are found in Table 2-14.
required DE
CK
LE
NG
TH
[m]
DE
CK
WID
TH
[m]
CA
RG
O
DR
AU
GH
T
[m]
CA
RG
O W
GT
VC
G C
AR
GO
[m]
VC
G*W
GT
[t*m
]
OP
EN
ST
ER
N
CARGO TYPE
River Barges 40 hopper barges 136.0 32 3.5 13,000 8.0 104,000 NO
8 tank barges 130.0 32 3.5 4,600 3.0 13,800 NO
Cranes 4 Extended <1,300 t 120.0 32 n.a. 5,600 37.0 207,200 NO
S-class limits S-class cargo 126.6 32 6.5-8.0 - n.a. 300,000 NO
Table 2-14: Schematic view concept drivers
1.3.2 S-CLASS DESIGN EVALUATION
In this evaluation the S-class design is evaluated and the tools to determine the required freight rate for the
S-class are described. The weights and power are determined as input for the cost calculation. For the
weights, the steel weight, outfit weight, machinery and remainder of the machinery is calculated. For the
power calculation, first the ship resistance is determined. The hull resistance is determined with Holtrop
and Mennen. This hull resistance calculation method is applicable for hull dimension and shapes according
to Table 1-2.
Minimum: Maximum: S-class
Lwl/B 3.9 15 5.38
B/T 2.1 4.0 3.41
LCB -5% +5% +0.88%
Cp 0.55 0.85 0.759
Fn - 0.80 0.179
Table 1-2: Holtrop & Mennen applicability
A sea margin is accounted for weather, wind and waves. To calculate the installed power, an additional
sea margin is included that encounters wind resistance on container cranes.
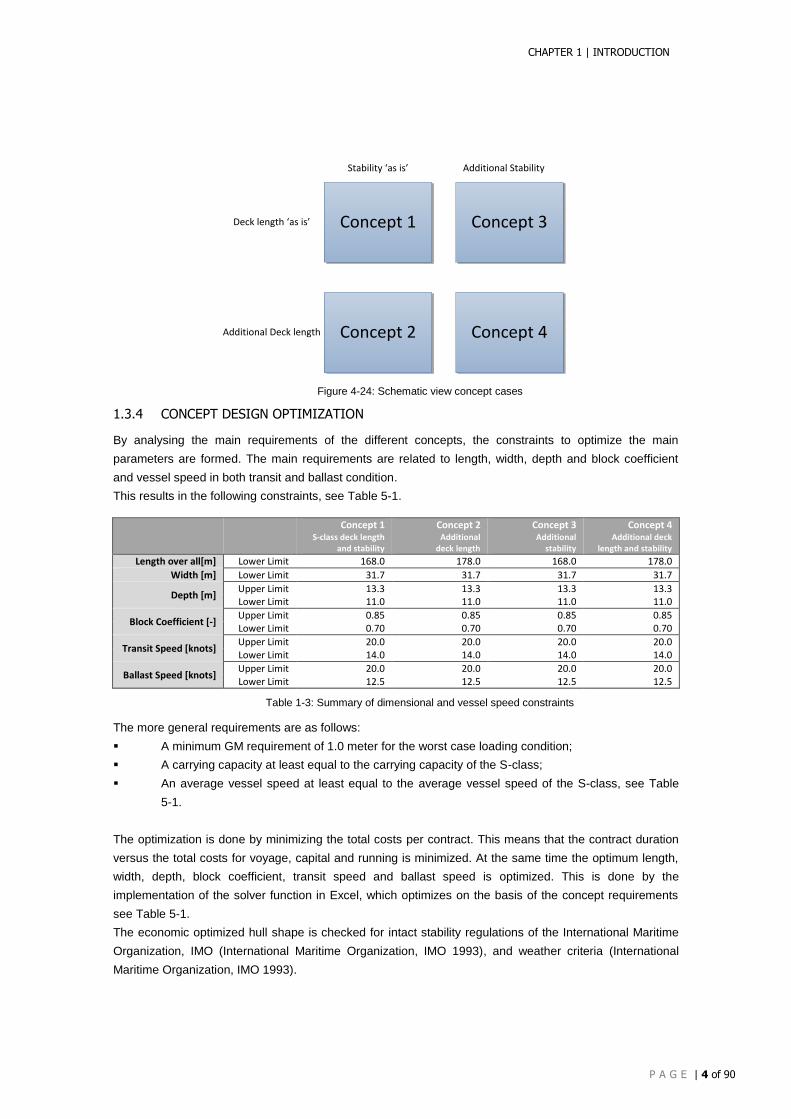
1.3.3 CONCEPT DESIGN EVALUATION
The concepts are based on the design requirements and S-class functionality. The initial design is based
on the market requirements for an open stern vessel and redundant propulsion. Within the lay-out, the
added flexibility to load modules and the possibility to do float-over installations for topsides is attractive.
Therefore the design is based on an open stern lay-out. The final choice for the initial design is based on
proven technology to analyse the possibilities for the lay-out.
For the power configuration, Redundant Propulsion, RP, will be considered, as well for a two stroke and
four stroke engine or diesel electric configuration. Dynamic Positioning is not taken into account since this
highly effect the costs for a new vessel. Together with the concept design drivers for additional HMT cargo,
this results in four concepts, see Figure 4-24.
CHAPTER 1 | INTRODUCTION
P A G E | 4 of 90
Concept 1 Concept 3
Concept 2 Concept 4
Deck length ‘as is’
Additional Deck length
Additional StabilityStability ‘as is’
Figure 4-24: Schematic view concept cases
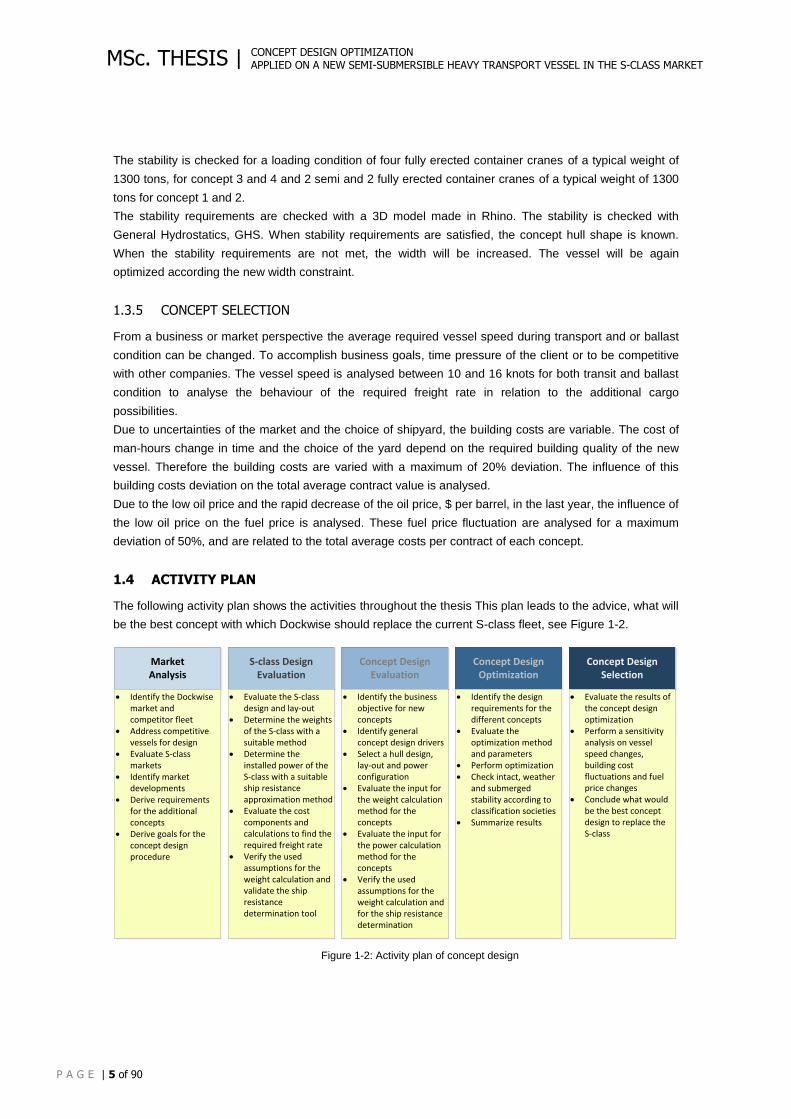
1.3.4 CONCEPT DESIGN OPTIMIZATION
By analysing the main requirements of the different concepts, the constraints to optimize the main
parameters are formed. The main requirements are related to length, width, depth and block coefficient
and vessel speed in both transit and ballast condition.
This results in the following constraints, see Table 5-1.
Concept 1 S-class deck length
and stability
Concept 2 Additional
deck length
Concept 3 Additional
stability
Concept 4 Additional deck
length and stability Length over all[m] Lower Limit 168.0 178.0 168.0 178.0
Width [m] Lower Limit 31.7 31.7 31.7 31.7
Depth [m] Upper Limit 13.3 13.3 13.3 13.3 Lower Limit 11.0 11.0 11.0 11.0
Block Coefficient [-] Upper Limit 0.85 0.85 0.85 0.85 Lower Limit 0.70 0.70 0.70 0.70
Transit Speed [knots] Upper Limit 20.0 20.0 20.0 20.0 Lower Limit 14.0 14.0 14.0 14.0
Ballast Speed [knots] Upper Limit 20.0 20.0 20.0 20.0 Lower Limit 12.5 12.5 12.5 12.5
Table 1-3: Summary of dimensional and vessel speed constraints
The more general requirements are as follows:
A minimum GM requirement of 1.0 meter for the worst case loading condition;
A carrying capacity at least equal to the carrying capacity of the S-class;
An average vessel speed at least equal to the average vessel speed of the S-class, see Table
5-1.
The optimization is done by minimizing the total costs per contract. This means that the contract duration
versus the total costs for voyage, capital and running is minimized. At the same time the optimum length,
width, depth, block coefficient, transit speed and ballast speed is optimized. This is done by the
implementation of the solver function in Excel, which optimizes on the basis of the concept requirements
see Table 5-1.
The economic optimized hull shape is checked for intact stability regulations of the International Maritime
Organization, IMO (International Maritime Organization, IMO 1993), and weather criteria (International
Maritime Organization, IMO 1993).
CONCEPT DESIGN OPTIMIZATION APPLIED ON A NEW SEMI-SUBMERSIBLE HEAVY TRANSPORT VESSEL IN THE S-CLASS MARKET
P A G E | 5 of 90
MSc. THESIS |
The stability is checked for a loading condition of four fully erected container cranes of a typical weight of
1300 tons, for concept 3 and 4 and 2 semi and 2 fully erected container cranes of a typical weight of 1300
tons for concept 1 and 2.
The stability requirements are checked with a 3D model made in Rhino. The stability is checked with
General Hydrostatics, GHS. When stability requirements are satisfied, the concept hull shape is known.
When the stability requirements are not met, the width will be increased. The vessel will be again
optimized according the new width constraint.
1.3.5 CONCEPT SELECTION
From a business or market perspective the average required vessel speed during transport and or ballast
condition can be changed. To accomplish business goals, time pressure of the client or to be competitive
with other companies. The vessel speed is analysed between 10 and 16 knots for both transit and ballast
condition to analyse the behaviour of the required freight rate in relation to the additional cargo
possibilities.
Due to uncertainties of the market and the choice of shipyard, the building costs are variable. The cost of
man-hours change in time and the choice of the yard depend on the required building quality of the new
vessel. Therefore the building costs are varied with a maximum of 20% deviation. The influence of this
building costs deviation on the total average contract value is analysed.
Due to the low oil price and the rapid decrease of the oil price, $ per barrel, in the last year, the influence of
the low oil price on the fuel price is analysed. These fuel price fluctuation are analysed for a maximum
deviation of 50%, and are related to the total average costs per contract of each concept.
1.4 ACTIVITY PLAN
The following activity plan shows the activities throughout the thesis This plan leads to the advice, what will
be the best concept with which Dockwise should replace the current S-class fleet, see Figure 1-2.
Market Analysis
S-class Design Evaluation
Concept Design Evaluation
Concept Design Optimization
Concept Design Selection
· Identify the Dockwise market and competitor fleet
· Address competitive vessels for design
· Evaluate S-class markets
· Identify market developments
· Derive requirements for the additional concepts
· Derive goals for the concept design procedure
· Evaluate the results of the concept design optimization
· Perform a sensitivity analysis on vessel speed changes, building cost fluctuations and fuel price changes
· Conclude what would be the best concept design to replace the S-class
· Identify the design requirements for the different concepts
· Evaluate the optimization method and parameters
· Perform optimization· Check intact, weather
and submerged stability according to classification societies
· Summarize results
· Evaluate the S-class design and lay-out
· Determine the weights of the S-class with a suitable method
· Determine the installed power of the S-class with a suitable ship resistance approximation method
· Evaluate the cost components and calculations to find the required freight rate
· Verify the used assumptions for the weight calculation and validate the ship resistance determination tool
· Identify the business objective for new concepts
· Identify general concept design drivers
· Select a hull design, lay-out and power configuration
· Evaluate the input for the weight calculation method for the concepts
· Evaluate the input for the power calculation method for the concepts
· Verify the used assumptions for the weight calculation and for the ship resistance determination
Figure 1-2: Activity plan of concept design

CHAPTER 1 | INTRODUCTION
P A G E | 6 of 90
- This page intentionally left blank -
CONCEPT DESIGN OPTIMIZATION APPLIED ON A NEW SEMI-SUBMERSIBLE HEAVY TRANSPORT VESSEL IN THE S-CLASS MARKET
P A G E | 7 of 90
MSc. THESIS |
2 MARKET ANALYSIS
This chapter starts with a brief summary of the Dockwise markets and fleet, followed by an analysis of the
competitors and an investigation of the specific markets served by the S-class vessels. This is followed by
the main design drivers related to the S-class vessels and cargoes transported by the S-class. From here,
the additional cargo and the corresponding concept requirements are introduced. With this market analysis
the question: ‘Is it advisable to replace the S-class and which cargoes are drivers for the design?’ will be
answered.
2.1 DOCKWISE MARKET PROFILE
In this section the Dockwise main services are introduced. These are served by the Dockwise fleet and the
fleet of the competitors. The competitor fleet is investigated to find out if the addition of new S-class type
vessels is attractive.
2.1.1 SERVICES
In the year of 1993, Wijsmuller Transport and Dock Express Shipping joined their forces to be one of the
world’s largest Heavy Marine Transport company named Dockwise. In 2013, all shares of Dockwise were
acquired by Royal Boskalis Westminster. Dockwise has a workforce of more than 1,400 people both
offshore and onshore worldwide with the headquarter in Papendrecht, The Netherlands.
Dockwise is active in the ocean transportation of extremely large and heavy structures, named Heavy
Marine Transport, HMT. Dockwise offers a total marine scope for offshore platform installations supported
by its in-house engineering, procurement and dedicated project management capabilities, named
Transport % Installation, T&I. Dockwise offers logistical management, LM, solutions to the onshore
industry, by managing multiple heavy transports in a single contract. Together with the versatile Dockwise
fleet, Dockwise strives to serve its clients in all different disciplines.
2.1.1.1 HEAVY MARINE TRANSPORT
Within heavy marine transport, cargo is loaded onto a vessel, transported overseas and discharged from
the vessel. The HMT business serves markets that can be divided into two different industries; The first
industry is driven by the energy consumption. Dockwise serves the oil, gas and other energy and
resources markets, from here named Energy and Resources, E&R, industry. The other industry is the
Ports and Marine, P&M, that is driven by the world trade. Besides these two main industries, also the
military clients are being served, but this is a small and exceptional industry.
The HMT business unit includes all different loading and discharge operations for single transportation of
all different types of cargo. Flexibility is an important key focus of the vessels that operate in this business
unit. These versatile HMT operations strongly differ for floating and non-floating cargoes. The key design
requirement is sufficient and efficient longitudinal deck space and sufficient stability for relatively heavy
cargoes with a high VCG.
CHAPTER 2 | MARKET ANALYSIS
P A G E | 8 of 90
2.1.1.2 TRANSPORT & INSTALLATION
Transport and Installation, T&I, covers the complete scope of the transport of topsides to the location
where the topside is installed by means of floatover. Besides the T&I of topsides, this service also includes
jacket launches, deck mating and for example the installation of a topside on a semi-submersible hull like
the Vyborg project1, or on a Tension Leg Platform, TLP, Spar or Gravity Based Structure, GBS.
With this service, Dockwise introduces a bigger scope of work and offers efficiency for the client by doing
multiple operations with one vessel. An offshore oil platform consists of a jacket structure with on top an
installed topside that in most cases includes the production plant, the accommodation block and the drilling
rig. Topsides as part of the Energy and Resources, E&R, market segment, are transported from the
construction yard to the operating location. On the offshore site, a pre-installed jacket structure is prepared
to welcome the topside and to start with the production of oil and gas.
A huge selling point of Dockwise for all the Dockwise clients is the ability to combine the transport and the
installation operation by means of the floatover operation. This ensures cost and time savings for the
clients. Topsides above 10,000t are nowadays not yet suitable for single lift operations.
The capability of doing floatover operations, demand some key design requirements like:
Removable casings, which are tank compartments located on deck to create sufficient buoyancy
while submerged. These casings can be removed to satisfy the required air draught between
vessel and topside, so the vessel can easily leave the jacket slot when installation is finished;
Width requirements because of the maximum jacket slot width and the minimum width of the
support frame;
Stability requirements in order to create the ability of carrying heavy cargoes with high VCG’s.
2.1.1.3 LOGISTICAL MANAGEMENT
The complete planning, management and execution of the logistical train for the transport of modules is
included in the logistical management services. These ‘Lump Sum’ agreements result in big projects with a
long term contract. These modules are dedicated prefabricated building blocks intended to be assembled
and installed at an onshore facility. Vessel functionality and operational flexibility is needed for the
transport of modules from yard to the sometimes remote Module Offloading Facility, MOF, at the
construction area. Dockwise owns dedicated project vessels that serve the Logistical Management
projects. There are five major onshore facility types that could require module transportation. This
includes:
Liquefied Natural Gas, LNG, liquefaction plants;
LNG regasification plants;
Refineries / Gas to Liquids, GTL, plants;
Chemical plants;
Mining plants.
The LM business unit may influence a design when accessibility of these remote areas plays a significant
role. The main design aspects to be competitive in this market are:
Preferred open stern to increase load-out flexibility, since the load-out is done via So or Ro;
Depth limitations; sufficient depth to be maintain flexible for different quay heights and tidal
differences during the load-out.
1 http://www.dockwise.com/page/projects/vyborg.html
CONCEPT DESIGN OPTIMIZATION APPLIED ON A NEW SEMI-SUBMERSIBLE HEAVY TRANSPORT VESSEL IN THE S-CLASS MARKET
P A G E | 9 of 90
MSc. THESIS |
2.1.2 HEAVY TRANSPORT VESSELS
The Dockwise fleet and the fleet of the competitors serve the markets as described in 2.1.1. The worldwide
fleet of heavy transport vessels consists of 72 vessels of which 16 are being build or converted and 56
operational (Latarche 2015). In this section the Dockwise fleet is introduced as well as the competitor fleet.
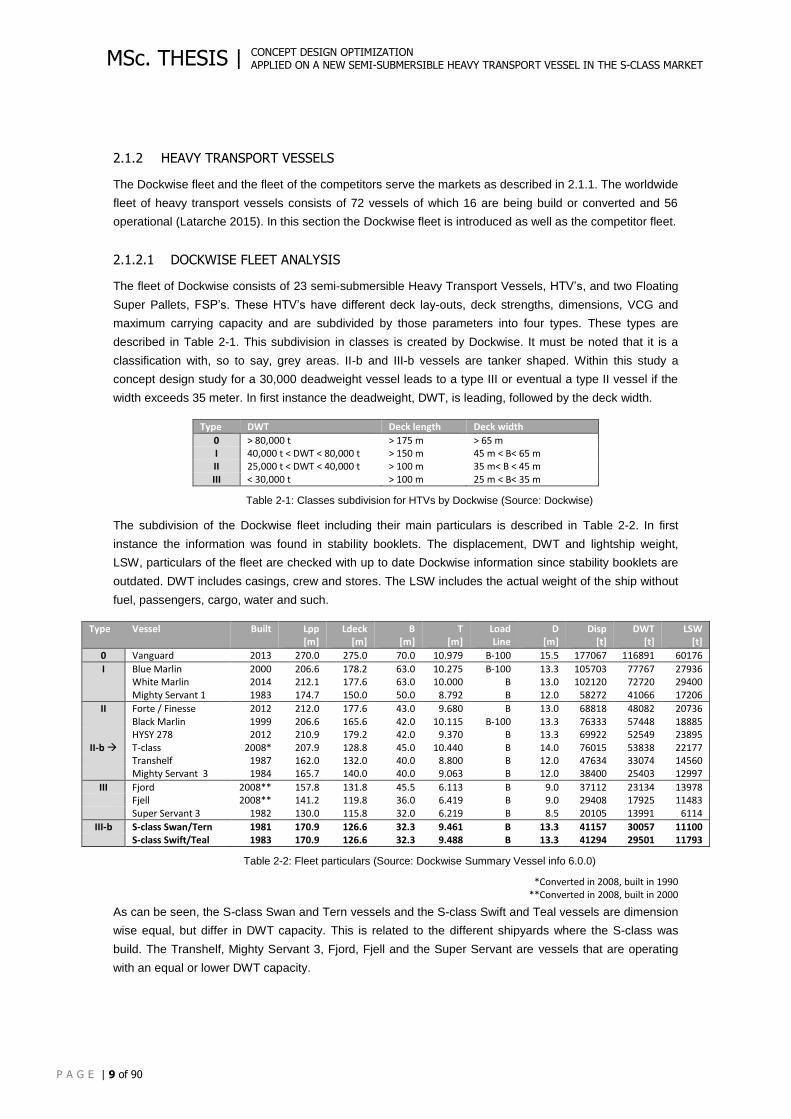
2.1.2.1 DOCKWISE FLEET ANALYSIS
The fleet of Dockwise consists of 23 semi-submersible Heavy Transport Vessels, HTV’s, and two Floating
Super Pallets, FSP’s. These HTV’s have different deck lay-outs, deck strengths, dimensions, VCG and
maximum carrying capacity and are subdivided by those parameters into four types. These types are
described in Table 2-1. This subdivision in classes is created by Dockwise. It must be noted that it is a
classification with, so to say, grey areas. II-b and III-b vessels are tanker shaped. Within this study a
concept design study for a 30,000 deadweight vessel leads to a type III or eventual a type II vessel if the
width exceeds 35 meter. In first instance the deadweight, DWT, is leading, followed by the deck width.
Type DWT Deck length Deck width
0 > 80,000 t > 175 m > 65 m I 40,000 t < DWT < 80,000 t > 150 m 45 m < B< 65 m II 25,000 t < DWT < 40,000 t > 100 m 35 m< B < 45 m III < 30,000 t > 100 m 25 m < B< 35 m
Table 2-1: Classes subdivision for HTVs by Dockwise (Source: Dockwise)
The subdivision of the Dockwise fleet including their main particulars is described in Table 2-2. In first
instance the information was found in stability booklets. The displacement, DWT and lightship weight,
LSW, particulars of the fleet are checked with up to date Dockwise information since stability booklets are
outdated. DWT includes casings, crew and stores. The LSW includes the actual weight of the ship without
fuel, passengers, cargo, water and such.
Type Vessel Built Lpp
[m] Ldeck
[m] B
[m] T
[m] Load Line
D [m]
Disp [t]
DWT [t]
LSW [t]
0 Vanguard 2013 270.0 275.0 70.0 10.979 B-100 15.5 177067 116891 60176
I Blue Marlin 2000 206.6 178.2 63.0 10.275 B-100 13.3 105703 77767 27936 White Marlin 2014 212.1 177.6 63.0 10.000 B 13.0 102120 72720 29400 Mighty Servant 1 1983 174.7 150.0 50.0 8.792 B 12.0 58272 41066 17206
II Forte / Finesse 2012 212.0 177.6 43.0 9.680 B 13.0 68818 48082 20736 Black Marlin 1999 206.6 165.6 42.0 10.115 B-100 13.3 76333 57448 18885 HYSY 278 2012 210.9 179.2 42.0 9.370 B 13.3 69922 52549 23895
II-b T-class 2008* 207.9 128.8 45.0 10.440 B 14.0 76015 53838 22177 Transhelf 1987 162.0 132.0 40.0 8.800 B 12.0 47634 33074 14560 Mighty Servant 3 1984 165.7 140.0 40.0 9.063 B 12.0 38400 25403 12997
III Fjord 2008** 157.8 131.8 45.5 6.113 B 9.0 37112 23134 13978 Fjell 2008** 141.2 119.8 36.0 6.419 B 9.0 29408 17925 11483
Super Servant 3 1982 130.0 115.8 32.0 6.219 B 8.5 20105 13991 6114
III-b S-class Swan/Tern 1981 170.9 126.6 32.3 9.461 B 13.3 41157 30057 11100 S-class Swift/Teal 1983 170.9 126.6 32.3 9.488 B 13.3 41294 29501 11793
Table 2-2: Fleet particulars (Source: Dockwise Summary Vessel info 6.0.0)
*Converted in 2008, built in 1990 **Converted in 2008, built in 2000
As can be seen, the S-class Swan and Tern vessels and the S-class Swift and Teal vessels are dimension
wise equal, but differ in DWT capacity. This is related to the different shipyards where the S-class was
build. The Transhelf, Mighty Servant 3, Fjord, Fjell and the Super Servant are vessels that are operating
with an equal or lower DWT capacity.
CHAPTER 2 | MARKET ANALYSIS
P A G E | 10 of 90
2.1.2.2 COMPETITOR FLEET ANALYSIS
In this industry there are a number of competitors that are worth to be mentioned. Focussing on the type II
and type III vessels the following competitors are of interest. This is based on the Dockwise internal and
confidential quarterly competitors update Q2 2014.
CCCC China Communications Construction Company International Shipping Corp; This company
was founded in 2005, is predominate active in the Ports and Marine, P&M segment and owns two
open stern HTVs;
COSCO China Ocean Shipping Company Heavy Transport This company both owns and
commercially manages a fleet of HTVs. It is part of the Chinese government and specialized in
supplying logistical and shipping services;
Guangzhou Salvage Bureau owns vessels that are managed by COSCO. Guangzhou Salvage
Bureau ordered a new type II vessel of 50,000 DWT ready in 2015;
OHT Offshore Heavy Transport AS; This Norwegian company is for 67% owned by Arne Blystad
AS. In the first quarter of 2015 they add a converted tanker to their fleet of HTVs;
STX Pan Ocean Company; This company is a South Korean shipping company also active in the
heavy lift market segment which owns relative new vessels;
ZSBC Zhejiang Share-ever Business Company; This company is founded in 2008 and owns one
vessel Xia Zhi Yuan 6 that is managed by COSCO;
ZPMC – Shanghai Zhenhua Heavy Industry Company; This Chinese based ZPMC plans to add
type II vessels to their fleet. Two new 50,000 DWT open stern vessels, first owned by united faith,
and one converted tanker are to be added to their fleet in 2015;
Centrans Ocean Shipping Logistics Group Co. Ltd. is a Chinese company, owns dock vessels
previously owned by Dockwise, and is planning to add two vessels to their fleet.
To get an overview of the vessel types owned and operated by the competitor in the markets of Dockwise
and the developments for the coming years, the following figures are shown. For both type II and type III
vessels the vessel competition overview is shown. For each type a subdivision is made for closed stern
and open stern vessels.
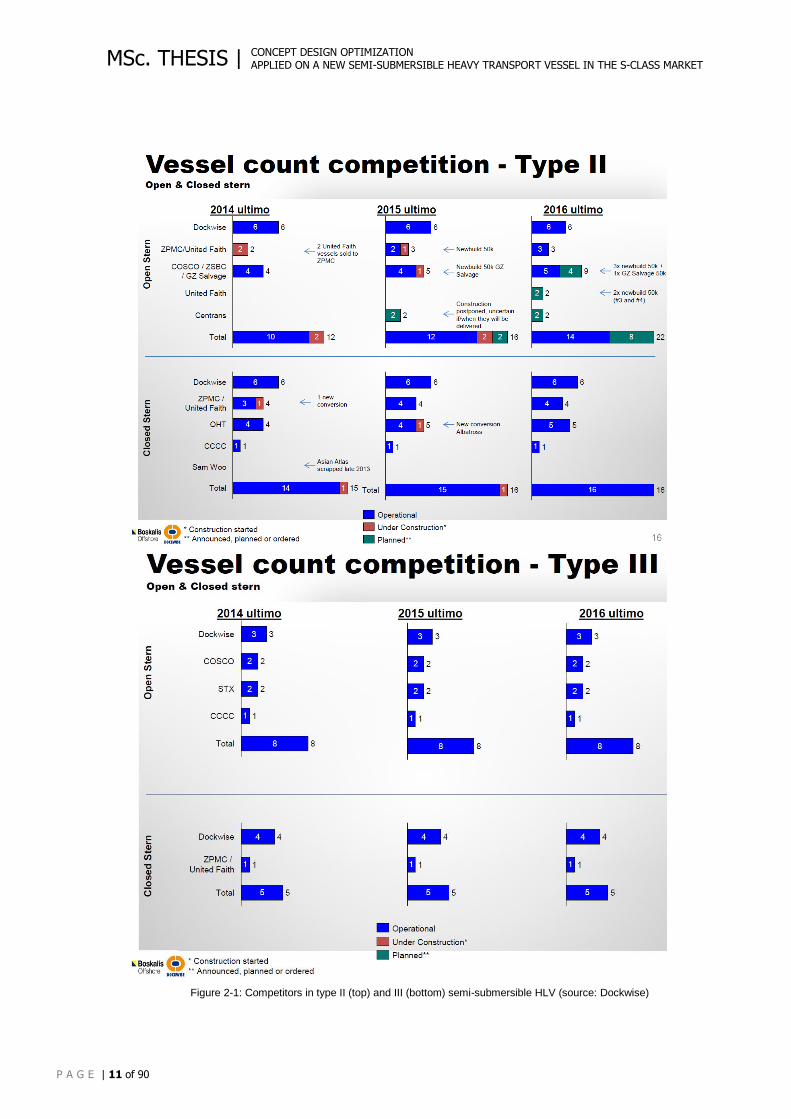
In Figure 2-1 at the top, type II vessels are shown. Dockwise has a big share in this vessel type, but in
2015 this will decrease tremendously with the addition of new competitor vessels. This type II market
seems to be very active and attractive for new competitors to enter. United Faith and Centrans will plan to
enter this vessel type market. In Figure 2-1 at the bottom, type III vessels are shown. There are no known
changes for the upcoming years. It has to be mentioned that it is expected that the closed stern Dockwise
vessels will be at the end of lifetime from 2016. This means that an enormous decrease of type III vessels
can follow. This could result in a lack of this type when no action is taken. Probably, companies are willing
to invest in the market segment of type II. Reasons can be the higher profits they expect of contracts due
to heavier, bigger, more complex and with that more high value cargo. This table includes both type II and
type III vessels since a 30.000 DWT vessel can exceed the type III vessel width. The Zhen Hua 22 is a
type III closed stern like the current S-Class. The Eagle and Falcon are type II closed stern vessels
because of the width of more than 35 meters, see Table 2-3. The Hua Hai Long is a type II open stern
vessel with diesel electric power configuration and DP1 class. The Sunshine, Sunrise, Kang sheng Kou &
Tai an Kou and Wishway are type III open stern vessels. These open stern vessels are more flexible and
with that more attractive for the market than the S-class with a closed stern and no redundant propulsion
class. The current carrying capacity shows that the only competitor is the Zhen Hua 22 with a length that
roughly exceeds the S-class. From this, it can be concluded that the S-class capacity based on deck-
space, length and DWT is a leading vessel in this vessel type category.
CONCEPT DESIGN OPTIMIZATION APPLIED ON A NEW SEMI-SUBMERSIBLE HEAVY TRANSPORT VESSEL IN THE S-CLASS MARKET
P A G E | 11 of 90
MSc. THESIS |
Figure 2-1: Competitors in type II (top) and III (bottom) semi-submersible HLV (source: Dockwise)
CHAPTER 2 | MARKET ANALYSIS
P A G E | 12 of 90
Because it is known that this concept design study focusses on a vessel of S-class comparable DWT
capacity of around 30.000 tons. The following vessels owned by competitors including their main
particulars are of interest, see Table 2-3:
Build Conv. Company Vessel-name Loa
[m] Lpp [m]
B [m]
D [m]
Ldeck [m]
Adeck [m2]
DWT [t]
V [kts]
Type
2011 n.a. GZ Salvage Hua Hai Long 181.9 170.4 43.6 11.0 144.0 6496 30000 12.0 II 1981 2006 OHT Eagle / Falcon 199.3 191.3 42.0 11.0 113.7 4700 31809 14.0 II-B 1983 2007 ZPMC Zhen Hua 22 228.5 218.0 32.2 13.5 151.0 4832 32292 12.1 III-B 2003 2008 COSCO Kang Sheng Kou
/Tai An Kou 156.0 145.0 36.0 10.0 126.0 4104 20131 12.0 III
2010 n.a. CCCC Wishway 156.4 149.4 36.0 10.0 126.8 4204 20000 11.0 III 2008 n.a. STX Sunshine 174.2 165.0 48.0 8.5 147.0 5904 16715 11.5 III 2012 n.a. STX Sunrise 168.5 165.0 44.0 10.3 134.0 5350 24000 11.5 III
Table 2-3: Vessel particulars competitor vessels. (Source: Dockwise competitor database)
From this figure, it can be concluded that most of these vessels are relatively wide which will have a
negative effect on the fuel consumption in relation to the current S-class. The Wishway and Kang Sheng
Kou/Tai An Kou are relatively short compared to the deck length but have a relatively low deadweight,
DWT. The S-class dimensions are not represented in this figure. From this it can be concluded, that there
are no direct competitors with the same specifications as the current S-class. The open stern is beneficial
compared to the S-class, but this can be integrated in the new design.
To answer the question: ‘is it advisable to design a new vessel of the S-class type’, this information is not
sufficient. The market must be investigated. The market and clients nowadays require an open stern
vessel due to loading and discharge possibilities as well as a more efficient deck space. The market and
clients nowadays also asks for a redundant power configuration.
2.2 S-CLASS MARKET PROFILE
This section investigates, what the S-class vessels transports and what the S-class probably will transport
in the future.
2.2.1 INTRODUCTION
The S-class vessels were originally designed for both the heavy marine transport industry and for the
transportation of liquid cargo. Nowadays the vessel is only capable of transporting cargo on deck. This
cargo can be loaded on by means of float-on operation by submerging the vessel deck, lift-on operation
with the help of external cranes or roll/skid-on from the quay-side. The vessel functionality, CAPEX, OPEX
and the market potential, results in a operational profile. This is summarized in the next sections.
The S-class vessels serve the HMT market and with the use of FSPs it can serve the LM business. Since
topsides are often too heavy and the S-class has no open stern, the S-class vessels are normally not
involved in installation projects. The market segments explained in 2.1.1 will be explained in this section.
The E&R sector offers a wide range of offshore structures which can be transported from one yard to
another yard, from the yard to the site, from one site to another site for e.g. the lifetime extension or finally
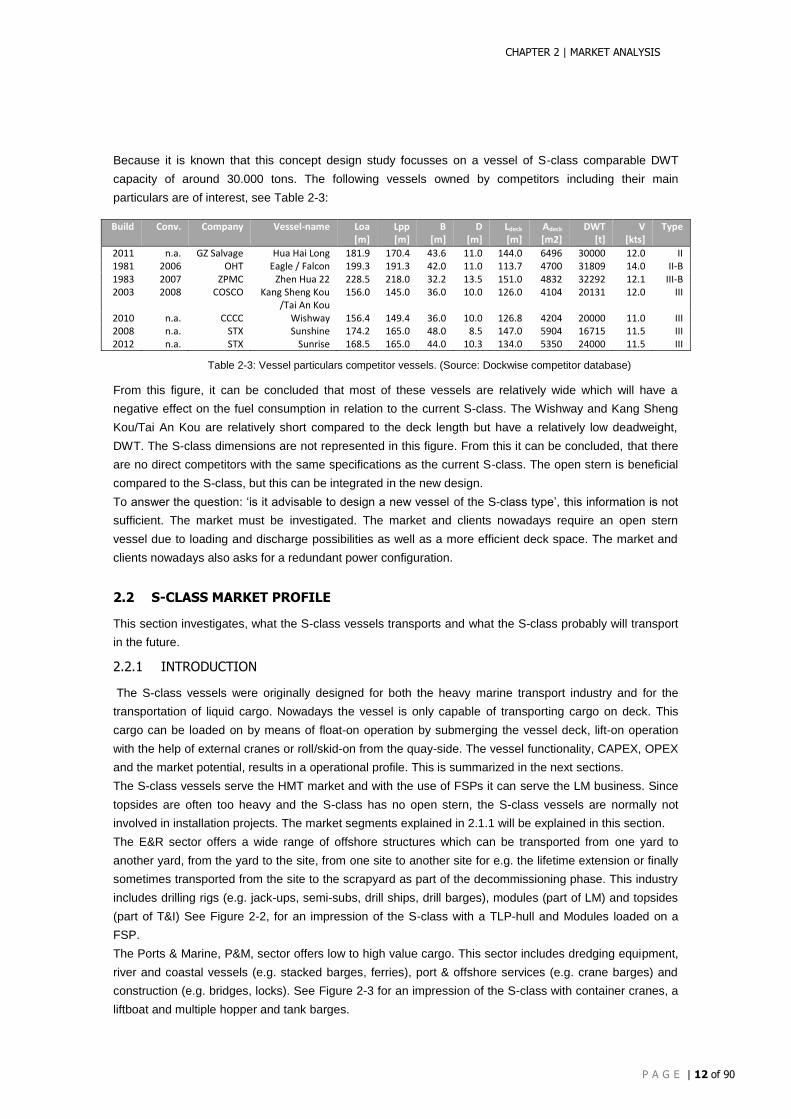
sometimes transported from the site to the scrapyard as part of the decommissioning phase. This industry
includes drilling rigs (e.g. jack-ups, semi-subs, drill ships, drill barges), modules (part of LM) and topsides
(part of T&I) See Figure 2-2, for an impression of the S-class with a TLP-hull and Modules loaded on a
FSP.
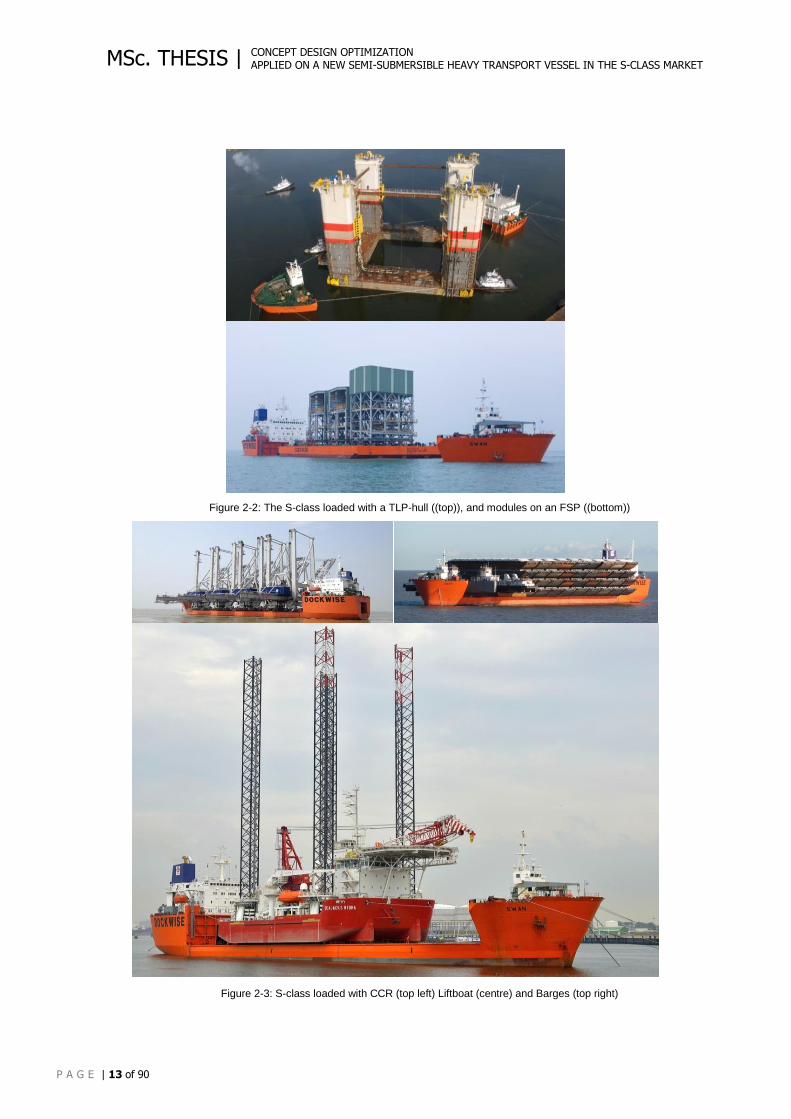
The Ports & Marine, P&M, sector offers low to high value cargo. This sector includes dredging equipment,
river and coastal vessels (e.g. stacked barges, ferries), port & offshore services (e.g. crane barges) and
construction (e.g. bridges, locks). See Figure 2-3 for an impression of the S-class with container cranes, a
liftboat and multiple hopper and tank barges.
CONCEPT DESIGN OPTIMIZATION APPLIED ON A NEW SEMI-SUBMERSIBLE HEAVY TRANSPORT VESSEL IN THE S-CLASS MARKET
P A G E | 13 of 90
MSc. THESIS |
Figure 2-2: The S-class loaded with a TLP-hull ((top)), and modules on an FSP ((bottom))
Figure 2-3: S-class loaded with CCR (top left) Liftboat (centre) and Barges (top right)
CHAPTER 2 | MARKET ANALYSIS
P A G E | 14 of 90
The military market is not part of the main markets and includes:
Military vessels e.g. coastguard vessels, corvettes, destroyers, frigates, landing crafts,
minehunters or patrol boats;
Seabasings e.g. military sealift command projects;
Submarines.
2.2.2 S-CLASS MARKET INVESTIGATION
The current S-class market, the opportunities and market changes are analysed to identify which markets
strongly influences a new design. This investigation is done with the following information:
A study for Dockwise about the complete Dockwise markets for the years 2009 to 2012 and a
prognosis for the years of 2013 to 2017 executed by Deloitte.
The fleet schedules of the S-class vessels for the years of 2006 to 2013.
A gross margin summary of the S-class of the years 2008 to 2012.
To start with, the Dockwise vessel revenue breakdown by market shows the distribution of the main
markets per vessel type. This information is confidential., Figure 2-4, shows this investigation with major
conclusion that the short term rig market is served by primarily type II-b vessels and the P&M market in
most cases is served by the S-class vessels. The type III-A vessels (open stern) serves the LM market in
general. These type III-A are competitive vessels for an S-class size concept. Serving the LM market is
thus an attractive addition to the S-class markets, when taking it into account for a new build vessel. The
Mighty Servant 3 does relatively much military projects. The Transshelf does relatively much drilling rigs. It
does not directly say something about market opportunities for a concept vessel. It will give a first
estimation of what kind of market packages can be formed based on the available markets.
Figure 2-4: Breakdown by market and vessel type (source: Dockwise)
The fleet schedule of the S-class provides information on the cargo type, the actual and standard
mobilization days and total days per contract. Maintenance and idle time is analysed to find the utilization
numbers. The available data from 2006 until 2013 gives a first insight into the market segments distribution
over the years.
To get a closer look on the different cargo types, transported between 2006 and 2013, often transported
cargo is subdivided. This is based on the loading and discharge method and the description in 2.1.2. In
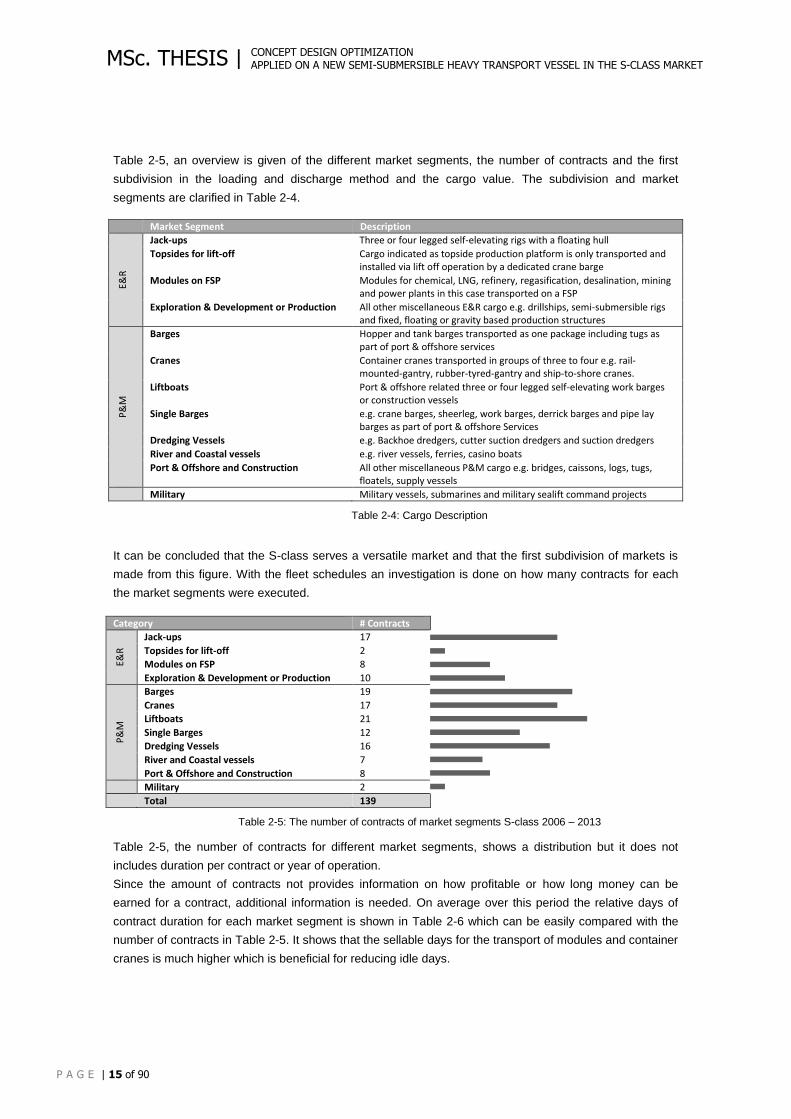
CONCEPT DESIGN OPTIMIZATION APPLIED ON A NEW SEMI-SUBMERSIBLE HEAVY TRANSPORT VESSEL IN THE S-CLASS MARKET
P A G E | 15 of 90
MSc. THESIS |
Table 2-5, an overview is given of the different market segments, the number of contracts and the first
subdivision in the loading and discharge method and the cargo value. The subdivision and market
segments are clarified in Table 2-4.
Market Segment Description
E&R
Jack-ups Three or four legged self-elevating rigs with a floating hull
Topsides for lift-off Cargo indicated as topside production platform is only transported and installed via lift off operation by a dedicated crane barge
Modules on FSP Modules for chemical, LNG, refinery, regasification, desalination, mining and power plants in this case transported on a FSP
Exploration & Development or Production All other miscellaneous E&R cargo e.g. drillships, semi-submersible rigs and fixed, floating or gravity based production structures
P&
M
Barges
Hopper and tank barges transported as one package including tugs as part of port & offshore services
Cranes Container cranes transported in groups of three to four e.g. rail-mounted-gantry, rubber-tyred-gantry and ship-to-shore cranes.
Liftboats Port & offshore related three or four legged self-elevating work barges or construction vessels
Single Barges e.g. crane barges, sheerleg, work barges, derrick barges and pipe lay barges as part of port & offshore Services
Dredging Vessels e.g. Backhoe dredgers, cutter suction dredgers and suction dredgers
River and Coastal vessels e.g. river vessels, ferries, casino boats
Port & Offshore and Construction All other miscellaneous P&M cargo e.g. bridges, caissons, logs, tugs, floatels, supply vessels
Military Military vessels, submarines and military sealift command projects
Table 2-4: Cargo Description
It can be concluded that the S-class serves a versatile market and that the first subdivision of markets is
made from this figure. With the fleet schedules an investigation is done on how many contracts for each
the market segments were executed.
Category # Contracts
E&R
Jack-ups 17
Topsides for lift-off 2
Modules on FSP 8
Exploration & Development or Production 10
P&
M
Barges 19
Cranes 17
Liftboats 21
Single Barges 12
Dredging Vessels 16
River and Coastal vessels 7
Port & Offshore and Construction 8
Military 2
l Total 139
Table 2-5: The number of contracts of market segments S-class 2006 – 2013
Table 2-5, the number of contracts for different market segments, shows a distribution but it does not
includes duration per contract or year of operation.
Since the amount of contracts not provides information on how profitable or how long money can be
earned for a contract, additional information is needed. On average over this period the relative days of
contract duration for each market segment is shown in Table 2-6 which can be easily compared with the
number of contracts in Table 2-5. It shows that the sellable days for the transport of modules and container
cranes is much higher which is beneficial for reducing idle days.
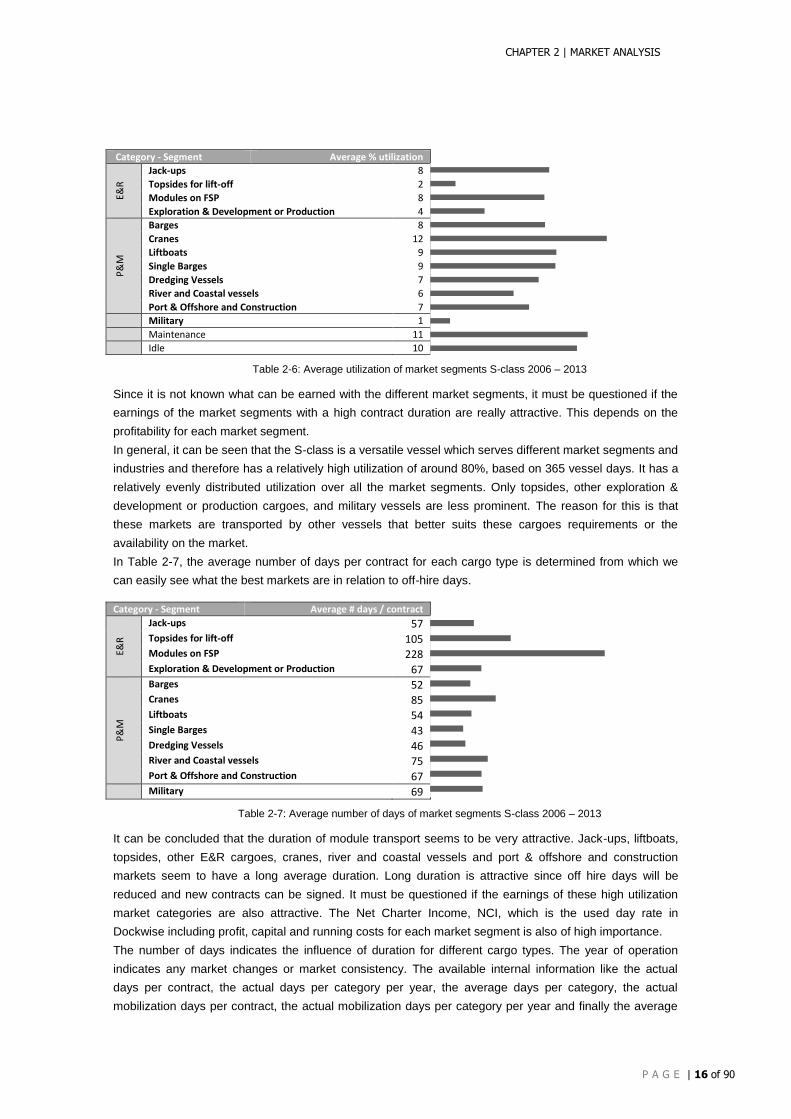
CHAPTER 2 | MARKET ANALYSIS
P A G E | 16 of 90
Category - Segment Average % utilization
E&R
Jack-ups 8
Topsides for lift-off 2
Modules on FSP 8
Exploration & Development or Production 4
P&
M
Barges 8
Cranes 12
Liftboats 9
Single Barges 9
Dredging Vessels 7
River and Coastal vessels 6
Port & Offshore and Construction 7
Military 1
Maintenance 11
Idle 10
Table 2-6: Average utilization of market segments S-class 2006 – 2013
Since it is not known what can be earned with the different market segments, it must be questioned if the
earnings of the market segments with a high contract duration are really attractive. This depends on the
profitability for each market segment.
In general, it can be seen that the S-class is a versatile vessel which serves different market segments and
industries and therefore has a relatively high utilization of around 80%, based on 365 vessel days. It has a
relatively evenly distributed utilization over all the market segments. Only topsides, other exploration &
development or production cargoes, and military vessels are less prominent. The reason for this is that
these markets are transported by other vessels that better suits these cargoes requirements or the
availability on the market.
In Table 2-7, the average number of days per contract for each cargo type is determined from which we
can easily see what the best markets are in relation to off-hire days.
Category - Segment Average # days / contract
E&R
Jack-ups 57 Topsides for lift-off 105 Modules on FSP 228 Exploration & Development or Production 67
P&
M
Barges 52 Cranes 85 Liftboats 54 Single Barges 43 Dredging Vessels 46 River and Coastal vessels 75 Port & Offshore and Construction 67 Military 69
Table 2-7: Average number of days of market segments S-class 2006 – 2013
It can be concluded that the duration of module transport seems to be very attractive. Jack-ups, liftboats,
topsides, other E&R cargoes, cranes, river and coastal vessels and port & offshore and construction
markets seem to have a long average duration. Long duration is attractive since off hire days will be
reduced and new contracts can be signed. It must be questioned if the earnings of these high utilization
market categories are also attractive. The Net Charter Income, NCI, which is the used day rate in
Dockwise including profit, capital and running costs for each market segment is also of high importance.
The number of days indicates the influence of duration for different cargo types. The year of operation
indicates any market changes or market consistency. The available internal information like the actual
days per contract, the actual days per category per year, the average days per category, the actual
mobilization days per contract, the actual mobilization days per category per year and finally the average
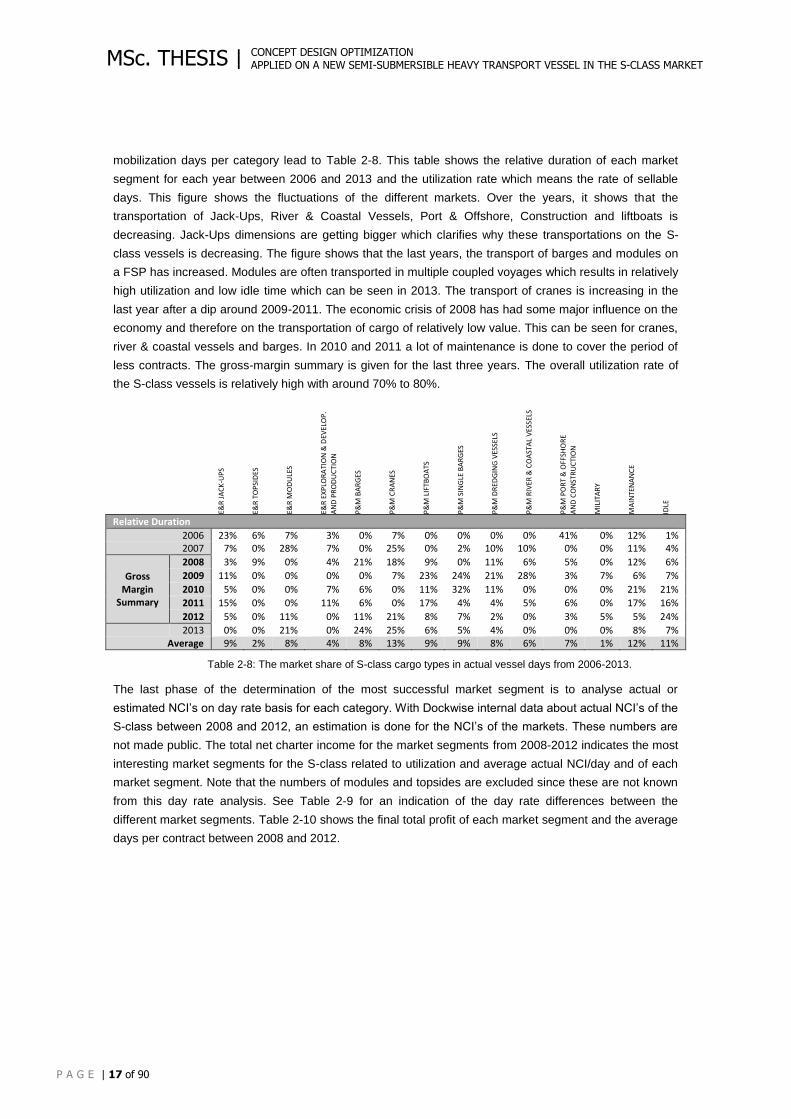
CONCEPT DESIGN OPTIMIZATION APPLIED ON A NEW SEMI-SUBMERSIBLE HEAVY TRANSPORT VESSEL IN THE S-CLASS MARKET
P A G E | 17 of 90
MSc. THESIS |
mobilization days per category lead to Table 2-8. This table shows the relative duration of each market
segment for each year between 2006 and 2013 and the utilization rate which means the rate of sellable
days. This figure shows the fluctuations of the different markets. Over the years, it shows that the
transportation of Jack-Ups, River & Coastal Vessels, Port & Offshore, Construction and liftboats is
decreasing. Jack-Ups dimensions are getting bigger which clarifies why these transportations on the S-
class vessels is decreasing. The figure shows that the last years, the transport of barges and modules on
a FSP has increased. Modules are often transported in multiple coupled voyages which results in relatively
high utilization and low idle time which can be seen in 2013. The transport of cranes is increasing in the
last year after a dip around 2009-2011. The economic crisis of 2008 has had some major influence on the
economy and therefore on the transportation of cargo of relatively low value. This can be seen for cranes,
river & coastal vessels and barges. In 2010 and 2011 a lot of maintenance is done to cover the period of
less contracts. The gross-margin summary is given for the last three years. The overall utilization rate of
the S-class vessels is relatively high with around 70% to 80%.
E&R
JA
CK
-UP
S
E&R
TO
PSI
DES
E&R
MO
DU
LES
E&R
EX
PLO
RA
TIO
N &
DEV
ELO
P.
AN
D P
RO
DU
CTI
ON
P&
M B
AR
GES
P&
M C
RA
NES
P&
M L
IFTB
OA
TS
P&
M S
ING
LE B
AR
GES
P&
M D
RED
GIN
G V
ESSE
LS
P&
M R
IVER
& C
OA
STA
L V
ESSE
LS
P&
M P
OR
T &
OFF
SHO
RE
AN
D C
ON
STR
UC
TIO
N
MIL
ITA
RY
MA
INTE
NA
NC
E
IDLE
Relative Duration
2006 23% 6% 7% 3% 0% 7% 0% 0% 0% 0% 41% 0% 12% 1% 2007 7% 0% 28% 7% 0% 25% 0% 2% 10% 10% 0% 0% 11% 4%
Gross Margin
Summary
2008 3% 9% 0% 4% 21% 18% 9% 0% 11% 6% 5% 0% 12% 6%
2009 11% 0% 0% 0% 0% 7% 23% 24% 21% 28% 3% 7% 6% 7%
2010 5% 0% 0% 7% 6% 0% 11% 32% 11% 0% 0% 0% 21% 21%
2011 15% 0% 0% 11% 6% 0% 17% 4% 4% 5% 6% 0% 17% 16%
2012 5% 0% 11% 0% 11% 21% 8% 7% 2% 0% 3% 5% 5% 24%
2013 0% 0% 21% 0% 24% 25% 6% 5% 4% 0% 0% 0% 8% 7% Average 9% 2% 8% 4% 8% 13% 9% 9% 8% 6% 7% 1% 12% 11%
Table 2-8: The market share of S-class cargo types in actual vessel days from 2006-2013.
The last phase of the determination of the most successful market segment is to analyse actual or
estimated NCI’s on day rate basis for each category. With Dockwise internal data about actual NCI’s of the
S-class between 2008 and 2012, an estimation is done for the NCI’s of the markets. These numbers are
not made public. The total net charter income for the market segments from 2008-2012 indicates the most
interesting market segments for the S-class related to utilization and average actual NCI/day and of each
market segment. Note that the numbers of modules and topsides are excluded since these are not known
from this day rate analysis. See Table 2-9 for an indication of the day rate differences between the
different market segments. Table 2-10 shows the final total profit of each market segment and the average
days per contract between 2008 and 2012.
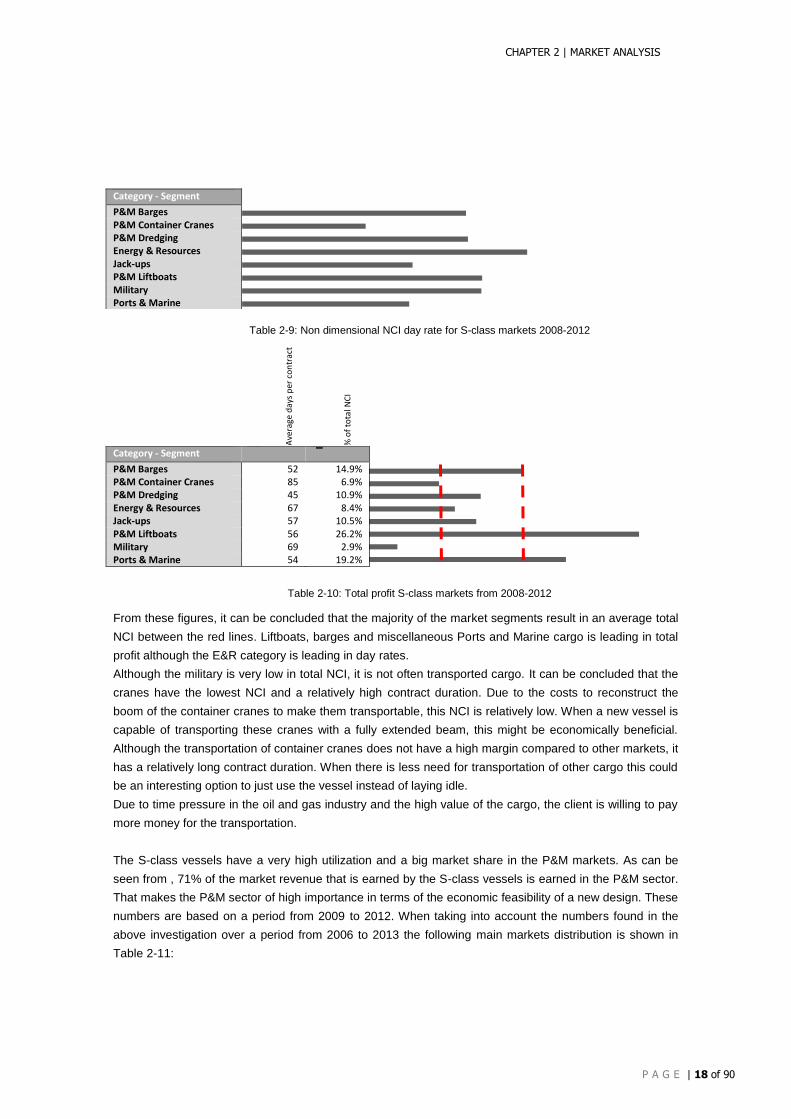
CHAPTER 2 | MARKET ANALYSIS
P A G E | 18 of 90
Table 2-9: Non dimensional NCI day rate for S-class markets 2008-2012
Ave
rage
day
s p
er c
on
trac
t
% o
f to
tal N
CI
Table 2-10: Total profit S-class markets from 2008-2012
From these figures, it can be concluded that the majority of the market segments result in an average total
NCI between the red lines. Liftboats, barges and miscellaneous Ports and Marine cargo is leading in total
profit although the E&R category is leading in day rates.
Although the military is very low in total NCI, it is not often transported cargo. It can be concluded that the
cranes have the lowest NCI and a relatively high contract duration. Due to the costs to reconstruct the
boom of the container cranes to make them transportable, this NCI is relatively low. When a new vessel is
capable of transporting these cranes with a fully extended beam, this might be economically beneficial.
Although the transportation of container cranes does not have a high margin compared to other markets, it
has a relatively long contract duration. When there is less need for transportation of other cargo this could
be an interesting option to just use the vessel instead of laying idle.
Due to time pressure in the oil and gas industry and the high value of the cargo, the client is willing to pay
more money for the transportation.
The S-class vessels have a very high utilization and a big market share in the P&M markets. As can be
seen from , 71% of the market revenue that is earned by the S-class vessels is earned in the P&M sector.
That makes the P&M sector of high importance in terms of the economic feasibility of a new design. These
numbers are based on a period from 2009 to 2012. When taking into account the numbers found in the
above investigation over a period from 2006 to 2013 the following main markets distribution is shown in
Table 2-11:
Category - Segment
P&M Barges P&M Container Cranes P&M Dredging Energy & Resources Jack-ups P&M Liftboats Military Ports & Marine
Category - Segment
I
P&M Barges 52 14.9% P&M Container Cranes 85 6.9% P&M Dredging 45 10.9% Energy & Resources 67 8.4% Jack-ups 57 10.5% P&M Liftboats 56 26.2% Military 69 2.9% Ports & Marine 54 19.2%
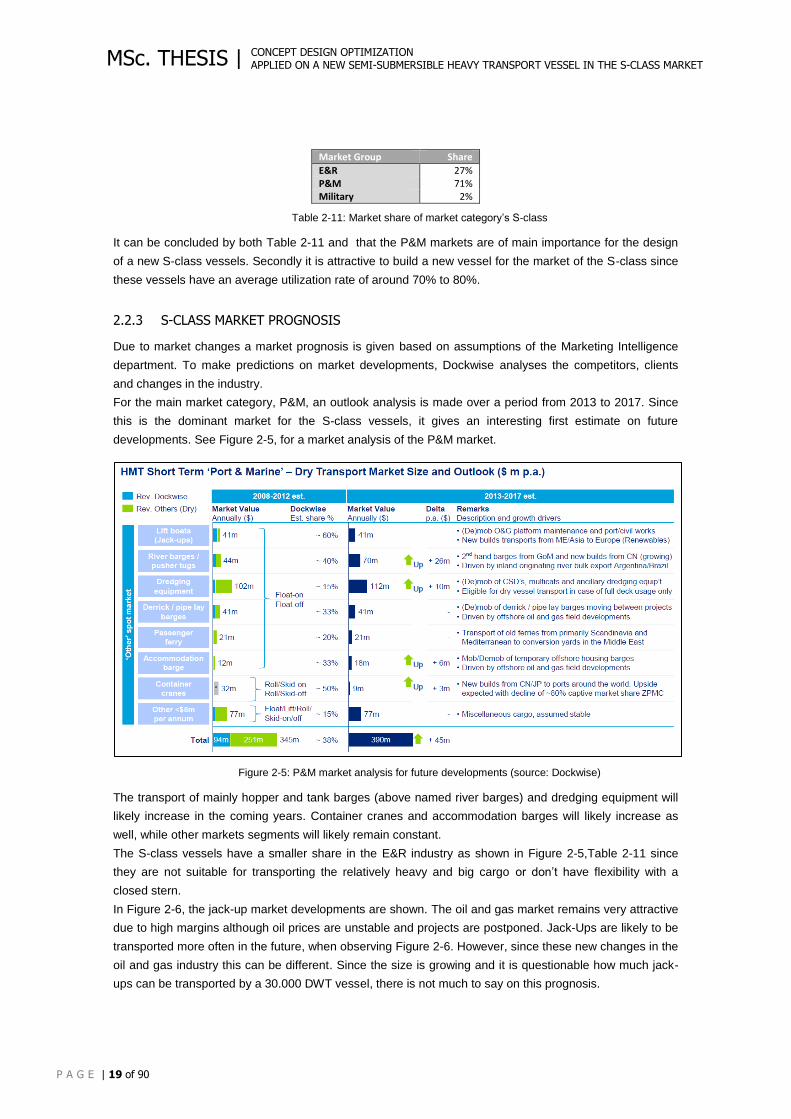
CONCEPT DESIGN OPTIMIZATION APPLIED ON A NEW SEMI-SUBMERSIBLE HEAVY TRANSPORT VESSEL IN THE S-CLASS MARKET
P A G E | 19 of 90
MSc. THESIS |
Market Group Share
E&R 27% P&M 71% Military 2%
Table 2-11: Market share of market category’s S-class
It can be concluded by both Table 2-11 and that the P&M markets are of main importance for the design
of a new S-class vessels. Secondly it is attractive to build a new vessel for the market of the S-class since
these vessels have an average utilization rate of around 70% to 80%.
2.2.3 S-CLASS MARKET PROGNOSIS
Due to market changes a market prognosis is given based on assumptions of the Marketing Intelligence
department. To make predictions on market developments, Dockwise analyses the competitors, clients
and changes in the industry.
For the main market category, P&M, an outlook analysis is made over a period from 2013 to 2017. Since
this is the dominant market for the S-class vessels, it gives an interesting first estimate on future
developments. See Figure 2-5, for a market analysis of the P&M market.
Figure 2-5: P&M market analysis for future developments (source: Dockwise)
The transport of mainly hopper and tank barges (above named river barges) and dredging equipment will
likely increase in the coming years. Container cranes and accommodation barges will likely increase as
well, while other markets segments will likely remain constant.
The S-class vessels have a smaller share in the E&R industry as shown in Figure 2-5,Table 2-11 since
they are not suitable for transporting the relatively heavy and big cargo or don’t have flexibility with a
closed stern.
In Figure 2-6, the jack-up market developments are shown. The oil and gas market remains very attractive
due to high margins although oil prices are unstable and projects are postponed. Jack-Ups are likely to be
transported more often in the future, when observing Figure 2-6. However, since these new changes in the
oil and gas industry this can be different. Since the size is growing and it is questionable how much jack-
ups can be transported by a 30.000 DWT vessel, there is not much to say on this prognosis.
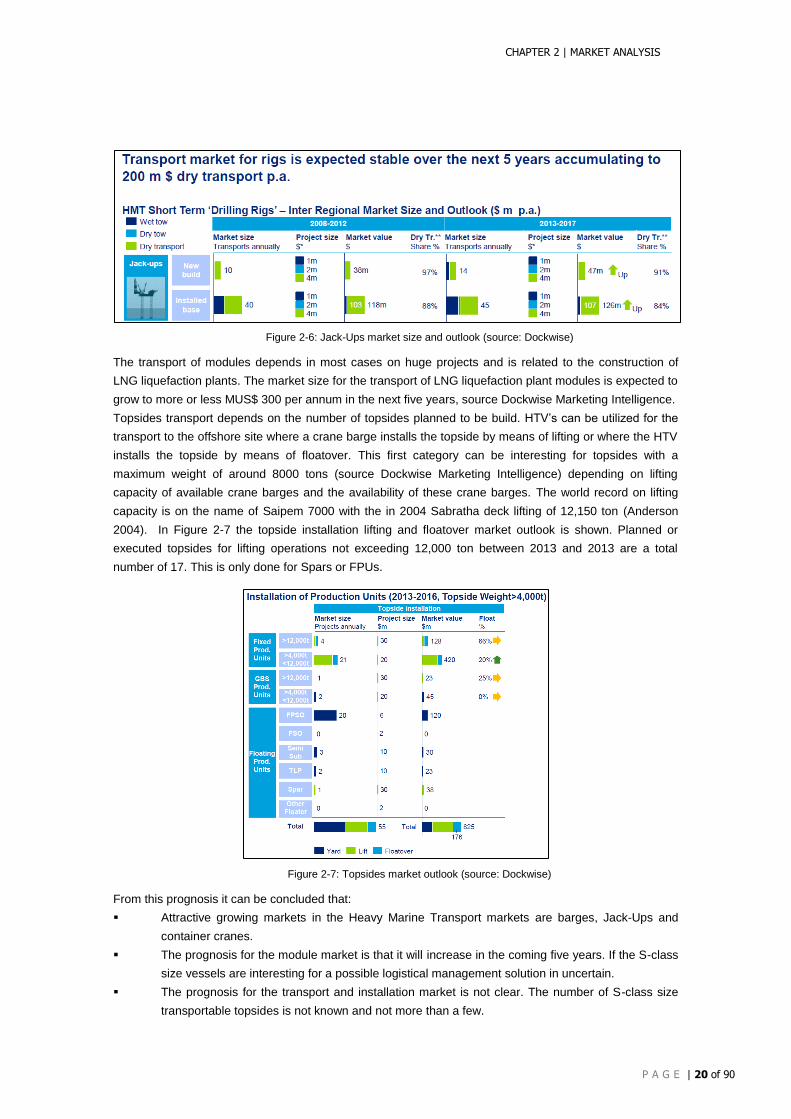
CHAPTER 2 | MARKET ANALYSIS
P A G E | 20 of 90
Figure 2-6: Jack-Ups market size and outlook (source: Dockwise)
The transport of modules depends in most cases on huge projects and is related to the construction of
LNG liquefaction plants. The market size for the transport of LNG liquefaction plant modules is expected to
grow to more or less MUS$ 300 per annum in the next five years, source Dockwise Marketing Intelligence.
Topsides transport depends on the number of topsides planned to be build. HTV’s can be utilized for the
transport to the offshore site where a crane barge installs the topside by means of lifting or where the HTV
installs the topside by means of floatover. This first category can be interesting for topsides with a
maximum weight of around 8000 tons (source Dockwise Marketing Intelligence) depending on lifting
capacity of available crane barges and the availability of these crane barges. The world record on lifting
capacity is on the name of Saipem 7000 with the in 2004 Sabratha deck lifting of 12,150 ton (Anderson
2004). In Figure 2-7 the topside installation lifting and floatover market outlook is shown. Planned or
executed topsides for lifting operations not exceeding 12,000 ton between 2013 and 2013 are a total
number of 17. This is only done for Spars or FPUs.
Figure 2-7: Topsides market outlook (source: Dockwise)
From this prognosis it can be concluded that:
Attractive growing markets in the Heavy Marine Transport markets are barges, Jack-Ups and
container cranes.
The prognosis for the module market is that it will increase in the coming five years. If the S-class
size vessels are interesting for a possible logistical management solution in uncertain.
The prognosis for the transport and installation market is not clear. The number of S-class size
transportable topsides is not known and not more than a few.
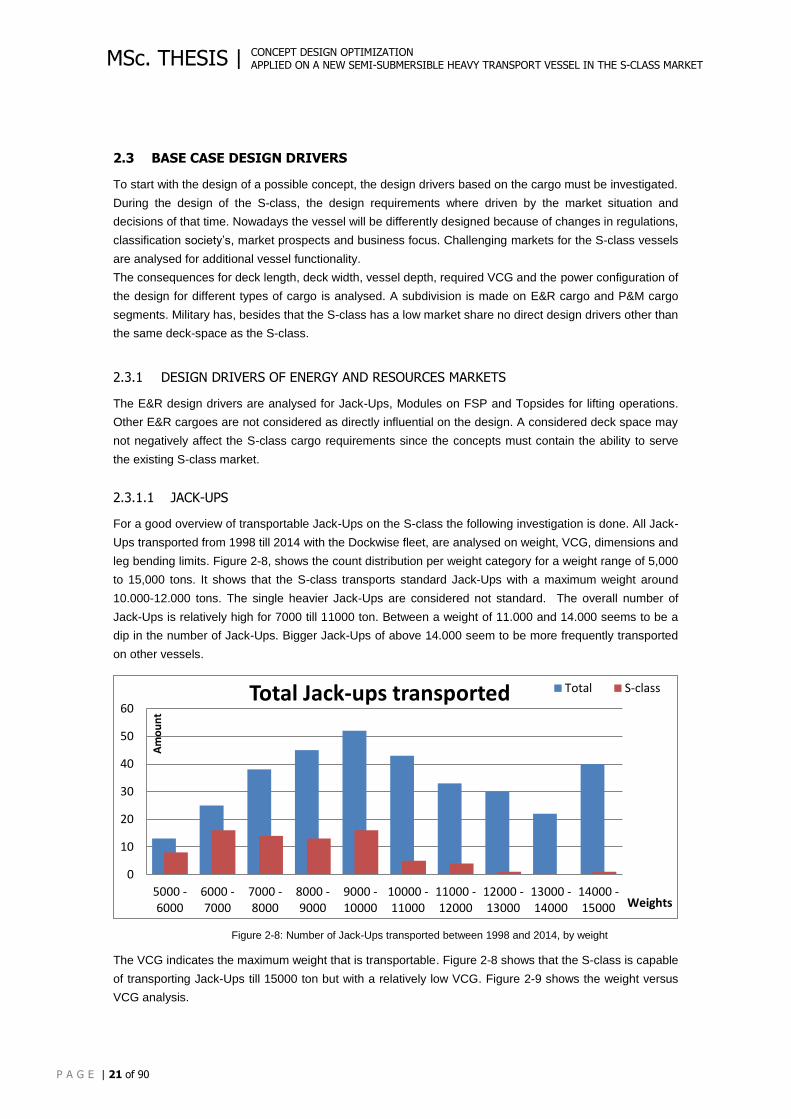
CONCEPT DESIGN OPTIMIZATION APPLIED ON A NEW SEMI-SUBMERSIBLE HEAVY TRANSPORT VESSEL IN THE S-CLASS MARKET
P A G E | 21 of 90
MSc. THESIS |
2.3 BASE CASE DESIGN DRIVERS
To start with the design of a possible concept, the design drivers based on the cargo must be investigated.
During the design of the S-class, the design requirements where driven by the market situation and
decisions of that time. Nowadays the vessel will be differently designed because of changes in regulations,
classification society’s, market prospects and business focus. Challenging markets for the S-class vessels
are analysed for additional vessel functionality.
The consequences for deck length, deck width, vessel depth, required VCG and the power configuration of
the design for different types of cargo is analysed. A subdivision is made on E&R cargo and P&M cargo
segments. Military has, besides that the S-class has a low market share no direct design drivers other than
the same deck-space as the S-class.
2.3.1 DESIGN DRIVERS OF ENERGY AND RESOURCES MARKETS
The E&R design drivers are analysed for Jack-Ups, Modules on FSP and Topsides for lifting operations.
Other E&R cargoes are not considered as directly influential on the design. A considered deck space may
not negatively affect the S-class cargo requirements since the concepts must contain the ability to serve
the existing S-class market.
2.3.1.1 JACK-UPS
For a good overview of transportable Jack-Ups on the S-class the following investigation is done. All Jack-
Ups transported from 1998 till 2014 with the Dockwise fleet, are analysed on weight, VCG, dimensions and
leg bending limits. Figure 2-8, shows the count distribution per weight category for a weight range of 5,000
to 15,000 tons. It shows that the S-class transports standard Jack-Ups with a maximum weight around
10.000-12.000 tons. The single heavier Jack-Ups are considered not standard. The overall number of
Jack-Ups is relatively high for 7000 till 11000 ton. Between a weight of 11.000 and 14.000 seems to be a
dip in the number of Jack-Ups. Bigger Jack-Ups of above 14.000 seem to be more frequently transported
on other vessels.
Figure 2-8: Number of Jack-Ups transported between 1998 and 2014, by weight
The VCG indicates the maximum weight that is transportable. Figure 2-8 shows that the S-class is capable
of transporting Jack-Ups till 15000 ton but with a relatively low VCG. Figure 2-9 shows the weight versus
VCG analysis.
0
10
20
30
40
50
60
5000 -6000
6000 -7000
7000 -8000
8000 -9000
9000 -10000
10000 -11000
11000 -12000
12000 -13000
13000 -14000
14000 -15000
Am
ou
nt
Weights
Total Jack-ups transported Total S-class
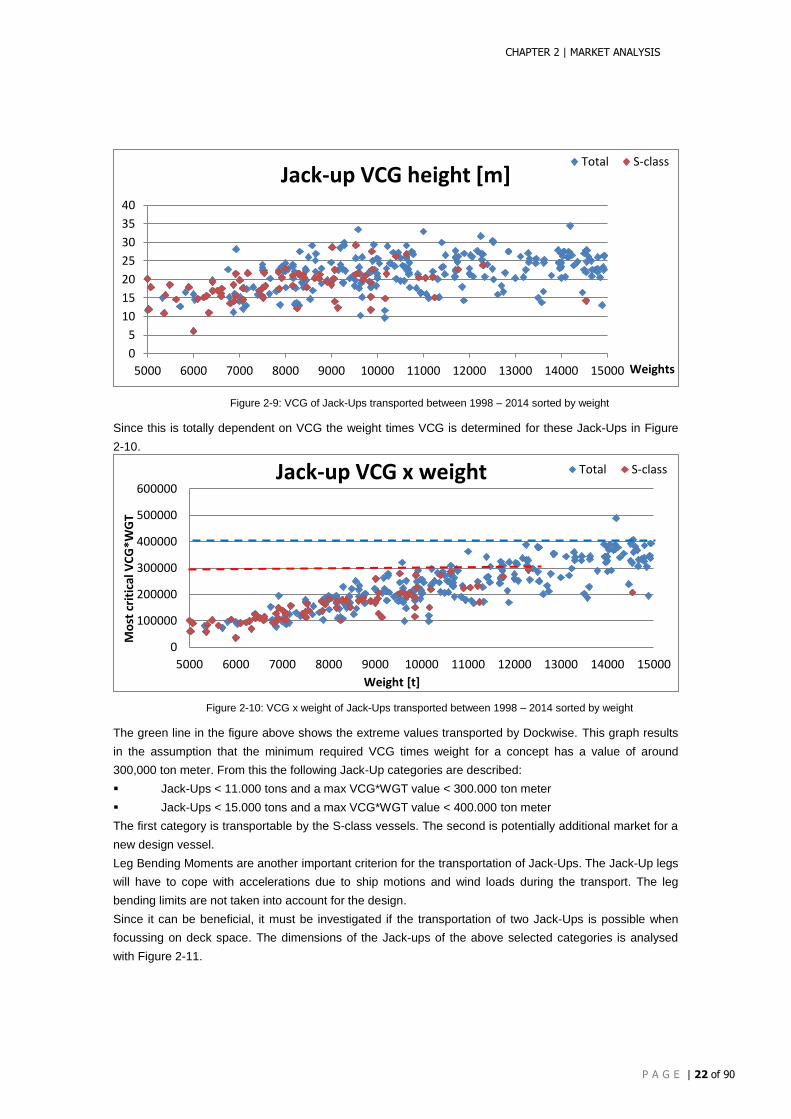
CHAPTER 2 | MARKET ANALYSIS
P A G E | 22 of 90
Figure 2-9: VCG of Jack-Ups transported between 1998 – 2014 sorted by weight
Since this is totally dependent on VCG the weight times VCG is determined for these Jack-Ups in Figure
2-10.
Figure 2-10: VCG x weight of Jack-Ups transported between 1998 – 2014 sorted by weight
The green line in the figure above shows the extreme values transported by Dockwise. This graph results
in the assumption that the minimum required VCG times weight for a concept has a value of around
300,000 ton meter. From this the following Jack-Up categories are described:
Jack-Ups < 11.000 tons and a max VCG*WGT value < 300.000 ton meter
Jack-Ups < 15.000 tons and a max VCG*WGT value < 400.000 ton meter
The first category is transportable by the S-class vessels. The second is potentially additional market for a
new design vessel.
Leg Bending Moments are another important criterion for the transportation of Jack-Ups. The Jack-Up legs
will have to cope with accelerations due to ship motions and wind loads during the transport. The leg
bending limits are not taken into account for the design.
Since it can be beneficial, it must be investigated if the transportation of two Jack-Ups is possible when
focussing on deck space. The dimensions of the Jack-ups of the above selected categories is analysed
with Figure 2-11.
0
5
10
15
20
25
30
35
40
5000 6000 7000 8000 9000 10000 11000 12000 13000 14000 15000 Weights
Jack-up VCG height [m] Total S-class
0
100000
200000
300000
400000
500000
600000
5000 6000 7000 8000 9000 10000 11000 12000 13000 14000 15000
Mo
st c
riti
cal V
CG
*WG
T
Weight [t]
Jack-up VCG x weight Total S-class
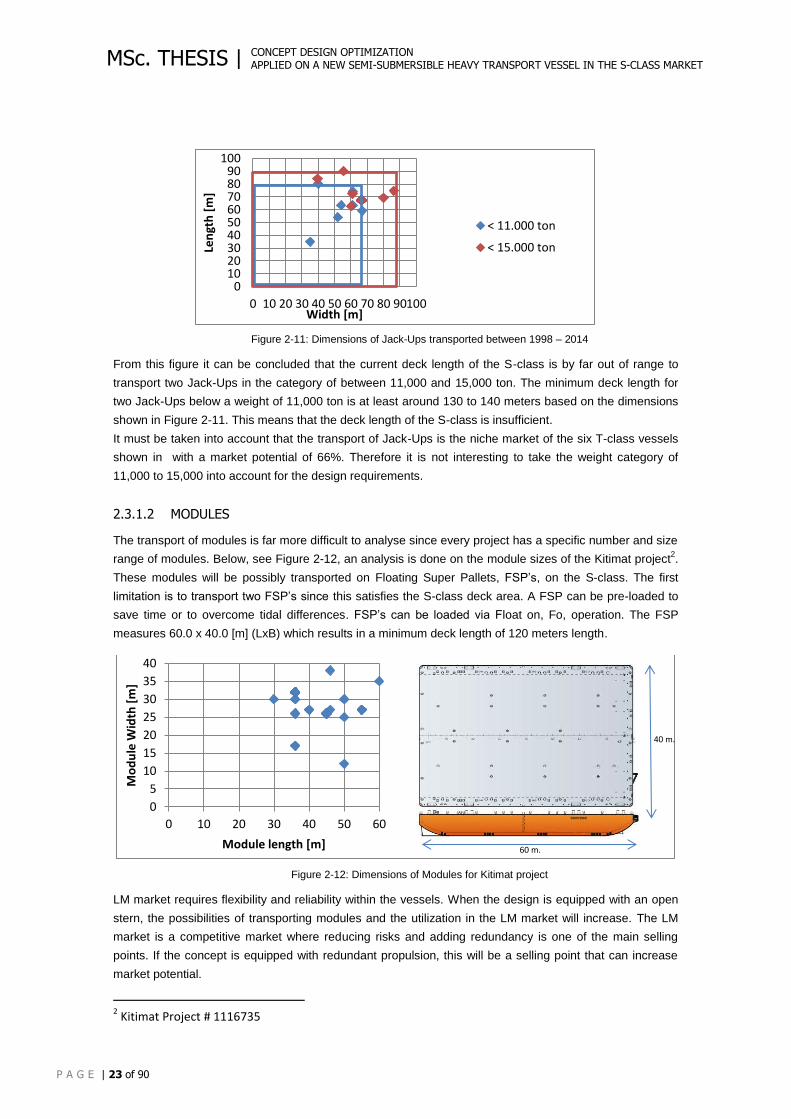
CONCEPT DESIGN OPTIMIZATION APPLIED ON A NEW SEMI-SUBMERSIBLE HEAVY TRANSPORT VESSEL IN THE S-CLASS MARKET
P A G E | 23 of 90
MSc. THESIS |
Figure 2-11: Dimensions of Jack-Ups transported between 1998 – 2014
From this figure it can be concluded that the current deck length of the S-class is by far out of range to
transport two Jack-Ups in the category of between 11,000 and 15,000 ton. The minimum deck length for
two Jack-Ups below a weight of 11,000 ton is at least around 130 to 140 meters based on the dimensions
shown in Figure 2-11. This means that the deck length of the S-class is insufficient.
It must be taken into account that the transport of Jack-Ups is the niche market of the six T-class vessels
shown in with a market potential of 66%. Therefore it is not interesting to take the weight category of
11,000 to 15,000 into account for the design requirements.
2.3.1.2 MODULES
The transport of modules is far more difficult to analyse since every project has a specific number and size
range of modules. Below, see Figure 2-12, an analysis is done on the module sizes of the Kitimat project2.
These modules will be possibly transported on Floating Super Pallets, FSP’s, on the S-class. The first
limitation is to transport two FSP’s since this satisfies the S-class deck area. A FSP can be pre-loaded to
save time or to overcome tidal differences. FSP’s can be loaded via Float on, Fo, operation. The FSP
measures 60.0 x 40.0 [m] (LxB) which results in a minimum deck length of 120 meters length.
Figure 2-12: Dimensions of Modules for Kitimat project
LM market requires flexibility and reliability within the vessels. When the design is equipped with an open
stern, the possibilities of transporting modules and the utilization in the LM market will increase. The LM
market is a competitive market where reducing risks and adding redundancy is one of the main selling
points. If the concept is equipped with redundant propulsion, this will be a selling point that can increase
market potential.
2 Kitimat Project # 1116735
0102030405060708090
100
0 10 20 30 40 50 60 70 80 90100
Len
gth
[m
]
Width [m]
< 11.000 ton
< 15.000 ton
0
5
10
15
20
25
30
35
40
0 10 20 30 40 50 60
Mo
du
le W
idth
[m
]
Module length [m]
Floating Super Pallet
40 m.
60 m.
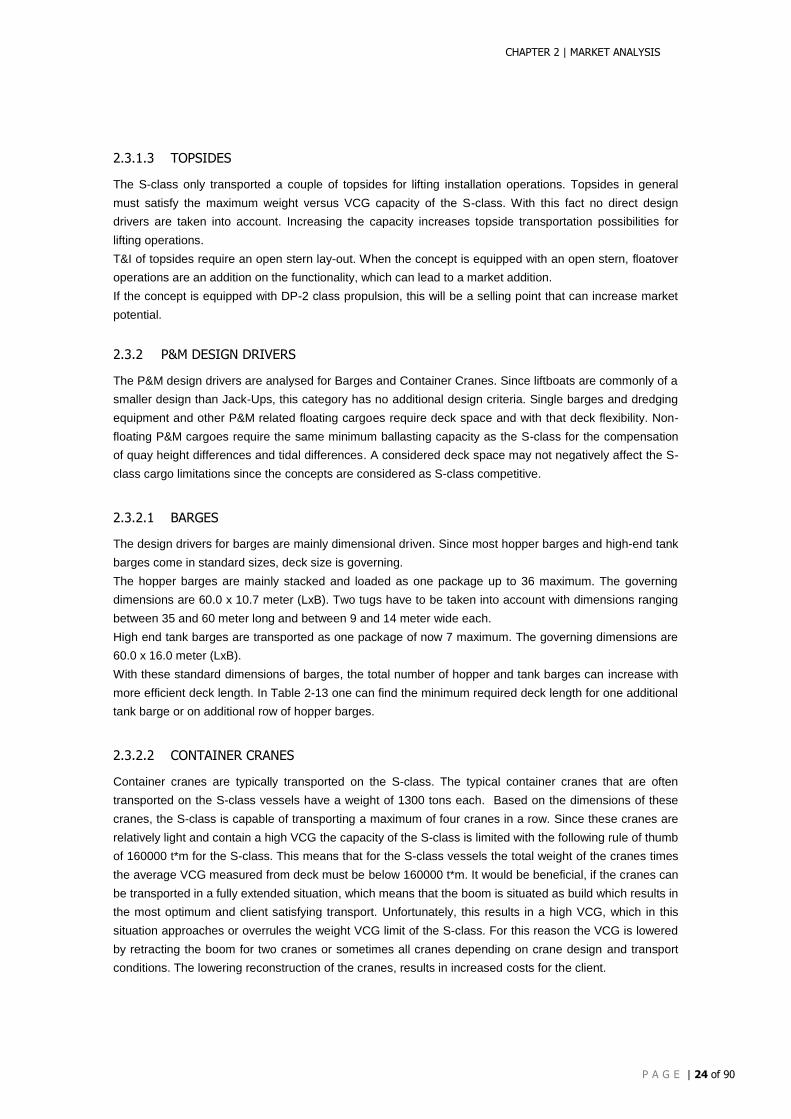
CHAPTER 2 | MARKET ANALYSIS
P A G E | 24 of 90
2.3.1.3 TOPSIDES
The S-class only transported a couple of topsides for lifting installation operations. Topsides in general
must satisfy the maximum weight versus VCG capacity of the S-class. With this fact no direct design
drivers are taken into account. Increasing the capacity increases topside transportation possibilities for
lifting operations.
T&I of topsides require an open stern lay-out. When the concept is equipped with an open stern, floatover
operations are an addition on the functionality, which can lead to a market addition.
If the concept is equipped with DP-2 class propulsion, this will be a selling point that can increase market
potential.
2.3.2 P&M DESIGN DRIVERS
The P&M design drivers are analysed for Barges and Container Cranes. Since liftboats are commonly of a
smaller design than Jack-Ups, this category has no additional design criteria. Single barges and dredging
equipment and other P&M related floating cargoes require deck space and with that deck flexibility. Non-
floating P&M cargoes require the same minimum ballasting capacity as the S-class for the compensation
of quay height differences and tidal differences. A considered deck space may not negatively affect the S-
class cargo limitations since the concepts are considered as S-class competitive.
2.3.2.1 BARGES
The design drivers for barges are mainly dimensional driven. Since most hopper barges and high-end tank
barges come in standard sizes, deck size is governing.
The hopper barges are mainly stacked and loaded as one package up to 36 maximum. The governing
dimensions are 60.0 x 10.7 meter (LxB). Two tugs have to be taken into account with dimensions ranging
between 35 and 60 meter long and between 9 and 14 meter wide each.
High end tank barges are transported as one package of now 7 maximum. The governing dimensions are
60.0 x 16.0 meter (LxB).
With these standard dimensions of barges, the total number of hopper and tank barges can increase with
more efficient deck length. In Table 2-13 one can find the minimum required deck length for one additional
tank barge or on additional row of hopper barges.
2.3.2.2 CONTAINER CRANES
Container cranes are typically transported on the S-class. The typical container cranes that are often
transported on the S-class vessels have a weight of 1300 tons each. Based on the dimensions of these
cranes, the S-class is capable of transporting a maximum of four cranes in a row. Since these cranes are
relatively light and contain a high VCG the capacity of the S-class is limited with the following rule of thumb
of 160000 t*m for the S-class. This means that for the S-class vessels the total weight of the cranes times
the average VCG measured from deck must be below 160000 t*m. It would be beneficial, if the cranes can
be transported in a fully extended situation, which means that the boom is situated as build which results in
the most optimum and client satisfying transport. Unfortunately, this results in a high VCG, which in this
situation approaches or overrules the weight VCG limit of the S-class. For this reason the VCG is lowered
by retracting the boom for two cranes or sometimes all cranes depending on crane design and transport
conditions. The lowering reconstruction of the cranes, results in increased costs for the client.
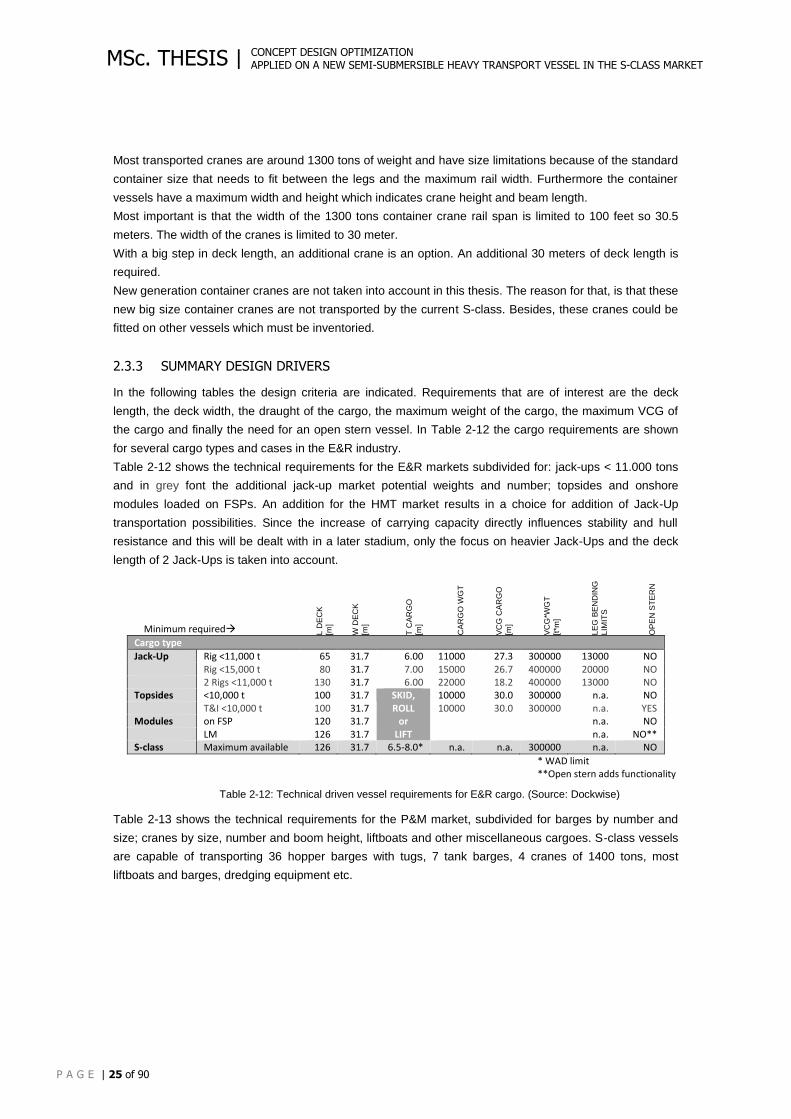
CONCEPT DESIGN OPTIMIZATION APPLIED ON A NEW SEMI-SUBMERSIBLE HEAVY TRANSPORT VESSEL IN THE S-CLASS MARKET
P A G E | 25 of 90
MSc. THESIS |
Most transported cranes are around 1300 tons of weight and have size limitations because of the standard
container size that needs to fit between the legs and the maximum rail width. Furthermore the container
vessels have a maximum width and height which indicates crane height and beam length.
Most important is that the width of the 1300 tons container crane rail span is limited to 100 feet so 30.5
meters. The width of the cranes is limited to 30 meter.
With a big step in deck length, an additional crane is an option. An additional 30 meters of deck length is
required.
New generation container cranes are not taken into account in this thesis. The reason for that, is that these
new big size container cranes are not transported by the current S-class. Besides, these cranes could be
fitted on other vessels which must be inventoried.
2.3.3 SUMMARY DESIGN DRIVERS
In the following tables the design criteria are indicated. Requirements that are of interest are the deck
length, the deck width, the draught of the cargo, the maximum weight of the cargo, the maximum VCG of
the cargo and finally the need for an open stern vessel. In Table 2-12 the cargo requirements are shown
for several cargo types and cases in the E&R industry.
Table 2-12 shows the technical requirements for the E&R markets subdivided for: jack-ups < 11.000 tons
and in grey font the additional jack-up market potential weights and number; topsides and onshore
modules loaded on FSPs. An addition for the HMT market results in a choice for addition of Jack-Up
transportation possibilities. Since the increase of carrying capacity directly influences stability and hull
resistance and this will be dealt with in a later stadium, only the focus on heavier Jack-Ups and the deck
length of 2 Jack-Ups is taken into account.
Minimum required L D
EC
K
[m]
W D
EC
K
[m]
T C
AR
GO
[m]
CA
RG
O W
GT
VC
G C
AR
GO
[m]
VC
G*W
GT
[t*m
]
LE
G B
EN
DIN
G
LIM
ITS
OP
EN
ST
ER
N
Cargo type
Jack-Up Rig <11,000 t 65 31.7 6.00 11000 27.3 300000 13000 NO Rig <15,000 t 80 31.7 7.00 15000 26.7 400000 20000 NO
2 Rigs <11,000 t 130 31.7 6.00 22000 18.2 400000 13000 NO Topsides <10,000 t 100 31.7 SKID,
ROLL or
LIFT
10000 30.0 300000 n.a. NO T&I <10,000 t 100 31.7 10000 30.0 300000 n.a. YES Modules on FSP 120 31.7 n.a. NO LM 126 31.7 n.a. NO** S-class Maximum available 126 31.7 6.5-8.0* n.a. n.a. 300000 n.a. NO
* WAD limit **Open stern adds functionality
Table 2-12: Technical driven vessel requirements for E&R cargo. (Source: Dockwise)
Table 2-13 shows the technical requirements for the P&M market, subdivided for barges by number and
size; cranes by size, number and boom height, liftboats and other miscellaneous cargoes. S-class vessels
are capable of transporting 36 hopper barges with tugs, 7 tank barges, 4 cranes of 1400 tons, most
liftboats and barges, dredging equipment etc.
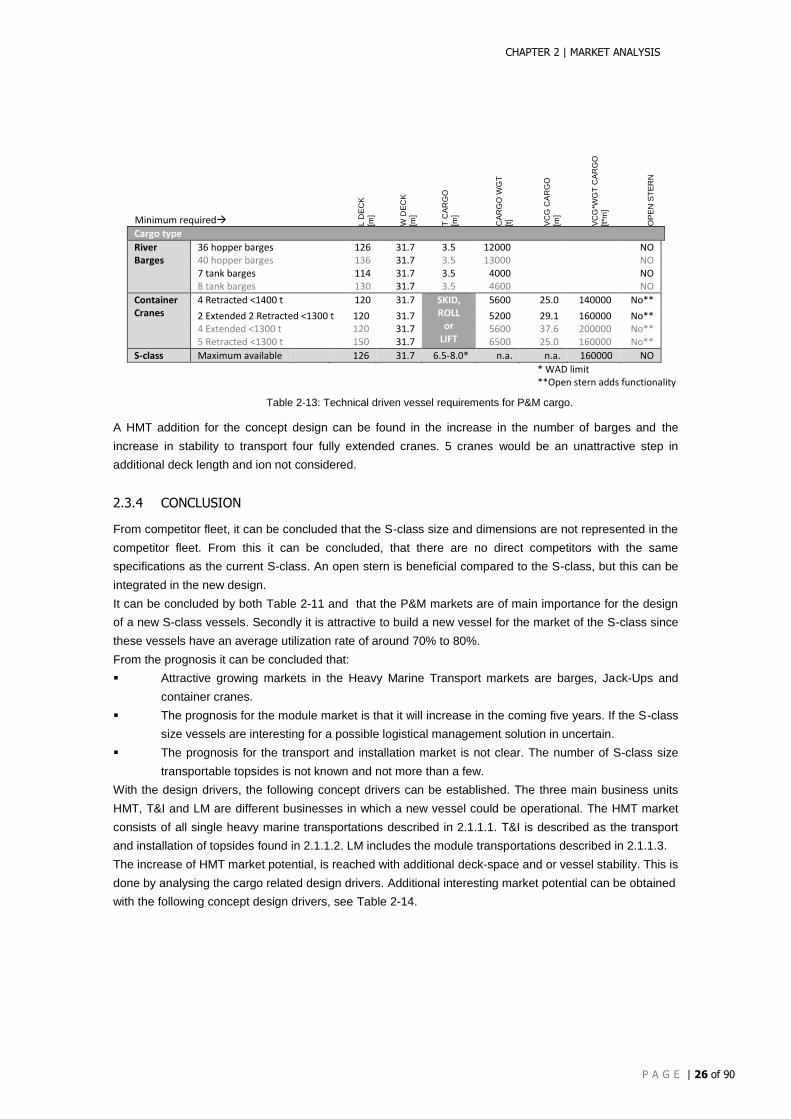
CHAPTER 2 | MARKET ANALYSIS
P A G E | 26 of 90
Minimum required L D
EC
K
[m]
W D
EC
K
[m]
T C
AR
GO
[m]
CA
RG
O W
GT
[t]
VC
G C
AR
GO
[m]
VC
G*W
GT
CA
RG
O
[t*m
]
OP
EN
ST
ER
N
Cargo type
River Barges
36 hopper barges 126 31.7 3.5 12000 NO 40 hopper barges 136 31.7 3.5 13000 NO 7 tank barges 114 31.7 3.5 4000 NO 8 tank barges 130 31.7 3.5 4600 NO
Container Cranes
4 Retracted <1400 t 120 31.7 SKID, ROLL
or LIFT
5600 25.0 140000 No**
2 Extended 2 Retracted <1300 t 120 31.7 5200 29.1 160000 No** 4 Extended <1300 t 120 31.7 5600 37.6 200000 No** 5 Retracted <1300 t 150 31.7 6500 25.0 160000 No**
S-class Maximum available 126 31.7 6.5-8.0* n.a. n.a. 160000 NO
* WAD limit **Open stern adds functionality
Table 2-13: Technical driven vessel requirements for P&M cargo.
A HMT addition for the concept design can be found in the increase in the number of barges and the
increase in stability to transport four fully extended cranes. 5 cranes would be an unattractive step in
additional deck length and ion not considered.
2.3.4 CONCLUSION
From competitor fleet, it can be concluded that the S-class size and dimensions are not represented in the
competitor fleet. From this it can be concluded, that there are no direct competitors with the same
specifications as the current S-class. An open stern is beneficial compared to the S-class, but this can be
integrated in the new design.
It can be concluded by both Table 2-11 and that the P&M markets are of main importance for the design
of a new S-class vessels. Secondly it is attractive to build a new vessel for the market of the S-class since
these vessels have an average utilization rate of around 70% to 80%.
From the prognosis it can be concluded that:
Attractive growing markets in the Heavy Marine Transport markets are barges, Jack-Ups and
container cranes.
The prognosis for the module market is that it will increase in the coming five years. If the S-class
size vessels are interesting for a possible logistical management solution in uncertain.
The prognosis for the transport and installation market is not clear. The number of S-class size
transportable topsides is not known and not more than a few.
With the design drivers, the following concept drivers can be established. The three main business units
HMT, T&I and LM are different businesses in which a new vessel could be operational. The HMT market
consists of all single heavy marine transportations described in 2.1.1.1. T&I is described as the transport
and installation of topsides found in 2.1.1.2. LM includes the module transportations described in 2.1.1.3.
The increase of HMT market potential, is reached with additional deck-space and or vessel stability. This is
done by analysing the cargo related design drivers. Additional interesting market potential can be obtained
with the following concept design drivers, see Table 2-14.
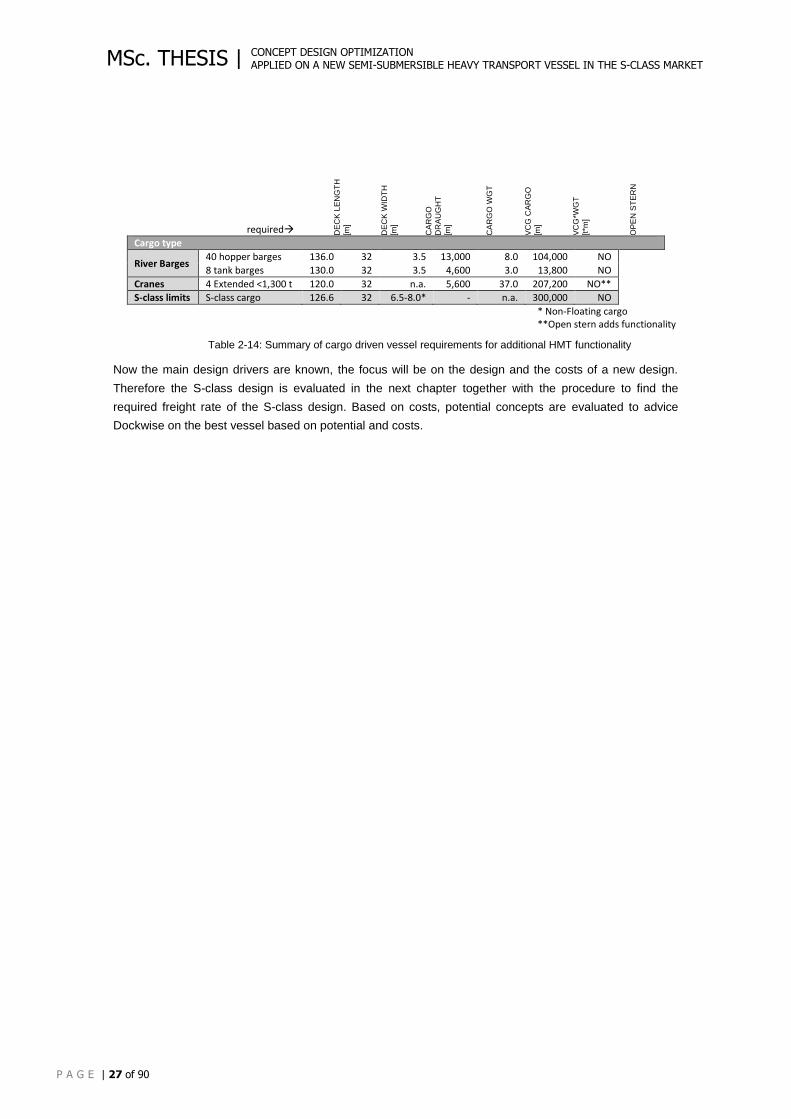
CONCEPT DESIGN OPTIMIZATION APPLIED ON A NEW SEMI-SUBMERSIBLE HEAVY TRANSPORT VESSEL IN THE S-CLASS MARKET
P A G E | 27 of 90
MSc. THESIS |
required DE
CK
LE
NG
TH
[m]
DE
CK
WID
TH
[m]
CA
RG
O
DR
AU
GH
T
[m]
CA
RG
O W
GT
VC
G C
AR
GO
[m]
VC
G*W
GT
[t*m
]
OP
EN
ST
ER
N
Cargo type
River Barges 40 hopper barges 136.0 32 3.5 13,000 8.0 104,000 NO
8 tank barges 130.0 32 3.5 4,600 3.0 13,800 NO
Cranes 4 Extended <1,300 t 120.0 32 n.a. 5,600 37.0 207,200 NO**
S-class limits S-class cargo 126.6 32 6.5-8.0* - n.a. 300,000 NO
* Non-Floating cargo **Open stern adds functionality
Table 2-14: Summary of cargo driven vessel requirements for additional HMT functionality
Now the main design drivers are known, the focus will be on the design and the costs of a new design.
Therefore the S-class design is evaluated in the next chapter together with the procedure to find the
required freight rate of the S-class design. Based on costs, potential concepts are evaluated to advice
Dockwise on the best vessel based on potential and costs.

CHAPTER 3 | MARKET ANALYSIS
P A G E | 28 of 90
- This page intentionally left blank -
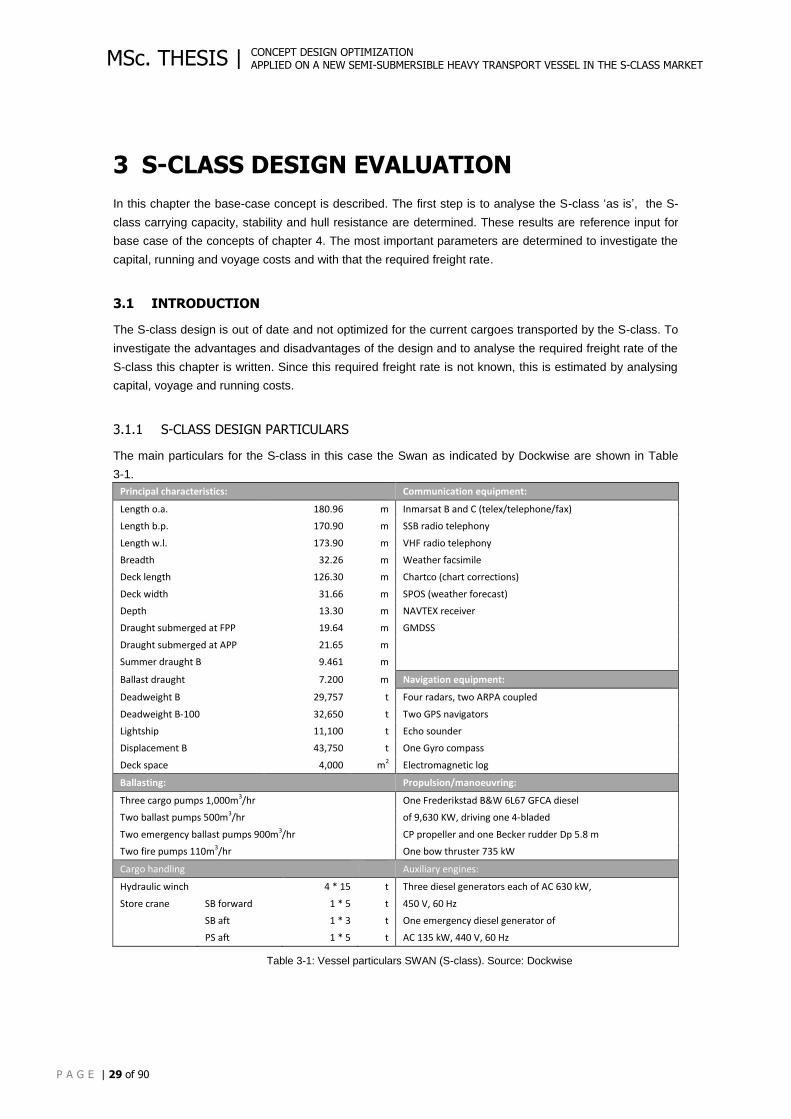
CONCEPT DESIGN OPTIMIZATION APPLIED ON A NEW SEMI-SUBMERSIBLE HEAVY TRANSPORT VESSEL IN THE S-CLASS MARKET
P A G E | 29 of 90
MSc. THESIS |
3 S-CLASS DESIGN EVALUATION
In this chapter the base-case concept is described. The first step is to analyse the S-class ‘as is’, the S-
class carrying capacity, stability and hull resistance are determined. These results are reference input for
base case of the concepts of chapter 4. The most important parameters are determined to investigate the
capital, running and voyage costs and with that the required freight rate.
3.1 INTRODUCTION
The S-class design is out of date and not optimized for the current cargoes transported by the S-class. To
investigate the advantages and disadvantages of the design and to analyse the required freight rate of the
S-class this chapter is written. Since this required freight rate is not known, this is estimated by analysing
capital, voyage and running costs.
3.1.1 S-CLASS DESIGN PARTICULARS
The main particulars for the S-class in this case the Swan as indicated by Dockwise are shown in Table
3-1.
Principal characteristics: Communication equipment:
Length o.a. 180.96 m Inmarsat B and C (telex/telephone/fax)
Length b.p. 170.90 m SSB radio telephony
Length w.l. 173.90 m VHF radio telephony
Breadth 32.26 m Weather facsimile
Deck length 126.30 m Chartco (chart corrections)
Deck width 31.66 m SPOS (weather forecast)
Depth 13.30 m NAVTEX receiver
Draught submerged at FPP 19.64 m GMDSS
Draught submerged at APP 21.65 m
Summer draught B 9.461 m
Ballast draught 7.200 m Navigation equipment:
Deadweight B 29,757 t Four radars, two ARPA coupled
Deadweight B-100 32,650 t Two GPS navigators
Lightship 11,100 t Echo sounder
Displacement B 43,750 t One Gyro compass
Deck space 4,000 m2 Electromagnetic log
Ballasting: Propulsion/manoeuvring:
Three cargo pumps 1,000m3/hr One Frederikstad B&W 6L67 GFCA diesel
Two ballast pumps 500m3/hr of 9,630 KW, driving one 4-bladed
Two emergency ballast pumps 900m3/hr CP propeller and one Becker rudder Dp 5.8 m
Two fire pumps 110m3/hr One bow thruster 735 kW
Cargo handling Auxiliary engines:
Hydraulic winch 4 * 15 t Three diesel generators each of AC 630 kW,
Store crane SB forward 1 * 5 t 450 V, 60 Hz
SB aft 1 * 3 t One emergency diesel generator of
PS aft 1 * 5 t AC 135 kW, 440 V, 60 Hz
Table 3-1: Vessel particulars SWAN (S-class). Source: Dockwise
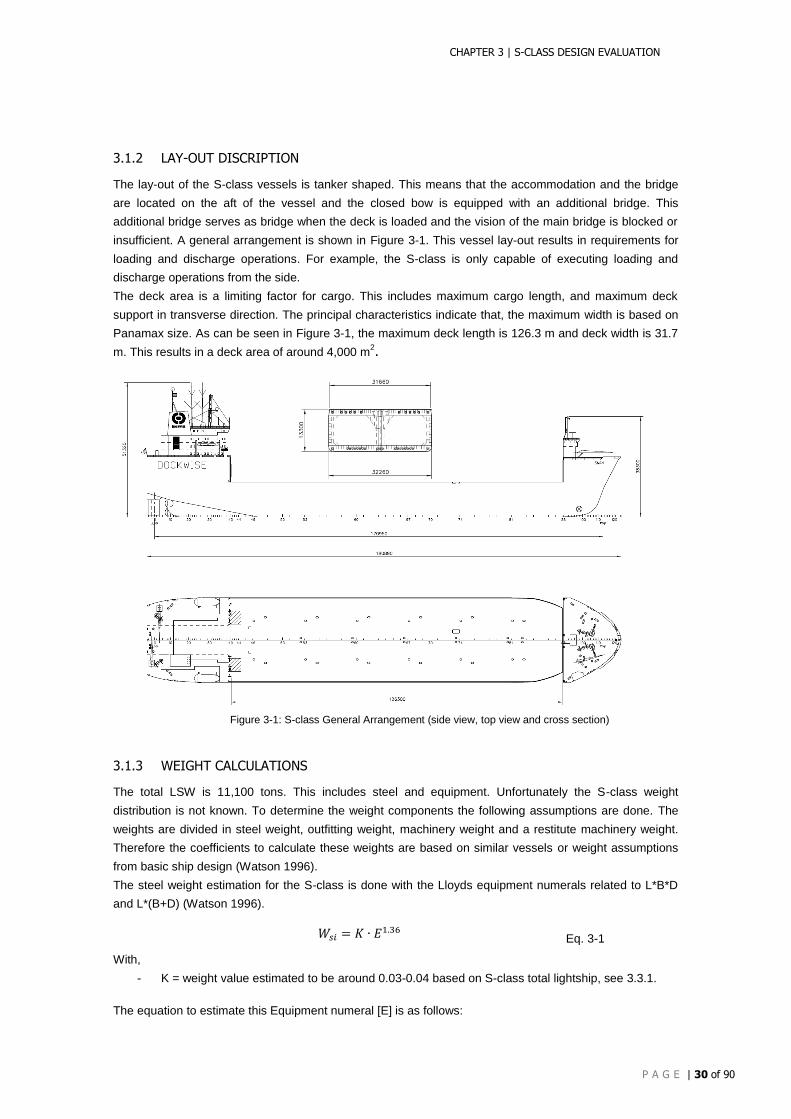
CHAPTER 3 | S-CLASS DESIGN EVALUATION
P A G E | 30 of 90
3.1.2 LAY-OUT DISCRIPTION
The lay-out of the S-class vessels is tanker shaped. This means that the accommodation and the bridge
are located on the aft of the vessel and the closed bow is equipped with an additional bridge. This
additional bridge serves as bridge when the deck is loaded and the vision of the main bridge is blocked or
insufficient. A general arrangement is shown in Figure 3-1. This vessel lay-out results in requirements for
loading and discharge operations. For example, the S-class is only capable of executing loading and
discharge operations from the side.
The deck area is a limiting factor for cargo. This includes maximum cargo length, and maximum deck
support in transverse direction. The principal characteristics indicate that, the maximum width is based on
Panamax size. As can be seen in Figure 3-1, the maximum deck length is 126.3 m and deck width is 31.7
m. This results in a deck area of around 4,000 m2.
Figure 3-1: S-class General Arrangement (side view, top view and cross section)
3.1.3 WEIGHT CALCULATIONS
The total LSW is 11,100 tons. This includes steel and equipment. Unfortunately the S-class weight
distribution is not known. To determine the weight components the following assumptions are done. The
weights are divided in steel weight, outfitting weight, machinery weight and a restitute machinery weight.
Therefore the coefficients to calculate these weights are based on similar vessels or weight assumptions
from basic ship design (Watson 1996).
The steel weight estimation for the S-class is done with the Lloyds equipment numerals related to L*B*D
and L*(B+D) (Watson 1996).
𝑊𝑠𝑖 = 𝐾 ∙ 𝐸1.36 Eq. 3-1
With,
- K = weight value estimated to be around 0.03-0.04 based on S-class total lightship, see 3.3.1.
The equation to estimate this Equipment numeral [E] is as follows:
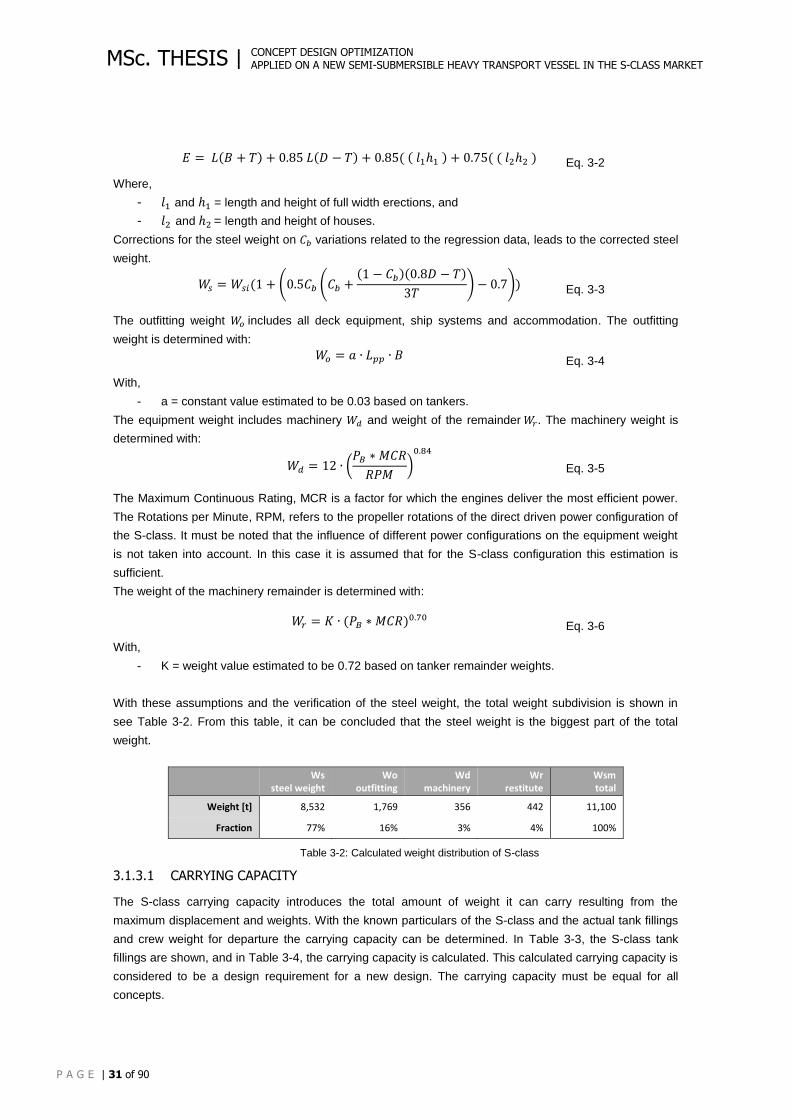
CONCEPT DESIGN OPTIMIZATION APPLIED ON A NEW SEMI-SUBMERSIBLE HEAVY TRANSPORT VESSEL IN THE S-CLASS MARKET
P A G E | 31 of 90
MSc. THESIS |
𝐸 = 𝐿(𝐵 + 𝑇) + 0.85 𝐿(𝐷 − 𝑇) + 0.85( ( 𝑙1ℎ1 ) + 0.75( ( 𝑙2ℎ2 ) Eq. 3-2
Where,
- 𝑙1 and ℎ1 = length and height of full width erections, and
- 𝑙2 and ℎ2 = length and height of houses.
Corrections for the steel weight on 𝐶𝑏 variations related to the regression data, leads to the corrected steel
weight.
𝑊𝑠 = 𝑊𝑠𝑖(1 + (0.5𝐶𝑏 (𝐶𝑏 +(1 − 𝐶𝑏)(0.8𝐷 − 𝑇)
3𝑇) − 0.7)) Eq. 3-3
The outfitting weight 𝑊𝑜 includes all deck equipment, ship systems and accommodation. The outfitting
weight is determined with:
𝑊𝑜 = 𝑎 ∙ 𝐿𝑝𝑝 ∙ 𝐵 Eq. 3-4
With,
- a = constant value estimated to be 0.03 based on tankers.
The equipment weight includes machinery 𝑊𝑑 and weight of the remainder 𝑊𝑟. The machinery weight is
determined with:
𝑊𝑑 = 12 ∙ (𝑃𝐵 ∗ 𝑀𝐶𝑅
𝑅𝑃𝑀)
0.84
Eq. 3-5
The Maximum Continuous Rating, MCR is a factor for which the engines deliver the most efficient power.
The Rotations per Minute, RPM, refers to the propeller rotations of the direct driven power configuration of
the S-class. It must be noted that the influence of different power configurations on the equipment weight
is not taken into account. In this case it is assumed that for the S-class configuration this estimation is
sufficient.
The weight of the machinery remainder is determined with:
𝑊𝑟 = 𝐾 ∙ (𝑃𝐵 ∗ 𝑀𝐶𝑅)0.70 Eq. 3-6
With,
- K = weight value estimated to be 0.72 based on tanker remainder weights.
With these assumptions and the verification of the steel weight, the total weight subdivision is shown in
see Table 3-2. From this table, it can be concluded that the steel weight is the biggest part of the total
weight.
Ws
steel weight Wo
outfitting Wd
machinery Wr
restitute Wsm total
Weight [t] 8,532 1,769 356 442 11,100
Fraction 77% 16% 3% 4% 100%
Table 3-2: Calculated weight distribution of S-class
3.1.3.1 CARRYING CAPACITY
The S-class carrying capacity introduces the total amount of weight it can carry resulting from the
maximum displacement and weights. With the known particulars of the S-class and the actual tank fillings
and crew weight for departure the carrying capacity can be determined. In Table 3-3, the S-class tank
fillings are shown, and in Table 3-4, the carrying capacity is calculated. This calculated carrying capacity is
considered to be a design requirement for a new design. The carrying capacity must be equal for all
concepts.
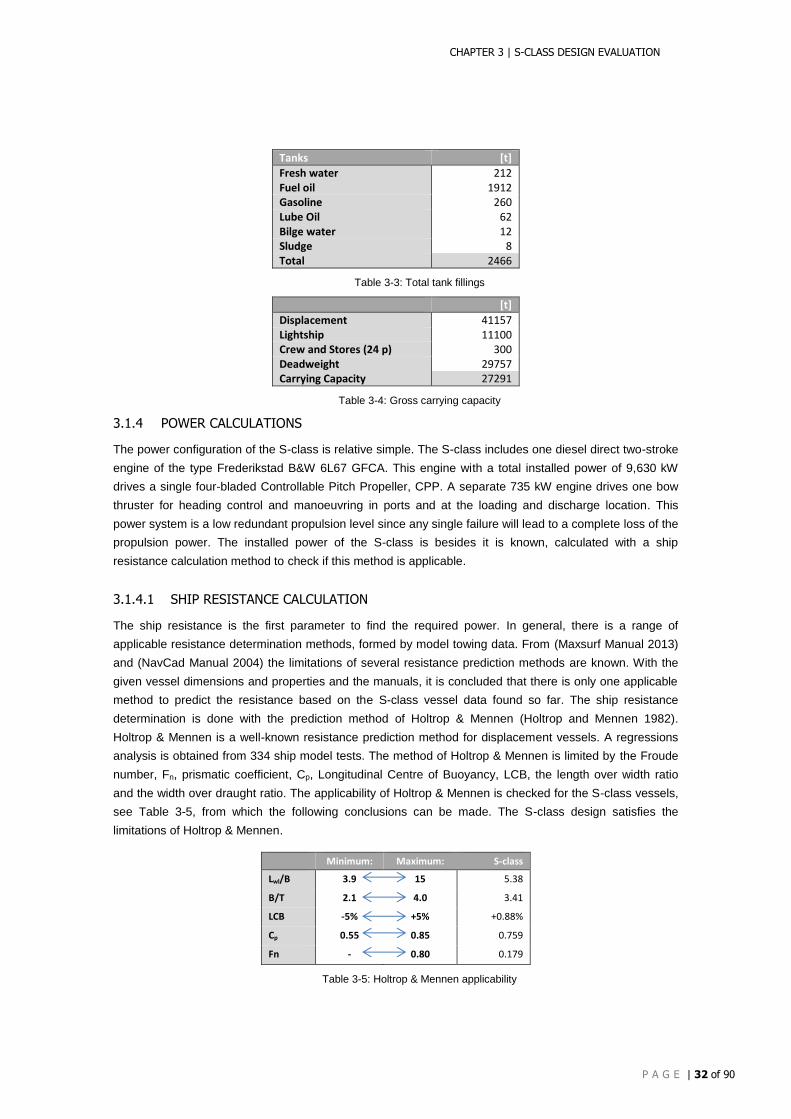
CHAPTER 3 | S-CLASS DESIGN EVALUATION
P A G E | 32 of 90
Tanks [t]
Fresh water 212 Fuel oil 1912 Gasoline 260 Lube Oil 62 Bilge water 12 Sludge 8 Total 2466
Table 3-3: Total tank fillings
[t]
Displacement 41157 Lightship 11100 Crew and Stores (24 p) 300 Deadweight 29757 Carrying Capacity 27291
Table 3-4: Gross carrying capacity
3.1.4 POWER CALCULATIONS
The power configuration of the S-class is relative simple. The S-class includes one diesel direct two-stroke
engine of the type Frederikstad B&W 6L67 GFCA. This engine with a total installed power of 9,630 kW
drives a single four-bladed Controllable Pitch Propeller, CPP. A separate 735 kW engine drives one bow
thruster for heading control and manoeuvring in ports and at the loading and discharge location. This
power system is a low redundant propulsion level since any single failure will lead to a complete loss of the
propulsion power. The installed power of the S-class is besides it is known, calculated with a ship
resistance calculation method to check if this method is applicable.
3.1.4.1 SHIP RESISTANCE CALCULATION
The ship resistance is the first parameter to find the required power. In general, there is a range of
applicable resistance determination methods, formed by model towing data. From (Maxsurf Manual 2013)
and (NavCad Manual 2004) the limitations of several resistance prediction methods are known. With the
given vessel dimensions and properties and the manuals, it is concluded that there is only one applicable
method to predict the resistance based on the S-class vessel data found so far. The ship resistance
determination is done with the prediction method of Holtrop & Mennen (Holtrop and Mennen 1982).
Holtrop & Mennen is a well-known resistance prediction method for displacement vessels. A regressions
analysis is obtained from 334 ship model tests. The method of Holtrop & Mennen is limited by the Froude
number, Fn, prismatic coefficient, Cp, Longitudinal Centre of Buoyancy, LCB, the length over width ratio
and the width over draught ratio. The applicability of Holtrop & Mennen is checked for the S-class vessels,
see Table 3-5, from which the following conclusions can be made. The S-class design satisfies the
limitations of Holtrop & Mennen.
Minimum: Maximum: S-class
Lwl/B 3.9 15 5.38
B/T 2.1 4.0 3.41
LCB -5% +5% +0.88%
Cp 0.55 0.85 0.759
Fn - 0.80 0.179
Table 3-5: Holtrop & Mennen applicability
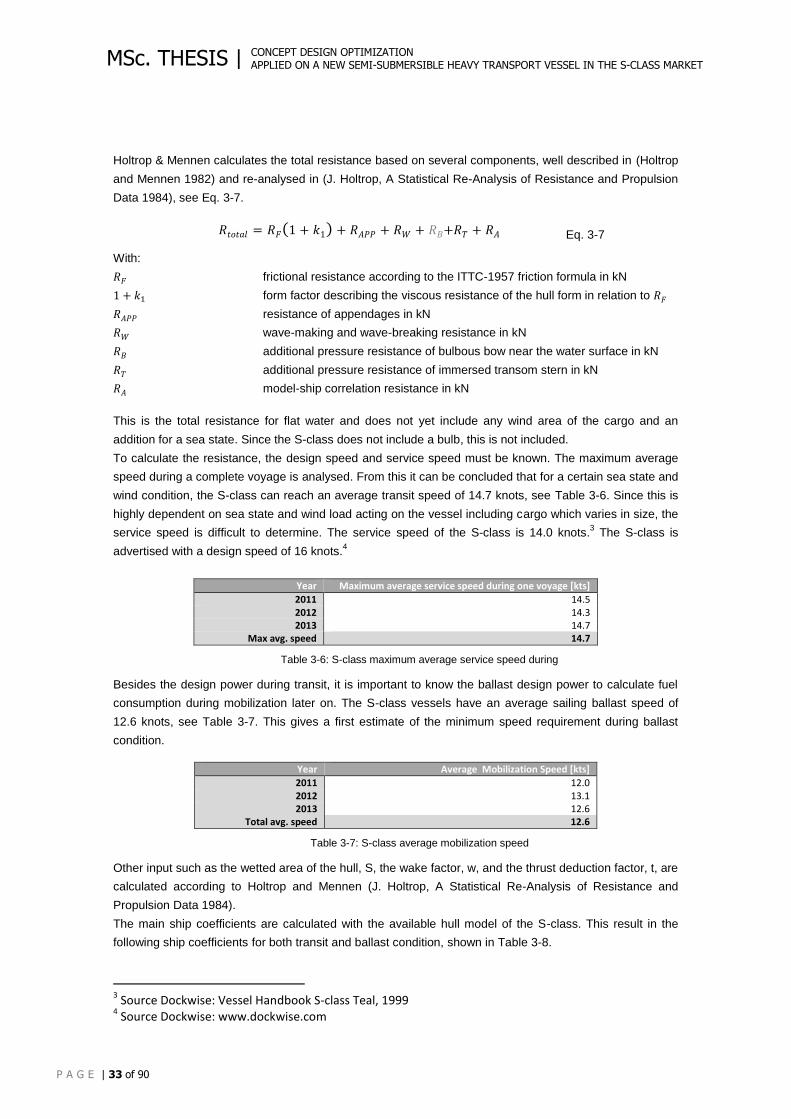
CONCEPT DESIGN OPTIMIZATION APPLIED ON A NEW SEMI-SUBMERSIBLE HEAVY TRANSPORT VESSEL IN THE S-CLASS MARKET
P A G E | 33 of 90
MSc. THESIS |
Holtrop & Mennen calculates the total resistance based on several components, well described in (Holtrop
and Mennen 1982) and re-analysed in (J. Holtrop, A Statistical Re-Analysis of Resistance and Propulsion
Data 1984), see Eq. 3-7.
𝑅𝑡𝑜𝑡𝑎𝑙 = 𝑅𝐹(1 + 𝑘1) + 𝑅𝐴𝑃𝑃 + 𝑅𝑊 + 𝑅𝐵+𝑅𝑇 + 𝑅𝐴 Eq. 3-7
With:
𝑅𝐹 frictional resistance according to the ITTC-1957 friction formula in kN
1 + 𝑘1 form factor describing the viscous resistance of the hull form in relation to 𝑅𝐹
𝑅𝐴𝑃𝑃 resistance of appendages in kN
𝑅𝑊 wave-making and wave-breaking resistance in kN
𝑅𝐵 additional pressure resistance of bulbous bow near the water surface in kN
𝑅𝑇 additional pressure resistance of immersed transom stern in kN
𝑅𝐴 model-ship correlation resistance in kN
This is the total resistance for flat water and does not yet include any wind area of the cargo and an
addition for a sea state. Since the S-class does not include a bulb, this is not included.
To calculate the resistance, the design speed and service speed must be known. The maximum average
speed during a complete voyage is analysed. From this it can be concluded that for a certain sea state and
wind condition, the S-class can reach an average transit speed of 14.7 knots, see Table 3-6. Since this is
highly dependent on sea state and wind load acting on the vessel including cargo which varies in size, the
service speed is difficult to determine. The service speed of the S-class is 14.0 knots.3 The S-class is
advertised with a design speed of 16 knots.4
Year Maximum average service speed during one voyage [kts]
2011 14.5 2012 14.3 2013 14.7
Max avg. speed 14.7
Table 3-6: S-class maximum average service speed during
Besides the design power during transit, it is important to know the ballast design power to calculate fuel
consumption during mobilization later on. The S-class vessels have an average sailing ballast speed of
12.6 knots, see Table 3-7. This gives a first estimate of the minimum speed requirement during ballast
condition.
Year Average Mobilization Speed [kts]
2011 12.0 2012 13.1 2013 12.6
Total avg. speed 12.6
Table 3-7: S-class average mobilization speed
Other input such as the wetted area of the hull, S, the wake factor, w, and the thrust deduction factor, t, are
calculated according to Holtrop and Mennen (J. Holtrop, A Statistical Re-Analysis of Resistance and
Propulsion Data 1984).
The main ship coefficients are calculated with the available hull model of the S-class. This result in the
following ship coefficients for both transit and ballast condition, shown in Table 3-8.
3 Source Dockwise: Vessel Handbook S-class Teal, 1999
4 Source Dockwise: www.dockwise.com
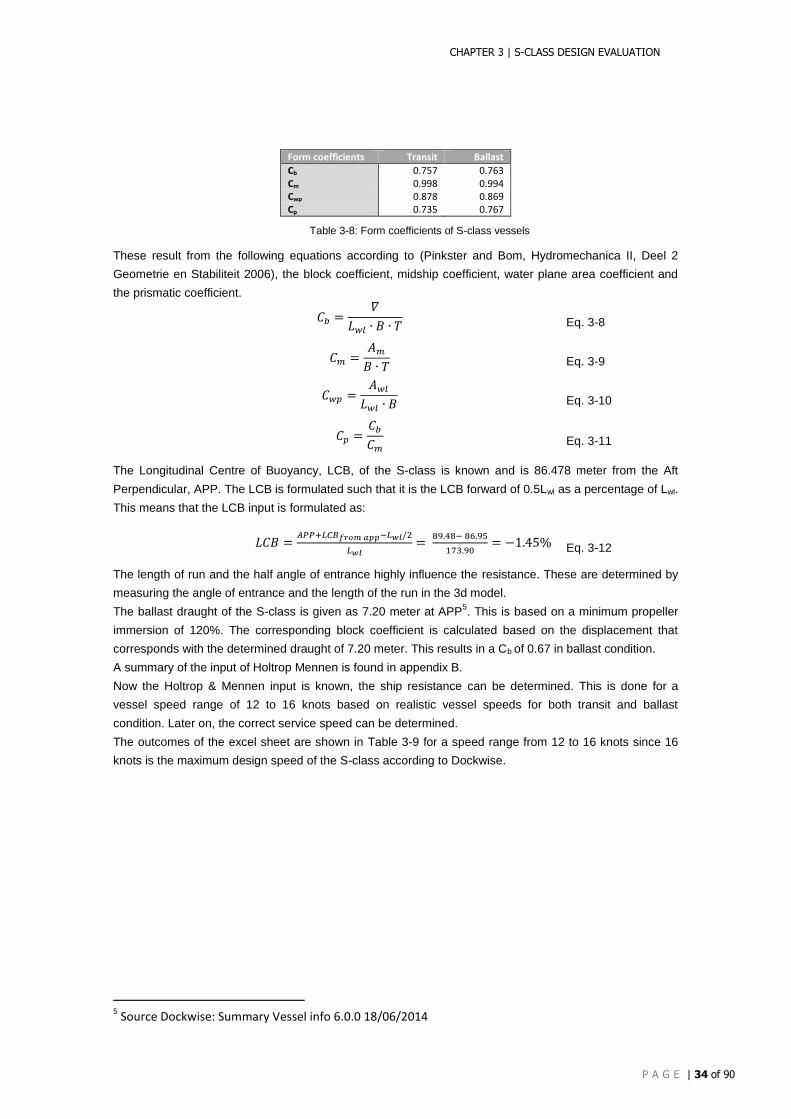
CHAPTER 3 | S-CLASS DESIGN EVALUATION
P A G E | 34 of 90
Form coefficients Transit Ballast
Cb 0.757 0.763 Cm 0.998 0.994 Cwp 0.878 0.869 Cp 0.735 0.767
Table 3-8: Form coefficients of S-class vessels
These result from the following equations according to (Pinkster and Bom, Hydromechanica II, Deel 2
Geometrie en Stabiliteit 2006), the block coefficient, midship coefficient, water plane area coefficient and
the prismatic coefficient.
𝐶𝑏 =𝛻
𝐿𝑤𝑙 ∙ 𝐵 ∙ 𝑇 Eq. 3-8
𝐶𝑚 =𝐴𝑚
𝐵 ∙ 𝑇 Eq. 3-9
𝐶𝑤𝑝 =𝐴𝑤𝑙
𝐿𝑤𝑙 ∙ 𝐵 Eq. 3-10
𝐶𝑝 =𝐶𝑏
𝐶𝑚
Eq. 3-11
The Longitudinal Centre of Buoyancy, LCB, of the S-class is known and is 86.478 meter from the Aft
Perpendicular, APP. The LCB is formulated such that it is the LCB forward of 0.5Lwl as a percentage of Lwl.
This means that the LCB input is formulated as:
𝐿𝐶𝐵 =𝐴𝑃𝑃+𝐿𝐶𝐵𝑓𝑟𝑜𝑚 𝑎𝑝𝑝−𝐿𝑤𝑙/2
𝐿𝑤𝑙=
89.48− 86.95
173.90= −1.45% Eq. 3-12
The length of run and the half angle of entrance highly influence the resistance. These are determined by
measuring the angle of entrance and the length of the run in the 3d model.
The ballast draught of the S-class is given as 7.20 meter at APP5. This is based on a minimum propeller
immersion of 120%. The corresponding block coefficient is calculated based on the displacement that
corresponds with the determined draught of 7.20 meter. This results in a Cb of 0.67 in ballast condition.
A summary of the input of Holtrop Mennen is found in appendix B.
Now the Holtrop & Mennen input is known, the ship resistance can be determined. This is done for a
vessel speed range of 12 to 16 knots based on realistic vessel speeds for both transit and ballast
condition. Later on, the correct service speed can be determined.
The outcomes of the excel sheet are shown in Table 3-9 for a speed range from 12 to 16 knots since 16
knots is the maximum design speed of the S-class according to Dockwise.
5 Source Dockwise: Summary Vessel info 6.0.0 18/06/2014
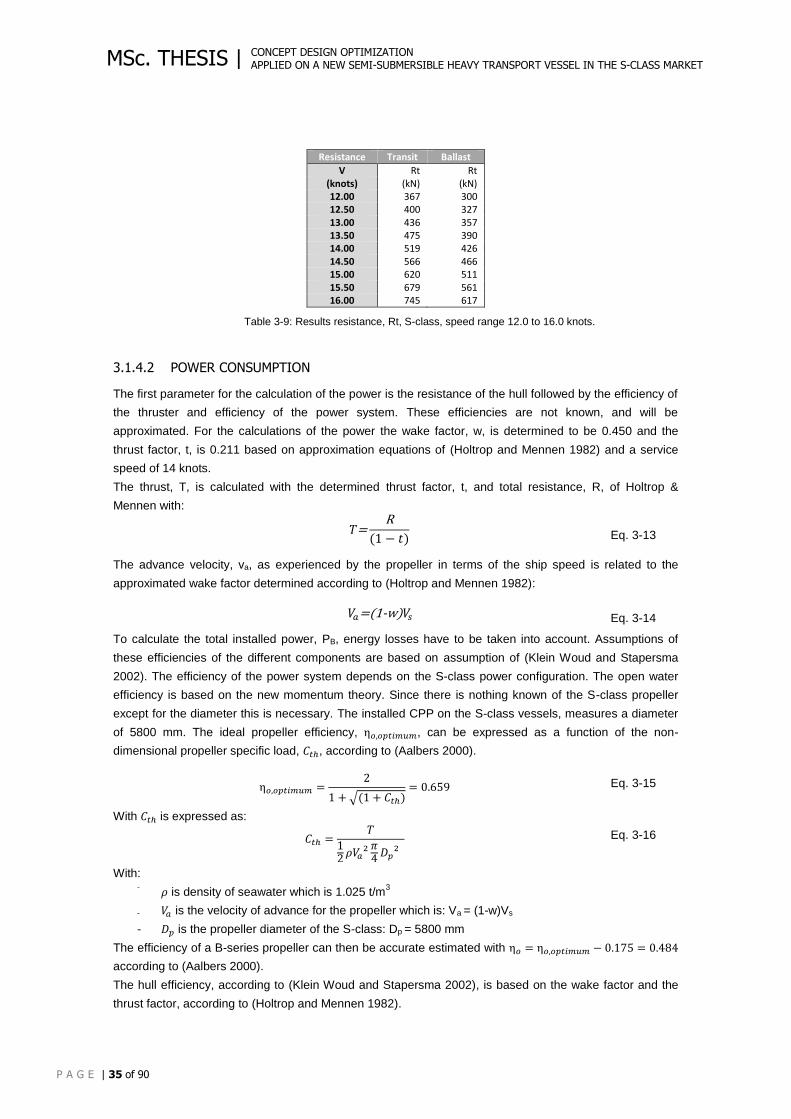
CONCEPT DESIGN OPTIMIZATION APPLIED ON A NEW SEMI-SUBMERSIBLE HEAVY TRANSPORT VESSEL IN THE S-CLASS MARKET
P A G E | 35 of 90
MSc. THESIS |
Resistance Transit Ballast
V Rt Rt (knots) (kN) (kN) 12.00 367 300 12.50 400 327 13.00 436 357 13.50 475 390 14.00 519 426 14.50 566 466 15.00 620 511 15.50 679 561 16.00 745 617
Table 3-9: Results resistance, Rt, S-class, speed range 12.0 to 16.0 knots.
3.1.4.2 POWER CONSUMPTION
The first parameter for the calculation of the power is the resistance of the hull followed by the efficiency of
the thruster and efficiency of the power system. These efficiencies are not known, and will be
approximated. For the calculations of the power the wake factor, w, is determined to be 0.450 and the
thrust factor, t, is 0.211 based on approximation equations of (Holtrop and Mennen 1982) and a service
speed of 14 knots.
The thrust, T, is calculated with the determined thrust factor, t, and total resistance, R, of Holtrop &
Mennen with:
𝑇=R
(1 − 𝑡) Eq. 3-13
The advance velocity, va, as experienced by the propeller in terms of the ship speed is related to the
approximated wake factor determined according to (Holtrop and Mennen 1982):
𝑉𝑎=(1-w)𝑉𝑠 Eq. 3-14
To calculate the total installed power, PB, energy losses have to be taken into account. Assumptions of
these efficiencies of the different components are based on assumption of (Klein Woud and Stapersma
2002). The efficiency of the power system depends on the S-class power configuration. The open water
efficiency is based on the new momentum theory. Since there is nothing known of the S-class propeller
except for the diameter this is necessary. The installed CPP on the S-class vessels, measures a diameter
of 5800 mm. The ideal propeller efficiency, η𝑜,𝑜𝑝𝑡𝑖𝑚𝑢𝑚, can be expressed as a function of the non-
dimensional propeller specific load, 𝐶𝑡ℎ, according to (Aalbers 2000).
η𝑜,𝑜𝑝𝑡𝑖𝑚𝑢𝑚 =2
1 + √(1 + 𝐶𝑡ℎ)= 0.659 Eq. 3-15
With 𝐶𝑡ℎ is expressed as:
𝐶𝑡ℎ =𝑇
12
𝜌𝑉𝑎2 𝜋
4𝐷𝑝
2 Eq. 3-16
With: - 𝜌 is density of seawater which is 1.025 t/m
3
- 𝑉𝑎 is the velocity of advance for the propeller which is: Va = (1-w)Vs
- 𝐷𝑝 is the propeller diameter of the S-class: Dp = 5800 mm
The efficiency of a B-series propeller can then be accurate estimated with η𝑜 = η𝑜,𝑜𝑝𝑡𝑖𝑚𝑢𝑚 − 0.175 = 0.484
according to (Aalbers 2000).
The hull efficiency, according to (Klein Woud and Stapersma 2002), is based on the wake factor and the
thrust factor, according to (Holtrop and Mennen 1982).
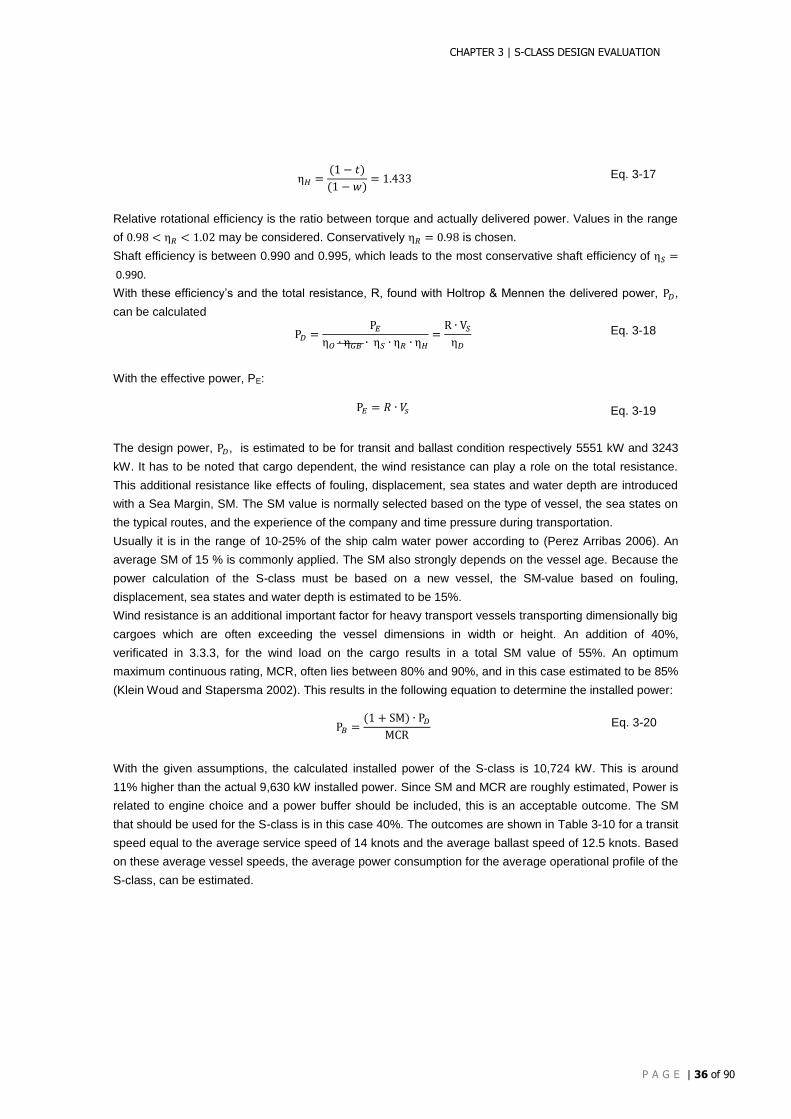
CHAPTER 3 | S-CLASS DESIGN EVALUATION
P A G E | 36 of 90
η𝐻 =(1 − 𝑡)
(1 − 𝑤)= 1.433 Eq. 3-17
Relative rotational efficiency is the ratio between torque and actually delivered power. Values in the range
of 0.98 < η𝑅 < 1.02 may be considered. Conservatively η𝑅 = 0.98 is chosen.
Shaft efficiency is between 0.990 and 0.995, which leads to the most conservative shaft efficiency of η𝑆 =
0.990.
With these efficiency’s and the total resistance, R, found with Holtrop & Mennen the delivered power, P𝐷,
can be calculated
P𝐷 =P𝐸
η𝑂 ∙ η𝐺𝐵 ∙ η𝑆 ∙ η𝑅 ∙ η𝐻=
R ∙ V𝑆
η𝐷 Eq. 3-18
With the effective power, PE:
P𝐸 = 𝑅 ∙ 𝑉𝑠 Eq. 3-19
The design power, P𝐷, is estimated to be for transit and ballast condition respectively 5551 kW and 3243
kW. It has to be noted that cargo dependent, the wind resistance can play a role on the total resistance.
This additional resistance like effects of fouling, displacement, sea states and water depth are introduced
with a Sea Margin, SM. The SM value is normally selected based on the type of vessel, the sea states on
the typical routes, and the experience of the company and time pressure during transportation.
Usually it is in the range of 10-25% of the ship calm water power according to (Perez Arribas 2006). An
average SM of 15 % is commonly applied. The SM also strongly depends on the vessel age. Because the
power calculation of the S-class must be based on a new vessel, the SM-value based on fouling,
displacement, sea states and water depth is estimated to be 15%.
Wind resistance is an additional important factor for heavy transport vessels transporting dimensionally big
cargoes which are often exceeding the vessel dimensions in width or height. An addition of 40%,
verificated in 3.3.3, for the wind load on the cargo results in a total SM value of 55%. An optimum
maximum continuous rating, MCR, often lies between 80% and 90%, and in this case estimated to be 85%
(Klein Woud and Stapersma 2002). This results in the following equation to determine the installed power:
P𝐵 =(1 + SM) ∙ P𝐷
MCR Eq. 3-20
With the given assumptions, the calculated installed power of the S-class is 10,724 kW. This is around
11% higher than the actual 9,630 kW installed power. Since SM and MCR are roughly estimated, Power is
related to engine choice and a power buffer should be included, this is an acceptable outcome. The SM
that should be used for the S-class is in this case 40%. The outcomes are shown in Table 3-10 for a transit
speed equal to the average service speed of 14 knots and the average ballast speed of 12.5 knots. Based
on these average vessel speeds, the average power consumption for the average operational profile of the
S-class, can be estimated.
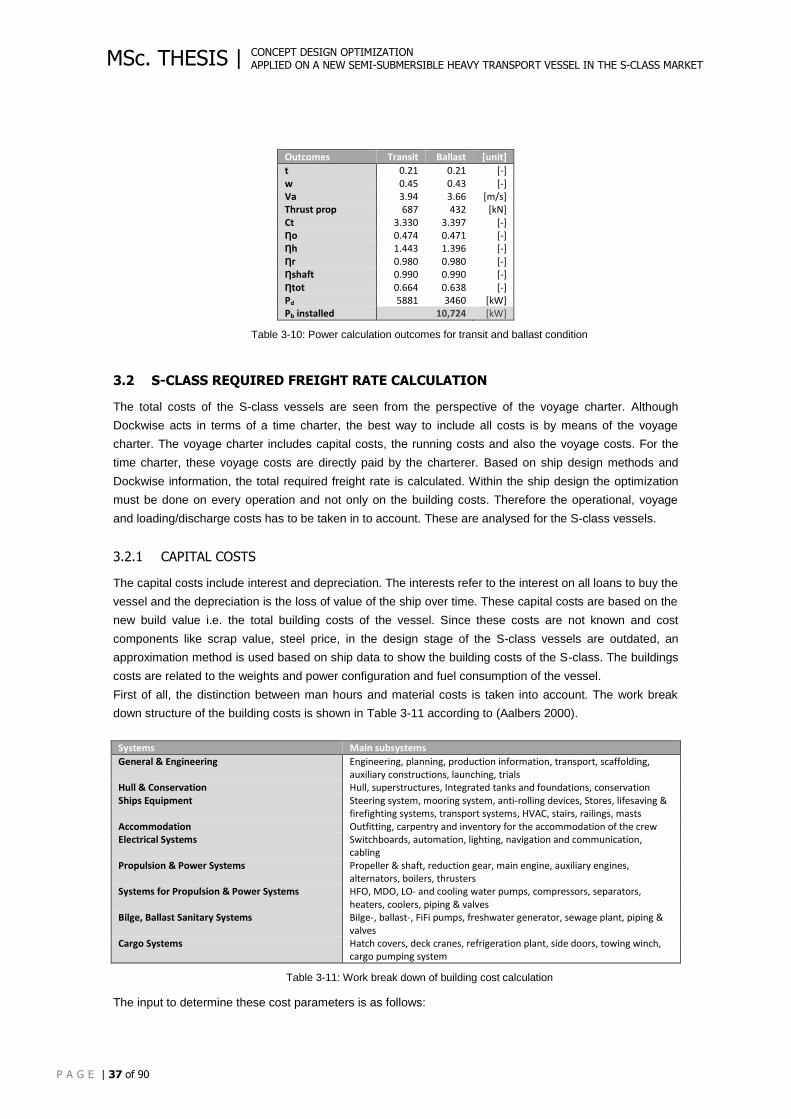
CONCEPT DESIGN OPTIMIZATION APPLIED ON A NEW SEMI-SUBMERSIBLE HEAVY TRANSPORT VESSEL IN THE S-CLASS MARKET
P A G E | 37 of 90
MSc. THESIS |
Outcomes Transit Ballast [unit]
t 0.21 0.21 [-] w 0.45 0.43 [-] Va 3.94 3.66 [m/s] Thrust prop 687 432 [kN] Ct 3.330 3.397 [-] Ƞo 0.474 0.471 [-] Ƞh 1.443 1.396 [-] Ƞr 0.980 0.980 [-] Ƞshaft 0.990 0.990 [-] Ƞtot 0.664 0.638 [-] Pd 5881 3460 [kW] Pb installed 10,724 [kW]
Table 3-10: Power calculation outcomes for transit and ballast condition
3.2 S-CLASS REQUIRED FREIGHT RATE CALCULATION
The total costs of the S-class vessels are seen from the perspective of the voyage charter. Although
Dockwise acts in terms of a time charter, the best way to include all costs is by means of the voyage
charter. The voyage charter includes capital costs, the running costs and also the voyage costs. For the
time charter, these voyage costs are directly paid by the charterer. Based on ship design methods and
Dockwise information, the total required freight rate is calculated. Within the ship design the optimization
must be done on every operation and not only on the building costs. Therefore the operational, voyage
and loading/discharge costs has to be taken in to account. These are analysed for the S-class vessels.
3.2.1 CAPITAL COSTS
The capital costs include interest and depreciation. The interests refer to the interest on all loans to buy the
vessel and the depreciation is the loss of value of the ship over time. These capital costs are based on the
new build value i.e. the total building costs of the vessel. Since these costs are not known and cost
components like scrap value, steel price, in the design stage of the S-class vessels are outdated, an
approximation method is used based on ship data to show the building costs of the S-class. The buildings
costs are related to the weights and power configuration and fuel consumption of the vessel.
First of all, the distinction between man hours and material costs is taken into account. The work break
down structure of the building costs is shown in Table 3-11 according to (Aalbers 2000).
Systems Main subsystems
General & Engineering Engineering, planning, production information, transport, scaffolding, auxiliary constructions, launching, trials
Hull & Conservation Hull, superstructures, Integrated tanks and foundations, conservation Ships Equipment Steering system, mooring system, anti-rolling devices, Stores, lifesaving &
firefighting systems, transport systems, HVAC, stairs, railings, masts Accommodation Outfitting, carpentry and inventory for the accommodation of the crew Electrical Systems Switchboards, automation, lighting, navigation and communication,
cabling Propulsion & Power Systems Propeller & shaft, reduction gear, main engine, auxiliary engines,
alternators, boilers, thrusters Systems for Propulsion & Power Systems HFO, MDO, LO- and cooling water pumps, compressors, separators,
heaters, coolers, piping & valves Bilge, Ballast Sanitary Systems Bilge-, ballast-, FiFi pumps, freshwater generator, sewage plant, piping &
valves Cargo Systems Hatch covers, deck cranes, refrigeration plant, side doors, towing winch,
cargo pumping system
Table 3-11: Work break down of building cost calculation
The input to determine these cost parameters is as follows:
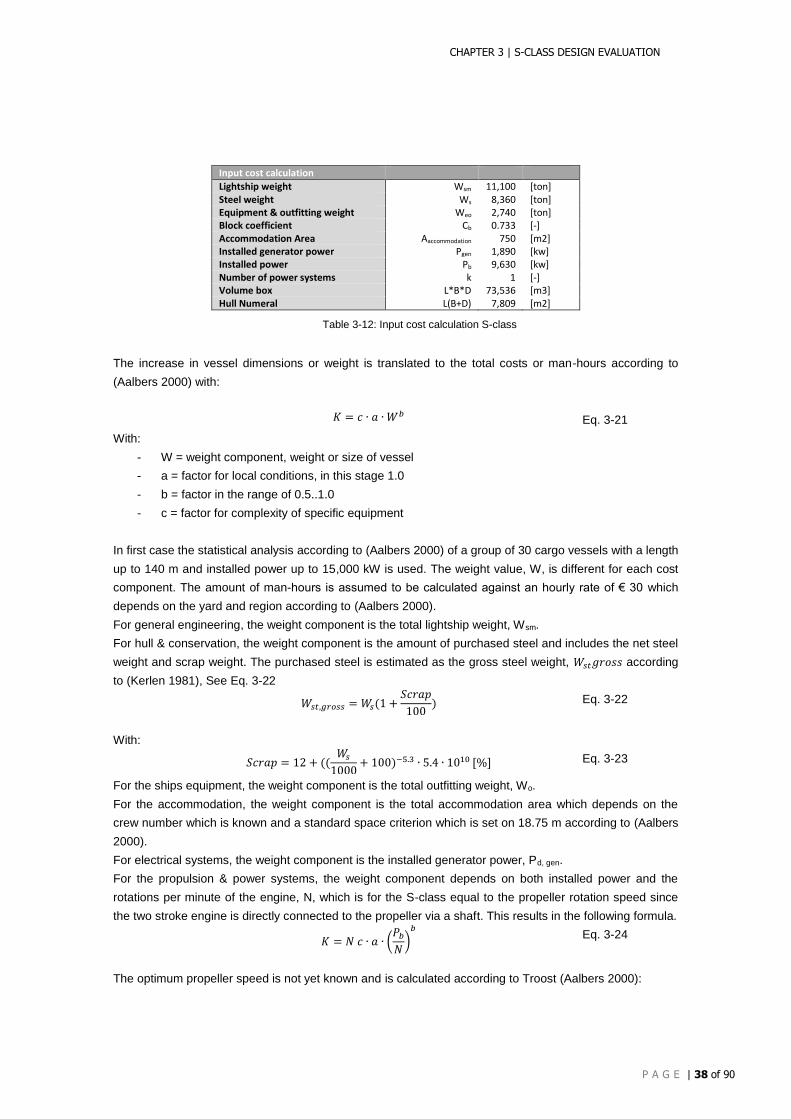
CHAPTER 3 | S-CLASS DESIGN EVALUATION
P A G E | 38 of 90
Input cost calculation
Lightship weight Wsm 11,100 [ton] Steel weight Ws 8,360 [ton] Equipment & outfitting weight Weo 2,740 [ton] Block coefficient Cb 0.733 [-] Accommodation Area Aaccommodation 750 [m2] Installed generator power Pgen 1,890 [kw] Installed power Pb 9,630 [kw] Number of power systems k 1 [-] Volume box L*B*D 73,536 [m3] Hull Numeral L(B+D) 7,809 [m2]
Table 3-12: Input cost calculation S-class
The increase in vessel dimensions or weight is translated to the total costs or man-hours according to
(Aalbers 2000) with:
𝐾 = 𝑐 ∙ 𝑎 ∙ 𝑊𝑏 Eq. 3-21
With:
- W = weight component, weight or size of vessel
- a = factor for local conditions, in this stage 1.0
- b = factor in the range of 0.5..1.0
- c = factor for complexity of specific equipment
In first case the statistical analysis according to (Aalbers 2000) of a group of 30 cargo vessels with a length
up to 140 m and installed power up to 15,000 kW is used. The weight value, W, is different for each cost
component. The amount of man-hours is assumed to be calculated against an hourly rate of € 30 which
depends on the yard and region according to (Aalbers 2000).
For general engineering, the weight component is the total lightship weight, Wsm.
For hull & conservation, the weight component is the amount of purchased steel and includes the net steel
weight and scrap weight. The purchased steel is estimated as the gross steel weight, 𝑊𝑠𝑡𝑔𝑟𝑜𝑠𝑠 according
to (Kerlen 1981), See Eq. 3-22
𝑊𝑠𝑡,𝑔𝑟𝑜𝑠𝑠 = 𝑊𝑠(1 +𝑆𝑐𝑟𝑎𝑝
100) Eq. 3-22
With:
𝑆𝑐𝑟𝑎𝑝 = 12 + ((𝑊𝑠
1000+ 100)−5.3 ∙ 5.4 ∙ 1010 [%] Eq. 3-23
For the ships equipment, the weight component is the total outfitting weight, Wo.
For the accommodation, the weight component is the total accommodation area which depends on the
crew number which is known and a standard space criterion which is set on 18.75 m according to (Aalbers
2000).
For electrical systems, the weight component is the installed generator power, Pd, gen.
For the propulsion & power systems, the weight component depends on both installed power and the
rotations per minute of the engine, N, which is for the S-class equal to the propeller rotation speed since
the two stroke engine is directly connected to the propeller via a shaft. This results in the following formula.
𝐾 = 𝑁 𝑐 ∙ 𝑎 ∙ (𝑃𝑏
𝑁)
𝑏
Eq. 3-24
The optimum propeller speed is not yet known and is calculated according to Troost (Aalbers 2000):
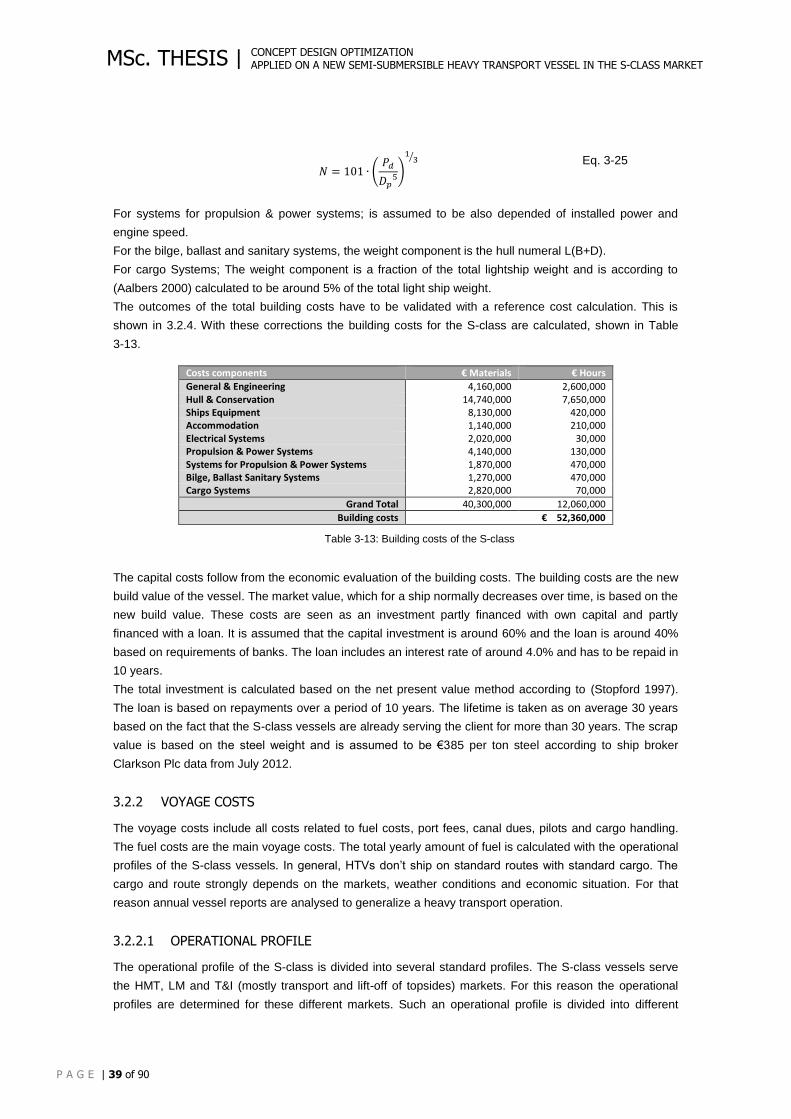
CONCEPT DESIGN OPTIMIZATION APPLIED ON A NEW SEMI-SUBMERSIBLE HEAVY TRANSPORT VESSEL IN THE S-CLASS MARKET
P A G E | 39 of 90
MSc. THESIS |
𝑁 = 101 ∙ (𝑃𝑑
𝐷𝑝5)
13⁄
Eq. 3-25
For systems for propulsion & power systems; is assumed to be also depended of installed power and
engine speed.
For the bilge, ballast and sanitary systems, the weight component is the hull numeral L(B+D).
For cargo Systems; The weight component is a fraction of the total lightship weight and is according to
(Aalbers 2000) calculated to be around 5% of the total light ship weight.
The outcomes of the total building costs have to be validated with a reference cost calculation. This is
shown in 3.2.4. With these corrections the building costs for the S-class are calculated, shown in Table
3-13.
Costs components € Materials € Hours
General & Engineering 4,160,000 2,600,000 Hull & Conservation 14,740,000 7,650,000 Ships Equipment 8,130,000 420,000 Accommodation 1,140,000 210,000 Electrical Systems 2,020,000 30,000 Propulsion & Power Systems 4,140,000 130,000 Systems for Propulsion & Power Systems 1,870,000 470,000 Bilge, Ballast Sanitary Systems 1,270,000 470,000 Cargo Systems 2,820,000 70,000
Grand Total 40,300,000 12,060,000
Building costs € 52,360,000
Table 3-13: Building costs of the S-class
The capital costs follow from the economic evaluation of the building costs. The building costs are the new
build value of the vessel. The market value, which for a ship normally decreases over time, is based on the
new build value. These costs are seen as an investment partly financed with own capital and partly
financed with a loan. It is assumed that the capital investment is around 60% and the loan is around 40%
based on requirements of banks. The loan includes an interest rate of around 4.0% and has to be repaid in
10 years.
The total investment is calculated based on the net present value method according to (Stopford 1997).
The loan is based on repayments over a period of 10 years. The lifetime is taken as on average 30 years
based on the fact that the S-class vessels are already serving the client for more than 30 years. The scrap
value is based on the steel weight and is assumed to be €385 per ton steel according to ship broker
Clarkson Plc data from July 2012.
3.2.2 VOYAGE COSTS
The voyage costs include all costs related to fuel costs, port fees, canal dues, pilots and cargo handling.
The fuel costs are the main voyage costs. The total yearly amount of fuel is calculated with the operational
profiles of the S-class vessels. In general, HTVs don’t ship on standard routes with standard cargo. The
cargo and route strongly depends on the markets, weather conditions and economic situation. For that
reason annual vessel reports are analysed to generalize a heavy transport operation.
3.2.2.1 OPERATIONAL PROFILE
The operational profile of the S-class is divided into several standard profiles. The S-class vessels serve
the HMT, LM and T&I (mostly transport and lift-off of topsides) markets. For this reason the operational
profiles are determined for these different markets. Such an operational profile is divided into different
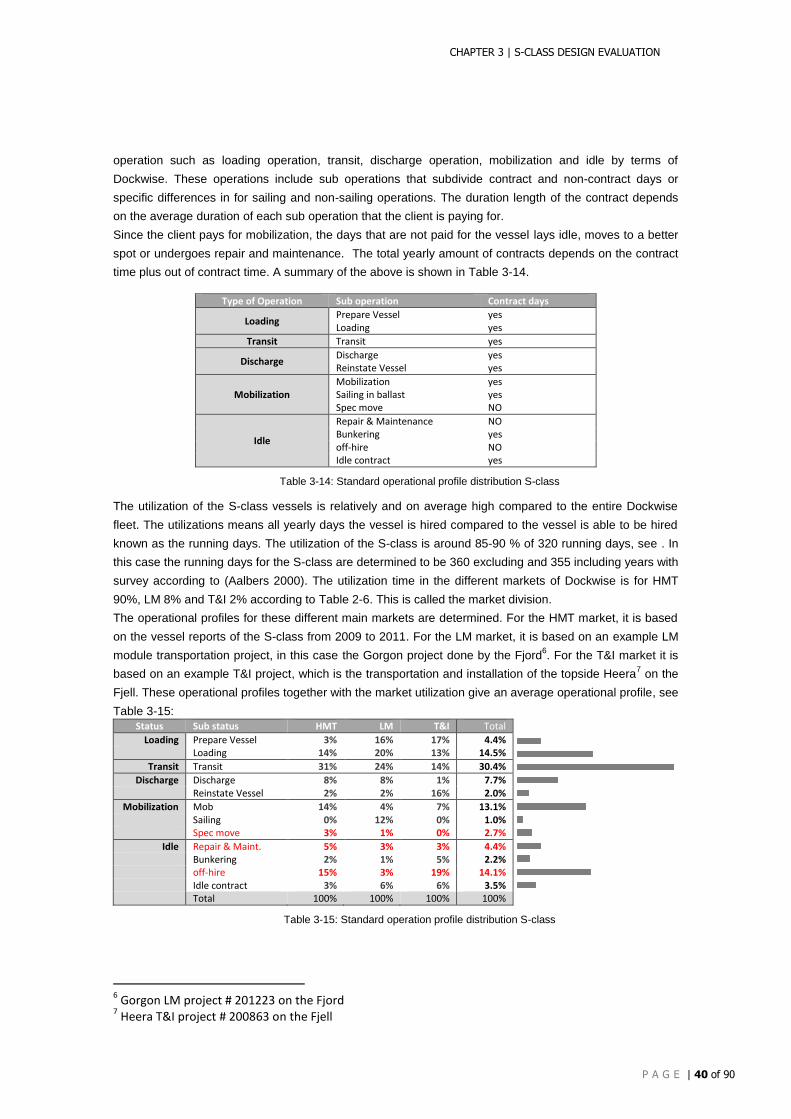
CHAPTER 3 | S-CLASS DESIGN EVALUATION
P A G E | 40 of 90
operation such as loading operation, transit, discharge operation, mobilization and idle by terms of
Dockwise. These operations include sub operations that subdivide contract and non-contract days or
specific differences in for sailing and non-sailing operations. The duration length of the contract depends
on the average duration of each sub operation that the client is paying for.
Since the client pays for mobilization, the days that are not paid for the vessel lays idle, moves to a better
spot or undergoes repair and maintenance. The total yearly amount of contracts depends on the contract
time plus out of contract time. A summary of the above is shown in Table 3-14.
Type of Operation Sub operation Contract days
Loading Prepare Vessel yes Loading yes
Transit Transit yes
Discharge Discharge yes Reinstate Vessel yes
Mobilization Mobilization yes Sailing in ballast yes Spec move NO
Idle
Repair & Maintenance NO Bunkering yes off-hire NO Idle contract yes
Table 3-14: Standard operational profile distribution S-class
The utilization of the S-class vessels is relatively and on average high compared to the entire Dockwise
fleet. The utilizations means all yearly days the vessel is hired compared to the vessel is able to be hired
known as the running days. The utilization of the S-class is around 85-90 % of 320 running days, see . In
this case the running days for the S-class are determined to be 360 excluding and 355 including years with
survey according to (Aalbers 2000). The utilization time in the different markets of Dockwise is for HMT
90%, LM 8% and T&I 2% according to Table 2-6. This is called the market division.
The operational profiles for these different main markets are determined. For the HMT market, it is based
on the vessel reports of the S-class from 2009 to 2011. For the LM market, it is based on an example LM
module transportation project, in this case the Gorgon project done by the Fjord6. For the T&I market it is
based on an example T&I project, which is the transportation and installation of the topside Heera7 on the
Fjell. These operational profiles together with the market utilization give an average operational profile, see
Table 3-15:
Status Sub status HMT LM T&I Total
Loading Prepare Vessel 3% 16% 17% 4.4% Loading 14% 20% 13% 14.5%
Transit Transit 31% 24% 14% 30.4%
Discharge Discharge 8% 8% 1% 7.7% Reinstate Vessel 2% 2% 16% 2.0%
Mobilization Mob 14% 4% 7% 13.1% Sailing 0% 12% 0% 1.0% Spec move 3% 1% 0% 2.7%
Idle Repair & Maint. 5% 3% 3% 4.4% Bunkering 2% 1% 5% 2.2%
off-hire 15% 3% 19% 14.1% Idle contract 3% 6% 6% 3.5% Total 100% 100% 100% 100%
Table 3-15: Standard operation profile distribution S-class
6 Gorgon LM project # 201223 on the Fjord
7 Heera T&I project # 200863 on the Fjell
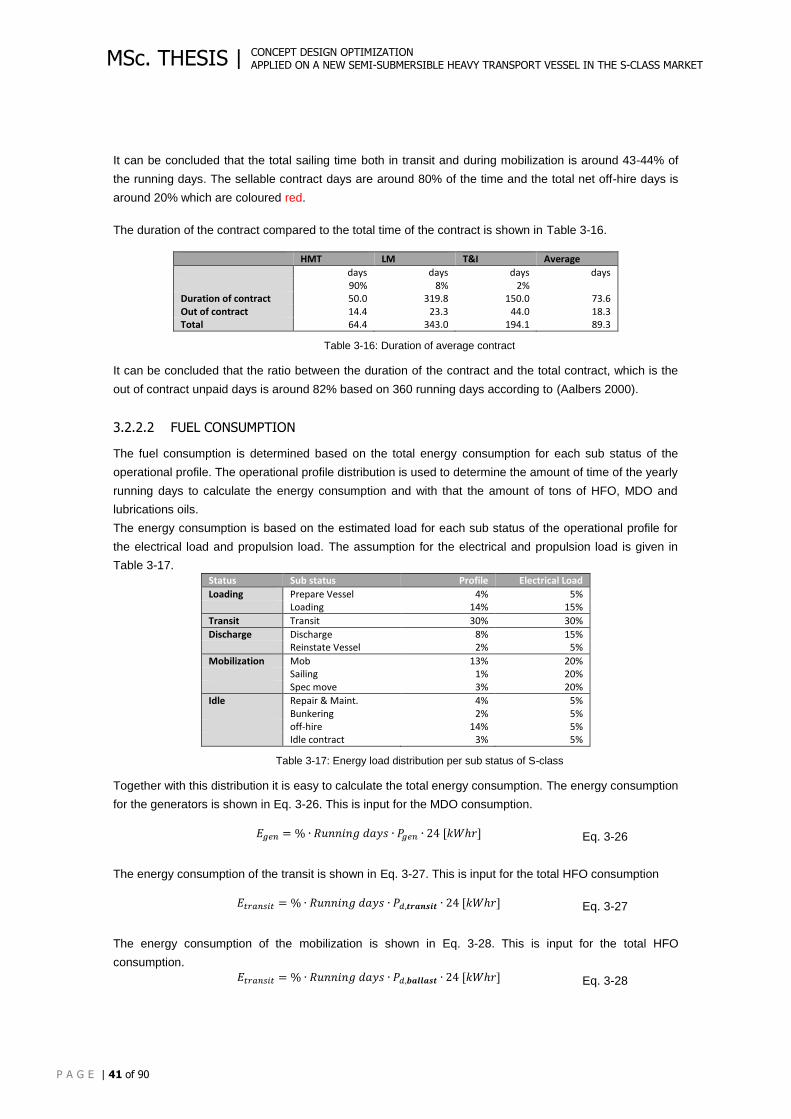
CONCEPT DESIGN OPTIMIZATION APPLIED ON A NEW SEMI-SUBMERSIBLE HEAVY TRANSPORT VESSEL IN THE S-CLASS MARKET
P A G E | 41 of 90
MSc. THESIS |
It can be concluded that the total sailing time both in transit and during mobilization is around 43-44% of
the running days. The sellable contract days are around 80% of the time and the total net off-hire days is
around 20% which are coloured red.
The duration of the contract compared to the total time of the contract is shown in Table 3-16.
HMT LM T&I Average
days days days days 90% 8% 2% Duration of contract 50.0 319.8 150.0 73.6 Out of contract 14.4 23.3 44.0 18.3 Total 64.4 343.0 194.1 89.3
Table 3-16: Duration of average contract
It can be concluded that the ratio between the duration of the contract and the total contract, which is the
out of contract unpaid days is around 82% based on 360 running days according to (Aalbers 2000).
3.2.2.2 FUEL CONSUMPTION
The fuel consumption is determined based on the total energy consumption for each sub status of the
operational profile. The operational profile distribution is used to determine the amount of time of the yearly
running days to calculate the energy consumption and with that the amount of tons of HFO, MDO and
lubrications oils.
The energy consumption is based on the estimated load for each sub status of the operational profile for
the electrical load and propulsion load. The assumption for the electrical and propulsion load is given in
Table 3-17.
Status Sub status Profile Electrical Load
Loading Prepare Vessel 4% 5% Loading 14% 15%
Transit Transit 30% 30%
Discharge Discharge 8% 15% Reinstate Vessel 2% 5%
Mobilization Mob 13% 20% Sailing 1% 20% Spec move 3% 20%
Idle Repair & Maint. 4% 5% Bunkering 2% 5% off-hire 14% 5% Idle contract 3% 5%
Table 3-17: Energy load distribution per sub status of S-class
Together with this distribution it is easy to calculate the total energy consumption. The energy consumption
for the generators is shown in Eq. 3-26. This is input for the MDO consumption.
𝐸𝑔𝑒𝑛 = % ∙ 𝑅𝑢𝑛𝑛𝑖𝑛𝑔 𝑑𝑎𝑦𝑠 ∙ 𝑃𝑔𝑒𝑛 ∙ 24 [𝑘𝑊ℎ𝑟] Eq. 3-26
The energy consumption of the transit is shown in Eq. 3-27. This is input for the total HFO consumption
𝐸𝑡𝑟𝑎𝑛𝑠𝑖𝑡 = % ∙ 𝑅𝑢𝑛𝑛𝑖𝑛𝑔 𝑑𝑎𝑦𝑠 ∙ 𝑃𝑑,𝒕𝒓𝒂𝒏𝒔𝒊𝒕 ∙ 24 [𝑘𝑊ℎ𝑟] Eq. 3-27
The energy consumption of the mobilization is shown in Eq. 3-28. This is input for the total HFO
consumption.
𝐸𝑡𝑟𝑎𝑛𝑠𝑖𝑡 = % ∙ 𝑅𝑢𝑛𝑛𝑖𝑛𝑔 𝑑𝑎𝑦𝑠 ∙ 𝑃𝑑,𝒃𝒂𝒍𝒍𝒂𝒔𝒕 ∙ 24 [𝑘𝑊ℎ𝑟] Eq. 3-28
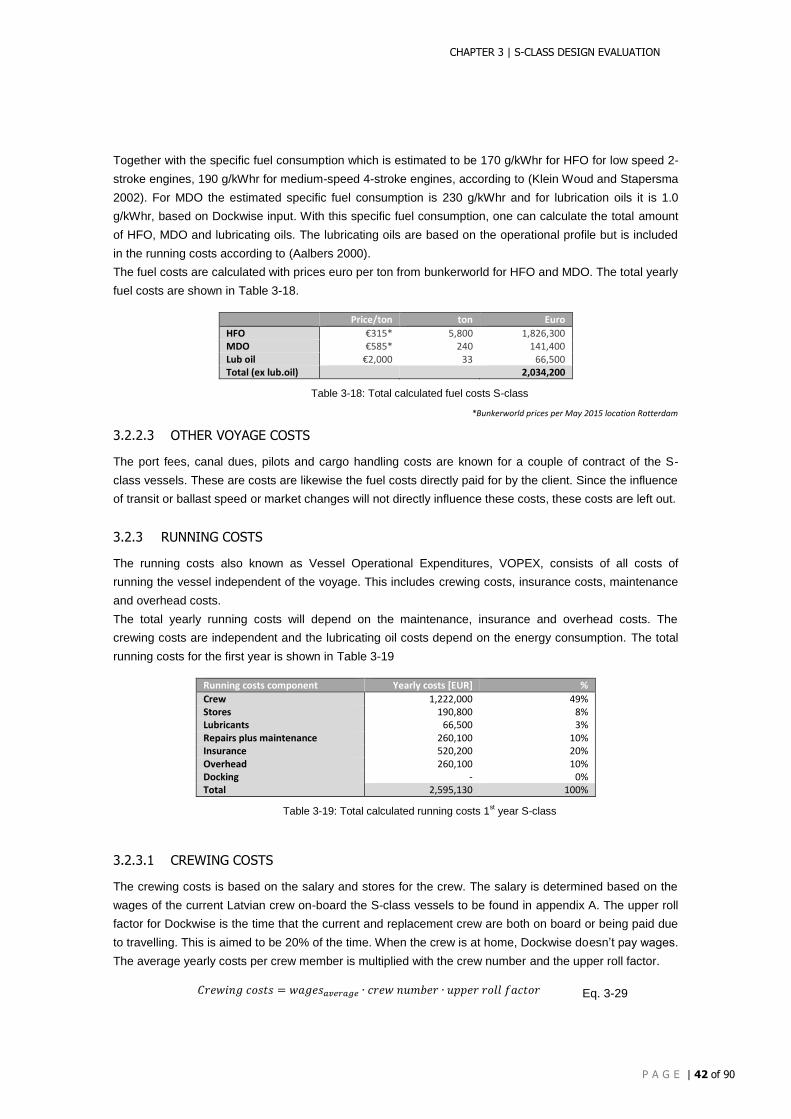
CHAPTER 3 | S-CLASS DESIGN EVALUATION
P A G E | 42 of 90
Together with the specific fuel consumption which is estimated to be 170 g/kWhr for HFO for low speed 2-
stroke engines, 190 g/kWhr for medium-speed 4-stroke engines, according to (Klein Woud and Stapersma
2002). For MDO the estimated specific fuel consumption is 230 g/kWhr and for lubrication oils it is 1.0
g/kWhr, based on Dockwise input. With this specific fuel consumption, one can calculate the total amount
of HFO, MDO and lubricating oils. The lubricating oils are based on the operational profile but is included
in the running costs according to (Aalbers 2000).
The fuel costs are calculated with prices euro per ton from bunkerworld for HFO and MDO. The total yearly
fuel costs are shown in Table 3-18.
Price/ton ton Euro
HFO €315* 5,800 1,826,300 MDO €585* 240 141,400 Lub oil €2,000 33 66,500 Total (ex lub.oil)
2,034,200
Table 3-18: Total calculated fuel costs S-class
*Bunkerworld prices per May 2015 location Rotterdam
3.2.2.3 OTHER VOYAGE COSTS
The port fees, canal dues, pilots and cargo handling costs are known for a couple of contract of the S-
class vessels. These are costs are likewise the fuel costs directly paid for by the client. Since the influence
of transit or ballast speed or market changes will not directly influence these costs, these costs are left out.
3.2.3 RUNNING COSTS
The running costs also known as Vessel Operational Expenditures, VOPEX, consists of all costs of
running the vessel independent of the voyage. This includes crewing costs, insurance costs, maintenance
and overhead costs.
The total yearly running costs will depend on the maintenance, insurance and overhead costs. The
crewing costs are independent and the lubricating oil costs depend on the energy consumption. The total
running costs for the first year is shown in Table 3-19
Running costs component Yearly costs [EUR] %
Crew 1,222,000 49% Stores 190,800 8% Lubricants 66,500 3% Repairs plus maintenance 260,100 10% Insurance 520,200 20% Overhead 260,100 10% Docking - 0% Total 2,595,130 100%
Table 3-19: Total calculated running costs 1st year S-class
3.2.3.1 CREWING COSTS
The crewing costs is based on the salary and stores for the crew. The salary is determined based on the
wages of the current Latvian crew on-board the S-class vessels to be found in appendix A. The upper roll
factor for Dockwise is the time that the current and replacement crew are both on board or being paid due
to travelling. This is aimed to be 20% of the time. When the crew is at home, Dockwise doesn’t pay wages.
The average yearly costs per crew member is multiplied with the crew number and the upper roll factor.
𝐶𝑟𝑒𝑤𝑖𝑛𝑔 𝑐𝑜𝑠𝑡𝑠 = 𝑤𝑎𝑔𝑒𝑠𝑎𝑣𝑒𝑟𝑎𝑔𝑒 ∙ 𝑐𝑟𝑒𝑤 𝑛𝑢𝑚𝑏𝑒𝑟 ∙ 𝑢𝑝𝑝𝑒𝑟 𝑟𝑜𝑙𝑙 𝑓𝑎𝑐𝑡𝑜𝑟 Eq. 3-29
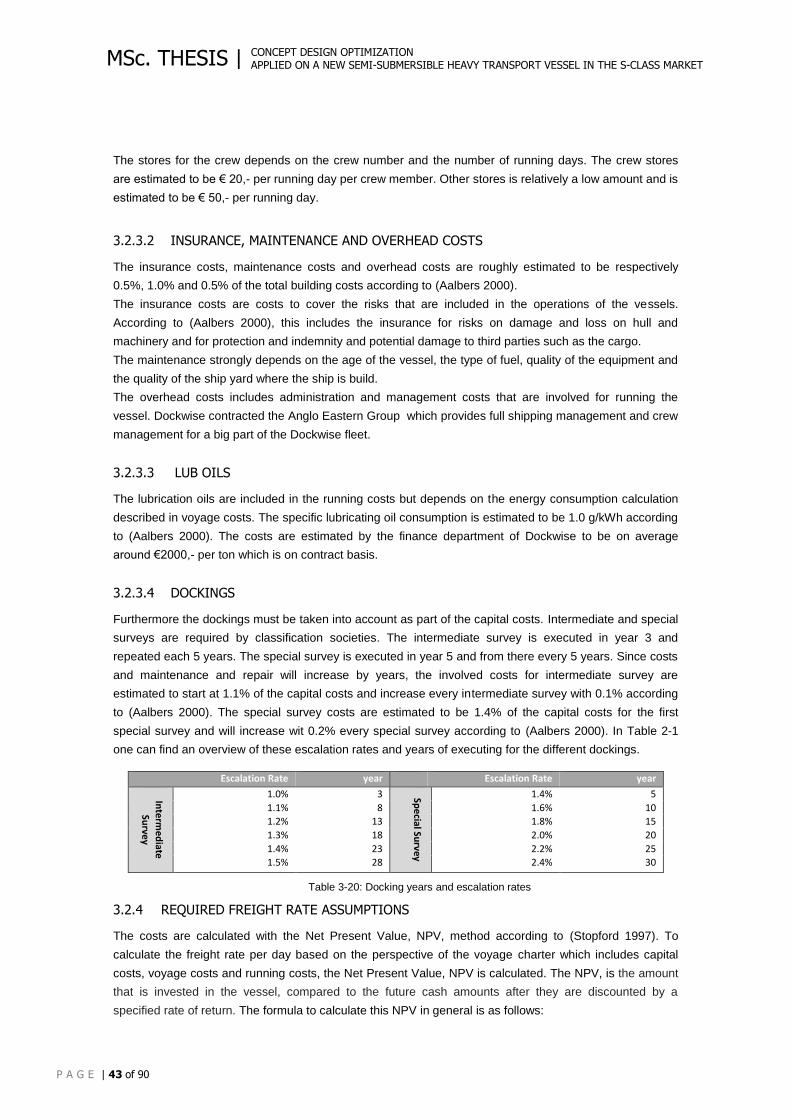
CONCEPT DESIGN OPTIMIZATION APPLIED ON A NEW SEMI-SUBMERSIBLE HEAVY TRANSPORT VESSEL IN THE S-CLASS MARKET
P A G E | 43 of 90
MSc. THESIS |
The stores for the crew depends on the crew number and the number of running days. The crew stores
are estimated to be € 20,- per running day per crew member. Other stores is relatively a low amount and is
estimated to be € 50,- per running day.
3.2.3.2 INSURANCE, MAINTENANCE AND OVERHEAD COSTS
The insurance costs, maintenance costs and overhead costs are roughly estimated to be respectively
0.5%, 1.0% and 0.5% of the total building costs according to (Aalbers 2000).
The insurance costs are costs to cover the risks that are included in the operations of the vessels.
According to (Aalbers 2000), this includes the insurance for risks on damage and loss on hull and
machinery and for protection and indemnity and potential damage to third parties such as the cargo.
The maintenance strongly depends on the age of the vessel, the type of fuel, quality of the equipment and
the quality of the ship yard where the ship is build.
The overhead costs includes administration and management costs that are involved for running the
vessel. Dockwise contracted the Anglo Eastern Group which provides full shipping management and crew
management for a big part of the Dockwise fleet.
3.2.3.3 LUB OILS
The lubrication oils are included in the running costs but depends on the energy consumption calculation
described in voyage costs. The specific lubricating oil consumption is estimated to be 1.0 g/kWh according
to (Aalbers 2000). The costs are estimated by the finance department of Dockwise to be on average
around €2000,- per ton which is on contract basis.
3.2.3.4 DOCKINGS
Furthermore the dockings must be taken into account as part of the capital costs. Intermediate and special
surveys are required by classification societies. The intermediate survey is executed in year 3 and
repeated each 5 years. The special survey is executed in year 5 and from there every 5 years. Since costs
and maintenance and repair will increase by years, the involved costs for intermediate survey are
estimated to start at 1.1% of the capital costs and increase every intermediate survey with 0.1% according
to (Aalbers 2000). The special survey costs are estimated to be 1.4% of the capital costs for the first
special survey and will increase wit 0.2% every special survey according to (Aalbers 2000). In Table 2-1
one can find an overview of these escalation rates and years of executing for the different dockings.
Escalation Rate year Escalation Rate year
Inte
rme
diate
Surve
y
1.0% 3 Spe
cial Survey
1.4% 5
1.1% 8 1.6% 10
1.2% 13 1.8% 15
1.3% 18 2.0% 20
1.4% 23 2.2% 25
1.5% 28 2.4% 30
Table 3-20: Docking years and escalation rates
3.2.4 REQUIRED FREIGHT RATE ASSUMPTIONS
The costs are calculated with the Net Present Value, NPV, method according to (Stopford 1997). To
calculate the freight rate per day based on the perspective of the voyage charter which includes capital
costs, voyage costs and running costs, the Net Present Value, NPV is calculated. The NPV, is the amount
that is invested in the vessel, compared to the future cash amounts after they are discounted by a
specified rate of return. The formula to calculate this NPV in general is as follows:
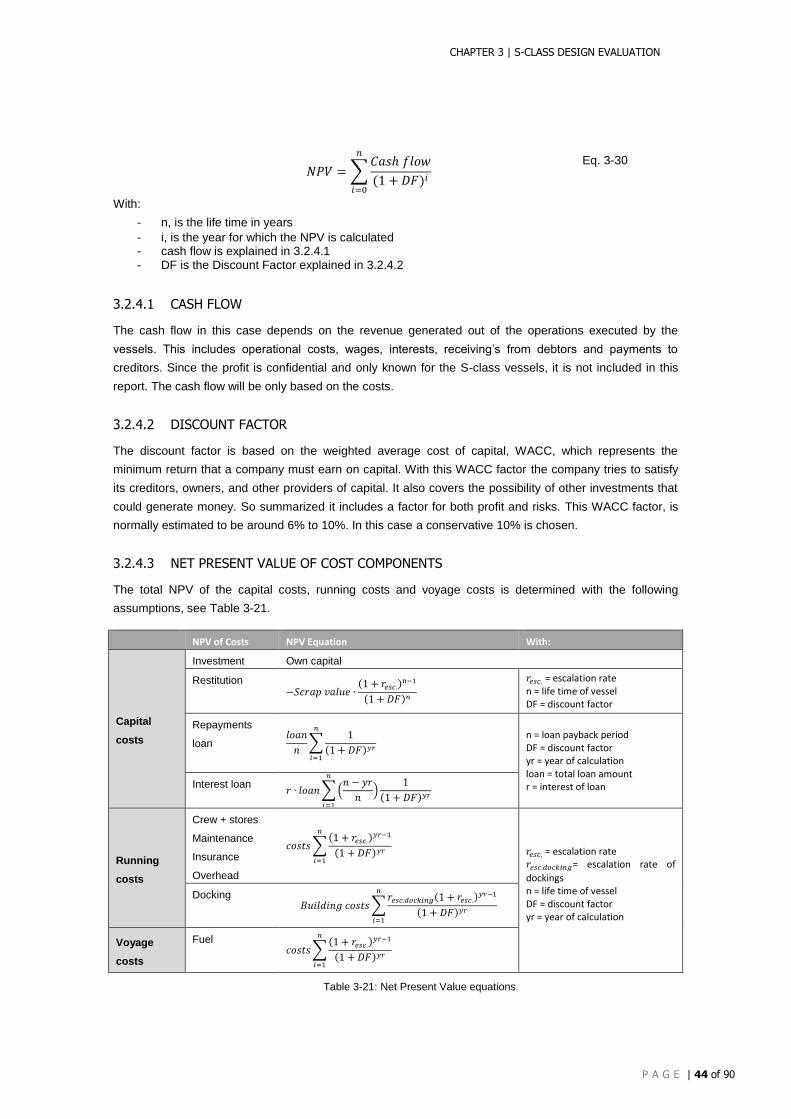
CHAPTER 3 | S-CLASS DESIGN EVALUATION
P A G E | 44 of 90
𝑁𝑃𝑉 = ∑𝐶𝑎𝑠ℎ 𝑓𝑙𝑜𝑤
(1 + 𝐷𝐹)𝑖
𝑛
𝑖=0
Eq. 3-30
With:
- n, is the life time in years
- i, is the year for which the NPV is calculated - cash flow is explained in 3.2.4.1 - DF is the Discount Factor explained in 3.2.4.2
3.2.4.1 CASH FLOW
The cash flow in this case depends on the revenue generated out of the operations executed by the
vessels. This includes operational costs, wages, interests, receiving’s from debtors and payments to
creditors. Since the profit is confidential and only known for the S-class vessels, it is not included in this
report. The cash flow will be only based on the costs.
3.2.4.2 DISCOUNT FACTOR
The discount factor is based on the weighted average cost of capital, WACC, which represents the
minimum return that a company must earn on capital. With this WACC factor the company tries to satisfy
its creditors, owners, and other providers of capital. It also covers the possibility of other investments that
could generate money. So summarized it includes a factor for both profit and risks. This WACC factor, is
normally estimated to be around 6% to 10%. In this case a conservative 10% is chosen.
3.2.4.3 NET PRESENT VALUE OF COST COMPONENTS
The total NPV of the capital costs, running costs and voyage costs is determined with the following
assumptions, see Table 3-21.
NPV of Costs NPV Equation With:
Capital
costs
Investment Own capital
Restitution
−𝑆𝑐𝑟𝑎𝑝 𝑣𝑎𝑙𝑢𝑒 ∙(1 + 𝑟𝑒𝑠𝑐.)
n−1
(1 + 𝐷𝐹)𝑛
𝑟𝑒𝑠𝑐. = escalation rate n = life time of vessel DF = discount factor
Repayments
loan 𝑙𝑜𝑎𝑛
𝑛∑
1
(1 + 𝐷𝐹)𝑦𝑟
𝑛
𝑖=1
n = loan payback period DF = discount factor yr = year of calculation loan = total loan amount r = interest of loan Interest loan
𝑟 ∙ 𝑙𝑜𝑎𝑛 ∑ (𝑛 − 𝑦𝑟
𝑛)
1
(1 + 𝐷𝐹)𝑦𝑟
𝑛
𝑖=1
Running
costs
Crew + stores
Maintenance
Insurance
Overhead
𝑐𝑜𝑠𝑡𝑠 ∑(1 + 𝑟𝑒𝑠𝑐.)
𝑦𝑟−1
(1 + 𝐷𝐹)𝑦𝑟
𝑛
𝑖=1
𝑟𝑒𝑠𝑐. = escalation rate 𝑟𝑒𝑠𝑐.𝑑𝑜𝑐𝑘𝑖𝑛𝑔= escalation rate of
dockings n = life time of vessel DF = discount factor yr = year of calculation
Docking
𝐵𝑢𝑖𝑙𝑑𝑖𝑛𝑔 𝑐𝑜𝑠𝑡𝑠 ∑𝑟𝑒𝑠𝑐.𝑑𝑜𝑐𝑘𝑖𝑛𝑔(1 + 𝑟𝑒𝑠𝑐.)
𝑦𝑟−1
(1 + 𝐷𝐹)𝑦𝑟
𝑛
𝑖=1
Voyage
costs
Fuel
𝑐𝑜𝑠𝑡𝑠 ∑(1 + 𝑟𝑒𝑠𝑐.)
𝑦𝑟−1
(1 + 𝐷𝐹)𝑦𝑟
𝑛
𝑖=1
Table 3-21: Net Present Value equations
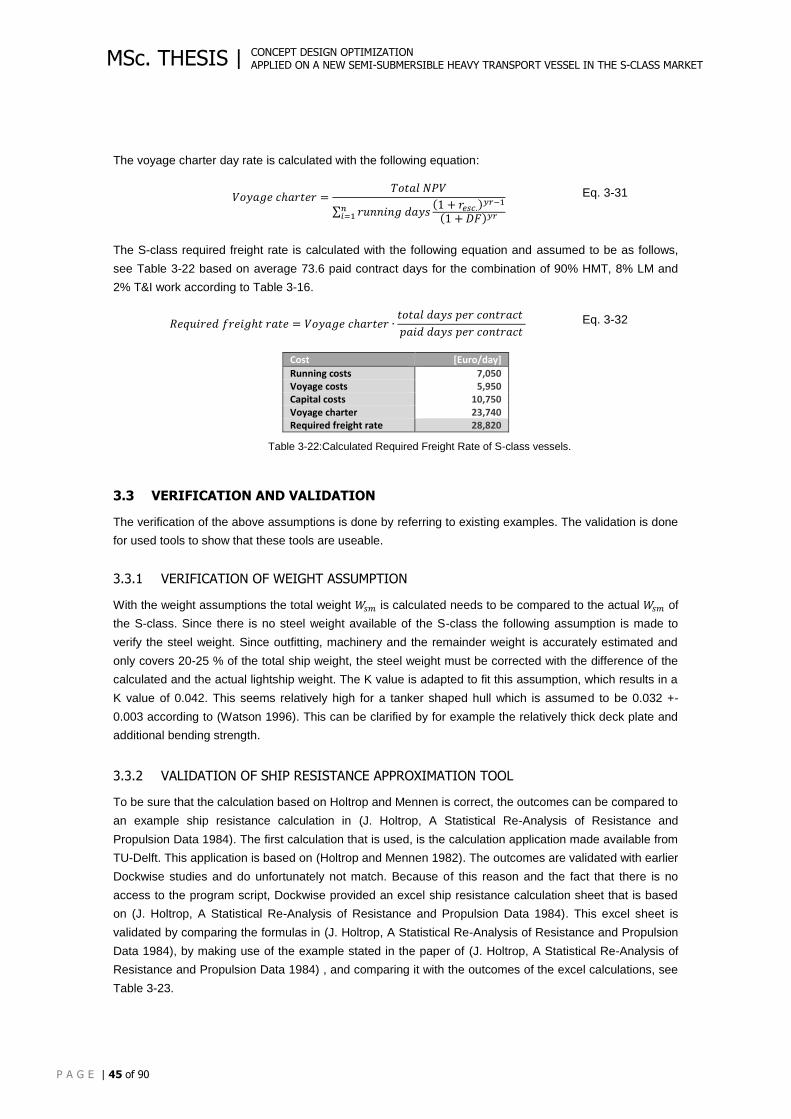
CONCEPT DESIGN OPTIMIZATION APPLIED ON A NEW SEMI-SUBMERSIBLE HEAVY TRANSPORT VESSEL IN THE S-CLASS MARKET
P A G E | 45 of 90
MSc. THESIS |
The voyage charter day rate is calculated with the following equation:
𝑉𝑜𝑦𝑎𝑔𝑒 𝑐ℎ𝑎𝑟𝑡𝑒𝑟 =𝑇𝑜𝑡𝑎𝑙 𝑁𝑃𝑉
∑ 𝑟𝑢𝑛𝑛𝑖𝑛𝑔 𝑑𝑎𝑦𝑠(1 + 𝑟𝑒𝑠𝑐.)
𝑦𝑟−1
(1 + 𝐷𝐹)𝑦𝑟𝑛𝑖=1
Eq. 3-31
The S-class required freight rate is calculated with the following equation and assumed to be as follows,
see Table 3-22 based on average 73.6 paid contract days for the combination of 90% HMT, 8% LM and
2% T&I work according to Table 3-16.
𝑅𝑒𝑞𝑢𝑖𝑟𝑒𝑑 𝑓𝑟𝑒𝑖𝑔ℎ𝑡 𝑟𝑎𝑡𝑒 = 𝑉𝑜𝑦𝑎𝑔𝑒 𝑐ℎ𝑎𝑟𝑡𝑒𝑟 ∙𝑡𝑜𝑡𝑎𝑙 𝑑𝑎𝑦𝑠 𝑝𝑒𝑟 𝑐𝑜𝑛𝑡𝑟𝑎𝑐𝑡
𝑝𝑎𝑖𝑑 𝑑𝑎𝑦𝑠 𝑝𝑒𝑟 𝑐𝑜𝑛𝑡𝑟𝑎𝑐𝑡
Eq. 3-32
Cost [Euro/day]
Running costs 7,050 Voyage costs 5,950 Capital costs 10,750 Voyage charter 23,740 Required freight rate 28,820
Table 3-22:Calculated Required Freight Rate of S-class vessels.
3.3 VERIFICATION AND VALIDATION
The verification of the above assumptions is done by referring to existing examples. The validation is done
for used tools to show that these tools are useable.
3.3.1 VERIFICATION OF WEIGHT ASSUMPTION
With the weight assumptions the total weight 𝑊𝑠𝑚 is calculated needs to be compared to the actual 𝑊𝑠𝑚 of
the S-class. Since there is no steel weight available of the S-class the following assumption is made to
verify the steel weight. Since outfitting, machinery and the remainder weight is accurately estimated and
only covers 20-25 % of the total ship weight, the steel weight must be corrected with the difference of the
calculated and the actual lightship weight. The K value is adapted to fit this assumption, which results in a
K value of 0.042. This seems relatively high for a tanker shaped hull which is assumed to be 0.032 +-
0.003 according to (Watson 1996). This can be clarified by for example the relatively thick deck plate and
additional bending strength.
3.3.2 VALIDATION OF SHIP RESISTANCE APPROXIMATION TOOL
To be sure that the calculation based on Holtrop and Mennen is correct, the outcomes can be compared to
an example ship resistance calculation in (J. Holtrop, A Statistical Re-Analysis of Resistance and
Propulsion Data 1984). The first calculation that is used, is the calculation application made available from
TU-Delft. This application is based on (Holtrop and Mennen 1982). The outcomes are validated with earlier
Dockwise studies and do unfortunately not match. Because of this reason and the fact that there is no
access to the program script, Dockwise provided an excel ship resistance calculation sheet that is based
on (J. Holtrop, A Statistical Re-Analysis of Resistance and Propulsion Data 1984). This excel sheet is
validated by comparing the formulas in (J. Holtrop, A Statistical Re-Analysis of Resistance and Propulsion
Data 1984), by making use of the example stated in the paper of (J. Holtrop, A Statistical Re-Analysis of
Resistance and Propulsion Data 1984) , and comparing it with the outcomes of the excel calculations, see
Table 3-23.
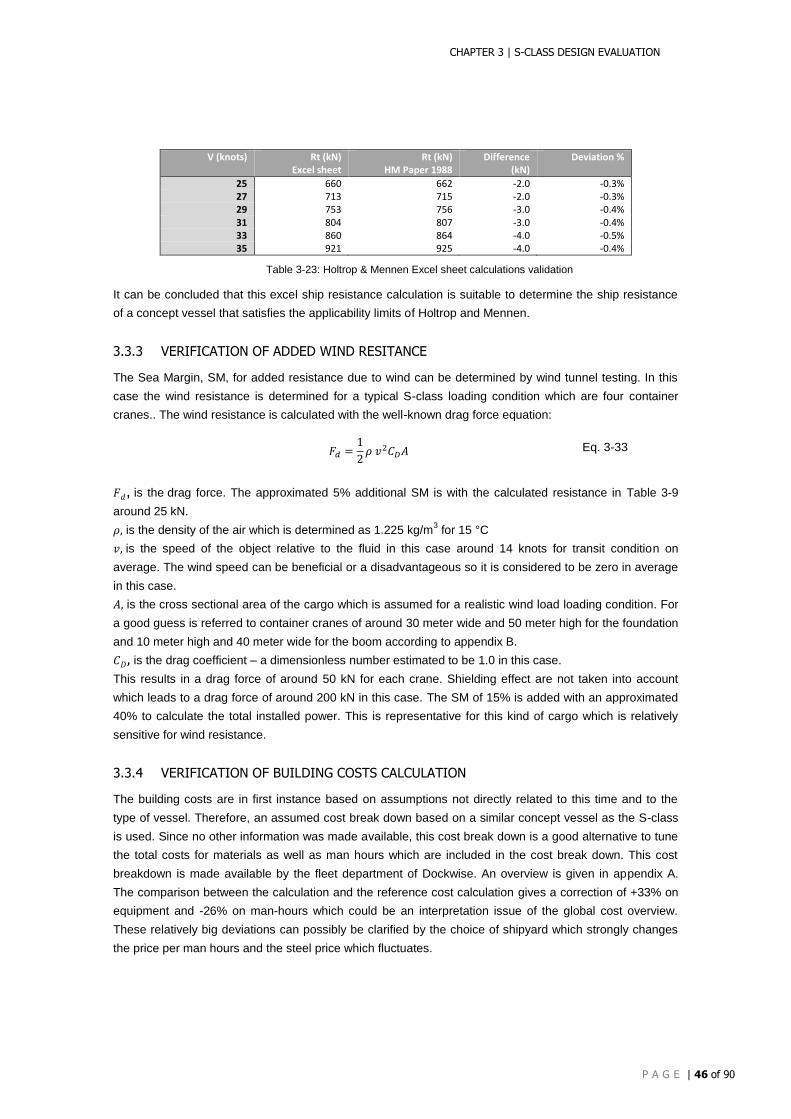
CHAPTER 3 | S-CLASS DESIGN EVALUATION
P A G E | 46 of 90
V (knots) Rt (kN) Excel sheet
Rt (kN) HM Paper 1988
Difference (kN)
Deviation %
25 660 662 -2.0 -0.3% 27 713 715 -2.0 -0.3% 29 753 756 -3.0 -0.4% 31 804 807 -3.0 -0.4% 33 860 864 -4.0 -0.5% 35 921 925 -4.0 -0.4%
Table 3-23: Holtrop & Mennen Excel sheet calculations validation
It can be concluded that this excel ship resistance calculation is suitable to determine the ship resistance
of a concept vessel that satisfies the applicability limits of Holtrop and Mennen.
3.3.3 VERIFICATION OF ADDED WIND RESITANCE
The Sea Margin, SM, for added resistance due to wind can be determined by wind tunnel testing. In this
case the wind resistance is determined for a typical S-class loading condition which are four container
cranes.. The wind resistance is calculated with the well-known drag force equation:
𝐹𝑑 =1
2𝜌 𝑣2𝐶𝐷𝐴 Eq. 3-33
𝐹𝑑, is the drag force. The approximated 5% additional SM is with the calculated resistance in Table 3-9
around 25 kN.
𝜌, is the density of the air which is determined as 1.225 kg/m3 for 15 °C
𝑣, is the speed of the object relative to the fluid in this case around 14 knots for transit condition on
average. The wind speed can be beneficial or a disadvantageous so it is considered to be zero in average
in this case.
𝐴, is the cross sectional area of the cargo which is assumed for a realistic wind load loading condition. For
a good guess is referred to container cranes of around 30 meter wide and 50 meter high for the foundation
and 10 meter high and 40 meter wide for the boom according to appendix B.
𝐶𝐷, is the drag coefficient – a dimensionless number estimated to be 1.0 in this case.
This results in a drag force of around 50 kN for each crane. Shielding effect are not taken into account
which leads to a drag force of around 200 kN in this case. The SM of 15% is added with an approximated
40% to calculate the total installed power. This is representative for this kind of cargo which is relatively
sensitive for wind resistance.
3.3.4 VERIFICATION OF BUILDING COSTS CALCULATION
The building costs are in first instance based on assumptions not directly related to this time and to the
type of vessel. Therefore, an assumed cost break down based on a similar concept vessel as the S-class
is used. Since no other information was made available, this cost break down is a good alternative to tune
the total costs for materials as well as man hours which are included in the cost break down. This cost
breakdown is made available by the fleet department of Dockwise. An overview is given in appendix A.
The comparison between the calculation and the reference cost calculation gives a correction of +33% on
equipment and -26% on man-hours which could be an interpretation issue of the global cost overview.
These relatively big deviations can possibly be clarified by the choice of shipyard which strongly changes
the price per man hours and the steel price which fluctuates.
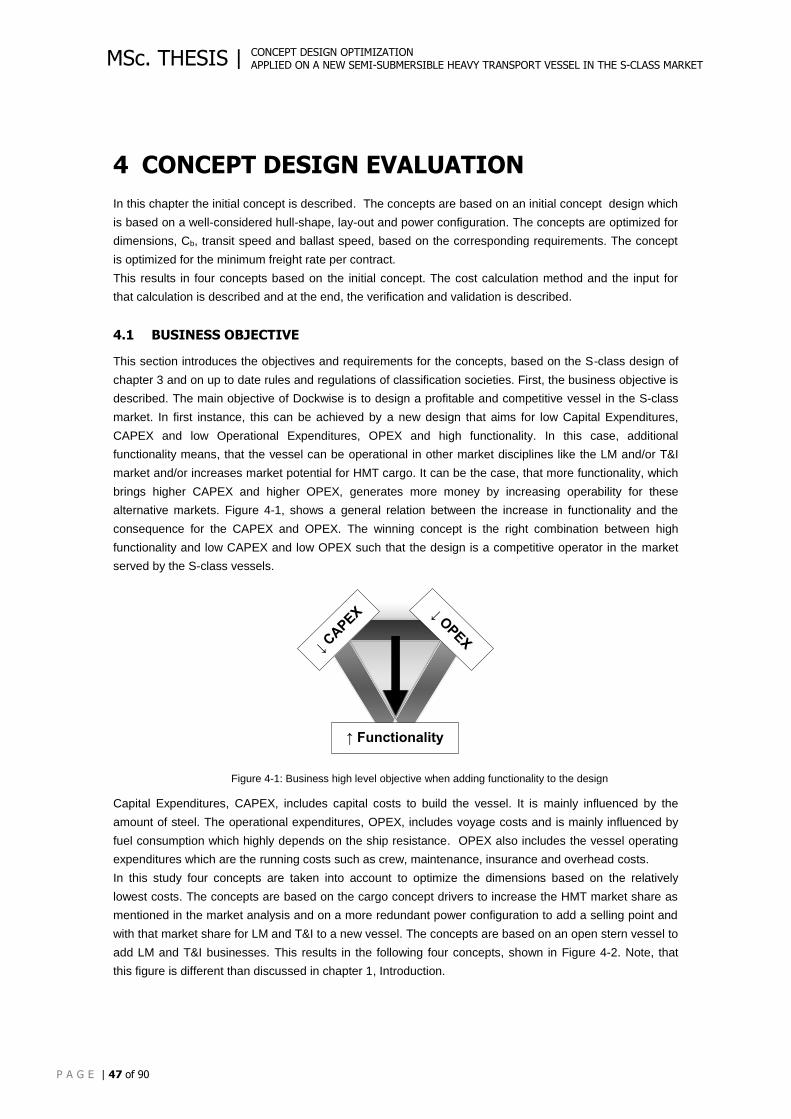
CONCEPT DESIGN OPTIMIZATION APPLIED ON A NEW SEMI-SUBMERSIBLE HEAVY TRANSPORT VESSEL IN THE S-CLASS MARKET
P A G E | 47 of 90
MSc. THESIS |
4 CONCEPT DESIGN EVALUATION
In this chapter the initial concept is described. The concepts are based on an initial concept design which
is based on a well-considered hull-shape, lay-out and power configuration. The concepts are optimized for
dimensions, Cb, transit speed and ballast speed, based on the corresponding requirements. The concept
is optimized for the minimum freight rate per contract.
This results in four concepts based on the initial concept. The cost calculation method and the input for
that calculation is described and at the end, the verification and validation is described.
4.1 BUSINESS OBJECTIVE
This section introduces the objectives and requirements for the concepts, based on the S-class design of
chapter 3 and on up to date rules and regulations of classification societies. First, the business objective is
described. The main objective of Dockwise is to design a profitable and competitive vessel in the S-class
market. In first instance, this can be achieved by a new design that aims for low Capital Expenditures,
CAPEX and low Operational Expenditures, OPEX and high functionality. In this case, additional
functionality means, that the vessel can be operational in other market disciplines like the LM and/or T&I
market and/or increases market potential for HMT cargo. It can be the case, that more functionality, which
brings higher CAPEX and higher OPEX, generates more money by increasing operability for these
alternative markets. Figure 4-1, shows a general relation between the increase in functionality and the
consequence for the CAPEX and OPEX. The winning concept is the right combination between high
functionality and low CAPEX and low OPEX such that the design is a competitive operator in the market
served by the S-class vessels.
↑ Functionality
↓ CAPEX ↓ O
PEX
Figure 4-1: Business high level objective when adding functionality to the design
Capital Expenditures, CAPEX, includes capital costs to build the vessel. It is mainly influenced by the
amount of steel. The operational expenditures, OPEX, includes voyage costs and is mainly influenced by
fuel consumption which highly depends on the ship resistance. OPEX also includes the vessel operating
expenditures which are the running costs such as crew, maintenance, insurance and overhead costs.
In this study four concepts are taken into account to optimize the dimensions based on the relatively
lowest costs. The concepts are based on the cargo concept drivers to increase the HMT market share as
mentioned in the market analysis and on a more redundant power configuration to add a selling point and
with that market share for LM and T&I to a new vessel. The concepts are based on an open stern vessel to
add LM and T&I businesses. This results in the following four concepts, shown in Figure 4-2. Note, that
this figure is different than discussed in chapter 1, Introduction.
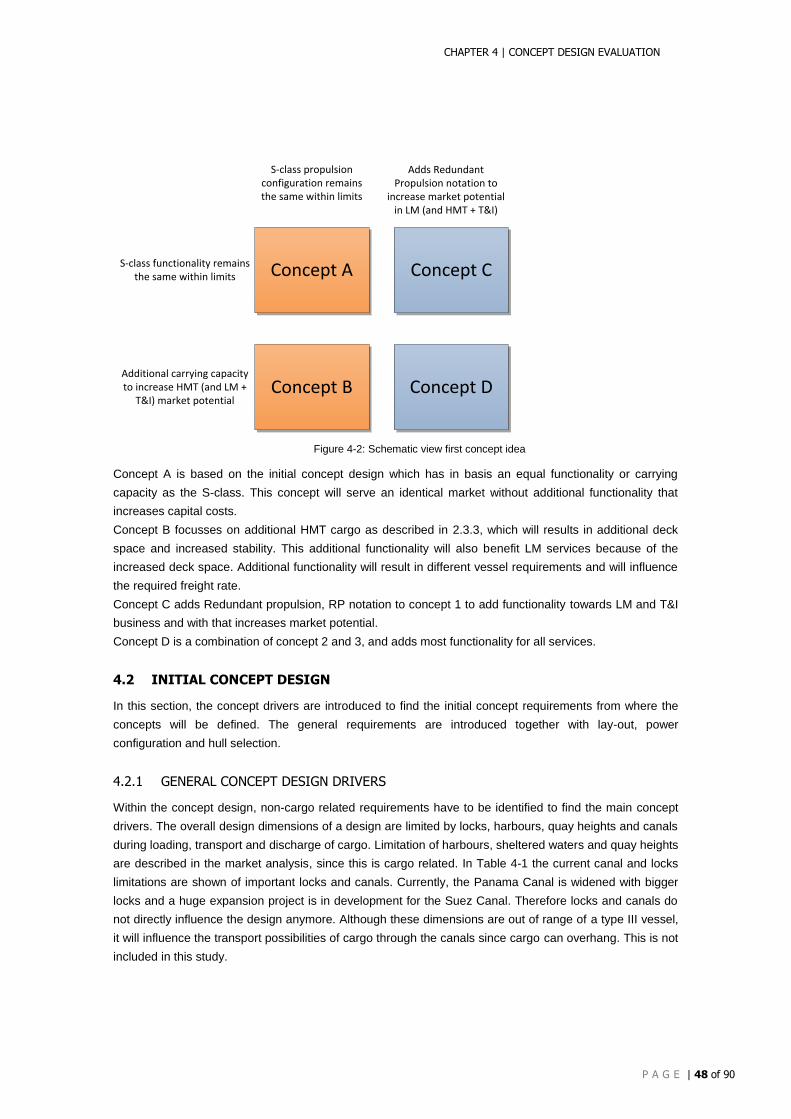
CHAPTER 4 | CONCEPT DESIGN EVALUATION
P A G E | 48 of 90
Concept A Concept C
Concept B Concept D
S-class functionality remains the same within limits
Additional carrying capacity to increase HMT (and LM +
T&I) market potential
Adds Redundant Propulsion notation to
increase market potential in LM (and HMT + T&I)
S-class propulsion configuration remains the same within limits
Figure 4-2: Schematic view first concept idea
Concept A is based on the initial concept design which has in basis an equal functionality or carrying
capacity as the S-class. This concept will serve an identical market without additional functionality that
increases capital costs.
Concept B focusses on additional HMT cargo as described in 2.3.3, which will results in additional deck
space and increased stability. This additional functionality will also benefit LM services because of the
increased deck space. Additional functionality will result in different vessel requirements and will influence
the required freight rate.
Concept C adds Redundant propulsion, RP notation to concept 1 to add functionality towards LM and T&I
business and with that increases market potential.
Concept D is a combination of concept 2 and 3, and adds most functionality for all services.
4.2 INITIAL CONCEPT DESIGN
In this section, the concept drivers are introduced to find the initial concept requirements from where the
concepts will be defined. The general requirements are introduced together with lay-out, power
configuration and hull selection.
4.2.1 GENERAL CONCEPT DESIGN DRIVERS
Within the concept design, non-cargo related requirements have to be identified to find the main concept
drivers. The overall design dimensions of a design are limited by locks, harbours, quay heights and canals
during loading, transport and discharge of cargo. Limitation of harbours, sheltered waters and quay heights
are described in the market analysis, since this is cargo related. In Table 4-1 the current canal and locks
limitations are shown of important locks and canals. Currently, the Panama Canal is widened with bigger
locks and a huge expansion project is in development for the Suez Canal. Therefore locks and canals do
not directly influence the design anymore. Although these dimensions are out of range of a type III vessel,
it will influence the transport possibilities of cargo through the canals since cargo can overhang. This is not
included in this study.
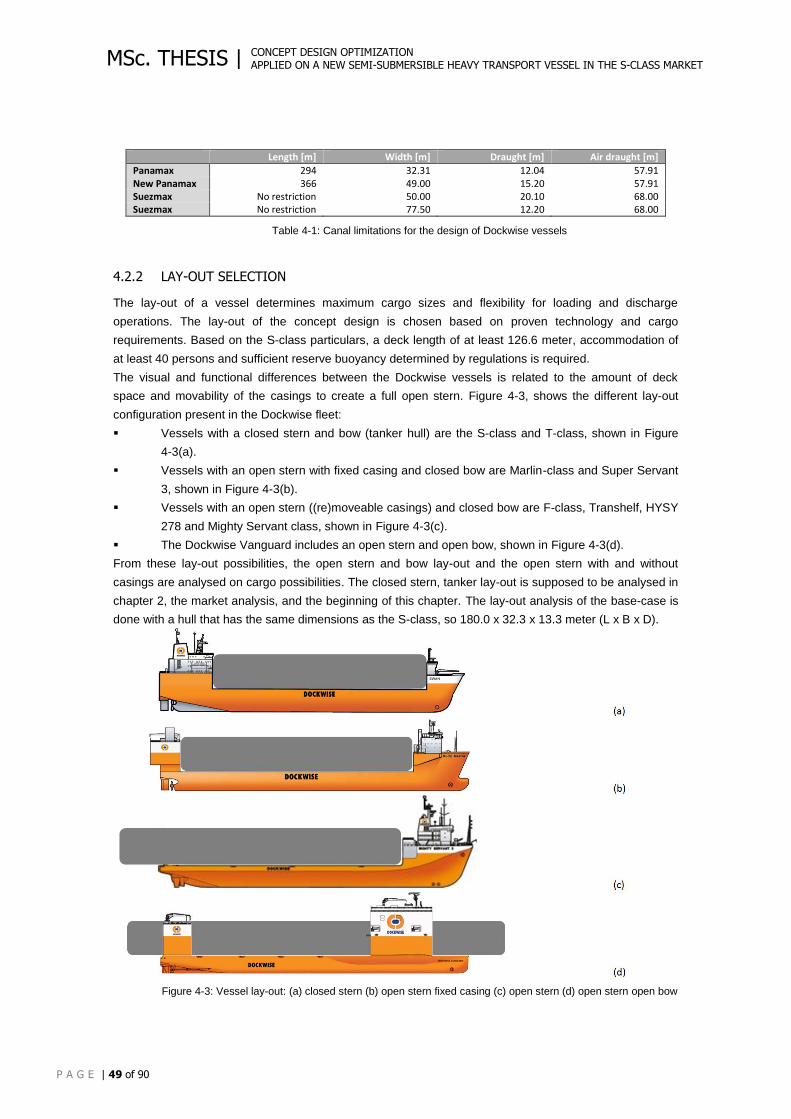
CONCEPT DESIGN OPTIMIZATION APPLIED ON A NEW SEMI-SUBMERSIBLE HEAVY TRANSPORT VESSEL IN THE S-CLASS MARKET
P A G E | 49 of 90
MSc. THESIS |
Length [m] Width [m] Draught [m] Air draught [m]
Panamax 294 32.31 12.04 57.91 New Panamax 366 49.00 15.20 57.91 Suezmax No restriction 50.00 20.10 68.00 Suezmax No restriction 77.50 12.20 68.00
Table 4-1: Canal limitations for the design of Dockwise vessels
4.2.2 LAY-OUT SELECTION
The lay-out of a vessel determines maximum cargo sizes and flexibility for loading and discharge
operations. The lay-out of the concept design is chosen based on proven technology and cargo
requirements. Based on the S-class particulars, a deck length of at least 126.6 meter, accommodation of
at least 40 persons and sufficient reserve buoyancy determined by regulations is required.
The visual and functional differences between the Dockwise vessels is related to the amount of deck
space and movability of the casings to create a full open stern. Figure 4-3, shows the different lay-out
configuration present in the Dockwise fleet:
Vessels with a closed stern and bow (tanker hull) are the S-class and T-class, shown in Figure
4-3(a).
Vessels with an open stern with fixed casing and closed bow are Marlin-class and Super Servant
3, shown in Figure 4-3(b).
Vessels with an open stern ((re)moveable casings) and closed bow are F-class, Transhelf, HYSY
278 and Mighty Servant class, shown in Figure 4-3(c).
The Dockwise Vanguard includes an open stern and open bow, shown in Figure 4-3(d).
From these lay-out possibilities, the open stern and bow lay-out and the open stern with and without
casings are analysed on cargo possibilities. The closed stern, tanker lay-out is supposed to be analysed in
chapter 2, the market analysis, and the beginning of this chapter. The lay-out analysis of the base-case is
done with a hull that has the same dimensions as the S-class, so 180.0 x 32.3 x 13.3 meter (L x B x D).
Figure 4-3: Vessel lay-out: (a) closed stern (b) open stern fixed casing (c) open stern (d) open stern open bow
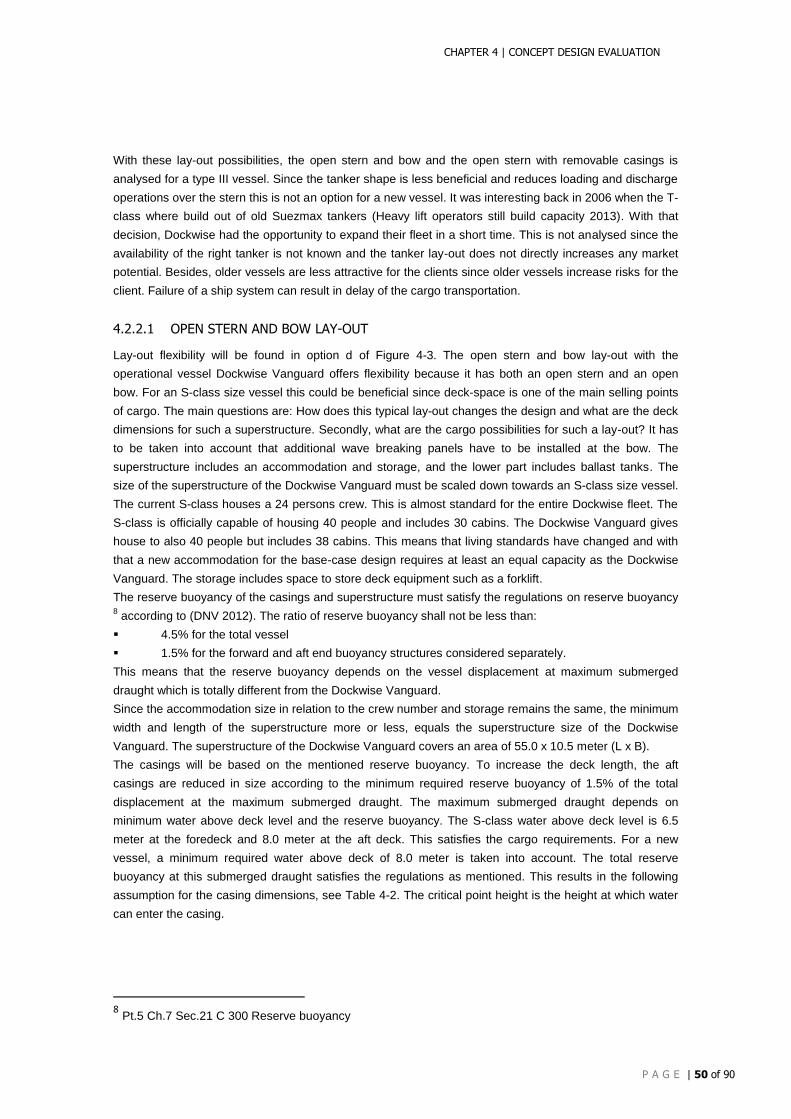
CHAPTER 4 | CONCEPT DESIGN EVALUATION
P A G E | 50 of 90
With these lay-out possibilities, the open stern and bow and the open stern with removable casings is
analysed for a type III vessel. Since the tanker shape is less beneficial and reduces loading and discharge
operations over the stern this is not an option for a new vessel. It was interesting back in 2006 when the T-
class where build out of old Suezmax tankers (Heavy lift operators still build capacity 2013). With that
decision, Dockwise had the opportunity to expand their fleet in a short time. This is not analysed since the
availability of the right tanker is not known and the tanker lay-out does not directly increases any market
potential. Besides, older vessels are less attractive for the clients since older vessels increase risks for the
client. Failure of a ship system can result in delay of the cargo transportation.
4.2.2.1 OPEN STERN AND BOW LAY-OUT
Lay-out flexibility will be found in option d of Figure 4-3. The open stern and bow lay-out with the
operational vessel Dockwise Vanguard offers flexibility because it has both an open stern and an open
bow. For an S-class size vessel this could be beneficial since deck-space is one of the main selling points
of cargo. The main questions are: How does this typical lay-out changes the design and what are the deck
dimensions for such a superstructure. Secondly, what are the cargo possibilities for such a lay-out? It has
to be taken into account that additional wave breaking panels have to be installed at the bow. The
superstructure includes an accommodation and storage, and the lower part includes ballast tanks. The
size of the superstructure of the Dockwise Vanguard must be scaled down towards an S-class size vessel.
The current S-class houses a 24 persons crew. This is almost standard for the entire Dockwise fleet. The
S-class is officially capable of housing 40 people and includes 30 cabins. The Dockwise Vanguard gives
house to also 40 people but includes 38 cabins. This means that living standards have changed and with
that a new accommodation for the base-case design requires at least an equal capacity as the Dockwise
Vanguard. The storage includes space to store deck equipment such as a forklift.
The reserve buoyancy of the casings and superstructure must satisfy the regulations on reserve buoyancy 8 according to (DNV 2012). The ratio of reserve buoyancy shall not be less than:
4.5% for the total vessel
1.5% for the forward and aft end buoyancy structures considered separately.
This means that the reserve buoyancy depends on the vessel displacement at maximum submerged
draught which is totally different from the Dockwise Vanguard.
Since the accommodation size in relation to the crew number and storage remains the same, the minimum
width and length of the superstructure more or less, equals the superstructure size of the Dockwise
Vanguard. The superstructure of the Dockwise Vanguard covers an area of 55.0 x 10.5 meter (L x B).
The casings will be based on the mentioned reserve buoyancy. To increase the deck length, the aft
casings are reduced in size according to the minimum required reserve buoyancy of 1.5% of the total
displacement at the maximum submerged draught. The maximum submerged draught depends on
minimum water above deck level and the reserve buoyancy. The S-class water above deck level is 6.5
meter at the foredeck and 8.0 meter at the aft deck. This satisfies the cargo requirements. For a new
vessel, a minimum required water above deck of 8.0 meter is taken into account. The total reserve
buoyancy at this submerged draught satisfies the regulations as mentioned. This results in the following
assumption for the casing dimensions, see Table 4-2. The critical point height is the height at which water
can enter the casing.
8 Pt.5 Ch.7 Sec.21 C 300 Reserve buoyancy
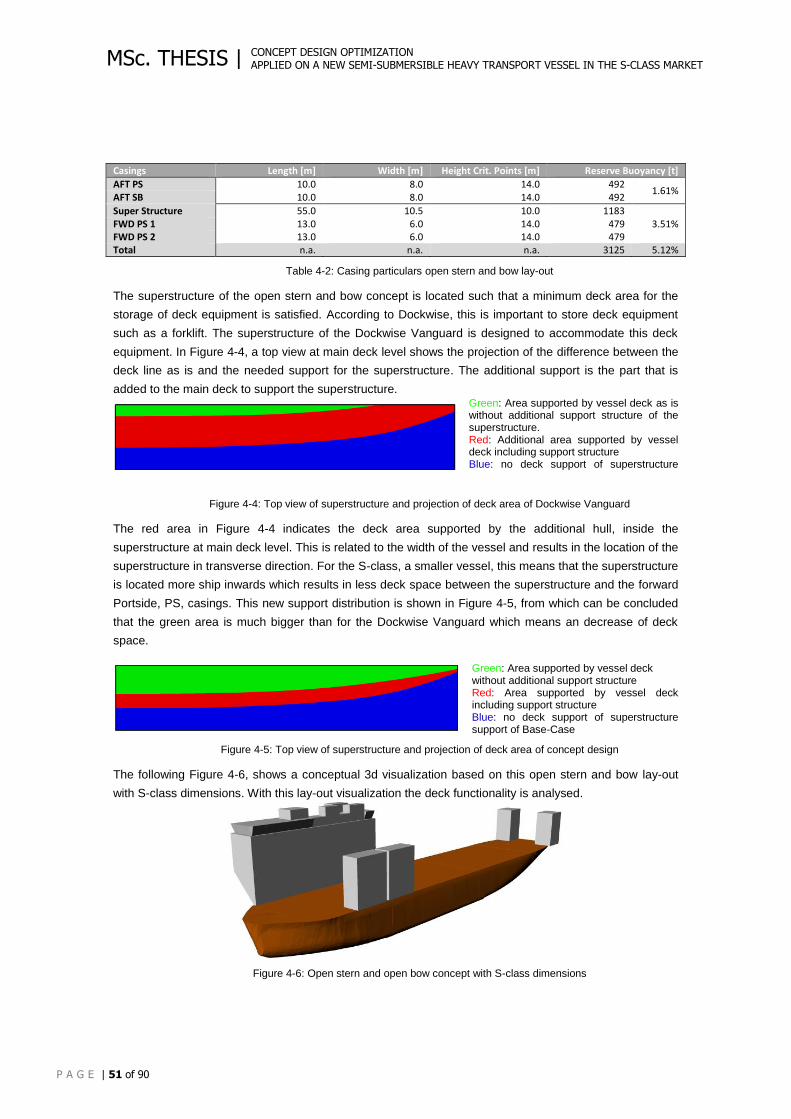
CONCEPT DESIGN OPTIMIZATION APPLIED ON A NEW SEMI-SUBMERSIBLE HEAVY TRANSPORT VESSEL IN THE S-CLASS MARKET
P A G E | 51 of 90
MSc. THESIS |
Casings Length [m] Width [m] Height Crit. Points [m] Reserve Buoyancy [t]
AFT PS 10.0 8.0 14.0 492 1.61%
AFT SB 10.0 8.0 14.0 492
Super Structure 55.0 10.5 10.0 1183 3.51% FWD PS 1 13.0 6.0 14.0 479
FWD PS 2 13.0 6.0 14.0 479 Total n.a. n.a. n.a. 3125 5.12%
Table 4-2: Casing particulars open stern and bow lay-out
The superstructure of the open stern and bow concept is located such that a minimum deck area for the
storage of deck equipment is satisfied. According to Dockwise, this is important to store deck equipment
such as a forklift. The superstructure of the Dockwise Vanguard is designed to accommodate this deck
equipment. In Figure 4-4, a top view at main deck level shows the projection of the difference between the
deck line as is and the needed support for the superstructure. The additional support is the part that is
added to the main deck to support the superstructure. Green: Area supported by vessel deck as is without additional support structure of the superstructure. Red: Additional area supported by vessel deck including support structure Blue: no deck support of superstructure
Figure 4-4: Top view of superstructure and projection of deck area of Dockwise Vanguard
The red area in Figure 4-4 indicates the deck area supported by the additional hull, inside the
superstructure at main deck level. This is related to the width of the vessel and results in the location of the
superstructure in transverse direction. For the S-class, a smaller vessel, this means that the superstructure
is located more ship inwards which results in less deck space between the superstructure and the forward
Portside, PS, casings. This new support distribution is shown in Figure 4-5, from which can be concluded
that the green area is much bigger than for the Dockwise Vanguard which means an decrease of deck
space.
Green: Area supported by vessel deck without additional support structure Red: Area supported by vessel deck including support structure Blue: no deck support of superstructure support of Base-Case
Figure 4-5: Top view of superstructure and projection of deck area of concept design
The following Figure 4-6, shows a conceptual 3d visualization based on this open stern and bow lay-out
with S-class dimensions. With this lay-out visualization the deck functionality is analysed.
Figure 4-6: Open stern and open bow concept with S-class dimensions
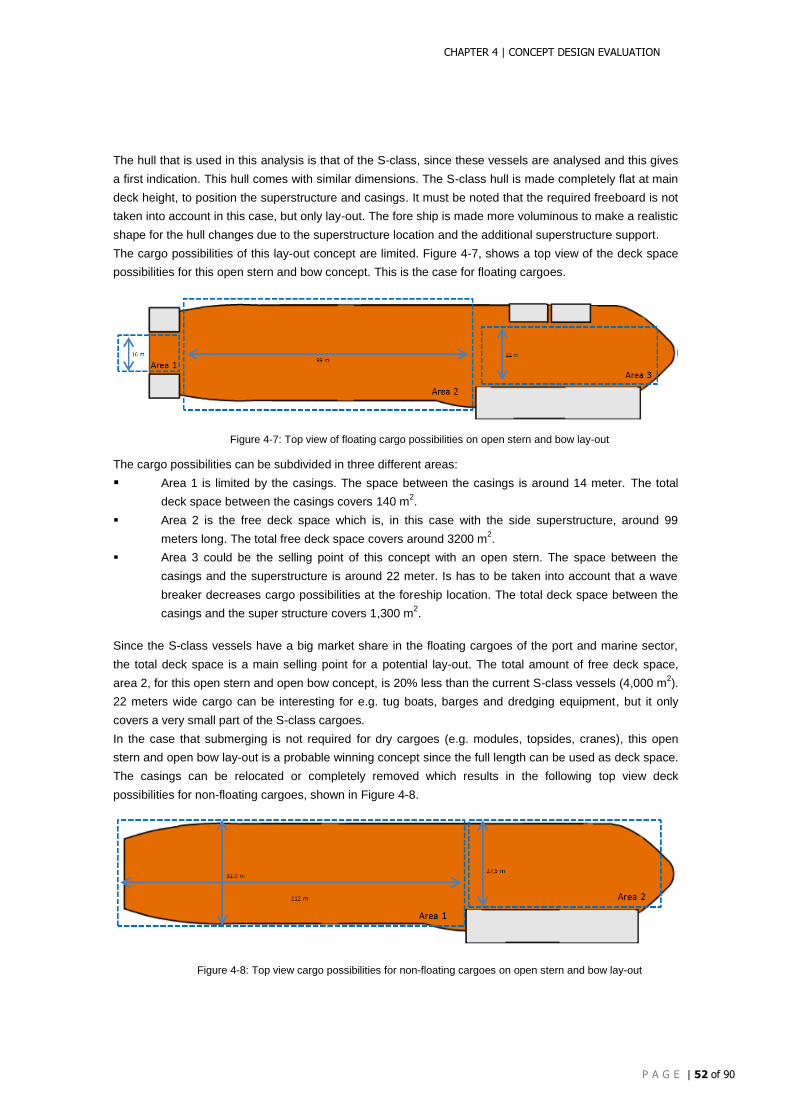
CHAPTER 4 | CONCEPT DESIGN EVALUATION
P A G E | 52 of 90
The hull that is used in this analysis is that of the S-class, since these vessels are analysed and this gives
a first indication. This hull comes with similar dimensions. The S-class hull is made completely flat at main
deck height, to position the superstructure and casings. It must be noted that the required freeboard is not
taken into account in this case, but only lay-out. The fore ship is made more voluminous to make a realistic
shape for the hull changes due to the superstructure location and the additional superstructure support.
The cargo possibilities of this lay-out concept are limited. Figure 4-7, shows a top view of the deck space
possibilities for this open stern and bow concept. This is the case for floating cargoes.
Figure 4-7: Top view of floating cargo possibilities on open stern and bow lay-out
The cargo possibilities can be subdivided in three different areas:
Area 1 is limited by the casings. The space between the casings is around 14 meter. The total
deck space between the casings covers 140 m2.
Area 2 is the free deck space which is, in this case with the side superstructure, around 99
meters long. The total free deck space covers around 3200 m2.
Area 3 could be the selling point of this concept with an open stern. The space between the
casings and the superstructure is around 22 meter. Is has to be taken into account that a wave
breaker decreases cargo possibilities at the foreship location. The total deck space between the
casings and the super structure covers 1,300 m2.
Since the S-class vessels have a big market share in the floating cargoes of the port and marine sector,
the total deck space is a main selling point for a potential lay-out. The total amount of free deck space,
area 2, for this open stern and open bow concept, is 20% less than the current S-class vessels (4,000 m2).
22 meters wide cargo can be interesting for e.g. tug boats, barges and dredging equipment, but it only
covers a very small part of the S-class cargoes.
In the case that submerging is not required for dry cargoes (e.g. modules, topsides, cranes), this open
stern and open bow lay-out is a probable winning concept since the full length can be used as deck space.
The casings can be relocated or completely removed which results in the following top view deck
possibilities for non-floating cargoes, shown in Figure 4-8.
Figure 4-8: Top view cargo possibilities for non-floating cargoes on open stern and bow lay-out
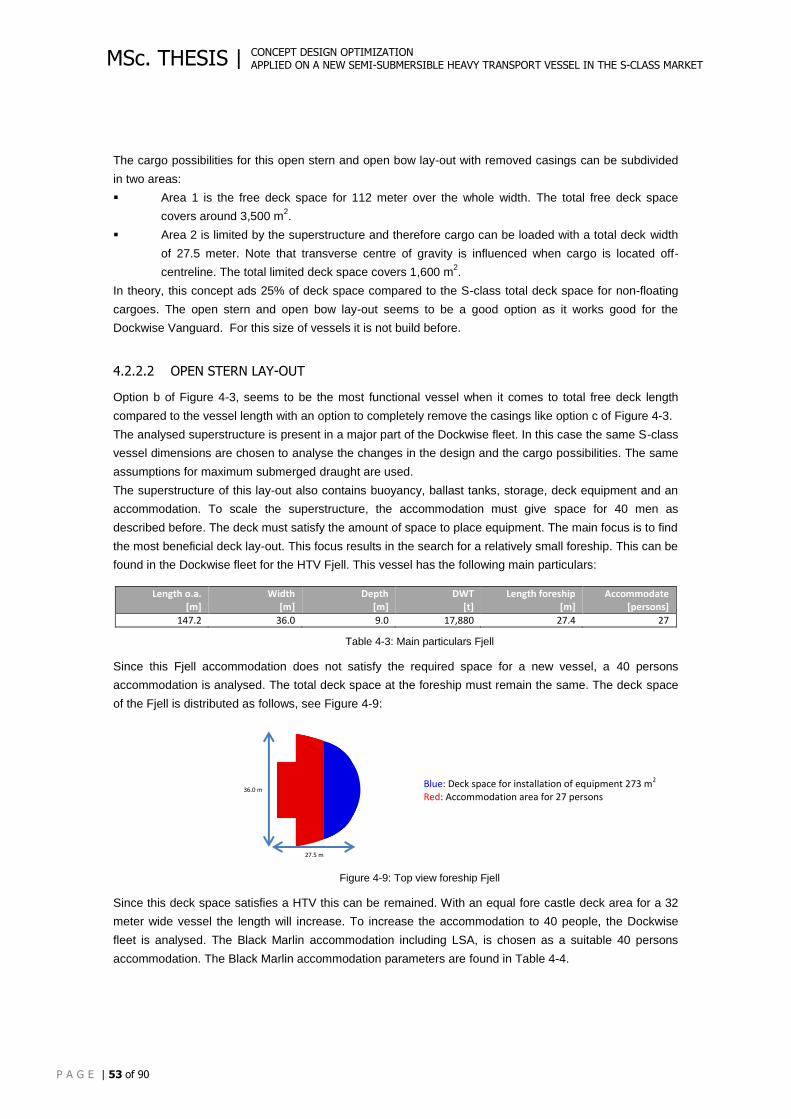
CONCEPT DESIGN OPTIMIZATION APPLIED ON A NEW SEMI-SUBMERSIBLE HEAVY TRANSPORT VESSEL IN THE S-CLASS MARKET
P A G E | 53 of 90
MSc. THESIS |
The cargo possibilities for this open stern and open bow lay-out with removed casings can be subdivided
in two areas:
Area 1 is the free deck space for 112 meter over the whole width. The total free deck space
covers around 3,500 m2.
Area 2 is limited by the superstructure and therefore cargo can be loaded with a total deck width
of 27.5 meter. Note that transverse centre of gravity is influenced when cargo is located off-
centreline. The total limited deck space covers 1,600 m2.
In theory, this concept ads 25% of deck space compared to the S-class total deck space for non-floating
cargoes. The open stern and open bow lay-out seems to be a good option as it works good for the
Dockwise Vanguard. For this size of vessels it is not build before.
4.2.2.2 OPEN STERN LAY-OUT
Option b of Figure 4-3, seems to be the most functional vessel when it comes to total free deck length
compared to the vessel length with an option to completely remove the casings like option c of Figure 4-3.
The analysed superstructure is present in a major part of the Dockwise fleet. In this case the same S-class
vessel dimensions are chosen to analyse the changes in the design and the cargo possibilities. The same
assumptions for maximum submerged draught are used.
The superstructure of this lay-out also contains buoyancy, ballast tanks, storage, deck equipment and an
accommodation. To scale the superstructure, the accommodation must give space for 40 men as
described before. The deck must satisfy the amount of space to place equipment. The main focus is to find
the most beneficial deck lay-out. This focus results in the search for a relatively small foreship. This can be
found in the Dockwise fleet for the HTV Fjell. This vessel has the following main particulars:
Length o.a.
[m] Width
[m] Depth
[m] DWT
[t] Length foreship
[m] Accommodate
[persons]
147.2 36.0 9.0 17,880 27.4 27
Table 4-3: Main particulars Fjell
Since this Fjell accommodation does not satisfy the required space for a new vessel, a 40 persons
accommodation is analysed. The total deck space at the foreship must remain the same. The deck space
of the Fjell is distributed as follows, see Figure 4-9:
Blue: Deck space for installation of equipment 273 m2
Red: Accommodation area for 27 persons
Figure 4-9: Top view foreship Fjell
Since this deck space satisfies a HTV this can be remained. With an equal fore castle deck area for a 32
meter wide vessel the length will increase. To increase the accommodation to 40 people, the Dockwise
fleet is analysed. The Black Marlin accommodation including LSA, is chosen as a suitable 40 persons
accommodation. The Black Marlin accommodation parameters are found in Table 4-4.
36.0 m
27.5 m
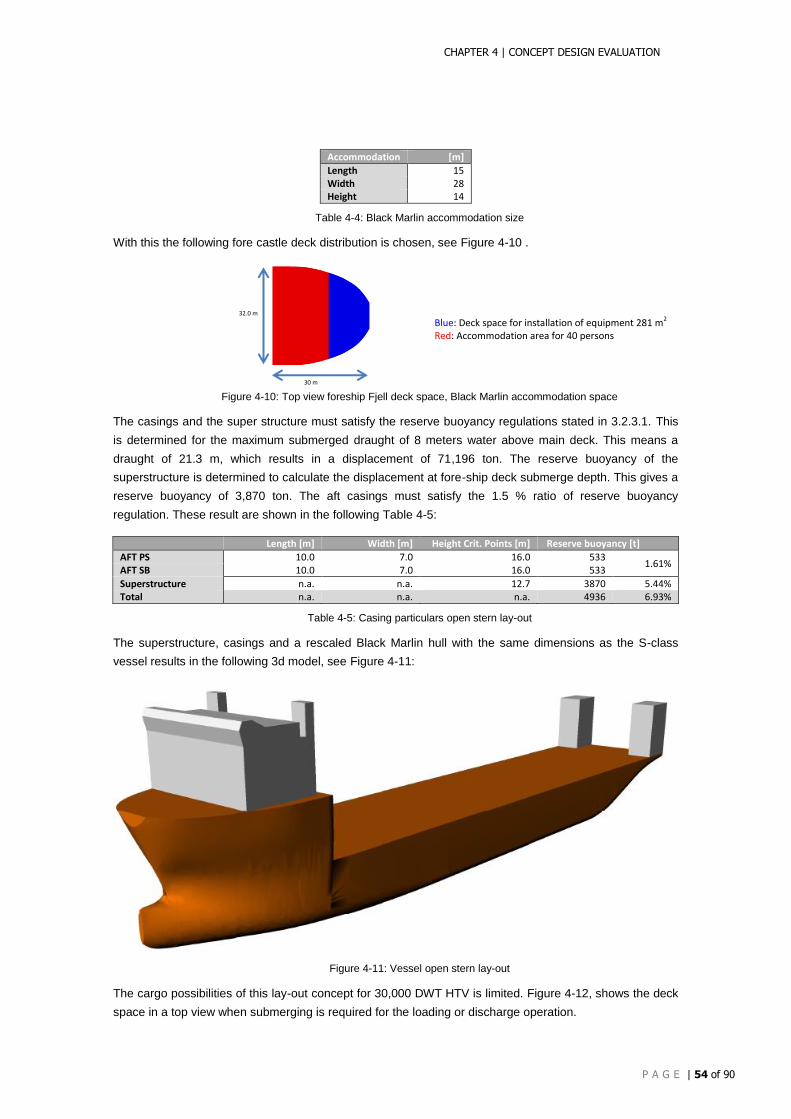
CHAPTER 4 | CONCEPT DESIGN EVALUATION
P A G E | 54 of 90
Accommodation [m]
Length 15 Width 28 Height 14
Table 4-4: Black Marlin accommodation size
With this the following fore castle deck distribution is chosen, see Figure 4-10 .
Blue: Deck space for installation of equipment 281 m2
Red: Accommodation area for 40 persons
Figure 4-10: Top view foreship Fjell deck space, Black Marlin accommodation space
The casings and the super structure must satisfy the reserve buoyancy regulations stated in 3.2.3.1. This
is determined for the maximum submerged draught of 8 meters water above main deck. This means a
draught of 21.3 m, which results in a displacement of 71,196 ton. The reserve buoyancy of the
superstructure is determined to calculate the displacement at fore-ship deck submerge depth. This gives a
reserve buoyancy of 3,870 ton. The aft casings must satisfy the 1.5 % ratio of reserve buoyancy
regulation. These result are shown in the following Table 4-5:
Length [m] Width [m] Height Crit. Points [m] Reserve buoyancy [t]
AFT PS 10.0 7.0 16.0 533 1.61%
AFT SB 10.0 7.0 16.0 533
Superstructure n.a. n.a. 12.7 3870 5.44% Total n.a. n.a. n.a. 4936 6.93%
Table 4-5: Casing particulars open stern lay-out
The superstructure, casings and a rescaled Black Marlin hull with the same dimensions as the S-class
vessel results in the following 3d model, see Figure 4-11:
Figure 4-11: Vessel open stern lay-out
The cargo possibilities of this lay-out concept for 30,000 DWT HTV is limited. Figure 4-12, shows the deck
space in a top view when submerging is required for the loading or discharge operation.
32.0 m
30 m
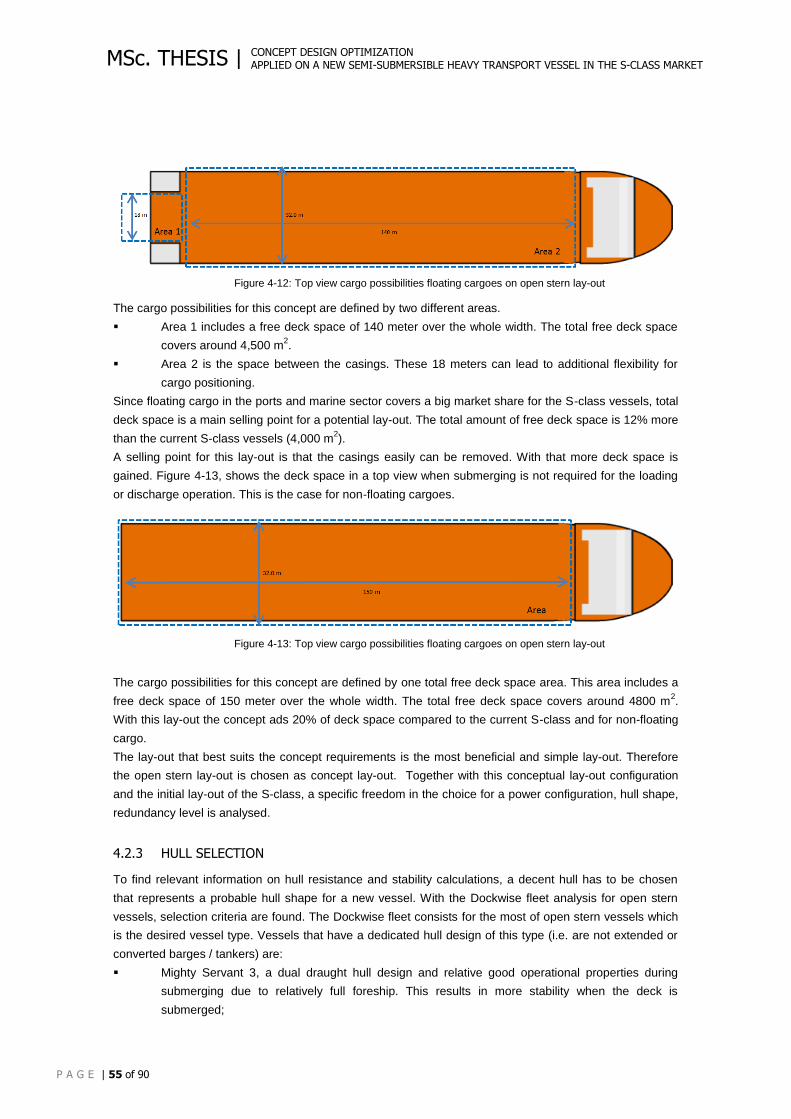
CONCEPT DESIGN OPTIMIZATION APPLIED ON A NEW SEMI-SUBMERSIBLE HEAVY TRANSPORT VESSEL IN THE S-CLASS MARKET
P A G E | 55 of 90
MSc. THESIS |
Figure 4-12: Top view cargo possibilities floating cargoes on open stern lay-out
The cargo possibilities for this concept are defined by two different areas.
Area 1 includes a free deck space of 140 meter over the whole width. The total free deck space
covers around 4,500 m2.
Area 2 is the space between the casings. These 18 meters can lead to additional flexibility for
cargo positioning.
Since floating cargo in the ports and marine sector covers a big market share for the S-class vessels, total
deck space is a main selling point for a potential lay-out. The total amount of free deck space is 12% more
than the current S-class vessels (4,000 m2).
A selling point for this lay-out is that the casings easily can be removed. With that more deck space is
gained. Figure 4-13, shows the deck space in a top view when submerging is not required for the loading
or discharge operation. This is the case for non-floating cargoes.
Figure 4-13: Top view cargo possibilities floating cargoes on open stern lay-out
The cargo possibilities for this concept are defined by one total free deck space area. This area includes a
free deck space of 150 meter over the whole width. The total free deck space covers around 4800 m2.
With this lay-out the concept ads 20% of deck space compared to the current S-class and for non-floating
cargo.
The lay-out that best suits the concept requirements is the most beneficial and simple lay-out. Therefore
the open stern lay-out is chosen as concept lay-out. Together with this conceptual lay-out configuration
and the initial lay-out of the S-class, a specific freedom in the choice for a power configuration, hull shape,
redundancy level is analysed.
4.2.3 HULL SELECTION
To find relevant information on hull resistance and stability calculations, a decent hull has to be chosen
that represents a probable hull shape for a new vessel. With the Dockwise fleet analysis for open stern
vessels, selection criteria are found. The Dockwise fleet consists for the most of open stern vessels which
is the desired vessel type. Vessels that have a dedicated hull design of this type (i.e. are not extended or
converted barges / tankers) are:
Mighty Servant 3, a dual draught hull design and relative good operational properties during
submerging due to relatively full foreship. This results in more stability when the deck is
submerged;
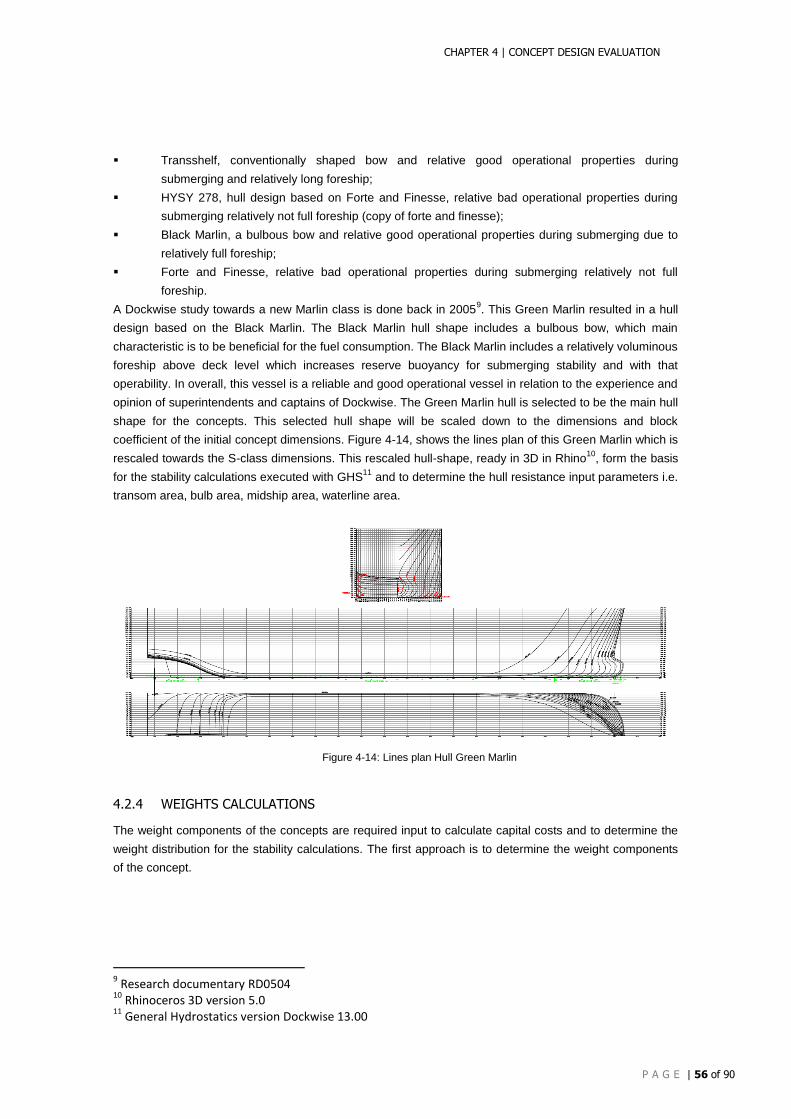
CHAPTER 4 | CONCEPT DESIGN EVALUATION
P A G E | 56 of 90
Transshelf, conventionally shaped bow and relative good operational properties during
submerging and relatively long foreship;
HYSY 278, hull design based on Forte and Finesse, relative bad operational properties during
submerging relatively not full foreship (copy of forte and finesse);
Black Marlin, a bulbous bow and relative good operational properties during submerging due to
relatively full foreship;
Forte and Finesse, relative bad operational properties during submerging relatively not full
foreship.
A Dockwise study towards a new Marlin class is done back in 20059. This Green Marlin resulted in a hull
design based on the Black Marlin. The Black Marlin hull shape includes a bulbous bow, which main
characteristic is to be beneficial for the fuel consumption. The Black Marlin includes a relatively voluminous
foreship above deck level which increases reserve buoyancy for submerging stability and with that
operability. In overall, this vessel is a reliable and good operational vessel in relation to the experience and
opinion of superintendents and captains of Dockwise. The Green Marlin hull is selected to be the main hull
shape for the concepts. This selected hull shape will be scaled down to the dimensions and block
coefficient of the initial concept dimensions. Figure 4-14, shows the lines plan of this Green Marlin which is
rescaled towards the S-class dimensions. This rescaled hull-shape, ready in 3D in Rhino10
, form the basis
for the stability calculations executed with GHS11
and to determine the hull resistance input parameters i.e.
transom area, bulb area, midship area, waterline area.
Figure 4-14: Lines plan Hull Green Marlin
4.2.4 WEIGHTS CALCULATIONS
The weight components of the concepts are required input to calculate capital costs and to determine the
weight distribution for the stability calculations. The first approach is to determine the weight components
of the concept.
9 Research documentary RD0504
10 Rhinoceros 3D version 5.0
11 General Hydrostatics version Dockwise 13.00
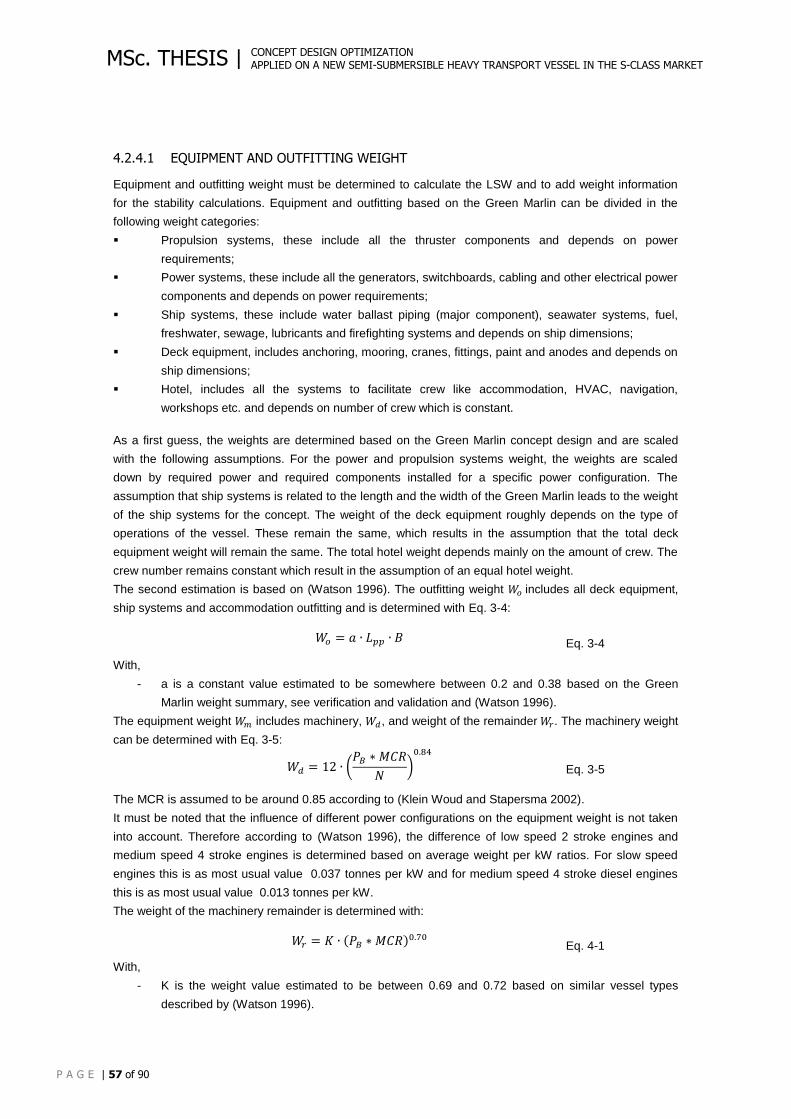
CONCEPT DESIGN OPTIMIZATION APPLIED ON A NEW SEMI-SUBMERSIBLE HEAVY TRANSPORT VESSEL IN THE S-CLASS MARKET
P A G E | 57 of 90
MSc. THESIS |
4.2.4.1 EQUIPMENT AND OUTFITTING WEIGHT
Equipment and outfitting weight must be determined to calculate the LSW and to add weight information
for the stability calculations. Equipment and outfitting based on the Green Marlin can be divided in the
following weight categories:
Propulsion systems, these include all the thruster components and depends on power
requirements;
Power systems, these include all the generators, switchboards, cabling and other electrical power
components and depends on power requirements;
Ship systems, these include water ballast piping (major component), seawater systems, fuel,
freshwater, sewage, lubricants and firefighting systems and depends on ship dimensions;
Deck equipment, includes anchoring, mooring, cranes, fittings, paint and anodes and depends on
ship dimensions;
Hotel, includes all the systems to facilitate crew like accommodation, HVAC, navigation,
workshops etc. and depends on number of crew which is constant.
As a first guess, the weights are determined based on the Green Marlin concept design and are scaled
with the following assumptions. For the power and propulsion systems weight, the weights are scaled
down by required power and required components installed for a specific power configuration. The
assumption that ship systems is related to the length and the width of the Green Marlin leads to the weight
of the ship systems for the concept. The weight of the deck equipment roughly depends on the type of
operations of the vessel. These remain the same, which results in the assumption that the total deck
equipment weight will remain the same. The total hotel weight depends mainly on the amount of crew. The
crew number remains constant which result in the assumption of an equal hotel weight.
The second estimation is based on (Watson 1996). The outfitting weight 𝑊𝑜 includes all deck equipment,
ship systems and accommodation outfitting and is determined with Eq. 3-4:
𝑊𝑜 = 𝑎 ∙ 𝐿𝑝𝑝 ∙ 𝐵 Eq. 3-4
With,
- a is a constant value estimated to be somewhere between 0.2 and 0.38 based on the Green
Marlin weight summary, see verification and validation and (Watson 1996).
The equipment weight 𝑊𝑚 includes machinery, 𝑊𝑑, and weight of the remainder 𝑊𝑟. The machinery weight
can be determined with Eq. 3-5:
𝑊𝑑 = 12 ∙ (𝑃𝐵 ∗ 𝑀𝐶𝑅
𝑁)
0.84
Eq. 3-5
The MCR is assumed to be around 0.85 according to (Klein Woud and Stapersma 2002).
It must be noted that the influence of different power configurations on the equipment weight is not taken
into account. Therefore according to (Watson 1996), the difference of low speed 2 stroke engines and
medium speed 4 stroke engines is determined based on average weight per kW ratios. For slow speed
engines this is as most usual value 0.037 tonnes per kW and for medium speed 4 stroke diesel engines
this is as most usual value 0.013 tonnes per kW.
The weight of the machinery remainder is determined with:
𝑊𝑟 = 𝐾 ∙ (𝑃𝐵 ∗ 𝑀𝐶𝑅)0.70 Eq. 4-1
With,
- K is the weight value estimated to be between 0.69 and 0.72 based on similar vessel types
described by (Watson 1996).
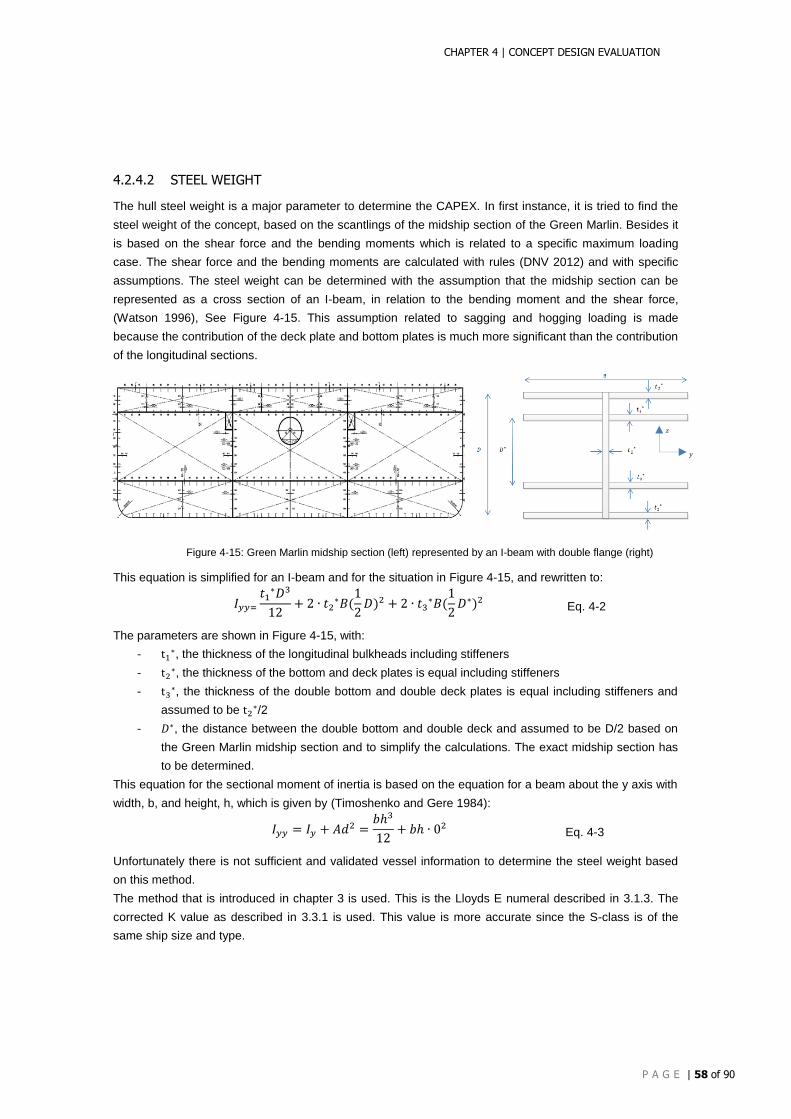
CHAPTER 4 | CONCEPT DESIGN EVALUATION
P A G E | 58 of 90
4.2.4.2 STEEL WEIGHT
The hull steel weight is a major parameter to determine the CAPEX. In first instance, it is tried to find the
steel weight of the concept, based on the scantlings of the midship section of the Green Marlin. Besides it
is based on the shear force and the bending moments which is related to a specific maximum loading
case. The shear force and the bending moments are calculated with rules (DNV 2012) and with specific
assumptions. The steel weight can be determined with the assumption that the midship section can be
represented as a cross section of an I-beam, in relation to the bending moment and the shear force,
(Watson 1996), See Figure 4-15. This assumption related to sagging and hogging loading is made
because the contribution of the deck plate and bottom plates is much more significant than the contribution
of the longitudinal sections.
Figure 4-15: Green Marlin midship section (left) represented by an I-beam with double flange (right)
This equation is simplified for an I-beam and for the situation in Figure 4-15, and rewritten to:
𝐼𝑦𝑦=
𝑡1∗𝐷3
12+ 2 ∙ 𝑡2
∗𝐵(1
2𝐷)2 + 2 ∙ 𝑡3
∗𝐵(1
2𝐷∗)2 Eq. 4-2
The parameters are shown in Figure 4-15, with:
- t1∗, the thickness of the longitudinal bulkheads including stiffeners
- t2∗, the thickness of the bottom and deck plates is equal including stiffeners
- t3∗, the thickness of the double bottom and double deck plates is equal including stiffeners and
assumed to be t2∗/2
- 𝐷∗, the distance between the double bottom and double deck and assumed to be D/2 based on
the Green Marlin midship section and to simplify the calculations. The exact midship section has
to be determined.
This equation for the sectional moment of inertia is based on the equation for a beam about the y axis with
width, b, and height, h, which is given by (Timoshenko and Gere 1984):
𝐼𝑦𝑦 = 𝐼𝑦 + 𝐴𝑑2 =𝑏ℎ3
12+ 𝑏ℎ ∙ 02 Eq. 4-3
Unfortunately there is not sufficient and validated vessel information to determine the steel weight based
on this method.
The method that is introduced in chapter 3 is used. This is the Lloyds E numeral described in 3.1.3. The
corrected K value as described in 3.3.1 is used. This value is more accurate since the S-class is of the
same ship size and type.
𝑦
𝑧
CONCEPT DESIGN OPTIMIZATION APPLIED ON A NEW SEMI-SUBMERSIBLE HEAVY TRANSPORT VESSEL IN THE S-CLASS MARKET
P A G E | 59 of 90
MSc. THESIS |
4.2.4.3 SUMMER DRAUGHT CALCULATION
With the given depth, freeboard regulations give the maximum design summer draught. The freeboard
calculations according to (Det Norske Veritas July 2011) are based on input values for overall length,
depth, width, length of superstructure, block coefficient, height and length of fore castle deck. The
Superstructure is based on the Black Marlin since the same crew number is required. The main
dimensions of the superstructure are to be found in Table 4-4.
The forecastle deck length depends on the overall length, the deck length and on the length of the casings.
See Figure 4-16, for an overview of the lengths needed for the freeboard calculation. Based on freeboard
tables of (Det Norske Veritas July 2011) the summer draught will be calculated.
Figure 4-16: Overview lengths for input of freeboard calculation
4.2.5 POWER CALCULATIONS
In this part the assumptions and methods to calculate the required power is described. First the possible
power configurations are evaluated followed by the assumptions for the resistance calculations. The main
differences between the power calculation for the S-class and the power configuration of the concept are
found in the requirements of the power configurations chosen with or without RP notation.
4.2.5.1 POWER CONFIGURATION
The power configuration includes the basic choices and assumptions for machinery, transmission and
propulsion. The optimum power configuration is driven by CAPEX, fuel consumption, location in vessel,
dimensions and redundancy requirements.
The S-class power configuration results in a relatively simple and reliable power configuration. A single
direct driven power configuration is chosen as power configuration for concept A and B. A direct driven
power configuration simply consists of a prime mover, a transmission when a four stroke engine is
selected and a propulsor. The prime mover for a HTV is commonly a low speed 2-stroke or a mid-speed 4-
stroke diesel engine. The low speed 2-stroke diesel engine, operated on HFO, has a high efficiency
because it directly powers the propulsor which results in a high thermal efficiency. This again results in an
overall good economy of the engine. A controllable pitch propeller, CPP, is advisable since it enables
lower engine speeds and more flexibility for manoeuvring which is an important function for the HTV. The
HTV must be able to manoeuvre in ports and near loading and discharge locations. The weight power ratio
of a low speed 2-stroke engine is relatively good. Because of its simplicity, maintenance costs are
relatively low. The possibility for a shaft generator reduces the operational costs by its better overall
efficiency. The specific fuel consumption, SFC is relatively high which reduces fuel costs.
𝐿𝑜𝑎
𝐿𝑐𝑎𝑠𝑖𝑛𝑔 𝐿𝑑𝑒𝑐𝑘 𝐿𝑠𝑢𝑝𝑒𝑟 𝑠𝑡𝑟𝑢𝑐.
𝐿𝑓𝑜𝑟𝑒𝑐𝑎𝑠𝑡𝑙𝑒𝑑𝑒𝑐𝑘
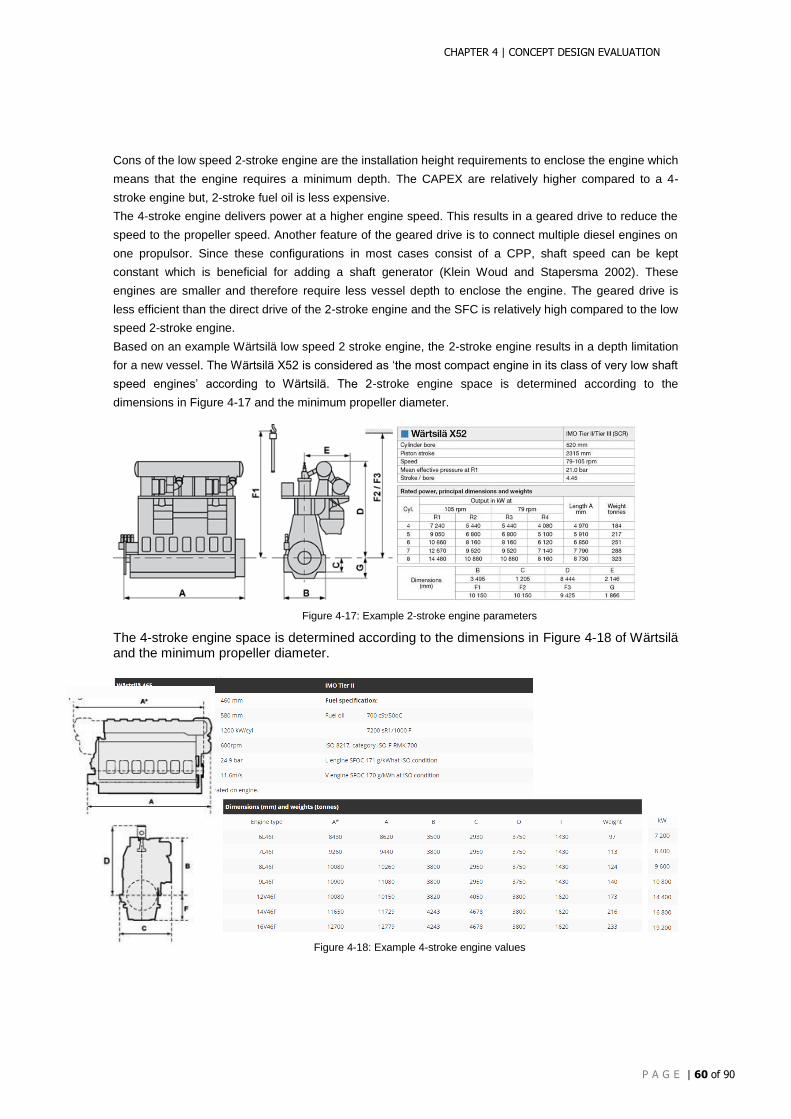
CHAPTER 4 | CONCEPT DESIGN EVALUATION
P A G E | 60 of 90
Cons of the low speed 2-stroke engine are the installation height requirements to enclose the engine which
means that the engine requires a minimum depth. The CAPEX are relatively higher compared to a 4-
stroke engine but, 2-stroke fuel oil is less expensive.
The 4-stroke engine delivers power at a higher engine speed. This results in a geared drive to reduce the
speed to the propeller speed. Another feature of the geared drive is to connect multiple diesel engines on
one propulsor. Since these configurations in most cases consist of a CPP, shaft speed can be kept
constant which is beneficial for adding a shaft generator (Klein Woud and Stapersma 2002). These
engines are smaller and therefore require less vessel depth to enclose the engine. The geared drive is
less efficient than the direct drive of the 2-stroke engine and the SFC is relatively high compared to the low
speed 2-stroke engine.
Based on an example Wärtsilä low speed 2 stroke engine, the 2-stroke engine results in a depth limitation
for a new vessel. The Wärtsilä X52 is considered as ‘the most compact engine in its class of very low shaft
speed engines’ according to Wärtsilä. The 2-stroke engine space is determined according to the
dimensions in Figure 4-17 and the minimum propeller diameter.
Figure 4-17: Example 2-stroke engine parameters
The 4-stroke engine space is determined according to the dimensions in Figure 4-18 of Wärtsilä and the minimum propeller diameter.
Figure 4-18: Example 4-stroke engine values
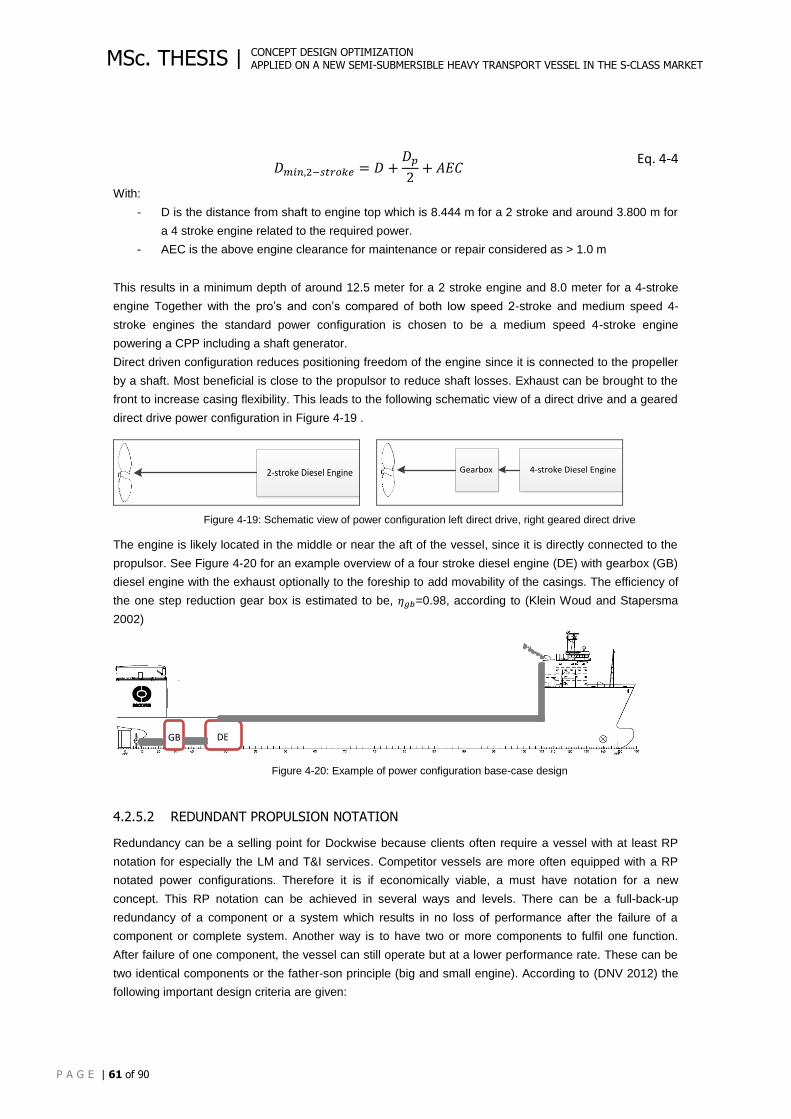
CONCEPT DESIGN OPTIMIZATION APPLIED ON A NEW SEMI-SUBMERSIBLE HEAVY TRANSPORT VESSEL IN THE S-CLASS MARKET
P A G E | 61 of 90
MSc. THESIS |
𝐷𝑚𝑖𝑛,2−𝑠𝑡𝑟𝑜𝑘𝑒 = 𝐷 +𝐷𝑝
2+ 𝐴𝐸𝐶
Eq. 4-4
With:
- D is the distance from shaft to engine top which is 8.444 m for a 2 stroke and around 3.800 m for
a 4 stroke engine related to the required power.
- AEC is the above engine clearance for maintenance or repair considered as > 1.0 m
This results in a minimum depth of around 12.5 meter for a 2 stroke engine and 8.0 meter for a 4-stroke
engine Together with the pro’s and con’s compared of both low speed 2-stroke and medium speed 4-
stroke engines the standard power configuration is chosen to be a medium speed 4-stroke engine
powering a CPP including a shaft generator.
Direct driven configuration reduces positioning freedom of the engine since it is connected to the propeller
by a shaft. Most beneficial is close to the propulsor to reduce shaft losses. Exhaust can be brought to the
front to increase casing flexibility. This leads to the following schematic view of a direct drive and a geared
direct drive power configuration in Figure 4-19 .
2-stroke Diesel Engine
4-stroke Diesel EngineGearbox
Figure 4-19: Schematic view of power configuration left direct drive, right geared direct drive
The engine is likely located in the middle or near the aft of the vessel, since it is directly connected to the
propulsor. See Figure 4-20 for an example overview of a four stroke diesel engine (DE) with gearbox (GB)
diesel engine with the exhaust optionally to the foreship to add movability of the casings. The efficiency of
the one step reduction gear box is estimated to be, 𝜂𝑔𝑏=0.98, according to (Klein Woud and Stapersma
2002)
Figure 4-20: Example of power configuration base-case design
4.2.5.2 REDUNDANT PROPULSION NOTATION
Redundancy can be a selling point for Dockwise because clients often require a vessel with at least RP
notation for especially the LM and T&I services. Competitor vessels are more often equipped with a RP
notated power configurations. Therefore it is if economically viable, a must have notation for a new
concept. This RP notation can be achieved in several ways and levels. There can be a full-back-up
redundancy of a component or a system which results in no loss of performance after the failure of a
component or complete system. Another way is to have two or more components to fulfil one function.
After failure of one component, the vessel can still operate but at a lower performance rate. These can be
two identical components or the father-son principle (big and small engine). According to (DNV 2012) the
following important design criteria are given:
DE GB
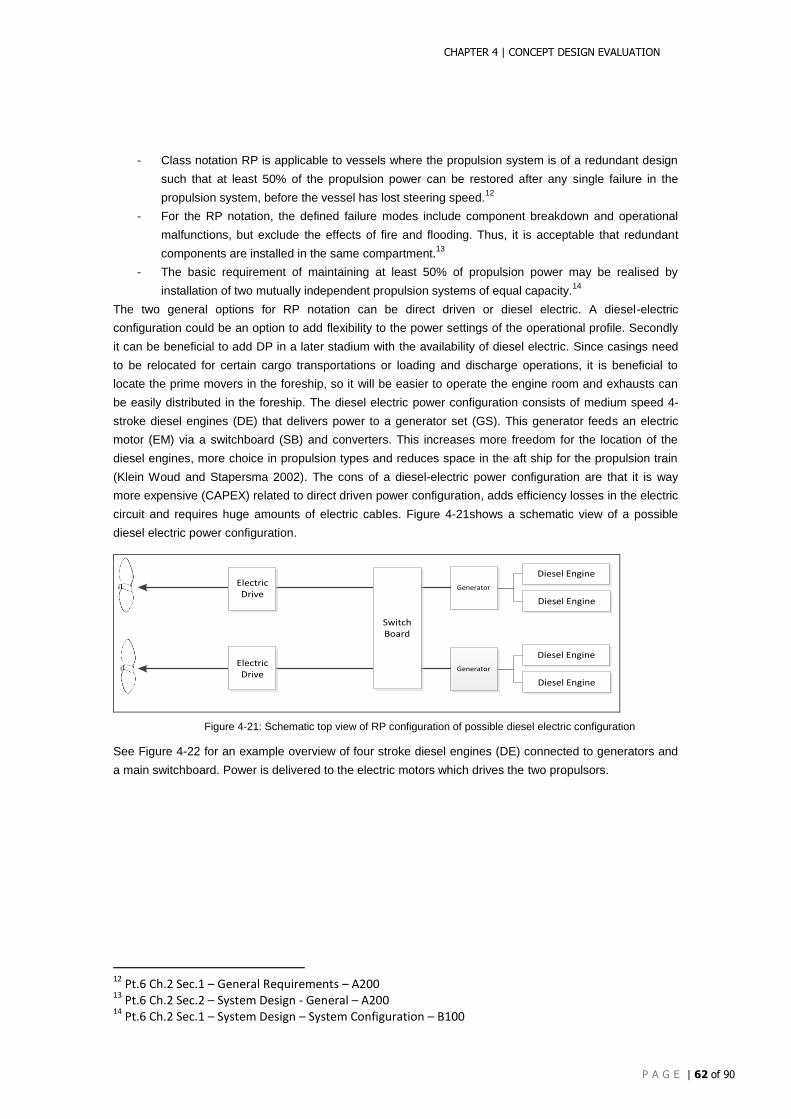
CHAPTER 4 | CONCEPT DESIGN EVALUATION
P A G E | 62 of 90
- Class notation RP is applicable to vessels where the propulsion system is of a redundant design
such that at least 50% of the propulsion power can be restored after any single failure in the
propulsion system, before the vessel has lost steering speed.12
- For the RP notation, the defined failure modes include component breakdown and operational
malfunctions, but exclude the effects of fire and flooding. Thus, it is acceptable that redundant
components are installed in the same compartment.13
- The basic requirement of maintaining at least 50% of propulsion power may be realised by
installation of two mutually independent propulsion systems of equal capacity.14
The two general options for RP notation can be direct driven or diesel electric. A diesel-electric
configuration could be an option to add flexibility to the power settings of the operational profile. Secondly
it can be beneficial to add DP in a later stadium with the availability of diesel electric. Since casings need
to be relocated for certain cargo transportations or loading and discharge operations, it is beneficial to
locate the prime movers in the foreship, so it will be easier to operate the engine room and exhausts can
be easily distributed in the foreship. The diesel electric power configuration consists of medium speed 4-
stroke diesel engines (DE) that delivers power to a generator set (GS). This generator feeds an electric
motor (EM) via a switchboard (SB) and converters. This increases more freedom for the location of the
diesel engines, more choice in propulsion types and reduces space in the aft ship for the propulsion train
(Klein Woud and Stapersma 2002). The cons of a diesel-electric power configuration are that it is way
more expensive (CAPEX) related to direct driven power configuration, adds efficiency losses in the electric
circuit and requires huge amounts of electric cables. Figure 4-21shows a schematic view of a possible
diesel electric power configuration.
Generator
Diesel Engine
Diesel Engine
Generator
Diesel Engine
Diesel Engine
Switch Board
Electric Drive
Electric Drive
Figure 4-21: Schematic top view of RP configuration of possible diesel electric configuration
See Figure 4-22 for an example overview of four stroke diesel engines (DE) connected to generators and
a main switchboard. Power is delivered to the electric motors which drives the two propulsors.
12
Pt.6 Ch.2 Sec.1 – General Requirements – A200 13
Pt.6 Ch.2 Sec.2 – System Design - General – A200 14
Pt.6 Ch.2 Sec.1 – System Design – System Configuration – B100
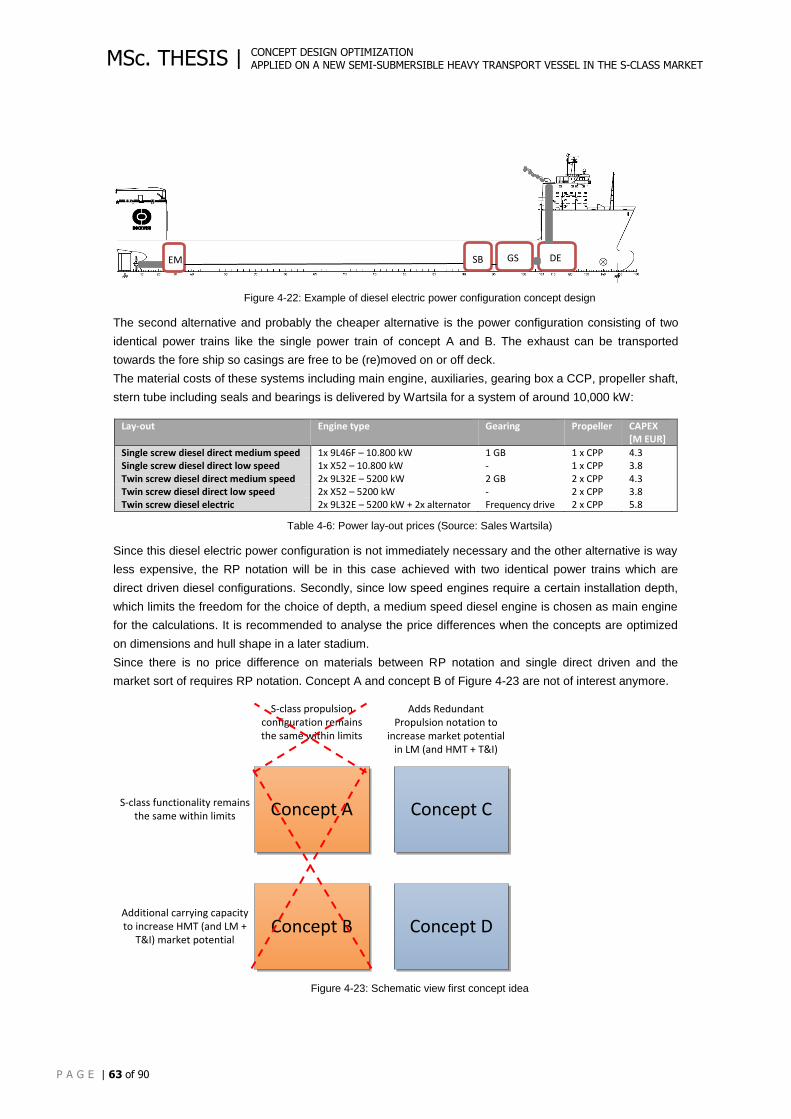
CONCEPT DESIGN OPTIMIZATION APPLIED ON A NEW SEMI-SUBMERSIBLE HEAVY TRANSPORT VESSEL IN THE S-CLASS MARKET
P A G E | 63 of 90
MSc. THESIS |
Figure 4-22: Example of diesel electric power configuration concept design
The second alternative and probably the cheaper alternative is the power configuration consisting of two
identical power trains like the single power train of concept A and B. The exhaust can be transported
towards the fore ship so casings are free to be (re)moved on or off deck.
The material costs of these systems including main engine, auxiliaries, gearing box a CCP, propeller shaft,
stern tube including seals and bearings is delivered by Wartsila for a system of around 10,000 kW:
Lay-out Engine type Gearing Propeller CAPEX
[M EUR]
Single screw diesel direct medium speed 1x 9L46F – 10.800 kW 1 GB 1 x CPP 4.3 Single screw diesel direct low speed 1x X52 – 10.800 kW - 1 x CPP 3.8 Twin screw diesel direct medium speed 2x 9L32E – 5200 kW 2 GB 2 x CPP 4.3 Twin screw diesel direct low speed 2x X52 – 5200 kW - 2 x CPP 3.8 Twin screw diesel electric 2x 9L32E – 5200 kW + 2x alternator Frequency drive 2 x CPP 5.8
Table 4-6: Power lay-out prices (Source: Sales Wartsila)
Since this diesel electric power configuration is not immediately necessary and the other alternative is way
less expensive, the RP notation will be in this case achieved with two identical power trains which are
direct driven diesel configurations. Secondly, since low speed engines require a certain installation depth,
which limits the freedom for the choice of depth, a medium speed diesel engine is chosen as main engine
for the calculations. It is recommended to analyse the price differences when the concepts are optimized
on dimensions and hull shape in a later stadium.
Since there is no price difference on materials between RP notation and single direct driven and the
market sort of requires RP notation. Concept A and concept B of Figure 4-23 are not of interest anymore.
Concept A Concept C
Concept B Concept D
S-class functionality remains the same within limits
Additional carrying capacity to increase HMT (and LM +
T&I) market potential
Adds Redundant Propulsion notation to
increase market potential in LM (and HMT + T&I)
S-class propulsion configuration remains the same within limits
Figure 4-23: Schematic view first concept idea
DE EM GS SB
CHAPTER 4 | CONCEPT DESIGN EVALUATION
P A G E | 64 of 90
4.2.5.3 SHIP RESISTANCE CALCULATION
The same ship resistance calculation method is used as for the S-class vessels. The concept hull shape
must be such, that it satisfies the boundaries of the Holtrop & Mennen method, seen in Table 3-5. For the
concepts, specific particulars have to be determined e.g. ship coefficients, propeller diameter, ballast
draught, service speed and design speed.
The main ship coefficients are determined with the ship design methodology of Schneekluth. The midship
section coefficient is based on the block coefficient of existing hull forms. With the equation of Schneekluth
and Bertram (Schneekluth and Bertram 1998), the following midship coefficient determination equation is
used. The
𝐶𝑚 = 1.006 − 0.0056𝐶𝑏−3.56 Eq. 4-5
The water plane coefficient is determined with the Schneekluth formula based on the Cb for tankers
(Schneekluth and Bertram 1998). This water plane coefficient must be corrected for heavy transport
vessels. This is evaluated in the validation and verification.
𝐶𝑤𝑝 = (1 + 2𝐶𝑏)/3 Eq. 4-6
The longitudinal prismatic coefficient shows the volume distribution along the hull form based on the
midship section coefficient and the block coefficient with the following relation (Schneekluth and Bertram
1998):
𝐶𝑝 =𝐶𝑏
𝐶𝑚
Eq. 3-11
The longitudinal position of the centre of buoyancy (LCB) is determined by Schneekluth, (Schneekluth and
Bertram 1998) assumed for tankers as follows:
𝐿𝐶𝐵 = (−13.5 + 19.4 ∙ 𝐶𝑝)/100 Eq. 4-7
The propeller size is an important design parameter for the aft ship shape. As a first indicator, the propeller
diameter is based on the diameter depth ratio of typical HTV’s of Dockwise and is related to single or
double propeller configurations.
For the ballast condition the following assumptions have to be made. According to Dockwise, a minimum
propeller submergence of 120% is required. Propeller immersion less than 100% will result in a loss of the
vessel performance, over speeding of the engine and possible damage to the machinery and shaft. On the
other hand ballast draught increases resistance. According to (Watson 1996), 0.3 meter over the propeller
tip is the minimum indicator for immersion depth. Besides the ballast capacity must be such, that the mean
ballast draught will be 2+0.02 Loa. The most conservative minimum ballast draught is based on the
minimum propeller immersion given by Dockwise which is related to the input parameters of the concept.
A trim is introduced of 1.0 meter at the aft to make this ballast condition more realistic. Based on the S-
class, the block coefficient is reduced with the ratio of Cb in ballast over Cb in transit condition, known from
the S-class.
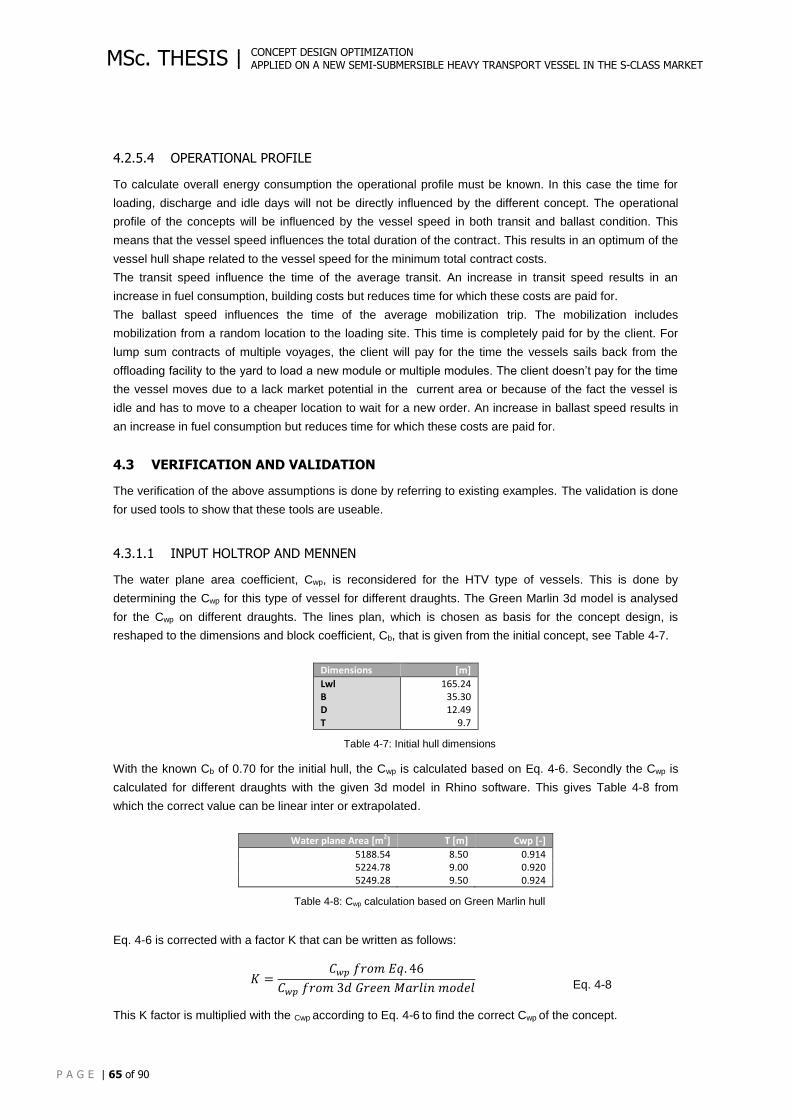
CONCEPT DESIGN OPTIMIZATION APPLIED ON A NEW SEMI-SUBMERSIBLE HEAVY TRANSPORT VESSEL IN THE S-CLASS MARKET
P A G E | 65 of 90
MSc. THESIS |
4.2.5.4 OPERATIONAL PROFILE
To calculate overall energy consumption the operational profile must be known. In this case the time for
loading, discharge and idle days will not be directly influenced by the different concept. The operational
profile of the concepts will be influenced by the vessel speed in both transit and ballast condition. This
means that the vessel speed influences the total duration of the contract. This results in an optimum of the
vessel hull shape related to the vessel speed for the minimum total contract costs.
The transit speed influence the time of the average transit. An increase in transit speed results in an
increase in fuel consumption, building costs but reduces time for which these costs are paid for.
The ballast speed influences the time of the average mobilization trip. The mobilization includes
mobilization from a random location to the loading site. This time is completely paid for by the client. For
lump sum contracts of multiple voyages, the client will pay for the time the vessels sails back from the
offloading facility to the yard to load a new module or multiple modules. The client doesn’t pay for the time
the vessel moves due to a lack market potential in the current area or because of the fact the vessel is
idle and has to move to a cheaper location to wait for a new order. An increase in ballast speed results in
an increase in fuel consumption but reduces time for which these costs are paid for.
4.3 VERIFICATION AND VALIDATION
The verification of the above assumptions is done by referring to existing examples. The validation is done
for used tools to show that these tools are useable.
4.3.1.1 INPUT HOLTROP AND MENNEN
The water plane area coefficient, Cwp, is reconsidered for the HTV type of vessels. This is done by
determining the Cwp for this type of vessel for different draughts. The Green Marlin 3d model is analysed
for the Cwp on different draughts. The lines plan, which is chosen as basis for the concept design, is
reshaped to the dimensions and block coefficient, Cb, that is given from the initial concept, see Table 4-7.
Dimensions [m]
Lwl 165.24 B 35.30 D 12.49 T 9.7
Table 4-7: Initial hull dimensions
With the known Cb of 0.70 for the initial hull, the Cwp is calculated based on Eq. 4-6. Secondly the Cwp is
calculated for different draughts with the given 3d model in Rhino software. This gives Table 4-8 from
which the correct value can be linear inter or extrapolated.
Water plane Area [m2] T [m] Cwp [-]
5188.54 8.50 0.914 5224.78 9.00 0.920 5249.28 9.50 0.924
Table 4-8: Cwp calculation based on Green Marlin hull
Eq. 4-6 is corrected with a factor K that can be written as follows:
𝐾 =𝐶𝑤𝑝 𝑓𝑟𝑜𝑚 𝐸𝑞. 4 6
𝐶𝑤𝑝 𝑓𝑟𝑜𝑚 3𝑑 𝐺𝑟𝑒𝑒𝑛 𝑀𝑎𝑟𝑙𝑖𝑛 𝑚𝑜𝑑𝑒𝑙 Eq. 4-8
This K factor is multiplied with the Cwp according to Eq. 4-6 to find the correct Cwp of the concept.
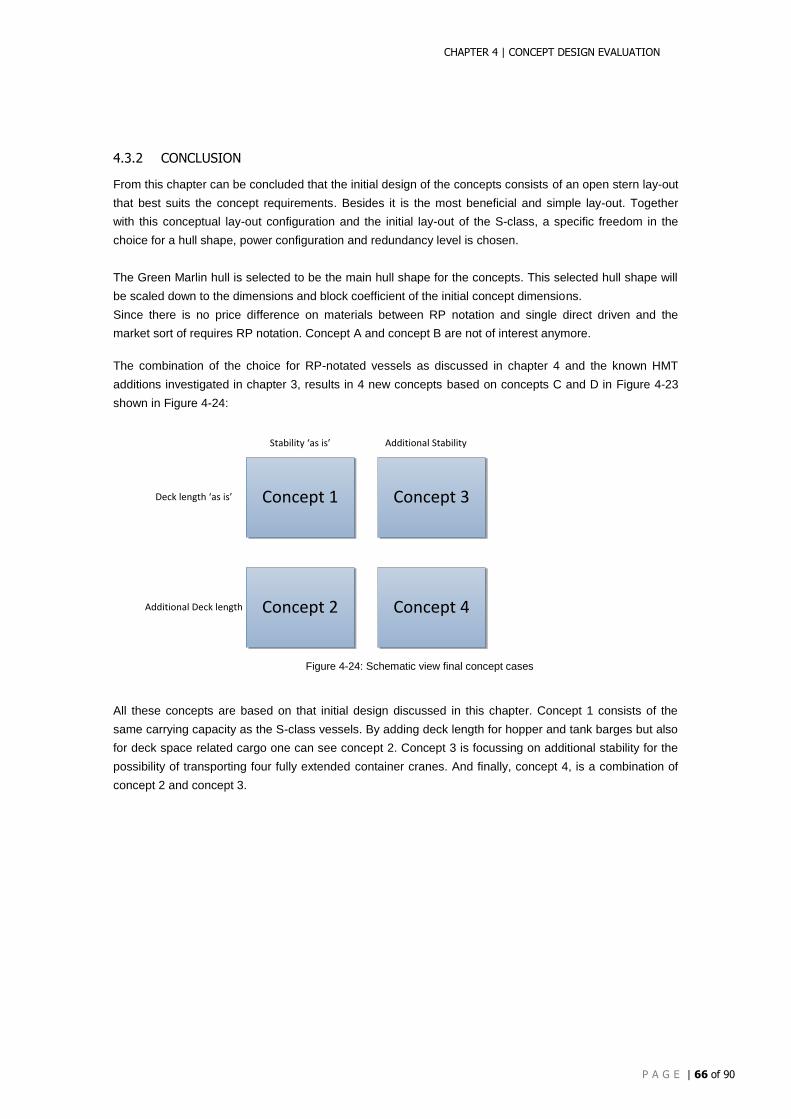
CHAPTER 4 | CONCEPT DESIGN EVALUATION
P A G E | 66 of 90
4.3.2 CONCLUSION
From this chapter can be concluded that the initial design of the concepts consists of an open stern lay-out
that best suits the concept requirements. Besides it is the most beneficial and simple lay-out. Together
with this conceptual lay-out configuration and the initial lay-out of the S-class, a specific freedom in the
choice for a hull shape, power configuration and redundancy level is chosen.
The Green Marlin hull is selected to be the main hull shape for the concepts. This selected hull shape will
be scaled down to the dimensions and block coefficient of the initial concept dimensions.
Since there is no price difference on materials between RP notation and single direct driven and the
market sort of requires RP notation. Concept A and concept B are not of interest anymore.
The combination of the choice for RP-notated vessels as discussed in chapter 4 and the known HMT
additions investigated in chapter 3, results in 4 new concepts based on concepts C and D in Figure 4-23
shown in Figure 4-24:
Concept 1 Concept 3
Concept 2 Concept 4
Deck length ‘as is’
Additional Deck length
Additional StabilityStability ‘as is’
Figure 4-24: Schematic view final concept cases
All these concepts are based on that initial design discussed in this chapter. Concept 1 consists of the
same carrying capacity as the S-class vessels. By adding deck length for hopper and tank barges but also
for deck space related cargo one can see concept 2. Concept 3 is focussing on additional stability for the
possibility of transporting four fully extended container cranes. And finally, concept 4, is a combination of
concept 2 and concept 3.
CONCEPT DESIGN OPTIMIZATION APPLIED ON A NEW SEMI-SUBMERSIBLE HEAVY TRANSPORT VESSEL IN THE S-CLASS MARKET
P A G E | 67 of 90
MSc. THESIS |
5 CONCEPT DESIGN OPTIMIZATION
To optimize the most economic concept dimensions, parameter constraints are introduced. Including this
constraints for different concept choices results in concepts with optimum length, width, depth, block
coefficient and vessel speed both during transit and ballast condition.
5.1 OPTIMIZING THEORY
To optimize the dimensions and speed for transit and ballast condition, the total costs per contract related
to the vessel speed in ballast and transit condition is leading. With the required freight rate and the
corresponding operational profile, running days, transit speed and ballast speed, the total costs per
contract are calculated, which is the optimizing function. This total costs per contract is based on a fictive
contract duration that is the average of all different cargo types related contract durations and correspond
to the standardized fictive operational profile. With a solving application, the vessel hull shape and speed
is optimized based on this optimizing function and the vessel requirements.
5.1.1 DIMENSIONAL AND SPEED REQUIREMENTS
The dimensional constraints are based on the market analysis, and the current S-class vessels. The
length, width and depth are considered as well as the shape which is related to the block coefficient.
.
5.1.1.1 LENGTH
The length strongly depends on the chosen lay-out. The required minimum deck length must equal as the
S-class deck length. The casings and foreship part together with this deck length gives the total vessel
length. Figure 4-12, shows that with the same dimensions a deck length can be reached of around 140
meter. Decreasing this deck length towards the S-class size of 126.7 meter results in a minimum vessel
length over all of around 13 meters shorter, thus 168 meter. Since decreasing vessel length decreases
required steel weight this seems to be attractive. This length of 168 meter includes the minimum storage,
accommodation and deck space at the bow for a conventional open stern vessel with a crew size of 24
people. The initial minimum length is set on 168 meter for concept 1 and concept 3. When other designs
are considered this length over all may change, and only the required deck length is leading.
For additional HMT cargo and barges, the required free deck space is insufficient. According to the cargo
driven vessel regulations of Table 2-14 the deck length is required to be at least 136.7 meter. With this and
the assumption of a minimum casing space of around 10 meter and a forecastle deck of around 30 meter
for a conventional open stern vessel, the minimum vessel length for concept 2 and concept 4 is assumed
to be 178.0 meter (168 meter added with 10 meters of deck length)
5.1.1.2 WIDTH
The width of the S-class vessels was limited due to Panama canal locks limitations. Since this is not the
case for a new concept vessel with the new panama canal locks, the width can exceed. With the fact that
a lesser deck width decreases cargo possibilities and deck support, the deck width of the S-class is the
minimum width for the concept vessel. The initial minimum width is set on 31.7 meter which is the current
deck width of the S-class. The maximum width will be related to the rapid increase in voyage costs and
capital costs and stability.
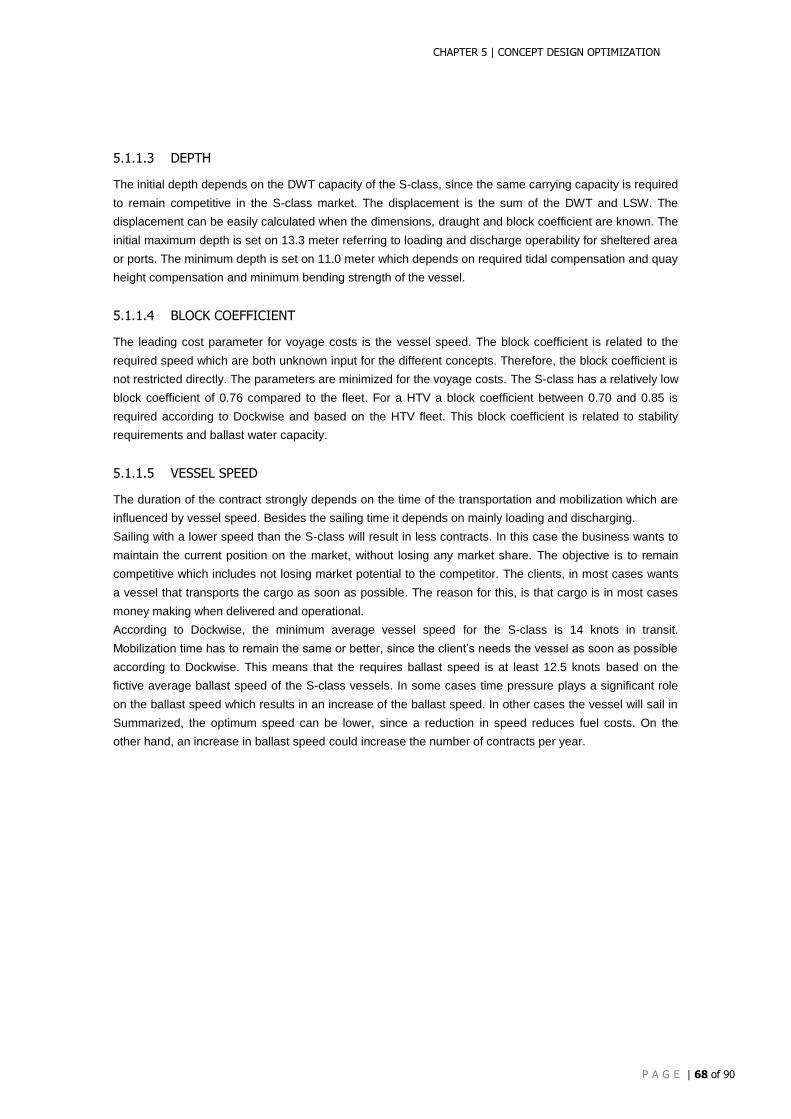
CHAPTER 5 | CONCEPT DESIGN OPTIMIZATION
P A G E | 68 of 90
5.1.1.3 DEPTH
The initial depth depends on the DWT capacity of the S-class, since the same carrying capacity is required
to remain competitive in the S-class market. The displacement is the sum of the DWT and LSW. The
displacement can be easily calculated when the dimensions, draught and block coefficient are known. The
initial maximum depth is set on 13.3 meter referring to loading and discharge operability for sheltered area
or ports. The minimum depth is set on 11.0 meter which depends on required tidal compensation and quay
height compensation and minimum bending strength of the vessel.
5.1.1.4 BLOCK COEFFICIENT
The leading cost parameter for voyage costs is the vessel speed. The block coefficient is related to the
required speed which are both unknown input for the different concepts. Therefore, the block coefficient is
not restricted directly. The parameters are minimized for the voyage costs. The S-class has a relatively low
block coefficient of 0.76 compared to the fleet. For a HTV a block coefficient between 0.70 and 0.85 is
required according to Dockwise and based on the HTV fleet. This block coefficient is related to stability
requirements and ballast water capacity.
5.1.1.5 VESSEL SPEED
The duration of the contract strongly depends on the time of the transportation and mobilization which are
influenced by vessel speed. Besides the sailing time it depends on mainly loading and discharging.
Sailing with a lower speed than the S-class will result in less contracts. In this case the business wants to
maintain the current position on the market, without losing any market share. The objective is to remain
competitive which includes not losing market potential to the competitor. The clients, in most cases wants
a vessel that transports the cargo as soon as possible. The reason for this, is that cargo is in most cases
money making when delivered and operational.
According to Dockwise, the minimum average vessel speed for the S-class is 14 knots in transit.
Mobilization time has to remain the same or better, since the client’s needs the vessel as soon as possible
according to Dockwise. This means that the requires ballast speed is at least 12.5 knots based on the
fictive average ballast speed of the S-class vessels. In some cases time pressure plays a significant role
on the ballast speed which results in an increase of the ballast speed. In other cases the vessel will sail in
Summarized, the optimum speed can be lower, since a reduction in speed reduces fuel costs. On the
other hand, an increase in ballast speed could increase the number of contracts per year.
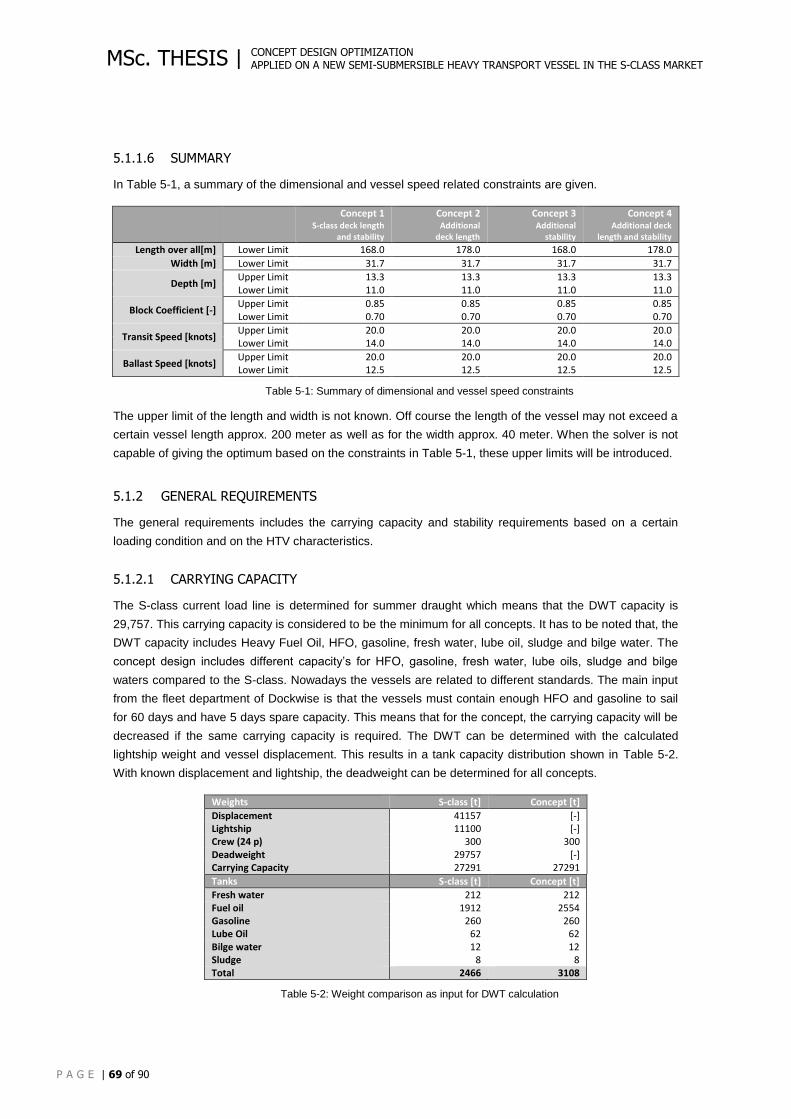
CONCEPT DESIGN OPTIMIZATION APPLIED ON A NEW SEMI-SUBMERSIBLE HEAVY TRANSPORT VESSEL IN THE S-CLASS MARKET
P A G E | 69 of 90
MSc. THESIS |
5.1.1.6 SUMMARY
In Table 5-1, a summary of the dimensional and vessel speed related constraints are given.
Concept 1 S-class deck length
and stability
Concept 2 Additional
deck length
Concept 3 Additional
stability
Concept 4 Additional deck
length and stability Length over all[m] Lower Limit 168.0 178.0 168.0 178.0
Width [m] Lower Limit 31.7 31.7 31.7 31.7
Depth [m] Upper Limit 13.3 13.3 13.3 13.3 Lower Limit 11.0 11.0 11.0 11.0
Block Coefficient [-] Upper Limit 0.85 0.85 0.85 0.85 Lower Limit 0.70 0.70 0.70 0.70
Transit Speed [knots] Upper Limit 20.0 20.0 20.0 20.0 Lower Limit 14.0 14.0 14.0 14.0
Ballast Speed [knots] Upper Limit 20.0 20.0 20.0 20.0 Lower Limit 12.5 12.5 12.5 12.5
Table 5-1: Summary of dimensional and vessel speed constraints
The upper limit of the length and width is not known. Off course the length of the vessel may not exceed a
certain vessel length approx. 200 meter as well as for the width approx. 40 meter. When the solver is not
capable of giving the optimum based on the constraints in Table 5-1, these upper limits will be introduced.
5.1.2 GENERAL REQUIREMENTS
The general requirements includes the carrying capacity and stability requirements based on a certain
loading condition and on the HTV characteristics.
5.1.2.1 CARRYING CAPACITY
The S-class current load line is determined for summer draught which means that the DWT capacity is
29,757. This carrying capacity is considered to be the minimum for all concepts. It has to be noted that, the
DWT capacity includes Heavy Fuel Oil, HFO, gasoline, fresh water, lube oil, sludge and bilge water. The
concept design includes different capacity’s for HFO, gasoline, fresh water, lube oils, sludge and bilge
waters compared to the S-class. Nowadays the vessels are related to different standards. The main input
from the fleet department of Dockwise is that the vessels must contain enough HFO and gasoline to sail
for 60 days and have 5 days spare capacity. This means that for the concept, the carrying capacity will be
decreased if the same carrying capacity is required. The DWT can be determined with the calculated
lightship weight and vessel displacement. This results in a tank capacity distribution shown in Table 5-2.
With known displacement and lightship, the deadweight can be determined for all concepts.
Weights S-class [t] Concept [t]
Displacement 41157 [-] Lightship 11100 [-] Crew (24 p) 300 300 Deadweight 29757 [-] Carrying Capacity 27291 27291
Tanks S-class [t] Concept [t]
Fresh water 212 212 Fuel oil 1912 2554 Gasoline 260 260 Lube Oil 62 62 Bilge water 12 12 Sludge 8 8 Total 2466 3108
Table 5-2: Weight comparison as input for DWT calculation
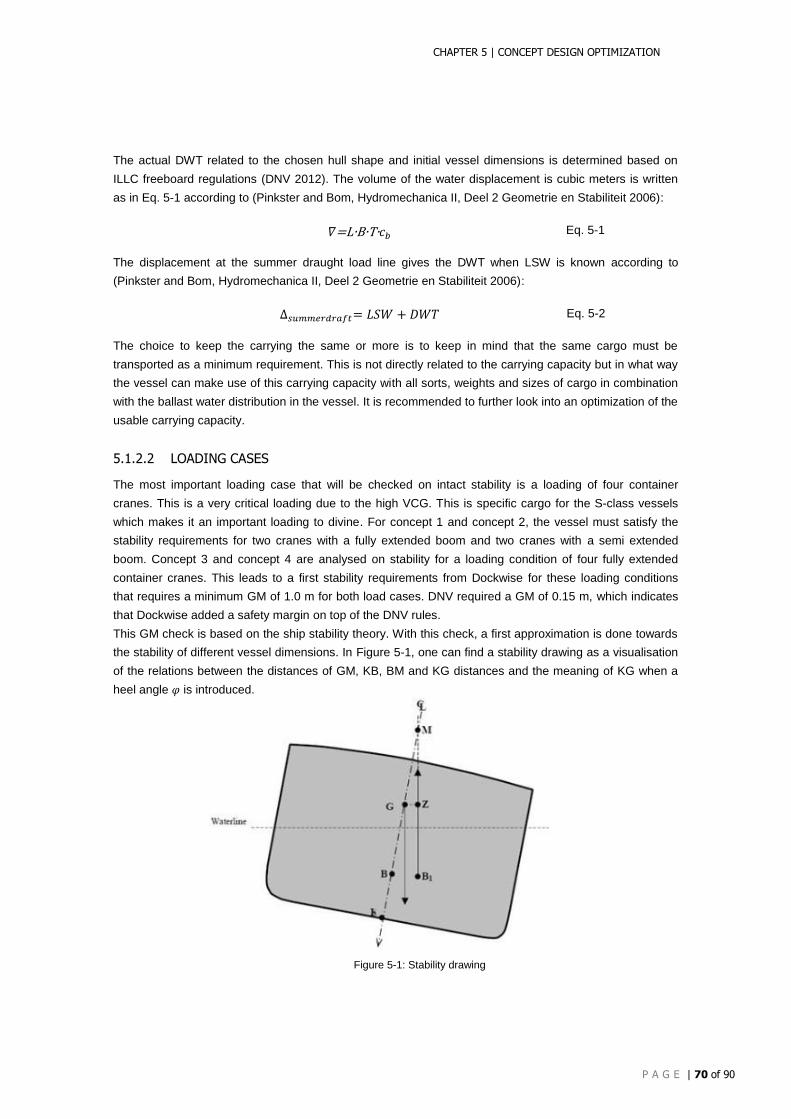
CHAPTER 5 | CONCEPT DESIGN OPTIMIZATION
P A G E | 70 of 90
The actual DWT related to the chosen hull shape and initial vessel dimensions is determined based on
ILLC freeboard regulations (DNV 2012). The volume of the water displacement is cubic meters is written
as in Eq. 5-1 according to (Pinkster and Bom, Hydromechanica II, Deel 2 Geometrie en Stabiliteit 2006):
𝛻=L∙B∙T∙𝑐𝑏 Eq. 5-1
The displacement at the summer draught load line gives the DWT when LSW is known according to
(Pinkster and Bom, Hydromechanica II, Deel 2 Geometrie en Stabiliteit 2006):
∆𝑠𝑢𝑚𝑚𝑒𝑟𝑑𝑟𝑎𝑓𝑡= 𝐿𝑆𝑊 + 𝐷𝑊𝑇 Eq. 5-2
The choice to keep the carrying the same or more is to keep in mind that the same cargo must be
transported as a minimum requirement. This is not directly related to the carrying capacity but in what way
the vessel can make use of this carrying capacity with all sorts, weights and sizes of cargo in combination
with the ballast water distribution in the vessel. It is recommended to further look into an optimization of the
usable carrying capacity.
5.1.2.2 LOADING CASES
The most important loading case that will be checked on intact stability is a loading of four container
cranes. This is a very critical loading due to the high VCG. This is specific cargo for the S-class vessels
which makes it an important loading to divine. For concept 1 and concept 2, the vessel must satisfy the
stability requirements for two cranes with a fully extended boom and two cranes with a semi extended
boom. Concept 3 and concept 4 are analysed on stability for a loading condition of four fully extended
container cranes. This leads to a first stability requirements from Dockwise for these loading conditions
that requires a minimum GM of 1.0 m for both load cases. DNV required a GM of 0.15 m, which indicates
that Dockwise added a safety margin on top of the DNV rules.
This GM check is based on the ship stability theory. With this check, a first approximation is done towards
the stability of different vessel dimensions. In Figure 5-1, one can find a stability drawing as a visualisation
of the relations between the distances of GM, KB, BM and KG distances and the meaning of KG when a
heel angle 𝜑 is introduced.
Figure 5-1: Stability drawing
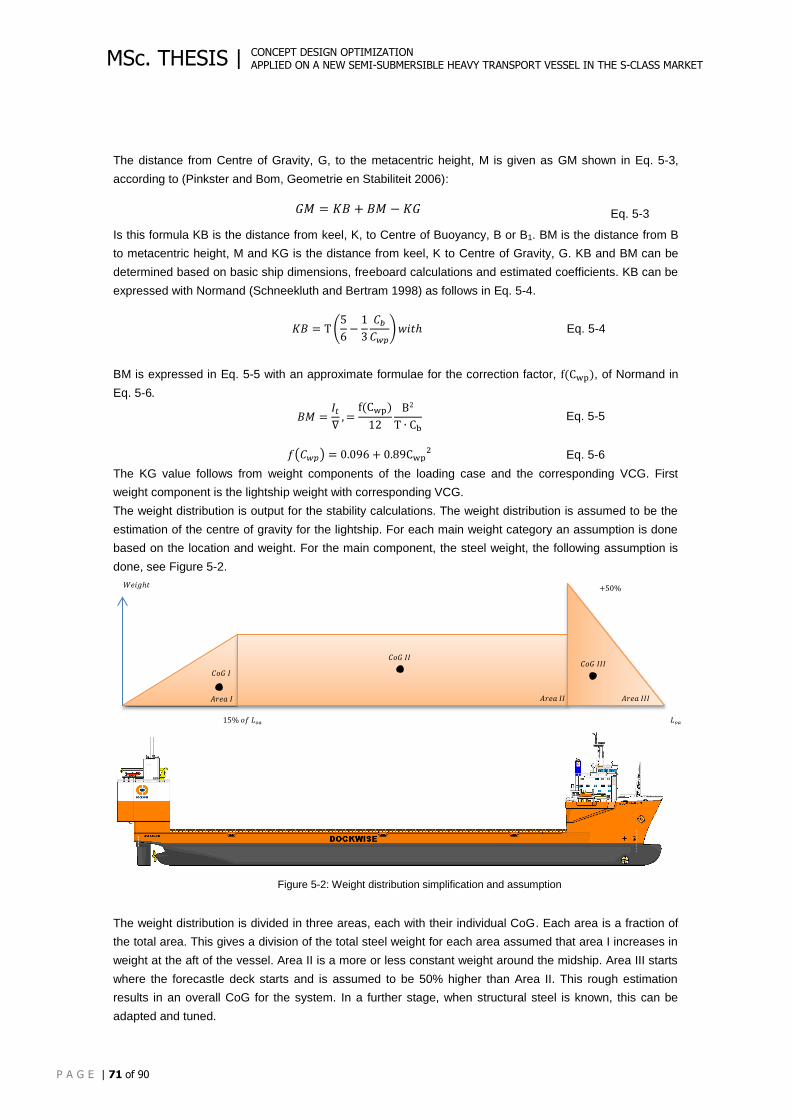
CONCEPT DESIGN OPTIMIZATION APPLIED ON A NEW SEMI-SUBMERSIBLE HEAVY TRANSPORT VESSEL IN THE S-CLASS MARKET
P A G E | 71 of 90
MSc. THESIS |
The distance from Centre of Gravity, G, to the metacentric height, M is given as GM shown in Eq. 5-3,
according to (Pinkster and Bom, Geometrie en Stabiliteit 2006):
𝐺𝑀 = 𝐾𝐵 + 𝐵𝑀 − 𝐾𝐺 Eq. 5-3
Is this formula KB is the distance from keel, K, to Centre of Buoyancy, B or B1. BM is the distance from B
to metacentric height, M and KG is the distance from keel, K to Centre of Gravity, G. KB and BM can be
determined based on basic ship dimensions, freeboard calculations and estimated coefficients. KB can be
expressed with Normand (Schneekluth and Bertram 1998) as follows in Eq. 5-4.
𝐾𝐵 = T (5
6−
1
3
𝐶𝑏
𝐶𝑤𝑝) 𝑤𝑖𝑡ℎ Eq. 5-4
BM is expressed in Eq. 5-5 with an approximate formulae for the correction factor, f(Cwp), of Normand in
Eq. 5-6.
𝐵𝑀 =𝐼𝑡
∇, =
f(Cwp)
12
B2
T ∙ Cb Eq. 5-5
𝑓(𝐶𝑤𝑝) = 0.096 + 0.89Cwp2 Eq. 5-6
The KG value follows from weight components of the loading case and the corresponding VCG. First
weight component is the lightship weight with corresponding VCG.
The weight distribution is output for the stability calculations. The weight distribution is assumed to be the
estimation of the centre of gravity for the lightship. For each main weight category an assumption is done
based on the location and weight. For the main component, the steel weight, the following assumption is
done, see Figure 5-2.
Figure 5-2: Weight distribution simplification and assumption
The weight distribution is divided in three areas, each with their individual CoG. Each area is a fraction of
the total area. This gives a division of the total steel weight for each area assumed that area I increases in
weight at the aft of the vessel. Area II is a more or less constant weight around the midship. Area III starts
where the forecastle deck starts and is assumed to be 50% higher than Area II. This rough estimation
results in an overall CoG for the system. In a further stage, when structural steel is known, this can be
adapted and tuned.
𝑊𝑒𝑖𝑔ℎ𝑡
15% 𝑜𝑓 𝐿𝑜𝑎 𝐿𝑜𝑎
𝐴𝑟𝑒𝑎 𝐼 𝐴𝑟𝑒𝑎 𝐼𝐼𝐼 𝐴𝑟𝑒𝑎 𝐼𝐼
𝐶𝑜𝐺 𝐼 𝐶𝑜𝐺 𝐼𝐼𝐼
𝐶𝑜𝐺 𝐼𝐼
+50%
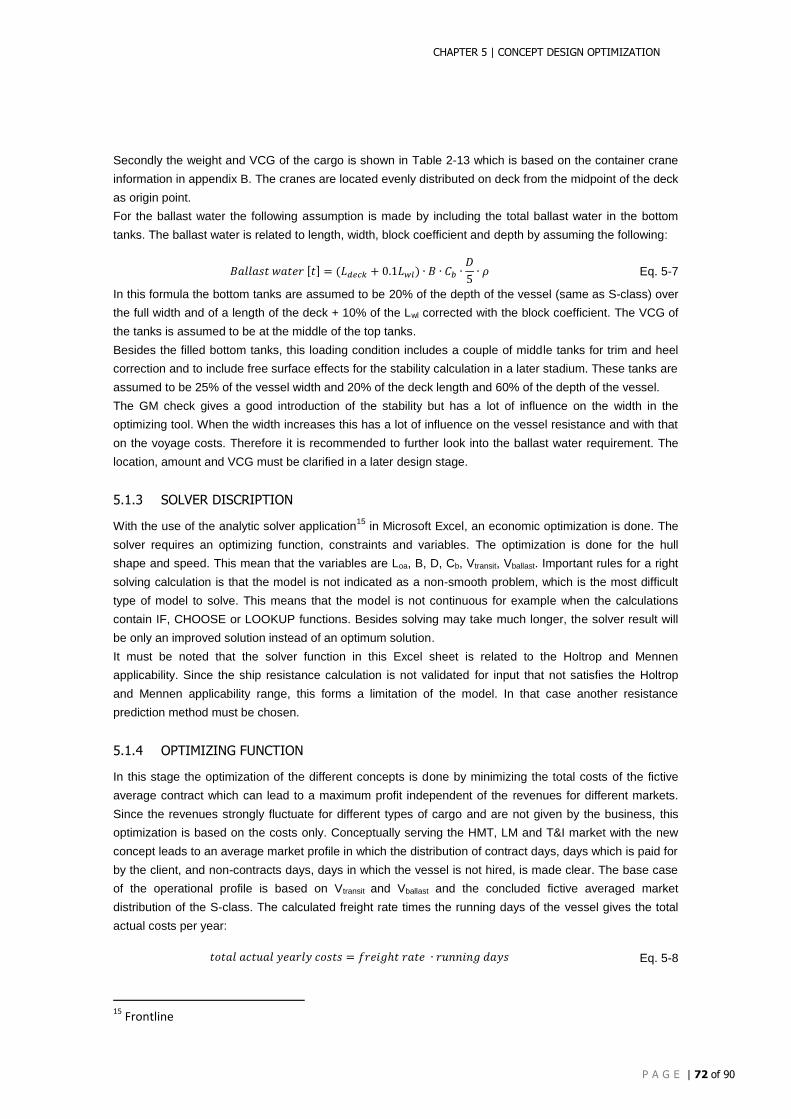
CHAPTER 5 | CONCEPT DESIGN OPTIMIZATION
P A G E | 72 of 90
Secondly the weight and VCG of the cargo is shown in Table 2-13 which is based on the container crane
information in appendix B. The cranes are located evenly distributed on deck from the midpoint of the deck
as origin point.
For the ballast water the following assumption is made by including the total ballast water in the bottom
tanks. The ballast water is related to length, width, block coefficient and depth by assuming the following:
𝐵𝑎𝑙𝑙𝑎𝑠𝑡 𝑤𝑎𝑡𝑒𝑟 [𝑡] = (𝐿𝑑𝑒𝑐𝑘 + 0.1𝐿𝑤𝑙) ∙ 𝐵 ∙ 𝐶𝑏 ∙𝐷
5∙ 𝜌 Eq. 5-7
In this formula the bottom tanks are assumed to be 20% of the depth of the vessel (same as S-class) over
the full width and of a length of the deck + 10% of the Lwl corrected with the block coefficient. The VCG of
the tanks is assumed to be at the middle of the top tanks.
Besides the filled bottom tanks, this loading condition includes a couple of middle tanks for trim and heel
correction and to include free surface effects for the stability calculation in a later stadium. These tanks are
assumed to be 25% of the vessel width and 20% of the deck length and 60% of the depth of the vessel.
The GM check gives a good introduction of the stability but has a lot of influence on the width in the
optimizing tool. When the width increases this has a lot of influence on the vessel resistance and with that
on the voyage costs. Therefore it is recommended to further look into the ballast water requirement. The
location, amount and VCG must be clarified in a later design stage.
5.1.3 SOLVER DISCRIPTION
With the use of the analytic solver application15
in Microsoft Excel, an economic optimization is done. The
solver requires an optimizing function, constraints and variables. The optimization is done for the hull
shape and speed. This mean that the variables are Loa, B, D, Cb, Vtransit, Vballast. Important rules for a right
solving calculation is that the model is not indicated as a non-smooth problem, which is the most difficult
type of model to solve. This means that the model is not continuous for example when the calculations
contain IF, CHOOSE or LOOKUP functions. Besides solving may take much longer, the solver result will
be only an improved solution instead of an optimum solution.
It must be noted that the solver function in this Excel sheet is related to the Holtrop and Mennen
applicability. Since the ship resistance calculation is not validated for input that not satisfies the Holtrop
and Mennen applicability range, this forms a limitation of the model. In that case another resistance
prediction method must be chosen.
5.1.4 OPTIMIZING FUNCTION
In this stage the optimization of the different concepts is done by minimizing the total costs of the fictive
average contract which can lead to a maximum profit independent of the revenues for different markets.
Since the revenues strongly fluctuate for different types of cargo and are not given by the business, this
optimization is based on the costs only. Conceptually serving the HMT, LM and T&I market with the new
concept leads to an average market profile in which the distribution of contract days, days which is paid for
by the client, and non-contracts days, days in which the vessel is not hired, is made clear. The base case
of the operational profile is based on Vtransit and Vballast and the concluded fictive averaged market
distribution of the S-class. The calculated freight rate times the running days of the vessel gives the total
actual costs per year:
𝑡𝑜𝑡𝑎𝑙 𝑎𝑐𝑡𝑢𝑎𝑙 𝑦𝑒𝑎𝑟𝑙𝑦 𝑐𝑜𝑠𝑡𝑠 = 𝑓𝑟𝑒𝑖𝑔ℎ𝑡 𝑟𝑎𝑡𝑒 ∙ 𝑟𝑢𝑛𝑛𝑖𝑛𝑔 𝑑𝑎𝑦𝑠 Eq. 5-8
15
Frontline
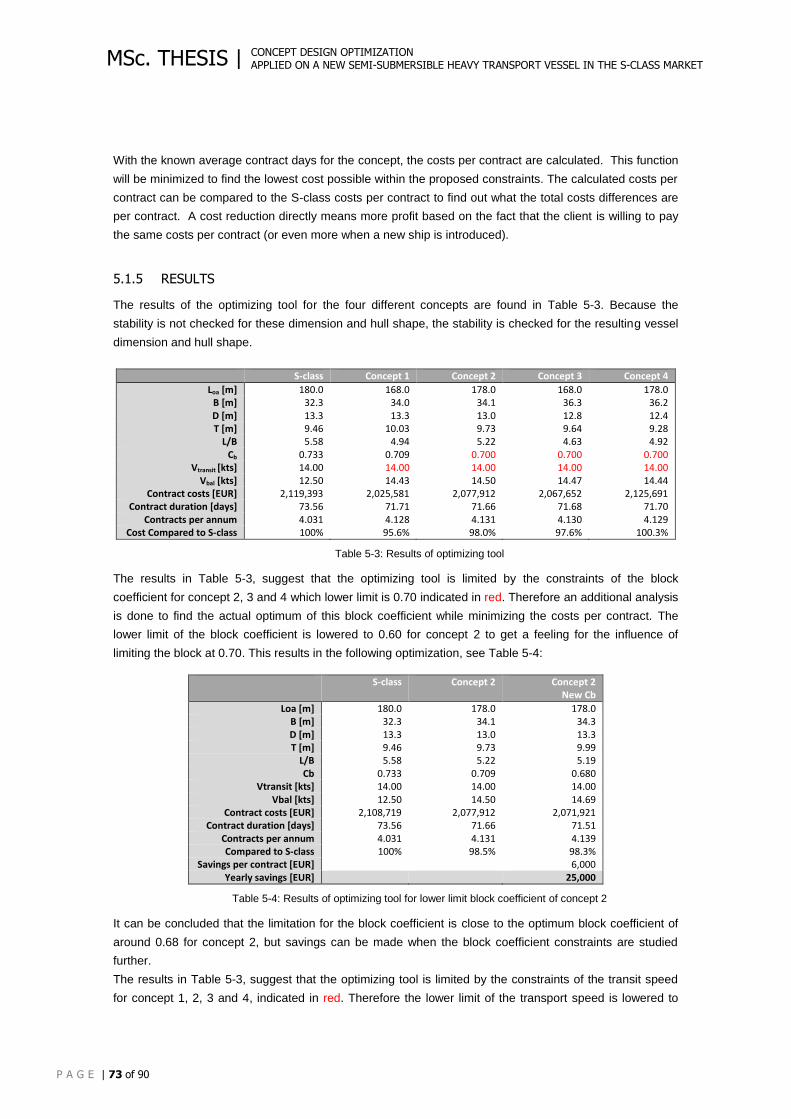
CONCEPT DESIGN OPTIMIZATION APPLIED ON A NEW SEMI-SUBMERSIBLE HEAVY TRANSPORT VESSEL IN THE S-CLASS MARKET
P A G E | 73 of 90
MSc. THESIS |
With the known average contract days for the concept, the costs per contract are calculated. This function
will be minimized to find the lowest cost possible within the proposed constraints. The calculated costs per
contract can be compared to the S-class costs per contract to find out what the total costs differences are
per contract. A cost reduction directly means more profit based on the fact that the client is willing to pay
the same costs per contract (or even more when a new ship is introduced).
5.1.5 RESULTS
The results of the optimizing tool for the four different concepts are found in Table 5-3. Because the
stability is not checked for these dimension and hull shape, the stability is checked for the resulting vessel
dimension and hull shape.
S-class Concept 1 Concept 2 Concept 3 Concept 4
Loa [m] 180.0 168.0 178.0 168.0 178.0 B [m] 32.3 34.0 34.1 36.3 36.2 D [m] 13.3 13.3 13.0 12.8 12.4 T [m] 9.46 10.03 9.73 9.64 9.28
L/B 5.58 4.94 5.22 4.63 4.92 Cb 0.733 0.709 0.700 0.700 0.700
Vtransit [kts] 14.00 14.00 14.00 14.00 14.00 Vbal [kts] 12.50 14.43 14.50 14.47 14.44
Contract costs [EUR] 2,119,393 2,025,581 2,077,912 2,067,652 2,125,691 Contract duration [days] 73.56 71.71 71.66 71.68 71.70
Contracts per annum 4.031 4.128 4.131 4.130 4.129 Cost Compared to S-class 100% 95.6% 98.0% 97.6% 100.3%
Table 5-3: Results of optimizing tool
The results in Table 5-3, suggest that the optimizing tool is limited by the constraints of the block
coefficient for concept 2, 3 and 4 which lower limit is 0.70 indicated in red. Therefore an additional analysis
is done to find the actual optimum of this block coefficient while minimizing the costs per contract. The
lower limit of the block coefficient is lowered to 0.60 for concept 2 to get a feeling for the influence of
limiting the block at 0.70. This results in the following optimization, see Table 5-4:
S-class Concept 2 Concept 2
New Cb
Loa [m] 180.0 178.0 178.0 B [m] 32.3 34.1 34.3 D [m] 13.3 13.0 13.3 T [m] 9.46 9.73 9.99
L/B 5.58 5.22 5.19 Cb 0.733 0.709 0.680
Vtransit [kts] 14.00 14.00 14.00 Vbal [kts] 12.50 14.50 14.69
Contract costs [EUR] 2,108,719 2,077,912 2,071,921 Contract duration [days] 73.56 71.66 71.51
Contracts per annum 4.031 4.131 4.139 Compared to S-class 100% 98.5% 98.3%
Savings per contract [EUR] 6,000 Yearly savings [EUR] 25,000
Table 5-4: Results of optimizing tool for lower limit block coefficient of concept 2
It can be concluded that the limitation for the block coefficient is close to the optimum block coefficient of
around 0.68 for concept 2, but savings can be made when the block coefficient constraints are studied
further.
The results in Table 5-3, suggest that the optimizing tool is limited by the constraints of the transit speed
for concept 1, 2, 3 and 4, indicated in red. Therefore the lower limit of the transport speed is lowered to
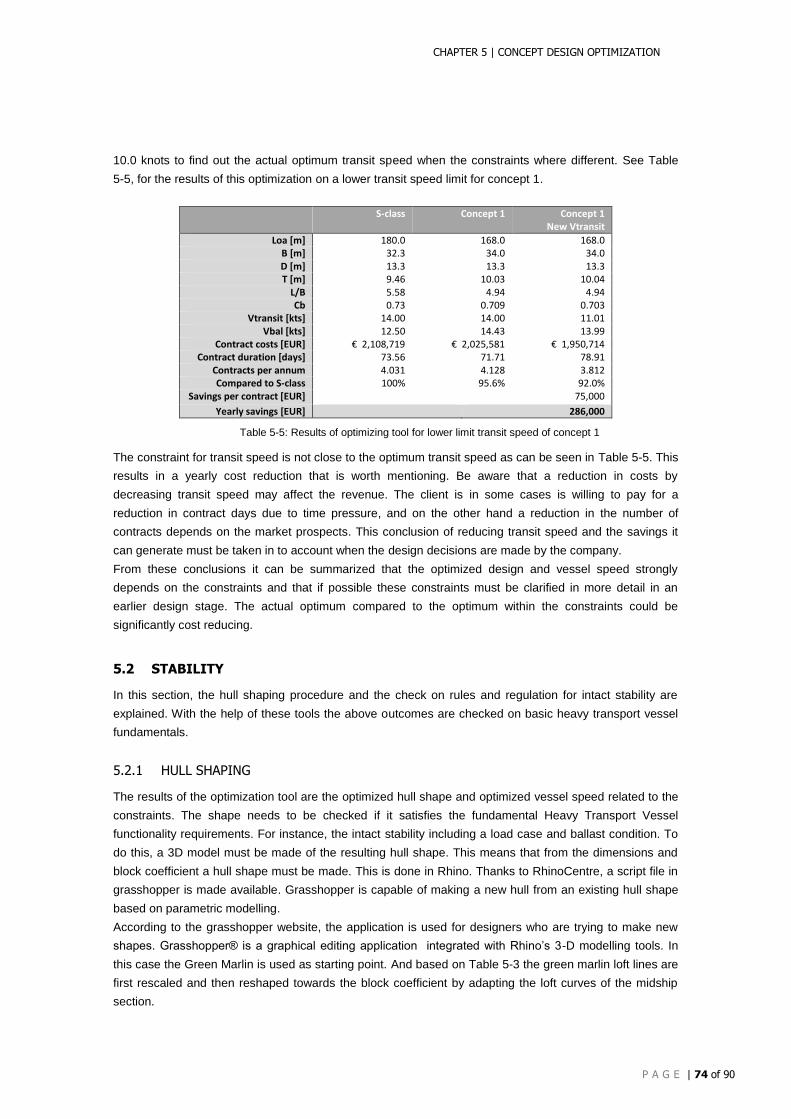
CHAPTER 5 | CONCEPT DESIGN OPTIMIZATION
P A G E | 74 of 90
10.0 knots to find out the actual optimum transit speed when the constraints where different. See Table
5-5, for the results of this optimization on a lower transit speed limit for concept 1.
S-class Concept 1 Concept 1
New Vtransit
Loa [m] 180.0 168.0 168.0 B [m] 32.3 34.0 34.0 D [m] 13.3 13.3 13.3 T [m] 9.46 10.03 10.04
L/B 5.58 4.94 4.94 Cb 0.73 0.709 0.703
Vtransit [kts] 14.00 14.00 11.01 Vbal [kts] 12.50 14.43 13.99
Contract costs [EUR] € 2,108,719 € 2,025,581 € 1,950,714 Contract duration [days] 73.56 71.71 78.91
Contracts per annum 4.031 4.128 3.812 Compared to S-class 100% 95.6% 92.0%
Savings per contract [EUR] 75,000
Yearly savings [EUR] 286,000
Table 5-5: Results of optimizing tool for lower limit transit speed of concept 1
The constraint for transit speed is not close to the optimum transit speed as can be seen in Table 5-5. This
results in a yearly cost reduction that is worth mentioning. Be aware that a reduction in costs by
decreasing transit speed may affect the revenue. The client is in some cases is willing to pay for a
reduction in contract days due to time pressure, and on the other hand a reduction in the number of
contracts depends on the market prospects. This conclusion of reducing transit speed and the savings it
can generate must be taken in to account when the design decisions are made by the company.
From these conclusions it can be summarized that the optimized design and vessel speed strongly
depends on the constraints and that if possible these constraints must be clarified in more detail in an
earlier design stage. The actual optimum compared to the optimum within the constraints could be
significantly cost reducing.
5.2 STABILITY
In this section, the hull shaping procedure and the check on rules and regulation for intact stability are
explained. With the help of these tools the above outcomes are checked on basic heavy transport vessel
fundamentals.
5.2.1 HULL SHAPING
The results of the optimization tool are the optimized hull shape and optimized vessel speed related to the
constraints. The shape needs to be checked if it satisfies the fundamental Heavy Transport Vessel
functionality requirements. For instance, the intact stability including a load case and ballast condition. To
do this, a 3D model must be made of the resulting hull shape. This means that from the dimensions and
block coefficient a hull shape must be made. This is done in Rhino. Thanks to RhinoCentre, a script file in
grasshopper is made available. Grasshopper is capable of making a new hull from an existing hull shape
based on parametric modelling.
According to the grasshopper website, the application is used for designers who are trying to make new
shapes. Grasshopper® is a graphical editing application integrated with Rhino’s 3-D modelling tools. In
this case the Green Marlin is used as starting point. And based on Table 5-3 the green marlin loft lines are
first rescaled and then reshaped towards the block coefficient by adapting the loft curves of the midship
section.
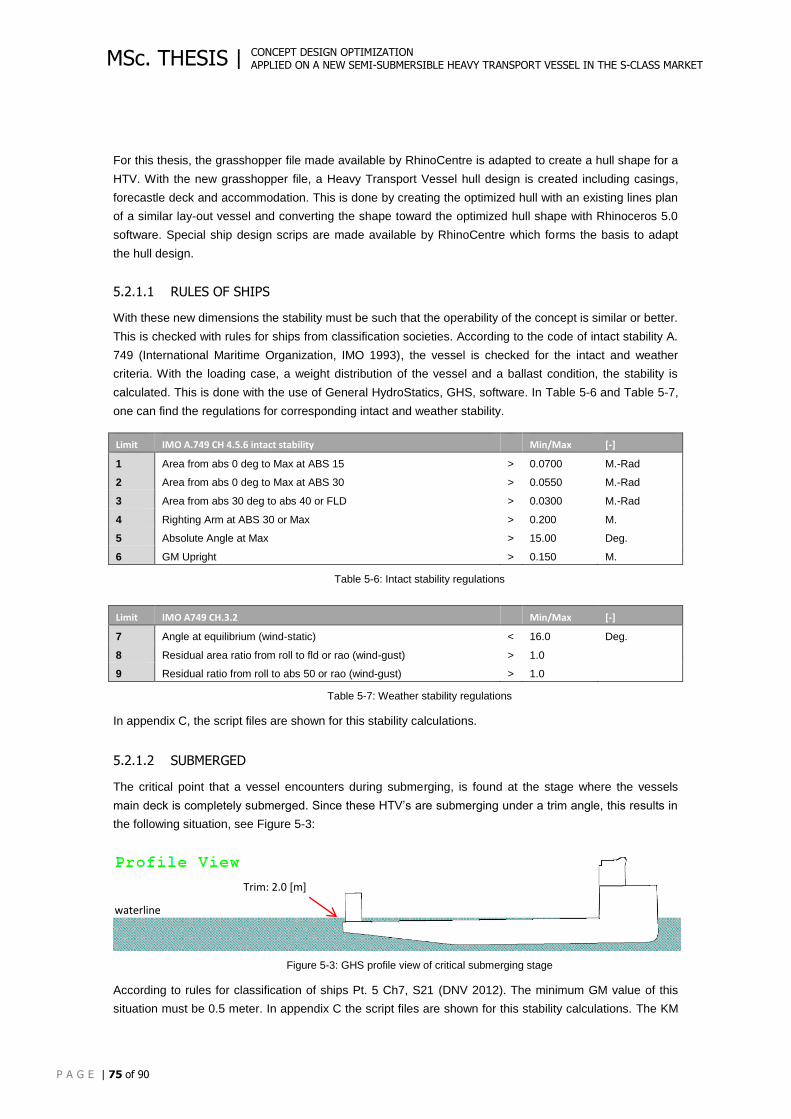
CONCEPT DESIGN OPTIMIZATION APPLIED ON A NEW SEMI-SUBMERSIBLE HEAVY TRANSPORT VESSEL IN THE S-CLASS MARKET
P A G E | 75 of 90
MSc. THESIS |
For this thesis, the grasshopper file made available by RhinoCentre is adapted to create a hull shape for a
HTV. With the new grasshopper file, a Heavy Transport Vessel hull design is created including casings,
forecastle deck and accommodation. This is done by creating the optimized hull with an existing lines plan
of a similar lay-out vessel and converting the shape toward the optimized hull shape with Rhinoceros 5.0
software. Special ship design scrips are made available by RhinoCentre which forms the basis to adapt
the hull design.
5.2.1.1 RULES OF SHIPS
With these new dimensions the stability must be such that the operability of the concept is similar or better.
This is checked with rules for ships from classification societies. According to the code of intact stability A.
749 (International Maritime Organization, IMO 1993), the vessel is checked for the intact and weather
criteria. With the loading case, a weight distribution of the vessel and a ballast condition, the stability is
calculated. This is done with the use of General HydroStatics, GHS, software. In Table 5-6 and Table 5-7,
one can find the regulations for corresponding intact and weather stability.
Limit IMO A.749 CH 4.5.6 intact stability Min/Max [-]
1 Area from abs 0 deg to Max at ABS 15 > 0.0700 M.-Rad
2 Area from abs 0 deg to Max at ABS 30 > 0.0550 M.-Rad
3 Area from abs 30 deg to abs 40 or FLD > 0.0300 M.-Rad
4 Righting Arm at ABS 30 or Max > 0.200 M.
5 Absolute Angle at Max > 15.00 Deg.
6 GM Upright > 0.150 M.
Table 5-6: Intact stability regulations
Limit IMO A749 CH.3.2 Min/Max [-]
7 Angle at equilibrium (wind-static) < 16.0 Deg.
8 Residual area ratio from roll to fld or rao (wind-gust) > 1.0
9 Residual ratio from roll to abs 50 or rao (wind-gust) > 1.0
Table 5-7: Weather stability regulations
In appendix C, the script files are shown for this stability calculations.
5.2.1.2 SUBMERGED
The critical point that a vessel encounters during submerging, is found at the stage where the vessels
main deck is completely submerged. Since these HTV’s are submerging under a trim angle, this results in
the following situation, see Figure 5-3:
Figure 5-3: GHS profile view of critical submerging stage
According to rules for classification of ships Pt. 5 Ch7, S21 (DNV 2012). The minimum GM value of this
situation must be 0.5 meter. In appendix C the script files are shown for this stability calculations. The KM
Trim: 2.0 [m]
waterline
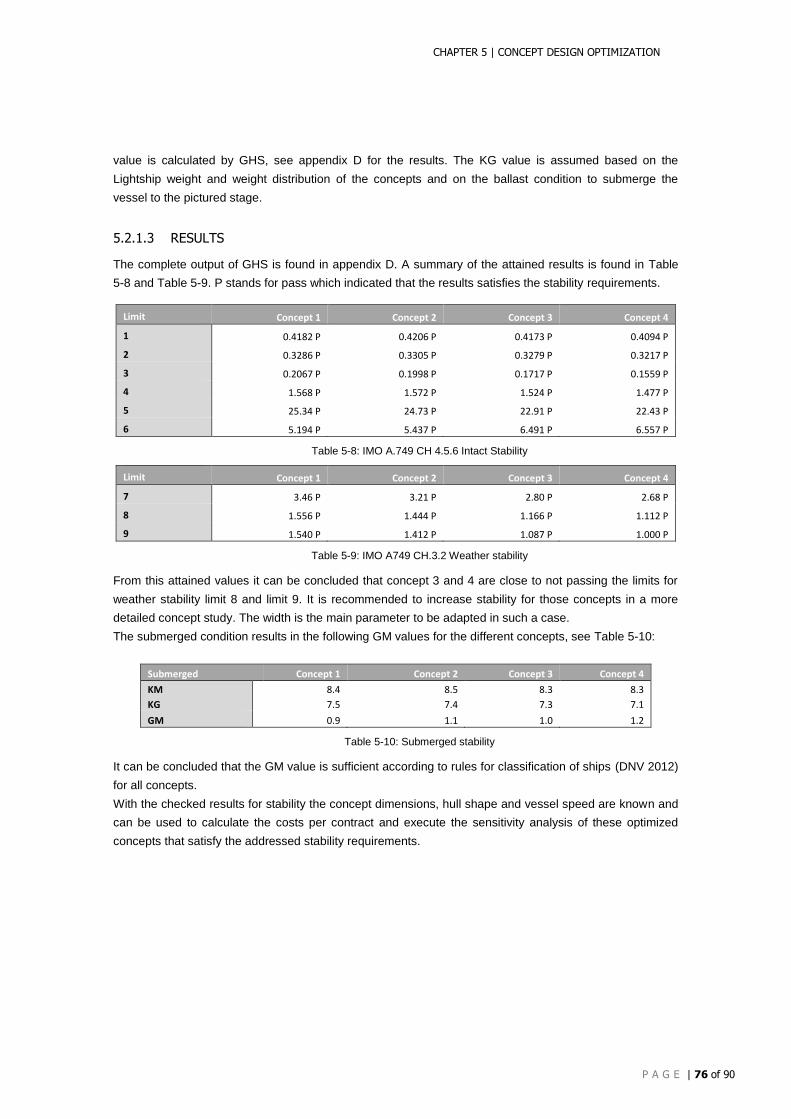
CHAPTER 5 | CONCEPT DESIGN OPTIMIZATION
P A G E | 76 of 90
value is calculated by GHS, see appendix D for the results. The KG value is assumed based on the
Lightship weight and weight distribution of the concepts and on the ballast condition to submerge the
vessel to the pictured stage.
5.2.1.3 RESULTS
The complete output of GHS is found in appendix D. A summary of the attained results is found in Table
5-8 and Table 5-9. P stands for pass which indicated that the results satisfies the stability requirements.
Limit Concept 1 Concept 2 Concept 3 Concept 4
1 0.4182 P 0.4206 P 0.4173 P 0.4094 P
2 0.3286 P 0.3305 P 0.3279 P 0.3217 P
3 0.2067 P 0.1998 P 0.1717 P 0.1559 P
4 1.568 P 1.572 P 1.524 P 1.477 P
5 25.34 P 24.73 P 22.91 P 22.43 P
6 5.194 P 5.437 P 6.491 P 6.557 P
Table 5-8: IMO A.749 CH 4.5.6 Intact Stability
Limit Concept 1 Concept 2 Concept 3 Concept 4
7 3.46 P 3.21 P 2.80 P 2.68 P
8 1.556 P 1.444 P 1.166 P 1.112 P
9 1.540 P 1.412 P 1.087 P 1.000 P
Table 5-9: IMO A749 CH.3.2 Weather stability
From this attained values it can be concluded that concept 3 and 4 are close to not passing the limits for
weather stability limit 8 and limit 9. It is recommended to increase stability for those concepts in a more
detailed concept study. The width is the main parameter to be adapted in such a case.
The submerged condition results in the following GM values for the different concepts, see Table 5-10:
Submerged Concept 1 Concept 2 Concept 3 Concept 4
KM 8.4 8.5 8.3 8.3
KG 7.5 7.4 7.3 7.1
GM 0.9 1.1 1.0 1.2
Table 5-10: Submerged stability
It can be concluded that the GM value is sufficient according to rules for classification of ships (DNV 2012)
for all concepts.
With the checked results for stability the concept dimensions, hull shape and vessel speed are known and
can be used to calculate the costs per contract and execute the sensitivity analysis of these optimized
concepts that satisfy the addressed stability requirements.
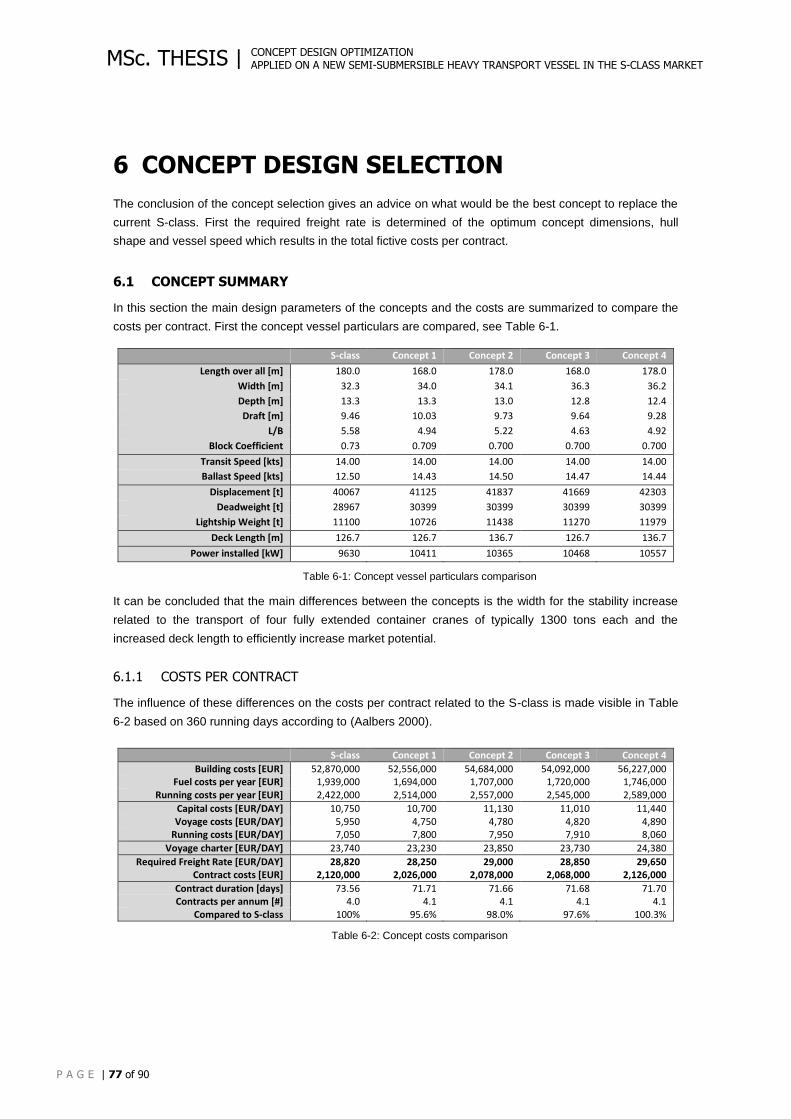
CONCEPT DESIGN OPTIMIZATION APPLIED ON A NEW SEMI-SUBMERSIBLE HEAVY TRANSPORT VESSEL IN THE S-CLASS MARKET
P A G E | 77 of 90
MSc. THESIS |
6 CONCEPT DESIGN SELECTION
The conclusion of the concept selection gives an advice on what would be the best concept to replace the
current S-class. First the required freight rate is determined of the optimum concept dimensions, hull
shape and vessel speed which results in the total fictive costs per contract.
6.1 CONCEPT SUMMARY
In this section the main design parameters of the concepts and the costs are summarized to compare the
costs per contract. First the concept vessel particulars are compared, see Table 6-1.
S-class Concept 1 Concept 2 Concept 3 Concept 4
Length over all [m] 180.0 168.0 178.0 168.0 178.0
Width [m] 32.3 34.0 34.1 36.3 36.2
Depth [m] 13.3 13.3 13.0 12.8 12.4
Draft [m] 9.46 10.03 9.73 9.64 9.28
L/B 5.58 4.94 5.22 4.63 4.92
Block Coefficient 0.73 0.709 0.700 0.700 0.700
Transit Speed [kts] 14.00 14.00 14.00 14.00 14.00
Ballast Speed [kts] 12.50 14.43 14.50 14.47 14.44
Displacement [t] 40067 41125 41837 41669 42303
Deadweight [t] 28967 30399 30399 30399 30399
Lightship Weight [t] 11100 10726 11438 11270 11979
Deck Length [m] 126.7 126.7 136.7 126.7 136.7
Power installed [kW] 9630 10411 10365 10468 10557
Table 6-1: Concept vessel particulars comparison
It can be concluded that the main differences between the concepts is the width for the stability increase
related to the transport of four fully extended container cranes of typically 1300 tons each and the
increased deck length to efficiently increase market potential.
6.1.1 COSTS PER CONTRACT
The influence of these differences on the costs per contract related to the S-class is made visible in Table
6-2 based on 360 running days according to (Aalbers 2000).
S-class Concept 1 Concept 2 Concept 3 Concept 4
Building costs [EUR] 52,870,000 52,556,000 54,684,000 54,092,000 56,227,000 Fuel costs per year [EUR] 1,939,000 1,694,000 1,707,000 1,720,000 1,746,000
Running costs per year [EUR] 2,422,000 2,514,000 2,557,000 2,545,000 2,589,000
Capital costs [EUR/DAY] 10,750 10,700 11,130 11,010 11,440 Voyage costs [EUR/DAY] 5,950 4,750 4,780 4,820 4,890
Running costs [EUR/DAY] 7,050 7,800 7,950 7,910 8,060
Voyage charter [EUR/DAY] 23,740 23,230 23,850 23,730 24,380
Required Freight Rate [EUR/DAY] 28,820 28,250 29,000 28,850 29,650 Contract costs [EUR] 2,120,000 2,026,000 2,078,000 2,068,000 2,126,000
Contract duration [days] 73.56 71.71 71.66 71.68 71.70 Contracts per annum [#] 4.0 4.1 4.1 4.1 4.1
Compared to S-class 100% 95.6% 98.0% 97.6% 100.3%
Table 6-2: Concept costs comparison
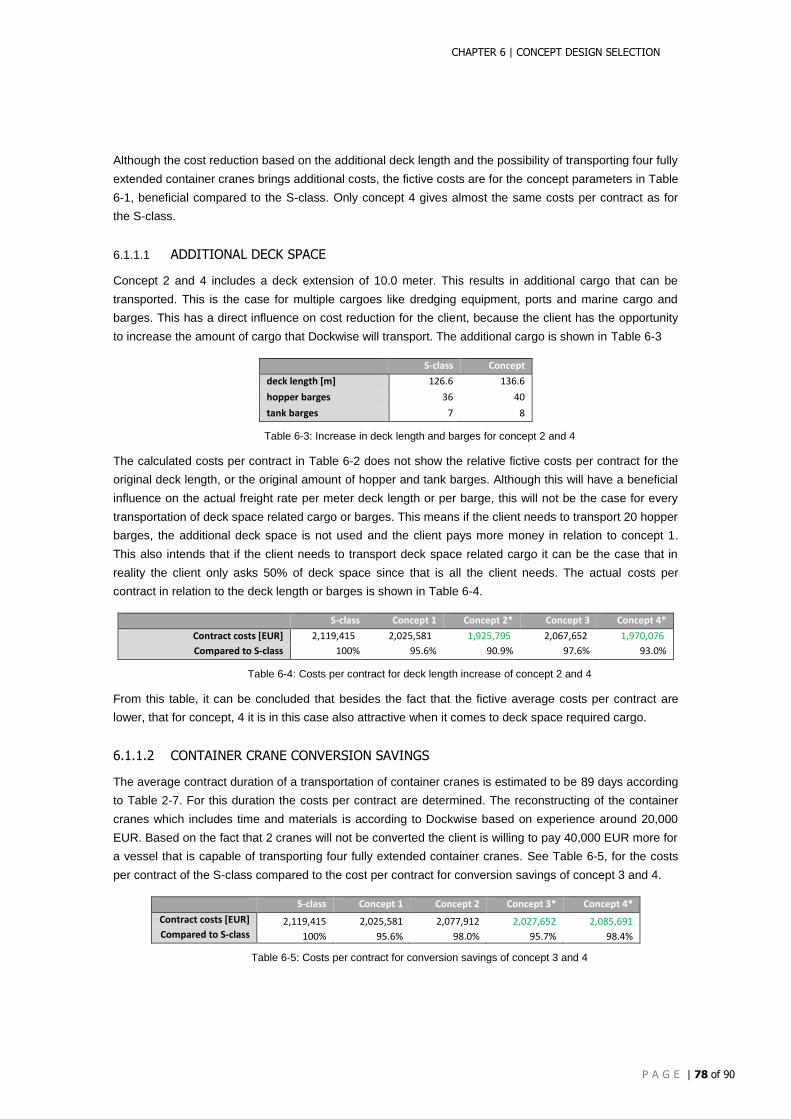
CHAPTER 6 | CONCEPT DESIGN SELECTION
P A G E | 78 of 90
Although the cost reduction based on the additional deck length and the possibility of transporting four fully
extended container cranes brings additional costs, the fictive costs are for the concept parameters in Table
6-1, beneficial compared to the S-class. Only concept 4 gives almost the same costs per contract as for
the S-class.
6.1.1.1 ADDITIONAL DECK SPACE
Concept 2 and 4 includes a deck extension of 10.0 meter. This results in additional cargo that can be
transported. This is the case for multiple cargoes like dredging equipment, ports and marine cargo and
barges. This has a direct influence on cost reduction for the client, because the client has the opportunity
to increase the amount of cargo that Dockwise will transport. The additional cargo is shown in Table 6-3
S-class Concept
deck length [m] 126.6 136.6
hopper barges 36 40
tank barges 7 8
Table 6-3: Increase in deck length and barges for concept 2 and 4
The calculated costs per contract in Table 6-2 does not show the relative fictive costs per contract for the
original deck length, or the original amount of hopper and tank barges. Although this will have a beneficial
influence on the actual freight rate per meter deck length or per barge, this will not be the case for every
transportation of deck space related cargo or barges. This means if the client needs to transport 20 hopper
barges, the additional deck space is not used and the client pays more money in relation to concept 1.
This also intends that if the client needs to transport deck space related cargo it can be the case that in
reality the client only asks 50% of deck space since that is all the client needs. The actual costs per
contract in relation to the deck length or barges is shown in Table 6-4.
S-class Concept 1 Concept 2* Concept 3 Concept 4*
Contract costs [EUR] 2,119,415 2,025,581 1,925,795 2,067,652 1,970,076
Compared to S-class 100% 95.6% 90.9% 97.6% 93.0%
Table 6-4: Costs per contract for deck length increase of concept 2 and 4
From this table, it can be concluded that besides the fact that the fictive average costs per contract are
lower, that for concept, 4 it is in this case also attractive when it comes to deck space required cargo.
6.1.1.2 CONTAINER CRANE CONVERSION SAVINGS
The average contract duration of a transportation of container cranes is estimated to be 89 days according
to Table 2-7. For this duration the costs per contract are determined. The reconstructing of the container
cranes which includes time and materials is according to Dockwise based on experience around 20,000
EUR. Based on the fact that 2 cranes will not be converted the client is willing to pay 40,000 EUR more for
a vessel that is capable of transporting four fully extended container cranes. See Table 6-5, for the costs
per contract of the S-class compared to the cost per contract for conversion savings of concept 3 and 4.
S-class Concept 1 Concept 2 Concept 3* Concept 4*
Contract costs [EUR] 2,119,415 2,025,581 2,077,912 2,027,652 2,085,691 Compared to S-class 100% 95.6% 98.0% 95.7% 98.4%
Table 6-5: Costs per contract for conversion savings of concept 3 and 4
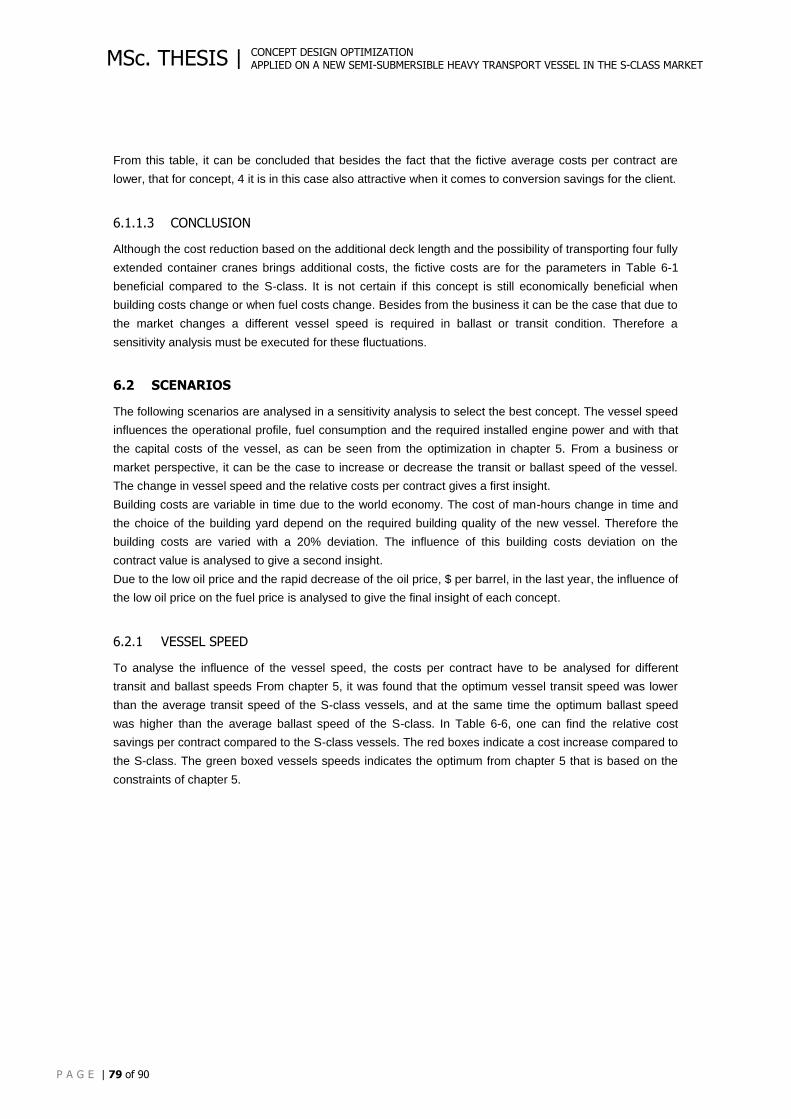
CONCEPT DESIGN OPTIMIZATION APPLIED ON A NEW SEMI-SUBMERSIBLE HEAVY TRANSPORT VESSEL IN THE S-CLASS MARKET
P A G E | 79 of 90
MSc. THESIS |
From this table, it can be concluded that besides the fact that the fictive average costs per contract are
lower, that for concept, 4 it is in this case also attractive when it comes to conversion savings for the client.
6.1.1.3 CONCLUSION
Although the cost reduction based on the additional deck length and the possibility of transporting four fully
extended container cranes brings additional costs, the fictive costs are for the parameters in Table 6-1
beneficial compared to the S-class. It is not certain if this concept is still economically beneficial when
building costs change or when fuel costs change. Besides from the business it can be the case that due to
the market changes a different vessel speed is required in ballast or transit condition. Therefore a
sensitivity analysis must be executed for these fluctuations.
6.2 SCENARIOS
The following scenarios are analysed in a sensitivity analysis to select the best concept. The vessel speed
influences the operational profile, fuel consumption and the required installed engine power and with that
the capital costs of the vessel, as can be seen from the optimization in chapter 5. From a business or
market perspective, it can be the case to increase or decrease the transit or ballast speed of the vessel.
The change in vessel speed and the relative costs per contract gives a first insight.
Building costs are variable in time due to the world economy. The cost of man-hours change in time and
the choice of the building yard depend on the required building quality of the new vessel. Therefore the
building costs are varied with a 20% deviation. The influence of this building costs deviation on the
contract value is analysed to give a second insight.
Due to the low oil price and the rapid decrease of the oil price, $ per barrel, in the last year, the influence of
the low oil price on the fuel price is analysed to give the final insight of each concept.
6.2.1 VESSEL SPEED
To analyse the influence of the vessel speed, the costs per contract have to be analysed for different
transit and ballast speeds From chapter 5, it was found that the optimum vessel transit speed was lower
than the average transit speed of the S-class vessels, and at the same time the optimum ballast speed
was higher than the average ballast speed of the S-class. In Table 6-6, one can find the relative cost
savings per contract compared to the S-class vessels. The red boxes indicate a cost increase compared to
the S-class. The green boxed vessels speeds indicates the optimum from chapter 5 that is based on the
constraints of chapter 5.
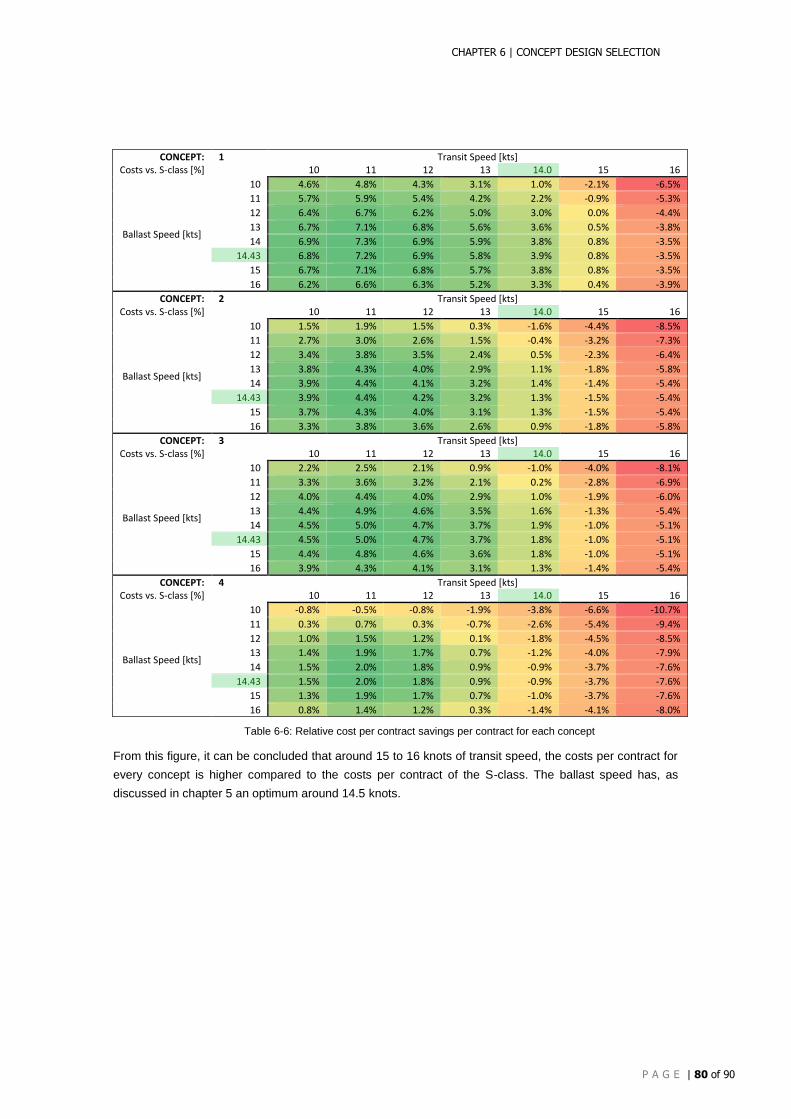
CHAPTER 6 | CONCEPT DESIGN SELECTION
P A G E | 80 of 90
CONCEPT: 1 Transit Speed [kts] Costs vs. S-class [%] 10 11 12 13 14.0 15 16
Ballast Speed [kts]
10 4.6% 4.8% 4.3% 3.1% 1.0% -2.1% -6.5%
11 5.7% 5.9% 5.4% 4.2% 2.2% -0.9% -5.3%
12 6.4% 6.7% 6.2% 5.0% 3.0% 0.0% -4.4%
13 6.7% 7.1% 6.8% 5.6% 3.6% 0.5% -3.8%
14 6.9% 7.3% 6.9% 5.9% 3.8% 0.8% -3.5%
14.43 6.8% 7.2% 6.9% 5.8% 3.9% 0.8% -3.5%
15 6.7% 7.1% 6.8% 5.7% 3.8% 0.8% -3.5%
16 6.2% 6.6% 6.3% 5.2% 3.3% 0.4% -3.9%
CONCEPT: 2 Transit Speed [kts] Costs vs. S-class [%] 10 11 12 13 14.0 15 16
Ballast Speed [kts]
10 1.5% 1.9% 1.5% 0.3% -1.6% -4.4% -8.5%
11 2.7% 3.0% 2.6% 1.5% -0.4% -3.2% -7.3%
12 3.4% 3.8% 3.5% 2.4% 0.5% -2.3% -6.4%
13 3.8% 4.3% 4.0% 2.9% 1.1% -1.8% -5.8%
14 3.9% 4.4% 4.1% 3.2% 1.4% -1.4% -5.4%
14.43 3.9% 4.4% 4.2% 3.2% 1.3% -1.5% -5.4%
15 3.7% 4.3% 4.0% 3.1% 1.3% -1.5% -5.4%
16 3.3% 3.8% 3.6% 2.6% 0.9% -1.8% -5.8%
CONCEPT: 3 Transit Speed [kts] Costs vs. S-class [%] 10 11 12 13 14.0 15 16
Ballast Speed [kts]
10 2.2% 2.5% 2.1% 0.9% -1.0% -4.0% -8.1%
11 3.3% 3.6% 3.2% 2.1% 0.2% -2.8% -6.9%
12 4.0% 4.4% 4.0% 2.9% 1.0% -1.9% -6.0%
13 4.4% 4.9% 4.6% 3.5% 1.6% -1.3% -5.4%
14 4.5% 5.0% 4.7% 3.7% 1.9% -1.0% -5.1%
14.43 4.5% 5.0% 4.7% 3.7% 1.8% -1.0% -5.1%
15 4.4% 4.8% 4.6% 3.6% 1.8% -1.0% -5.1%
16 3.9% 4.3% 4.1% 3.1% 1.3% -1.4% -5.4%
CONCEPT: 4 Transit Speed [kts] Costs vs. S-class [%] 10 11 12 13 14.0 15 16
Ballast Speed [kts]
10 -0.8% -0.5% -0.8% -1.9% -3.8% -6.6% -10.7%
11 0.3% 0.7% 0.3% -0.7% -2.6% -5.4% -9.4%
12 1.0% 1.5% 1.2% 0.1% -1.8% -4.5% -8.5%
13 1.4% 1.9% 1.7% 0.7% -1.2% -4.0% -7.9%
14 1.5% 2.0% 1.8% 0.9% -0.9% -3.7% -7.6%
14.43 1.5% 2.0% 1.8% 0.9% -0.9% -3.7% -7.6%
15 1.3% 1.9% 1.7% 0.7% -1.0% -3.7% -7.6%
16 0.8% 1.4% 1.2% 0.3% -1.4% -4.1% -8.0%
Table 6-6: Relative cost per contract savings per contract for each concept
From this figure, it can be concluded that around 15 to 16 knots of transit speed, the costs per contract for
every concept is higher compared to the costs per contract of the S-class. The ballast speed has, as
discussed in chapter 5 an optimum around 14.5 knots.
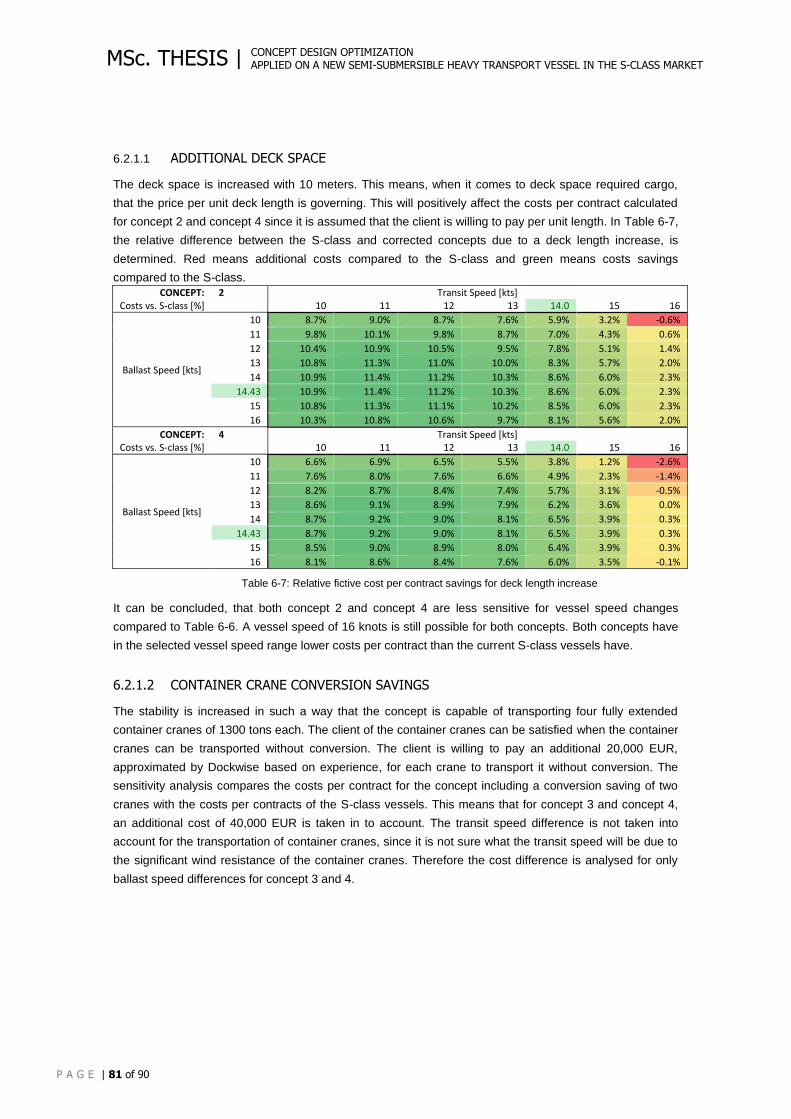
CONCEPT DESIGN OPTIMIZATION APPLIED ON A NEW SEMI-SUBMERSIBLE HEAVY TRANSPORT VESSEL IN THE S-CLASS MARKET
P A G E | 81 of 90
MSc. THESIS |
6.2.1.1 ADDITIONAL DECK SPACE
The deck space is increased with 10 meters. This means, when it comes to deck space required cargo,
that the price per unit deck length is governing. This will positively affect the costs per contract calculated
for concept 2 and concept 4 since it is assumed that the client is willing to pay per unit length. In Table 6-7,
the relative difference between the S-class and corrected concepts due to a deck length increase, is
determined. Red means additional costs compared to the S-class and green means costs savings
compared to the S-class.
CONCEPT: 2 Transit Speed [kts] Costs vs. S-class [%] 10 11 12 13 14.0 15 16
Ballast Speed [kts]
10 8.7% 9.0% 8.7% 7.6% 5.9% 3.2% -0.6%
11 9.8% 10.1% 9.8% 8.7% 7.0% 4.3% 0.6%
12 10.4% 10.9% 10.5% 9.5% 7.8% 5.1% 1.4%
13 10.8% 11.3% 11.0% 10.0% 8.3% 5.7% 2.0%
14 10.9% 11.4% 11.2% 10.3% 8.6% 6.0% 2.3%
14.43 10.9% 11.4% 11.2% 10.3% 8.6% 6.0% 2.3%
15 10.8% 11.3% 11.1% 10.2% 8.5% 6.0% 2.3%
16 10.3% 10.8% 10.6% 9.7% 8.1% 5.6% 2.0%
CONCEPT: 4 Transit Speed [kts] Costs vs. S-class [%] 10 11 12 13 14.0 15 16
Ballast Speed [kts]
10 6.6% 6.9% 6.5% 5.5% 3.8% 1.2% -2.6%
11 7.6% 8.0% 7.6% 6.6% 4.9% 2.3% -1.4%
12 8.2% 8.7% 8.4% 7.4% 5.7% 3.1% -0.5%
13 8.6% 9.1% 8.9% 7.9% 6.2% 3.6% 0.0%
14 8.7% 9.2% 9.0% 8.1% 6.5% 3.9% 0.3%
14.43 8.7% 9.2% 9.0% 8.1% 6.5% 3.9% 0.3%
15 8.5% 9.0% 8.9% 8.0% 6.4% 3.9% 0.3%
16 8.1% 8.6% 8.4% 7.6% 6.0% 3.5% -0.1%
Table 6-7: Relative fictive cost per contract savings for deck length increase
It can be concluded, that both concept 2 and concept 4 are less sensitive for vessel speed changes
compared to Table 6-6. A vessel speed of 16 knots is still possible for both concepts. Both concepts have
in the selected vessel speed range lower costs per contract than the current S-class vessels have.
6.2.1.2 CONTAINER CRANE CONVERSION SAVINGS
The stability is increased in such a way that the concept is capable of transporting four fully extended
container cranes of 1300 tons each. The client of the container cranes can be satisfied when the container
cranes can be transported without conversion. The client is willing to pay an additional 20,000 EUR,
approximated by Dockwise based on experience, for each crane to transport it without conversion. The
sensitivity analysis compares the costs per contract for the concept including a conversion saving of two
cranes with the costs per contracts of the S-class vessels. This means that for concept 3 and concept 4,
an additional cost of 40,000 EUR is taken in to account. The transit speed difference is not taken into
account for the transportation of container cranes, since it is not sure what the transit speed will be due to
the significant wind resistance of the container cranes. Therefore the cost difference is analysed for only
ballast speed differences for concept 3 and 4.
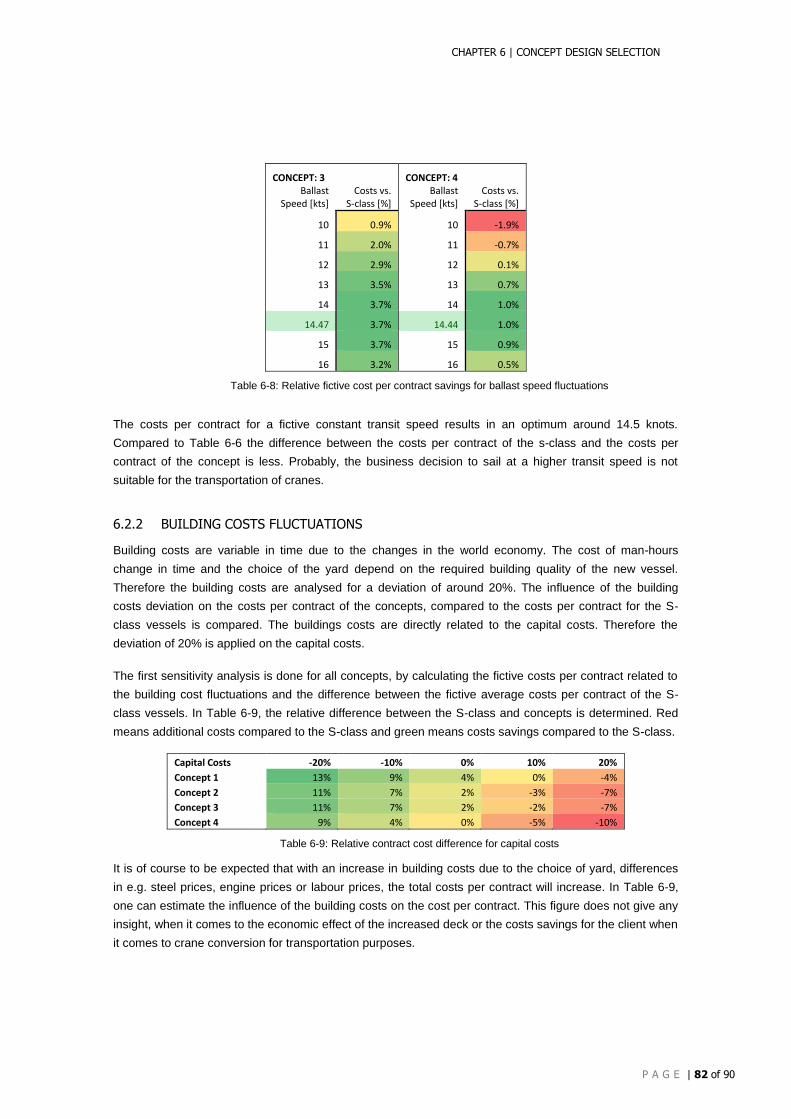
CHAPTER 6 | CONCEPT DESIGN SELECTION
P A G E | 82 of 90
CONCEPT: 3 CONCEPT: 4 Ballast
Speed [kts] Costs vs.
S-class [%] Ballast
Speed [kts] Costs vs.
S-class [%]
10 0.9% 10 -1.9%
11 2.0% 11 -0.7%
12 2.9% 12 0.1%
13 3.5% 13 0.7%
14 3.7% 14 1.0%
14.47 3.7% 14.44 1.0%
15 3.7% 15 0.9%
16 3.2% 16 0.5%
Table 6-8: Relative fictive cost per contract savings for ballast speed fluctuations
The costs per contract for a fictive constant transit speed results in an optimum around 14.5 knots.
Compared to Table 6-6 the difference between the costs per contract of the s-class and the costs per
contract of the concept is less. Probably, the business decision to sail at a higher transit speed is not
suitable for the transportation of cranes.
6.2.2 BUILDING COSTS FLUCTUATIONS
Building costs are variable in time due to the changes in the world economy. The cost of man-hours
change in time and the choice of the yard depend on the required building quality of the new vessel.
Therefore the building costs are analysed for a deviation of around 20%. The influence of the building
costs deviation on the costs per contract of the concepts, compared to the costs per contract for the S-
class vessels is compared. The buildings costs are directly related to the capital costs. Therefore the
deviation of 20% is applied on the capital costs.
The first sensitivity analysis is done for all concepts, by calculating the fictive costs per contract related to
the building cost fluctuations and the difference between the fictive average costs per contract of the S-
class vessels. In Table 6-9, the relative difference between the S-class and concepts is determined. Red
means additional costs compared to the S-class and green means costs savings compared to the S-class.
Capital Costs -20% -10% 0% 10% 20%
Concept 1 13% 9% 4% 0% -4%
Concept 2 11% 7% 2% -3% -7%
Concept 3 11% 7% 2% -2% -7%
Concept 4 9% 4% 0% -5% -10%
Table 6-9: Relative contract cost difference for capital costs
It is of course to be expected that with an increase in building costs due to the choice of yard, differences
in e.g. steel prices, engine prices or labour prices, the total costs per contract will increase. In Table 6-9,
one can estimate the influence of the building costs on the cost per contract. This figure does not give any
insight, when it comes to the economic effect of the increased deck or the costs savings for the client when
it comes to crane conversion for transportation purposes.
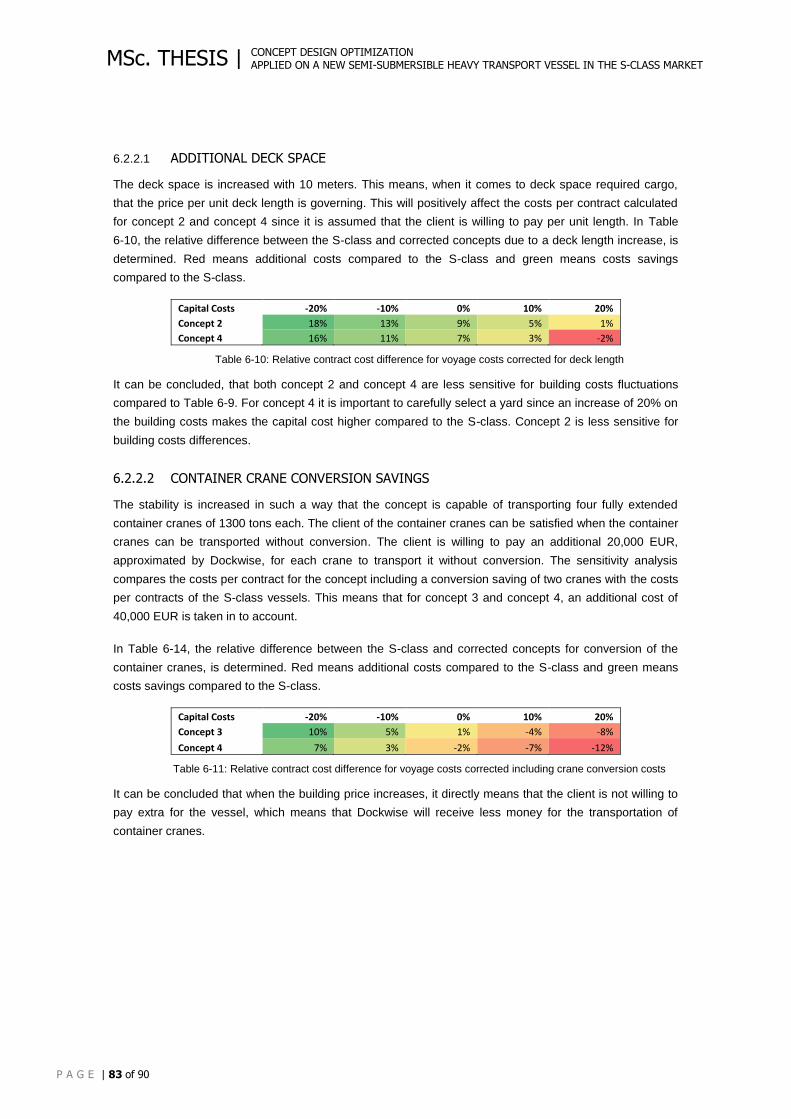
CONCEPT DESIGN OPTIMIZATION APPLIED ON A NEW SEMI-SUBMERSIBLE HEAVY TRANSPORT VESSEL IN THE S-CLASS MARKET
P A G E | 83 of 90
MSc. THESIS |
6.2.2.1 ADDITIONAL DECK SPACE
The deck space is increased with 10 meters. This means, when it comes to deck space required cargo,
that the price per unit deck length is governing. This will positively affect the costs per contract calculated
for concept 2 and concept 4 since it is assumed that the client is willing to pay per unit length. In Table
6-10, the relative difference between the S-class and corrected concepts due to a deck length increase, is
determined. Red means additional costs compared to the S-class and green means costs savings
compared to the S-class.
Capital Costs -20% -10% 0% 10% 20%
Concept 2 18% 13% 9% 5% 1%
Concept 4 16% 11% 7% 3% -2%
Table 6-10: Relative contract cost difference for voyage costs corrected for deck length
It can be concluded, that both concept 2 and concept 4 are less sensitive for building costs fluctuations
compared to Table 6-9. For concept 4 it is important to carefully select a yard since an increase of 20% on
the building costs makes the capital cost higher compared to the S-class. Concept 2 is less sensitive for
building costs differences.
6.2.2.2 CONTAINER CRANE CONVERSION SAVINGS
The stability is increased in such a way that the concept is capable of transporting four fully extended
container cranes of 1300 tons each. The client of the container cranes can be satisfied when the container
cranes can be transported without conversion. The client is willing to pay an additional 20,000 EUR,
approximated by Dockwise, for each crane to transport it without conversion. The sensitivity analysis
compares the costs per contract for the concept including a conversion saving of two cranes with the costs
per contracts of the S-class vessels. This means that for concept 3 and concept 4, an additional cost of
40,000 EUR is taken in to account.
In Table 6-14, the relative difference between the S-class and corrected concepts for conversion of the
container cranes, is determined. Red means additional costs compared to the S-class and green means
costs savings compared to the S-class.
Capital Costs -20% -10% 0% 10% 20%
Concept 3 10% 5% 1% -4% -8%
Concept 4 7% 3% -2% -7% -12%
Table 6-11: Relative contract cost difference for voyage costs corrected including crane conversion costs
It can be concluded that when the building price increases, it directly means that the client is not willing to
pay extra for the vessel, which means that Dockwise will receive less money for the transportation of
container cranes.
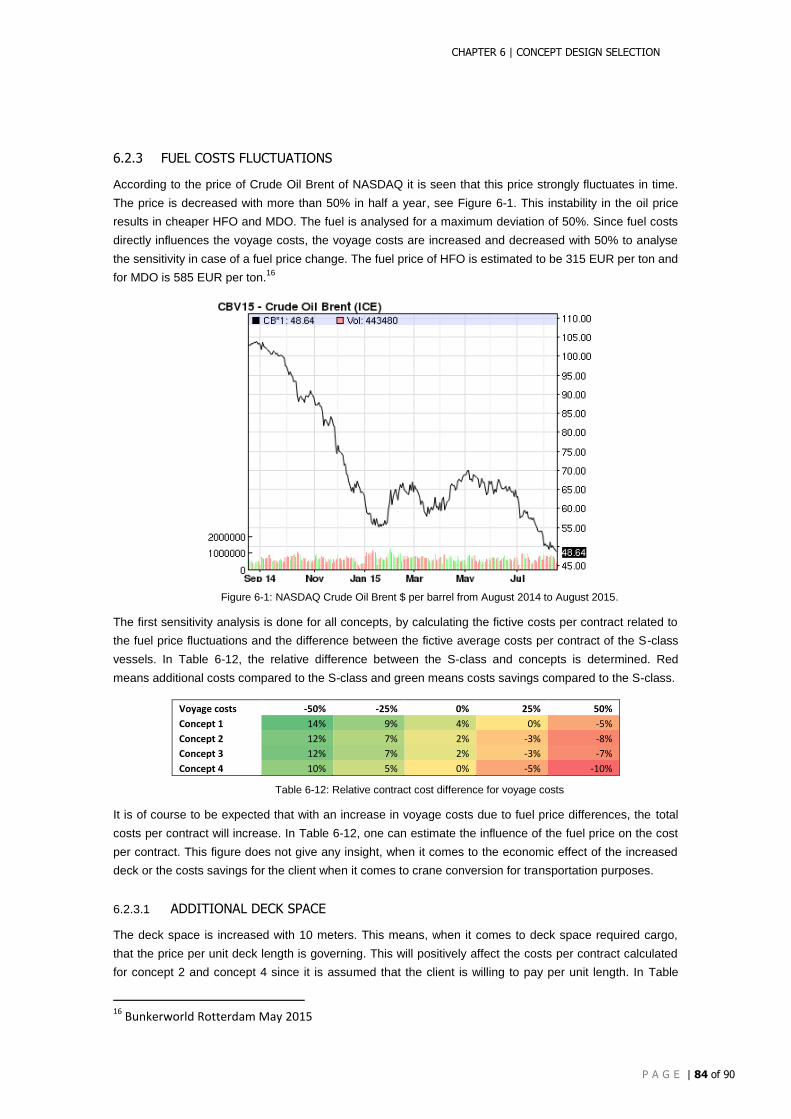
CHAPTER 6 | CONCEPT DESIGN SELECTION
P A G E | 84 of 90
6.2.3 FUEL COSTS FLUCTUATIONS
According to the price of Crude Oil Brent of NASDAQ it is seen that this price strongly fluctuates in time.
The price is decreased with more than 50% in half a year, see Figure 6-1. This instability in the oil price
results in cheaper HFO and MDO. The fuel is analysed for a maximum deviation of 50%. Since fuel costs
directly influences the voyage costs, the voyage costs are increased and decreased with 50% to analyse
the sensitivity in case of a fuel price change. The fuel price of HFO is estimated to be 315 EUR per ton and
for MDO is 585 EUR per ton.16
Figure 6-1: NASDAQ Crude Oil Brent $ per barrel from August 2014 to August 2015.
The first sensitivity analysis is done for all concepts, by calculating the fictive costs per contract related to
the fuel price fluctuations and the difference between the fictive average costs per contract of the S-class
vessels. In Table 6-12, the relative difference between the S-class and concepts is determined. Red
means additional costs compared to the S-class and green means costs savings compared to the S-class.
Voyage costs -50% -25% 0% 25% 50%
Concept 1 14% 9% 4% 0% -5%
Concept 2 12% 7% 2% -3% -8%
Concept 3 12% 7% 2% -3% -7%
Concept 4 10% 5% 0% -5% -10%
Table 6-12: Relative contract cost difference for voyage costs
It is of course to be expected that with an increase in voyage costs due to fuel price differences, the total
costs per contract will increase. In Table 6-12, one can estimate the influence of the fuel price on the cost
per contract. This figure does not give any insight, when it comes to the economic effect of the increased
deck or the costs savings for the client when it comes to crane conversion for transportation purposes.
6.2.3.1 ADDITIONAL DECK SPACE
The deck space is increased with 10 meters. This means, when it comes to deck space required cargo,
that the price per unit deck length is governing. This will positively affect the costs per contract calculated
for concept 2 and concept 4 since it is assumed that the client is willing to pay per unit length. In Table
16
Bunkerworld Rotterdam May 2015
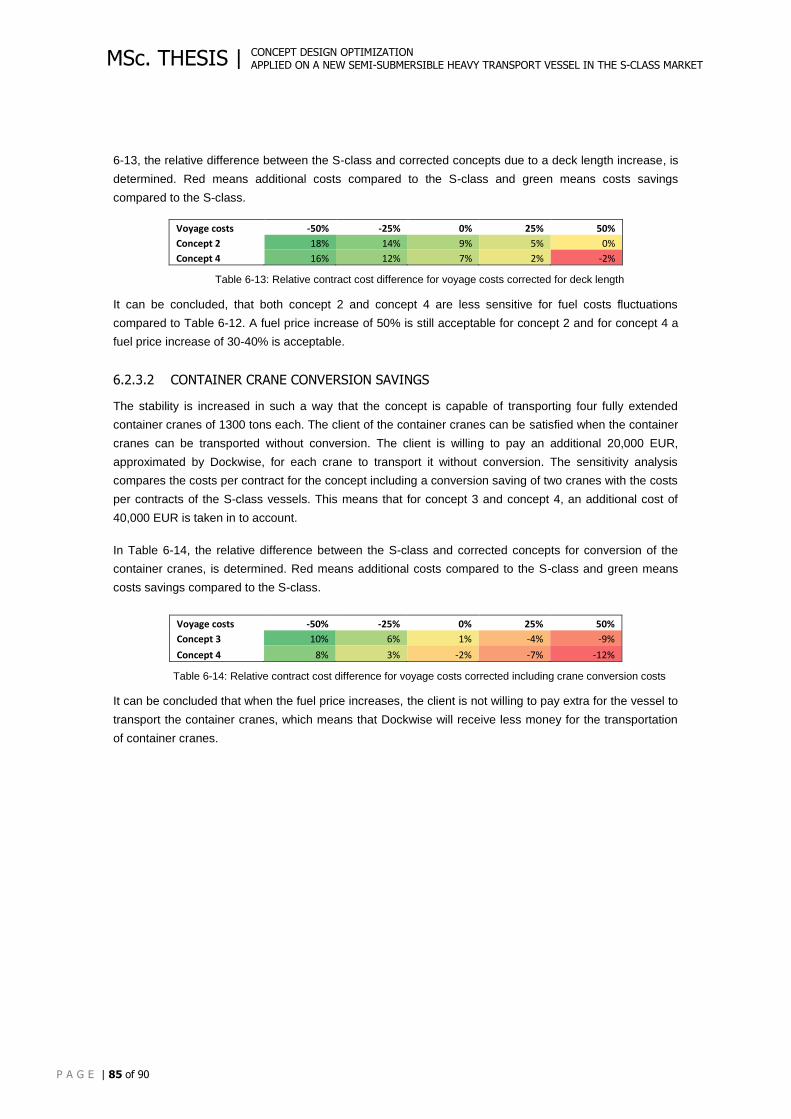
CONCEPT DESIGN OPTIMIZATION APPLIED ON A NEW SEMI-SUBMERSIBLE HEAVY TRANSPORT VESSEL IN THE S-CLASS MARKET
P A G E | 85 of 90
MSc. THESIS |
6-13, the relative difference between the S-class and corrected concepts due to a deck length increase, is
determined. Red means additional costs compared to the S-class and green means costs savings
compared to the S-class.
Voyage costs -50% -25% 0% 25% 50%
Concept 2 18% 14% 9% 5% 0%
Concept 4 16% 12% 7% 2% -2%
Table 6-13: Relative contract cost difference for voyage costs corrected for deck length
It can be concluded, that both concept 2 and concept 4 are less sensitive for fuel costs fluctuations
compared to Table 6-12. A fuel price increase of 50% is still acceptable for concept 2 and for concept 4 a
fuel price increase of 30-40% is acceptable.
6.2.3.2 CONTAINER CRANE CONVERSION SAVINGS
The stability is increased in such a way that the concept is capable of transporting four fully extended
container cranes of 1300 tons each. The client of the container cranes can be satisfied when the container
cranes can be transported without conversion. The client is willing to pay an additional 20,000 EUR,
approximated by Dockwise, for each crane to transport it without conversion. The sensitivity analysis
compares the costs per contract for the concept including a conversion saving of two cranes with the costs
per contracts of the S-class vessels. This means that for concept 3 and concept 4, an additional cost of
40,000 EUR is taken in to account.
In Table 6-14, the relative difference between the S-class and corrected concepts for conversion of the
container cranes, is determined. Red means additional costs compared to the S-class and green means
costs savings compared to the S-class.
Voyage costs -50% -25% 0% 25% 50%
Concept 3 10% 6% 1% -4% -9%
Concept 4 8% 3% -2% -7% -12%
Table 6-14: Relative contract cost difference for voyage costs corrected including crane conversion costs
It can be concluded that when the fuel price increases, the client is not willing to pay extra for the vessel to
transport the container cranes, which means that Dockwise will receive less money for the transportation
of container cranes.
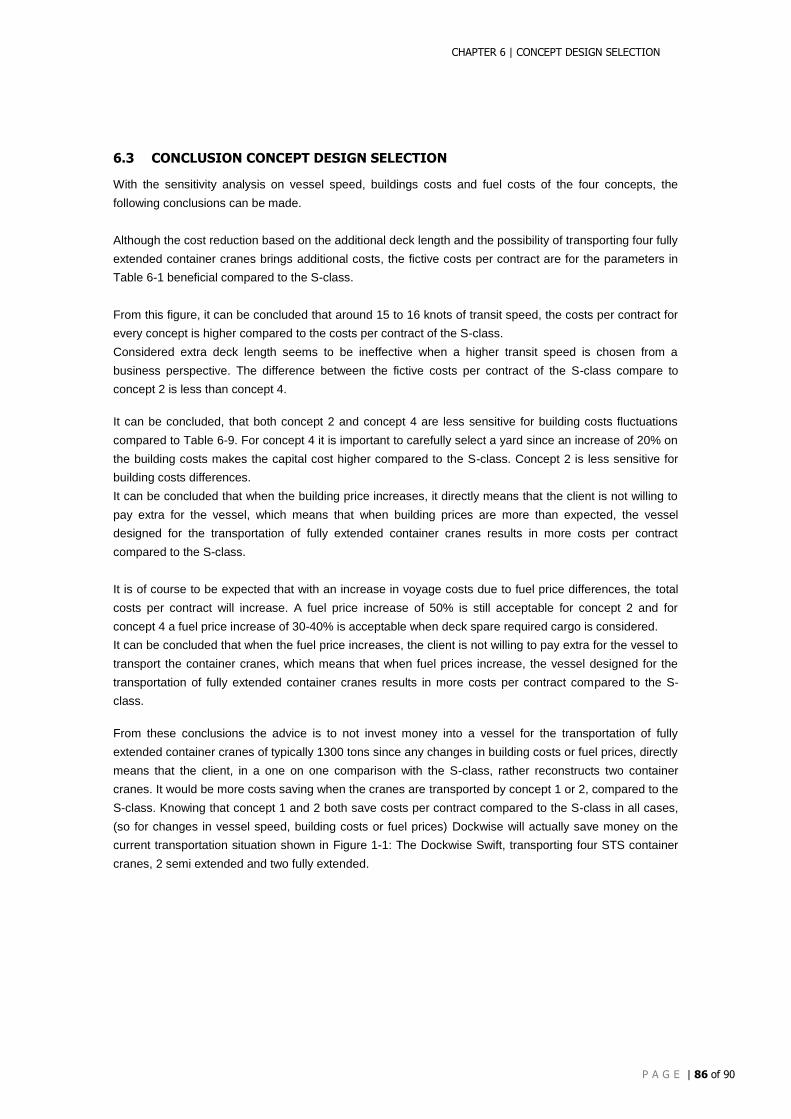
CHAPTER 6 | CONCEPT DESIGN SELECTION
P A G E | 86 of 90
6.3 CONCLUSION CONCEPT DESIGN SELECTION
With the sensitivity analysis on vessel speed, buildings costs and fuel costs of the four concepts, the
following conclusions can be made.
Although the cost reduction based on the additional deck length and the possibility of transporting four fully
extended container cranes brings additional costs, the fictive costs per contract are for the parameters in
Table 6-1 beneficial compared to the S-class.
From this figure, it can be concluded that around 15 to 16 knots of transit speed, the costs per contract for
every concept is higher compared to the costs per contract of the S-class.
Considered extra deck length seems to be ineffective when a higher transit speed is chosen from a
business perspective. The difference between the fictive costs per contract of the S-class compare to
concept 2 is less than concept 4.
It can be concluded, that both concept 2 and concept 4 are less sensitive for building costs fluctuations
compared to Table 6-9. For concept 4 it is important to carefully select a yard since an increase of 20% on
the building costs makes the capital cost higher compared to the S-class. Concept 2 is less sensitive for
building costs differences.
It can be concluded that when the building price increases, it directly means that the client is not willing to
pay extra for the vessel, which means that when building prices are more than expected, the vessel
designed for the transportation of fully extended container cranes results in more costs per contract
compared to the S-class.
It is of course to be expected that with an increase in voyage costs due to fuel price differences, the total
costs per contract will increase. A fuel price increase of 50% is still acceptable for concept 2 and for
concept 4 a fuel price increase of 30-40% is acceptable when deck spare required cargo is considered.
It can be concluded that when the fuel price increases, the client is not willing to pay extra for the vessel to
transport the container cranes, which means that when fuel prices increase, the vessel designed for the
transportation of fully extended container cranes results in more costs per contract compared to the S-
class.
From these conclusions the advice is to not invest money into a vessel for the transportation of fully
extended container cranes of typically 1300 tons since any changes in building costs or fuel prices, directly
means that the client, in a one on one comparison with the S-class, rather reconstructs two container
cranes. It would be more costs saving when the cranes are transported by concept 1 or 2, compared to the
S-class. Knowing that concept 1 and 2 both save costs per contract compared to the S-class in all cases,
(so for changes in vessel speed, building costs or fuel prices) Dockwise will actually save money on the
current transportation situation shown in Figure 1-1: The Dockwise Swift, transporting four STS container
cranes, 2 semi extended and two fully extended.
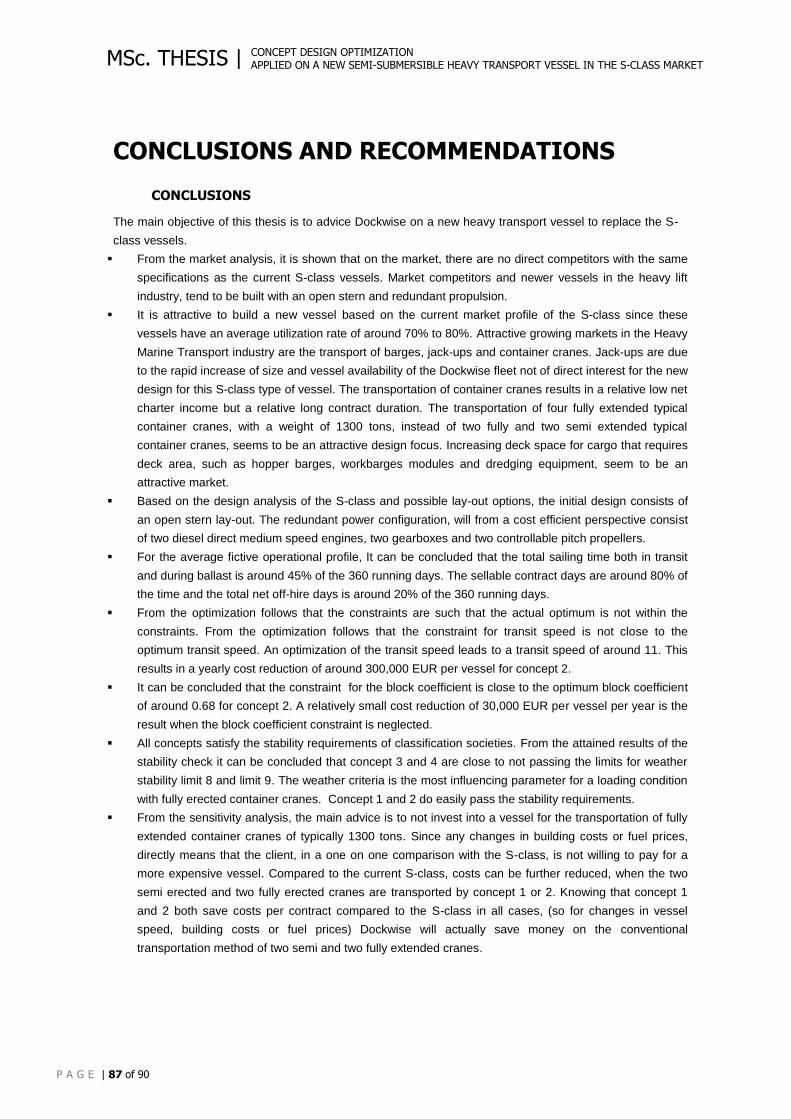
CONCEPT DESIGN OPTIMIZATION APPLIED ON A NEW SEMI-SUBMERSIBLE HEAVY TRANSPORT VESSEL IN THE S-CLASS MARKET
P A G E | 87 of 90
MSc. THESIS |
CONCLUSIONS AND RECOMMENDATIONS
CONCLUSIONS
The main objective of this thesis is to advice Dockwise on a new heavy transport vessel to replace the S-
class vessels.
From the market analysis, it is shown that on the market, there are no direct competitors with the same
specifications as the current S-class vessels. Market competitors and newer vessels in the heavy lift
industry, tend to be built with an open stern and redundant propulsion.
It is attractive to build a new vessel based on the current market profile of the S-class since these
vessels have an average utilization rate of around 70% to 80%. Attractive growing markets in the Heavy
Marine Transport industry are the transport of barges, jack-ups and container cranes. Jack-ups are due
to the rapid increase of size and vessel availability of the Dockwise fleet not of direct interest for the new
design for this S-class type of vessel. The transportation of container cranes results in a relative low net
charter income but a relative long contract duration. The transportation of four fully extended typical
container cranes, with a weight of 1300 tons, instead of two fully and two semi extended typical
container cranes, seems to be an attractive design focus. Increasing deck space for cargo that requires
deck area, such as hopper barges, workbarges modules and dredging equipment, seem to be an
attractive market.
Based on the design analysis of the S-class and possible lay-out options, the initial design consists of
an open stern lay-out. The redundant power configuration, will from a cost efficient perspective consist
of two diesel direct medium speed engines, two gearboxes and two controllable pitch propellers.
For the average fictive operational profile, It can be concluded that the total sailing time both in transit
and during ballast is around 45% of the 360 running days. The sellable contract days are around 80% of
the time and the total net off-hire days is around 20% of the 360 running days.
From the optimization follows that the constraints are such that the actual optimum is not within the
constraints. From the optimization follows that the constraint for transit speed is not close to the
optimum transit speed. An optimization of the transit speed leads to a transit speed of around 11. This
results in a yearly cost reduction of around 300,000 EUR per vessel for concept 2.
It can be concluded that the constraint for the block coefficient is close to the optimum block coefficient
of around 0.68 for concept 2. A relatively small cost reduction of 30,000 EUR per vessel per year is the
result when the block coefficient constraint is neglected.
All concepts satisfy the stability requirements of classification societies. From the attained results of the
stability check it can be concluded that concept 3 and 4 are close to not passing the limits for weather
stability limit 8 and limit 9. The weather criteria is the most influencing parameter for a loading condition
with fully erected container cranes. Concept 1 and 2 do easily pass the stability requirements.
From the sensitivity analysis, the main advice is to not invest into a vessel for the transportation of fully
extended container cranes of typically 1300 tons. Since any changes in building costs or fuel prices,
directly means that the client, in a one on one comparison with the S-class, is not willing to pay for a
more expensive vessel. Compared to the current S-class, costs can be further reduced, when the two
semi erected and two fully erected cranes are transported by concept 1 or 2. Knowing that concept 1
and 2 both save costs per contract compared to the S-class in all cases, (so for changes in vessel
speed, building costs or fuel prices) Dockwise will actually save money on the conventional
transportation method of two semi and two fully extended cranes.
P A G E | 88 of 90
RECOMMENDATIONS
The market analysis is done based on S-class history. It can be seen, that nowadays the market is rapidly
changed due to the low oil price. The utilization of the S-class is much lower than average number of the
last 8 years. It is recommended to take the new market distribution into account and the effect on future
cargo type transportations. Secondly the choice of four vessels to be replaced with four new vessels could
be not the best economical option. This depends on market availability and strategic location of vessels.
For the initial design, the installation depth is limiting for the choice of a medium speed or low speed diesel
engine. In this concept design study the medium speed engine is chosen as main engine. It is advisable to
invest in a decent study towards the cost effect of both engines on the average cost per contract. Secondly
the design of the foreship including, storage, accommodation, tanks and deck equipment, is based on
current vessel requirements. Deck length is the main requirement for this type of vessels. Innovative
design solutions may lead to a smart design that decreases overall vessel length and with that building
costs.
The ship resistance method is based on Holtrop Mennen. Since Holtrop Mennen is based on resistance
prediction, and heavy transport vessels in general are not of a conventional shape, it is recommended to
execute model testing.
It is recommended to increase stability for the concepts that include additional stability for the
transportation of four fully extended container cranes compared to the outcomes of the optimization tool.
An increase in width is the main parameter to be adapted in such a case.
For the optimization it is recommended that constraints for the design are reconsidered. An average vessel
speed requirement must be decided by the business. It depends on prospects of the market and possible
revenues. Technical constraints depend on feasibility. When the concept design is studied further these
constraints may change.
In the optimization stage, the stability is checked by approximating the GM value. This GM value depends
on weight and centre of gravity assumptions on ballast water, lightship and cargo. The lightship weight and
centre of gravity will be accurate in a later design stadium. The ballast water details are only clear when
the vessel is completely designed. Before assumptions have to be made. The cargo is based on a worst
case loading condition for container cranes. Since the assumptions for ballast water and lightship influence
the GM, and the GM influences the width of the vessel, these are sensitive assumptions.
REFERENCES
Aalbers, Arie. "Evaluation of ship design options." Delft University of Technology: unpublished, 2000.
Anderson, Kirsteen . M2 PressWIRE. November 15, 2004.
http://www.m2.com/m2/web/story.php/2004533F463109C2449285256F4D003EBA27 (accessed February 26, 2015).
Comando Generale del Corpo delle Capitanerie di Porto. "International Convention on Load
Lines, ICLL." 1966.
Det Norske Veritas. Rules for Ships. July 2011.
DNV. Rules for classification of Ships. Vol. Part 3 Chapter 5. Norway: Det Norske Veritas, 2012. Gerritsma, P. Bewegen en Sturen. Delft: Delft University of Technology, 2003.
Holtrop, J, and G.G.J. Mennen. "An Approximate power prediction method." International
Shipbuilding Progress 29 (335) (1982): 166-170.
Holtrop, J. "A Statistical Analysis of Performance Test Results." International Shipbuilding
Progress 24 (1977).
Holtrop, J. "A Statistical Re-Analysis of Resistance and Propulsion Data." International
Shipbuilding Progress, 1984: 272.
Holtrop, J. "De weerstand van bakvormige vaartuigen." Schip en Werf 1e jaargang Maart
(1991): 149-152.
International Maritime Organization, IMO. "Resolution A.749 Code on intact stability for all types
of ships covered by IMO instruments." 1993.
Journee, J.M.J., and W.W. Massie. Offshore Hydrmechanics. Delft: Delft University of
Technology, 2001. Kerlen, H. "Über den Einfluss der Völligkeit auf die Rumpfstahlkosten von Frachtschiffen."
Dissertation TH Aachen, 1981.
Klein Woud, Hans, and Douwe Stapersma. Design of Propulsion and Electric Power Generation
Systems. London: IMarEST, 2002.
Kuiper, G. Resistance and Propulsion. Delft: Delft University of Technology, 2002. Latarche, Malcom. "Semi-sub lifters keeping their heads above water." Offshore Support
Journal Jan/Feb (2015).
MAN. Basic Principles of Ship Propulsion. Man Diesel & Turbo, n.d.
Maxsurf Manual. "Maxsurf Resistance Program & User Manual." Appendix B. Bentley Systems,
Incorporated, 2013. NavCad Manual. NavCad User's Guide. Durham: HydroComp, Inc., 2004. Perez Arribas, F. "Some methods to obtain the added resistance of a ship advancing in waves."
Ocean Engineering, September 2006: 946-955.
P A G E | 90 of 90
Pinkster, J., and C.J. Bom. Geometrie en Stabiliteit. Delft: Delft University of Technology, 2006. —. Hydromechanica II, Deel 2 Geometrie en Stabiliteit. Delft: TU-Delft, 2006.
Probability in Civil Engineering, part 1: The theory of probabilistic design. Gouda: CUR, 1997.
Rizzuto, Enrico, and Guedes Soares Carlos. Sustainable Maritime Transportation and
Exploitation of Sea Resources. Vol. 1. CRC Press, 2011.
Saha, Goutam Kumar, and Asim Kumar Sarker. Optimization of Ship Hull Parameter of Inland
Vessel with respect to Regression Based Resistance Analysis. Dhaka, Bangladesh: MARTEC, 2010.
Schneekluth, H., and V. Bertram. Ship Design for Efficiency & Economy. Madras, India:
Butterworth-Heinemann, 1998.
Stopford, Martin. Maritime Economics. London: Routledge, 1997.
Timoshenko, Stephen P., and James M. Gere. Mechanics of Materials. Boston: Wadsworth
International, 1984.
van Hoorn, Frank. "Heavy-Lift Transport Ships - Overview of Existing Fleet and Future
Developments." Singapore: CORE, National University of Singapore, 2008.
Watson, D.G.M. Practical Ship Design. Elsevier, 1996.
World Cargo news. "Heavy lift operators still build capacity." March 2013: 46-47.


![arXiv:1104.3667v1 [stat.ME] 19 Apr 2011 design optimization (RBDO) is a concept that accounts for uncertainty all along the optimization process](https://img.pdfslide.net/doc/110x75/5b1c3dff7f8b9a46258f8d18/arxiv11043667v1-statme-19-apr-2011-design-optimization-rbdo-is-a-concept.jpg)