Embed Size (px)
Citation preview
1
The What Works Study: Instruction, Literacy and Language Learning for Adult ESL Literacy Students
Larry Condelli, American Institutes for Research
Heide Spruck Wrigley, Literacywork International
Published 2008 in S. Reder and J. Bynner (Eds.).Tracking Adult Literacy and Numeracy Skills: Findings from Longitudinal Research. London & New York: Routledge.
The focus of the What Works Study is on adult ESL literacy students⎯ESL learners who
lack basic literacy skills and have minimal proficiency in English. These learners face the dual
challenge of developing basic skills, decoding, comprehending and producing print. Until the last
quarter century, schools and resettlement agencies designed ESL classes on the assumption that
adult students had the basic education and literacy skills to learn another language (Van de
Craats, Kurvers & Young-Scholten, 2006). A wave of immigrants that arrived beginning in the
late 1970s challenged this assumption, as these new immigrants did not have the strong
educational experiences upon which literacy is built. Without the basic text processing skills that
allow them to follow text that appeared in class and in textbooks, these students became
frustrated, overwhelmed and had a high drop out rate, due to their inability to catch up the
missing literacy skills and keep up with the more literate students in the class (Wrigley & Guth,
1992). Recent trends indicate that the number of new immigrants to the U.S. who have very low
levels of literacy is continuing to increase (Fix, Passel and Sucher, 2003).
The What Works Study is the first large, national study to examine these students: who
they are, their instructional experiences and what they learn. However, the goal of this study was
not merely descriptive: it also sought to identify “what works”—the instructional activities that
help to develop and improve ESL literacy students’ English literacy skills and their ability to
communicate in English, by addressing the following questions:
2
Who are adult ESL literacy students? What are their English literacy and language abilities?
What types instructional approaches do teachers of adult ESL literacy students use?
What classroom and instructional variables are correlated with improving adult ESL literacy students’ literacy and language development and how do these relationships vary by students’ initial literacy level, native language, age or other characteristics?
What are the attendance and persistence patterns of adult ESL literacy students and what instructional factors affect persistence?
The study was to suggest changes in program design, resources and instruction that are
needed to improve instruction to, and literacy and language development of, adult ESL literacy
students.1
Conceptual Framework
Teaching ESL Literacy requires instruction in (1) the language skills necessary to
communicate in English, including sub skills related to sentence structure, pronunciation, word
endings, tenses; and (2) the literacy or reading and writing skills necessary to process print and
gain meaning from the written word. Cognizant of the importance of these key components in
teaching and learning, we based our approach to the study on the literature in second language
learning, theories of adult learning, studies in cognition, and research in reading. When we began
the study, very few studies existed that systematically explored the intersection of literacy
development and language learning in students who were non-literate or only marginally literate
in their native language. Since there was no direct research upon which to build our study, the
conceptual framework we created had to be based on implications from related research.
To guide our efforts, we built on a set of principles, originally developed as part of the
national Cyberstep Project (Wrigley, H.S. 2001), outlining what it takes for adults to learn. We
wed these principles to research in basic reading and created a framework that looked at key
3
components needed to enable students to learn to read and write for the first time in English.
These components included reading as meaning-making, reading for practice, and activities
related to oral fluency, grammatical accuracy, and vocabulary development. We also included
strategies likely to improve literacy development, such as connecting prior information with new
information and focusing on both global meaning and details, and sub skills related to phonemic
awareness, decoding, and pronunciation.
There is very little research on outcomes related to adult literacy students and almost no
such research on adult ESL literacy students, to inform development of a growth model.
However, the broader research on adult second language acquisition suggests that the following
could affect English language learning and literacy development of our students:
• English oral language ability could influence second language reading development (Alderson,1984; Carrell 1991; Bernhard and Kamil, 1995);
• Literacy in context – use of language in rich contexts in instruction (such as connection
to real-world tasks and materials) promotes second language learning (Bransford, et al., 2000; Brown, el al., 1996; Greeno and Resnick et al., 1996; Purcell-Gates, et al., 2002);
• Native language support – literacy in the native language promotes second language
development (Ramirez, Yuen and Ramey, 1991; Slavin and Cheung, 2003; Thomas and Collier, 2002).2
Methodology of the Study
We collected data over a two year period in 38 classes from 13 adult ESL programs in
seven states (Arizona, California, Illinois, Minnesota, New York, Texas and Washington), and
we had a final sample size of 495 students. The sample included two cohorts of students who
were followed from the time of entry into class for nine months. Data collectors assessed
students at entry (initial assessment), approximately three months after enrollment (second
assessment) and about nine months after enrollment (final assessment), regardless of how long
4
the student remained enrolled. Data collectors also observed each class an average of nine times
over the data collection period and coded instructional activities.
Site and Student Selection
When identified ESL literacy students as those who had 3 years of schooling or fewer
and selected a sample of candidate sites (over 25 in all) chosen from a mail survey. We recruited
558 students, of which 58 left classes less than four weeks after recruitment, the minimum time
we required for inclusion in the study, leaving 500 eligible students in the sample. Data for five
students were incomplete or inaccurate, giving us a final study sample of 495.
Longitudinal Issues: Maintaining Contact with Students
Although the study had a nine month follow-up period, we did not expect learners to
remain in class more than three or four months. The nine month follow-up assessment, however,
allowed us to take a longitudinal look at student learning after instruction ended. The extra time
also provided an opportunity to look at student attendance and retention in adult ESL classes.
We knew that keeping track of adult ESL students for even a relatively short time would
be a challenge. Our main strategy for tracking students was to use individuals from the
community as our local field staff. These “study liaisons” lived in the communities of each local
adult school in the study and most were former adult ESL teachers. They knew the issues and
concerns facing students in the program and were experienced in working with the study
population. In Latino communities in the study, all liaisons were English-Spanish bilingual and
one had been a student in the school where the study was being conducted.
The study liaisons recruited students into the study, observed classes and had ongoing,
direct contact with each student in the study. They collected extensive contact information on
5
each student, stressed the importance of remaining in touch for the study and encouraged
students to inform them of planned leaves or absences. If students failed to attend class, liaisons
would try to locate them, either directly or by asking other students in the class or the community
to assist in locating them. Through this personal relationship between student and liaison, we
hoped to minimize study attrition.
Measuring Instruction: Classroom Observations
. Guided by our conceptual framework and our observations of over 75 classes, we
outlined the learning tasks and teaching strategies associated with both literacy development and
second language development and created codes that described the components of learning and
instruction associated with each.
We quantified instructional activities (using percent of observed time on the activity) as
well as observer ratings of teachers’ use of instructional strategies, with four point Likert scales.
We created two categories of measures: instructional emphasis measures, which describe the
content of the instruction in terms of the language or literacy focus and instructional strategies,
the activities teachers used to organize and teach the lesson.
While these strategies and emphases characterize how instruction was provided, they
were not mutually exclusive or independent of each other. In fact, teachers that used one set of
strategies often used combinations of them over time or within a single class session. The
following instructional variables were used in the analyses.
Instructional Emphasis Variables
Literacy development emphasis—Main focus on reading and writing development. ESL acquisition emphasis—Main focus on, fundamentals of English (how English
works)
6
Functional skills emphasis—Main focus on functional literacy (e.g., interpreting forms, labels, using money, maps).
Basic literacy skills emphasis—Main focus on print awareness, fluency and basic
reading skills.
Reading comprehension emphasis—Main focus on comprehension strategies.
Writing emphasis—Main focus on writing fluency, writing practice.
Oral communication emphasis—Main focus on speaking and listening practice. Instructional Strategies Variables
Varied practice and interaction—teachers provide students with opportunities to learn in a variety of ways and modalities (e.g., speaking, reading, writing) and by having students interact with each other.
Open communication—teachers are flexible and respond to students’ concerns as
they arise; ask for open-ended responses; support authentic communication.
Connection to the “outside”—teachers link what is being learned to life outside classroom and bring the “outside” into the class through use of field trips, speakers, and real-life materials.
Another instructional strategy we coded was the teacher’s use of students’ native
language in instruction. We constructed a scale of the use of this instructional strategy by first
conducting a factor analysis of the four measures we used of how native language use was
incorporated into classes: to explain concepts, give directions, for students to ask questions and
to do written assignments. The analysis identified only one factor, which incorporated all of the
measures. We combined these four items into a single index representing the average proportion
of use of the four native language instructional activities in each class. The scale ranged from
zero (use of no activities) to one (use of all four activities). We then averaged the scores across
observations.
To ensure reliability, we trained observers extensively and reviewed coding of all
observations. The framework and the resulting observation instrument not only helped to guide
7
the study, but also served as a blue print of sorts to the kind of teaching and learning that make
up adult ESL literacy.
Measuring Student Learning: Outcome Measures
Assessment in adult ESL requires measurement of skills in two domains: English
language proficiency and literacy ability. Knowledge of English is interwoven with the ability to
process print. To assess students’ knowledge of English, regardless of their ability to read and
write, we needed assessments that measured speaking and listening and did not require reading
instructions or other literacy-based skills, to respond. Conversely, to find out if students could
complete literacy tasks, we had to make sure that they understood the instructions. To that end,
we gave instructions to each task in English and the native language.
To capture these complexities, we used a multi-dimensional, multi-method approach to
assessment with a battery of standardized and non-standardized tests that included:
The Woodcock-Johnson Basic Reading Skills Cluster (WJBRSC) and Reading Comprehension Cluster (WJRCC), which measured basic reading and comprehension abilities;
The oral Basic English Skills Test (BEST), measured English speaking and listening;
and
Adult Language Assessment Scales Writing Assessment (A-LASW) measured writing ability.
The study also included an interview about student literacy practices in both English and
the native language and a reading demonstration task, which measured student English fluency
and comprehension through reading of authentic materials. Each assessment was conducted
individually. Instructions were translated and the literacy practices interview was conducted
entirely in the native language. .
8
Student Attendance Measures
Students enrolled in adult basic literacy and ESL classes typically attend for relatively
brief periods of time. These students face many barriers to attending regularly or completing a
course, including the lack of available childcare, family problems, transportation difficulties, and
the trade-off between work and going to class (Chisman, Wrigley & Ewen, 1993) which may
cause them to drop out of class. However, students may also leave for positive reasons, such as
meeting their educational goals and some may “stop out” and return to the class at a later time
(Quigley, 1996; Comings, Cuban, Bos & Porter, 2003). Many adult educators fear this brief
attendance prevents students for achieving significant improvements in their literacy skills.
We studied student attendance patterns through the following measures:
Total hours— total number of instructional hours attended; Total weeks— total number of weeks attended; Rate of attendance— proportion of total hours attended out of hours possible to
attend; and Intensity— average number of hours attended per week.
Each measure of attendance provides us with different information about student attendance
patterns.
Descriptive Findings
Of the 495 participants in the study, 258 provided assessment data for all of the three
assessment periods, 135 provided initial assessment data only, and 102 provided data at other
times. Of those 102 students, 97 completed the initial and second assessments but were
inaccessible for the final assessment. Consequently, of 495 students that took the initial
assessments 356 students (72 percent) took the second assessments and 263 students (53 percent)
took the third set of assessments.
9
The study attrition for the third assessment was quite high, due primarily to the loss of
students during the summer months in the first year of the study. While we tried to begin the
study in the fall each year, during the first year some sites did not begin data collection until the
winter and in those sites, the third assessment period was in the fall. Over the summer, many
students left the area and liaisons lost contact with students. During the second year of the study
when the final assessments were completed by June, the retention was over 70 percent.3
The average age of students in the study was 40; they were 72% female and had an
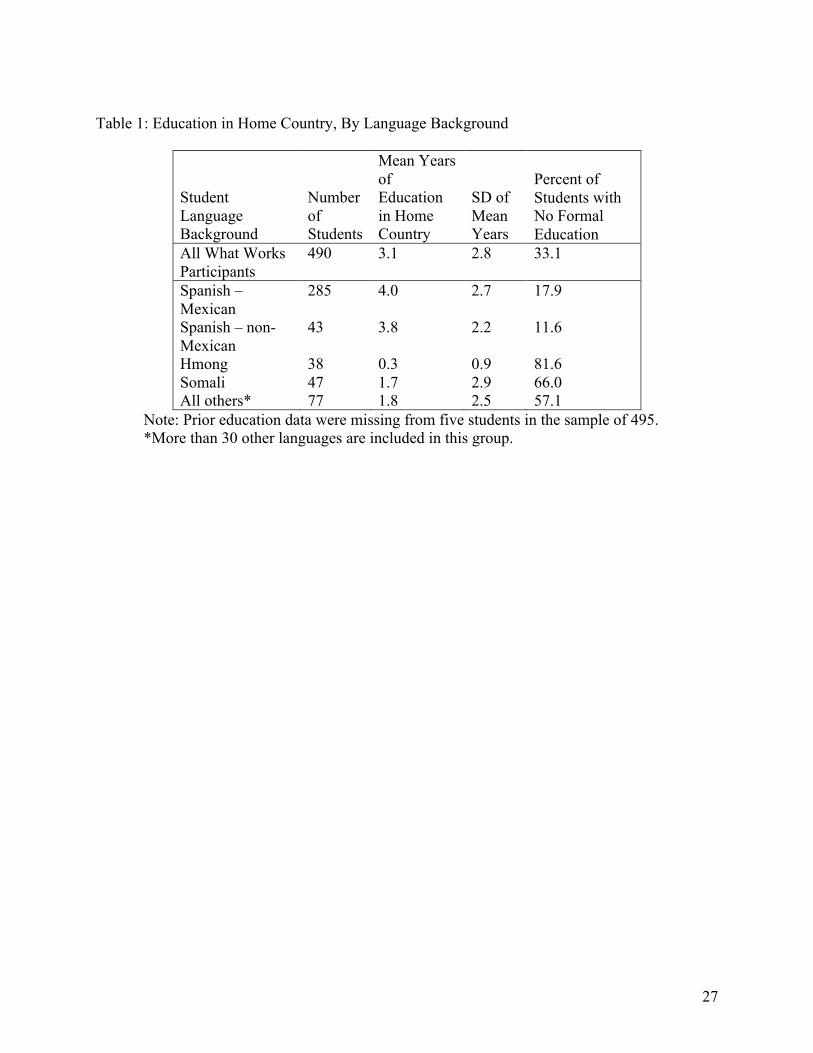
average of 3.1 years of schooling in their home country. Table 1 summarizes the characteristics
of students in the study.
Put Table 1 about here
Students in the study attended an average of about 16 weeks and 128 total hours and
attended about two-thirds of possible time (rate of 0.64). This rate had very little variability and
further analysis revealed that type of instruction and scheduled class time had no significant
effect on rate of attendance. These findings suggest that students devote a set proportion of their
time to attend class, which appears to be difficult to change through schedules, class content or
attendance requirements. The lack of effect of these variables on rate of attendance may be due
to life circumstances of ESL literacy students, which make it hard for them to attend more
frequently, or it may be an implicit decision by students to devote only a certain amount of time
to class attendance.4
Literacy and Language Skills
The students in the study were indeed very low literate and had minimal oral language
skills in English, as measured by the standardized assessments. According to the WJRBRSC
subtests, students started at an average of about a 1.5 grade level and improved to second grade
10
level at the final assessment. Students’ reading comprehension scores as measured by the
subtests were also very low and changed little over the study period, remaining at just about the
first grade level. According to the BEST Oral English assessment, students had very little oral
English ability, with almost 70 percent of them initially at SPL II or lower. In contrast to literacy
skills, however, BEST scores improved dramatically over the study period, with only about 40
percent of students at these levels and increased percentages at higher SPLs at the final
assessment.
The ALAS Writing Test (ALAS-W) presented a challenge for students. Most students
were able to write few, if any, English words and most words were simple nouns and pronouns.
It was not uncommon for students to write partially or even exclusively in their native languages
or to return blank test forms. By the final assessment, the average scores on both subtests
increased little and the increase was not statistically significant.
Statistical Modeling of Growth of Literacy and Language Skills
The study examined the relationship of instructional content, instructional strategies,
attendance, student characteristics, teacher characteristics and class variables on student
outcomes using a latent growth modeling within a hierarchical linear model (HLM) framework
(Bryk and Raudenbush, 1992). The latent growth modeling technique is designed to capture the
underlying growth that takes places over time by using each individual student’s data to draw a
single, underlying growth trajectory that fits a straight line or smooth curve. The statistical
parameters underlying the line or curve can then be used to describe students’ literacy growth in
terms of their initial status, or where they started, and the linear and quadratic (or non-linear)
rates and direction of change. The parameters allow prediction of the effect of variables in the
model that relate to growth. In other words, using this technique, we can estimate where students
11
were on the measures when they enrolled, how fast they grew on the measures over the course of
their class participation and estimate continued growth. We can also relate this growth to specific
variables in the model to predict which ones correlate with faster (or slower) growth.
Variables Used in the Model
The conduct of latent growth modeling requires identification of predictor variables and a
model of how the predictors relate to an outcome measure within the different levels of analysis.
The researcher must identify the predictor variables and model through theory, prior research and
the statistical nature of the data collected.
We first conducted preliminary analyses on student, class, teacher and instructional variables
that we believed would influence language learning and based on these analyses, dropped
variables due to lack of variance on measures, to avoid redundant predictors and to achieve a
parsimonious model.5
Figure 1 shows the variables used in the model, which include (1) student background
variables, (2) teacher characteristics, (3) class types, (4) instructional variables, (5) attendance
measures and the English literacy and language test scores we used as outcome measures. The
student background, attendance and outcomes variables are student-level measures and the
remaining variables are class-level measures. Not all the measures in Figure 1 were used in all
analyses. Instead, we had a core set of measures, which served as the basic model and then used
additional measures that were appropriate to the outcome under investigation.6
Figure 1 about here
Variables Related to Growth in Basic Reading Skills (WJBRSC)
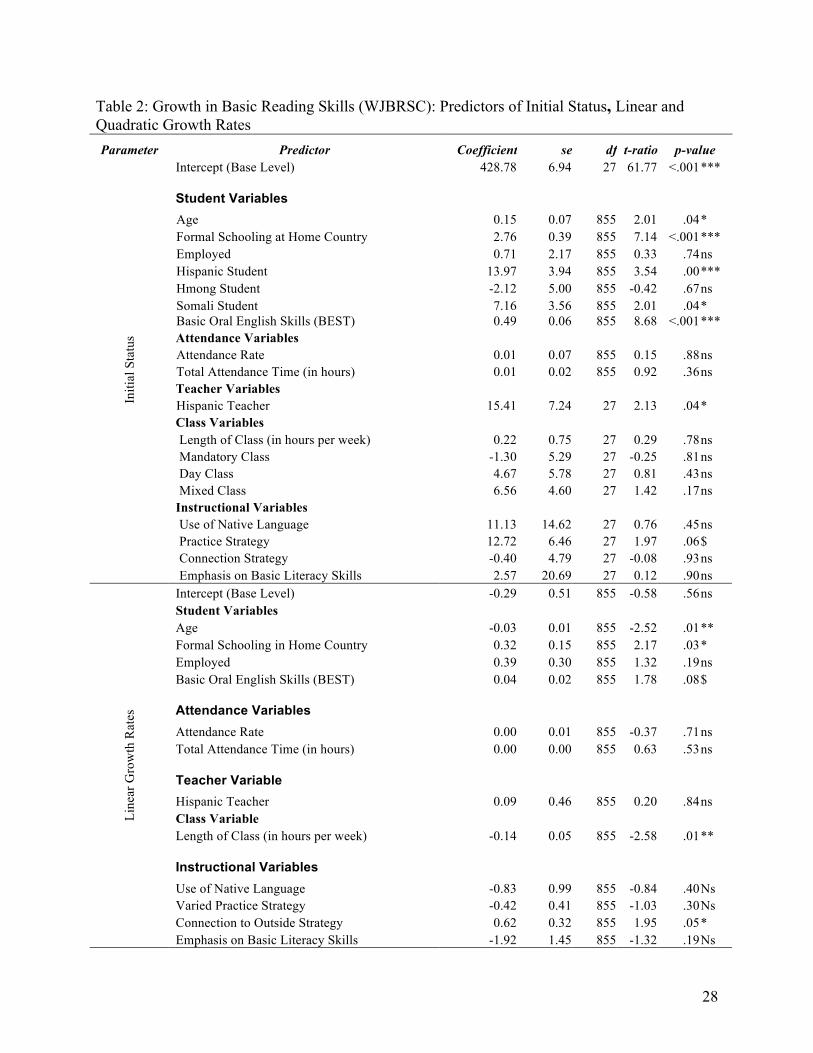
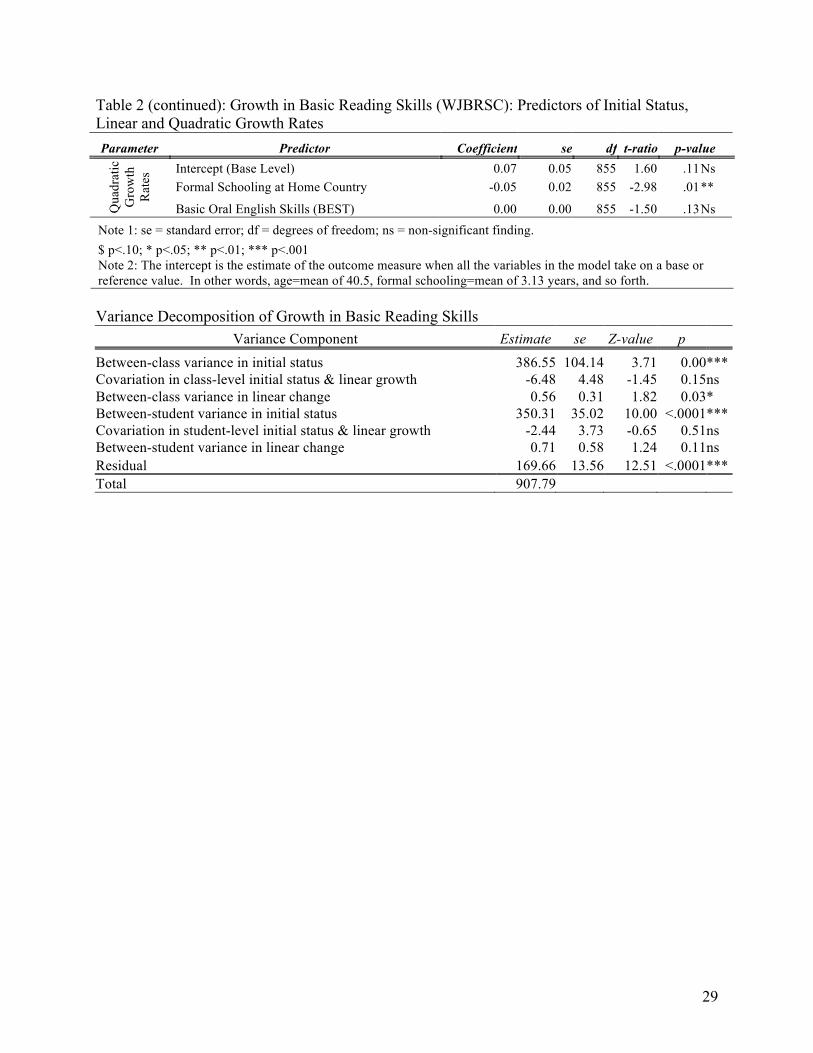
Table 2 shows the results of the HLM modeling on the WJBRSC, which assessed students’
basic reading skills, including letter-word identification and knowledge of phonics.7 Two student
variables, age, and years of formal schooling, were significantly related to growth in basic
12
reading skills. Age was negatively related to linear growth rate, meaning that older students
acquired these skills more slowly. Even though younger students started lower on this measure
(as revealed by preliminary analysis), they made up for their initial disadvantage in basic reading
skills by learning faster.
Table 2 about here
Students’ years of formal schooling in the home country was also positively associated
with linear growth rate. Students with more education both started at a higher level and learned
faster than their less educated peers. However, students’ years of formal schooling in the home
country became less important over time, as indicated by the negative quadratic growth
coefficient. This means that the initial positive effect of formal schooling in the native country on
linear growth fades over time. While prior education initially helps ESL literacy students acquire
basic reading skills, this initial advantage does not help later.
Students’ oral English skills, as measured by the BEST, were also positively related with
the linear growth in basic reading skills (with marginal statistical significance). This finding may
indicate that some proficiency in oral English language skills may work to assist learning of
basic reading skills.
The only class-level variable related to growth in basic reading skills was the length of
the scheduled hours per week of class meeting time. Students in classes with longer scheduled
hours showed less growth than students in classes with fewer scheduled hours. Other things
being equal, including students’ attendance and persistence, the longer the class’s weekly
scheduled meeting hours, the slower the rate of students’ learning in basic reading skills.
The use of the instruction strategy we called “connection to the outside,” where teachers
brought real world materials and examples into their instruction, had a positive effect on the
13
linear growth in basic reading skills. The use of this strategy was effective in raising the level of
students’ mastery in basic reading skills. The analyses suggest that that all else being equal, the
use of the connection to the outside strategy results in an increase in basic skills development
over time.
Variables Related to Growth in Basic Reading Comprehension (WJRCC)
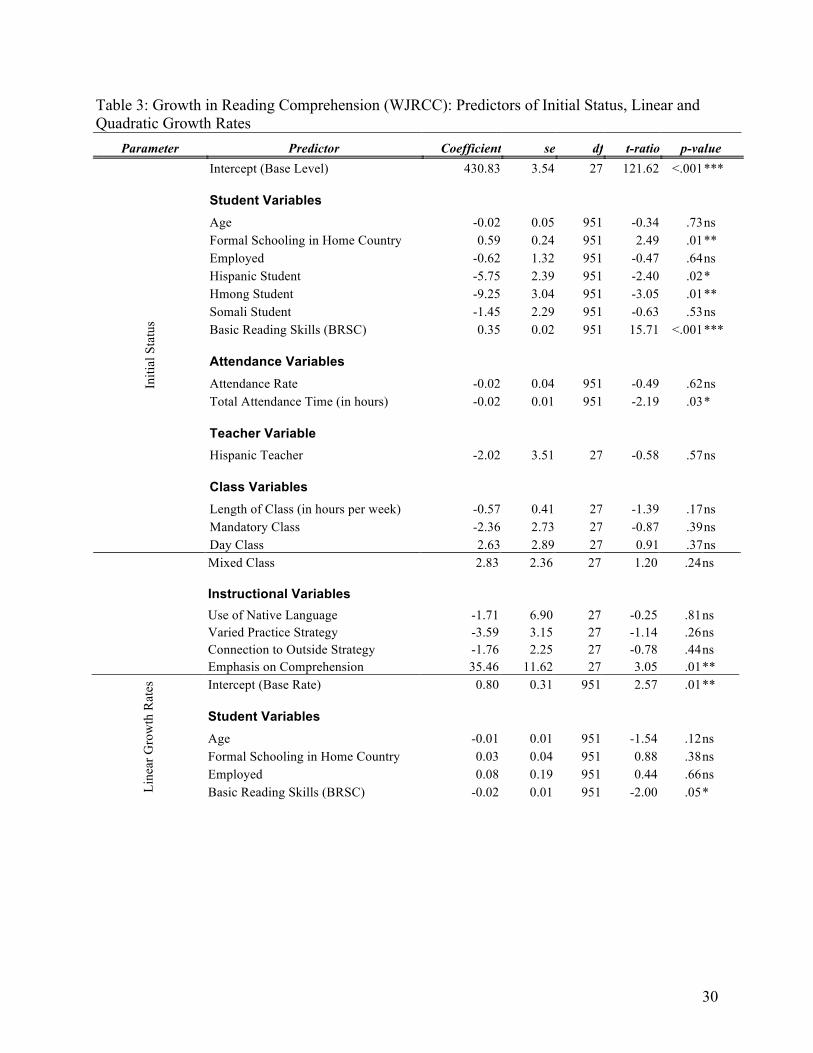
The latent growth modeling analysis for the reading comprehension measure, the
WJRCC), showed an average steady linear growth over time of about 1.2 points per month. We
examined within the model the relationship of students’ basic reading skills at entry in class on
growth in reading comprehension. The results of the analysis, shown in Table 3, revealed both a
significant negative linear growth and a positive quadratic growth curve. We interpret this
finding to mean that the reading comprehension of students with higher BRSC scores at class
entry grew very little at first, but over time this growth accelerated more dramatically. In
contrast, students with little or no basic reading skills at entry showed a small amount of growth
initially, but then failed to improve their reading comprehension skills over time. In other words,
adult ESL literacy students who entered class with some basic reading skills showed significant
growth in reading comprehension compared to students who had little or no basic reading skills,
but this took time to appear. Initially, students with low basic reading skills improved slightly,
but then later showed no growth in their reading comprehension skills.
Table 3 about here
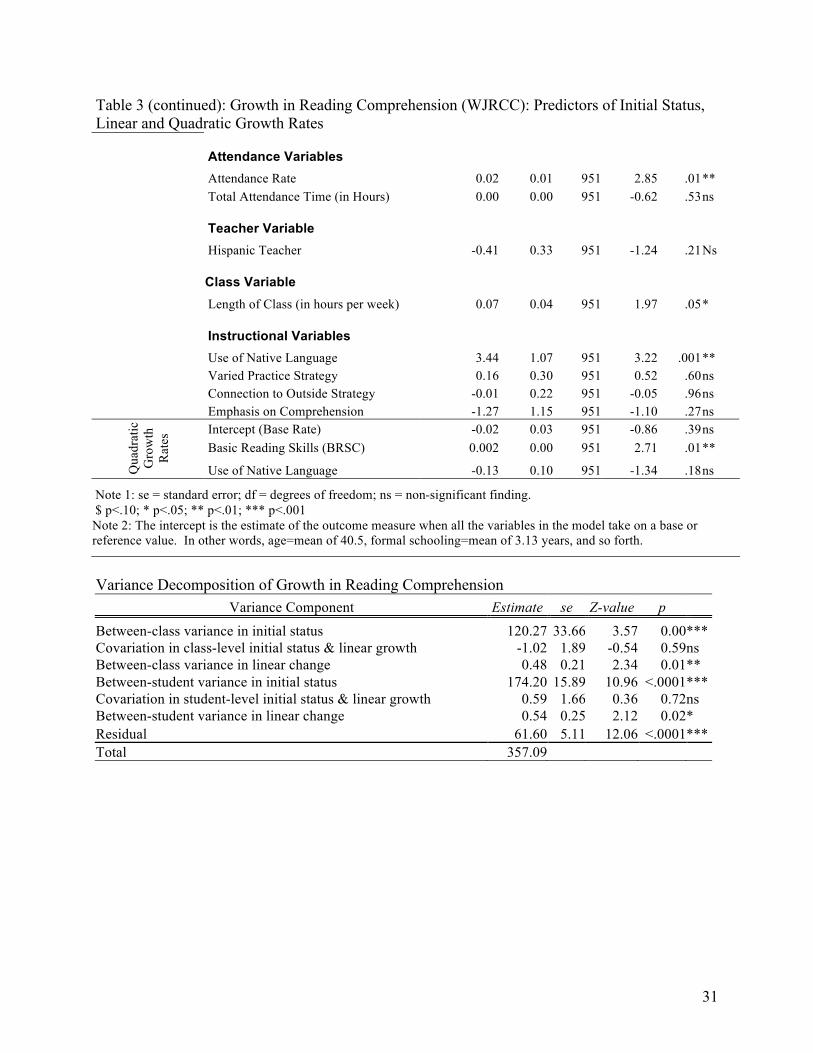
The model identified the rate of attendance (proportion of hours attended to scheduled
hours) as positively related to linear growth in reading comprehension. The coefficient of 0.02
for the attendance rate means that there was a 0.2-point increase per month with each 10 percent
increase in attendance rate, which was significant even after controlling for the total attendance
14
time in hours. Thus, students who attended more regularly improved their reading
comprehension skills, no matter how many hours they attended. The scheduled length of class in
hours per week was also related to positive growth in reading comprehension. Students in class
with more scheduled hours per week had more growth in reading comprehension.
The use of a native language in class, a measure of how teachers used the students’ native
language for clarification during instruction, had a positive effect on the linear growth in reading
comprehension. In other words, the more teachers used students’ native language to do such
things as give directions about class activities or to clarify concepts, the faster students’ reading
comprehension grew. This relationship was quite strong: the coefficient of 3.44 for the variable
can be translated to a gain of 8.2 points over a year with a 20 percent more use of native
language.
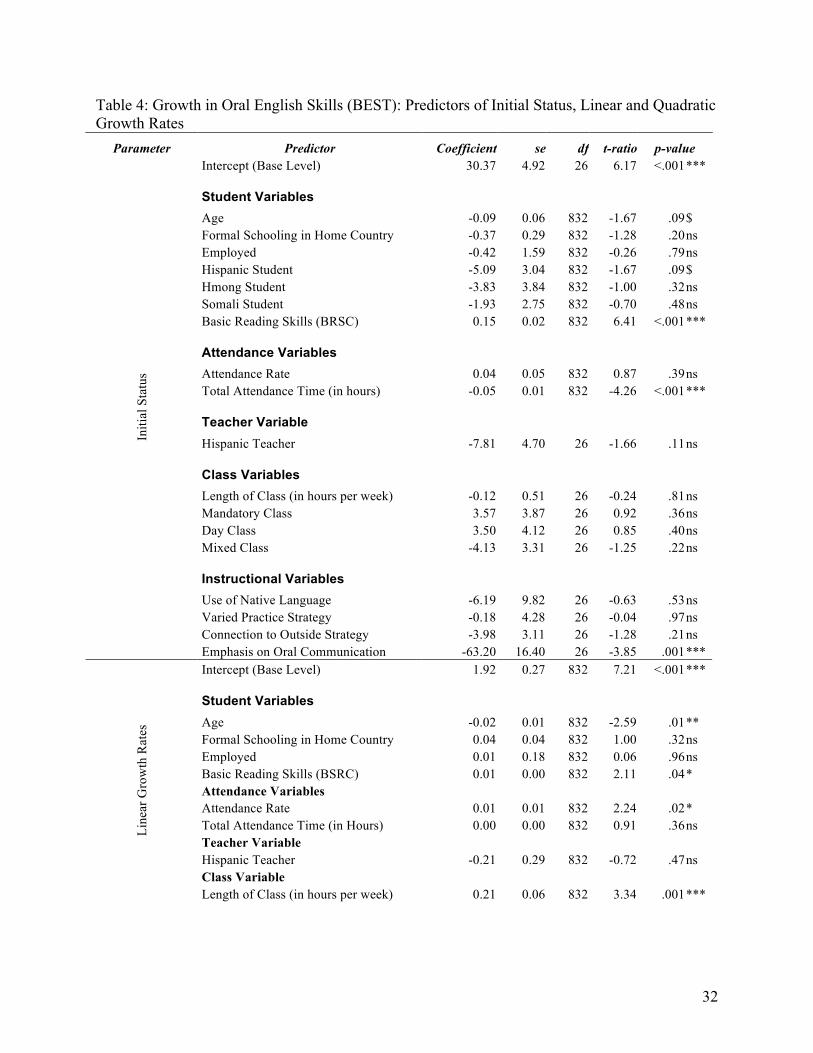
Variables Related to Growth in Oral English Language Development (BEST)
The growth curve model for ESL literacy students’ oral language skills measured by the
BEST test showed that there was significant linear growth and a significant quadratic trend,
meaning the linear trend tapers off over time. The mean BEST total scores started at 23.7 and
increased at a rate of about 2.2 points per month for the first three months, or about 6.6 points.
However, due to the growth deceleration, the model showed it would take the next six months to
achieve the same amount of gain. The results of the growth curve modeling presented in Table 4
show that many student, class attendance and measures of instructional strategies were
significantly related to linear growth in development of oral English communication skills.
Table 4 about here
Students’ age had a small negative relationship to linear growth in oral English skills, as
measured by the BEST. Younger adult ESL literacy students acquired English speaking and
15
listening skills at a slightly faster rate than their older counterparts. The model predicts that a 20-
year-old student would gain 0.4 more points more per month on the BEST compared to a 40-
year-old student, all other variables being equal. Since younger students also tended to have
slightly better oral English skills at the start of class, this age gap only widens over time.
Students’ with higher basic reading skills when class began, as measured by the
Woodcock Johnson BRSC, were positively related to BEST scores initially (i.e., initial status)
and were positively related with linear growth in oral English skills. This finding means that the
better basic readers started higher and learned English oral skills faster than their less reading-
skilled peers.
As with the reading comprehension measure, rate of attendance was significantly related
to positive growth in oral English. Other things being equal, including the length of class and the
total amount of attendance hours, students who attended more regularly (i.e., with higher
attendance rate) learned oral English at a faster rate than students who attended less regularly.
The model also showed that the scheduled length of class in hours per week was positively
associated with linear growth rate. In other words, the longer classes promoted faster growth in
oral English acquisition.
The growth model revealed three instructional factors that were positively related to
improvement in oral English. Students in classes where more time in instruction was spent on
oral communication development activities (such as pronunciation practice, conversation
practice and dialogue drills) grew faster than students in classes where this type of instruction
was provided less often.8 The use of native language as instructional support also helped
students learn oral English faster, as did increased use of the varied practice and interaction
strategy.
16
We illustrate the growth curve model predictions for oral English language development
in Figure 2, using two of the instructional variables. Holding other variables constant, we
compared the growth lines for low and high emphasis on oral communication instructional
activities and low and high emphasis on the varied practice and feedback strategy. We also show
the projected growth when both strategies are used at a high level, all else being equal. The
curvilinear relationship is clearly evident, as are the relative effect of the two instructional
emphases and the combined effect when both strategies are used.
Figure 2 about here
Summary and Discussion of Main Findings
The What Works study was successful in achieving its main goal of relating instructional
strategies to student learning. Through the growth modeling approach, we found that three
instructional strategies: connection to the outside world, use of the student’s native language for
clarification in instruction and varied practice and interaction, were related to growth in student
literacy and language learning. Table 5 summarizes the main findings related to instruction and
program practices. These instructional strategies encompass a range of teaching activities, which
we discuss below, along with an interpretation of why these strategies were effective. We
conclude with a summary of findings related to student variables and suggestions for further
research, including conducting longitudinal research.
Table 5 about here
Connection to the Outside: Using Materials from Everyday Life
Connecting literacy teaching to every day life made a significant difference in reading
basic skills development. To implement this strategy, teachers used materials from daily life that
contained information that students wanted to know about or with which they had some
17
experience. For example, a teacher might bring in grocery flyers from different stores and ask
students to compare prices or use phone and electricity bills, letters from schools or immigration
authorities, and other items that highlight literacy for adult contexts. Using authentic materials in
this way, teachers can help build vocabulary skills, build background knowledge that helps
students negotiate different types of document literacy and increase reading comprehension
skills. Work by Purcell-Gates and her colleagues has also demonstrated positive effects for
using authentic materials in instruction (Purcell-Gates, et al., 2002).
Activities of this sort might foster literacy development by linking new information to
what learners already know and by engaging the learner in topics of interest. By starting with
familiar materials that are of interest to learners and by creating situations for cognitive
involvement, teachers can create interest, maintain high levels of motivation, engage students’
minds and through this process build literacy skills that have importance in the lives of adults.
Use of Students’ Native Language for Clarification
In classes where teachers used the native language as part of instruction to clarify and
explain, students exhibited faster growth in both reading comprehension and oral communication
skills.9 Since the directions for a language and literacy task are sometimes more complex than
the language required by the task itself (e.g., “write your name and the date on the upper right
hand side of the paper”), students who received clarification in the native language were able to
focus on the task at hand and the confusion and anxiety of not understanding the instructions
were reduced.
Another reason why using both English and the native language in the classroom was
effective may be that many of the learners, particularly along the U.S. – Mexico border, have
become convinced that English can only be learned through a reliance on translation and are
18
reluctant to use English outside of the classroom for fear of not understanding or not being
understood and possibly subject to ridicule. They may have lost confidence in their ability to get
a point across in imperfect English or to understand a message if not all the words are
understood. For these students, having a teacher who shares their language means being able to
ask questions in a language they understand and having the security that access to the native
language provides. Being in a classroom where the native language is used may provide less of a
linguistic and more of a psychological advantage. Free from the anxiety of having to survive on
English only in the classroom, these adults now have the opportunity to focus on learning and
take in more information than otherwise possible. These explanations, however, must remain
speculative, since we collected no data directly on these topics.
It seems clear that we cannot think critically in a language we cannot understand. Beginning
ESL literacy students are not able to discuss options or articulate opinions to a deep level if they
still struggle with even a basic conversation in the new language. They may be able to
understand a simple scenario presented to them, but they will be hard pressed to discuss the
situation in detail or suggest more than the simplest course of action. Yet these types of
situations present themselves daily to immigrants and refugees since the problems of real life do
not wait for English to catch up: children have to be enrolled in school, supervisors need
explanations and newcomers get lost. By giving students a chance to use their own language in
discussions, teachers can help students think about the situations that might confront them and
can encourage them to work with others to brainstorm ideas, discover options and think about
consequences. By mixing the use of English with opportunities to use the native language where
appropriate, the learning English can be reinforced. This may be the process by which oral
19
communication skills and reading skills improved, although again we can only speculate due to
lack of data on this issue.
Varied Practice and Interaction
The reason for the relationship of varied practice and interaction to oral language learning
may be that learning how to communicate in English is a challenging process that requires
different sets of knowledge: an understanding of sentence structure, grammar and syntax; a good
sense of how written language reflects oral language (phonology); the ability to interpret and use
word endings that change the meaning of an expression and a rich vocabulary. In other words,
students need a good sense of “how English works” to understand what is being said and explain
their ideas in ways that at least approximate Standard English. Communication requires a good
sense of what is appropriate in any given situation, a sense of socio-linguistic competence.
While it is possible to learn English on one’s own and slowly sort out the intricacies of the
language, the process is aided by a teacher who draws students’ attention to certain patterns and
rules when appropriate and gives students a chance to talk in class without having to worry about
accuracy at every step. This strategy is fundamental to direct teaching and explicitly literacy
instructional approaches, for example (Brown & Pressley, et al., 1996; Carell, 1985). However,
while there is a place for direct teaching in the ESL literacy classroom, it is easy for students to
become overwhelmed. Adults who did not study English formally in school often have
difficulties understanding concepts such as “subject” or “direct object” and too academic
terminology can frustrate both students and teachers. Setting time aside, however, to demonstrate
to students how English works by highlighting patterns and to practice language in meaningful
ways appears to pay off in terms of increasing oral proficiency.
Students and Teachers
20
In examining the relationship of student background characteristics to English literacy and
language development, we found that students’ amount of formal education was related to
growth in basic reading skills. While all of the students in the study had very little formal
schooling, the more schooling they did have, the greater their development of basic reading skills
– at least at first. This initial advantage of schooling faded over time. It may be that students with
more prior schooling in their native language had some knowledge of basic reading that they
were able to transfer to English, enabling them to learn faster. Students with less schooling
struggled initially, but eventually caught up to their more educated peers. This find is consistent
with the general research on the relationship of educational training in basic literacy to learning
basic reading skills in a second language the subsequent learning level and second language
literacy development (Young-Scholten and Strom, 2006).
Students’ English language and literacy skills when they started class also were related to
their subsequent learning. Students with higher basic reading skills (as measured by the
WJRBRS pretest) developed reading comprehension and oral communication skills faster than
their peers. Similarly, students with higher initial English oral communication skills (as assessed
by the BEST pretest) improved their basic reading skills faster.
Students’ age was also an advantage to developing English oral communication and basic
reading skills. Younger students developed these skills faster than older students. We cannot
state from this research whether this finding is due to a cognitive advantage of age or higher
motivation of younger to learn English that older students. However, there was one assessment
where older students had the advantage: the reading demonstration task. Older students tended to
perform better over time reading the real-life, authentic materials (e.g., bill, labels, signs) used in
21
this assessment than younger students. This intriguing finding may be due to the greater
experience older students may have with these materials (see Condelli, et al, 2003).10
We also looked at whether teacher background and training had an effect on adult ESL
literacy student learning. We found that no teacher variables were related to any of the student
outcome measures used in the study. However, the 38 teachers in the study were relatively
homogeneous. They were generally new, inexperienced teachers and although most had
Bachelor or Master’s degrees, had little training or professional development in teaching adult
ESL or ESL literacy. These factors made it very difficult to find statistically significant effects
for teacher characteristics.
Suggestions for Further Research
Because the What Works Study did not employ experimental manipulation or a
randomized design, we cannot state definitively which specific instructional practices will
produce the outcomes we observed. For example, while our findings allow us to say that
“bringing in the outside” teaching strategies are related to growth in adult ESL literacy students’
basic reading skills, the study design does not allow us to say which specific instructional
practices will cause these students’ basic reading skills to improve. To make this type of
inference, experimental research using random assignment, is needed.
The study methodology and approach limited our ability to examine the effect of teacher
characteristics on adult ESL student learning and to define the characteristics and behaviors of
good teachers. Yet, the importance of a good teacher is widely acknowledged and adult literacy
students often identify their teacher as instrumental to their learning. In addition to focusing on
instructional methods, a future study could identify teacher variables, such as ESL specific
22
training, educational background and pedagogical approach of teachers that affect student
learning.
While the study has demonstrated that instructional practices in adult ESL literacy class
are related to language and learning growth, most students spend relatively little time in class.
For example, we found our students attended an average of about 129 hours over 16 weeks.
Adults in these classes clearly rely on their environmental exposure to English and other methods
of learning, in addition to classroom instruction, to acquire literacy and language skills. Such
factors as the community in which learners reside, personal and family situation, employment,
personal motivation, and literacy practices and needs also affect learning. The role of self-
directed learning of adult ESL students has received little attention, but current research suggests
it is an important factor in adult learning (Reder and Strawn, 2006).
Future research could also explore approaches to assessing adult ESL literacy students.
We found that the assessments available for these students for instruction, research and
accountability purposes range from non-exist to inadequate, particularly in the assessment of
literacy skills in second language learners. Empirical work to identify assessment approaches and
to develop and evaluate new assessments would greatly benefit the field at all levels. Teachers
need these tools to design appropriate instruction, researchers need them as outcome measures
and administrators need a gauge on student progress for accountability.
Implications for Longitudinal Studies
This study is a first attempt to examine adult ESL literacy student’s experiences with
instruction and how literacy and language skills develop over time, using quantitative methods.
Although the study period was only about 9 months, our analytic model uncovered intriguing
changes in learning development during this time. The HLM model for basic reading skills,
23
reading comprehension and oral English language development each had a significant quadratic
or non-linear trend. In the modeling of basic reading skills, students with more schooling
improved on these skills more quickly than less educated students, but this advantage
disappeared over time. The model also identified a changing learning dynamic for reading
comprehension. Adult ESL literacy students who had higher basic reading skills showed
significant growth in reading comprehension compared to students who had little or no basic
reading skills, but this took time to appear. At first, students with low basic reading skills
improved slightly, but then later showed no growth in their reading comprehension skills. For
oral English development, we observed rapid learning initially, which dropped off over time,
according to the statistical model. Further research can study these learning changes over time
and by student, only through longitudinal study.
Unaddressed in this study was the role of students’ literacy and language learning outside
the classroom. Students only attend for an average of about 129 hours over a four month period,
an insufficient amount of time for proficient language development, especially for students at the
literacy level. However, students are exposed to English and negotiate American culture and
daily life with varying degrees of success. Clearly, ESL students have other ways of learning
English and supplementing their classroom experiences which longitudinal study could help
reveal. As reported elsewhere in this volume, Reder has studied this issue with low-literate
native English speakers.
As we found, however, longitudinal study of the adult ESL literacy population must
contend with the reality that many students are new immigrants and refugees and move
frequently to follow jobs and family. A substantial number of students from Mexico and Central
America also return home frequently, maintaining ties on both sides of the border. Our strategy
24
for maintaining contact with students was to use field staff from the community who developed
personal ties with learners and maintained frequent, ongoing contact, which was somewhat
successful when were able to implement it. For the second study cohort, we had a retention rate
of almost 75 percent of learners. For the first cohort, however, which lasted over a summer, field
staff lost track of many students and retention was just over 50 percent. This difference
illustrates that continuous, ongoing student contact is essential to the success of any longitudinal
effort.
25
References Alderson, C. (1984). Reading in a Foreign Language. New York: Longman. Bernhardt, E. & Kamil, M (1995). Interpreting relationships between L1 and L2 reading:
Consolidating the linguistic threshold and the linguistic interdependence hypothesis. Applied Linguistics, 16: 15-34.
Bransford, J.D, Brown, A. & Cocking, R. (2000). How People Learn: Mind, Brain, Experience
and School, Expanded Edition. Washington, DC: National Academy Press. Brown, R., Pressley, M., Van Meter, P., & Schuder, T. (1996). A quasi-experimental validation
of transactional strategies instruction with previously low-achieving, second-grade readers. Journal of Educational Psychology, 88, 18-37.
Bryk, A.S. & Raudenbush, S.W. (1992). Hierarchical Linear Models: Applications and Data
Analysis Methods. Newbury Park, CA: Sage Publications. Carrell, P. L. (1985). Facilitating ESL reading by teaching text structure. TESOL Quarterly, 19,
727-752. Carrell, P. (1991). Second language reading: Reading ability or language proficiency. Applied
Linguistics, 12(2), 159-179. Chisman, F., Wrigley, H., & Ewen. (1993.) Sparks of Excellence: Program Realities and
Promising Practices in Adult ESL. Washington, DC: The Southport Institute for Policy Analysis.
Comings, J., Cuban, S., Bos, H. & Porter, K. (2003). “As Long As It Takes:” Responding to the
Challenges of Adult Student Persistence in Library Literacy Programs. New York: MDRC.
Condelli, L., Wrigley. H., Yoon. K., Cronen, S. & Seburn, M. (2003). What Works Study for
Adult ESL Literacy Students: Final Report. Washington DC: U.S. Department of Education (available from the American Institutes for Research).
Condelli, L. & Wrigley, H.S. (2004). Identifying Promising Literacy Interventions for Adult ESL
Literacy Students: A Review of the Literature. Washington DC: U.S. Department of Education (available from the American Institutes for Research).
Fix, M., Passel, J. & Sucher, K. (2003). Trends in naturalization (Brief No. 3, Immigrant
Families and Workers: Facts and Perspectives). Washington, DC: Urban Institute. Greeno, J. G., Collins, A. M., & Resnick, L. B. (1996). Cognition and learning. In D. C. Berliner
& R. C. Calfee (Eds.), Handbook of Educational Psychology (pp.15-46). New York: Macmillan.
26
Purcell-Gates, V., Degener, S., Jacobson, E. & Soler, M.. (2002). Impact of Authentic Literacy
Instruction on Adult Literacy Practices. Reading Research Quarterly, 37(1), 70-92. Quigley, Allan (1996). Rethinking Literacy Education: The Critical Need for Practice-Based
Change. New York: Jossey-Bass. Ramirez, J., Yuen, S., & Ramey. D. (1991). Executive summary: Longitudinal study of
structured English immersion strategy, early-exit, and late-exit transitional bilingual education programs for language-minority children. San Mateo, CA: Aguirre International.
Reder, S. & Strawn, C. (2006). Self-Study: Broadening the concepts of participation and
program support. Focus on Basics, 8(C), 6-10. Slavin, R.E. & Cheung, A. (2003). Effective reading programs for English language learners: A
best-evidence synthesis. Baltimore, MD: Johns Hopkins University, Center for Research on the Education of Students Placed at Risk.
Thomas, W.P., & Collier, V.P. (2002). A national study of school effectiveness for language
minority students' long-term academic achievement. Santa Cruz, CA: Center for Research on Education, Diversity and Excellence, University of California-Santa Cruz.
Van de Craats, I., Kurvers, J. & Young-Scholten, M. (2006). Research on Low-Educated Second
Language and Literacy Acquisition. In Van de Craats, I., Kurvers, J. & Young-Scholten, M., (Eds.), Low-Educated Second Language and Literacy Acquisition: Proceedings of the Inaugural Symposium – Tilburg 05. Utrecht, The Netherlands: LOT.
Wrigley, H. (2001). Principles and Indicators to Assist in the Development and Evaluation of
Technology-based Materials: A Design Framework for Multimedia Development in Adult Literacy. Retrieved from http://www.cyberstep.org/principles.html.
Wrigley, H. & Guth, G. (1992). Bringing Literacy to Life. San Mateo, CA: Aguirre
International. Young-Scholten, M. & Strom, N. (2006). First time L2 readers: Is there a critical period? In Van
de Craats, I., Kurvers, J. & Young-Scholten, M., (Eds.), Low-Educated Second Language and Literacy Acquisition: Proceedings of the Inaugural Symposium – Tilburg 05. Utrecht, The Netherlands: LOT.
27
Table 1: Education in Home Country, By Language Background
Student Language Background
Number of Students
Mean Years of Education in Home Country
SD of Mean Years
Percent of Students with No Formal Education
All What Works Participants
490 3.1 2.8 33.1
Spanish – Mexican
285 4.0 2.7 17.9
Spanish – non-Mexican
43 3.8 2.2 11.6
Hmong 38 0.3 0.9 81.6 Somali 47 1.7 2.9 66.0 All others* 77 1.8 2.5 57.1
Note: Prior education data were missing from five students in the sample of 495. *More than 30 other languages are included in this group.
28
Table 2: Growth in Basic Reading Skills (WJBRSC): Predictors of Initial Status, Linear and Quadratic Growth Rates Parameter Predictor Coefficient se df t-ratio p-value
Intercept (Base Level) 428.78 6.94 27 61.77 <.001 ***
Student Variables Age 0.15 0.07 855 2.01 .04 * Formal Schooling at Home Country 2.76 0.39 855 7.14 <.001 *** Employed 0.71 2.17 855 0.33 .74 ns Hispanic Student 13.97 3.94 855 3.54 .00 *** Hmong Student -2.12 5.00 855 -0.42 .67 ns Somali Student 7.16 3.56 855 2.01 .04 * Basic Oral English Skills (BEST) 0.49 0.06 855 8.68 <.001 *** Attendance Variables Attendance Rate 0.01 0.07 855 0.15 .88 ns Total Attendance Time (in hours) 0.01 0.02 855 0.92 .36 ns Teacher Variables Hispanic Teacher 15.41 7.24 27 2.13 .04 * Class Variables Length of Class (in hours per week) 0.22 0.75 27 0.29 .78 ns Mandatory Class -1.30 5.29 27 -0.25 .81 ns Day Class 4.67 5.78 27 0.81 .43 ns Mixed Class 6.56 4.60 27 1.42 .17 ns
Instructional Variables Use of Native Language 11.13 14.62 27 0.76 .45 ns Practice Strategy 12.72 6.46 27 1.97 .06 $ Connection Strategy -0.40 4.79 27 -0.08 .93 ns
Initi
al S
tatu
s
Emphasis on Basic Literacy Skills 2.57 20.69 27 0.12 .90 ns Intercept (Base Level) -0.29 0.51 855 -0.58 .56 ns Student Variables Age -0.03 0.01 855 -2.52 .01 ** Formal Schooling in Home Country 0.32 0.15 855 2.17 .03 * Employed 0.39 0.30 855 1.32 .19 ns Basic Oral English Skills (BEST) 0.04 0.02 855 1.78 .08 $
Attendance Variables Attendance Rate 0.00 0.01 855 -0.37 .71 ns Total Attendance Time (in hours) 0.00 0.00 855 0.63 .53 ns
Teacher Variable Hispanic Teacher 0.09 0.46 855 0.20 .84 ns Class Variable Length of Class (in hours per week) -0.14 0.05 855 -2.58 .01 **
Instructional Variables Use of Native Language -0.83 0.99 855 -0.84 .40 Ns Varied Practice Strategy -0.42 0.41 855 -1.03 .30 Ns Connection to Outside Strategy 0.62 0.32 855 1.95 .05 *
Line
ar G
row
th R
ates
Emphasis on Basic Literacy Skills -1.92 1.45 855 -1.32 .19 Ns
29
Table 2 (continued): Growth in Basic Reading Skills (WJBRSC): Predictors of Initial Status, Linear and Quadratic Growth Rates Parameter Predictor Coefficient se df t-ratio p-value
Intercept (Base Level) 0.07 0.05 855 1.60 .11 Ns Formal Schooling at Home Country -0.05 0.02 855 -2.98 .01 **
Qua
drat
ic
Gro
wth
R
ates
Basic Oral English Skills (BEST) 0.00 0.00 855 -1.50 .13 Ns Note 1: se = standard error; df = degrees of freedom; ns = non-significant finding. $ p<.10; * p<.05; ** p<.01; *** p<.001 Note 2: The intercept is the estimate of the outcome measure when all the variables in the model take on a base or reference value. In other words, age=mean of 40.5, formal schooling=mean of 3.13 years, and so forth. Variance Decomposition of Growth in Basic Reading Skills
Variance Component Estimate se Z-value p
Between-class variance in initial status 386.55 104.14 3.71 0.00 *** Covariation in class-level initial status & linear growth -6.48 4.48 -1.45 0.15 ns Between-class variance in linear change 0.56 0.31 1.82 0.03 * Between-student variance in initial status 350.31 35.02 10.00 <.0001 *** Covariation in student-level initial status & linear growth -2.44 3.73 -0.65 0.51 ns Between-student variance in linear change 0.71 0.58 1.24 0.11 ns Residual 169.66 13.56 12.51 <.0001 *** Total 907.79
30
Table 3: Growth in Reading Comprehension (WJRCC): Predictors of Initial Status, Linear and Quadratic Growth Rates
Parameter Predictor Coefficient se df t-ratio p-value Intercept (Base Level) 430.83 3.54 27 121.62 <.001 ***
Student Variables Age -0.02 0.05 951 -0.34 .73 ns Formal Schooling in Home Country 0.59 0.24 951 2.49 .01 ** Employed -0.62 1.32 951 -0.47 .64 ns Hispanic Student -5.75 2.39 951 -2.40 .02 * Hmong Student -9.25 3.04 951 -3.05 .01 ** Somali Student -1.45 2.29 951 -0.63 .53 ns Basic Reading Skills (BRSC) 0.35 0.02 951 15.71 <.001 ***
Attendance Variables Attendance Rate -0.02 0.04 951 -0.49 .62 ns Total Attendance Time (in hours) -0.02 0.01 951 -2.19 .03 *
Teacher Variable Hispanic Teacher -2.02 3.51 27 -0.58 .57 ns
Class Variables Length of Class (in hours per week) -0.57 0.41 27 -1.39 .17 ns Mandatory Class -2.36 2.73 27 -0.87 .39 ns
Initi
al S
tatu
s
Day Class 2.63 2.89 27 0.91 .37 ns Mixed Class 2.83 2.36 27 1.20 .24 ns
Instructional Variables Use of Native Language -1.71 6.90 27 -0.25 .81 ns Varied Practice Strategy -3.59 3.15 27 -1.14 .26 ns Connection to Outside Strategy -1.76 2.25 27 -0.78 .44 ns
Emphasis on Comprehension 35.46 11.62 27 3.05 .01 ** Intercept (Base Rate) 0.80 0.31 951 2.57 .01 **
Student Variables Age -0.01 0.01 951 -1.54 .12 ns Formal Schooling in Home Country 0.03 0.04 951 0.88 .38 ns Employed 0.08 0.19 951 0.44 .66 ns
Line
ar G
row
th R
ates
Basic Reading Skills (BRSC) -0.02 0.01 951 -2.00 .05 *
31
Table 3 (continued): Growth in Reading Comprehension (WJRCC): Predictors of Initial Status, Linear and Quadratic Growth Rates
Attendance Variables Attendance Rate 0.02 0.01 951 2.85 .01 ** Total Attendance Time (in Hours) 0.00 0.00 951 -0.62 .53 ns
Teacher Variable Hispanic Teacher -0.41 0.33 951 -1.24 .21 Ns
Class Variable Length of Class (in hours per week) 0.07 0.04 951 1.97 .05 *
Instructional Variables Use of Native Language 3.44 1.07 951 3.22 .001 ** Varied Practice Strategy 0.16 0.30 951 0.52 .60 ns Connection to Outside Strategy -0.01 0.22 951 -0.05 .96 ns
Emphasis on Comprehension -1.27 1.15 951 -1.10 .27 ns Intercept (Base Rate) -0.02 0.03 951 -0.86 .39 ns Basic Reading Skills (BRSC) 0.002 0.00 951 2.71 .01 **
Qua
drat
ic
Gro
wth
R
ates
Use of Native Language -0.13 0.10 951 -1.34 .18 ns
Note 1: se = standard error; df = degrees of freedom; ns = non-significant finding. $ p<.10; * p<.05; ** p<.01; *** p<.001 Note 2: The intercept is the estimate of the outcome measure when all the variables in the model take on a base or reference value. In other words, age=mean of 40.5, formal schooling=mean of 3.13 years, and so forth.
Variance Decomposition of Growth in Reading Comprehension
Variance Component Estimate se Z-value p
Between-class variance in initial status 120.27 33.66 3.57 0.00 *** Covariation in class-level initial status & linear growth -1.02 1.89 -0.54 0.59 ns Between-class variance in linear change 0.48 0.21 2.34 0.01 ** Between-student variance in initial status 174.20 15.89 10.96 <.0001 *** Covariation in student-level initial status & linear growth 0.59 1.66 0.36 0.72 ns Between-student variance in linear change 0.54 0.25 2.12 0.02 * Residual 61.60 5.11 12.06 <.0001 *** Total 357.09
32
Table 4: Growth in Oral English Skills (BEST): Predictors of Initial Status, Linear and Quadratic Growth Rates
Parameter Predictor Coefficient se df t-ratio p-value Intercept (Base Level) 30.37 4.92 26 6.17 <.001 ***
Student Variables Age -0.09 0.06 832 -1.67 .09 $ Formal Schooling in Home Country -0.37 0.29 832 -1.28 .20 ns Employed -0.42 1.59 832 -0.26 .79 ns Hispanic Student -5.09 3.04 832 -1.67 .09 $ Hmong Student -3.83 3.84 832 -1.00 .32 ns Somali Student -1.93 2.75 832 -0.70 .48 ns Basic Reading Skills (BRSC) 0.15 0.02 832 6.41 <.001 ***
Attendance Variables Attendance Rate 0.04 0.05 832 0.87 .39 ns Total Attendance Time (in hours) -0.05 0.01 832 -4.26 <.001 ***
Teacher Variable Hispanic Teacher -7.81 4.70 26 -1.66 .11 ns
Class Variables Length of Class (in hours per week) -0.12 0.51 26 -0.24 .81 ns Mandatory Class 3.57 3.87 26 0.92 .36 ns Day Class 3.50 4.12 26 0.85 .40 ns Mixed Class -4.13 3.31 26 -1.25 .22 ns
Instructional Variables Use of Native Language -6.19 9.82 26 -0.63 .53 ns Varied Practice Strategy -0.18 4.28 26 -0.04 .97 ns Connection to Outside Strategy -3.98 3.11 26 -1.28 .21 ns
Initi
al S
tatu
s
Emphasis on Oral Communication -63.20 16.40 26 -3.85 .001 *** Intercept (Base Level) 1.92 0.27 832 7.21 <.001 ***
Student Variables Age -0.02 0.01 832 -2.59 .01 ** Formal Schooling in Home Country 0.04 0.04 832 1.00 .32 ns Employed 0.01 0.18 832 0.06 .96 ns Basic Reading Skills (BSRC) 0.01 0.00 832 2.11 .04 * Attendance Variables Attendance Rate 0.01 0.01 832 2.24 .02 * Total Attendance Time (in Hours) 0.00 0.00 832 0.91 .36 ns Teacher Variable Hispanic Teacher -0.21 0.29 832 -0.72 .47 ns Class Variable
Line
ar G
row
th R
ates
Length of Class (in hours per week) 0.21 0.06 832 3.34 .001 ***
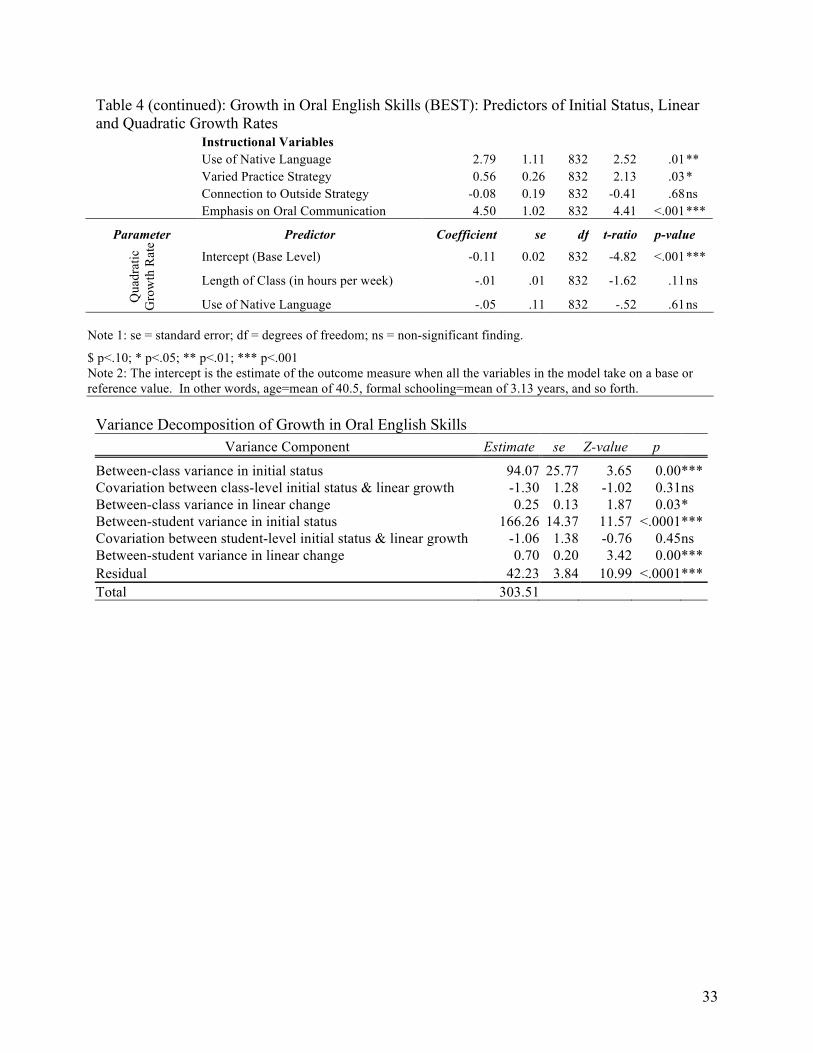
33
Table 4 (continued): Growth in Oral English Skills (BEST): Predictors of Initial Status, Linear and Quadratic Growth Rates
Instructional Variables Use of Native Language 2.79 1.11 832 2.52 .01 ** Varied Practice Strategy 0.56 0.26 832 2.13 .03 * Connection to Outside Strategy -0.08 0.19 832 -0.41 .68 ns
Emphasis on Oral Communication 4.50 1.02 832 4.41 <.001 ***
Parameter Predictor Coefficient se df t-ratio p-value
Intercept (Base Level) -0.11 0.02 832 -4.82 <.001 ***
Length of Class (in hours per week) -.01 .01 832 -1.62 .11 ns
Qua
drat
ic
Gro
wth
Rat
e
Use of Native Language -.05 .11 832 -.52 .61 ns
Note 1: se = standard error; df = degrees of freedom; ns = non-significant finding.
$ p<.10; * p<.05; ** p<.01; *** p<.001 Note 2: The intercept is the estimate of the outcome measure when all the variables in the model take on a base or reference value. In other words, age=mean of 40.5, formal schooling=mean of 3.13 years, and so forth.
Variance Decomposition of Growth in Oral English Skills
Variance Component Estimate se Z-value p
Between-class variance in initial status 94.07 25.77 3.65 0.00 *** Covariation between class-level initial status & linear growth -1.30 1.28 -1.02 0.31 ns Between-class variance in linear change 0.25 0.13 1.87 0.03 * Between-student variance in initial status 166.26 14.37 11.57 <.0001 *** Covariation between student-level initial status & linear growth -1.06 1.38 -0.76 0.45 ns Between-student variance in linear change 0.70 0.20 3.42 0.00 *** Residual 42.23 3.84 10.99 <.0001 *** Total 303.51
34
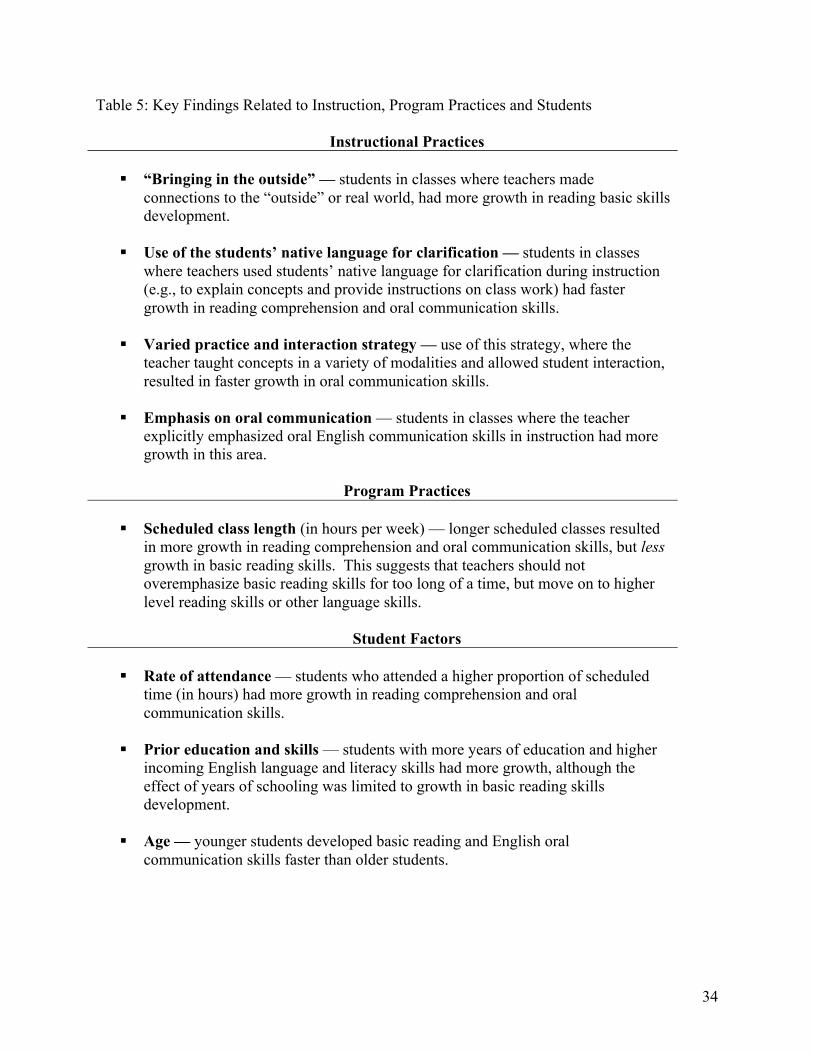
Table 5: Key Findings Related to Instruction, Program Practices and Students
Instructional Practices
“Bringing in the outside” — students in classes where teachers made connections to the “outside” or real world, had more growth in reading basic skills development.
Use of the students’ native language for clarification — students in classes
where teachers used students’ native language for clarification during instruction (e.g., to explain concepts and provide instructions on class work) had faster growth in reading comprehension and oral communication skills.
Varied practice and interaction strategy — use of this strategy, where the
teacher taught concepts in a variety of modalities and allowed student interaction, resulted in faster growth in oral communication skills.
Emphasis on oral communication — students in classes where the teacher
explicitly emphasized oral English communication skills in instruction had more growth in this area.
Program Practices
Scheduled class length (in hours per week) — longer scheduled classes resulted
in more growth in reading comprehension and oral communication skills, but less growth in basic reading skills. This suggests that teachers should not overemphasize basic reading skills for too long of a time, but move on to higher level reading skills or other language skills.
Student Factors
Rate of attendance — students who attended a higher proportion of scheduled
time (in hours) had more growth in reading comprehension and oral communication skills.
Prior education and skills — students with more years of education and higher
incoming English language and literacy skills had more growth, although the effect of years of schooling was limited to growth in basic reading skills development.
Age — younger students developed basic reading and English oral
communication skills faster than older students.