Embed Size (px)
Citation preview

January 2010
Condition and CriticalityReport

A i
Contents
Section 1 Introduction 1.1 Project Background .................................................................................................. 1-1 1.2 Project Overview ...................................................................................................... 1-1 1.3 Collection System Infrastructure ............................................................................ 1-2 1.4 Organization .............................................................................................................. 1-4
Section 2 System Prioritization Based on Existing Information 2.1 Overview of Prioritization Process ........................................................................ 2-1 2.2 Identify Condition and Criticality Factors ............................................................ 2-2 2.3 Collect Data ............................................................................................................... 2-2 2.4 Assign Levels to Condition and Criticality Factors ............................................. 2-5 2.4.1 Criticality Factors ...................................................................................... 2-5
2.4.1.1 Quantity of Flow Conveyed .................................................... 2-5 2.4.1.2 Transportation Impact .............................................................. 2-8 2.4.1.3 Environmental Impact ............................................................ 2-10 2.4.1.4 Public Health Impact .............................................................. 2-10 2.4.1.5 Large User Impact ................................................................... 2-12 2.4.2 Condition Factors .................................................................................... 2-15 2.4.2.1 Structural Condition ............................................................... 2-15 2.4.2.2 Maintenance Frequency ......................................................... 2-19 2.4.2.3 Inflow and Infiltration ............................................................ 2-22 2.4.2.4 Areas of Concern ..................................................................... 2-26
2.5 Calculating a Condition and Criticality Rating .................................................. 2-30 2.5.1 Relative Importance Values and Override Factors ............................. 2-31 2.5.2 Overall condition and Criticality Rating .............................................. 2-32 2.6 Prioritizing Based on Criticality and Condition Ratings .................................. 2-32 2.6.1 System Prioritization ............................................................................... 2-36
Section 3 Condition Assessment 3.1 Structural Condition ................................................................................................. 3-1
3.1.1 Gravity Sewer Investigation Techniques ............................................... 3-1 3.1.2 Force Main Investigation Techniques ..................................................... 3-3 3.1.3 Pump Station Investigation ...................................................................... 3-6 3.1.4 Developing Structural Condition Ratings ............................................. 3-7
3.2 Infiltration/Inflow Condition ................................................................................. 3-8 3.2.1 I/I Investigation Techniques ................................................................... 3-8 3.3 Capacity Considerations .......................................................................................... 3-9 3.3.1 Capacity Investigation Techniques ......................................................... 3-9
Section 4 Rehabilitation Strategy 4.1 Re-prioritizing Based on Capacity Considerations .............................................. 4-1

Table of Contents Sanitary Sewer Condition Assessment and Rehabilitation Program Plan
Condition and Criticality Report
A ii
4.2 Highest Priority Projects .......................................................................................... 4-2
4.2.1 Knights Creek Outfall ............................................................................... 4-2 4.2.2 Withlacoochee Outfall .............................................................................. 4-2 4.2.3 South Dukes Bay Outfall .......................................................................... 4-4 4.2.4 Mud Creek Outfall .................................................................................... 4-4 4.2.5 Ponderosa Collection System .................................................................. 4-4 4.2.6 Ponderosa and Big Country Club Lift Stations ..................................... 4-4 4.2.7 Lakeland Pump Station ............................................................................ 4-5
4.3 Next Priority Projects ............................................................................................... 4-5 4.4 Remaining Field Investigation Prioritization ....................................................... 4-7 4.5 Rehabilitation Techniques ....................................................................................... 4-9 4.5.1 Pipe Replacement ...................................................................................... 4-9 4.5.2 Pipe Lining ............................................................................................... 4-10 4.5.3 Evaluation and Design Criteria ............................................................. 4-12 4.5.3.1 Hydraulic Capacity .............................................................. 4-12 4.5.3.2 Structural Conditions .......................................................... 4-12 4.5.3.3 Surface Conditions ............................................................... 4-14 4.5.4 Service Lateral Rehabilitation ................................................................ 4-14 4.5.5 Manhole Rehabilitation .......................................................................... 4-14 4.5.5.1 Manhole Replacement ......................................................... 4-15 4.5.5.2 Alternative Manhole Rehabilitation Techniques ............. 4-15 4.5.5.3 Manhole Point Repairs ........................................................ 4-16 4.5.5.4 Acceptance Standards ......................................................... 4-18 4.6 Alternative Delivery Methods .............................................................................. 4-18 4.7 Management of Program ....................................................................................... 4-21 4.8 Documenting Results ............................................................................................. 4-21
Section 5 Capital Improvements Program 5.1 Condition Assessment High Priority Project Costs ............................................. 5-1 5.2 Capital Improvements Plan .................................................................................... 5-2 5.3 Summary .................................................................................................................... 5-8

List of Figures and Tables Sanitary Sewer Condition Assessment and Rehabilitation Program Plan
Condition and Criticality Report
A iii
Figures
Figure 1-1 System Map ...................................................................................................... 1-3 Figure 2-1 Condition and Criticality Factors and Their Applicability to Wastewater Collection System Assets .......................................................... 2-4 Figure 2-2 Quantity of Flow .............................................................................................. 2-7 Figure 2-3 Transportation Impact ..................................................................................... 2-9 Figure 2-4 Environmental Impact ................................................................................... 2-11 Figure 2-5 Public Health Impact Levels ......................................................................... 2-13 Figure 2-6 Larger User Impact ........................................................................................ 2-14 Figure 2-7 Structural Rating for Pump Stations ........................................................... 2-16 Figure 2-8 Pipe Material ................................................................................................... 2-18 Figure 2-9 Age Levels ....................................................................................................... 2-20 Figure 2-10 SSO Locations ................................................................................................. 2-21 Figure 2-11 SSO Levels ....................................................................................................... 2-23 Figure 2-12 Inflow & Infiltration Levels .......................................................................... 2-25 Figure 2-13 Areas of Concern Levels ............................................................................... 2-28 Figure 2-14 Condition Rating ............................................................................................ 2-33 Figure 2-15 Criticality Rating ............................................................................................ 2-34 Figure 2-16 Recommended Course of Action Based on Condition and Criticality Ratings ............................................................................................................. 2-35 Figure 2-17 System Prioritization ..................................................................................... 2-38 Figure 4-1 System Prioritization Projects Not Considering Capacity ......................... 4-3

List of Figures and Tables Sanitary Sewer Condition Assessment and Rehabilitation Program Plan
Immediate Action Plan
A iv
Tables
Table 2-1 Criticality and Condition Factors .................................................................. 2-3 Table 2-2 Quantity of Flow Levels for Gravity Sewer ................................................. 2-6 Table 2-3 Quantity of Flow Levels for Force Mains ..................................................... 2-6 Table 2-4 Quantity of Flow Levels for Pump Stations ................................................. 2-6 Table 2-5 Transportation Impact Levels ........................................................................ 2-8 Table 2-6 Environmental Impact Levels ...................................................................... 2-10 Table 2-7 Public Health Impact Levels ......................................................................... 2-12 Table 2-8 Large Water/Sewer Users ............................................................................ 2-12 Table 2-9 Large User Impacts Levels for Gravity Sewer ........................................... 2-12 Table 2-10 Structural Conditions Levels for Pump Stations ....................................... 2-15 Table 2-11 Pipe Material Levels for Gravity Sewer ...................................................... 2-17 Table 2-12 Pipe Age Factor Levels .................................................................................. 2-19 Table 2-13 SSO Levels for Gravity Sewer ...................................................................... 2-22 Table 2-14 SSO Levels for Pump Stations ...................................................................... 2-22 Table 2-15 Levels for Gravity Sewer I/I Factor ............................................................ 2-24 Table 2-16 Areas of Concern Levels for Gravity Sewer and Force Mains ................. 2-27 Table 2-17 Relative Importance of Criticality Factors .................................................. 2-31 Table 2-18 Relative Importance of Condition Factors .................................................. 2-32 Table 3-1 Summary of Force Main Investigation Techniques .................................... 3-4 Table 3-2 Example of Structural Condition Ratings ..................................................... 3-7 Table 4-1 Priority 3 Projects ............................................................................................. 4-7 Table 4-2 Lower Priority Projects .................................................................................... 4-8 Table 4-3 Required Point Repairs for Various Rehabilitation Techniques ............. 4-13 Table 4-4 Sewer System Rehabilitation Program Management Tasks and Responsibilities ............................................................................................... 4-22 Table 5-1 Summary of Estimated Condition Assessment Costs for Priority 1 & 2
Projects ............................................................................................................... 5-3 Table 5-2 Capital Improvement Plans Implementation Schedule ............................. 5-4 Table 5-3 Implementation Schedule for Phase 1 Projects ............................................ 5-5

A 1-1
Section 1 Introduction 1.1 Project Background The City of Valdosta (City) initiated a comprehensive evaluation of its wastewater collection system with the goals of reducing inflow and infiltration (I/I), planning for future development, and developing an on-going rehabilitation strategy. This comprehensive evaluation consisted of four main tasks:
Sanitary Sewer Modeling and Capacity Evaluation;
Sanitary Sewer System Assessment and Rehabilitation Program;
Field Condition Assessment; and
Rehabilitation Implementation Program.
Camp Dresser & McKee Inc. (CDM) is assisting the City with the Sanitary Sewer Assessment Program Plan and the Sewer System Modeling and Capacity Evaluation. It is anticipated that the Field Condition Assessment and Rehabilitation Implementation Program will begin once the Assessment Program and Capacity Evaluation are complete.
The results of these two evaluations were combined to create a single capital improvements program for the City that includes projects to improve capacity and condition of the sewer collection system. This report discusses the Sanitary Sewer Assessment and Rehabilitation Program.
1.2 Project Overview The purpose of the Sanitary Sewer Assessment and Rehabilitation Program Plan is to guide the City in devoting the appropriate level of resources to inspect, maintain, and rehabilitate priority areas of the system. Simultaneous investigation and rehabilitation of every pipe and pump station is cost-prohibitive for most utilities. A more appropriate use of finite resources is to focus immediate rehabilitation on higher priority areas of the system and to monitor areas that are lower priority. To accomplish this, a prioritization process was developed where all collection system components (gravity sewer, force mains, and pump stations) were evaluated based on both criticality (consequence of failure) and condition (probability of failure).
The result of the prioritization process is an identification of immediate rehabilitation needs in the City’s wastewater collection system and, also, development of a strategy for continuing future assessment and rehabilitation. The future rehabilitation strategy is one that should be updated regularly and that results in phased rehabilitation of all system components. The goal of the long-term rehabilitation strategy is to proactively

Section 1 Introduction
A 1-2
identify potential problem areas and correct the problems before they result in negative impacts to the community or environment.
This report details the first step of the Sanitary Sewer Assessment Program Plan, which is the prioritization process for the City’s wastewater collection system facilities. The report also provides a preliminary list of the highest priority areas recommended for immediate sanitary sewer evaluation survey (SSES) investigation. The facility prioritization will be combined with the results of the capacity analyses that are being conducted as part of the Sewer System Modeling and Capacity Evaluation. The end result will be a complete and cost-effective rehabilitation and capital improvements plan for the City’s wastewater collection system.
1.3 Collection System Infrastructure The City wastewater collection system consists of approximately 287 miles of gravity pipeline, 9 miles of force mains, and 16 pump stations. The collection system conveys flows to one of two water pollution control plants (WPCPs) maintained by the City. Wastewater from the eastern portion of the system is treated at the Mud Creek WPCP, and wastewater from the central and western portions of the system is treated at the Withlacoochee WPCP.
The sewer collection system assessment focused on evaluation of the City’s pump stations, gravity sewers, and force mains as described below. The general locations of the wastewater collection system facilities are shown on Figure 1-1. This data is based on GIS pipe and pump station layers provided by the City.
Mud Creek WPCP Collection System
Five pump stations (Airport, East Wind, Food Bank, Knight Mill, and Lakeland).
Approximately 76 miles of 4- through 30-inch diameter gravity sewers. The major gravity outfalls include:
o Knights Creek o Mud Creek o South Dukes Bay
Approximately 2 miles of 4- through 8-inch diameter force mains.
Withlacoochee WPCP Collection System
Eleven pump stations (Bemiss, Big Country Club, Boys Club, Highway 84, Highway 94, Hyde Park, Mack Drive, Ponderosa Drive, Rogers Street, Small Country Club, and South Forty).

75
75
84
221
84
Knights Creek
One-Mile Branch
West Dukes Bay Canal
Three-Mile BranchSouth Dukes Bay Canal
Knights CreekWithlac
oochee Rive
r
Browns Canal
Sugar Creek
Cherry CreekCherry Creek
Two-Mile Branch
Mud Creek
Mud Creek
Withlaco
ochee
River
Mud Creek
Hightower Creek
Central
Pl
US Highway 84 W
E Park Av
e
US Highway 41 S
S Patterson St
US Highway 84 E
E CentralAve
N Patterson St
N Valdosta Rd
Ashle
y St
N Ashley St
New Statenville Hwy
Griffin Ave
W CentralAve
Bemi
ss Rd
W Hill Ave
Lakeland Hwy
E HillAve
Madison Hwy
N StAugustine Rd
21
19
20
17
16
15
11
3
9
8
65
13
24
107
12
14
1
SmallCountryClub PS
Airport PS
KnightMill PS
Bemiss PS
Lakeland PS
FoodBank PS
BoysClub PS
HydePark PS
Big CountryClub PS
Hwy84 PS
PonderosaDrive PS
RogersStreet PS
Eastwind PS
Hwy94 PS
MackDrive PS
SouthForty PS
WithlacoocheeWPCP
Mud CreekWPCP
LegendPump StationForce Main
Gravity Sewer<15-inch=>15-inch
SewershedsWithlacoochee WPCPMud Creek WPCPTreatment FacilityCounty Bounds
WetlandsRiverMajor RoadsInterstatesFlow Monitor
Figure 1-1City of ValdostaSewer Collection SystemSystem Map
0 0.8 1.60.4Approximate scale in miles
75
Georgia
Florida HamiltonMadison
Jefferson
Echols
Lowndes
Brooks
LanierClinch
Colquitt Cook Berrien
Valdosta

Section 1 Introduction
A 1-4
Approximately 211 miles of 4- through 54-inch diameter gravity sewers. The major gravity outfalls include:
o One Mile Branch o Two Mile Branch o Three Mile Branch o Browns Canal
o Sugar Creek
o Withlacoochee
Approximately 7 miles of 4- through 10-inch diameter force mains.
For the purposes of this assessment, the smaller diameter gravity collector sewers were grouped into sewersheds. Evaluation on a sewershed basis is easier for both the collection of condition information and eventual planned rehabilitation. The sewershed areas are based on the locations of 20 temporary flow monitors installed as part of the Sewer System Modeling and Capacity Evaluation Task. Each sewershed includes the gravity sewers directly upstream that contribute flow to the monitor. The sewersheds developed for this assessment are shown on Figure 1-1.
1.4 Organization The following sections describe in more detail the steps and results of the prioritization process. The remainder of this report is organized as follows:
Section 2 – System Prioritization Based on Existing Information
Section 3 – Condition Assessment
Section 4 – Rehabilitation Strategy
Section 5 – Capital Improvements Program

A
SectioSysteInform This sectioprioritizati
2.1 OveOne way oimmediateis to rank t(probabilitand enviroinspection these assetand pump recommenrehabilitati
The priorit
Step 1 is
assess thsome mua sewer municipenvironm
Step 2 issystem a
Step 3 isthat pipecriticalit
Step 4 isassignedeach fac
Step 5 isaction an
on 2 m Priomationn describes ion process.
erview oof differentiae inspection othem in termy of failure)
onment and w and/or rehats provide th stations tha
nded for somion.
tization proc
s to identify he system. Tunicipalities system failu
palities mighmentally crit
s to collect thassessment,
s to assign des and pumpty.
s to assign a d by using thtor.
s to use the rnd future re
oritizatn in more deta
f Prioritating betweeor rehabilita
ms of their cr. Assets whowhose condabilitation. T
he most risk at receive a lo
me level of co
cess used for
the conditioThe CC factors might idenure as the moht identify gatical.
he data that existing dat
ifferent levep stations ca
CC rating fohe level assig
ratings to prhabilitation
tion B
ail the system
tization Pen pipes andation and thoiticality (or cose failure cr
dition is the pThis is basedfor negativeower critical
ontinued mo
r this project
on and criticars are uniqu
ntify water boost critical enameland or w
will be useda will be use
els to each faan be differe
or each pipegned to each
ioritize the s projects.
ased o
m assessmen
Process d pump statioose that shouconsequencereates a largpoorest will d on a risk me impacts asslity and cond
onitoring but
t consists of
ality (CC) faue to each coodies that convironmentawildlife rese
d to evaluateed in the eva
actor. The puntiated in te
e and pump h factor and
system and t
on Exis
nt steps (1 th
ons that should receive fe of failure)
ge impact on receive a hig
management sociated withdition ratingt no immedi
five steps ill
actors that wllection systould potential factor, wh
erves as bein
e each factoraluation.
urpose of asserms of their
station. The the relative
to determine
sting
hrough 5) of
ould receive future monitand conditio the commugher priority approach wh a failure. Pg are iate action or
lustrated bel
will be used ttem. For examally be affec
hile other ng the most
. For this ini
signing levelr condition o
ratings are importance
e immediate
2-1
the
toring on
unity y for
where Pipes
r
low.
to mple,
cted by
itial
ls is so or
of
e

A
2.2 Iden
sewer systecan be grou
Quantity
Transpo
Environ
Public H
Large W
The actual The conditare above gcondition otime. Therewas availafactors wergrouped in
Structur
Mainten
Inflow a
Areas of
Areas of Crelated to t
2.3 CollFor each ca
informatiocategories,
ntify Co
em. In generuped into fiv
y of Flow Co
ortation Impa
mental Impa
Health Impac
Water/Sewer
condition otion of pumpground and of the entire efore, for thible. If no conre used to esnto four main
ral Condition
nance;
and Infiltrati
f Concern.
oncern werethe capacity
lect Dataategory, fact
n becomes a the factors t
ndition CDM
revcon
to perral, the criticve categorie
onveyed;
act;
act;
ct; and
r User Impac
f many of thp stations is more easily collection syis assessmenndition assestimate the cn categories
n;
on Conditio
e added to th of the collec
a tors were use
initialdata
assesavailable andthat were m
and CritM facilitated viewed the Cndition and rform the incality factorss:
ct.
he City’s graeasier to det
y inspected. Iystem can bent, existing cssment data
condition of s:
on; and
he original action system
ed to measul system assea was used tossment proced the prioriti
measured, and
System Prioriti
ticality Fa workshopCity’s availa criticality (C
nitial assessms for each of
vity sewers termine thanInvestigatione cost prohibondition inf
a was availab each asset. T
analysis as mm.
ure the criticaessment, exio evaluate eaess should bies can be red the data th
ization Based o
Factors with City’s
able data to iCC) factors thment of the C the wastewa
and force mn pipes becan and inventbitive unlessformation wble, surrogatThe conditio
more data be
ality and consting informach factor. In
be updated wevised. Tablehat was used
Son Existing Info
staff and dentify the hat could be
City’s sanitarater compon
mains is unknuse the statitory of the cs performedas used whete condition
on factors can
came availa
ndition. For mation such an the future,
with new date 2-1 lists thd. Figure 2-1
Section 2 ormation
2-2
e used ry nents
nown. ions urrent over en it n be
ble
this as GIS , the ta as e CC
1

Section 2 System Prioritization Based on Existing Information
A 2-3
shows the factors that were evaluated for gravity sewer, force mains, and pump stations.
Table 2-1 Criticality and Condition Factors
Criticality Category Criticality Factor
Quantity of Flow Conveyed Pipe diameter1 Firm capacity of pump station2
Transportation Impact Proximity to major roadways or railways1 Planned roadway improvement projects2
Environmental Impact Distance to wetlands and streams1 Public Health Impact Population density3
Large User Impact Distance downstream of major water user4
Condition Category Condition Factor
Structural Pipe material 2 Age 2, 5 Pump station assessment6
Maintenance Number of sanitary sewer overflows (SSOs) 7
Inflow and Infiltration Documented inflow/infiltration (I/I) concerns 8, 1
Areas of Concern Areas of concern as discussed in Section 2.3.2 2
1 GIS data used to assign levels to the factor. 2 Input from City staff used to assign levels to the factor. 3 Census data used to assign levels to the factor 4 Water and sewer consumption records used to assign levels to the factor. 5 As-built data used to assign levels to the factor. 6 Pump station assessment is from conversations with City staff and site visits performed by CDM in December 2007. 7 Records of SSOs used to assign levels to the factor. 8 Analysis of temporary flow monitoring data used to assign levels to factor.

CriticalityFactors
ConditionFactors
Pump StationForce MainGravity Sewer
Quantity of Flow Conveyed
Transportation/Urban Impact
Environmental Impact
Public health Impact
Large Water/Sewer User Impact
Maintenance Frequency
Pipe material
Age
Pump station assessment
SSOs
Inflow and Infiltration Concern
Areas of Concern
I/I
Structural
Figure 2-1: Condition and Criticality Factors and TheirApplicability to Wastewater Collection System Assets
A
2.4 Assi
most criticastation, eaceach force
The level aincreases. Fwastewatediameter pinch interccriticality fsame factofactor.
2.4.1 CriPipe or pumenvironmepurpose ofof their consome levelpipes and passessmentterms of thfrequency
The followassigned bdevelopmepopulationevaluated t
2.4.1.1 QuThe quantiforce maindiameters Similarly, pthan statiocapability wthe pipe orwere assign
ign Leve
al or the pooch pipe segmmain.
assigned incrFor example
er being releapipe has a higeptor would
factor, and thr. The follow
iticality Famp station f
ent, the publf the rankingnsequence o of monitoripump statiot, and rehab
heir transporof inspection
wing paragraased on the ent causes a n density or to reflect tho
uantity of Fity of flow co
ns and the caconvey a larpump stations with a lowwith one pur pump statined for the q
els to CoThe p
dico
factoorest conditiment (from u
reases as thee, a break in ased than a bgher critical
d be assignedhe 8-inch grawing section
actors failure has anlic, and the Cg system is tof failure. Alling, rehabilitons with an abilitation. Forrtation, envirn, maintenan
aphs describe existing City change in thconstructionose changes.
Flow Conveonveyed wa
apacity of therger quantityns with highwer capacity
ump out of seon capacity quantity of f
ondition purpose of afferentiate p
onsequences or is assignedion. The leveupstream ma
e consequenc a 24-inch grbreak in an 8ity in terms d a higher leavity pipe w
ns discuss ho
n impact on City repair cro differential pipes and ptation, or imappropriate r example, pronmental, once, or rehab
e the criticaly infrastructhe criticalityn of a new m.
eyed as estimated e pump statiy of wastewaher firm capy. Firm capaervice. The l increases. Tflow criticali
System Prioriti
and Criassigning levpipes and pu and probabd a level fromels are applieanhole to do
ce of failure ravity interce8-inch collec of the amouevel for the q
would be assow levels we
transportatirews, no ma
ate the pipespump station
mmediate actlevel of mai
pipes identifior public impbilitation.
lity factors anture and sew of certain ar
major highwa
based on thions. Pipes aater than pipacity are cap
acity is calcullevel assigne
Tables 2-2, 2-ity factor. Th
ization Based o
iticality Fvels to each ump stationsbility of theirm 1 to 5. Leved to each in
ownstream m
or probabilieptor can resctor pipe. Thunt of flow cquantity of figned a lowe
ere assigned
ion, businesatter where is and pump ns in the sys
tion. The goantenance, coied as beingpact would
nd levels. Lewer system. Ireas, such asay, the levels
he size of theand force mapes of smallepable of convlated as the
ed increases -3, and 2-4 shhe percent of
Son Existing Info
Factors CC factor is
s in terms of r failure. Eacvel 5 indicatendividual pumanhole), an
ity of failuresult in more
herefore, the onveyed. Th
flow conveyeer level for t for each CC
ss, the it occurs. Thestations in te
stem will recal is to matchondition
g very criticareceive a hig
evels were If future s a shift in s should be r
e gravity pipains with larer diametersveying morestation’s pu as the diamhow how levf the total len
Section 2 ormation
2-5
to the
ch CC es the ump nd
e larger he 24-ed the
C
e erms ceive h the
l in gher
re-
es or rger s. e flow mping
meter of vels ngth

Section 2 System Prioritization Based on Existing Information
A 2-6
of pipe in the collection system or the percent of pump stations that falls within each level is also given. The pipe diameter was determined using GIS information provided by the City. The pump station capacity was based on information provided by the City.
Table 2-2 Quantity of Flow Levels for Gravity Sewer
Pipe Diameter Level % Total Pipe Length
<8 inch 1 1 8 inch 3 80 10 to 24 inch 4 17 >24 inch 5 2 Diameter Unknown 3.1 0.3
Table 2-3 Quantity of Flow Levels for Force Mains
Pipe Diameter Level % Total Pipe Length
<=4 inch 2 48 6 to 8 inch 3 43 10 inch 4 9
Table 2-4 Quantity of Flow Levels for Pump Stations
Pump Station Capacity Level Number of Pump Stations <200 gpm 3 5 201 to 500 gpm 4 7 >500 gpm 5 1 Capacity Unknown 3.1 3 Figure 2-2 shows the levels assigned to each pipe and pump station for the quantity of flow factor. The assets identified as being more critical in terms of the quantity of flow they conveyed were the large-diameter gravity sewer outfalls and force mains and the larger pump stations. In particular, the gravity sewer identified as a Level 5 included the Withlacoochee outfall and portions of the Sugar Creek and One Mile branch outfall. Lakeland pump station also received a Level 5 rating for quantity of flow conveyed.

75
75
84
221
84
Central
Pl
US Highway 84 W
E Park Ave
US Highway 41 S
S Patterson St
US Highway 84 E
E CentralAve
N Patterson St
N Valdosta Rd
Ashle
y St
N Ashley St
New Statenville Hwy
Griffin Ave
W CentralAve
Bemi
ss Rd
W Hill Ave
Lakeland Hwy
E Hill Ave
Madison Hwy
N St Augustine Rd
SmallCountryClub PS
Airport PS
KnightMill PS
Bemiss PS
Lakeland PS
FoodBank PS
BoysClub PS
HydePark PS
Big CountryClub PS
Hwy84 PS
PonderosaDrive PS
RogersStreet PS
Eastwind PS
Hwy94 PS
MackDrive PS
SouthForty PS
WithlacoocheeWPCP
Mud CreekWPCP
LegendPump Station
Level 1Level 2Level 3Level 4Level 5Unknown
Force MainLevel 1Level 2Level 3Level 4Level 5Unknown
Gravity SewerLevel 1Level 2Level 3Level 4Level 5Unknown
Major RoadsInterstatesValdosta City LimitCounty Bounds
Figure 2-2City of ValdostaSewer Collection SystemQuantity of Flow
0 1 20.5Approximate scale in miles
75
Georgia
Florida HamiltonMadison
Jefferson
Echols
Lowndes
Brooks
LanierClinch
Colquitt Cook Berrien
Valdosta
Section 2 System Prioritization Based on Existing Information
A 2-8
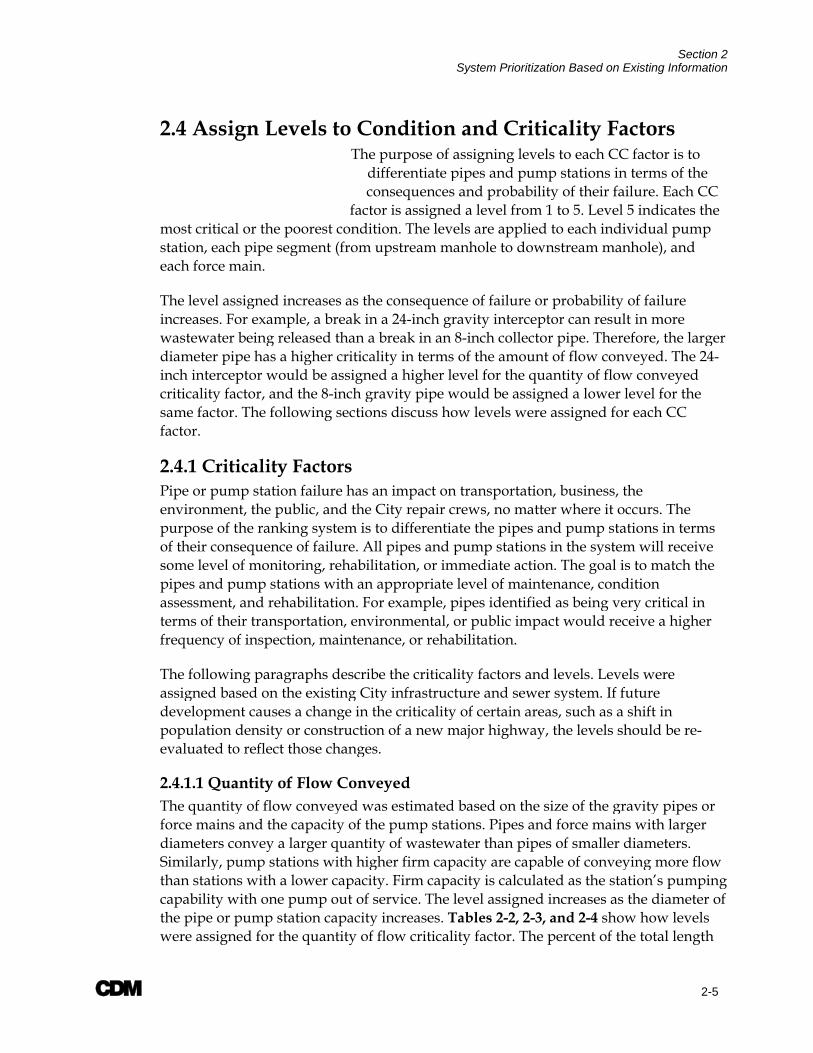
2.4.1.2 Transportation Impact The impact to traffic flow, if a pipe or pump station fails, was estimated based on the type of transportation that is nearby the pipe or pump station. It is assumed that if the pipe fails under a major thoroughfare or railroad, the impact to traffic flow would be greater than if the pipe failed in an easement or under a less-traveled local street. A failure under a railroad track would also have a large impact on railway transportation, assuming the railroad would have to be closed while repairs were being made. In addition, a pipe or pump station was considered critical if it is within 100 feet of a planned roadway project. Assets near planned roadway projects were considered critical, because they should be evaluated or replaced, if needed, prior to the planned improvements, to minimize the disruption of newly replaced road surfaces. Table 2-5 shows how levels were assigned to each gravity sewer, force main, and pump station for the transportation impact criticality factor. The road type and railroad locations are based on GIS data from the Georgia Department of Transportation (DOT) obtained from the State GIS data clearinghouse.
Table 2-5 Transportation Impact Levels
Transportation Impact Level % Total Pipe
Length (Gravity Sewer)
% Total Pipe Length
(Force Main) Number of
Pump Stations
>25 ft from Local Rd 1 29 2 10 <25 ft from Local Rd 3 57 45 2 <100 ft from Major Rd 4 11 34 3 Crosses Railroad or <100 ft from Roadway Project 5 3 19 1
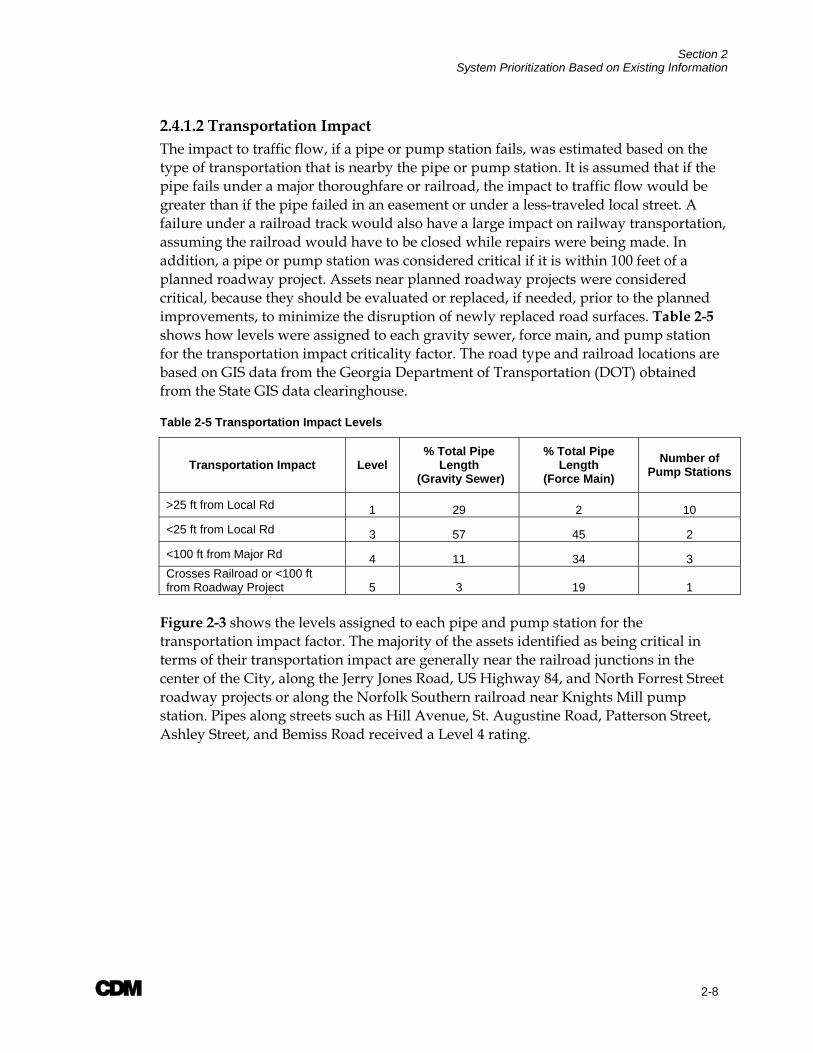
Figure 2-3 shows the levels assigned to each pipe and pump station for the transportation impact factor. The majority of the assets identified as being critical in terms of their transportation impact are generally near the railroad junctions in the center of the City, along the Jerry Jones Road, US Highway 84, and North Forrest Street roadway projects or along the Norfolk Southern railroad near Knights Mill pump station. Pipes along streets such as Hill Avenue, St. Augustine Road, Patterson Street, Ashley Street, and Bemiss Road received a Level 4 rating.
75
75
84
221
84
Central
Pl
US Highway 84 W
E Park Ave
US Highway 41 S
S Patterson St
US Highway 84 E
E CentralAve
N Patterson St
N Valdosta Rd
Ashle
y St
N Ashley St
New Statenville Hwy
Griffin Ave
W CentralAve
Bemi
ss Rd
W Hill Ave
Lakeland Hwy
E Hill Ave
Madison Hwy
N St Augustine Rd
SmallCountryClub PS
Airport PS
KnightMill PS
Bemiss PS
Lakeland PS
FoodBank PS
BoysClub PS
HydePark PS
Big CountryClub PS
Hwy84 PS
PonderosaDrive PS
RogersStreet PS
Eastwind PS
Hwy94 PS
MackDrive PS
SouthForty PS
WithlacoocheeWPCP
Mud CreekWPCP
LegendPump Station
Level 1Level 2Level 3Level 4Level 5Unknown
Force MainLevel 1Level 2Level 3Level 4Level 5Unknown
Gravity SewerLevel 1Level 2Level 3Level 4Level 5Unknown
Major RoadsInterstatesValdosta City LimitCounty BoundsRailroadScheduled Road Projects
Figure 2-3City of ValdostaSewer Collection SystemTransportation Impact
0 1 20.5Approximate scale in miles
75
Georgia
Florida HamiltonMadison
Jefferson
Echols
Lowndes
Brooks
LanierClinch
Colquitt Cook Berrien
Valdosta

Section 2 System Prioritization Based on Existing Information
A 2-10
2.4.1.3 Environmental Impact Any wastewater spill has a negative impact on the environment. It is expected that City crews would have a better chance of locating and containing a wastewater spill that occurs on land, as compared to a spill that occurs in the water or reaches surface water. Therefore, the environmental impact was estimated based on the distance of the pipe from a stream or wetland. A higher level was assigned as the distance to any stream or wetland decreases. Table 2-6 shows how levels were assigned to each pipe or pump station for the environmental impact criticality factor. The location of the streams and wetlands was based on GIS data from the U.S. Fish and Wildlife Service National Wetlands Inventory obtained from the State GIS data clearinghouse.
Table 2-6 Environmental Impact Levels
Distance to Wetland/Stream Level
% Total Pipe Length
(Gravity Sewer)
% Total Pipe Length
(Force Main)
Number of Pump Stations
(Pump Station)
> 1,500 feet 1 13 0 0
701 to 1,500 feet 2 28 0 1
401 to 700 feet 3 18 2 0
150 to 400 feet 4 20 16 6
<150 feet 5 21 82 9
Figure 2-4 shows the levels assigned to each pipe and pump station for the environmental impact factor. In general, the level assigned to each asset increases as the distance from the water decreases. Most of the City’s gravity outfalls run alongside a creek or river. In addition, the majority of the City’s pump stations and force mains are within 150 feet of a stream or wetland and, therefore, were assigned a Level 5 rating.
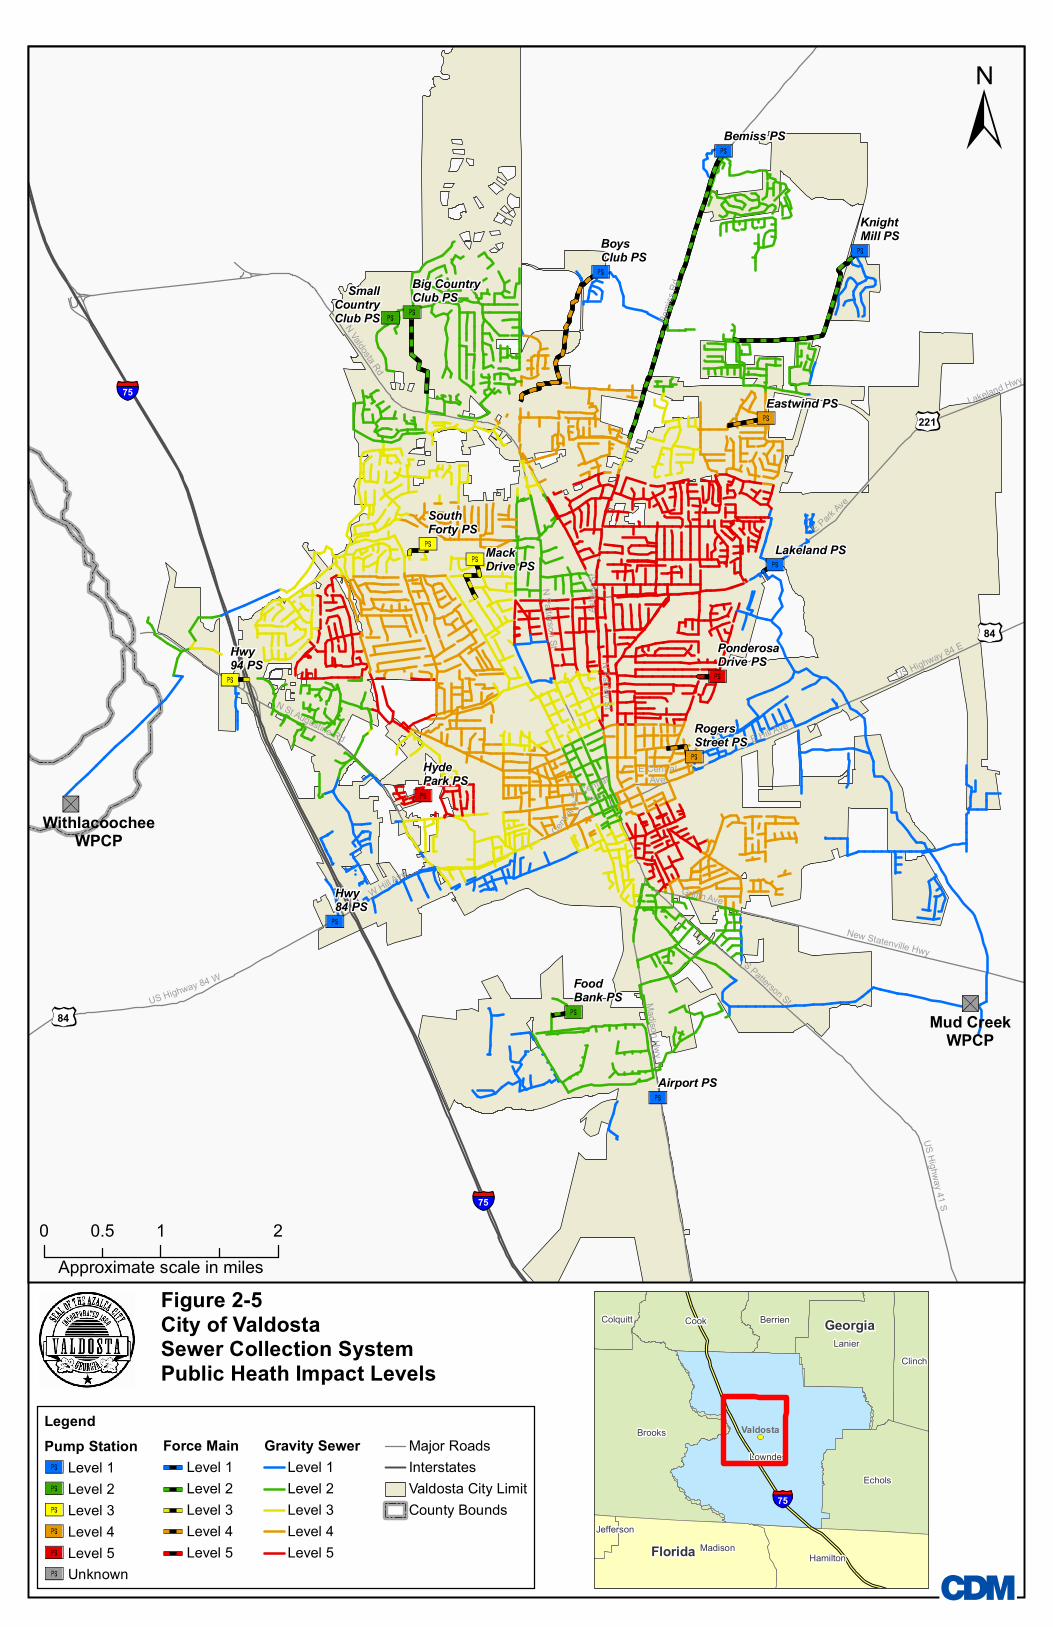
2.4.1.4 Public Health Impact Any wastewater spill has the potential to have a negative impact on public health. The purpose of the rating system is to differentiate the pipes and pump stations in terms of the number of people that could be impacted by a failure leading to a spill. If the pipe or pump station fails in a more densely populated area, there is a potential to impact a greater number of people. Therefore, the impact to public health was based on population density, or the number of people per square mile, as determined by the U.S. Bureau of Census year 2000 block survey. The GIS layer containing the census block information was obtained from the Census Bureau website. Each pipe or pump station was assigned a level based on the average population density of the adjacent census block or blocks. Table 2-7 shows how levels were applied to the public health impact factor.

75
75
84
221
84
Central
Pl
US Highway 84 W
E Park Ave
US Highway 41 S
S Patterson St
US Highway 84 E
E CentralAve
N Patterson St
N Valdosta Rd
Ashle
y St
N Ashley St
New Statenville Hwy
Griffin Ave
W CentralAve
Bemi
ss Rd
W Hill Ave
Lakeland Hwy
E Hill Ave
Madison Hwy
N St Augustine Rd
SmallCountryClub PS
Airport PS
KnightMill PS
Bemiss PS
Lakeland PS
FoodBank PS
BoysClub PS
HydePark PS
Big CountryClub PS
Hwy84 PS
PonderosaDrive PS
RogersStreet PS
Eastwind PS
Hwy94 PS
MackDrive PS
SouthForty PS
WithlacoocheeWPCP
Mud CreekWPCP
LegendPump Station
Level 1Level 2Level 3Level 4Level 5Unknown
Force MainLevel 1Level 2Level 3Level 4Level 5Unknown
Gravity SewerLevel 1Level 2Level 3Level 4Level 5Unknown
Major RoadsInterstatesValdosta City LimitCounty BoundsRiversWetlands
Figure 2-4City of ValdostaSewer Collection SystemEnvironmental Impact
0 1 20.5Approximate scale in miles
75
Georgia
Florida HamiltonMadison
Jefferson
Echols
Lowndes
Brooks
LanierClinch
Colquitt Cook Berrien
Valdosta

Section 2 System Prioritization Based on Existing Information
A 2-12
Table 2-7 Public Health Impact Levels
Population Density (Persons/Acre) Level % Total Pipe Length
(Gravity Sewer) % Total Pipe
Length (Force Main)
Number of Pump Stations
0 to 0.5 1 14 1 6
0.5 to 1.5 2 22 61 3
1.51 - 3.5 3 17 10 3
3.51 - 5.0 4 23 26 2
> 5.0 5 24 2 2
Figure 2-5 shows the levels assigned to each pipe and pump station for the public health impact factor. Those areas that have a population greater than 5 persons per acre and received a high level of criticality in terms of public health are located near the Hyde Park pump station, near the intersection of Gornto and Baytree Roads, just southeast of downtown, and in the northeast portion of the City near East Park Avenue and Bemiss Road.
2.4.1.5 Large User Impact Wastewater collection system assets that are located just downstream of large water and sewer users, such as an industry or large apartment complex, are assumed to be more critical, since repairs to the pipes or pump stations would directly affect the upstream user discharging to the sewer. The large water/sewer users included in this analysis are listed in Table 2-8 and are shown on Figure 2-6. Only those large users that discharge from a central location are included. Table 2-9 shows how levels were applied to gravity sewers for the large user impact factor.
Table 2-8 Large Water/Sewer Users
ADM Woodstone Apartments Valdosta State University Three Oaks Apartments ERCO Worldwide, INC Lakeside Apartments Spanish Mission Apartments Arizona Chemical Cracking Good Bakery SAFT America
Table 2-9 Large User Impact Levels for Gravity Sewer
Downstream of Major Water User Level
% Total Pipe Length (Gravity
Sewer)
% Total Pipe Length (Force
Main) Number of Pump
Stations
Not within 1,000 ft 3 99 96 15
Within 1,000 ft downstream 5 1 4 1
75
75
84
221
84
Central
Pl
US Highway 84 W
E Park Ave
US Highway 41 S
S Patterson St
US Highway 84 E
E CentralAve
N Patterson St
N Valdosta Rd
Ashle
y St
N Ashley St
New Statenville Hwy
Griffin Ave
W CentralAve
Bemi
ss Rd
W Hill Ave
Lakeland Hwy
E Hill Ave
Madison Hwy
N St Augustine Rd
SmallCountryClub PS
Airport PS
KnightMill PS
Bemiss PS
Lakeland PS
FoodBank PS
BoysClub PS
HydePark PS
Big CountryClub PS
Hwy84 PS
PonderosaDrive PS
RogersStreet PS
Eastwind PS
Hwy94 PS
MackDrive PS
SouthForty PS
WithlacoocheeWPCP
Mud CreekWPCP
LegendPump Station
Level 1Level 2Level 3Level 4Level 5Unknown
Force MainLevel 1Level 2Level 3Level 4Level 5
Gravity SewerLevel 1Level 2Level 3Level 4Level 5
Major RoadsInterstatesValdosta City LimitCounty Bounds
Figure 2-5City of ValdostaSewer Collection SystemPublic Heath Impact Levels
0 1 20.5Approximate scale in miles
75
Georgia
Florida HamiltonMadison
Jefferson
Echols
Lowndes
Brooks
LanierClinch
Colquitt Cook Berrien
Valdosta

75
84
75
Crackin' GoodERCO
Spanish Apts
Tree Oaks Apts
Valdosta State University
Arizona Chemical
Woodstore Apts
SAFT
Lakeside Apts.
ADM
US Highway 84 W
E Park Ave
Lakelan
d Hwy
US Highway 41 S
Bemi
ss Rd
S Patterson St
E CentralAve
N Patterson St
N Valdosta Rd
Ashle
y St
N Ashley St
US Highway 84 E
Madison Hwy
Griffin Ave
W CentralAve
W Hill Ave
New Statenville Hwy
E Hill Ave
N St Augustine Rd
SmallCountryClub PS
Airport PS
KnightMill PS
Bemiss PS
Lakeland PS
FoodBank PS
BoysClub PS
HydePark PS
Big CountryClub PS
Hwy84 PS
PonderosaDrive PS
Rogers Street PS
Eastwind PS
Hwy94 PS
MackDrive PS
SouthForty PS
WithlacoocheeWPCP
Mud CreekWPCP
LegendPump Station
Level 1Level 2Level 3Level 4Level 5Unknown
Force MainLevel 1Level 2Level 3Level 4Level 5Unknown
Gravity SewerLevel 1Level 2Level 3Level 4Level 5Unknown
Major RoadsInterstatesValdosta City LimitCounty BoundsMajor Water User
Figure 2-6City of ValdostaSewer Collection SystemLarger User Impact
0 1 20.5Approximate scale in miles
75
Georgia
Florida HamiltonMadison
Jefferson
Echols
Lowndes
Brooks
LanierClinch
Colquitt Cook Berrien
Valdosta

Section 2 System Prioritization Based on Existing Information
A 2-15
2.4.2 Condition Factors In addition to criticality factors, each pipe or pump station was ranked based on condition. Those portions of the system that are in poor condition have a higher probability of failure and, therefore, should be higher priority for investigation and repairs. Condition is assessed based on four categories: structural condition, maintenance frequency, inflow and infiltration, and areas of concern. The following paragraphs describe the condition factors and the levels assigned.
2.4.2.1 Structural Condition CDM performed site visits at the City’s pump stations in December 2007. As part of the site visits, general information, overall structural condition, and concerns at each pump station were reviewed with City staff. This information was used to assign a structural condition level at each pump station. Levels are site-specific to each station. Table 2-10 summarizes the general criteria used to apply levels to pump stations for the structural condition factor. Structural condition levels are also shown in Figure 2-7.
Table 2-10 Structural Condition Levels for Pump Stations
Description Level Number of Pump Stations
Excellent condition; new or like-new station 1 1
Very good condition; some recent improvements have been made to the station 2 2
Good condition; station does not experience operational issues 3 8
Fair condition; some concerns but pump station not in imminent danger of failure; some improvements needed 4 4
Poor condition causing some important elements not to function 5 1
Unknown; not inspected 3.1 0
Unlike pump stations, investigation and inventory of the current structural condition of each pipe in the collection system can be cost prohibitive unless performed over time. Therefore, most utilities have condition assessments performed only on portions of their system in any given year. For most of the City’s collection system gravity sewers and force mains, past condition assessment data is not available. Therefore, other types of known information have been used to estimate the structural condition of the asset, including pipe material and age. This information serves as a surrogate for condition to set priorities for collecting more accurate condition information. The ultimate goal will be to collect actual structural condition data for the entire system over time and update this information with a frequency consistent with the criticality of the asset. The actual condition information will then replace the surrogate data.

75
75
84
221
84
Central
Pl
US Highway 84 W
E Park Ave
US Highway 41 S
S Patterson St
US Highway 84 E
E CentralAve
N Patterson St
N Valdosta Rd
Ashle
y St
N Ashley St
New Statenville Hwy
Griffin Ave
W CentralAve
Bemi
ss Rd
W Hill Ave
Lakeland Hwy
E Hill Ave
Madison Hwy
N St Augustine Rd
SmallCountryClub PS
Airport PS
KnightMill PS
Bemiss PS
Lakeland PS
FoodBank PS
BoysClub PS
HydePark PS
Big CountryClub PS
Hwy84 PS
PonderosaDrive PS
RogersStreet PS
Eastwind PS
Hwy94 PS
MackDrive PS
SouthForty PS
WithlacoocheeWPCP
Mud CreekWPCP
LegendLevel 1Level 2Level 3Level 4Level 5Unknown
Force MainGravity SewerMajor RoadsInterstatesValdosta City LimitCounty Bounds
Figure 2-7City of ValdostaSewer Collection SystemStructural Rating for Pump Stations
0 1 20.5Approximate scale in miles
75
Georgia
Florida HamiltonMadison
Jefferson
Echols
Lowndes
Brooks
LanierClinch
Colquitt Cook Berrien
Valdosta

Section 2 System Prioritization Based on Existing Information
A 2-17
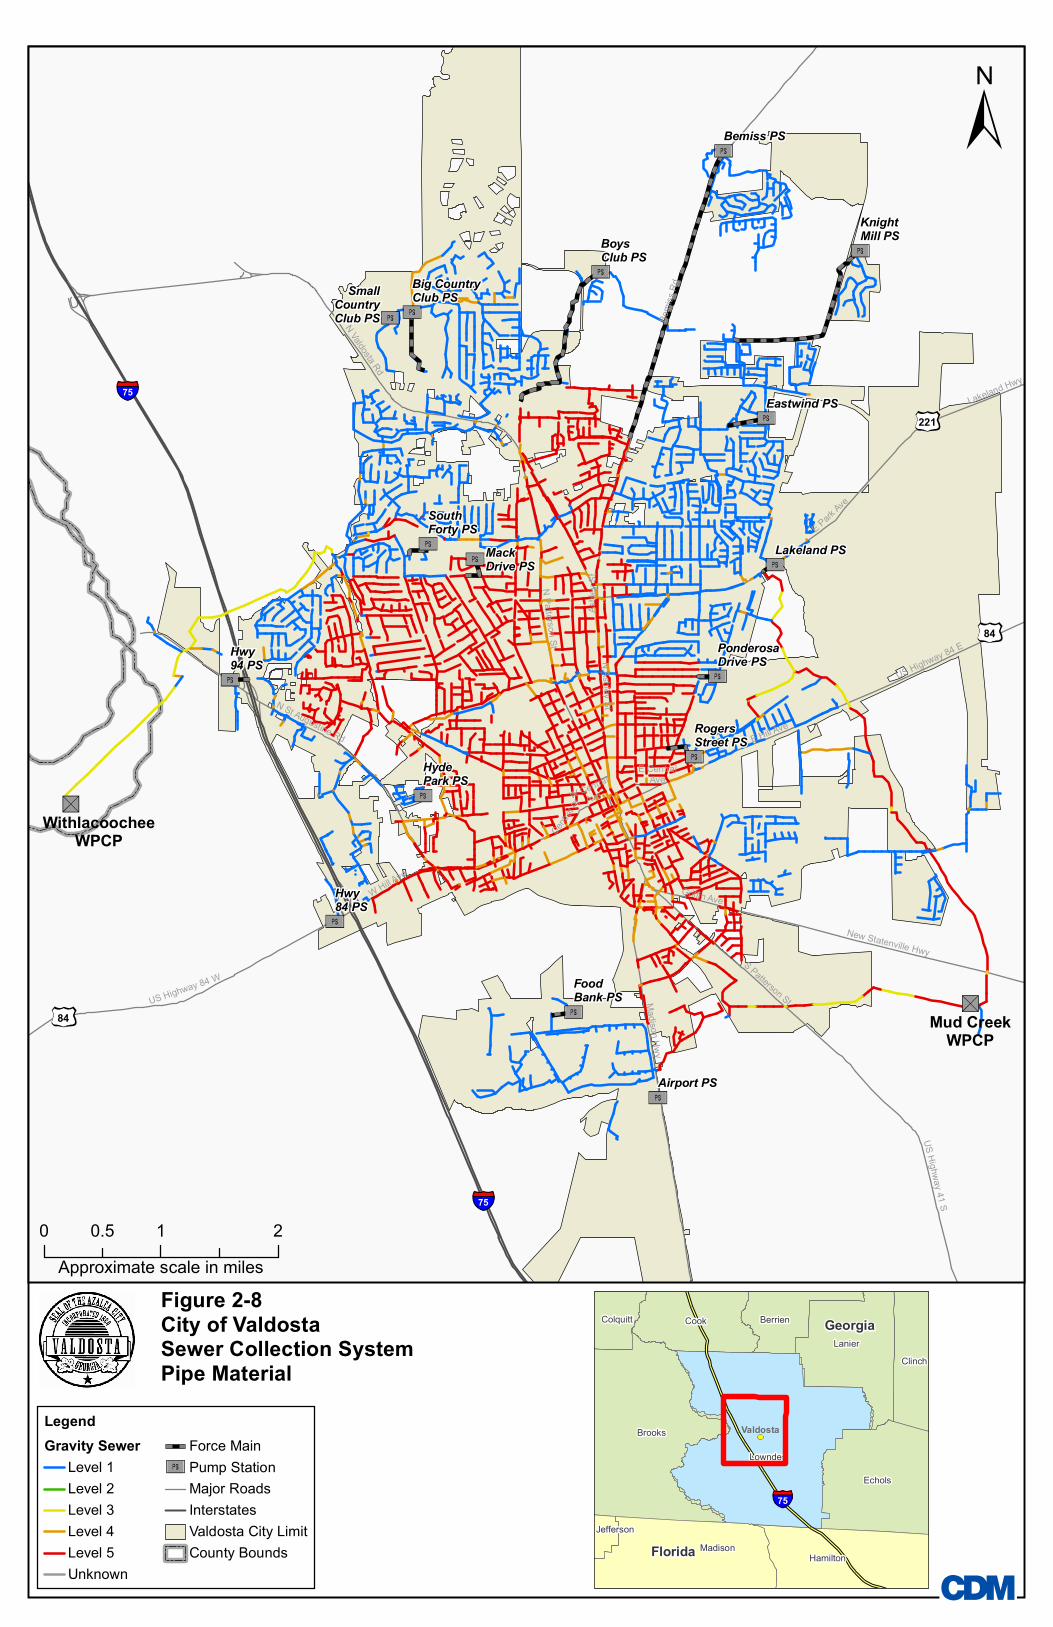
Pipe Material Pipe material is one of the surrogate factors that can be used, if no other condition information is available. Certain types of material are more prone to corrosion or deterioration over time. Pipes of these materials, such as cast iron and vitrified clay, received a higher level rating. Pipe materials such as polyvinyl chloride (PVC) and high density polyethylene (HDPE) have come into use fairly recently and are corrosion resistant. Therefore, it is generally assumed that these pipes would be in better condition and receive a lower level rating. Pipe material for all of the City’s force mains is assumed to be ductile iron and thus, is not a differentiating factor in determining condition of the force mains. Therefore, this factor was only applied to gravity sewers. Gravity pipe material was evaluated based on as-built information or other specific information provided by the City, where available. However, if no specific information is available, it was assumed that the pipes installed before 1972 are vitrified clay pipe (VCP) and pipe installed after 1972 are PVC. Table 2-11 presents the levels assigned to gravity sewer based on material.
Table 2-11 Pipe Material Levels for Gravity Sewer
Pipe Material Level % Total Pipe Length
HDPE, PVC 1 46 Reinforced Concrete & Ductile Iron 3 2 Cast Iron 4 8 Clay Pipe 5 44
Figure 2-8 shows the levels assigned to each pipe for the pipe material factor. The figure shows that most of the gravity sewers in the central portion of the system were assigned a Level 5 rating, indicating that they are made of materials most subject to deterioration.
Age Age is another surrogate factors that can be used, if no other condition information is available. It is assumed that newer pipes will be in better structural condition than those that are older. In addition, newer pipes typically reflect more advanced technology in terms of materials and installation methods. Therefore, the assigned levels increase based on increasing age of the pipes. Some specific age information was provided by the City. Where no specific information was available, the age was determined based on the construction date of the downstream WPCP or pump station. Table 2-12 presents the levels assigned to gravity sewer and force mains based on age.
75
75
84
221
84
Central
Pl
US Highway 84 W
E Park Ave
US Highway 41 S
S Patterson St
US Highway 84 E
E CentralAve
N Patterson St
N Valdosta Rd
Ashle
y St
N Ashley St
New Statenville Hwy
Griffin Ave
W CentralAve
Bemi
ss Rd
W Hill Ave
Lakeland Hwy
E Hill Ave
Madison Hwy
N St Augustine Rd
SmallCountryClub PS
Airport PS
KnightMill PS
Bemiss PS
Lakeland PS
FoodBank PS
BoysClub PS
HydePark PS
Big CountryClub PS
Hwy84 PS
PonderosaDrive PS
RogersStreet PS
Eastwind PS
Hwy94 PS
MackDrive PS
SouthForty PS
WithlacoocheeWPCP
Mud CreekWPCP
LegendGravity Sewer
Level 1Level 2Level 3Level 4Level 5Unknown
Force MainPump StationMajor RoadsInterstatesValdosta City LimitCounty Bounds
Figure 2-8City of ValdostaSewer Collection SystemPipe Material
0 1 20.5Approximate scale in miles
75
Georgia
Florida HamiltonMadison
Jefferson
Echols
Lowndes
Brooks
LanierClinch
Colquitt Cook Berrien
Valdosta

Section 2 System Prioritization Based on Existing Information
A 2-19
Table 2-12 Pipe Age Factor Levels
Installation Date Level % Total Pipe Length (Gravity Sewer)
% Total Pipe Length (Force Main)
2000 or newer 1 3 49
1990-1999 2 1 0
1980-1989 3 11 29
1960-1979 4 51 12
Pre-1960 5 33 10
Figure 2-9 shows the levels assigned to each pipe for the age factor. Generally, the oldest gravity sewer is in the central part of the City, with age increasing as distance from downtown increases.
2.4.2.2 Maintenance Frequency Records of the number of sanitary sewer overflows (SSOs) in a particular area were used to assess the maintenance required in parts of the system. Those pipes and pump stations with more frequent maintenance issues are assumed to have a higher probability of failure and are assigned a higher level than those areas requiring no maintenance.
Figure 2-10 shows the location of all recorded sewer spills, from December 1990 through February 2008 that could be mapped (including the storm event on February 22, 2008). These include both reportable and nonreportable SSOs. The SSOs were geocoded based on location. In order to assign an SSO level to gravity sewer, the number of SSOs was summed by sewershed. The total number of SSOs was divided by the footage of sewer in that sewershed. The same level was assigned to all pipes within the sewershed based on the number of SSOs per mile of pipe. The SSOs at the treatment plants were not assigned to upstream pipes, since the cause may not necessarily relate to maintenance factors in the collector sewers. Table 2-13 shows the levels assigned to each gravity sewer pipe for the SSO maintenance factor. Table 2-14 shows how levels were assigned to pump stations. No SSOs were attributed to force mains.

75
75
84
221
84
Central
Pl
US Highway 84 W
E Park Ave
US Highway 41 S
S Patterson St
US Highway 84 E
E CentralAve
N Patterson St
N Valdosta Rd
Ashle
y St
N Ashley St
New Statenville Hwy
Griffin Ave
W CentralAve
Bemi
ss Rd
W Hill Ave
Lakeland Hwy
E Hill Ave
Madison Hwy
N St Augustine Rd
SmallCountryClub PS
Airport PS
KnightMill PS
Bemiss PS
Lakeland PS
FoodBank PS
BoysClub PS
HydePark PS
Big CountryClub PS
Hwy84 PS
PonderosaDrive PS
RogersStreet PS
Eastwind PS
Hwy94 PS
MackDrive PS
SouthForty PS
WithlacoocheeWPCP
Mud CreekWPCP
LegendForce Main
Level 1Level 2Level 3Level 4Level 5Unknown
Gravity SewerLevel 1Level 2Level 3Level 4Level 5Unknown
Pump StationMajor RoadsInterstatesValdosta City LimitCounty Bounds
Figure 2-9City of ValdostaSewer Collection SystemAge Levels
0 1 20.5Approximate scale in miles
75
Georgia
Florida HamiltonMadison
Jefferson
Echols
Lowndes
Brooks
LanierClinch
Colquitt Cook Berrien
Valdosta

75
75
84
221
84
Central
Pl
US Highway 84 W
E Park Ave
US Highway 41 S
S Patterson St
US Highway 84 E
E CentralAve
N Patterson St
N Valdosta Rd
Ashle
y St
N Ashley St
New Statenville Hwy
Griffin Ave
W CentralAve
Bemi
ss Rd
W Hill Ave
Lakeland Hwy
E Hill Ave
Madison Hwy
N St Augustine Rd
SmallCountryClub PS
Airport PS
KnightMill PS
Bemiss PS
Lakeland PS
FoodBank PS
BoysClub PS
HydePark PS
Big CountryClub PS
Hwy84 PS
PonderosaDrive PS
RogersStreet PS
Eastwind PS
Hwy94 PS
MackDrive PS
SouthForty PS
WithlacoocheeWPCP
Mud CreekWPCP
LegendPump StationForce MainGravity SewerMajor RoadsInterstatesValdosta City LimitCounty Bounds
Number of SSO's1 SSO2 SSO's3 SSO's4 SSO's12 SSO's
Figure 2-10City of ValdostaSewer Collection SystemSSO Locations (from December 1990 through Feburary 2008)
0 1 20.5Approximate scale in miles
75
Georgia
Florida HamiltonMadison
Jefferson
Echols
Lowndes
Brooks
LanierClinch
Colquitt Cook Berrien
Valdosta

Section 2 System Prioritization Based on Existing Information
A 2-22
Table 2-13 SSO Levels for Gravity Sewer
SSOs per Mile of Pipe Level % Total Pipe Length
0 1 45 0.01 to 0.1 2 24 0.11 to 0.2 3 25 0.21 to1.0 4 6 >1.0 5 0
Table 2-14 SSO Levels for Pump Stations
Total Number of SSOs Level Number of Pump Stations
No SSOs 1 12 1 SSO 3 2 2 SSOs 4 1 3 SSOs 5 1
Figure 2-11 shows the levels assigned to each pipe and pump station for the SSO factor. The highest SSO levels are located at the Ponderosa Pump Station, the Big Country Club Pump Station, and gravity sewers near Baytree Road and Gornto Road.
2.4.2.3 Inflow and Infiltration The infiltration and inflow (I/I) condition of the pipe is related to the amount of I/I that enters the pipe. I/I enters the collection system through gravity sewers and manholes. Force mains flow under pressure, and therefore, I/I into the pipeline is not typically a concern. Stormwater inflow can enter from direct sources such as roof downspouts illegally connected to the sanitary sewer, yard and area drains, holes in manhole covers, cross-connections with storm drains, or catch basins. Infiltration of groundwater or stormwater enters the collection system through defective pipes, pipe joints, and manhole walls after percolating through the soil. I/I diminishes the usable capacity of the sewer and indicates structural defects in the sewer.
The I/I factor is based on the analysis of the temporary flow monitoring data collected from February 15, 2008 through April 25, 2008 and model predicted flows. For this memorandum, an evaluation of peak flows during the synthetic 2-year design storm was performed.

75
75
84
221
84
Central
Pl
US Highway 84 W
E Park Ave
US Highway 41 S
S Patterson St
US Highway 84 E
E CentralAve
N Patterson St
N Valdosta Rd
Ashle
y St
N Ashley St
New Statenville Hwy
Griffin Ave
W CentralAve
Bemi
ss Rd
W Hill Ave
Lakeland Hwy
E Hill Ave
Madison Hwy
N St Augustine Rd
SmallCountryClub PS
Airport PS
KnightMill PS
Bemiss PS
Lakeland PS
FoodBank PS
BoysClub PS
HydePark PS
Big CountryClub PS
Hwy84 PS
PonderosaDrive PS
RogersStreet PS
Eastwind PS
Hwy94 PS
MackDrive PS
SouthForty PS
WithlacoocheeWPCP
Mud CreekWPCP
LegendPump Station
Level 1Level 2Level 3Level 4Level 5Unknown
Gravity SewerLevel 1Level 2Level 3Level 4Level 5Unknown
Force MainMajor RoadsInterstatesValdosta City LimitCounty Bounds
Figure 2-11City of ValdostaSewer Collection SystemSSO Levels
0 0.8 1.60.4Approximate scale in miles
75
Georgia
Florida HamiltonMadison
Jefferson
Echols
Lowndes
Brooks
LanierClinch
Colquitt Cook Berrien
Valdosta

Section 2 System Prioritization Based on Existing Information
A 2-24
The model predicted peak wastewater flow recorded during the storm event was compared with the average dry-weather flow (ADWF) recorded at each temporary flow monitor. The highest levels were assigned to gravity sewers within the sewersheds upstream of the monitors that had the highest peaking factors. All gravity pipes within the sewershed were assigned the same level. Pump stations with high I/I were identified based on peak flows within the sewershed.
Table 2-15 shows how levels were assigned to gravity sewers and pump stations for the inflow/infiltration condition.
Table 2-15 Levels for Gravity Sewer I/I Factor
Peak Flow to ADWF Factor (For 2-year Design Storm) Level % Total Pipe Length Number of
Pump Station
0 to 2 1 3 1 2.1 to 4 2 28 5 4.1 to 6 3 27 5 6.1 to 10 4 25 3 >10 5 17 2 Unknown 3.1 0 0
Figure 2-12 shows the levels assigned for the inflow/infiltration condition factor. Areas with the highest I/I levels include portions of the gravity sewers tributary to the upper West Dukes Bay, Browns Canal, Sugar Creek, Two Mile and Withlacoochee outfalls. I/I factor level of five was assigned to the Withlacoochee outfall for a number of reasons. During the course of the flow monitoring period, the velocity sensor in Meter 14 on the Withlacoochee outfall showed unusual readings, but site conditions prohibited corrective maintenance from being performed. During the first two maintenance visits, the manhole in which Meter 14 was installed showed high levels of hydrogen sulfide gas which prohibited entry into the manhole.
The remaining visits occurred after the February 22, 2008 storm event. Immediately following the event, the manhole was underwater for a period of days. After the surface waters subsided, the manhole in which Meter 14 was installed showed very high flow depths during dry-weather flow. On an average day, the average depth was approximately 43 inches in the 54-inch pipe. Due to these high water depths, the flow monitoring personnel could not access the velocity probe or depth sensor for maintenance.

75
75
84
221
84
Central
Pl
US Highway 84 W
E Park Ave
US Highway 41 S
S Patterson St
US Highway 84 E
E CentralAve
N Patterson St
N Valdosta Rd
Ashle
y St
N Ashley St
New Statenville Hwy
Griffin Ave
W CentralAve
Bemi
ss Rd
W Hill Ave
Lakeland Hwy
E Hill Ave
Madison Hwy
N St Augustine Rd
SmallCountryClub PS
Airport PS
KnightMill PS
Bemiss PS
Lakeland PS
FoodBank PS
BoysClub PS
HydePark PS
Big CountryClub PS
Hwy84 PS
PonderosaDrive PS
RogersStreet PS
Eastwind PS
Hwy94 PS
MackDrive PS
SouthForty PS
WithlacoocheeWPCP
Mud CreekWPCP
LegendPump Station
Level 1Level 2Level 3Level 4Level 5Unknown
Gravity SewerLevel 1Level 2Level 3Level 4Level 5Unknown
Force MainMajor RoadsInterstatesValdosta City LimitCounty Bounds
Figure 2-12City of ValdostaSewer Collection SystemInflow & Infiltration Levels
0 1 20.5Approximate scale in miles
75
Georgia
Florida HamiltonMadison
Jefferson
Echols
Lowndes
Brooks
LanierClinch
Colquitt Cook Berrien
Valdosta

Section 2 System Prioritization Based on Existing Information
A 2-26
The Manhole in which Flow Meter 14 was Installed was Covered with Water Following the February 22, 2008
Storm Event
During maintenance visits, personnel would normally check the velocity probe and depth readings against manual readings. Also, personnel would clean the sensor with a brush to remove any grease or debris. Since the equipment could not be accessed for maintenance, the data cannot be used with a high level of confidence. Therefore, velocity and flow data from monitor 14 is not included in this analysis. Given that the meter location was consistently underwater, the Withlacoochee outfall received an I/I condition level of five.
Some other outfalls which had low peaking factors were later identified through the capacity analysis as having excessive surcharging due to groundwater infiltration, sediment, blockages, or other capacity issues. The fact these outfalls were consistently running over 50 percent full made it difficult to see a high peaking factor that would indicate high I/I. These outfalls were identified as areas of concern as discussed below.
2.4.2.4 Areas of Concern Areas of concern were developed to incorporate additional condition information related to the capacity analysis and maintenance issues that were not covered in the preliminary analysis using surrogate factors described above. The areas of concern are intended to be override factors and supersede the surrogate factors of age, material, SSOs, and I/I described above.
There are two different level assignments for the areas of concern. If there was field data that could provide supporting evidence of a problem, then the area of concern was assigned a rating of 5. The field data available for this determination was a work order database for sewer repairs covering April 2007 to April 2008 and the flow monitoring data. The flow monitoring data and subsequent hydraulic modeling showed evidence of prolonged infiltration and daily surcharging following rainfall events. Surcharge conditions can be due to a number of factors.
Surcharge can be due to structural deficiencies in the trunk sewer or upstream collector sewer that are allowing water to enter the sewer long after the rainfall event has ended. Surcharge can also be due to capacity limitations in the downstream trunk sewer or pump stations.
Manhole

Section 2 System Prioritization Based on Existing Information
A 2-27
Portions of the Knights Creek Outfall Cross under Standing Water
The capacity evaluation performed as part of this project determined the cause of the surcharge and the best corrective action. The proposed capacity improvements are integrated into the prioritized condition assessment and rehabilitation projects in Section 5 of this report. Table 2-16 and Figure 2-13 present the levels assigned for the areas of concern factors.
Table 2-16 Areas of Concern Levels for Gravity Sewer and Force Mains
Concern Level % Total Pipe
Length (Gravity Sewer)
% Total Pipe Length
(Force Main)
Fats, Oils, and Grease 4 0.5 0 Structural, I/I, or Capacity concern but that at this time is not documented with field data or that the flow monitoring did not show very prolonged infiltration
4 1.5 0
Area of Structural, I/I, or Capacity concern that is supported by work orders or flow monitoring data showing that infiltration leads to surcharging daily following rainfall events
5 5 30
The Knights Creek, South Dukes Bay, Mud Creek, and Withlacoochee outfalls were identified as areas of concern due to structural, surcharging, and capacity issues. These outfalls recorded surcharged levels more than 20 percent of the time and thus were assigned a level 5. The Knights Creek outfall Meter 16 recorded surcharging for 23 percent of the time.
Field visits to Knights Creek outfall showed some manhole rims in poor condition and some portion of the sewer passing under standing water, giving opportunity for infiltration. The capacity evaluation indicated the presence of blockages causing much of the surcharging and therefore an override factor of 5 is appropriate for priority field investigation of this outfall.
The South Dukes Bay outfall Meter 19 recorded surcharging 43 percent of the time. This surcharging, in combination with high peak flows, indicates the potential for excessive infiltration entering the collector sewer or along the outfall upstream of the meter. The capacity evaluation indicated a hydraulic restriction which may be causing much of the surcharge and stagnant water and is further discussed in Section 5.

75
75
84
221
84
Central
Pl
US Highway 84 W
E Park Ave
US Highway 41 S
S Patterson St
US Highway 84 E
E CentralAve
N Patterson St
N Valdosta Rd
Ashle
y St
N Ashley St
New Statenville Hwy
Griffin Ave
W CentralAve
Bemi
ss Rd
W Hill Ave
Lakeland Hwy
E Hill Ave
Madison Hwy
N St Augustine Rd
SmallCountryClub PS
Airport PS
KnightMill PS
Bemiss PS
Lakeland PS
FoodBank PS
BoysClub PS
HydePark PS
Big CountryClub PS
Hwy84 PS
PonderosaDrive PS
RogersStreet PS
Eastwind PS
Hwy94 PS
MackDrive PS
SouthForty PS
WithlacoocheeWPCP
Mud CreekWPCP
LegendForce Main
Level 1Level 2Level 3Level 4Level 5All Other FM
Gravity SewerLevel 1Level 2Level 3Level 4Level 5All Other Pipes
Pump StationMajor RoadsInterstatesValdosta City LimitCounty Bounds
Figure 2-13City of ValdostaSewer Collection SystemAreas of Concern Levels
0 1 20.5Approximate scale in miles
75
Georgia
Florida HamiltonMadison
Jefferson
Echols
Lowndes
Brooks
LanierClinch
Colquitt Cook Berrien
Valdosta

Section 2 System Prioritization Based on Existing Information
A 2-29
Some Portions of Withlacoochee Outfall are in
Areas of Standing Water
Portions of the Mud Creek Outfall Cross under Standing Water
Some Mud Creek Outfall Manholes are in Poor Condition
The Mud Creek outfall Meter 20 recorded surcharging 55 percent of the time. The downstream Meter 21 did not record the same level of surcharging and thus was
assigned a different level. This surcharging, in combination with high peak flows, indicates excessive I/I entering the collector sewer or along the outfall upstream of the meter. Field visits to the Mud Creek outfall showed deteriorated manholes and the outfall passing through swampy areas, giving opportunities for water to enter the system. The flow monitoring analysis and capacity evaluation also indicated the presence of blockages and therefore an override factor of 5 is appropriate for priority field investigation of this outfall.
Manholes on Knights Creek Outfall in Poor Condition

A
The Withlathan all othupstream ma restrictiothe projectrecorded bMeter 14 m
Under dry inflow, flowapproxima54-inch pipbelow the soutfall crosFollowing standing wdefects in t
The City’s were docuPonderosaan area of c
2.5 Calc
ratings arecomponen
The critical(quantity oimpact, anrating wascondition, relative imas “overridassigned tocriticality rvalues andand a critic
acoochee outher meters. Tmeters subsin downstrea will help ve
by the downsmay be due t
conditions ww monitors ately 4.4 mgdpe (even at msurcharge lesses under s the large rai
water, providthe pipe.
concerns regmented by n
a Drive in resconcern to th
culating
e also based ots that have
lity rating wof flow convd large-user calculated umaintenanc
mportance. Inde factors.” o these factorating. The fod override facality rating.
tfall Meter 1The surchargided, indicatam. Hydrauerify the caustream WPCo I/I enterin
without the upstream ofd. Using Maminimum sloevel of 54 inceveral swaminfall event oding ample o
garding excenumerous wsponse to leahe City due
g a CondiAfter
staov
weron a scale of the highest
was calculateeyed, transp
r impact) andusing the leve frequency,
n addition, soThese factor
ors overridesollowing sec
actors, follow.
14 recorded sging was recting the potelic modeling
use of the surCP effluent mng the outfal
influence off the Withlac
annings equaope) at a depches. Field inmpy areas onon Februaryopportunity
essive I/I inworkorders in
aks and sew to odor issu
ition and a level of 1 ation for eacverall criticale calculatedf 1 to 5, with consequenc
ed using the portation impd their relativels assigned, infiltrationome conditiors were deems all other facctions descri
wed by an ex
System Prioriti
surchargingcorded after ential for I/Ig being condrcharging. Simeter indicatll.
f rainfall depcoochee outfation, this flopth of appronspection of n the way to y 22, 2008, th for water to
n the Ponderon the area be
wer stops. Finues.
d Criticato 5 was ass
ch of the CC lity rating an for each sys
h highest ratie or highest
levels assignpact, enviroive importand to each con
n/inflow, andon and critic
med most imctors in deteibe in more dxample calcu
ization Based o
g 62 percent o the flows reI entering aloducted as animilar levelste that the su
pendent infilfall convey aow should b
oximately 16 the outfall s the Withlac
he ground wo enter throu
osa lift statioetween 807 anally, the Bem
ality Ratsigned to eac factors (see nd an overalstem compoings assigne probability
ned to each cnmental imp
nce. Similarlndition factod areas of cocality factors
mportant. Thermining thedetail the rel
ulation of a c
Son Existing Info
of the time—ecorded fromong the outf
nother portios of elevatedurcharging i
ltration and a flow of be conveyed inches—weshowed thatcoochee WPCas covered w
ugh cracks or
on collector and 1326 miss force m
ting ch pipe or pu Section 2.3),ll condition nent. These d to those of failure.
criticality fapact, public y, the condi
or (structuraoncern) and s were desig
herefore, the e final conditlative impor
condition rat
Section 2 ormation
2-30
—more m fall or on of d flow in
by a ell t the CP. with r other
sewer
main is
ump , an rating
ctor health tion l their
gnated level tion or rtance ting

Section 2 System Prioritization Based on Existing Information
A 2-31
2.5.1 Relative Importance Values and Override Factors The relative importance is the weighting, expressed as a percentage, applied to each factor in order to calculate an overall rating. The initial relative importance values were based on input received in the April 2008 kickoff meeting with City staff. These values were then refined during the calibration with actual system data. The calibration was performed so that criticality and condition ratings were distributed across the full range of values (1 to 5) to the extent possible. This way, there is a clear understanding of the relative probability and consequence of failure for each system component. The calibration process also ensured that areas of the system with poor condition and high criticality were properly identified as being a priority.
The criticality factors are applied in the same way for gravity sewers, force mains, and pump stations. The calibrated relative importance for the gravity sewer, force main, and pump station criticality factors is presented in Table 2-17. Based on input at the kickoff meeting, the environmental impact and public health impact categories were determined to be most important and were therefore designated as override factors. If both categories receive a Level 5 rating, the final criticality rating is a 5, regardless of the levels assigned to other factors. If one of these two categories receives a Level 5, then the final criticality rating is a 4, regardless of the levels assigned to other factors. This decision impacted many of the pump stations and resulted in 11 out of 16 pump stations rated as highly critical (Level 4 rating.)
Table 2-17 Relative Importance of Criticality Factors
Criticality Factors Gravity Sewer Force Mains Pump Stations
Quantity of Flow Conveyed 22.5% 22.5% 22.5% Transportation/Urban Impact 22.5% 22.5% 22.5% Environmental Impact* 22.5% / Override 22.5% / Override 22.5% / Override Public Health Impact* 22.5% / Override 22.5% / Override 22.5% / Override Large User Impact 10% 10% 10%
Total 100% 100% 100%
*If either the Environmental Impact or Public Health Impact factor is a Level 5, that factor will override the final rating.
The calibrated relative importance for condition factors is presented in Table 2-18. For pump stations, the structural condition factor was designated as an override. If the structural condition factor level is a 4 or 5 (poor condition), the overall condition rating is equal to the structural condition level. However, if the pump station is in good condition (Level 3 or less), the maintenance and capacity factors are also included in the overall rating, since these may indicate other types of concerns at the pump station.
The areas of concern category were designated as an override factor for gravity sewers and force mains. If the pipe or pump station has a structural, maintenance, or capacity concern identified by the City, then the overall condition rating is equal to the assigned level for the areas of concern category as given in Table 2-16.

A
Table 2-18 R
Structural C
MaintenanceCapacity Areas of Con
*If the pump st
2.5.2 OvOverall conmain, and 14 shows thsuspected older VCP central porWithlacooc
Figure 2-15identified aamount of downstrea
2.6 Prio
most immeaction for ecriticality r
Relative Impor
Condition Fa
ondition
e
ncern
tation structural c
erall Conndition and pump statiohe final condto be in the w pipes with srtion of the Cchee outfalls
5 shows the as being mo flow; are clo
am of large w
oritizing
ediate needseach sewer sratings.
rtance of Cond
ctors
AssessmeAge
MateriaSSOs
I/I
TOTALcondition is a lev
ndition an criticality raon. Ratings wdition ratingworst condisome knownCity and alons.
final criticalst critical if aosest to wate
water/sewer
g Based oThe co
deteasse
plan fos. Figure 2-16system comp
dition Factors
Gravit
ent N2
l 222
OvL 1el 4 or 5, then it w
nd Criticalatings were cwere roundeg for each astion (orangen concerns. Tng the Knigh
lity rating foa failure occer, roads, anr users.
on Criticombination oermines prioets. This prioor focusing t6 is a matrixponent based
System Prioriti
ty Sewer
N/A 25% 25% 25% 25% verride 00% will override the
lity Ratincalculated foed to the neaset. For grav
e and red onThese pipes hts Creek, M
or each asseturred are th
nd densely p
cality andof condition orities for reporitization wthe availablex showing thd on the com
ization Based o
Force Mains
N/A 70% N/A N/A N/A
30%/Override 100%
final rating.
ng or each gravarest whole nvity sewers,
n the figure) are mainly l
Mud Creek, a
. The assets hose that con
opulated are
d Condi and criticalipair or repla
will provide te resources ahe recommenmbination of
Son Existing Info
Pump St
50% / OvN/AN/A25%25%N/A
100%
ity sewer, fonumber. Fig the assets thare generallylocated in thand
that were nvey the largeas; and are
tion Ratity ratings acement of sythe City withand funding nded coursef condition a
Section 2 ormation
2-32
tations
verride A A % % A %
orce gure 2-hat are y the
he
gest
tings
ystem h a on the of
and
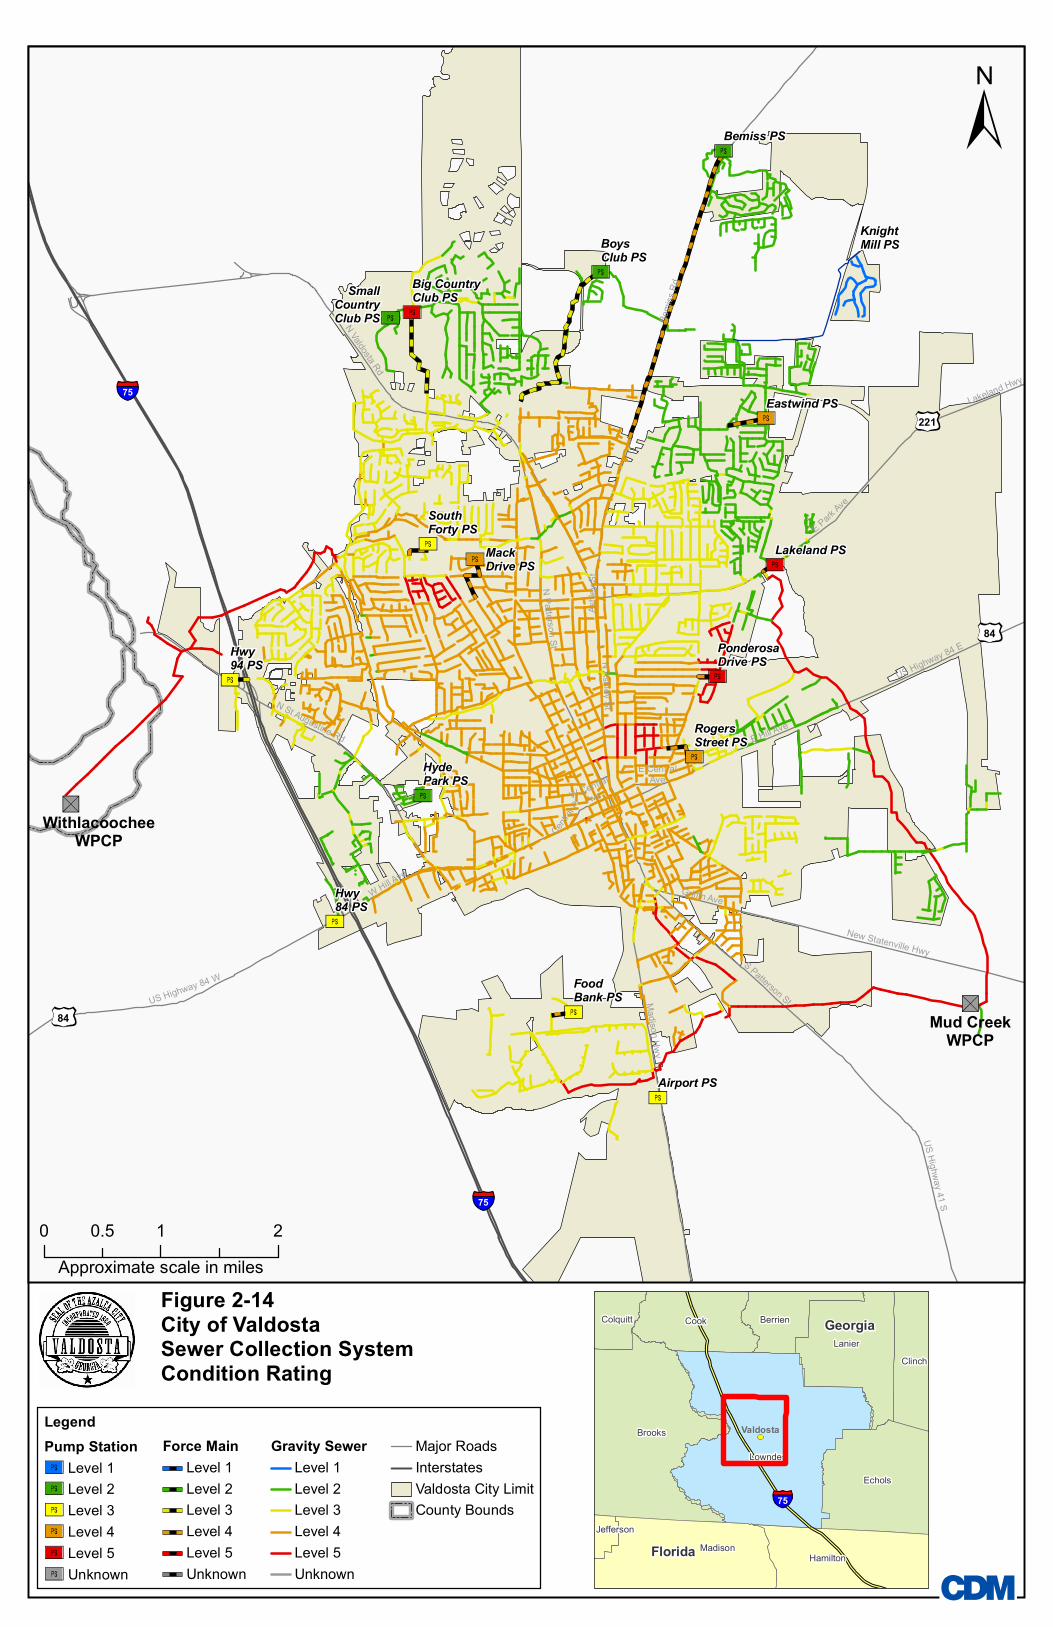
75
75
84
221
84
Central
Pl
US Highway 84 W
E Park Ave
US Highway 41 S
S Patterson St
US Highway 84 E
E CentralAve
N Patterson St
N Valdosta Rd
Ashle
y St
N Ashley St
New Statenville Hwy
Griffin Ave
W CentralAve
Bemi
ss Rd
W Hill Ave
Lakeland Hwy
E Hill Ave
Madison Hwy
N St Augustine Rd
SmallCountryClub PS
Airport PS
KnightMill PS
Bemiss PS
Lakeland PS
FoodBank PS
BoysClub PS
HydePark PS
Big CountryClub PS
Hwy84 PS
PonderosaDrive PS
RogersStreet PS
Eastwind PS
Hwy94 PS
MackDrive PS
SouthForty PS
WithlacoocheeWPCP
Mud CreekWPCP
LegendPump Station
Level 1Level 2Level 3Level 4Level 5Unknown
Force MainLevel 1Level 2Level 3Level 4Level 5Unknown
Gravity SewerLevel 1Level 2Level 3Level 4Level 5Unknown
Major RoadsInterstatesValdosta City LimitCounty Bounds
Figure 2-14City of ValdostaSewer Collection SystemCondition Rating
0 1 20.5Approximate scale in miles
75
Georgia
Florida HamiltonMadison
Jefferson
Echols
Lowndes
Brooks
LanierClinch
Colquitt Cook Berrien
Valdosta

75
75
84
221
84
Central
Pl
US Highway 84 W
E Park Ave
US Highway 41 S
S Patterson St
US Highway 84 E
E CentralAve
N Patterson St
N Valdosta Rd
Ashle
y St
N Ashley St
New Statenville Hwy
Griffin Ave
W CentralAve
Bemi
ss Rd
W Hill Ave
Lakeland Hwy
E Hill Ave
Madison Hwy
N St Augustine Rd
SmallCountryClub PS
Airport PS
KnightMill PS
Bemiss PS
Lakeland PS
FoodBank PS
BoysClub PS
HydePark PS
Big CountryClub PS
Hwy84 PS
PonderosaDrive PS
RogersStreet PS
Eastwind PS
Hwy94 PS
MackDrive PS
SouthForty PS
WithlacoocheeWPCP
Mud CreekWPCP
LegendPump Station
Level 1Level 2Level 3Level 4Level 5Unknown
Force MainLevel 1Level 2Level 3Level 4Level 5Unknown
Gravity SewerLevel 1Level 2Level 3Level 4Level 5Unknown
Major RoadsInterstatesValdosta City LimitCounty Bounds
Figure 2-15City of ValdostaSewer Collection SystemCriticality Rating
0 1 20.5Approximate scale in miles
75
Georgia
Florida HamiltonMadison
Jefferson
Echols
Lowndes
Brooks
LanierClinch
Colquitt Cook Berrien
Valdosta

Section 2 System Prioritization Based on Existing Information
A 2-35
High Priority Program Rehab
Criticality
1 2 3 4 5 C
ondi
tion
5 Program Rehab
Program Rehab
Program Rehab
Immediate Action
Immediate Action
4 Program Rehab
Program Rehab
Program Rehab
High Priority Program Rehab
High Priority Program Rehab
3 Low Priority Low Priority Regular
Monitoring Frequent
Assessment Frequent
Assessment
2 Low Priority Low Priority Regular
Monitoring Frequent
Assessment Frequent
Assessment
1 Low Priority Low Priority Regular
Monitoring Regular
Monitoring Regular
Monitoring
Figure 2-16
Recommended Course of Action Based on Condition and Criticality Ratings
Each of the recommended courses of action are briefly described below. A more detailed description of specific investigative and rehabilitation techniques is included in Section 3 of this report. The specific investigative techniques or rehabilitation will vary, based on the type of asset—gravity sewer, force main, or pump station.
Immediate Action Pipes or pump stations that are both very critical (criticality rating = 4 to 5) and in very poor condition (condition rating = 5) are placed with the highest priority for immediate action including rehabilitation or replacement. These assets are more likely both to fail and have high
consequences if a failure were to occur. The action to be taken may include additional data collection to determine actual condition. If the condition is documented to be very poor, the action would be emergency repairs, structural rehabilitation to address structural condition, or comprehensive rehabilitation to reduce I/I.
High-priority Program Rehabilitation Pipes or pump stations that are very critical (criticality rating = 4 to 5) and in relatively poor condition (condition rating = 4) are the second priority for action behind the immediate action category. Once the assets that initially fall into this category are verified to be in poor condition, they should be incorporated into a high-priority
rehabilitation program.
High- Priority
Program Rehab
Immediate Action

Section 2 System Prioritization Based on Existing Information
A 2-36
Program Rehabilitation Pipes or pump stations that are suspected to be in poor condition (condition rating = 4 or 5) but are not as critical (criticality rating = 1 to 3) should be part of an ongoing rehabilitation program.
Frequent Assessment Pipes or pump stations that are in fair condition (condition rating = 2 or 3), but are still very critical (criticality rating = 4 to 5) should have their condition assessed frequently, since the consequences of failure are high. The purpose of frequent assessment is to check if the
condition has deteriorated to a point that the asset would be moved to the immediate action category. In many cases, assets in the frequent assessment category had a condition rating around 3 due to unknown information about the condition. Once the condition is known, and if it is determined to be poor, these assets would move up to the immediate action category.
Regular Monitoring The assets in the regular monitoring category cover a span of condition and criticality ratings that fall between the frequent assessment and low priority categories. Assets in this group cover the conditions ratings 1, 2, and 3, as in the low priority group. However,
they are more critical than the low priority category, since they received a criticality rating of at least 3. Because of their higher criticality, they require regular monitoring. Some of the assets in this category are still very critical (rating 4 to 5) but are generally in better condition than those requiring frequent assessment. The activities performed under regular monitoring are the same as those performed under frequent assessment, although the activities are not performed as often.
Low Priority The low priority category includes assets that are believed to be in good to fair condition (condition rating 1 to 3) and that are not considered critical (criticality rating 1 or 2). The assets in this category will receive some level of condition monitoring to see if they should be
included in the rehabilitation program group.
2.6.1 System Prioritization Figure 2-17 presents the system prioritization map showing where each asset initially falls on the matrix presented in Figure 2-15. This figure uses the same coloring scheme as the Figure 2-15 matrix. Assets that fall within the immediate action category are shown in red. Assets that should be part of an ongoing rehabilitation program are shown in orange and yellow. Assets that require some form of monitoring are shown in purple and green. Lower priority assets are color coded blue.
Frequent Assessment
Program Rehab
Regular Monitoring
Low Priority

Section 2 System Prioritization Based on Existing Information
A 2-37
The criticality ratings are based upon the impact of a pipe or pump station failure on transportation, large users, the environment, and the public. The criticality rating is unlikely to fluctuate significantly unless future development causes a change in the criticality of certain areas, such as a shift in population density or construction of a new highway.
The structural condition of the City’s pump stations is generally known, since they are inspected on a regular basis. However, the condition of most of the City’s pipeline assets is currently unknown. Therefore, they were assigned a surrogate condition rating based on factors such as age, material, past SSOs, and I/I concerns. While these factors can provide an indicator of good or poor condition, the City should work to investigate and determine the actual condition of all pipeline assets as soon as feasible and continue to monitor and assess the pipelines as they age. Once the actual condition rating is known, the assets can be reprioritized so that they fall into the category with the proper level of maintenance or rehabilitation, based on their true condition. A description of the investigation techniques that can be used to determine the condition of the collection system is provided in Section 3. Specific recommendations for SSES investigation of the highest priority pipes and pump stations are presented in Section 4.

75
75
84
221
84
Central
Pl
US Highway 84 W
E Park Ave
US Highway 41 S
S Patterson St
US Highway 84 E
E CentralAve
N Patterson St
N Valdosta Rd
Ashle
y St
N Ashley St
New Statenville Hwy
Griffin Ave
W CentralAve
Bemi
ss Rd
W Hill Ave
Lakeland Hwy
E Hill Ave
Madison Hwy
N St Augustine Rd
10B
1E
17A14A
9A
8B8A
8D 8E
20A20C
12A
7A
7C6C6B
5B5C
5A
14B
14C
14D
4B
4A
2A2B
6D
1A 1B
10A
3B
5D
MC
12B
9B
2C
8C
7B
6A
WP
11
21
17
16A
3A
4C
19D
20B
13
1C
15B
SmallCountry
Club
Airport
KnightMill
Bemiss
Lakeland
FoodBank
BoysClub
HydePark
BigCountryClub
Hwy 84
PonderosaDrive
RogersStreet
Eastwind
Hwy 94
MackDrive
SouthForty
WithlacoocheeWPCP
Mud CreekWPCP
LegendPump Station
Low PriorityRegular MonitoringProgram RehabFrequent AssessmentHigh Priority Program RehabImmediate Action
Force MainLow PriorityRegular MonitoringProgram RehabFrequent AssesmentHigh Priority Program RehabImmediate Action
Gravity SewerLow PriorityRegular MonitoringProgram RehabFrequent AssessmentHigh Priority RehabImmediate Action
Major RoadsInterstatesValdosta City LimitCounty Bounds
Figure 2-17City of ValdostaSewer Collection SystemSystem Prioritization
0 1 20.5Approximate scale in miles

A 3-1
Zoom Camera being Lowered into a Manhole
Section 3 Condition Assessment Section 2 discussed the method for assessing the potential risk associated with the City’s sewer system assets based on criticality (consequence of failure) and condition (probability of failure). All sewer system assets (pipes, force mains, and pump stations) were initially assigned condition and criticality ratings and were grouped according to the corresponding matrix category. However, most of the condition ratings were assigned based on surrogate factors such as age, material, past SSOs, and I/I concerns. It is recommended that the City implement a condition assessment program to verify the actual condition of the highest priority collection system assets. When assessing condition, various aspects should be considered to determine an appropriate rehabilitation action. These include structural condition, maintenance issues, infiltration and inflow (I/I), and capacity.
3.1 Structural Condition The following sections discuss techniques for structural investigation and the development of structural condition ratings.
3.1.1 Gravity Sewer Investigation Techniques Some examples of structural evaluation for gravity sewer are manhole inspection, zoom camera inspection, closed-circuit television (CCTV) inspection, and sonar and laser profiling.
Manhole Inspection. Manhole inspections provide basic information including pipe size, depth from rim to invert, and pipeline cover (i.e., street, yard, easement, etc.). Manhole inspection also provides data on defects in the manhole that could cause structural failure or contribute to excessive I/I, as well as identify portions of the collection system in need of cleaning.
Zoom Camera Inspection. This technology uses high-powered zoom camera lenses in conjunction with high-intensity lighting to video tape the condition while moving (actually zooming) upstream and downstream of a given manhole location. It is typically performed at the same time manhole inspection is performed. The zoom camera can inspect approximately 50 feet into each pipe from the manhole, assuming debris, high water levels, bends, or defects do not obstruct the camera’s line of sight. Pipe defects that can be seen with zoom camera inspection include cracks, holes, offset joints, active infiltration,
Manhole Inspection Photo

Section 3 Condition Assessment
A 3-2
Example of Pipe Defect Identified by CCTV Inspection
roots, and debris. While zoom camera inspection can provide a general condition of the pipe, it does not replace CCTV for design of improvements. Zoom camera inspection is not well suited for pipes with high levels of grease, debris, or offset joints, as the camera cannot see beyond the obstructions. Corrosion can also be difficult to identify.
CCTV inspection. CCTV inspection uses a color television camera inside the sewer to visually establish the pipeline conditions as the camera is propelled through the pipeline. Similar to zoom
camera inspections, television inspections are conducted to locate pipe defects and potential rainfall dependent inflow and infiltration (RDII) sources. Most CCTV cameras can also pan and tilt to locate and inspect laterals along the pipe. CCTV inspection covers the entire pipeline from manhole to manhole and is the most accurate method of determining the condition of a gravity sewer. Costs range from $2—6 per foot for cleaning and CCTV, depending on pipe diameter, total length of CCTV, access, and traffic control issues. CCTV may not be well suited, if a significant portion of the pipe is below the water line, as the camera cannot determine the condition of the pipe below the water. If CCTV is not appropriate due to depth of water, other technologies such as robotics investigation or FELL should be used.
Robotic technology. Robotic technology allows collection of CCTV, sonar, and laser profiling, all in a single pass using a robot inspection system. RedZone Robotics has developed the only known multi-sensor robotic platform currently on the market. The RedZone Responder™ is a remotely-operated tool for inspection of large diameter pipe (36 inches and greater) up to 500 feet deep. The Responder can continuously inspect up to one mile of pipe, typically in a few hours. Laser profiling can be used to obtain a detailed picture of the pipe, including precise measurements of inside diameter, holes, ovality, joints, protruding rebar, etc. Continuous-spinning 3D LYDAR technology for laser profiling is an accurate method for assessing the extent of corrosion, especially in large-diameter outfalls. Sonar assessment data can be used to calculate the amount of debris and sediment in the pipe. Graphs of sediment levels in each pipe segment are generated. This technology can identify areas where cleaning is needed and can provide information needed to obtain much more accurate and better priced bids for the cleaning. CCTV and laser profiling are performed above the water line. Therefore, the pipe should be half full or less during the investigation.
Example of Zoom Camera Inspection
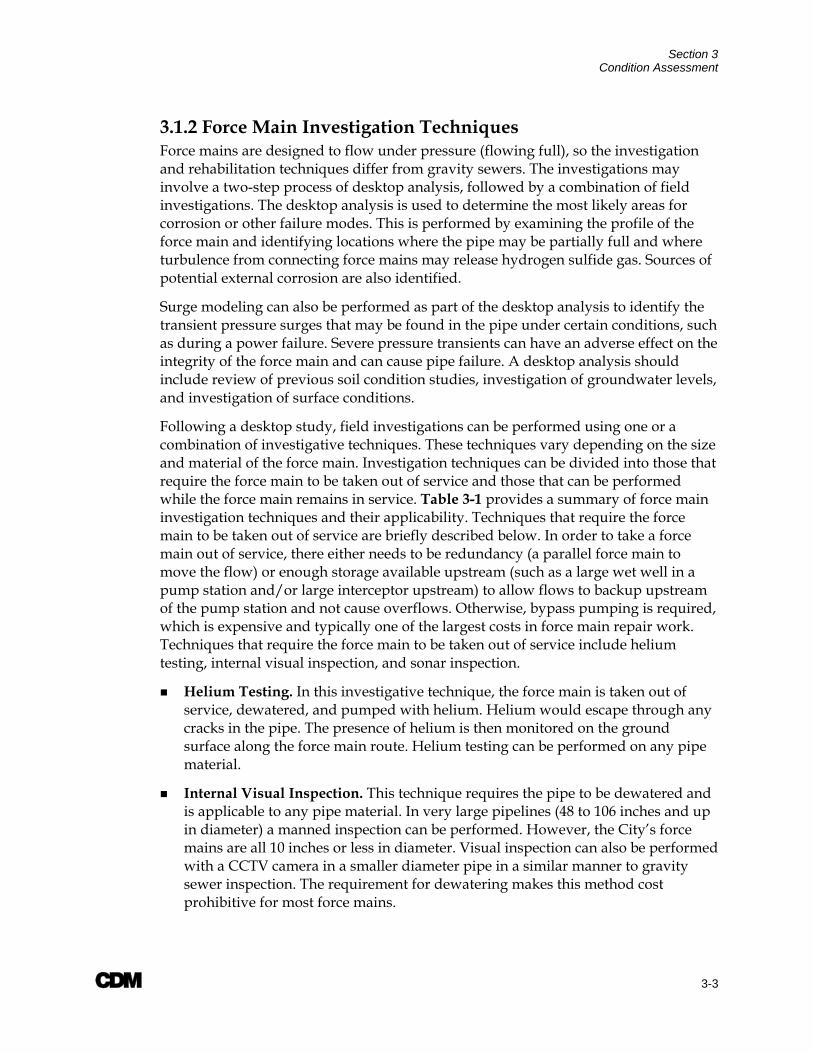
Section 3 Condition Assessment
A 3-3
3.1.2 Force Main Investigation Techniques Force mains are designed to flow under pressure (flowing full), so the investigation and rehabilitation techniques differ from gravity sewers. The investigations may involve a two-step process of desktop analysis, followed by a combination of field investigations. The desktop analysis is used to determine the most likely areas for corrosion or other failure modes. This is performed by examining the profile of the force main and identifying locations where the pipe may be partially full and where turbulence from connecting force mains may release hydrogen sulfide gas. Sources of potential external corrosion are also identified.
Surge modeling can also be performed as part of the desktop analysis to identify the transient pressure surges that may be found in the pipe under certain conditions, such as during a power failure. Severe pressure transients can have an adverse effect on the integrity of the force main and can cause pipe failure. A desktop analysis should include review of previous soil condition studies, investigation of groundwater levels, and investigation of surface conditions.
Following a desktop study, field investigations can be performed using one or a combination of investigative techniques. These techniques vary depending on the size and material of the force main. Investigation techniques can be divided into those that require the force main to be taken out of service and those that can be performed while the force main remains in service. Table 3-1 provides a summary of force main investigation techniques and their applicability. Techniques that require the force main to be taken out of service are briefly described below. In order to take a force main out of service, there either needs to be redundancy (a parallel force main to move the flow) or enough storage available upstream (such as a large wet well in a pump station and/or large interceptor upstream) to allow flows to backup upstream of the pump station and not cause overflows. Otherwise, bypass pumping is required, which is expensive and typically one of the largest costs in force main repair work. Techniques that require the force main to be taken out of service include helium testing, internal visual inspection, and sonar inspection.
Helium Testing. In this investigative technique, the force main is taken out of service, dewatered, and pumped with helium. Helium would escape through any cracks in the pipe. The presence of helium is then monitored on the ground surface along the force main route. Helium testing can be performed on any pipe material.
Internal Visual Inspection. This technique requires the pipe to be dewatered and is applicable to any pipe material. In very large pipelines (48 to 106 inches and up in diameter) a manned inspection can be performed. However, the City’s force mains are all 10 inches or less in diameter. Visual inspection can also be performed with a CCTV camera in a smaller diameter pipe in a similar manner to gravity sewer inspection. The requirement for dewatering makes this method cost prohibitive for most force mains.

Section 3 Condition Assessment
A 3-4
Table 3-1 Summary of Force Main Investigation Techniques
Investigation Techniques Pipe Can Remain in Service?
Applicable for Entire Length of Force Main or Isolated Spot Testing?
Pipe Materials Size
Helium Testing No Entire Length Any Any
Internal Visual Inspection
No Entire Length Any
Large diameter for manned inspection, smaller diameter for
CCTV
Sonar Inspection No Entire Length Any Any
ARV Inspection Yes Spot Testing Any Any
Pressure Testing Yes Entire Length Any Any Transient Pressure Analysis & Surge Modeling Yes Entire Length Any Any
Checking Flow Conservation Yes Entire Length Any Any
Ultrasonic Testing Yes - Excavation Required Spot Testing Ductile & Cast Iron,
PCCP Any
Broadband Electromagnetics (BEM) Yes - Excavation Required Spot Testing Ductile & Cast Iron Any
Taking Coupons Yes - Excavation Required Spot Testing Any Any

Section 3 Condition Assessment
A 3-5
Sonar Inspection. In this technique, a robotic unit inserted into the pipe uses sonar to measure the pipe cross section and determines any deviations from the pipe’s ideal geometry. The sonar can determine the amount of corrosion in the pipe by comparing the measured internal diameter of the pipe to the ideal pipe diameter. A measured diameter greater than the ideal diameter indicates that corrosion is taking place. Sonar inspection can also measure the amount of grease buildup and sediment levels in the force main. The pipe does not have to be dewatered for sonar inspection, but it is typically taken out-of-service. Sonar inspection can be performed on any pipe material.
Investigation techniques that can be performed while the force main remains in service can be further subdivided into those techniques that can be performed without excavation and those that require digging to uncover the force main. Techniques that can be performed while the force main remains in service and that do not require excavation include air release valve (ARV) inspection, pressure testing, transient pressure analysis and surge modeling, and checking flow conservation.
ARV Inspection. If the ARVs are in a manhole then they can be visually inspected for signs of corrosion.
Pressure Testing. This testing method involves pressurizing the pipe and seeing if the pipe can maintain the pressure. If the pipe cannot maintain pressure, this is an indication of a leakage. Although this technique is very common, it can be dangerous to use on pipe that is suspected to be in poor condition, as pressurizing the pipe may cause failure.
Transient Pressure Analysis and Surge Modeling. Transient pressure analysis determines the presence and severity of pressure transients and determines if they adversely affect the condition of the pipeline. This analysis also helps identify how operation of the pump station affects the pressure in the pipeline. This type of testing can also involve installing specialized monitoring equipment in the pipeline to continuously monitor the pressure in the pipe. Surge modeling determines the anticipated and allowable pressures, and testing can determine how actual conditions compare.
Checking Flow Conservation. This involves making sure that the flow pumped by the pump station is the same as the flow exiting the force main. An external magnetic meter can be installed on the end of the force main to monitor the flow. A loss of flow would indicate that the force main has leaks or cracks. This method is dependent on the accuracy of the meter installed and can only identify significant leaks, given that there is always some discrepancy between the meters.
Investigation techniques that can be performed while the force main remains in service but require excavation include ultrasonic testing, broadband electromagnetics, and taking coupons.

Section 3 Condition Assessment
A 3-6
Ultrasonic Testing. This technology involves using an ultrasonic thickness device to determine the thickness of the pipe wall around the circumference of the pipe in ductile iron, cast iron pipe and prestressed concrete cylinder pipe (PCCP). A trench is excavated so that the ultrasonic device can be applied around the force main. This testing may also be performed at locations where the pipe is already exposed such as an ARV manhole. Any exterior pipe coatings are removed before the device is applied. A coupon of the force main is taken to calibrate the ultrasonic testing device. The disadvantage of ultrasound is that the readings are taken at isolated points, as opposed to a full pipe scan.
Broadband Electromagnetics (BEM). BEM uses a range of electromagnetic frequencies to detect a variety of thicknesses in ductile iron and cast iron pipe. The main benefit of BEM is that it can survey very accurately through ferrous pipe coatings and linings. BEM is able to scan the entire exposed section of pipe for a full picture of pipe condition (loss of metal, cracks, etc.)—not just a number of isolated points. A combination of investigation pits and keyhole excavations may be used in conjunction with an available tool for remotely working down keyhole excavations to scan the upper part of the exposed pipe in the keyhole.
Taking Coupons. Coupons can be taken from selected locations to determine the amount of internal or external corrosion in any pipe material. The disadvantage of taking coupons is that it provides information only at the location where the coupon was taken and, often, corrosion is not uniform.
3.1.3 Pump Station Investigation Pump station condition assessment differs from pipeline condition assessment because the assets are above ground and the inspection can be performed easily on a regular basis. Additionally, preventive maintenance is routinely performed to keep the stations in good working order and prevent failure. Currently, the City conducts daily visits to pump stations as part of their preventive maintenance program.
For those pump stations identified in the high priority categories, a more detailed evaluation is necessary to determine the extent of the specific condition issues and the recommended course of action to rehabilitate the station. This may include drawdown tests; electrical, instrumentation and control inspection; detailed mechanical or structural inspections; or odor monitoring.
Ultrasonic Testing
Ductile iron pipe coupons

Section 3 Condition Assessment
A 3-7
3.1.4 Developing Structural Condition Ratings Once condition information is collected, it should be analyzed in an objective manner so that a structural condition rating can be applied to the asset. The ratings should be applied on a scale of 1 to 5, with 1 indicating the best structural condition and 5 indicating the worst structural condition.
NASSCO has developed a standardized Pipeline Assessment & Certification Program (PACP)© for coding defects identified by CCTV inspection of gravity sewers. This standard is widely used throughout the industry. The PACP ratings can be useful to the City when reviewing CCTV data to evaluate and distinguish the condition of gravity sewer pipes.
Table 3-2 provides a suggested guideline for assigning structural condition ratings with example criteria for gravity sewer, force mains, and pump stations.
Table 3-2 Example of Structural Condition Ratings
Rating Description
1 New or Like-new Condition Gravity Sewer– Newly installed; no significant defects; failure unlikely in the foreseeable
future. Force Main – Newly installed; no corrosion or loss of thickness; failure unlikely in the
foreseeable future. Pump Station – No repairs needed beyond routine maintenance; station is in good working
order; upgrades have just been completed. 2 Good Condition
Gravity Sewer– A few minor defects; no significant deterioration is evident; no significant maintenance issues (roots, debris buildup, etc.).
Force Main – No significant deterioration is evident.
Pump Station – Some repairs may be desirable to improve working order of pump station; repairs are not considered mandatory.
3 Fair Condition Gravity Sewer– A few moderate defects that may affect the operational condition of the
pipe, but do not threaten overall structural integrity of pipe; some maintenance issues (root, debris buildup, etc.).
Force Main – Minor corrosion or loss of thickness that does not affect structural integrity of pipeline.
Pump Station – Some repairs or upgrades are necessary in addition to routine maintenance; repairs do not immediately affect structural integrity of pump station.
4 Poor Condition Gravity Sewer– Several moderate to severe defects that affect the operational and
structural condition of the pipe; continuous defects along pipeline; significant maintenance issues (roots, debris buildup, etc.).
Force Main – Moderate to severe corrosion or loss of thickness with deterioration likely to continue; deteriorating wire condition in PCCP.
Pump Station – Repairs or upgrades considered mandatory within 5 years to maintain structural integrity and working order of pump station.
5 Very Poor Condition

Section 3 Condition Assessment
A 3-8
Rating Description Gravity Sewer– Severe defects requiring immediate attention; defects structurally affect
greater than 50 percent of pipe length; failure is likely. Force Main – Leaks detected; significant loss of wall thickness or corrosion that affects
the structural integrity of pipeline; failure is likely. Pump Station – Urgent repairs or upgrades needed to maintain structural integrity and
working order of pump station.
3.2 Infiltration/Inflow Condition The infiltration and inflow (I/I) condition of the pipe is related to the amount of I/I that enters the pipe. I/I enters the collection system through gravity sewers. Force mains flow under pressure, therefore, I/I into the pipeline is not typically a concern for force mains. Stormwater inflow can enter from direct sources such as roof downspouts illegally connected to the sanitary sewer, yard and area drains, holes in manhole covers, cross-connections with storm drains, or catch basins. Infiltration of groundwater or stormwater enters the collection system through defective pipes, pipe joints, and manhole walls after percolating through the soil. I/I diminishes the usable capacity of the sewer and indicates structural defects in the sewer.
Reduction of I/I is achieved through a comprehensive rehabilitation approach which addresses each component of the sanitary sewer system including the sewer main, manholes, and service laterals. The following sections discuss techniques for I/I investigation and the development of I/I condition ratings.
3.2.1 I/I Investigation Techniques Some examples of I/I investigation techniques include smoke testing, flow monitoring, and focused electrode leak location. As part of this project, temporary flow monitoring was conducted throughout the collection system from February 15, 2008 through April 25, 2008. The flow monitoring data was analyzed as part of the Sanitary Sewer Modeling and Capacity Evaluation task and the results of the analysis were incorporated into the I/I factor and Areas of concern presented in this report in Section 2.
Smoke Testing. Smoke testing involves blowing a non-toxic, non-staining smoke into the sewer and documenting locations where the smoke appears. Breaks in the sewer or illegal connections such as yard drains allow the smoke to escape.
Flow Monitoring. Flow monitoring involves placing sensors into pipes just upstream of a manhole. The sensors measure depth and velocity, typically in 5 to 30 minute increments, and use this information, along with the sewer diameter, to calculate the rate of flow. Rainfall
Typical Smoke Test

Section 3 Condition Assessment
A 3-9
data is collected in conjunction with flow monitoring data to determine the relationship between rainfall volume and the rainfall-dependent inflow and infiltration (RDI/I) volume into the sewers.
Focused Electrode Leak Location (FELL). Focused electrode leak locators can identify and measure the extent of leaks in gravity sewers made of materials with a high resistance to electric current, such as steel-reinforced concrete, clay, plastic pipe, or metallic pipes lined with nonconductive materials. FELL can be performed in pipes between 3 and 60 inches in diameter. This method plots the flow of current between an electrode placed above ground and an in-pipe radially-focused electrode (sonde) that is pulled through the sewer pipe. The electrode placed at the ground surface detects electric current that flows through the soil via water passing into or out of the pipe at the location of a leak. The current between the sonde and the surface electrode increases as the sonde approaches the leak and reaches a maximum when the sonde is aligned with the leak. Importantly, a leak does not need to be active for the crack to be detected. This method may also potentially detect areas of corrosion where the current may exit the pipe through the thinner material. However, the pipe must be full at the location of the sonde in order to detect leaks.
3.3 Capacity Considerations In determining the overall condition of pipes and pump stations, the existing system capacity should be evaluated as compared to current and predicted future wastewater flows. A pipe or pump station may be in good structural condition with relatively little I/I, but still have inadequate capacity for the existing (or future) wastewater flows. This could result in SSOs and other maintenance issues; and therefore, the pipe or pump station should be high priority for increased capacity or replacement. Also, if additional capacity is needed, the rehabilitation technique to be used will be limited to one that will result in increased capacity: namely, either open-cut replacement or pipe bursting. The capacity evaluation performed for the 15-inch and larger trunk sewers and associated pump stations and force mains is incorporated into this evaluation in Section 5.
3.3.1 Capacity Investigation Techniques For sewers that are part of the primary conveyance system (i.e., trunk sewers, typically those 15-inches in diameter and greater), this capacity evaluation should be conducted using a computer model of the sewer system, which has been calibrated based on recent wastewater flow monitoring data. The capacity analysis should consider available slope, existing wastewater flows (including infiltration and inflow), allocated wastewater flow contributions from permitted development, and other future projected increases in wastewater flows. In some cases, it may be appropriate to perform rehabilitation upstream of the sewer being analyzed as a means of reducing infiltration and inflow so that an increase in pipe diameter is not needed.

Section 3 Condition Assessment
A 3-10
For smaller-diameter collector sewers, a simpler capacity evaluation approach may be used. Because direct-flow monitoring data is typically not available for smaller- diameter sewers, estimates based on the best available knowledge of the area must be used to consider base wastewater flows from residential, commercial, and industrial flows and I/I rates including groundwater infiltration. Allocated capacity from permitted development and other future projected increases in wastewater flows must also be considered in these areas.
As part of the Sanitary Sewer Modeling and Capacity Evaluation, a capacity analysis was performed for the City’s main pump stations, force mains, and gravity sewers 15 inches in diameter and greater. The hydraulic modeling was performed using SewerGEMS software and simulated existing dry- and wet-weather flow conditions, as well as future flow conditions for 10- and 30-year, and buildout scenarios. Capacity limitations in the existing system will be identified and incorporated into the overall system prioritization ratings.

A 4-1
Section 4 Rehabilitation Strategy The system prioritization process discussed in Section 2 set forth guidelines for prioritizing the City’s rehabilitation and replacement projects. Projects identified as needing further field investigation or rehabilitation or replacement are specifically included as part of the CIP in Section 5. However, the City should also implement and ongoing rehabilitation and replacement program with the goal of rehabilitating or replacing a minimum of 1 percent of the sewer annually.
This section further discusses the overall strategy for the City’s sewer system rehabilitation program including prioritization of the system assets, alternatives for implementation and delivery of the rehabilitation and replacement work, methods for managing the rehabilitation and replacement program, and documentation of results of the program.
4.1 Re-prioritizing Based on Capacity Considerations As a first step in rehabilitation of a priority sewer, the existing system capacity should be evaluated as compared to current and predicted future wastewater flows. This step is important prior to designing the rehabilitation of the sewer line because, if additional capacity is needed, this decision should be made prior to expending money on the rehabilitation. Also, if additional capacity is needed, this will limit the rehabilitation technique that may be used to one that will result in increased capacity, namely either an open-cut replacement or pipe bursting. Finally, if a pipe must be replaced or rerouted for additional capacity (i.e. existing pipe removed from service) then the field investigation to verify condition can be removed from the CIP.
For sewers that are part of the primary conveyance system (i.e., trunk sewers greater than 15-inches in diameter) this capacity evaluation should be conducted using a computer model of the sewer system, which has been calibrated based on recent wastewater flow monitoring data. In some cases, it may be appropriate to perform rehabilitation upstream of the sewer being analyzed as a means of reducing infiltration and inflow so that an increase in pipe diameter is not needed. This overall capacity evaluation approach is consistent with the Sewer System Capacity Evaluation performed by CDM and incorporated in Section 5 of this report.
For smaller diameter collector sewers, a simpler capacity evaluation approach may be used. Because direct flow monitoring data is typically not available for smaller diameter sewers, estimates must be used based on the best available knowledge of the area to consider base wastewater flows from residential, commercial, and industrial flows, and infiltration and inflow rates, including groundwater infiltration. Allocated capacity from permitted development and other future projected increases in wastewater flows must also be considered in these areas.

Section 4 Rehabilitation Strategy
A 4-2
If the capacity evaluation reveals that capacity of the existing sewer is sufficient, then all rehabilitation methods discussed in the next section may be considered. If additional capacity is needed, then the evaluation must be limited to only those methods that increase system capacity, namely open-cut and replacement and pipe bursting. When the decision to increase capacity is made, the evaluation should also consider the impacts of increasing flows to downstream sewers, pump stations, and wastewater treatment facilities prior to making a final decision.
4.2 Highest Priority Projects The condition and criticality process was developed as a way to prioritize facilities in the collection system for inspection and repair. Areas selected for immediate inspection are those identified as having the highest probability of failure (suspected worst condition) and highest consequence of failure (most critical).
The priority areas identified in the preliminary findings presented in Section 2 were grouped into projects and are shown in Figure 4-1 as Priority 1 projects. A discussion of each project is presented below. Costs to perform further assessment or rehabilitation of these projects are presented in Section 5
4.2.1 Knights Creek Outfall The Knights Creek outfall runs from the Lakeland pump station downstream to the Mud Creek WPCP and contains approximately 25,200 feet of VCP sewer, 15 to 21 inches in diameter, and 77 manholes. This outfall to the Mud Creek WPCP is critical because it runs through wetlands and close to Knights Creek. It is also critical because, as the only outfall carrying flow from a large area of the city, the consequence of failure is high.
Further investigation via CCTV is recommended to verify the actual structural condition of this outfall. Flow monitoring data shows that the outfall is approximately 40-percent full during average dry-weather flow conditions and approximately 20- to 30-percent full during minimum nighttime flows. Because the pipe is 40-percent full during average dry-weather flows, CDM recommends CCTV inspection at night when the flows, on average, are lower. CDM also recommends that the flows be lowered to around 20 percent through utilization of flow through plug valves and potentially cutting back flows from the Lakeland pump station. This will require coordination with the City and monitoring surcharge levels in upstream manholes.
4.2.2 Withlacoochee Outfall The Withlacoochee outfall flows from the junction of Sugar Creek and Two Mile Branch to the Withlacoochee WPCP and contains approximately 19,000 feet of 42- to 54-inch diameter gravity sewer and 40 manholes. Sections of the outfall cross under standing water, and access to the outfall is difficult. Flow recorded at the Withlacoochee WPCP effluent meter and levels recorded by a temporary meter on the trunk sewer were elevated for 2 weeks following the February 22, 2008 storm event.

75
75
84
221
84
Central
Pl
US Highway 84 W
E Park Ave
US Highway 41 S
S Patterson St
US Highway 84 E
E CentralAve
N Patterson St
SugarCreek
N Valdosta Rd
Ashle
y St
N Ashley St
New Statenville Hwy
Griffin Ave
W CentralAve
KnightsCreek
Bemi
ss Rd
Withlacoochee
Outfall BrownsCanal
W Hill Ave
Two-Mile
Branch
WestDukes Bay
East SugarCreek
Lakeland Hwy
E Hill Ave
SouthDukes Bay
Three-MileBranch
MudCreekMadison Hwy
N St Augustine Rd
One-MileBranch
5B
8C
9A
8E
7B
6C
8B
5D
8A
7C
2B
9B
7A
6A
1D
5A
4A
3B
6B
2C
5C
1B
8D
2A
21
3A4B
20C
20C
20B
14C
1A
12B
19D
4C
10A
20A
16A
14A
15
6D14D
1C
14B13
12A
11 10B
17A
22
19A
18
19B19C
17B
16B16C
16D
16E
SmallCountry
Club
Airport
KnightMill
FoodBank
Hwy 94
Bemiss
BoysClub
HydePark
Hwy 84
SouthForty
RogersStreet
Eastwind
MackDrive Lakeland
BigCountryClub
PonderosaDrive
WithlacoocheeWPCP
Mud CreekWPCP
LegendPump Station
Priority 1Priority 2Priority 3Lower Priority
Force MainPriority 1Priority 2Priority 3Lower Priority
Gravity SewerPriority 1Priority 2Priority 3Lower Priority
Major RoadsInterstatesCounty Bounds
Figure 4-1City of ValdostaSewer Collection SystemSystem Prioritization Projects Not Considering Capacity
0 0.8 1.60.4Approximate scale in miles

Section 4 Rehabilitation Strategy
A 4-4
Flows recorded by meters installed on branch sewers upstream did not show the same elevated flow pattern, suggesting that the flow was coming in through the outfall.
Further investigation is recommended to verify the actual structural condition of this outfall. The flow monitoring data shows that the 42- to 54-inch Withlacoochee outfall is approximately 60-percent full during average dry-weather conditions and over 30-percent full during minimum nighttime conditions. Thus, CDM recommends using multi-sensor robotic investigations such as those available from Red Zone Technologies for pipeline condition assessment of this outfall. Red Zone Robotic technology allows collection of CCTV, sonar, and laser profiling, all, in a single pass.
4.2.3 South Dukes Bay Outfall The South Dukes Bay outfall, beginning at South Patterson Street and ending at the Mud Creek outfall, contains approximately 7,700 feet of 15-inch gravity pipe and 31 manholes. This outfall to the Mud Creek WPCP was identified as an area of concern by City staff members and has a history of SSOs. It is critical because it is a large pipeline along the creek; and a failure of the outfall has a high potential to impact the environment, public, and transportation. Further investigation by CCTV or robotic inspection is recommended to investigate the structural condition of this outfall.
4.2.4 Mud Creek Outfall The Mud Creek outfall from South Dukes Bay Canal to the Mud Creek WPCP contains approximately 11,500 feet of 20- to 24-inch-diameter VCP gravity sewer and 34 manholes. This outfall is critical, because it is a large outfall running through wetlands close to Mud Creek. It is also the only outfall carrying flow from a large area. The City staff identified this outfall as an area of concern due to silt and sand deposition, grease, hydrogen sulfide deterioration and I/I issues. Flow monitoring data indicates that this outfall was surcharged during the February 22, 2008 storm event. Further investigation by CCTV or robotic inspection is recommended to investigate the structural condition of this outfall.
4.2.5 Ponderosa Collection System The Ponderosa lift station collection system contains approximately 11,400 feet of 8-inch-diameter sewer and 42 manholes. This area was identified as a concern by the City staff and has a history of SSOs and maintenance issues. This area was identified as critical because of the density of population that would be affected by an SSO. Further investigation via CCTV is recommended to verify the actual structural condition of this area.
4.2.6 Ponderosa and Big Country Club Lift Stations The Ponderosa Pump Station was constructed in the 1970s and has never been upgraded. Currently, this station experiences excessive runtimes and operational problems especially under wet-weather conditions. The Big Country Club Pump

Section 4 Rehabilitation Strategy
A 4-5
Station is located within the Valdosta Country Club. This pump station was constructed in 1970s and has never been upgraded. Like Ponderosa Drive Pump Station, this station also experiences excessive runtimes and operational problems during the wet-weather periods. Both of these stations are in need of upgrades in the form of new wet wells and pumps sized to convey wet-weather flows resulting from the 2-year design storm, assuming no rehabilitation will be completed in the respective service areas. A capital project is underway for these improvements beginning in March 2009.
4.2.7 Lakeland Pump Station The Lakeland pump station is the largest pump station in the city’s collection system, with a capacity of 1,000 gpm. It re-pumps flow from both the Knights Mill and East Wind pump stations. This station is critical because of the volume of flow it conveys as well as its high potential to impact the environment and transportation should a failure occur. One of suction pipes reportedly has holes that caused air to be trapped and the pump to lose prime. It is recommended that this issue be further investigated and repaired.
4.3 Next Priority Projects Areas selected for the next priority inspection are those projects where the majority of facilities were identified for High Priority Program Rehabilitation the condition/criticality assessment.
These facilities were grouped into projects and are identified as Priority 2 projects on Figure 4-1 and further discussed below. Costs to perform further assessment or rehabilitation of these projects are presented in Section 5.
Immediate Action portion of Mini-basin 5a – The project includes cleaning and CCTV investigation of 11,200 feet of 8-inch diameter pipe and 41 manholes to verify the structural condition collection system.
Mini-basin 14b – The project includes cleaning and CCTV investigation of 25,200 feet of 8-inch diameter pipe and 130 manholes to verify the structural condition collection system.
Mini-basin 7c – The project includes cleaning and CCTV investigation of 43,700 feet of 8-inch diameter pipe and 120 manholes to verify the structural condition collection system.
East Sugar Creek Outfall – The project includes cleaning and CCTV investigation of 3,000 feet of 15-inch diameter pipe and 10 manholes. The purpose of this investigation is to verify the structural condition of the outfall.

Section 4 Rehabilitation Strategy
A 4-6
Sugar Creek Outfall – The project includes cleaning and CCTV investigation of 13,700 feet of 10- to 42-inch diameter pipe and 30 manholes. The purpose of this investigation is to verify the structural condition of the outfall.
Two-Mile Branch Outfall – The project includes cleaning and CCTV investigation of 10,000 feet of 10- to 24-inch diameter pipe and 50 manholes. The purpose of this investigation is to verify the structural condition of the outfall.
Three-Mile Branch Outfall - The project includes cleaning and CCTV investigation of 3,300 feet of 12- to 18-inch diameter pipe and 20 manholes. The purpose of this investigation is to verify the structural condition of the outfall.
One-Mile Branch Outfall – The project includes cleaning and CCTV investigation of 20,000 feet of 15- to 36-inch diameter pipe and 90 manholes. The purpose of this investigation is to verify the structural condition of the outfall.
Browns Canal Outfall – The project includes cleaning and CCTV investigation of 5,200 feet of 15- to 18-inch diameter pipe and 20 manholes. The purpose of this investigation is to verify the structural condition of the outfall.
High Priority Program Rehabilitation portion of Mini-basin 3a – The project includes cleaning and CCTV investigation of 26,600 feet of 8- to 12-inch diameter pipe and 90 manholes to verify the structural condition collection system.
High Priority Program Rehabilitation portion of Mini-basin 19b – The project includes cleaning and CCTV investigation of 18,300 feet of 8- to 12-inch diameter pipe and 100 manholes to verify the structural condition collection system.
High Priority Program Rehabilitation portion of Mini-basin 9b – The project includes cleaning and CCTV investigation of 19,300 feet of 8- to 12-inch diameter pipe and 90 manholes to verify the structural condition collection system.
Mack Drive Pump Station– This project includes the structural and electrical assessment of the current pump station to determine if rehabilitation is needed to be able to handle any future flows and modifications.
Rogers Street Pump Station– This project includes the structural and electrical assessment of the current pump station to determine if rehabilitation is needed to be able to handle any future flows and modifications.
Eastwind Pump Station– This project includes the structural and electrical assessment of the current pump station to determine if rehabilitation is needed to be able to handle any future flows and modifications.
Eastwind Force Main– This project includes ultrasonic thickness testing and coupon extraction along high risk portions of the Eastwind Force main.

Section 4 Rehabilitation Strategy
A 4-7
Bemiss Force Main– This project includes ultrasonic thickness testing and coupon extraction along high risk portions of the Bemiss Force Main.
4.4 Remaining Field Investigation Prioritization Priority 3 projects were identified for those facilities denoted frequent assessment or frequent assessment mixed with some high priority program rehab. Priority 3 projects are listed in Table 4-1 and shown on Figure 4-1. The remaining areas are lower priority projects. Only Priority 1 or 2 projects are described in more detail and assigned costs for further assessment or rehabilitation. Table 4-2 describes those projects ranked lower than Priority 3.
Table 4-1 Priority 3 Projects
Project Area(1) Length of Project (ft)
West Dukes Bay Outfall 14,900
Part of Mini-basin 1D 10,200
Mini-basin 5B 13,300
Mini-basin 5C 12,900
Mini-basin 10B 17,100
Part of Mini-basin 15 33,200
Mini-basin 16A 2,900
Mini-basin 16B 9,600
Mini-basin 16D 13,900
Bemiss Pump Station n/a
Boys Club Pump Station n/a
South Forty Pump Station n/a
Hyde Park Pump Station n/a
Highway 84 Pump Station n/a
1 As noted in Figure 4-1, Priority 3 projects are those denoted frequent assessment or frequent assessment mixed with some high priority program rehab. The remaining areas are lower priority projects. Only Priority 1 or 2 projects are described in more detail and assigned costs for further assessment or rehabilitation

Section 4 Rehabilitation Strategy
A 4-8
Table 4-2 Lower Priority Projects
Length of
Project Project Area (ft)
1A 2,900 1B 13,800 1C 83,600 1D 6,700 2A 3,900 2B 7,000 2C 12,700 3A 77,500 3B 37,500 4A 16,000 4B 14,500 4C 19,700 6D 23,900 5A 33,800 5D 79,500 6A 21,400 6B 2,800 6C 7,700 7A 24,700 7B 28,300 8A 2,000 8B 14,800 8C 22,400 8D 16,200 8E 23,300 9A 13,900 9B 18,100
10A 53,500 11 19,900
12A 10,700 12B 17,600 13 42,200
14A 3,400 14C 19,300 14D 13,300 15 71,700
16C 5,100 16E 18,600 17A 8,700 17B 6,700 18 8,400
19A 11,400 19B 36,000 19C 20,400 19D 19,200 20A 11,800 20B 2,700 20C 20,700 21 1,700 22 9,300
Small Country Club Pump Station n/a Knight Mill Pump Station n/a

Section 4 Rehabilitation Strategy
A 4-9
Length of
Project Project Area (ft)
Food Bank Pump Station n/a Airport Pump Station n/a
Highway 94 Pump Station n/a Boys Club Force main n/a
Big Country Club Force main n/a Knight Mill Force main n/a Food Bank Force main n/a South Forty Force main n/a
4.5 Rehabilitation Techniques This section discusses the rehabilitation techniques and evaluation and design criteria for gravity sewers. However, some of the techniques are also applicable to force mains. Force main rehabilitation can be accomplished by pipe bursting, open-cut replacement of the existing pipe, or open-cut installation of a parallel pipe. Rehabilitation of pump stations will be directed at finding the most cost-effective solution to a specific known problem.
The two main types of gravity sewer rehabilitation are the structural rehabilitation approach and comprehensive rehabilitation approach. The structural rehabilitation approach is chosen if the problems are mainly structural or maintenance driven and there is no need to reduce I/I. The structural approach targets repairs or rehabilitation to pipes with known structural problems. The comprehensive rehabilitation approach is aimed at reducing I/I into the sewers in a particular area. A comprehensive rehabilitation project addresses all component of the sanitary sewer system within a service area including the sewer main, manholes, and service laterals.
The following sections outline the rehabilitation techniques and design criteria for pipelines, service laterals, and manholes.
4.5.1 Pipe Replacement Pipe replacement is often the most cost-effective method of rehabilitation where extensive point repairs would be required in order to use an alternative rehabilitation technique. Pipe replacement is required to increase pipe size where additional capacity is needed and may be accomplished using (1) standard open-cut methods or (2) trenchless technology methods, such as pipe bursting. Rehabilitation of force mains is typically accomplished through pipe replacement techniques.
Open-Cut Replacement. Open-cut replacement utilizes the same standard techniques that are used to construct a new sewer line. The replacement sewer may be installed in the same location as the existing pipe or an alternate alignment may be used. Open-cut methods have the advantage of being widely used and well understood by a large number of contractors. This generally results in a reliable final product and in increased bidding competition than may be found with other

Section 4 Rehabilitation Strategy
A 4-10
rehabilitation methods that often require specialty contractors. Major disadvantages to open-cut replacement include (1) the increased noise, dust, and debris of construction, (2) restricted access to homes and businesses, and (3) greater surface disturbance.
Pipe Bursting. Pipe bursting employs a pneumatic, hydraulic, or mechanical wedge that is expanded inside the existing pipe, thereby fracturing it and pushing the pieces into the surrounding soil. The new pipe is jacked into place directly behind the wedge. The new pipe is either high density polyethylene (HDPE) with welded joints or short-jointed and thick-walled with in-wall joints (joint with no bells), which facilitates installation of the new pipe from an existing manhole access. With pipe bursting, the hydraulic wedge is guided by the existing pipe. Therefore, the new pipe will follow the grade of the existing pipe. Existing sewers that are free of sags or other hydraulic problems are most appropriate for this technique. Pipe of the same or greater diameter than the existing pipe may be installed. Prior to pipe bursting, service laterals must be open-excavated and disconnected in order to avoid destroying them with the hydraulic wedge. Depending on the type of pipe bursting technology used, there is also the potential to harm adjacent utilities. Therefore, care must be exercised in equipment selection when other utilities are located near the existing sewer.
4.5.2 Pipe Lining CDM's broad definition of lining includes all rehabilitation techniques where a smaller diameter pipe is inserted, installed, or constructed inside of the existing sewer pipe. A wide variety of techniques fall within this category, and are generally distinguished by the type of liner used. The variations described herein include sliplining, cured-in-place lining, and fold-and-formed lining. These techniques offer the advantage of requiring little or no excavation for installation, and are therefore most suitable for pipes where aboveground obstructions exist or where very deep excavation would be required to replace the existing pipe. Pipe lining also allows minimal disruption to traffic where sewer lines are located within public roads. Sewers must be cleaned and obstructions such as roots or protruding service connections must be removed prior to insertion of the liner. If all obstructions cannot be removed with the conventional cleaning and cutting equipment, then excavation is necessary at those specific locations.
With all lining techniques, the connection of the liner pipe to the manhole is critical. The connection must be sealed with a flexible, watertight joint that allows expansion and contraction of the liner pipe without cracking or spalling. If the manhole connection is not properly made, migration of I/I from defects in the existing pipe to the manhole joint may result.
Sliplining. Sliplining involves inserting a pipe of smaller diameter into the existing pipe, usually from an excavated insertion pit. The liner pipe must be flexible and is commonly made of HDPE, fiberglass, or polyvinyl chloride (PVC). Liner pipe joints

Section 4 Rehabilitation Strategy
A 4-11
are heat fused or gasketed, with heat-fused joints having the advantage of allowing the liner pipe to be closer in diameter to the existing pipe. The liner pipe is inserted by excavating an insertion pit at the center of the length of existing pipe. From this pit, the liner pipe may be inserted in both directions. The liner pipe is typically pulled through the sewer pipe with the assistance of a winch assembly that is installed in the next adjacent manhole. Because pulling the liner pipe often causes it to elongate, the liner pipe must be allowed to contract to its original length before connecting service laterals and sealing manholes. Alternatively, the sliplining can be installed by pushing the liner pipe into the old pipe using a sling or jacking assembly to avoid damage to the liner pipe.
CDM recommends that the void left between the existing pipe and the new pipe is filled with grout. If sliplining is used without filling voids between the liner pipe and the existing pipe with grout, little additional structural benefit is gained from the new liner pipe, and future loading increases to the pipe may result in failure. In addition, the annular space should be grouted in order to ensure the long-term strength of the newly lined pipe. The annular space should be at least two inches (50 mm) in order for grouting to be effective.
Once the sliplining is in place, service connections must be made to the liner pipe. This must be performed by excavating each service connection, breaking through the outside pipe, and then making a connection to the liner pipe using sidewall heat fusion or a tapping saddle.
Cured-In-Place Lining. Cured-in-place (CIP) lining consists of a felt or fabric sock that is impregnated with a resin that becomes rigid once it is thermally activated or cured. The impregnated liner is inserted in the existing pipe by first attaching the liner inside-out at one end of the pipe to be lined, and then feeding the liner through the pipe by inverting it to its original shape. The liner is typically inverted into the existing pipe using water pressure. Once the liner is inserted, it is cured with the use of hot water or air that causes the liner to become rigid. The resulting liner is seamless and jointless. Service connections are made by using a remote cutting device in conjunction with a television camera to remove the liner from the connection. If the existing service connection is defective, then the connection must be excavated and properly repaired. Cured-in-place lining is a relatively quick method of rehabilitation and generally requires only 24 to 48 hours of bypass pumping. Cured-in-place linings can be designed to handle structural loads, if necessary, where the existing pipe has structural defects or where additional loads are expected in the future. CDM typically recommends that CIP lining systems be designed to have the same structural properties as a stand-alone pipe (i.e. assume the host pipe is fully deteriorated).
Fold-and-Formed Lining. Fold-and-formed (FF) lining is similar to sliplining, except that the liner pipe is deformed in some manner to aid insertion into the existing pipe. Depending on the specific manufacturer, the liner pipe may be made of PVC or HDPE. One method of deforming the liner is to fold it into a "U" shape before insertion into the existing pipe. The pipe is then returned to its original

Section 4 Rehabilitation Strategy
A 4-12
circular shape using heated air or water, or using a rounded shaping device or mandrel. Ideally, there will be no void between the existing pipe and the liner pipe after expansion of the liner pipe with the shaping device. For the "U" shape liner, the resulting pipe liner is seamless and jointless.
4.5.3 Evaluation and Design Criteria The approach used to select the appropriate sewer rehabilitation technique includes the following tasks: evaluation of the hydraulic capacity, review structural condition of pipe, identification of point repairs needed for each rehabilitation technique, review of surface conditions, and cost analysis for each rehabilitation technique. For sewer lines to be rehabilitated, the technique or combination of techniques that results in the lowest cost and meets all constructability and performance criteria is selected. The following paragraphs discuss the approach used to review the conditions of the pipe and surrounding area and evaluate the rehabilitation techniques.
4.5.3.1 Hydraulic Capacity The design and selection process begins with an evaluation of the hydraulic capacity of the sewer as discussed in Section 5.2. If the capacity evaluation reveals that capacity of the existing sewer is sufficient, then all rehabilitation methods (pipe replacement or pipe lining) may be considered. If additional capacity is needed, then the evaluation must be limited to only those methods that increase system capacity, namely open-cut and replacement and pipe bursting. When the decision to increase capacity is made, the evaluation should also consider the impacts of increasing flows to downstream sewers, pump stations, and wastewater treatment facilities prior to making a final decision.
4.5.3.2 Structural Conditions The design and selection process should also include a review of all data available on the structural and surface conditions of the existing sewer. Manhole inspection logs and the CCTV inspection tapes and reports are used to identify and tabulate structural defects and their locations. The tabulations are used during the cost-effectiveness analysis of alternative methods and materials. All defects tabulated from the data review are categorized as to the type of defect and its severity in order to determine the locations where point repairs must be made prior to determining the feasibility of each rehabilitation technique. In order to meet all objectives of the rehabilitation program, it is important that both structural defects and maintenance problems are addressed. Table 4-3 summarizes the types of defects that must be repaired prior to using each rehabilitation technique. This table is used in conjunction with unit costs for point repairs to determine the total cost for each rehabilitation technique. It is assumed that point repairs for offset joints include replacement of one pipe length upstream and downstream of the problem area.

Section 4 Rehabilitation Strategy
A 4-13
Table 4-3 Required Point Repairs for Various Rehabilitation Techniques
Rehabilitation Technique Point Repairs
CIP/FF Lining
Offset joints greater than 1-inch
Severely shattered/broken pipe
Severely corroded iron pipe
Sags greater than 1/3 pipe diameter
Saw cutting where hammer taps protrude more than 1-inch
Root cutting, where roots are observed
Sliplining
Offset joints greater than ½-inch
Severely shattered/broken pipe
Sags greater than 1/3 pipe diameter
Saw cutting where hammer taps protrude more than 1-inch
Root cutting, where roots are observed
Pipe Bursting
Sags greater than 1/3 pipe diameter
Service lateral disconnects/reconnects
Ductile iron pipe, depending upon equipment used
Structural Defects. The extent of structural pipe defects, such as cracks, that must be repaired is dependent upon the rehabilitation technique. CDM designs liners for a fully deteriorated pipe condition. This allows a reduction in the number of point repairs for broken pipe that may be required otherwise. Only severely broken pipe with missing or protruding material will be replaced by a point repair prior to lining.
Maintenance Problems. All maintenance problems should be addressed during rehabilitation of an existing sewer. One major source of maintenance is the presence of sags within the existing sewer. CDM recommends point repairs for sags greater than one-third of the pipe diameter prior to pipe rehabilitation. Another major source of maintenance problems is the combination of roots and grease that result in flow stoppages. Rehabilitation methods that result in a jointless pipe provide the advantage of removing potential future entry points of roots. Roots that obstruct the existing sewer must be removed prior to installation of most liner systems. Ultimately, the most effective means of root control is removal of all trees located within the sewer right-of-way.
Joint Alignment. Offset sewer joints can make several rehabilitation techniques ineffective. Offset joints will obstruct installation of a slipliner so even minor offset joints are recommended for repair if sliplining will be used. A CIP lining typically does not require repairing offset joints unless they are severe. Severe offsets may

Section 4 Rehabilitation Strategy
A 4-14
result in sags or other maintenance problems after completion of the rehabilitation. It should be recognized that prior to using these technologies, both CIP lining and FF lining of pipelines will result in a liner that closely conforms to the existing pipeline interior. Offset joints in the host pipe will result in dips and circumferential wrinkles in the liner pipe. At this time, these conditions have not been identified as problem areas within rehabilitated sewers. However, the City should be aware of the appearance of the completed liner pipe.
Lateral Connections. Defective lateral connections are of concern regardless of the rehabilitation technique to be used. For all replacement and lining techniques, the connection of the service lateral to the main must be reinstated regardless of the condition of the lateral. The reinstatement method can include either excavation of a pit to expose the connection point or trenchless techniques that can be performed from within the rehabilitated main. Selection of the reinstatement method depends upon (1) the number and depth of the service connections, (2) surface conditions, (3) type of main rehabilitation or replacement used, and (4) the material of the new pipeline. For pipe replacement methods and sliplining methods, the service laterals must be replaced using open-cut excavations. For both CIP lining and FF lining, it is possible to reinstate the service connections using robotic techniques from within the sewer main. This process typically utilizes a robotic cutter to cut through the liner at the location of the service lateral, followed by a packer to seal the connection between the main liner and the reopened service lateral.
4.5.3.3 Surface Conditions Pavement replacement, site restoration, proximity to stream and creeks, and traffic control requirements directly impact the feasibility of performing a point repair or selecting a rehabilitation technique. Areas where impacts to traffic and existing site conditions are undesirable favor rehabilitation techniques that require minimal excavation and point repairs. Traffic control requirements will be most critical for high traffic areas. These areas may require nighttime work only to minimize disruption to traffic while performing point repairs and service lateral reinstatement.
4.5.4 Service Lateral Rehabilitation Laterals can be rehabilitated using the same methods available for sewer mains: replacement and lining. CDM recommends excavation and replacement of service laterals up to the property line to accomplish significant reduction of infiltration and inflow in a sewer system. This includes excavation of the service lateral and reconnection of the lateral to the newly lined or replaced sewer main using a saddle-type connection. A clean-out should be installed if one does not already exist.
4.5.5 Manhole Rehabilitation The same two approaches of replacement and lining may be used to rehabilitate existing sewer manholes. The appropriate rehabilitation technique is selected based upon manhole inspection reports. In general, all manholes that have been identified as having severe structural and/or safety problems should be considered for

Section 4 Rehabilitation Strategy
A 4-15
replacement or rehabilitation. Where defects are major or the existing manhole is in danger of collapse, it should be replaced with a new structure. Otherwise, the manhole should be rehabilitated using a cementitious or CIP liner system.
Cementitious liners have been shown to be a cost-effective means of improving minor structural problems when sufficient liner thickness is applied. This is especially true in the upper reaches of the collection system where the sewage is still relatively fresh (i.e. not septic) and the sewer atmosphere is less corrosive. In downstream reaches where the sewage is more likely to be septic and oxygen levels in the sewer atmosphere have been depleted, other more corrosion resistant techniques should be considered. For manholes over eight feet in depth, a corrosion resistant CIP liner is recommended.
4.5.5.1 Manhole Replacement It is often most cost-effective simply to replace a manhole when it has become structurally unsound. No point repairs are required when the existing manhole is excavated, demolished and a new manhole is constructed. Manhole construction has the advantage of being widely performed and well understood by a large number of contractors. This generally results in a reliable final product and in greater bidding competition than may be found with other rehabilitation methods that often require specialty contractors. The major disadvantage to manhole replacement is that it may disrupt traffic and restrict access to homes and offices.
4.5.5.2 Alternative Manhole Rehabilitation Techniques Numerous alternative manhole rehabilitation technologies currently exist which utilize a variety of materials and construction methods. The majority of these technologies is proprietary and provides corrosion resistance. A major advantage of these approaches is that they do not require excavation and can be performed relatively quickly. The following sections briefly describe the alternative manhole rehabilitation techniques.
Coatings or Monolithic Linings. Monolithic lining involves application of a coating to the interior of the manhole to seal out infiltration, restore structural integrity, and prevent corrosion. Coatings are generally cementitious (e.g., Strong Seal, Permacast, etc.), or epoxy (e.g., Aquatapoxy, Raven, etc.) and are applied in two layers of contrasting color. Cementitious liners are generally cheaper than epoxy. Depending on the severity of the deterioration, the thickness of the coating can be varied. The most important aspect of applying coatings is surface preparation. Proper surface preparation is essential to creating a bond between the manhole and the coating.
Manhole lining to seal out RDI/I involves several different steps. One of the most important steps is to remove the deteriorated materials from the manhole. This can be accomplished by water or sand blasting or use of mechanical tools. The next step is to stabilize the remaining sound inner wall surface of the manhole using

Section 4 Rehabilitation Strategy
A 4-16
preparations designed for this purpose. This should be done regardless of the manhole material. Any surface defects such as missing bricks or damaged concrete should be patched with a high strength, quick setting grout. A lining or coating system is applied to complete the renewal.
The advantage of manhole repair over replacement is that interference with traffic, utilities, and sewer service is minimized. Disadvantages to structural rehabilitation are that the labor cost involved in cleaning, repairing, and coating is often greater than a new manhole. Also coating systems such as epoxies, silicones, coal tar, or urethane, if applied to the interior, are subject to peeling caused by hydrostatic pressure from groundwater. Any deficiencies in the coating are subject to corrosion and actually concentrate the corrosion to the deficient area.
Coatings may be applied on the outside but the required excavation makes this more costly. Finally, coatings, because they are not of great thickness, wear out and reapplication is required on a periodic basis. If the quality of work is good and the proper materials are used, a satisfactory service life could be expected. In some situations though, where structural rehabilitation is not practical, replacement or repair of the base and replacement of the barrel may be the best alternative.
Structural Repair Liners. Manholes may also be rehabilitated by lining with a corrosion resistant liner. This lining can be done with sliplining of HDPE material or by an in-situ process. A properly installed slip-liner that is well sealed at the joints will eliminate infiltration and can be designed to handle structural loads. Grouting of the annular space between the liner and the inside of the manhole is recommended to eliminate infiltration into the void space that can promote leaks, cause uneven hydrostatic pressure and damage the liner.
In-situ lining of manholes uses the same materials as the inversion or CIP lining of sewers. It is an excellent process because it tightly seals the manhole and can be designed for structural loads. A liner of fiberglass or felt is impregnated with a resin and the liner is then expanded to conform to the existing manhole. Liners of this type have benefits similar to the monolithic coating. Surface preparation is less critical although is still important. The major disadvantage of this lining system is cost. The process is proprietary and the installation is rarely cost-effective unless replacement is not feasible.
Other types of structural repair type liners include poured-in-place concrete (Monoform), PVC rib liner, fiberglass-reinforced plastic, and spiral wound liners.
4.5.5.3 Manhole Point Repairs Point repairs may also be necessary to provide sound rehabilitation of an existing manhole. Some point repairs necessarily include others. For example, raising the rim elevation of a manhole requires the reconstruction of the chimney, adding a concrete

Section 4 Rehabilitation Strategy
A 4-17
or brick collar and resetting the frame and cover. The following sections describe the various types of point repairs for manholes.
Reset/Replace Frame and Cover. A common problem with manhole frames and covers is the entry of surface water. Surface water enters through holes in the lid, spaces between the frame and cover, and under the frame if it is poorly sealed. Deteriorated manhole frame and grade joints can be a significant source of inflow. Damage to the seals is quite often caused by heavy traffic, roadwork, and freeze-thaw cycles. Surface inflow can be especially high if the manhole is subject to ponding. If a manhole frame is in good condition and is properly graded, but is poorly sealed to the manhole, the frame can be regrouted. An alternative to grout that may be desirable in high-traffic areas is some type of commercially available flexible seal that will not crack. Additionally, internal flexible chimney seals may be recommended. If the manhole is subject to ponding then regrading is in order. Replacement of lids with holes or poor fitting lids will minimize inflow. An advantage of these methods is that none require the expense and inconvenience of excavation.
Rebuild Chimney or Cone (Corbel). When a manhole is observed to be below grade in a traffic area and the road surface around the manhole is in poor condition, the cone (precast concrete) or brick corbel may be damaged and structurally unsound. A solution is to excavate down to the manhole walls or barrel, remove the old corbel or cone and replace with a pre-cast cone. Alternatively, the manhole may be structurally sound but due to other factors such as paving or landscaping be below grade and require limited reconstruction to raise the manhole rim elevation. In this case the rim is removed and a concrete or brick collar is added and the rim is reinstalled. Raising manhole rim elevations flush with existing grade provides two benefits; it reduces the volume and potential frequency of surface inflow, and reduces the potential frequency of (SSOs).
Cement Grouting of Walls, Bench, Pipe Connections and Channel. Cement grouting should not be considered where a structural solution is needed. However, cement grouting is a feasible non-structural solution because it (1) causes minimal traffic disruption if installed from the interior of the manhole, (2) does not interfere with other utilities, (3) is seldom affected by wastewater flows, and (4) requires no surface restoration work. The process is relatively inexpensive, but has a limited life span. Cement grouts can be installed from either the interior or exterior of the manhole. For interior application a cement grout mixture is pressure injected through a hole that is drilled in the manhole sidewall. In grouting of the exterior of the manhole, the area around the manhole is excavated and grout applied to the damaged area. Grouting from the interior does not ensure even distribution of the grout outside the manhole. When this technique is utilized, the area immediately around the crack is sealed, apparently stopping the leak. However, the entire damaged area may not be repaired, and the leak may migrate to another location. Grouting the exterior of a manhole requires excavation of the impacted area. Again, if only one area is grouted, the leak may migrate to another area. In order to

Section 4 Rehabilitation Strategy
A 4-18
completely seal the manhole, the entire outside should be excavated and grout applied. Since the labor involved to excavate and seal the manhole is often greater than a new manhole, and the grouted manhole may still have areas of leakage or weakness, complete replacement is often preferred.
4.5.5.4 Acceptance Standards Regardless of the manhole rehabilitation method selected, each manhole shall have all work performed that is necessary to meet the following minimum acceptance standards:
The manhole shall pass a vacuum test. The vacuum test consists of plugging the entrance pipes to the manhole and any services and drawing a vacuum of approximately 10 inches of Mercury (Hg) and measuring the leakage rate.
The manhole frame and cover shall not be depressed below the adjoining street or ground surface if subject to ponding or has surface water flow across the manhole.
Both the frame and cover shall be in good, sound condition with no visible cracks or signs of corrosion. The cover shall properly seat into the frame so that there is no rocking.
The manhole cover shall be nearly watertight, having no open vent holes that allow inflow except pick holes per construction standards.
There shall be no visible openings, cracks, or deteriorated joints in the manhole.
The concrete manhole base shall be structurally sound with no cracks or voids.
The invert channel shall be smooth with proper transition between different size pipes and adequately smooth bends. The channel width and height shall be a minimum of the largest pipes inside diameter.
The ledge above the invert shall be sloped such that there is no ponding.
Pipes connected to the manhole shall have no signs of voids or deterioration at the connection and shall show no signs of infiltration.
Abandoned connections to manholes shall have adequate plugs to prevent leaks.
4.6 Alternative Delivery Methods Project delivery is the contractual mechanism for implementing a construction project. The delivery method selected will define the legal, contractual, and administrative relationship among all project team members, and will define the roles of the owner, designer, and builder. Many owners today are considering alternative forms of project delivery to expedite project schedules, reduce costs, and simplify the design and construction process. Often, alternative delivery results in more innovative

Section 4 Rehabilitation Strategy
A 4-19
solutions, as individuals typically not involved in the project until construction or operation phases play an integral role in design. This helps focus solutions early, and many times results in project-specific answers that may not have been considered otherwise. As you are aware, the City and CDM have performed work as alternative delivery (water treatment plant) and have been successful. CDM recommends the City explore alternative delivery methods when implementing the rehabilitation strategy. There are several options for alternative delivery discussed in this section including retainer contracts, annual rehabilitation contracts, and construction management at-risk.
Retainer Contracts Retainer contracts include bidding a specific project but including a retainer clause to allow the contractor to continue to perform additional work based on these same bid items. In this manner, if the City is happy with the contractor’s performance and the unit prices are good, they can continue their relationship with additional projects. These contracts are typically used for cured-in-place lining, pipe bursting, point repairs, and manhole rehabilitation. The City of Greensboro, North Carolina has successfully used this approach in their sewer rehabilitation program. An example of a retainer they are using from a 2003 project bid is as follows:
The City at its’ option reserves the right to extend this Contract as a “Unit Price Contract” for a period of twelve (12) months from the award date. The Contractor specifically agrees to accept additional quantities over and above those specified in the original contract. The City further reserves the right to extend the term of the contract for additional twelve (12) month increments, not to exceed three (3) extensions in aggregate at the following contract prices and terms.:
07/01/2004 through 06/30/2005 not to exceed ___2___% increase over original contract prices.
07/01/2005 through 06/30/2006 not to exceed ___4___% increase over original contract prices.
07/01/2006 through 07/30/2007 not to exceed ___6___% increase over original contract prices.
Contracting time will ultimately be calculated based on months of actual work. The City reserves the right to start and stop the contract with 30 days notice. No payment will be made for mobilization or de-mobilization. Furthermore, the City reserves the right to decrease or terminate any part of this Contract if it exceeds established funding, or if it is the best interest of the City to do so.
As seen above, this retainer is based on actual months of work as opposed to calendar months so the contract can be closed down and re-opened without losing time. The City also specified the increase as opposed to letting contractors specify the future increases so they could compare “apples to apples” at bid opening. In addition,

Section 4 Rehabilitation Strategy
A 4-20
although the contract states the City has the right to extend, the City explains that if the contractor does not want to extend the contract they are unlikely to force them as the whole purpose is to be more efficient due to a partnering concept that would not work well in an adversarial relationship. It is advisable to pre-qualify contractors using specific experience requirements for both the company and the superintendent.
Annual Rehabilitation Contracts Annual rehabilitation contracts are similar to retainer contracts in that a project is bid using a unit price contract with some idea of location and type of rehabilitation. The Owner can easily alter location and quantities throughout the period of the contract if other higher priority sewers are found and can renew the contract up to a certain time limit.
Fairfax County Virginia has used this alternative delivery method to perform extensive cured-in place pipe (CIPP) lining in their system for several years. Fairfax pre-qualifies bidders based on experience requirements for both the company and the superintendent. The County does reserve the right to add or delete similar items or services based on mutual agreement and negotiated prices. The County typically has one contract for small diameter rehabilitation and one contract for large diameter rehabilitation.
The main caution to using this process is that many utilities do not perform design for these projects but leave it up to the contractor to provide an engineer’s stamp on the design. This process could open the City up to design problems with no recourse. CDM advises the City have a separate contract for the design of the rehabilitation even if the contractor claims they will provide this service.
Construction Management (CM) -At-Risk In CM-at-Risk, the owner holds one contract with the designer/construction manager. This is the type of contract that the City and CDM entered into on the WTP expansion. The design will be fully developed and the CM-at-risk contractor will be the single point of responsibility for construction, typically subcontracting portions of the work as individual bid packages and self-performing some of the work.
The CM-at-risk contractor is typically selected based on qualifications. The CM-at-risk firm provides constructability review and input during design, then negotiates with the Owner a guaranteed maximum price (GMP) for construction and prepares distinct bid packages for subcontracting. The CM-at-risk firm and Owner may share cost savings achieved below the GMP.
CM-at-risk gives the ability to fast track projects by using discrete bid packages and procuring long lead equipment early and includes contractor involvement in design reducing design and construction disconnects.

Section 4 Rehabilitation Strategy
A 4-21
4.7 Management of Program A key component of implementing the City’s sewer system rehabilitation program will be proper management of key elements of the program. Table 4-4 describes these key elements and tasks that would be included in the responsibilities of a program management team. The program management team may be composed of either in-house staff, outside consultants, or a combination of the two; however, communications and regular coordination between team members will be critical to the successful implementation of the program.
The City will receive a number of benefits of using a formal program management approach including better coordination of the program with other City efforts, more efficient use of budgeted monies to achieve program objectives, better documentation of program benefits and results, and better understanding of customers and key officials of the program objectives and benefits.
4.8 Documenting Results The final key aspect of the rehabilitation strategy is the documentation of results. Documenting the benefits of rehabilitation and estimating the financial return on the investment will allow the City to justify the continued investment in the annual rehabilitation program. Documenting results includes the following tasks:
Manage and oversee post rehabilitation assessments to document project results;
Review and analyze post-rehabilitation flow monitoring and/or pump station run time data to estimate infiltration and inflow reduction benefits of project;
Identify maintenance reduction benefits from rehabilitation; and
Predict benefits related to risk reduction from project.

Section 4 Rehabilitation Strategy
A 4-22
Table 4-4 Sewer System Rehabilitation Program Management Tasks and Responsibilities
Task 1 – Manage Program Budget, Schedule, Communications, and Work Processes
Develop and maintain master program budget and schedule
Develop and update individual project cost estimates and schedules
Assist in managing rehabilitation program financing and budgets
Coordinate rehabilitation project schedules with other public works project schedules
Coordinate regular program meetings and provide monthly program summary and status reports
Develop, implement, and maintain a document control system
Task 2 – Select, Manage, and Oversee Field Condition Assessment Contractors
Develop requests for proposals and manage selection process for field services contractors
Develop standard specifications for field services including cleaning, CCTV, smoke testing, dye testing, surveying, ultrasonic investigations, and other condition assessment contractors
Manage field services procurement and invoicing, including monitoring quantities of work and quality of deliverables
Review, manage and store data collected by condition assessment contractors
Provide training and certification as needed to staff and contractors in pipe assessment certification program (PACP) standards
Task 3 – Update Rehabilitation Priorities and Asset Condition/Criticality Ratings
Use information obtained from condition assessment contractors to update condition ratings
Update GIS to reflect latest information and condition/criticality ratings
Revise and update rehabilitation program priorities based on revised condition/criticality ratings
Task 4 – Develop, Maintain, and Update Flow Projections and System Capacity Needs
Develop, update, and maintain wastewater flows projections for the service area
Develop and maintain a hydraulic model of the sewer system
Use wastewater flow projections with system hydraulic model to identify current capacity problems and project future capacity needs
Section 4 Rehabilitation Strategy
A 4-23
Task 5 – Coordinate Public Information and Public Relations Activities Related to Program
Coordinate public information activities on program objectives via web site, program hotline, brochures, and news releases
Hold public meetings in rehabilitation project areas to inform neighborhoods and business of pending construction work
Manage and respond to customer complaints and concerns identified during construction
Assist in providing messages conveying the benefits of the rehabilitation program in terms of improved customer service and environmental protection
Task 6 – Manage and Oversee Rehabilitation Design Engineers
Develop design and construction standards
Develop individual design and construction packages
Manage design of rehabilitation program and review reports and documents prepared by design engineers.
Conduct peer reviews, technical reviews, and constructability reviews as appropriate
Assist in bidding and awarding contracts
Task 7 – Coordinate Easements, Encroachments, Permits, & Utilities Locations
Coordinate easement and property acquisition as needed for rehabilitation projects
Coordinate securing encroachments as needed from railroads, Department of Transportation, and other property owners
Coordinate local and state permits needed for rehabilitation projects
Coordinate identification and location of utilities (gas, water, power, communications, etc.) for their protection and/or relocation as needed for the rehabilitation projects
Task 8 – Coordinate and Provide QA/QC Controls for Rehabilitation Construction
Develop quality assurance and quality control standards, protocols, and specifications to be used in condition assessment and rehabilitation projects
Review construction quality assurance and quality control data for compliance with specifications
Update GIS and/or work order management database(s) to reflect condition and rehabilitation information
Review and coordinate construction change orders and final close-out documents
A 5-1
Section 5 Capital Improvements Program 5.1 Condition Assessment High Priority Project Costs This section of the report outlines the recommended capital improvements program that the City of Valdosta should institute to meet the overall performance and level of service objectives set for the sanitary sewer system. The recommended capital improvements program has been developed based on the results of the risk analysis (condition and criticality ratings) that were developed within this report as well as the capacity analysis that is presented under a separate cover. Project priorities must be closely integrated between these two approaches in order to provide the most beneficial results for the city’s investment in this program.
As part of the capital improvements program, a number of high priority projects are identified that the city should initiate immediately. As a first step, however, it is recommended that field condition assessment be conducted. Field condition assessment data is required as the next step in the rehabilitation program for two reasons: 1) to verify the suspected poor condition of sewers, manholes, and force mains and 2) to provide the data required for rehabilitation design. Because the poor condition ratings for the outfalls and force mains were developed from surrogate condition factors, it is possible that the actual condition could be better or worse for all or portions of these projects. If the field data changes the condition rating, then the projects will be re-prioritized.
Because the extent of rehabilitation is uncertain until the field work is performed, individual project costs were only developed for condition assessment. A separate CIP project allocation for annual rehabilitation is included in the recommended CIP budget from which the funds can be drawn to rehabilitate the priority projects. The condition assessment cost estimates were developed based on the following assumptions:
CCTV inspection and manhole inspection was assumed for all gravity sewers (except portions of Withlacoochee discussed below). The unit costs to clean and CCTV the sewer range from $2/ft to $4/ft depending on diameter. Manhole inspection was assumed to be $200/manhole. Engineering analysis costs including tape review, defect tabulation, cost analysis, recommendations, report, and meetings were also included at a unit cost of approximately $50,500 per project plus $0.70/ft. This assumes projects are performed separately. There may be some cost savings if multiple projects were performed at once.
For the 54-inch portion of the Withlacoochee Outfall, inspection using Red Zone Robotic technologies instead of traditional CCTV was recommended as discussed in Section 4. The cost for this is estimated at $12 per foot.

Section 5 Capital Improvements Program
A 5-2
The force mains are all small diameter ductile iron; therefore ultrasonic thickness testing and coupon extraction is recommended at key locations (such as high points in the pipeline where hydrogen sulfide gas could accumulate) where corrosion would be suspected. Cost estimates assume between 3 and 8 test pits per force main depending on the length of the force main and include excavation, ultrasonic testing, one coupon per force main, and engineering analysis. Costs ranged from $80,000 to $200,000 per force main.
Site visits to the pump station were performed in June 2007 to verify existing data and gather any missing information. The primary pump stations in need of evaluation are the Lakeland, Mack Drive, Rogers Street and Eastwind Pump Stations. To evaluate each pump station, it is recommended that the evaluation include a structural assessment to determine whether the existing wet well/pump building can be reused or if a completely new station needs to be constructed. It is also recommended to include an electrical assessment to determine if the current electrical arrangement would be sufficient for renovated stations. The engineering costs for the pump station evaluations are expected to be $7,500 per station to conduct the evaluation.
The projects presented in this section include only condition assessment projects identified as Priority 1 or Priority 2 from the condition and criticality assessment. These projects are described in detail in Sections 4.2 and 4.3 of this report. Table 5-1, which lists the projects and cost estimates, can be used as a reference and tool for adjusting priorities as more field data is collected. Some of these investigations may turn into high priority rehabilitation projects and some may be lower priority or no need for rehabilitation until further in the future. Capacity considerations and implementation schedule are discussed in the next sections.
5.2 Capital Improvements Plan The condition assessment projects were combined with capacity evaluation projects to create a combined, phased CIP. Gravity sewers, force mains, or pump stations that required both capacity improvements and potential structural improvements were integrated. The phasing of the capacity projects was considered, as well as the recommended improvement method. For example, since the recommendation for the South Dukes Bay Outfall is replacement and potential re-routing then the condition assessment project for South Dukes Bay was eliminated because the existing pipe is expected to be abandoned.
Table 5-2 presents the 30-year CIP with condition projects highlighted in blue. The 30-year CIP is divided into six 5-year phases: 2009 to 2013, 2014 to 2018, 2019 to 2023, 2024 to 2028, 2029 to 2033 and 2034 to 2038. Table 5-3 presents a more detailed implementation schedule for the Phase 1 CIP projects (2009-2013). Detailed descriptions of the capacity projects, their phasing, and cost estimates are included in the Sanitary Sewer Modeling and Capacity Evaluation Report (February 2009).

Knights Creek Outfall 1 32,529 15 to 21-inch $187,300Mud Creek Outfall 1 27,002 15 to 24-inch $159,900
South Dukes Bay Outfall 1 8,265 15-inch $84,500Withlacoochee Outfall 1 25,175 18 to 54-inch $330,700
Immediate Action portion of Mini-basin 5A 1 11,248 8-inch $89,500Lakeland PS (3) 1 n/a n/a $7,500
Ponderosa Drive PS 1 n/a n/a $150,000Big Country Club PS 1 n/a n/a $800,000
Mini-basin14B 2 25,185 8-inch $148,300Mini-basin 7C 2 43,747 8-inch $201,400
High Priority Program Rehabilitation portion of Mini-basin 5A 2 30,744 8 to 12-inch $159,100
East Sugar Creek Outfall 2 2,984 15-inch $62,800Sugar Creek Outfall 2 13,658 10 to 42-inch $107,800
Two-Mile Branch Outfall 2 10,018 15 to 24-inch $92,400Three-Mile Branch Outfall 2 3,336 12 to 18-inch $66,400One-Mile Branch Outfall 2 19,633 15 to 36-inch $143,500
Browns Canal Outfall 2 5,224 15 to 18-inch $73,500High Priority Program Rehabilitation portion of
Mini-basin 3A 2 26,562 8 to 12-inch $141,600High Priority Program Rehabilitation portion of
Mini-basin 19B 2 18,893 8 to 15-inch $126,700
High Priority Program Rehabilitation portion of Mini-basin 9B 2 19,327 8 to 12-inch $126,300
Mack Drive PS (3) 2 n/a n/a $7,500Rogers Street PS (3) 2 n/a n/a $7,500
Eastwind PS (3) 2 n/a n/a $7,500Rogers Street Forcemain 2 1,730 6-inch $100,000
Mack Drive Forcemain 2 2,650 8-inch $120,000Ponderosa Drive Forcemain 2 890 4-inch $80,000
Eastwind Forcemain 2 1,780 4-inch $100,000Bemiss Forcemain 2 13,785 8-inch $200,000
Table 5-1: Summary of Estimated Condition Assessment Costs for Priority 1 & 2 Projects
Priority (1) Length of Project (ft)
Approximate Diameters
Estimated Cost For Condition Assessment
Projects (2)Project Area
(1) Priority 1 projects are those denoted immediate action projects based on the condition/criticality assessment. Priority 2 projects are those denoted "High Priority Program Rehabilitation" based on the condition/criticality assessment. As noted in Section 4.4, Priority 3 projects are those denoted frequent assessment or frequent assessment mixed with some high priority program rehab. The remaining areas are lower priority projects. Only Priority 1 and 2 projects are described in this section and assigned individual projects costs for further assessment.
(2) Costs are for additional assessment including engineering analysis. Costs assume projects will be performed separately. There may be some cost savings if multiple projects were performed at once. Costs assume CCTV and manhole inspection of all gravity sewers except portions of the Withlacoochee Outfall where RedZone technology is required. Forcemain costs assume ultrasonic thickness testing and coupon extraction.
(3) Pump station assessment only includes site visit and general evaluation by structural and electrical engineer. Costs for Design efforts and reports are not included.
A

Table 5-2: Capital Improvement Plans Implementation Schedule
Phase I Phase II Phase III Phase IV Phase V Phase VI2009-2013 2014-2018 2019-2023 2024-2028 2029-2033 2034-2038
W-1 Withlacoochee WPCP Storage - Install a 5 MG storage tank at the Withlacoochee WPCP. This project includes a pump station sized to handle the wet-weather flows. 6,000,000$ 6,000,000$
W-2 Collector PS Upgrade - Upgrade Big Country Club PS to convey a peak 1-hour flow of 1.64 mgd 800,000$ 800,000$ W-3 Collector PS Upgrade - Upgrade Ponderosa PS to convey a peak 1-hour flow of 0.25 mgd. 150,000$ 150,000$
W-4 Lower Withlacoochee Pump Station & Force Main - Install 21.4 mgd pump station to convey flow from the lower Withlacoochee basin to the WPCP. Install 18,200 LF of 36-inch force main from the old Sugar Creek WPCP to the Withlacoochee WPCP. 21,200,000$ 21,200,000$
MC-1 Condition Assessment of Mud Creek Outfall - CCTV & Manhole Inspection of 7,000 feet 15-inch to 24-inch of pipe. 160,000$ 160,000$ MC-2 Condition Assessment of Knights Creek Outfall - CCTV & Manhole Inspection of 32,500 feet of 15-inch to 21-inch pipe. 188,000$ 188,000$ W-5 Condition Assessment of Withlacoochee Outfall - CCTV, Manhole Inspection and use of RedZone Technology on 25,175 feet of 18-inch to 54-inch pipe 330,000$ 330,000$
W-29 Condition Assessment of a portion of Mini-basin 5A - 11,250 feet of 8-inch pipe 90,000$ 90,000$ MC-4 Structural Evaluation of Lakeland PS 7,500$ 7,500$ MC-5 New South Dukes Bay - Install 1,100 LF of 15-inch Pipe from Gil Harbin Industrial Boulevard to the Mud Creek Interceptor 360,000$ 360,000$ MC-6 Inner Perimeter Road Gravity Sewer Pipe - Install 15,200 LF of 21-inch gravity sewer pipe along Inner Perimeter Road 12,740,000$ 12,740,000$
MC-7 Lakeland Lift Station and Force Main - Installation of new pumps in existing wet well to convey 3.2 mgd and 7,700 LF of 16-inch force main to Inner Perimeter Road 4,380,000$ 4,380,000$
W-6 Collector PS Upgrade - Upgrade Mack Drive PS to convey a peak 1-hour flow of 0.47 mgd 230,000$ 230,000$ W-7 West Dukes Bay Pipe Replacement - Upsize 500 LF of 18-inch pipe to 30-inch pipe at the West Dukes Canal and Browns Canal Junction. 220,000$ 220,000$
MC-8 New Lower Knights Creek Outfall - Installation of 4,000 LF of 24-inch pipe and 2,000 LF of 36-inch pipe 4,440,000$ 4,440,000$ W-8 Sugar Creek Replacement - 1,000 LF of pipe upsized from 30” to 36” from Edgewood Street to the Sugar Creek Outfall. 310,000$ 310,000$ W-9 Withlacoochee WPCP Storage - Expand flow equalization by 11 MG at the Withlacoochee WPCP. 13,500,000$ 13,500,000$
W-10 Structural Evaluation of Mack Drive PS, Rodgers Street PS, and Eastwind PS 21,500$ 21,500$ W-11 Condition Assessment of East Sugar Creek Outfall - CCTV and Manhole inspection of 2,900 feet of 15-inch pipe 63,000$ 63,000$ W-12 Condition Assessment of Sugar Creek Outfall - CCTV and Manhole inspection on 13,400 feet of 15-inch to 42-inch pipe 108,000$ 108,000$ W-13 Condition Assessment of Bemiss Force Main - Conduct ultra sonic thickness testing and coupon extraction on 13,800 feet of 8-inch force main 200,000$ 200,000$ W-34 Condition Assessment for rehabilitation of Mini-basin 14B - 25,200 feet of 8-inch pipe 148,000$ 148,000$ W-30 Condition Assessment for rehabilitation of Mini-basin 7C - 43,800 feet of 8-inch pipe 201,000$ 201,000$ W-33 Condition Assessment for rehabilitation of Mini-basin 3A - 26,600 feet of 8-inch to 12-inch pipe 142,000$ 142,000$ W-27 Condition Assessment of Three-Mile Branch - CCTV and Manhole Inspection for 3,300 feet of 15-inch to 18-inch pipe 66,000$ 66,000$ W-15 Condition Assessment of Eastwind Force Main - Conduct ultra sonic thickness testing and coupon extraction on 2,000 feet of 4-inch force main 100,000$ 100,000$
W-14 West Dukes Canal Parallel - Install 5,200 LF of 10-inch pipe from South Toombs Street to Hawkins Street, 2,600 LF of 18-inch pipe from Hawkins Street to Perry Lane and 7,600 LF of 21-inch pipe from Perry Lane to the Old Sugar Creek Plant. 8,060,000$ 8,060,000$
MC-9 Mud Creek/South Dukes Bay Lift Station and Force Main - Installation of new Pump Station with a capacity of 7.2 mgd and 18,200 LF of 20-inch Force main 14,340,000$ 14,340,000$ W-31 Condition Assessment of Priority 2 Section of Mini-basin 5A - 31,000 feet of 8-inch to 12-inch pipe 160,000$ 160,000$ W-32 Condition Assessment for rehabilitation of Mini-basin 9B - 17,200 feet of 8-inch to 12-inch pipe 126,000$ 126,000$
MC-10 Upper Knights Creek Relief Sewer - 6,800 LF of 15-inch pipe from Northside Drive to the Lakeland Pump Station 4,390,000$ 4,390,000$ W-16 Collector PS Reroute - Reroute Mack Drive PS force main from One Mile Branch to Two Mile Branch. 220,000$ 220,000$ W-17 Collector PS Reroute - Reroute Rogers Street force main from Browns Canal to West Dukes Canal. 2,100,000$ 2,100,000$ W-18 Two Mile Parallel - Install 9,200 LF of 21-inch parallel pipe from North Patterson Street to Lake Drive. 3,760,000$ 3,760,000$
MC-11 Lower Mud Creek Existing Pipe - Use of CIPP liner on existing 10,600 LF of existing 24-inch pipe 2,940,000$ 2,940,000$ W-19 Condition Assessment of Two-Mile Branch Outfall - CCTV & Manhole Inspection of 10,000 feet of 15-inch to 24-inch pipe. 92,000$ 92,000$ MC-3 Condition Assessment for rehabilitation of Mini-basin 19B - 18,300 feet of 8-inch to 12-inch pipe 126,000$ 126,000$
MC-12 Knights Creek Rehabilitation - Rehabilitation of the existing 24,032 LF of pipe between the Lakeland FM discharge and Howell Road 4,300,000$ 4,300,000$
W-20 Browns Canal Parallel - Install 1,900 LF of 12-inch parallel pipe from Webster Street to York Street, and 6,100 LF of 15-inch parallel pipe from York Street to Lankford Drive. 2,900,000$ 2,900,000$
W-21 Hightower Upsize - Upsize 600 LF of 10-inch pipe to 15-inch pipe. 180,000$ 180,000$ MC-13 Collector System Upgrade - Upgrade Eastwind PS to convey peak 1-hour flow of 1.06 mgd. 520,000$ 520,000$ MC-14 Collector System Upgrade - Upgrade Knight Mill PS to convey Peak 1-hour flow of 0.33 mgd. 160,000$ 160,000$
W-22 One Mile Replacement - Correct Reverse grade between Vallotton and North Lee Street. Upsize 600 LF of 18-inch pipe to 24-inch from North Ashley Street to Iola Drive. 500,000$ 500,000$
W-23 Condition Assessment of Browns Canal Outfall - CCTV & Manhole Inspection of 5,200 feet of 15-inch to 18-inch pipe. 74,000$ 74,000$ W-24 One Mile Parallel - Install 2,400 LF of 15-inch parallel pipe from Vallotton to Iola Drive. 990,000$ 990,000$ W-25 One Mile Flow Diversion - Install a new Junction box at Sustella Road to split the flow between the upper and lower One Mile branch lines. 40,000$ 40,000$
MC-15 Upper Mud Creek Parallel Pipe – Install 700 LF of 12-inch Pipe, 3,800 LF of 15-inch Pipe, 1,200 LF of 18-inch Pipe, and 5,600 LF of 21-inch Pipe from Old Clyattville Road to the South Dukes Bay Interceptor 5,590,000$ 5,590,000$
W-26 Upper Withlacoochee Parallel - Install 4,900 LF of 12-inch parallel pipe and 500 LF of 18-inch pipe between Williamsburg Drive and Lake Drive. 1,500,000$ 1,500,000$ W-28 Condition Assessment of One-Mile Branch - CCTV and Manhole Inspection for 19,600 feet of 15-inch to 36-inch pipe 144,000$ 144,000$ R-1 Annual Rehabilitation - Rehabilitate 1% of Withlacoochee and Mud Creek basins gravity sewer per year. Total cost distributed over the 30 year time frame. 62,400,000$ 10,400,000$ 10,400,000$ 10,400,000$ 10,400,000$ 10,400,000$ 10,400,000$ R-2 Continued Annual Condition Assessment of Priority 3 and Other Projects 3,000,000$ 1,500,000$ 1,500,000$ R-3 Annual Rehabilitation for Collection System Pump Stations 5,000,000$ 1,000,000$ 1,000,000$ 1,000,000$ 1,000,000$ 1,000,000$
Totals 189,800,000$ 39,300,000$ 48,600,000$ 34,000,000$ 25,200,000$ 21,500,000$ 21,200,000$
1) Projects Highlighted in Blue are projects required from the Condition and Criticality Assessment
Project No. Project Description Capital Cost
A 5-4

Withlacoochee WPCP Storage 6,000,000$ Design Bid/Award Notice to Proceed/Construction
Big Country PS Upgrade 800,000$ Design Bid/Award Notice to Proceed/Construction
Ponderosa PS Upgrade 150,000$ Design Bid/Award Notice to Proceed/Construction
Lower Withlacoochee Pump Station & Force Main 21,200,000$ Design Bid/Award Notice to Proceed/Construction
MC-1 Mud Creek Outfall - CCTV & Manhole Inspection 160,000$
MC-2 Knights Creek Outfall - CCTV & Manhole Inspection 188,000$
W-5 Withlacoochee Outfall - CCTV and Manhole Inspection 330,000$
W-29 Priority Part of Mini-Basin 5A Assessment 250,000$
MC-4 Structural Evaluation of Lakeland Pump Station 8,000$
Annual Rehabilitation (2) 2,080,000$
Annual Rehabilitation (2) 2,080,000$
Annual Rehabilitation (2) 2,080,000$
Annual Rehabilitation (2) 2,080,000$
1) This is the Total Capital Cost for the project including 30% Construction Contingency and 25% for Engineering, Legal, and Administration
2) Annual Rehabilitation assumes the rehabiliation of 1% of both the Mud Creek and Withlacoochee basins gravity sewer per year
Project Number
W-1
W-2
W-3
W-4
N D2009 2010 2011 2012 2013
J J A S OJ F M A MA S O N DM A M J JO N D J FM J J A SD J F M AJ A S O NF M A M J
Table 5-3 Implementation Schedule for Phase I Projects
N D JCapital Cost (1)Project Description J J A S OJ F M A M
A

Section 5 Capital Improvements Program
A 5-6
As discussed above, field condition assessment data is required as the next step in the rehabilitation program. If the field data changes the condition rating, then the projects will be re-prioritized. Because the extent of rehabilitation is uncertain until the field work is performed, individual project costs were only developed for condition assessment. An annual rehabilitation project (R-1) was added to the CIP for Phases I through VI from which the funds can be drawn to rehabilitate the priority projects. This coincided with the annual rehabilitation recommendation from the capacity analysis in order to reduce I/I (project R-1). The funding for the annual rehabilitation project, R-1, is based the recommendation of rehabilitating a minimum of one percent of the gravity sewer per year. At this rate, it would be 100 years before the entire system was rehabilitated and therefore a reasonable minimum amount of funding to include in the CIP. The project begins in Year 2010, after the Phase 1 condition assessment projects have been completed and the projects are reprioritized for rehabilitation.
An annual rehabilitation project (R-3) was added to the CIP for Phases II through VI from which the funds can be drawn to rehabilitate pump stations. This project begins in Year 2014, after the Phase I condition assessment project for pump station have been completed.
The condition assessment projects were prioritized as detailed below. In general, projects identified as Priority 1 based on condition/criticality analysis were assigned to Phase I of the CIP. Those identified as Priority 2 were assigned to Phase II of the CIP. Exceptions were made for those projects that could be performed in conjunction with a capacity project.
Knights Creek Outfall investigation (project MC-1), identified as Priority 1 based on condition and criticality analysis, was assigned to Phase I of the CIP (2009-2013).
Mud Creek Outfall investigation (project MC-2), identified as Priority 1 based on condition and criticality analysis, was assigned to Phase I of the CIP (2009-2013).
South Dukes Bay Outfall investigation, identified as Priority 1 based on condition and criticality analysis, was not included in the CIP. The outfall will be replaced and potentially rerouted with abandonment of the existing pipe expected in Phase II of the CIP (2014-2018), and therefore inspection is not recommended.
Withlacoochee Outfall investigation (project W-5), identified as Priority 1, was assigned to Phase I of the CIP (2009-2013).
Investigation of a portion of mini-basin 5A (project W-29), identified as Priority 1 for based on condition/criticality analysis, was assigned to Phase I of the CIP (2009-2013).

Section 5 Capital Improvements Program
A 5-7
Lakeland pump station (project MC-4), identified as Priority 1 for structural evaluation and repair to suction based on condition and criticality analysis, was assigned to Phase I of the CIP (2009-2013).
Ponderosa pump station and Big Country Club pump station were identified as Priority 1 for repair based on excessive run times and operational issues during wet weather conditions. The condition assessment projects were combined with the capacity upgrade projects (W-2 and W-3) and assigned to the first phase of the CIP (2009 to 2013).
Investigation of mini-basins 14B and 7C (projects W-34 and W-30), Priority 2 investigations, was assigned to Phase II of the CIP (2014-2018).
Investigation of the remaining portion of mini-basin 5A (project W-31) and investigation of a portion of mini-basin 3A (project W-33), identified as Priority 2 for investigation, were assigned to the Phase III of the CIP (2014-2018).
Sugar Creek Outfall investigation (project W-12), identified as Priority 2 based on the condition and criticality analysis, was assigned to Phase II of the CIP (2014-2018).
East Sugar Creek Outfall investigation (W-11), identified as Priority 2 based on the condition and criticality analysis, was assigned to Phase II of the CIP (2014-2018).
Two Mile Branch investigation (project W-19), identified as Priority 2 based on the condition and criticality analysis, was assigned to Phase IV of the CIP (2024 to 2028). This project was assigned to Phase IV to coincide with the Two Mile Parallel project (W-18). Investigation of the outfall’s condition would aid in making an informed decision on whether to rehabilitate, replace, or parallel the existing outfall. If the existing outfall is in poor condition, then some type of rehabilitation would be needed in addition to the required capacity improvement.
One Mile Branch investigation (project W-28), identified as Priority 2 based on the condition and criticality analysis, was assigned to Phase VI of the CIP (2034 to 2038). This project was assigned to Phase VI to coincide with the One Mile Parallel project (W-24). Investigation of the outfall’s condition would aid in making an informed decision on whether to rehabilitate, replace, or parallel the existing outfall. If the existing outfall is in poor condition, then some type of rehabilitation would be needed in addition to the required capacity improvement.
Browns Canal Outfall investigation (project W-23), identified as Priority 2 based on the condition and criticality analysis, was assigned to Phase V of the CIP (2029-2033). This project was assigned to Phase V to coincide with the Browns Canal parallel project (W-20). Investigation of the outfall’s condition would aid in making an informed decision on whether to rehabilitate, replace, or parallel the existing

Section 5 Capital Improvements Program
A 5-8
outfall. If the existing outfall is in poor condition, then some type of rehabilitation would be needed in addition to the required capacity improvement.
Three Mile Outfall investigation (project W-27), identified as Priority 2 based on the condition/criticality analysis, was assigned to Phase II of the CIP (2014-2018).
Investigation of the portions of mini-basins 9B and 19B (project W-32 and project MC-3), designated Priority 2, were assigned to Phase IV of the CIP.
Mack Drive, Rogers Street and Eastwind pump station investigations (W-10), identified as Priority 2, were assigned to Phase II of the CIP (2014 to 2108).
The Eastwind pump station force main investigation (W-15) identified as Priority 2 based on condition and criticality analysis was assigned to Phase II of the CIP (2014-2018).
The force main investigation for Rogers Street pump station, Mack Drive pump station, and Ponderosa pump station identified as Priority 2 were eliminated. The flow from these pump stations will be re-directed to different outfalls via new force mains as part of projects W-17, W-16, and W-3.
The Bemiss force main investigation (project W-13), identified as Priority 2, were assigned to Phase II of the CIP (2014 to 2108).
Project R-3 is for continued annual condition assessment of Priority 3 projects (identified in Section 4) and other projects that require more frequent assessment. The costs for this continued assessment are placed in Phases V and VI. An annual estimate of $300,000 per year is used which will provide for the Priority 3 projects as well as some combination of lower priority projects and frequent assessment projects that will need to be reassessed in Phases 5 and 6. It is anticipated that some projects that are highly critical may require reassessment prior to the end of Phase 6 and these funds could be used for this as well as assessing additional lower priority projects. The $300,000 annual cost ($3M in Phases V and VI) in the CIP for this continued assessment is not enough money to assess all remaining facilities and the prioritization process established in this report should still be used to prioritize these funds.
5.3 Summary In conclusion, the CIP discussed in this Section and the Overall Sewer Rehabilitation Strategy presented in Section 4 provides a number of benefits to the City:
The proactive assessment helps identify problems before they fail, saving cost and protecting public health and the environment.
A programmatic approach provides budgeting on a regular basis for rehabilitation rather than reacting to emergency repairs.

Section 5 Capital Improvements Program
A 5-9
Implementation of the CIP and Strategy will improve regulatory compliance and customer confidence in the system.
Improved structural integrity provides a net positive return on investment reducing maintenance costs and reducing infiltration and inflow (thereby reducing pumping and treatment costs).
Implementation of the CIP and Strategy will support the economic viability of the community.