Embed Size (px)
DESCRIPTION
Conditional Probabilities and Independence. (Session 03). Learning Objectives. At the end of this session you will be able to explain what is meant by a conditional probability distinguish the concepts of mutual exclusiveness and independence of events. identify events which are independent - PowerPoint PPT Presentation
Citation preview
SADC Course in Statistics
Conditional Probabilities and Independence
(Session 03)
2To put your footer here go to View > Header and Footer
Learning Objectives
At the end of this session you will be able to• explain what is meant by a conditional
probability• distinguish the concepts of mutual
exclusiveness and independence of events.• identify events which are independent• state and apply Bayes’ theorem• construct a tree diagram for a specific
scenario and compute probabilities associated with events along branches of the tree
3To put your footer here go to View > Header and Footer
Conditional probabilityThere are situations where we want to find the probability of one event, say A, when we know that some related event B has occurred.
For example, we may ask • what is the probability of rain later today given that it is now very windy• what is the probability that a person is HIV positive given that he has Tuberculosis (TB)
Such probabilities are called conditional probabilities. In the first example the known condition was that it was windy while in the second example the known condition was that a person is suffering from TB.
4To put your footer here go to View > Header and Footer
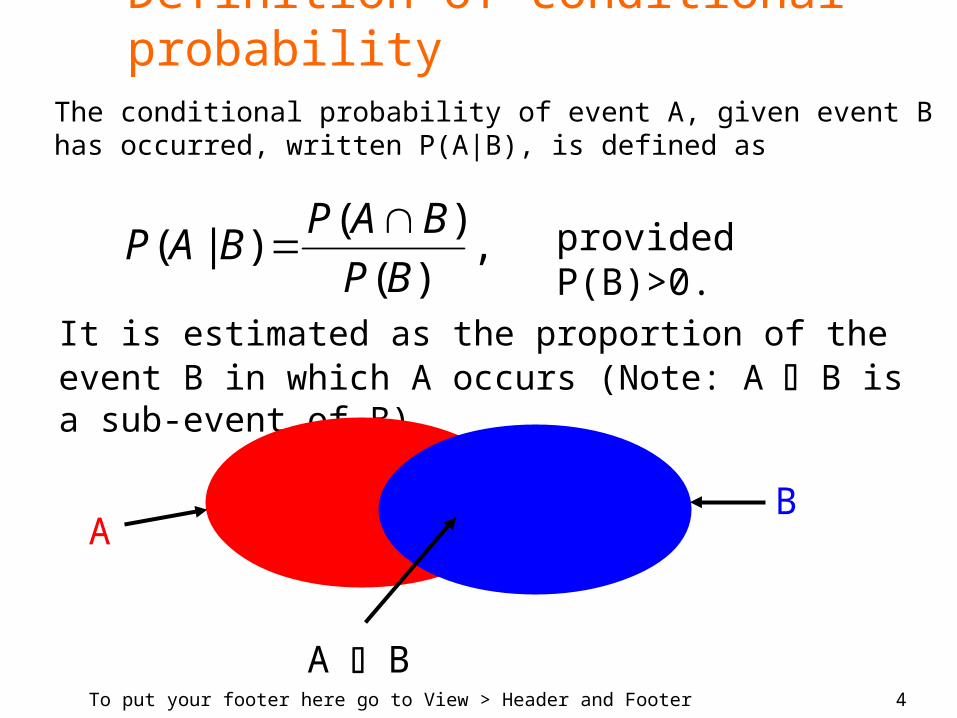
Definition of conditional probabilityThe conditional probability of event A, given event B has occurred, written P(A|B), is defined as
,)(
)()|(
BP
BAPBAP
It is estimated as the proportion of the event B in which A occurs (Note: A B is a sub-event of B).
AB
A B
provided P(B)>0.
5To put your footer here go to View > Header and Footer
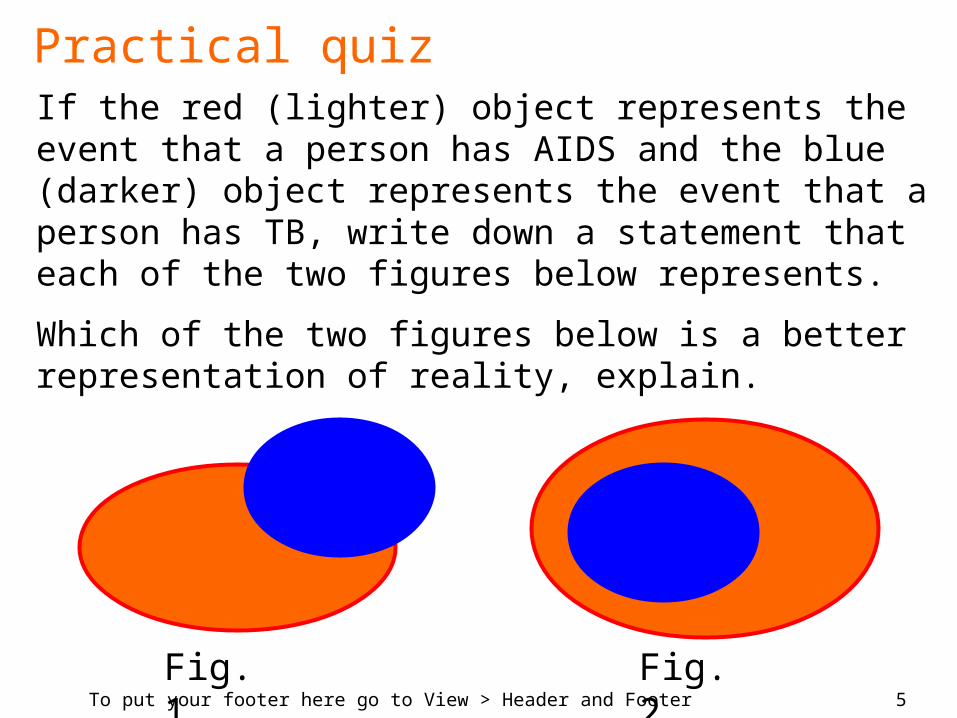
Practical quizIf the red (lighter) object represents the event that a person has AIDS and the blue (darker) object represents the event that a person has TB, write down a statement that each of the two figures below represents.
Which of the two figures below is a better representation of reality, explain.
Fig. 1 Fig. 2
6To put your footer here go to View > Header and Footer
Independence of events
• Events are independent if the occurrence of one does not affect the occurrence of the others.
• In other words events are independent if knowledge of one does not supply information about the other.
• Events which are not independent are said to be dependent.
7To put your footer here go to View > Header and Footer
• If events A and B are independent, P(A B) = P(A) x P(B)
• If P(B) is not equal to zero then P(A|B) = P(A B) / P(B)
= P(A) x P(B) / P(B) = P(A)
The above says that if A and B areindependent, then the occurrence of B doesnot change the probability of occurrence of A.
Conditional Probability and Independence
8To put your footer here go to View > Header and Footer
Other ways of determining independence
• Independence cannot always be determined by the formula given above.
• The most common way is to assume independence on the basis of knowledge of the physical or natural phenomenon.
• In the following table draw lines joining pairs of events A and B that you believe are dependent. Give an argument for your answers.
9To put your footer here go to View > Header and Footer
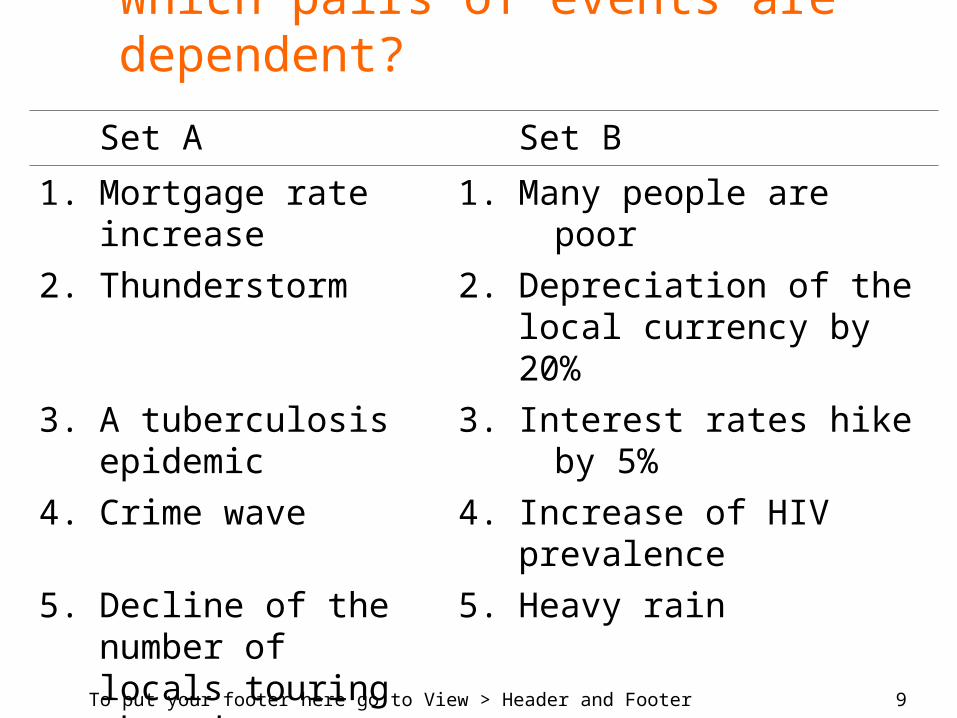
Which pairs of events are dependent?
Set A Set B
1. Mortgage rate increase
1. Many people are poor
2. Thunderstorm 2. Depreciation of the local currency by 20%
3. A tuberculosis epidemic
3. Interest rates hike by 5%
4. Crime wave 4. Increase of HIV prevalence
5. Decline of the number of locals touring abroad
5. Heavy rain
10To put your footer here go to View > Header and Footer
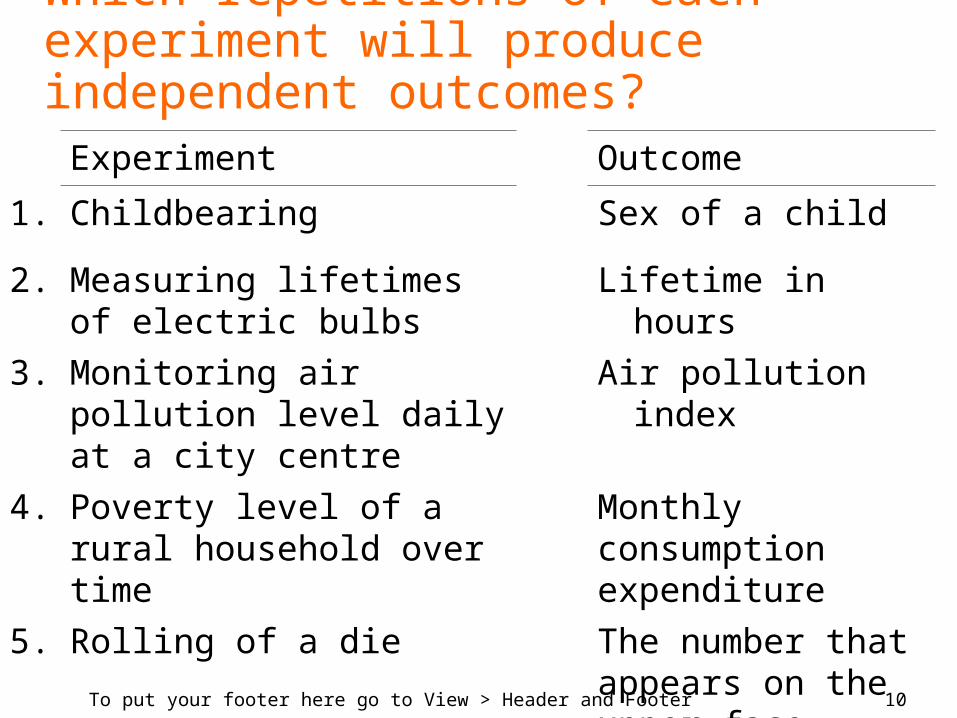
Which repetitions of each experiment will produce independent outcomes?
Experiment Outcome
1. Childbearing Sex of a child
2. Measuring lifetimes of electric bulbs
Lifetime in hours
3. Monitoring air pollution level daily at a city centre
Air pollution index
4. Poverty level of a rural household over time
Monthly consumption expenditure
5. Rolling of a die The number that appears on the upper face
11To put your footer here go to View > Header and Footer
Law of Total Probability
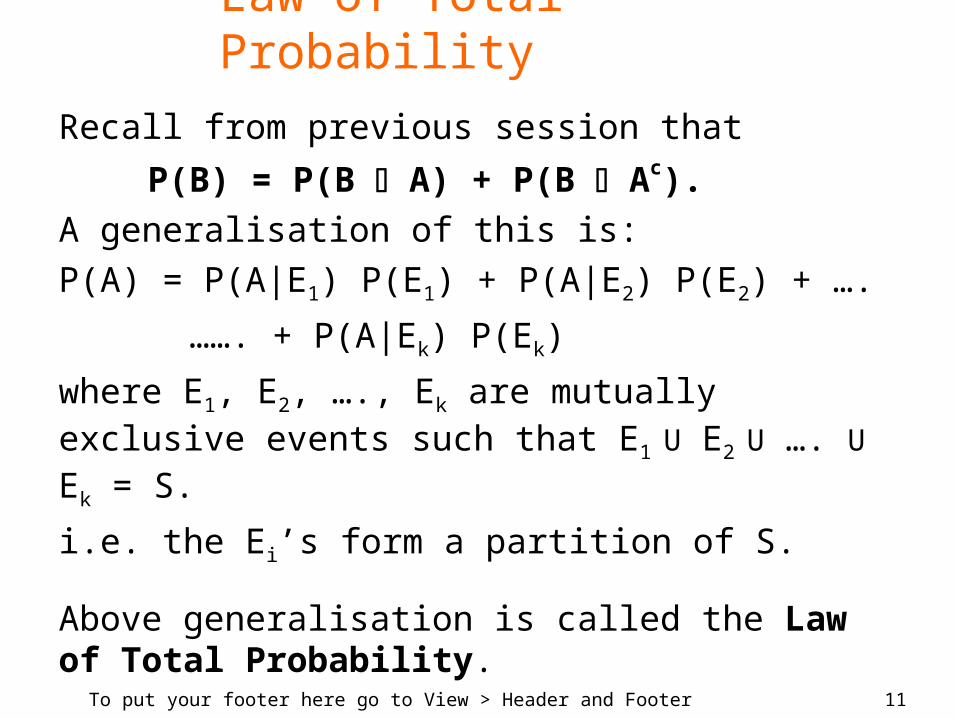
Recall from previous session that
P(B) = P(B A) + P(B Ac).A generalisation of this is:P(A) = P(A|E1) P(E1) + P(A|E2) P(E2) + ….
……. + P(A|Ek) P(Ek)
where E1, E2, …., Ek are mutually exclusive events such that E1 U E2 U …. U Ek = S.
i.e. the Ei’s form a partition of S.
Above generalisation is called the Law of Total Probability.
12To put your footer here go to View > Header and Footer
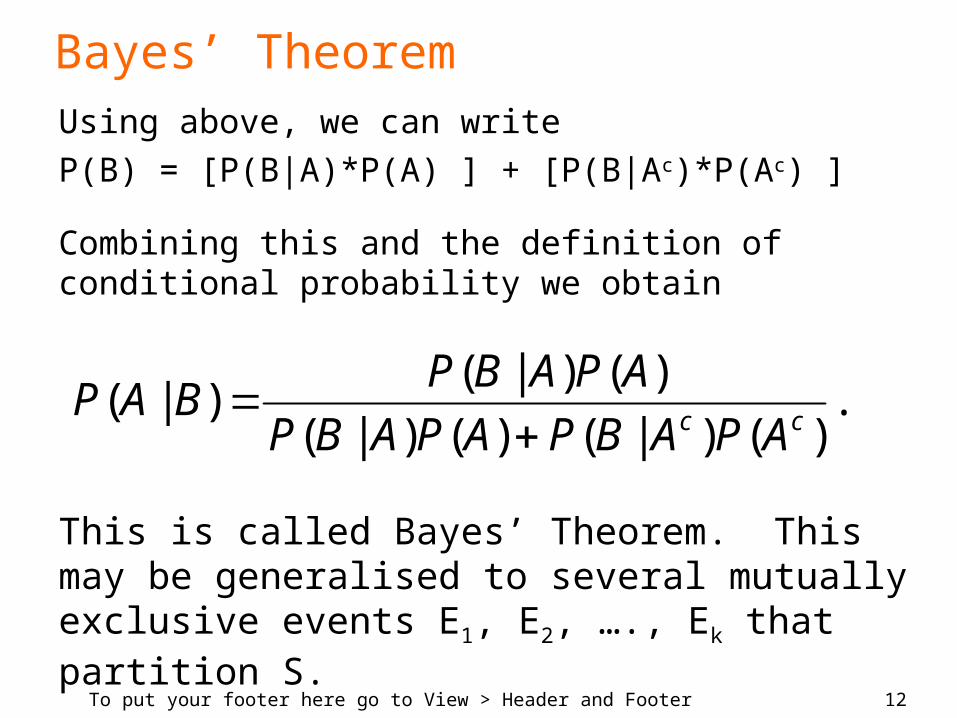
Bayes’ TheoremUsing above, we can writeP(B) = [P(B|A)*P(A) ] + [P(B|Ac)*P(Ac) ]
Combining this and the definition of conditional probability we obtain
.)()|()()|(
)()|()|(
cc APABPAPABP
APABPBAP
This is called Bayes’ Theorem. This may be generalised to several mutually exclusive events E1, E2, …., Ek that partition S.
13To put your footer here go to View > Header and Footer
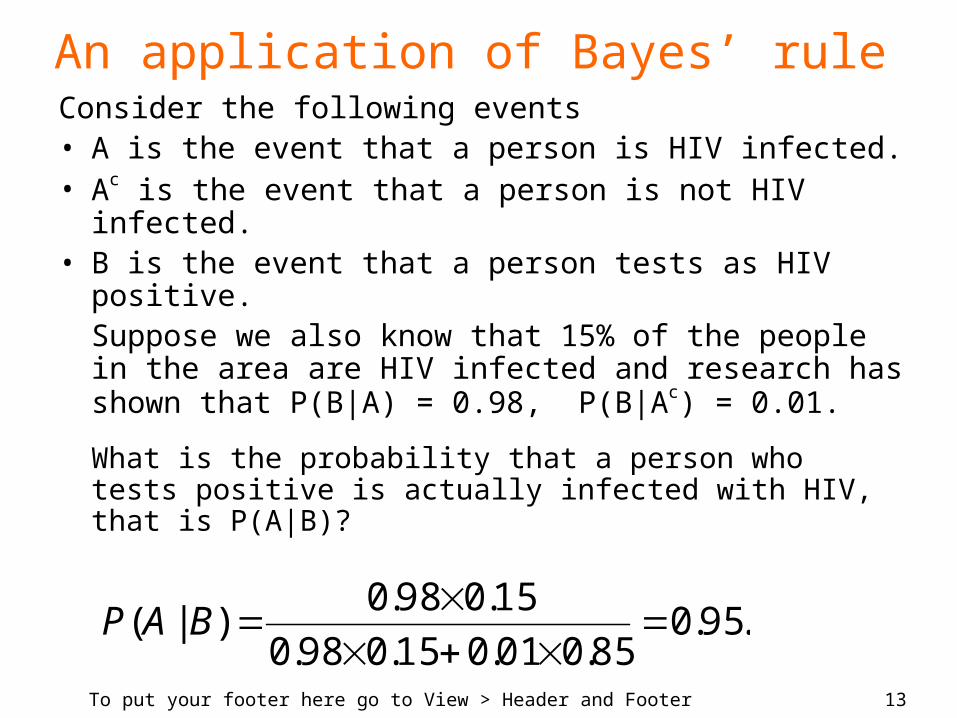
An application of Bayes’ ruleConsider the following events• A is the event that a person is HIV infected.• Ac is the event that a person is not HIV infected.• B is the event that a person tests as HIV
positive.Suppose we also know that 15% of the people in the area are HIV infected and research has shown that P(B|A) = 0.98, P(B|Ac) = 0.01.
What is the probability that a person who tests positive is actually infected with HIV, that is P(A|B)?
.95.085.001.015.098.0
15.098.0)|(
BAP
14To put your footer here go to View > Header and Footer
The multiplication rule
• One of the major problems in calculating probabilities is to make sure that all logical possibilities are considered.
• The multiplication rule states that if events A1, A2, ….,Ak have n1, n2, …, nk possible
outcomes respectively, then the total number of possible outcomes of the k events is n1 x n2 x … x nk .
15To put your footer here go to View > Header and Footer
The addition rule
If, on the other hand, events A1, A2, ….,Ak are mutually exclusive, we have the addition rule, i.e. that
A1 U A2 U …. U Ak has
n1 + n2 + … + nk possible outcomes.
Note: Independence and mutual exclusive are not the same thing, e.g. if a die and a coin are thrown simultaneously, the event of a six on the die and the event “head” on the coin, are independent, but are not mutually exclusive.
16To put your footer here go to View > Header and Footer
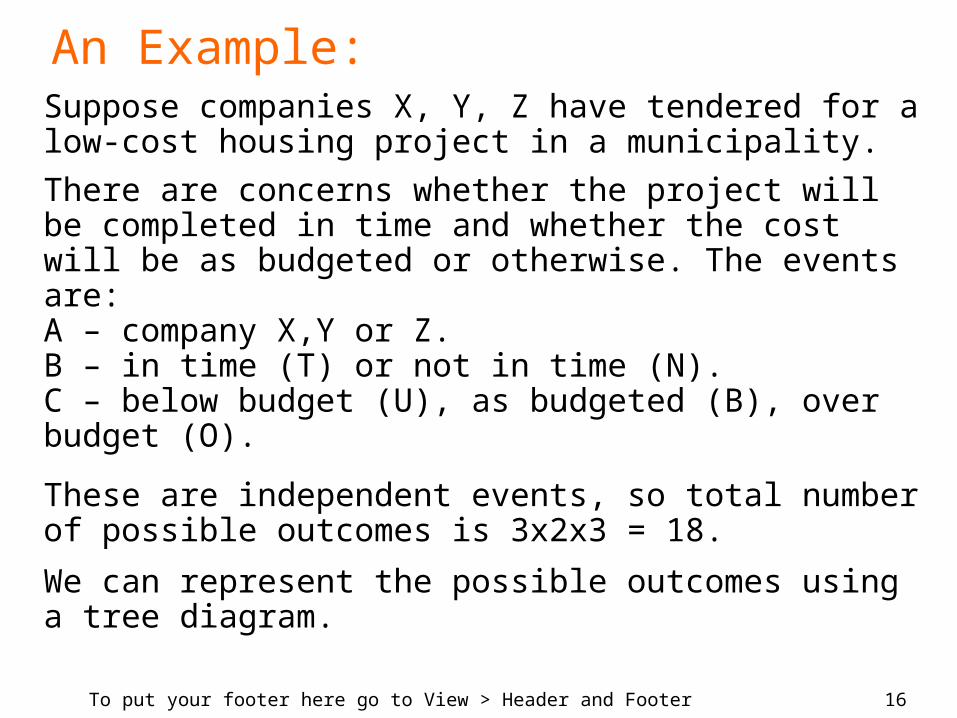
Suppose companies X, Y, Z have tendered for a low-cost housing project in a municipality.
There are concerns whether the project will be completed in time and whether the cost will be as budgeted or otherwise. The events are:A – company X,Y or Z.B – in time (T) or not in time (N).C – below budget (U), as budgeted (B), over budget (O).
These are independent events, so total number of possible outcomes is 3x2x3 = 18.
We can represent the possible outcomes using a tree diagram.
An Example:
17To put your footer here go to View > Header and Footer
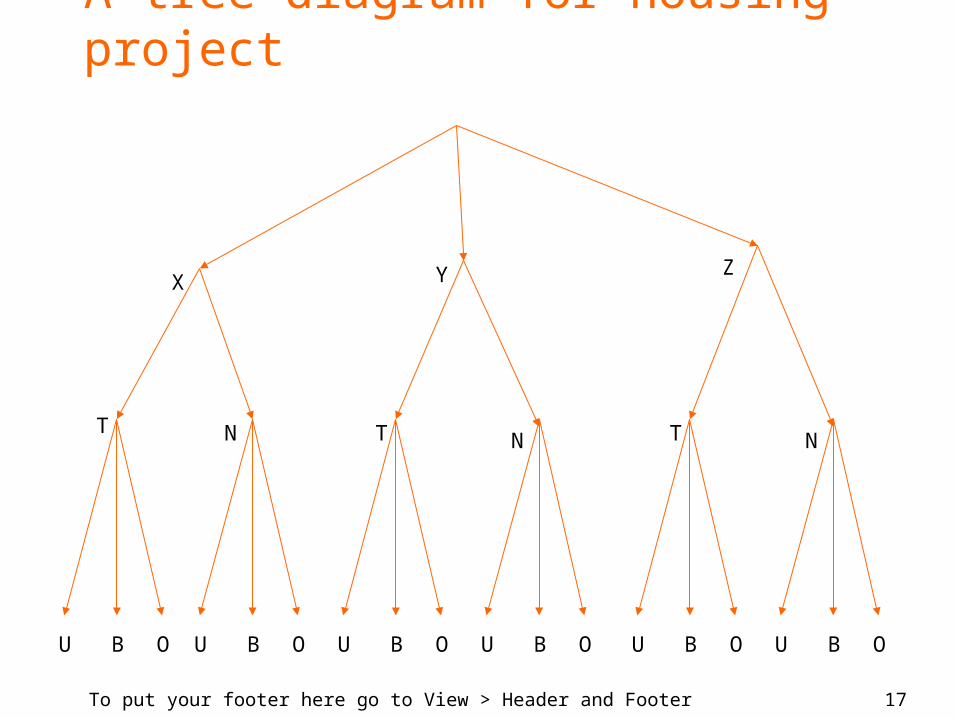
A tree diagram for housing project
U B O U B O U B O U B O U B OU B O
T T TN N N
X Y Z
18To put your footer here go to View > Header and Footer
Suppose from previous experience you have thefollowing probabilities:• 0.3 that company X will win the bid, 0.45 that Y
will win and 0.25 that Z will win.• 0.9 that the project will finish in time if X does it,
0.8 it will finish in time if Y does it an 0.7 it will finish in time if Z does it.
• 0.2 that the project will go over-budget if the project finishes in time and 0.7 that it will go over-budget if it does not finish in time.
Calculate the probability that the project will notgo over the budgeted cost.
Prob. calculations from tree diagram
19To put your footer here go to View > Header and Footer
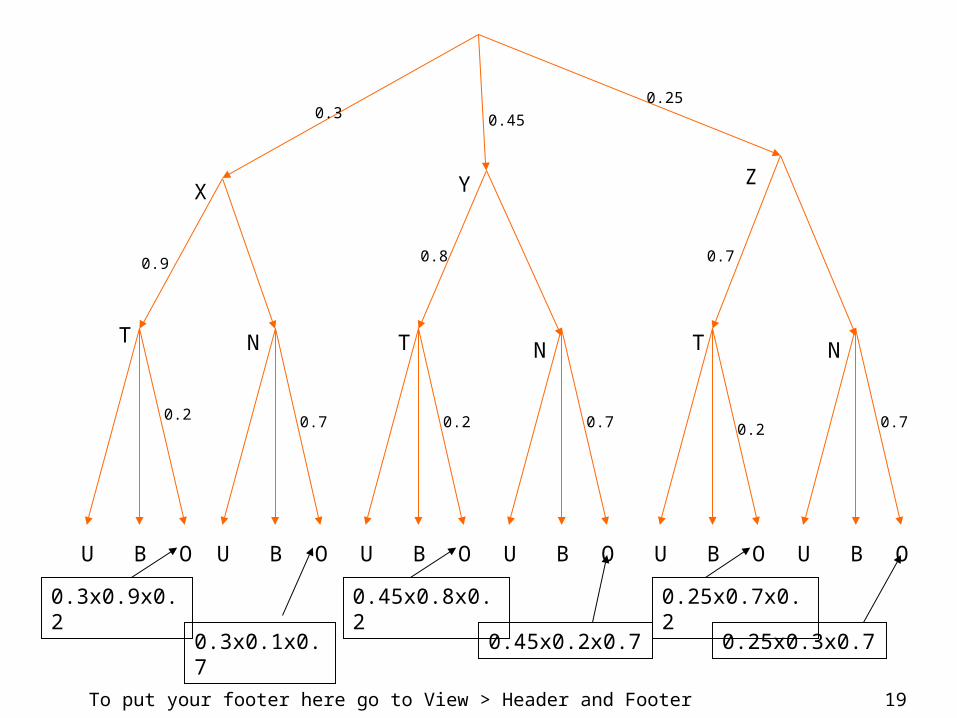
U B O U B O U B O U B O U B OU B O
T T TN N N
X Y Z
0.3 0.45
0.25
0.9 0.8 0.7
0.2 0.7 0.7 0.70.2 0.2
0.3x0.9x0.2
0.3x0.1x0.7
0.45x0.8x0.2
0.45x0.2x0.7
0.25x0.7x0.2
0.25x0.3x0.7
20To put your footer here go to View > Header and Footer
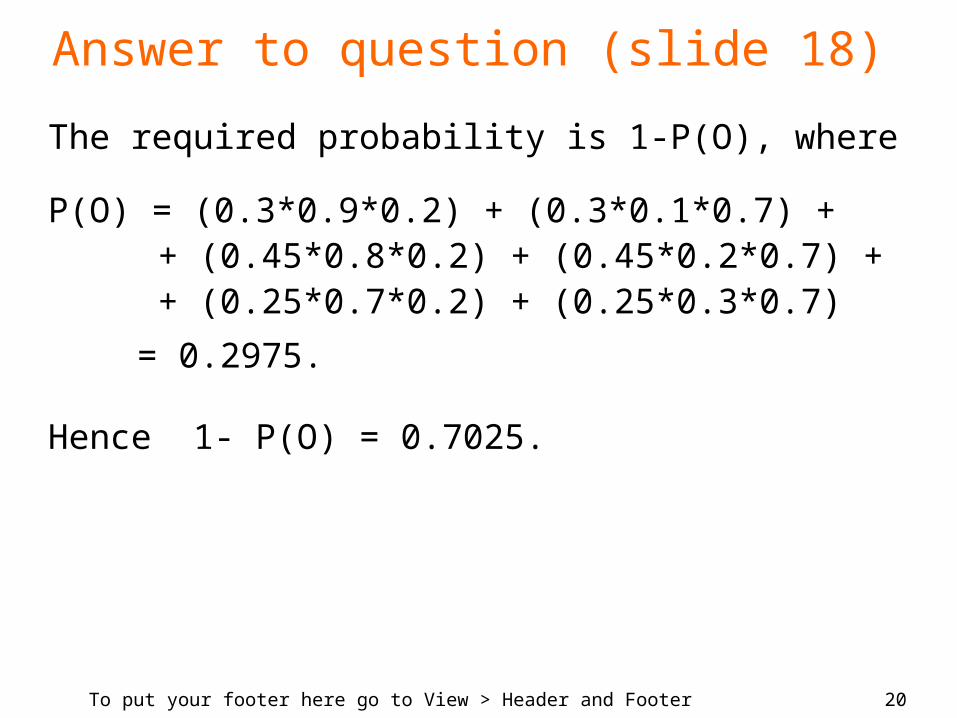
Answer to question (slide 18)
The required probability is 1-P(O), where
P(O) = (0.3*0.9*0.2) + (0.3*0.1*0.7) + + (0.45*0.8*0.2) + (0.45*0.2*0.7) + + (0.25*0.7*0.2) + (0.25*0.3*0.7)
= 0.2975.
Hence 1- P(O) = 0.7025.

21To put your footer here go to View > Header and Footer