Embed Size (px)
Citation preview
International Journal of Mathematical Analysis
Vol. 8, 2014, no. 41, 2033 - 2046
HIKARI Ltd, www.m-hikari.com
http://dx.doi.org/10.12988/ijma.2014.47210
Conditional Volatility Estimation by
Conditional Quantile Autoregression
D. N. Mutunga1, P. N. Mwita
2 and B. K. Muema
3
1Pan African University, Institutes of Basic Sciences Technology and Innovation
P.O Box 62000-00200, Nairobi, Kenya
2Jomo Kenyatta University of Agriculture and Technology
P.O Box 62000-00200, Nairobi, Kenya
3Jomo Kenyatta University of Agriculture and Technology
P.O Box 62000-00200, Nairobi, Kenya
Copyright © 2014 D. N. Mutunga, P. N. Mwita and B. K. Muema. This is an open access article distributed
under the Creative Commons Attribution License, which permits unrestricted use, distribution, and
reproduction in any medium, provided the original work is properly cited.
Abstract
This paper considers the problem of estimating conditional volatility function using
conditional quantile autoregression function. We estimate the interquantile autoregression
range and the conditional volatility function under known distributional assumptions. The
conditional volatility function estimator is found to be theoretically consistent. A small
simulation study ascertains that the Volatility Estimator is consistent.
Mathematics Subject Classification: 62G05; 62M1
Keywords: Quantile, InterQuantile, Autoregression, Range, Volatility
1. INTRODUCTION
Let be -measurable and be -measurable derived from a
stationary and -mixing multivariate time series * + adapted to the sequence
2034 D. N. Mutunga, P. N. Mwita and B. K. Muema
of sigma algebras. The response variable and the covariate
are partitions of such that .
/ A time series with these feature is
an autoregressive series where the regressors are past variables of the series that
is, is regressed on ( ) For example, the Generalized
Autoregressive Conditional Heteroscedasticity (GARCH) process by Bollerslev
(1986). We assume that there exists a conditional distribution ( ) from
which 2 3 is drawn from at the point .
/ Having in mind of an autoregressive
process we consider a process with an AR process for the mean and GARCH process
for the scale. To incorporate robustness in the model, we include quantile regression
notion in our work which was introduced by Koenker and Basset (1978). For
( ) we define the Quantile Autoregression – Generalized Autoregression
Conditional Heteroscedasticity (QAR-GARCH) process according Mwita (2003),
which is algebraically expressed as;
. / .
/ ( )
Where; ( ) are assume with Zero θ-quantile and unit
scale, . / is the conditional -quantile of given and .
/ is the
conditional quantile scale function of given Since . | /
( )
. |
/ the conditional quantile function of given
is defined as;
. / .
/ 2 (
) 3 .The main course in this paper is to
estimate the volatility function . / . The Quantile Autoregression-Generalized
Autoregression Conditional Heteroscedasticity (QAR-GARCH) process can be
rewritten as; . / .
/ . We shall consider a ( )
( ) process defined as;
(√
)
√
}
( )
Where ( ) ( )
( )
( )
(
)
(
) and ( )
denotes a quantile of a random variable at -level.
Conditional volatility estimation 2035
Assumption 1
We assume that the conditional quantile for the variable is zero for all quantiles.
That is, for ( )
( )
At each and every -level, the conditional quantile of given is given by;
. /
. We impose the constraint that |∑
| so as to achieve
stationarity of the QAR (r) as well as for the entire QAR (r)-GARCH (p, q) process.
The process in (1) can be expressed as:
. / .
/ .
/ .
/ ( )
From (3) . / denote the residuals. In mind we aim at parameters
estimation by minimization of the residuals. Factoring in the notion of leverage, we
consider an asymmetric check function so that the weights for negative and positive
residuals differ. We define an asymmetric loss function of the form;
( . /) {
( . /) .
/
( ) ( . /) .
/
( )
Where; ( ) ( ( )) for with ( ) being the indicator function.
Using (3), (4) can be expressed as;
| . /|
( ) | . /|
. / ,
( ) - ( )
Where denotes the positive and the negative parts respectively. The quantile
autoregression model for residuals (5), can be expressed as an asymmetric loss
function as;
( . /) .
/ .
/ ( ( ) ) ( )
With conditional quantile function, . / and the noise term, in this case been
given by; . / and ( ( ) ) respectively. Having the loss function
defined, we let ( ) denote an objective function which minimizes the expected loss

2036 D. N. Mutunga, P. N. Mwita and B. K. Muema
for our proposed model, defined as: ( ) ( ( )) and is the usual
expectation operator.
( . /) {
( . /) .
/
( ) ( . /) .
/
( )
Definition 1
A function is lipschitz continuous if there exists a constant such that
( ) ( ) .
To check whether our function is Lipschitz continuous we denote the loss function
( . /) ( ) (for notation convenience).
Theorem 1
For ( ) a real valued random variable, the function ( ) is Lipschitz continuous
in with Lipschitz constant i.e. ( ) ( )
Proof
By definition; ( ) ( ), ( )-
Then, let
( ) ( )
(( ), ( )-) (( ), ( )-)
( ) ,( ) ( ) ( ) ( )-
For we have;
( ) and ( ) hence;
( ) ( ) ( ) ( )
( ) ( ) ( )
( ) ( )( )
For ( ) and ( ) , we have;
( )( ) ( ) ( ) ( )
Thus ( ) ( ) is bounded from above by at least ( ) and
Conditional volatility estimation 2037
( )( ).
Similarly if;
(a) then ( ) and ( ) hence;
( ) ( ) ( )
(b) then ( ) and ( ) hence;
( ) ( ) ( )( ) ( )
( ) ( ) ( )
Hence its
Then, the Lipschitz continuity of the objective function follows from that of the loss
function. From theorem 1 clearly our objective function is a bounded from above,
convex and Lipschitz continuous.
Theorem 2
Rademacher's Theorem states that; If is Lipschitz, then is
differentiable almost everywhere.
By this theorem, our objective function is differentiable almost everywhere since is
Lipschitz continuous.
2. PARAMETER ESTIMATION AND ESTIMATOR PROPERTIES
2.1 ESTIMATION
For notational convenience let’s denote the objective function as .
/. An
appealing method of estimation of the regression coefficients is to find the set of
values of the coefficients which makes the residuals as small as possible. We define
our estimates as those parameters that minimize the residuals dispersion. The
parameters vector is the solution to the minimization problem of the objective
function.
⏟
.
/ ( )

2038 D. N. Mutunga, P. N. Mwita and B. K. Muema
The ( ) vector is the population solution of the minimization problem which
gives the least absolute residual error. Since to study an entire population is tedious we
shall have to use a representative random sample 2. / .
/ .
/3.
The sample version of the objective function will thus be given by;
.
/
∑ ( . /)
( )
The respective parameters vector estimate is expressed as;
⏟
.
/
( )
Thus the conditional quantile function estimate is given by; . /
. /
. Next, we define the InterQuantile AutoRegression Range at -
level denoted by as; . / .
/ and the estimate
for the is expressed as; .
/ .
/
From (1), we consider an AR (r)-GARCH (p, q) process which is a special case of
QAR (r)-GARCH (p, q) which is mathematically expressed as;
. / .
/ ( )
Then manipulate such that, , this makes the model be a quantile model
of the form: . / .
/ (
) ( )
Where is the -quantile of and is as defined previously and ( ) i.e.
has unit scale and mean zero. Substitution of with in the QAR (r)-
GARCH (p, q) process at -quantile level and similarly for -quantile level we
get; . / .
/ (
) and . / .
/ (
) respectively. Taking the difference of these expressions and making the
conditional scale function as the subject we have;
. /
. / .
/
( )
Conditional volatility estimation 2039
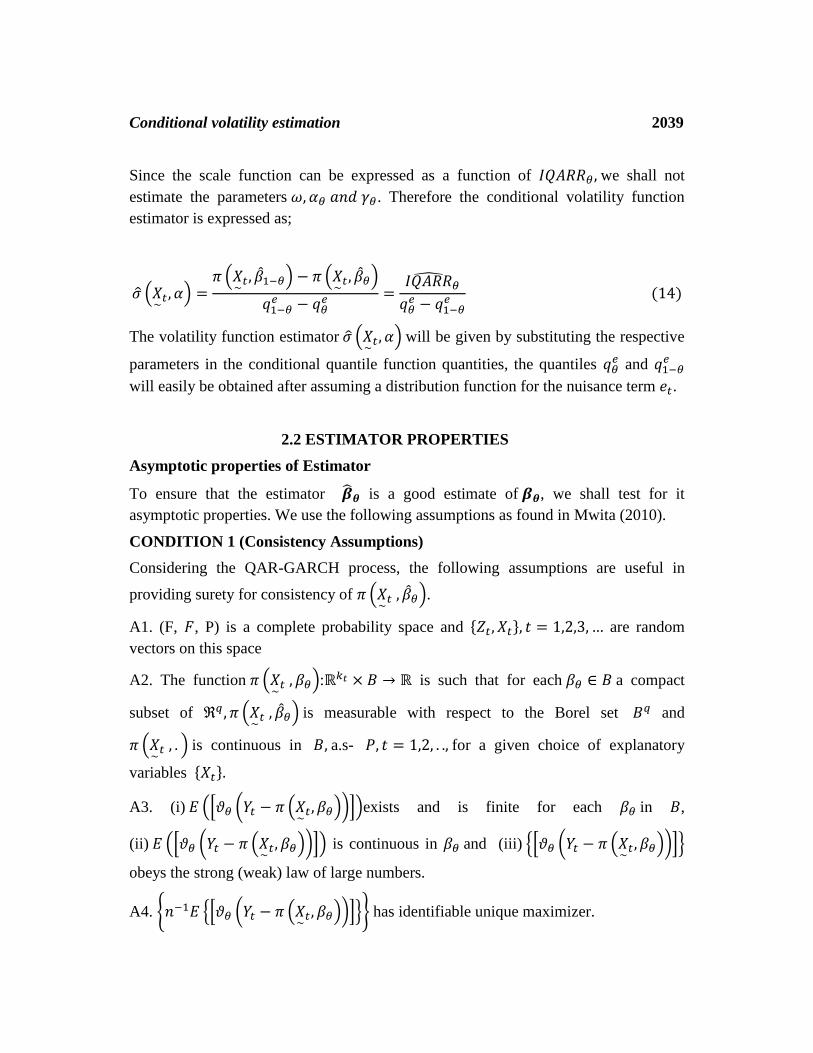
Since the scale function can be expressed as a function of we shall not
estimate the parameters . Therefore the conditional volatility function
estimator is expressed as;
. /
. / .
/
( )
The volatility function estimator . / will be given by substituting the respective
parameters in the conditional quantile function quantities, the quantiles and
will easily be obtained after assuming a distribution function for the nuisance term .
2.2 ESTIMATOR PROPERTIES
Asymptotic properties of Estimator
To ensure that the estimator is a good estimate of , we shall test for it
asymptotic properties. We use the following assumptions as found in Mwita (2010).
CONDITION 1 (Consistency Assumptions)
Considering the QAR-GARCH process, the following assumptions are useful in
providing surety for consistency of . /.
A1. (F, , P) is a complete probability space and * + are random
vectors on this space
A2. The function . /: is such that for each a compact
subset of . / is measurable with respect to the Borel set and
. / is continuous in a.s- for a given choice of explanatory
variables * +
A3. (i) .0 ( . /)1/exists and is finite for each in ,
(ii) .0 ( . /)1/ is continuous in and (iii) 20 ( .
/)13
obeys the strong (weak) law of large numbers.
A4. { 20 ( . /)13} has identifiable unique maximizer.
2040 D. N. Mutunga, P. N. Mwita and B. K. Muema
Theorem (Consistency)
Under assumptions A1– A4, as . Where is as previously defined.
Proof
For the proof see White (1994, pg. 75) by using the loss function defined in (3).
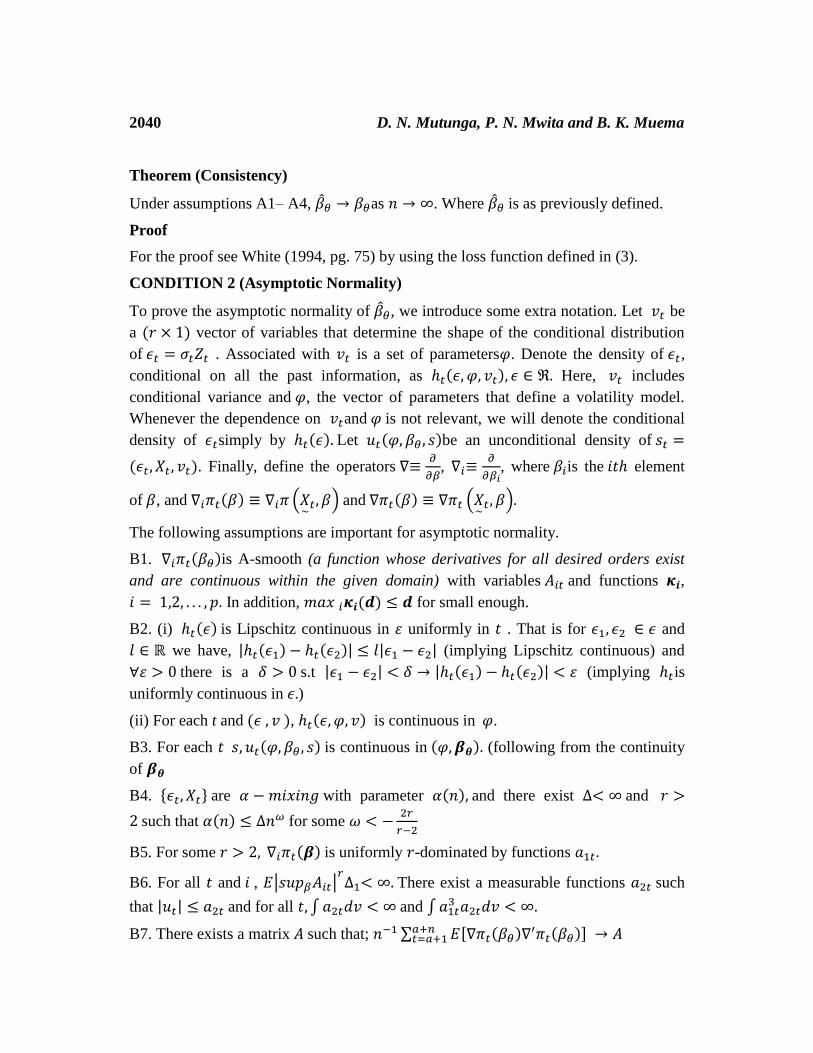
CONDITION 2 (Asymptotic Normality)
To prove the asymptotic normality of , we introduce some extra notation. Let be
a ( ) vector of variables that determine the shape of the conditional distribution
of . Associated with is a set of parameters . Denote the density of ,
conditional on all the past information, as ( ) Here, includes
conditional variance and , the vector of parameters that define a volatility model.
Whenever the dependence on and is not relevant, we will denote the conditional
density of simply by ( ) Let ( )be an unconditional density of
( ). Finally, define the operators
,
, where is the element
of , and ( ) . / and ( ) .
/
The following assumptions are important for asymptotic normality.
B1. ( )is A-smooth (a function whose derivatives for all desired orders exist
and are continuous within the given domain) with variables and functions ,
In addition, ( ) for small enough.
B2. (i) ( ) is Lipschitz continuous in uniformly in . That is for and
we have, ( ) ( ) (implying Lipschitz continuous) and
there is a s.t ( ) ( ) (implying is
uniformly continuous in )
(ii) For each t and ( ), ( ) is continuous in .
B3. For each ( ) is continuous in ( ) (following from the continuity
of
B4. * + are with parameter ( ) and there exist and
such that ( ) for some
B5. For some ( ) is uniformly -dominated by functions
B6. For all and , | | There exist a measurable functions such
that and for all ∫ and ∫
B7. There exists a matrix such that; ∑ , ( ) ( )-

Conditional volatility estimation 2041
As uniformly in
Theorem (Asymptotic Normality)
In consideration of our quantile autoregression model, if the estimator is consistent
and the axioms B1 – B7 hold, then we have;
√
( )
( )
Where;
( )
∑ , ( )
( )-
∑ , ( ) ( )
( )- and
⏟
[ ∑ ( ) | |
2 3
∑ | |
2 3
]
Proof
To proof that the estimator is asymptotically normal we substitute the function
, ( )- in place of the function ( ) 0
* +1 in Weiss (1991)
theorem 3.
If the conditions (A1-A4) and (B1-B7) are satisfied then our estimate is consistent and
also asymptotically normal. Since our scale function is defined in terms of the
interquantile autoregressive range then it is also consistent and asymptotically normal.
3. SIMULATION STUDY
A small simulation study was done for our model an AR (1) – GARCH (1, 1) to
reinforce the theoretical results obtained earlier for samples of size n=500, n=700 and
n=1000. The error term is assumed to be independent and identically distributed
following standard normal distribution. Figure 1, is an illustration of the AR (1) –
GARCH (1, 1) and in Figure 2 we superimpose different QAR function estimates (at
respectively) “lines” on the AR-GARCH process “points”.
The Interquantile Autoregression range function was estimated for all sample sizes at
(a) =0.99 and 0.01 (b) =0.95 and 0.05 (c) =0.90 and 0.10 and (d) =0.75 and 0.25.
Figure 3, illustrates on the superimposing of symmetric quantile autoregression
functions on the AR (1) – GARCH (1, 1) process. The computed volatility is

2042 D. N. Mutunga, P. N. Mwita and B. K. Muema
compared the true volatility and as seen in Figure 4, the estimated volatility follows
the same pattern as the true volatility.
Quantiles exhibit a property of been robust to outliers. This is clearly illustrated in
Figure 5 where its show how the parameters are dynamic from one quantile level to
another. This makes the quantile autoregression model parameters adapt appropriately
to capture outliers wherever they exist. To test the performance of the volatility
estimator, we use its Mean Absolute Proportionate Error (MAPE).
( ( ))
∑|
( ) ( )
( )|
As tabulated on Table 1, it is seen that the volatility estimator converges to the true
volatility as the sample size increases. When the sample size is increased the MAPE
tends to zero. That is; . / .
/ as . This property proofs the
consistency of our estimates.
Figure 1: The simulated AR (1) – GARCH (1, 1) process
From the plot, we can see that there is; volatility clustering, low auto autocorrelation,
high autocorrelation which are the stylistic features of financial data. Thus the AR (1)-
GARCH (1, 1) can model financial phenomenon.

Conditional volatility estimation 2043
Figure 2: AR (1)-GARCH (1, 1) process (points) with Estimated QARF (green lines) superimposed.
Figure 3: AR (1)-GARCH (1, 1) process (points) with Estimated QARF (red lines) “upper and lower quantiles”) superimposed

2044 D. N. Mutunga, P. N. Mwita and B. K. Muema
Figure 4: The Estimated Volatility “green dotted line” at different Quantiles superimposed on the True Volatility (GARCH generated) for a sample of size 1000
Figure 5: A plot of Quantile Autoregression Function parameter Estimates for different quantiles
Table 1: MAPE table with Increasing Sample sizes under different quantile levels
THETA
-Quantile
level
SAMPLE SIZE
N=500 N=700 N=1000
0.99 0.08879089 0.07060485 0.05853213
0.95 0.08214568 0.07584826 0.06694122
0.90 0.09705549 0.0843745 0.06034376
0.75 0.1164644 0.07893194 0.05859721

Conditional volatility estimation 2045
4. CONCLUSION
From the research in this paper we have come up with a quantile autoregression
model, QAR – GARCH used in estimation of market risk volatility. The model being
based on the interquantile autoregression range framework we have found that the
method is dynamic and robust to outliers. The theoretical results obtained in this paper
agree with the simulated results that the volatility estimator is consistent.
Further investigations can be done on cases where the error distribution is asymmetric.
The method can also be improved by incorporating cases of data censoring. Future
extension of the methodology can be done on Bayesian quantile autoregression and
developing the methodogy for forecasting.
2046 D. N. Mutunga, P. N. Mwita and B. K. Muema
REFERENCES
[1] T. Bollerslev, (1986), “Generalized autoregressive conditional
Heteroscedasticity”, Journal of Econometrics, 31, 307–327.
[2] R. Koenker and J. Bassett (1978), “Regression Quantiles”, Econometrica 46 (1),
pp. 33–50.
[3] N. P. Mwita (2003), “Semi parametric Estimation of Conditional Quantiles for
Time Series, with Applications in Finance”, Ph. D Thesis, University of
Kaiserslautern-Germany.
[4] N. P. Mwita (2010), “Estimation of T-Period’s Ahead Extreme Quantile
Autoregression Function”, African Journal of Mathematics and Computer Science
Research Vol. 3(4), pp. 60-67.
[5] A. Weiss (1991), “Estimating Non Linear Dynamic models using Least Absolute
Error Estimation”, Econometric Theory, 7: 46-68.
[6] H. White (1994), “Estimation, Inference and Specification Analysis”, Cambridge
University Press.
Received: July 11, 2014