Embed Size (px)
Citation preview
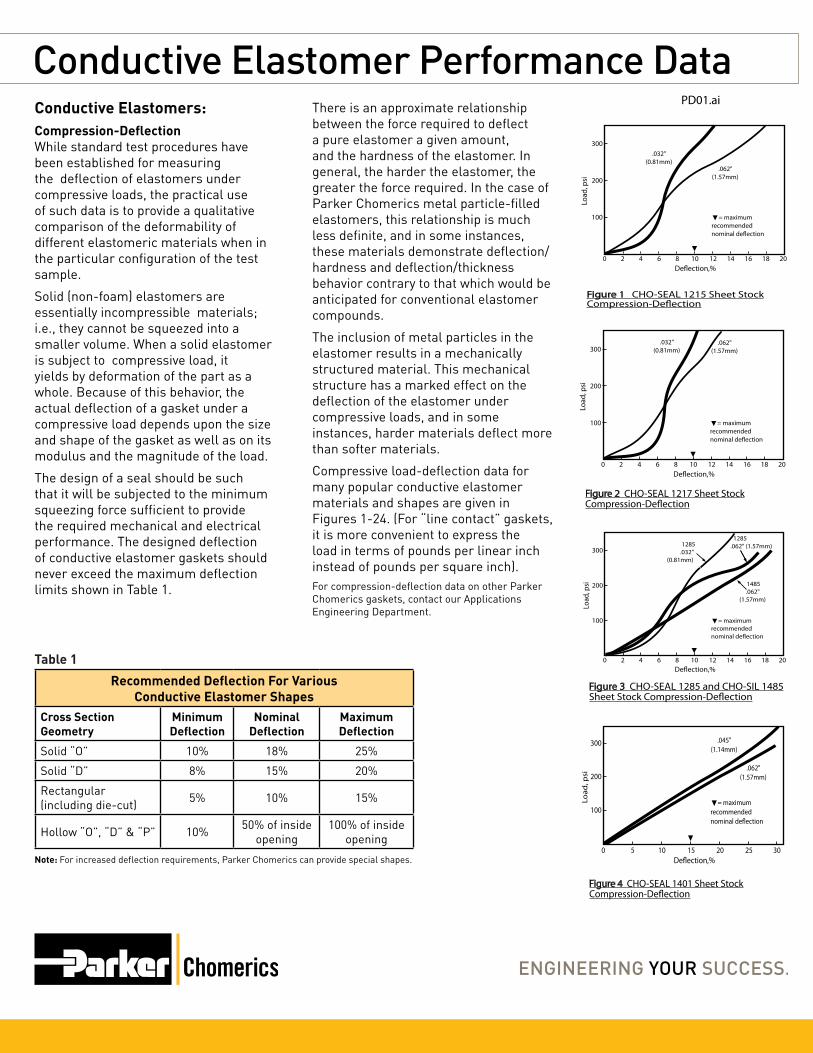
Conductive Elastomers: Compression-Deflection While standard test procedures have been established for measuring the deflection of elastomers under compressive loads, the practical use of such data is to provide a qualitative comparison of the deformability of different elastomeric materials when in the particular configuration of the test sample.
Solid (non-foam) elastomers are essentially incompressible materials; i.e., they cannot be squeezed into a smaller volume. When a solid elastomer is subject to compressive load, it yields by deformation of the part as a whole. Because of this behavior, the actual deflection of a gasket under a compressive load depends upon the size and shape of the gasket as well as on its modulus and the magnitude of the load.
The design of a seal should be such that it will be subjected to the minimum squeezing force sufficient to provide the required mechanical and electrical performance. The designed deflection of conductive elastomer gaskets should never exceed the maximum deflection limits shown in Table 1.
Conductive Elastomer Performance DataThere is an approximate relationship between the force required to deflect a pure elastomer a given amount, and the hardness of the elastomer. In general, the harder the elastomer, the greater the force required. In the case of Parker Chomerics metal particle-filled elastomers, this relationship is much less definite, and in some instances, these materials demonstrate deflection/hardness and deflection/thickness behavior contrary to that which would be anticipated for conventional elastomer compounds.
The inclusion of metal particles in the elastomer results in a mechanically structured material. This mechanical structure has a marked effect on the deflection of the elastomer under compressive loads, and in some instances, harder materials deflect more than softer materials.
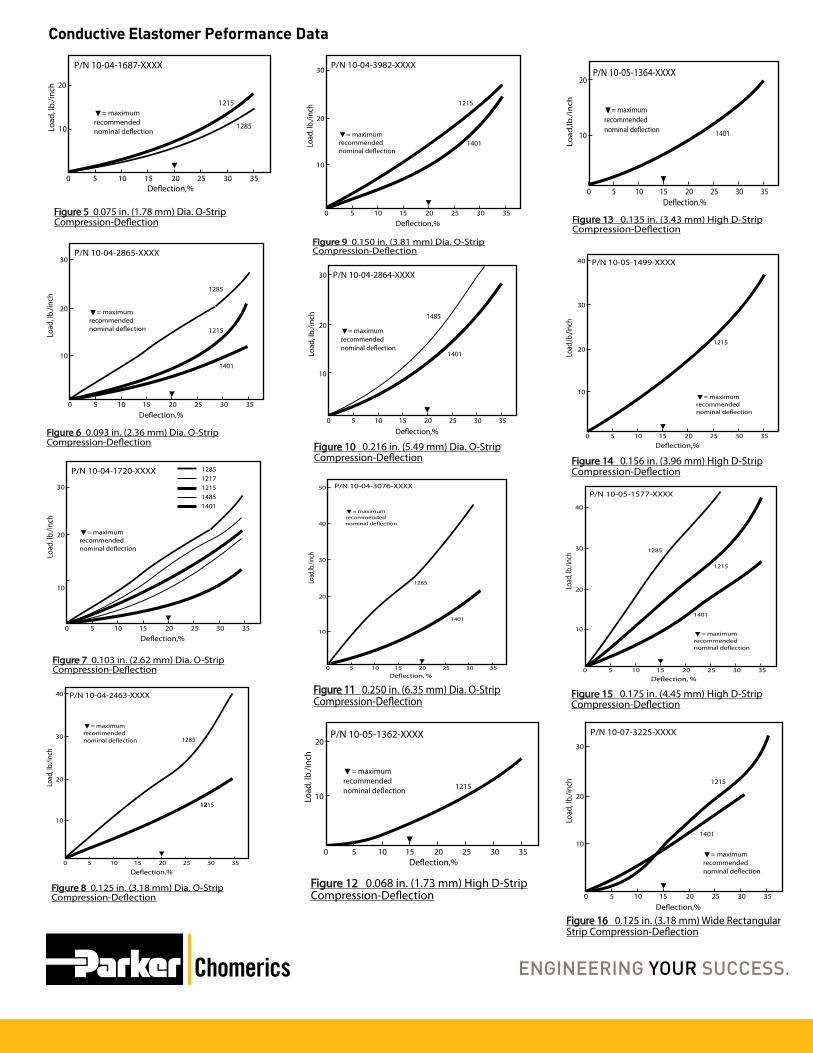
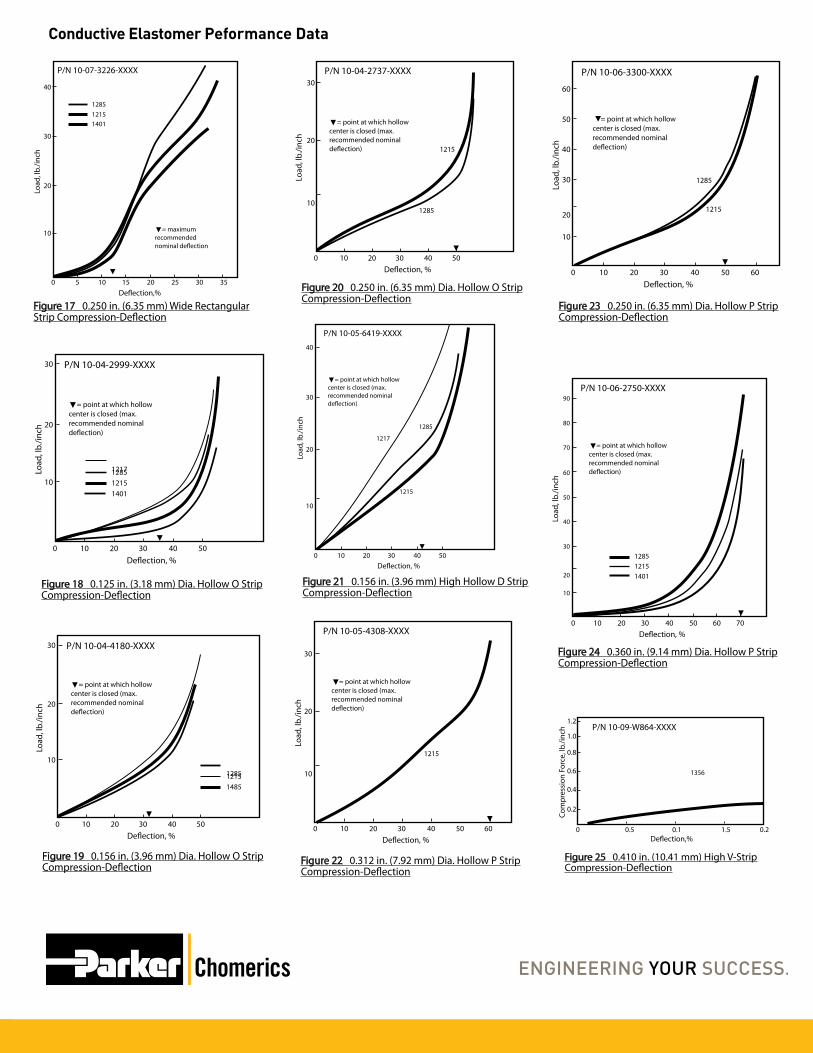
Compressive load-deflection data for many popular conductive elastomer materials and shapes are given in Figures 1-24. (For “line contact” gaskets, it is more convenient to express the load in terms of pounds per linear inch instead of pounds per square inch). For compression-deflection data on other Parker Chomerics gaskets, contact our Applications Engineering Department.
Table 1
Recommended Deflection For Various Conductive Elastomer Shapes
Cross Section Geometry
Minimum Deflection
Nominal Deflection
Maximum Deflection
Solid “O” 10% 18% 25%
Solid “D” 8% 15% 20%
Rectangular (including die-cut) 5% 10% 15%
Hollow “O”, “D” & “P” 10% 50% of inside opening
100% of inside opening
Note: For increased deflection requirements, Parker Chomerics can provide special shapes.
100
200
300
Deection,%
Load
, psi
= maximumrecommendednominal deection
.032"(0.81mm)
.062"(1.57mm)
0 2 4 6 8 10 12 14 16 18 20
PD01.ai
Figure 1 CHO-SEAL 1215 Sheet StockCompression-Deection
100
200
300
Deection,%
Load
, psi
= maximumrecommendednominal deection
.032"(0.81mm)
.062"(1.57mm)
0 2 4 6 8 10 12 14 16 18 20
Figure 2 CHO-SEAL 1217 Sheet StockCompression-Deection
100
200
300
Deection,%
Load
, psi
= maximumrecommendednominal deection
1285.032"
(0.81mm)
1285.062" (1.57mm)
1485.062"
(1.57mm)
0 2 4 6 8 10 12 14 16 18 20
Figure 3 CHO-SEAL 1285 and CHO-SIL 1485Sheet Stock Compression-Deection
100
200
300
Deection,%
Load
, psi
= maximumrecommendednominal deection
.045"(1.14mm)
.062"(1.57mm)
0 5 10 15 20 25 30
Figure 4 CHO-SEAL 1401 Sheet StockCompression-Deection
Conductive Elastomer Peformance Data
10
20
Deection,%
Load
, lb.
/inch
= maximumrecommendednominal deection
1215
1285
0 5 10 15 20 25 30 35
P/N 10-04-1687-XXXX
Figure 5 0.075 in. (1.78 mm) Dia. O-StripCompression-Deection
10
20
30
Load
, lb.
/inch
= maximumrecommendednominal deection
0 5 10 15 20 25 30 35
1215
1285
1401
P/N 10-04-2865-XXXX
Deection,%
Figure 6 0.093 in. (2.36 mm) Dia. O-StripCompression-Deection
10
20
30
Load
, lb.
/inch
= maximumrecommendednominal deection
0 5 10 15 20 25 30 35
12851217121514851401
P/N 10-04-1720-XXXX
Deection,%
Figure 7 0.103 in. (2.62 mm) Dia. O-StripCompression-Deection
10
20
30
40
Load
, lb./i
nch
= maximumrecommendednominal deection
0 5 10 15 20 25 30 35
121215
1285
P/N 10-04-2463-XXXX
Deection,%
Figure 8 0.125 in. (3.18 mm) Dia. O-StripCompression-Deection
10
20
30
Load
, lb.
/inch
= maximumrecommendednominal deection
0 5 15 20 25 30 35
1215
1401
P/N 10-04-3982-XXXX
Deection,%10
Figure 9 0.150 in. (3.81 mm) Dia. O-StripCompression-Deection
10
20
30
Load
, lb.
/inch
= maximumrecommendednominal deection
0 5 10 15 20 25 30 35
1485
1401
P/N 10-04-2864-XXXX
Deection,%
Figure 10 0.216 in. (5.49 mm) Dia. O-StripCompression-Deection
10
20
30
40
50
Load
,lb./in
ch
= maximumrecommendednominal deection
0 5 10 15 20 25 30 35
1401
1285
P/N 10-04-3076-XXXX
Deection, %
Figure 11 0.250 in. (6.35 mm) Dia. O-StripCompression-Deection
10
20
Deection,%
Load
, lb.
/inch
= maximumrecommendednominal deection
0 5 10 15 20 25 30 35
P/N 10-05-1362-XXXX
1215
Figure 12 0.068 in. (1.73 mm) High D-StripCompression-Deection
10
20
30
40
Load
,lb./i
nch
= maximumrecommendednominal deection
0 5 10 15 20 25 30 35
1215
P/N 10-05-1499-XXXX
Deection,%
Figure 14 0.156 in. (3.96 mm) High D-StripCompression-Deection
10
20
30
40
Load
, lb./i
nch
= maximumrecommendednominal deection
0 5 10 15 20 25 30 35
1215
1285
1401
P/N 10-05-1577-XXXX
Deection, %
Figure 15 0.175 in. (4.45 mm) High D-StripCompression-Deection
10
20
30
Load
, lb.
/inch
= maximumrecommendednominal deection
0 5 10 15 20 25 30 35
1215
1401
P/N 10-07-3225-XXXX
Deection,%
Figure 16 0.125 in. (3.18 mm) Wide RectangularStrip Compression-Deection
10
20
Deection,%
Load
,lb./
inch
= maximumrecommendednominal deection
0 5 10 15 20 25 30 35
P/N 10-05-1364-XXXX
1401
Figure 13 0.135 in. (3.43 mm) High D-StripCompression-Deection
Conductive Elastomer Peformance Data
128512151401
10
20
30
40
Load
, lb.
/inch
= maximumrecommendednominal deection
0 5 10 15 20 25 30 35
P/N 10-07-3226-XXXX
Deection,%
Figure 17 0.250 in. (6.35 mm) Wide RectangularStrip Compression-Deection
1217128512151401
10
20
30
Load
, lb.
/inch
0 10 20 30 40 50
P/N 10-04-2999-XXXX
Deection, %
= point at which hollowcenter is closed (max.recommended nominaldeection)
Figure 18 0.125 in. (3.18 mm) Dia. Hollow O StripCompression-Deection
128512151485
10
20
30
Load
, lb.
/inch
0 10 20 30 40 50
P/N 10-04-4180-XXXX
Deection, %
= point at which hollowcenter is closed (max.recommended nominaldeection)
Figure 19 0.156 in. (3.96 mm) Dia. Hollow O StripCompression-Deection
10
20
30
Load
, lb.
/inch
0 10 20 30 40 50
P/N 10-04-2737-XXXX
Deection, %
1215
1285
= point at which hollowcenter is closed (max.recommended nominaldeection)
Figure 20 0.250 in. (6.35 mm) Dia. Hollow O StripCompression-Deection
10
40
20
30
Load
, lb.
/inch
= point at which hollowcenter is closed (max.recommended nominaldeection)
0 10 20 30 40 50
P/N 10-05-6419-XXXX
Deection, %
1215
1217
1285
Figure 21 0.156 in. (3.96 mm) High Hollow D StripCompression-Deection
10
20
30
Load
, lb.
/inch
0 10 20 30 40 50 60
P/N 10-05-4308-XXXX
Deection, %
= point at which hollowcenter is closed (max.recommended nominaldeection)
1215
Figure 22 0.312 in. (7.92 mm) Dia. Hollow P StripCompression-Deection
20
40
60
10
30
50
Load
, lb.
/inch
0 10 20 30 40 50 60
P/N 10-06-3300-XXXX
Deection, %
= point at which hollowcenter is closed (max.recommended nominaldeection)
1215
1285
Figure 23 0.250 in. (6.35 mm) Dia. Hollow P StripCompression-Deection
20
40
60
10
30
50
70
90
80
Load
, lb.
/inch
0 10 20 30 40 50 60 70
P/N 10-06-2750-XXXX
Deection, %
= point at which hollowcenter is closed (max.recommended nominaldeection)
128512151401
Figure 24 0.360 in. (9.14 mm) Dia. Hollow P StripCompression-Deection
0.6
1.0
Deection,%
Com
pres
sion
For
ce, l
b./in
ch
0 0.5 0.1 1.5 0.2
P/N 10-09-W864-XXXX
1356
Figure 25 0.410 in. (10.41 mm) High V-StripCompression-Deection
0.2
0.4
0.8
1.2
Conductive Elastomer Peformance Data
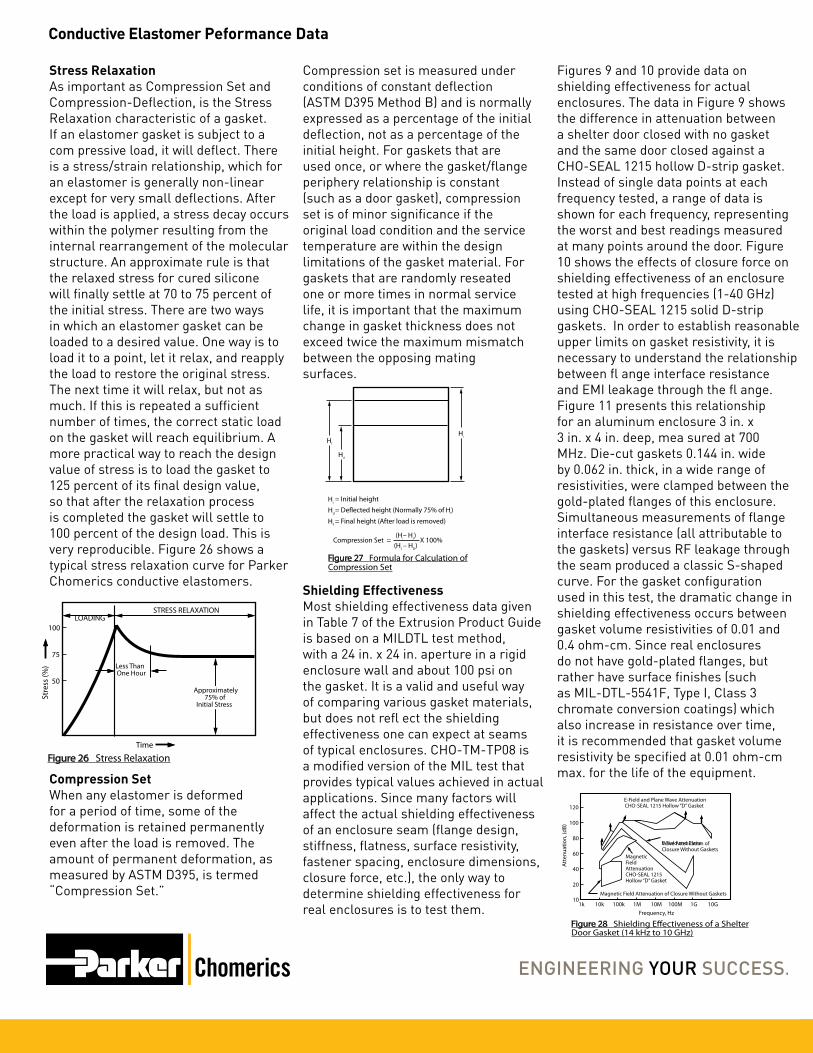
Stress Relaxation As important as Compression Set and Compression-Deflection, is the Stress Relaxation characteristic of a gasket. If an elastomer gasket is subject to a com pressive load, it will deflect. There is a stress/strain relationship, which for an elastomer is generally non-linear except for very small deflections. After the load is applied, a stress decay occurs within the polymer resulting from the internal rearrangement of the molecular structure. An approximate rule is that the relaxed stress for cured silicone will finally settle at 70 to 75 percent of the initial stress. There are two ways in which an elastomer gasket can be loaded to a desired value. One way is to load it to a point, let it relax, and reapply the load to restore the original stress. The next time it will relax, but not as much. If this is repeated a sufficient number of times, the correct static load on the gasket will reach equilibrium. A more practical way to reach the design value of stress is to load the gasket to 125 percent of its final design value, so that after the relaxation process is completed the gasket will settle to 100 percent of the design load. This is very reproducible. Figure 26 shows a typical stress relaxation curve for Parker Chomerics conductive elastomers.
Compression set is measured under conditions of constant deflection (ASTM D395 Method B) and is normally expressed as a percentage of the initial deflection, not as a percentage of the initial height. For gaskets that are used once, or where the gasket/flange periphery relationship is constant (such as a door gasket), compression set is of minor significance if the original load condition and the service temperature are within the design limitations of the gasket material. For gaskets that are randomly reseated one or more times in normal service life, it is important that the maximum change in gasket thickness does not exceed twice the maximum mismatch between the opposing mating surfaces.
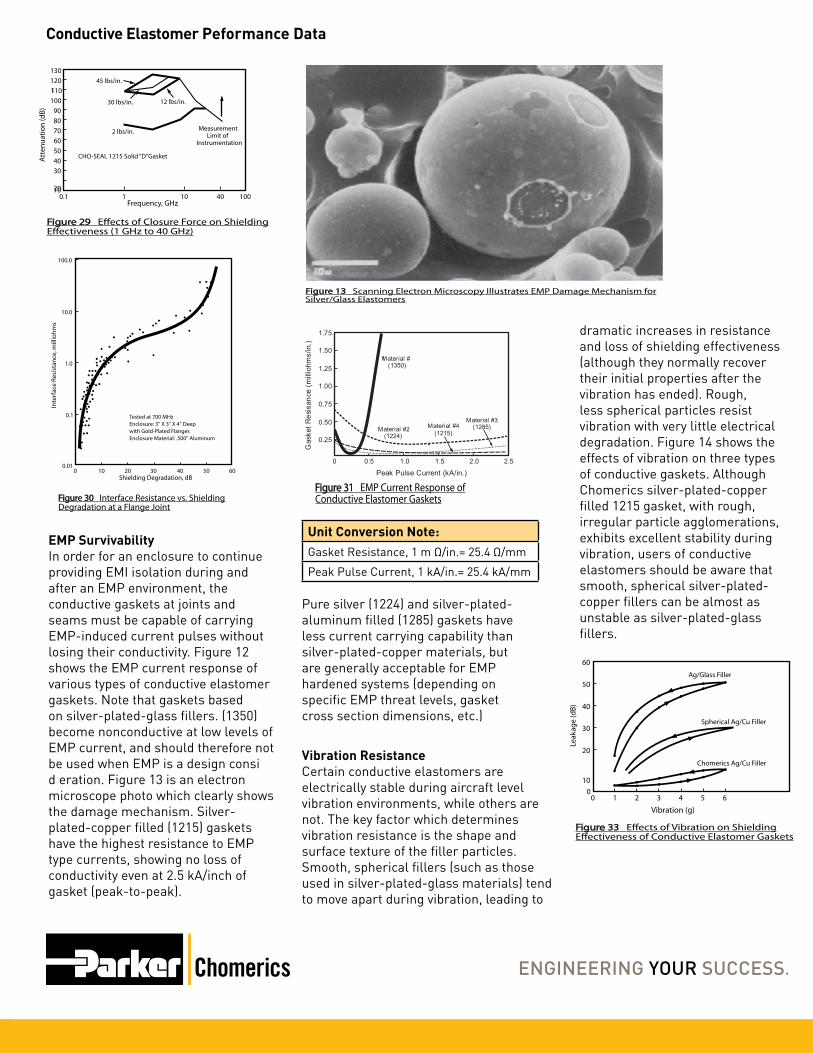
Figures 9 and 10 provide data on shielding effectiveness for actual enclosures. The data in Figure 9 shows the difference in attenuation between a shelter door closed with no gasket and the same door closed against a CHO-SEAL 1215 hollow D-strip gasket. Instead of single data points at each frequency tested, a range of data is shown for each frequency, representing the worst and best readings measured at many points around the door. Figure 10 shows the effects of closure force on shielding effectiveness of an enclosure tested at high frequencies (1-40 GHz) using CHO-SEAL 1215 solid D-strip gaskets. In order to establish reasonable upper limits on gasket resistivity, it is necessary to understand the relationship between fl ange interface resistance and EMI leakage through the fl ange. Figure 11 presents this relationship for an aluminum enclosure 3 in. x 3 in. x 4 in. deep, mea sured at 700 MHz. Die-cut gaskets 0.144 in. wide by 0.062 in. thick, in a wide range of resistivities, were clamped between the gold-plated flanges of this enclosure. Simultaneous measurements of flange interface resistance (all attributable to the gaskets) versus RF leakage through the seam produced a classic S-shaped curve. For the gasket configuration used in this test, the dramatic change in shielding effectiveness occurs between gasket volume resistivities of 0.01 and 0.4 ohm-cm. Since real enclosures do not have gold-plated flanges, but rather have surface finishes (such as MIL-DTL-5541F, Type I, Class 3 chromate conversion coatings) which also increase in resistance over time, it is recommended that gasket volume resistivity be specified at 0.01 ohm-cm max. for the life of the equipment.
LOADINGSTRESS RELAXATION
Less ThanOne Hour
Approximately75% of
Initial Stress
Time
Stre
ss (%
)
100
75
50
Figure 26 Stress Relaxation
Hd
Hd
Hi
Hf
= Initial height
= Deected height (Normally 75% of HI)
= Final height (After load is removed)
Hf
Hi
Compression Set = X 100%(H
I– H
F)
(HI – HD)
Figure 27 Formula for Calculation ofCompression Set
Compression Set When any elastomer is deformed for a period of time, some of the deformation is retained permanently even after the load is removed. The amount of permanent deformation, as measured by ASTM D395, is termed “Compression Set.”
Shielding Effectiveness Most shielding effectiveness data given in Table 7 of the Extrusion Product Guide is based on a MILDTL test method, with a 24 in. x 24 in. aperture in a rigid enclosure wall and about 100 psi on the gasket. It is a valid and useful way of comparing various gasket materials, but does not refl ect the shielding effectiveness one can expect at seams of typical enclosures. CHO-TM-TP08 is a modified version of the MIL test that provides typical values achieved in actual applications. Since many factors will affect the actual shielding effectiveness of an enclosure seam (flange design, stiffness, flatness, surface resistivity, fastener spacing, enclosure dimensions, closure force, etc.), the only way to determine shielding effectiveness for real enclosures is to test them.
10
20
40
60
80
100
120
1k 10k 100k 1M 10M 100M 1G 10GFrequency, Hz
Att
enua
tion,
(dB)
E-Field and PlaneWave Attenuation ofClosure Without Gaskets
MagneticFieldAttenuationCHO-SEAL 1215Hollow “D” Gasket
E-Field and Plane Wave AttenuationCHO-SEAL 1215 Hollow “D” Gasket
Magnetic Field Attenuation of Closure Without Gaskets
Figure 28 Shielding Eectiveness of a ShelterDoor Gasket (14 kHz to 10 GHz)
Conductive Elastomer Peformance Data
EMP Survivability In order for an enclosure to continue providing EMI isolation during and after an EMP environment, the conductive gaskets at joints and seams must be capable of carrying EMP-induced current pulses without losing their conductivity. Figure 12 shows the EMP current response of various types of conductive elastomer gaskets. Note that gaskets based on silver-plated-glass fillers. (1350) become nonconductive at low levels of EMP current, and should therefore not be used when EMP is a design consi d eration. Figure 13 is an electron microscope photo which clearly shows the damage mechanism. Silver-plated-copper filled (1215) gaskets have the highest resistance to EMP type currents, showing no loss of conductivity even at 2.5 kA/inch of gasket (peak-to-peak).
dramatic increases in resistance and loss of shielding effectiveness (although they normally recover their initial properties after the vibration has ended). Rough, less spherical particles resist vibration with very little electrical degradation. Figure 14 shows the effects of vibration on three types of conductive gaskets. Although Chomerics silver-plated-copper filled 1215 gasket, with rough, irregular particle agglomerations, exhibits excellent stability during vibration, users of conductive elastomers should be aware that smooth, spherical silver-plated-copper fillers can be almost as unstable as silver-plated-glass fillers.
0.1
0.01
1.0
10.0
100.0
0 10 20 30 40 50 60Shielding Degradation, dB
Inte
rfac
e Re
sist
ance
, mill
iohm
s
Tested at 700 MHzEnclosure: 3" X 3" X 4" Deepwith Gold-Plated FlangesEnclosure Material: .500" Aluminum
Figure 30 Interface Resistance vs. ShieldingDegradation at a Flange Joint
0.25
0 0.5 1.0 1.5 2.0 2.5
0.50
0.75
1.00
1.25
1.50
1.75
Gas
ket R
esis
ance
(mill
iohm
s/in
.)
Material #1(1350)
Material #2(1224)
Material #4(1215)
Material #3(1285)
Peak Pulse Current (kA/in.)
Figure 31 EMP Current Response ofConductive Elastomer Gaskets
Unit Conversion Note:Gasket Resistance, 1 m Ω/in.= 25.4 Ω/mm
Peak Pulse Current, 1 kA/in.= 25.4 kA/mm
Pure silver (1224) and silver-plated-aluminum filled (1285) gaskets have less current carrying capability than silver-plated-copper materials, but are generally acceptable for EMP hardened systems (depending on specific EMP threat levels, gasket cross section dimensions, etc.)
Vibration Resistance Certain conductive elastomers are electrically stable during aircraft level vibration environments, while others are not. The key factor which determines vibration resistance is the shape and surface texture of the filler particles. Smooth, spherical fillers (such as those used in silver-plated-glass materials) tend to move apart during vibration, leading to
100
0 1 2 3 4 5 6
20
30
40
50
60
Leak
age
(dB)
Ag/Glass Filler
Spherical Ag/Cu Filler
Chomerics Ag/Cu Filler
Vibration (g)
Figure 33 Eects of Vibration on ShieldingEectiveness of Conductive Elastomer Gaskets
2010
30405060708090
1001110120130
0.1 1 10 40 100Frequency, GHz
CHO-SEAL 1215 Solid “D”Gasket
2 lbs/in.
30 lbs/in.
45 lbs/in.
12 lbs/in.
MeasurementLimit of
Instrumentation
Att
enua
tion
(dB)
Figure 29 Eects of Closure Force on ShieldingEectiveness (1 GHz to 40 GHz)
Figure 13 Scanning Electron Microscopy Illustrates EMP Damage Mechanism forSilver/Glass Elastomers
Conductive Elastomer Peformance Data
CHOMERICS is a registered trademark of Parker Hannifin Corporation. ® 2013 TB 1145 EN Reformatted Original document November 2000
www.chomerics.com www.parker.com/chomerics
Heat Aging The primary aging mechanism which affects electrical stability of conductive elastomers is the oxidation of filler particles. For materials based on pure silver fillers, particle oxidation is not generally a problem because the oxide of silver is relatively soft and reasonably conductive. If the filler particles are non-noble (such as copper, nickel, aluminum, etc.) they will oxidize readily over time and become nonconductive.
Outgassing Many spacecraft specifications require that nonmetallic components be virtually free of volatile residues which might outgas in the hard vacuum environment of space. The standard test method for determining outgassing behavior is ASTM E595-93, which provides for measurement of total mass loss (TML) and collected volatile condensable materials (CVCM) in a vacuum environment. Data for a number of Chomerics conductive elastomers, based on ASTM E595-93 testing done by NASA Goddard Spaceflight Center, is presented in Table 20. The normal specification limits or guide-lines on outgassing for NASA applications are 1% TML max., and 0.1% CVCM max.
Even silver-plated base metal powders, such as silver-plated-copper or silver-plated-aluminum will become non-conductive over time if the plating is not done properly (or if other processing variables are not properly controlled). These are generally batch control problems, with each batch being potentially good or bad. The most reliable method of predicting whether a batch will be electrically stable is to promote the rate at which poorly plated or processed particles will oxidize, by heat aging in an air circulating oven.
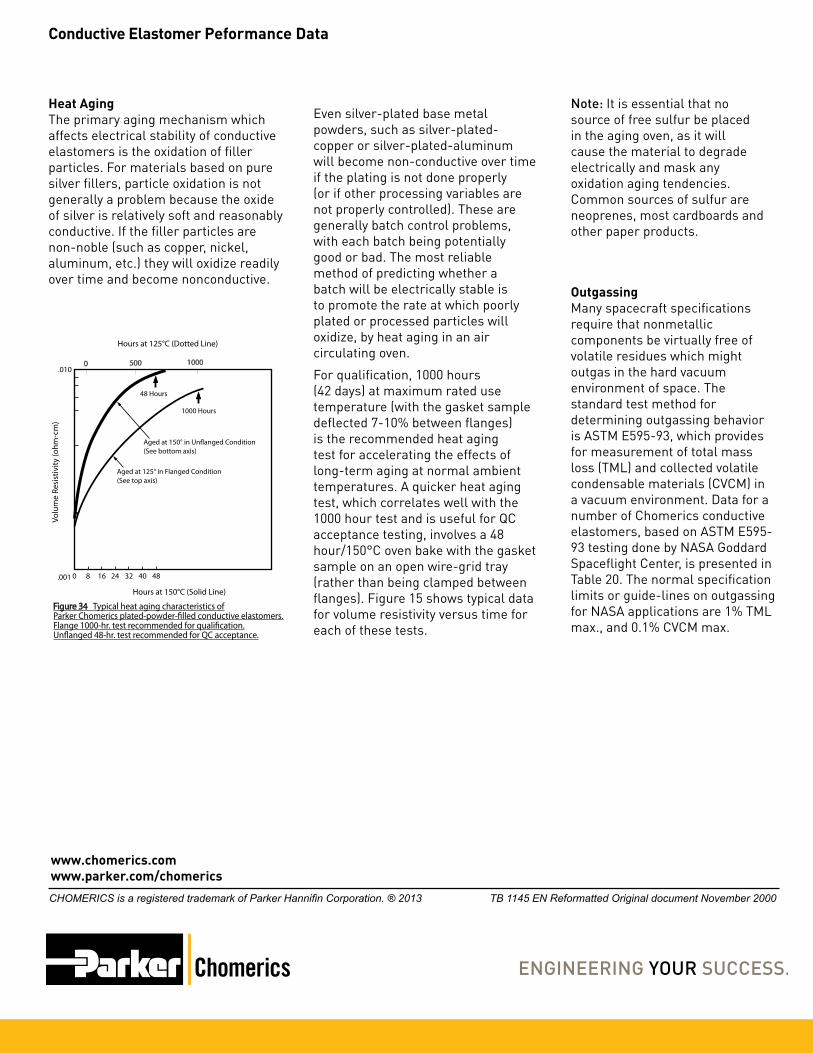
For qualification, 1000 hours (42 days) at maximum rated use temperature (with the gasket sample deflected 7-10% between flanges) is the recommended heat aging test for accelerating the effects of long-term aging at normal ambient temperatures. A quicker heat aging test, which correlates well with the 1000 hour test and is useful for QC acceptance testing, involves a 48 hour/150°C oven bake with the gasket sample on an open wire-grid tray (rather than being clamped between flanges). Figure 15 shows typical data for volume resistivity versus time for each of these tests.
.001
.010
Volu
me
Resi
stiv
ity (o
hm-c
m)
0 8 16 24 32 40 48
Hours at 150°C (Solid Line)
48 Hours
1000 Hours
Aged at 150° in Unanged Condition(See bottom axis)
Aged at 125° in Flanged Condition(See top axis)
0 500 1000
Hours at 125°C (Dotted Line)
Figure 34 Typical heat aging characteristics ofParker Chomerics plated-powder-lled conductive elastomers.Flange 1000-hr. test recommended for qualication.Unanged 48-hr. test recommended for QC acceptance.
Note: It is essential that no source of free sulfur be placed in the aging oven, as it will cause the material to degrade electrically and mask any oxidation aging tendencies. Common sources of sulfur are neoprenes, most cardboards and other paper products.