Embed Size (px)
Citation preview
KU ScholarWorks | The University of Kansas Pre-1923 Dissertations and Theses Collection
Conductivity as applied to water
analysis
May 15th, 1913
by Truman M. Godfrey
This work was digitized by the Scholarly Communications program staff in the KU Libraries’ Center for Digital Scholarship.
http://kuscholarworks.ku.edu
Submitted to the School of Engineering of the
University of Kansas in partial fulfillment of the
requirements for the Degree of Bachelor of Science
CONDUCTIVITY AS APPLIED
CONDUCTIVITY AS APPLIED TO WATER ANALYSIS by
TRUMAN M. GODFREY
Presented to the Faculty of the
School of Engineering of the
University of Kansas
In Partial Fulfillment of the Requirements for the Degree of
BACHELOR OF SCIENCE
May 15, 1913.
R000S5 3A05&
Lawrence, Kansas. May 15, 1913
Dr. E. H. S. Bailey, Director of the Chemical Laboratories,
University of Kansas, Lawrence, Kans as•
Dear Sir: In the following paper, which I present
as my senior thesis, I have attempted to apply conductivity measurements to water analysis in various ways as suggested by Prof. C. C. Young of the State V/ater Survey. I have also undertaken to investigate the claims made for the lfDionic'Water Tester", a portable conductivity apparatus recently placed upon the market. In all this work I am much indebted to Professor Young for his able suggestions and his apt interpretations of the results.
CONDUCTIVITY AS APPLIED TO WATER ANALYSIS
A machine known as the "Dionic Water Testerff has recently been put on the market by Bvershed and Vignoles of London, for the purpose of examining waters by means of their conductivities instead of some of the usual chemical tests. It is the object of the following work to investigate the possibility and accuracy of the applications which are claimed tor this machine, and of any other applications of conductivity measurements to water analysis.
Conductivity may be measured either by the direct current or the alternating current and wheatstone bridge method. The "Dionic Water Tester", which uses the former method, consists essentially of two platinum electrodes placed in the ends of a "U" tube which contains the solution to be tested. A side tube is provided for
a thermometer so that the temperature reading may be taken simultaneously with the conductivity
z.
reading. An error of 1° Centigrade in the temperature of the water would cause a change of 2% in the conductivity reading. A direct current of .004 amperes at 100 volts is furnished "by a small hand driven dynamo, controlled by a constant speed clutch. The conductivity is read directly on a scale in units of the reciprocal of one megohm. The scale is corrected for hack E• M.F• due to gas polarization. A table for temperature corrections is furnished with the instrument.
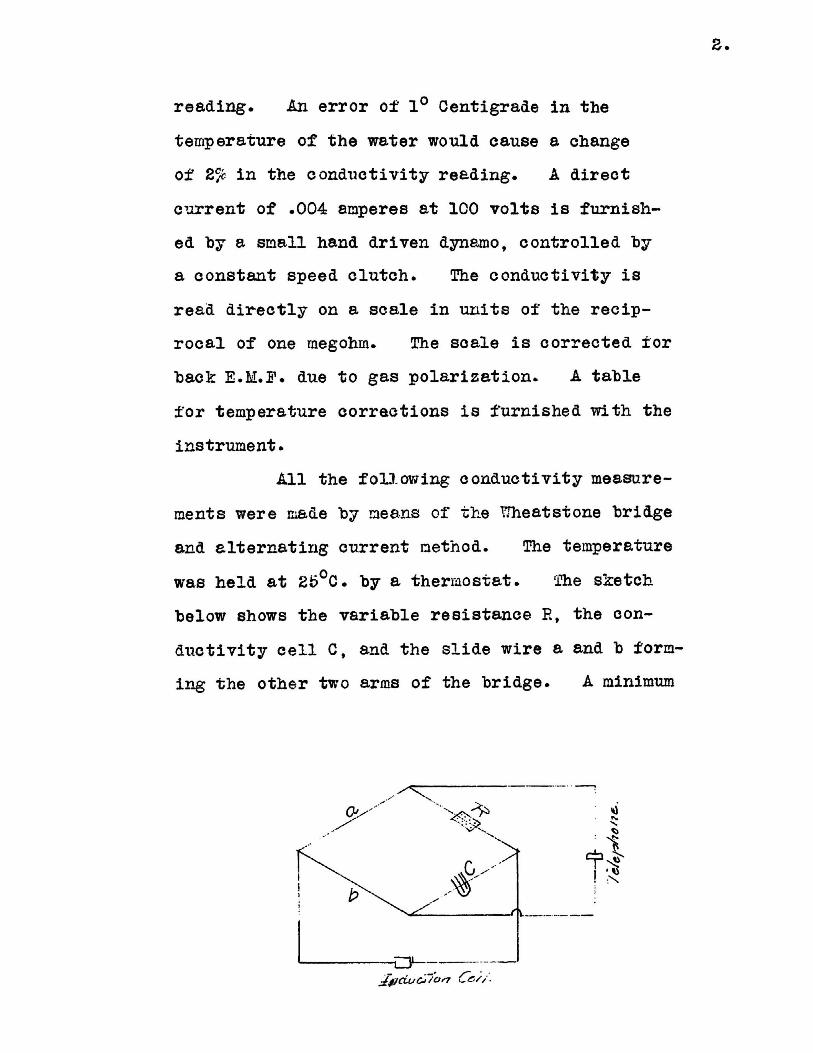
All the following conductivity measurements were made by means of the YJheatstone "bridge and alternating current method. The temperature was held at 25°C. hy a thermostat. The sketch below shows the variable resistance R, the conductivity cell C, and the slide wire a and b forming the other two arms of the bridge. A minimum
5.
o±' sound in the telephone receiver indicates when the bridge is in balance. In making a reading the plugs in the resistance box were shifted until the minimum was about reached, when the bridge contact was at the center of the bridge. The contact was then moved until a definite minimum was observed. This point was approached from both left and right, and the mean of the readings taken. If the minimum point was indefinite, as was the case with very dilute solutions when the buzz in the telephone receiver was very faint, the readings were taken when the smallest definite buzz could be distinguished clearly, approaching from left and right, and the mean of the readings taken. Two more sets of readings were taken in each case by increasing and decreasing the resistance in the box about ten per cent. This gave three checks on the resistance, all being read near the middle of the bridge. UlTien the readings are made near the middle of the bridge, any error in reading makes less difference in the calculation, since a is nearly equal be in the ratio f- .
b This form of apparatus is accurate to one or two tenths of one per cent. With the bridge in balance the resistance of the cell is given by the ratio - ~
a times the resistance R.
The unit of conductivity, the wmho I !
is the reciprocal of the ohm. Conductivity is
4
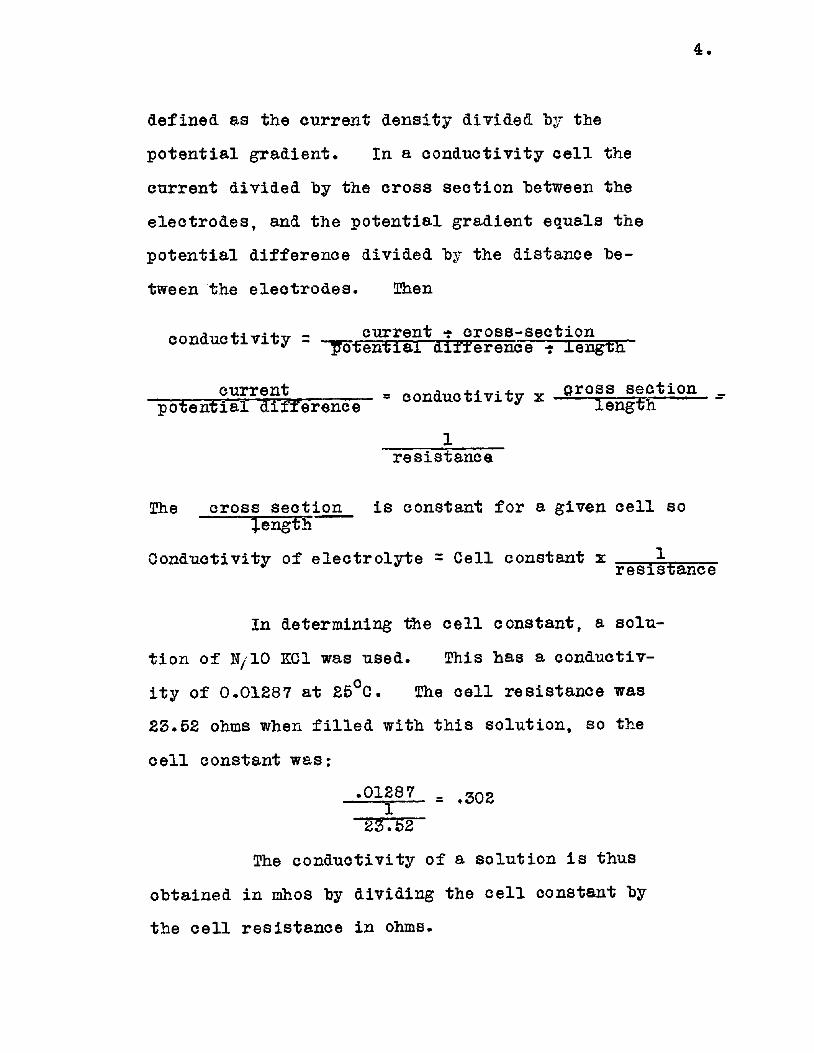
defined as the current density divided by the potential gradient. In a conductivity cell the current divided by the cross section between the electrodes, and the potential gradient equals the potential difference divided by the distance between the electrodes. Then
conductivity ^ ^ l l f length
p o t e n t " f e r e n c e ' conductivity x E j e c t i o n
resistance
The cross section is constant for a given cell so length
Conductivity of electrolyte = Cell constant x i1.
resistance
In determining the cell constant, a solution of N/10 KCl was used. This has a conductivity of 0.01287 at 25°C. The cell resistance was 23.52 ohms when filled with this solution, so the cell constant was:
«01287 = .502 23.52
The conductivity of a solution is thus obtained in mhos by dividing the cell constant by the cell resistance in ohms.
5.
2Ia+ 42.9 Z + 63.7
l/2Ca+* 47.8 1/2 Mg** 43.0
HT 314.0
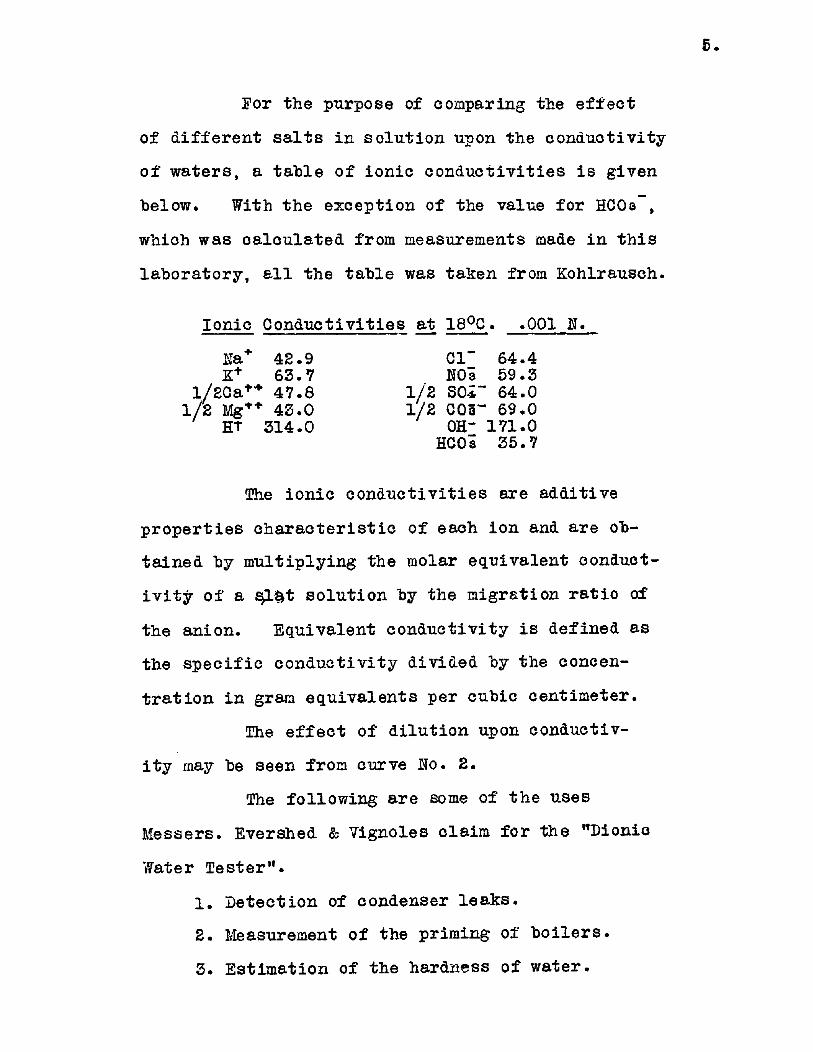
For the purpose of comparing the effect of different salts in solution upon the conductivity of waters, a table of ionic conductivities is given below. With the exception of the value for HC03~, which was calculated from measurements made in this laboratory, all the table was taken from Kohlrausch.
Ionic Conductivities at 18°C. .001 g. CI" 64.4 NOi 59.3
1/2 SQi~ 64.0 1/2 COr- 69.0
OH- 171.0 HCOa 35.7
The ionic conductivities are additive properties characteristic of each ion and are obtained by multiplying the molar equivalent conductivity of a ££L&t solution by the migration ratio of the anion. Equivalent conductivity is defined as the specific conductivity divided by the concentration in gram equivalents per cubic centimeter.
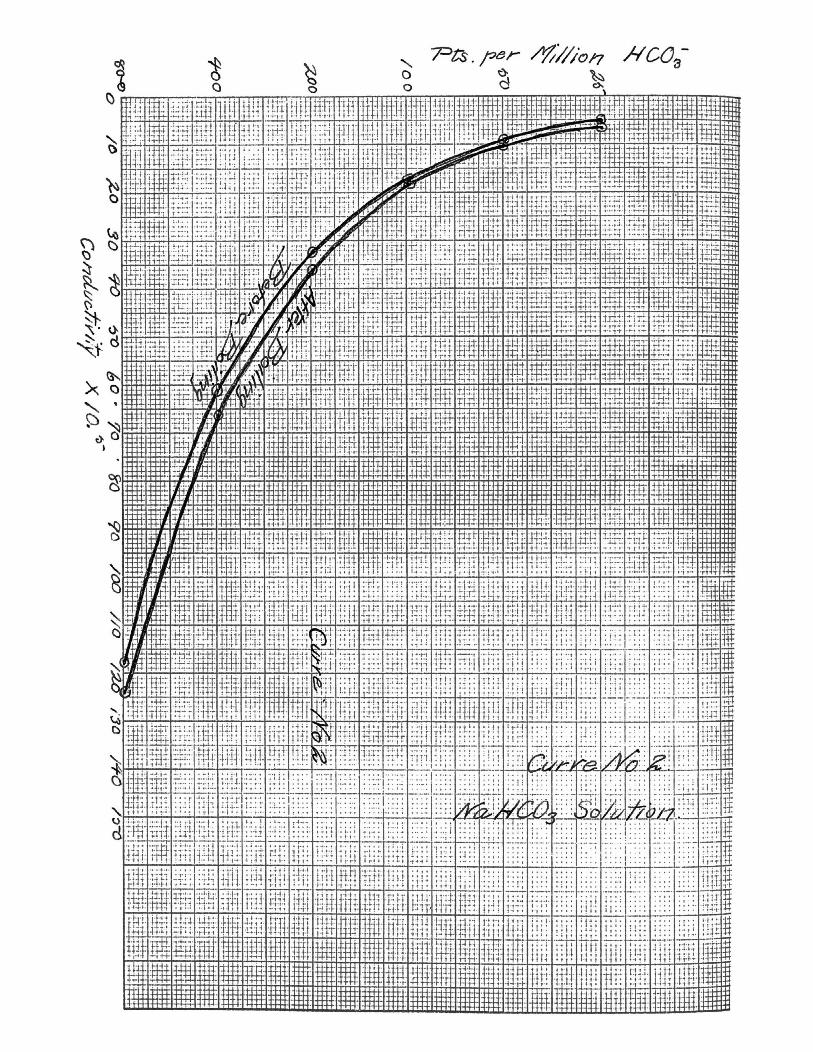
The effect of dilution upon conductivity may be seen from curve Wo. 2.
The following are some of the uses Messers. Evershed & Vignoles claim for the "Dionio Water Tester11.
1. Detection of condenser leaks. 2. Measurement of the priming of boilers. 3. Estimation of the hardness of water.
6.
4. Softening water. 5. Detection of sewage pollution. 6. Test of sewage effluent. 7. Estimation of the purity of distilled
water. 8. Checking the purity of a water supply.
In most cases, conductivity is a very satisfactory means of detecting condenser leaks and may also he used in estimating the extent of the leakage. The conductivity of a sample of condenser water from the University power plant was 30.7 x 10~ 6. Except in the case of very pure cooling water, such as mountain water, a small leakage would make a noticeable difference in the conductivity, as the average cooling water would have a conductivity of about 500 x 10~ 6. If sea water were being used for cooling, a much greater difference would be observed. In estimating the extent of the leakage, the conductivities of mixtures of distilled water with known percentages of cooling water are compared with a sample of the condenser water. In the absence of priming, this should give reliable results.
The extent of priming in boilers may be measured by the same method as condenser leakage, that is, by comparing the conductivities of samples of the condenser water when running under different
7.
loads with the conductivities of mixtures of boiler water and condenser water of known per cent.
In regard to the hardness of water Messrs. Evershed & Vignoles state the following:
"Water derived from springs or wells in the chalk is inevitably a hard water. ?/here there is no sewage pollution the conductivity is an accurate measure of the hardness, and the new method takes the place of the 'soap test 1, with all the advantages oi rapidity, precision and simplicity. The hardness may be due either to carbonate of lime or csrbonate of magnesia, or both; and if it is necessary to discriminate, a chemical analysis must be made once for all. After that, periodic tests of conductivity provide all the information required by a steam user. They indicate and measure any changes in hardness, and the corresponding alterations are easily made in the softening process or in the anti-fouling composition used in the boilers.
"The measure of hardness in grains per gallon may be deduced from the conductivity by means of the curve given in Fig. 3, which shows the relation between quantity of chalk in solution and conductivity."
This is oi value only when calcium aasA magnesium carbonates alone ere present, a condition which is extremely rare. A small quantity of other salts would entirely destroy the value of this application
8.
Evershed & Vignoles state:
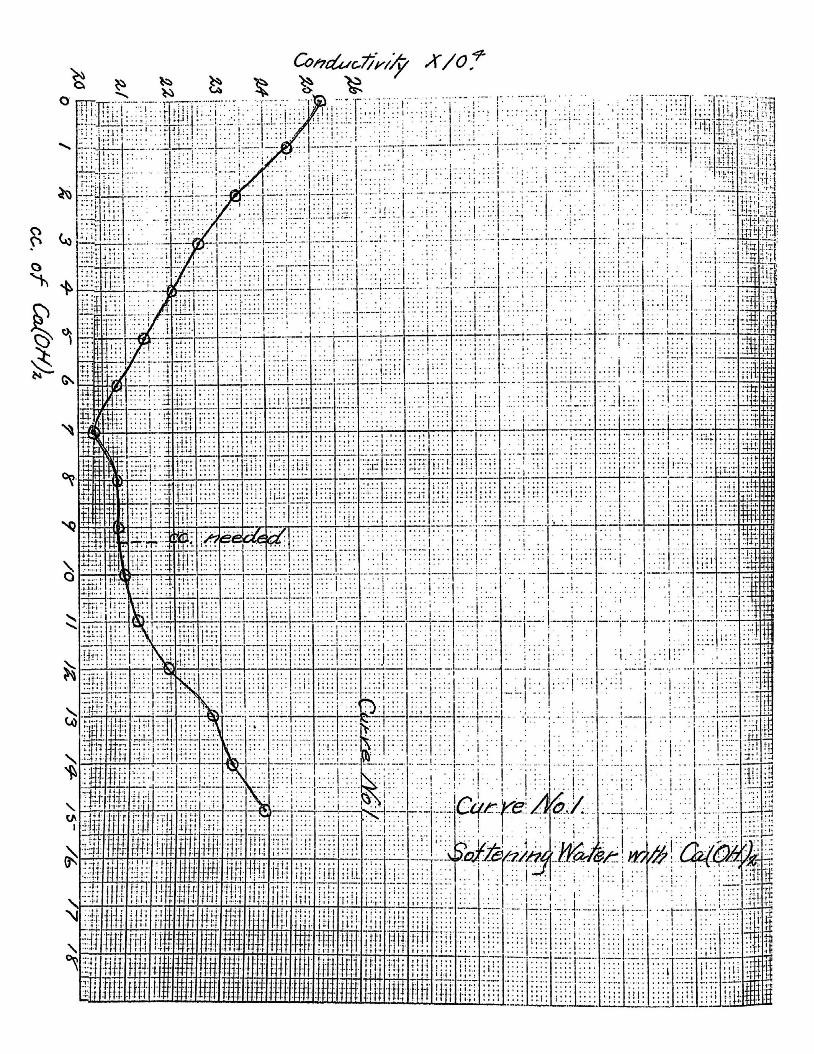
"TThen quicklime is added to hard water in order to soften it, the quantity required may be ascertained by adding lime in different proportions to the water and testing the conductivities. If the results are plotted as a curve connecting proportion of lime with conductivity, it will be found that as the quantity of lime is increased the conductivity diminishes until a minimum is reached, beyond which the addition of lime increases the conductivity. The point of minimum conductivity indicates the correct quantity oi lime.Tf
This scheme was tried out on water Uo.
553? containing 227.0 parts per million ECOa" and
27.5 of Mg* +.
Portions of 75.0 c c of this water
were placed in 100 c.c. bottles and different
amounts of a solution of Ca(0H)e containing
.00134 gm. per c.c. of CaO were run in each
bottle. They were then shaken and brought to
25°C. in the thermostat and their conductivities
determined. The curve o± the conductivity against
the cubic centimeters of Ca(0E)s solution added is
shown in Curve Uo. 1. The minimum conductivity
occurred when 124.5 parts per million of CaO had
been added. The calculated lime value of this
water is 167.0 parts per million of CaO. The
conductivity of the solution added was «00920, that
of the original water .00252. This increasing
addition of a solution of greater conductivity
would tend to make the minimum come too soon.
The presence of Hg** also has the same effect.
If only CaHC03 were present, the minimum on the
curve would give nearly the calculated value,
hut since the ltg+T ion of ionic conductivity
43., is replaced by the more mobile C a * * ion of
conductivity 47.3, the conductivity increases
before all the Mg** has been precipitated. The
The solubility of CaC03, 13 parts per million,
would also bring the minimum too low. Taking
all these factors into consideration, conduct
ivity can not be said to be a satisfactory
method of determining the lime value.
When softening a water of constant
composition with lime and soda ash, a record of
the conductivity before softening and after be
ing perfectly treated, would be a very accurate
method of control of the process for any excess
of lime or soda ash would give an enormous in
crease in conductivity, as the (OH)"" ion would
be liberated in either case and this is an ex
tremely mobile ion.
One of the most satisfactory and use
ful applications suggested for the "Dionic Water
Tester* is the detection of sewage pollution in
streams. By determining the conductivity of
samples taken above and below the sewer outlet, a very good idea of the extent of pollution could be obtained.
However, it is impossible to see how conductivity measurements could be of any value in testing sewage effluents,as the presence of varying quantities of nitrates would greatly change the conductivity.
Conductivity measurements form a very simple and accurate means of estimating the purity of distilled water. Ordinary distilled water from the tap in the Chemistry Building has
—ft
a conductivity of 28 x 10 mhos; good ammonia free water distilled over from cistern water gave 10 x K T 6 .
As a check upon the composition of a water supply, conductivity measurements would be a valuable aid. Municipal water plants using surface water could make the conductivity test easily and by this means know at once without even a partial analysis of any change in composition of the supply. It is not even necessary to filter the water to be tested, as is the case in titrating CI" and HC0a~, for suspended matter has no effect on the measurement.
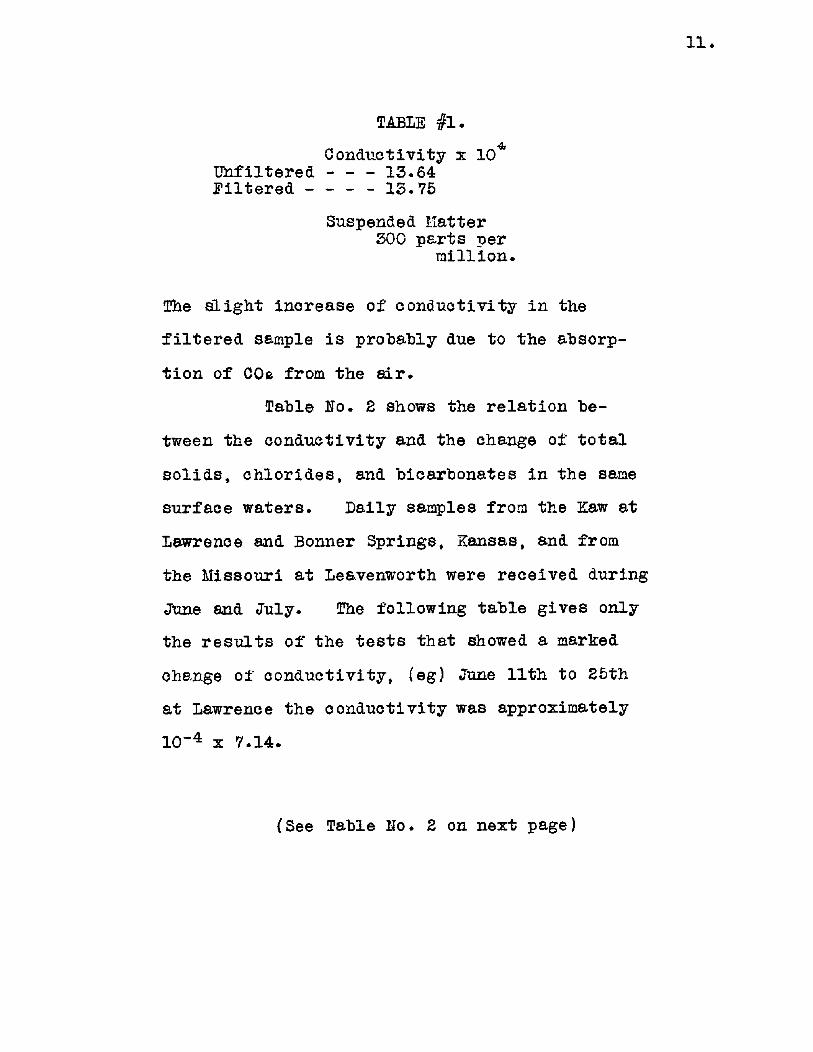
TABLE #1. Conductivity x 10*
ünfiltered 15.64 Filtered 15.75
Suspended Matter 500 parts per
million.
The slight increase of conductivity in the filtered sample is probably due to the absorption of COe from the air.
Table No. 2 shows the relation between the conductivity and the change of total solids, chlorides, and bicarbonates in the same surface waters. Daily samples from the Zaw at Lawrence and Bonner Springs, Kansas, and from the Missouri at Leavenworth were received during June and July. The following table gives only the results of the tests that showed a marked change of conductivity, (eg) June 11th to 25th at Lawrence the conductivity was approximately 1(T 4 x 7.14.
(See Table Ho. 2 on next page)
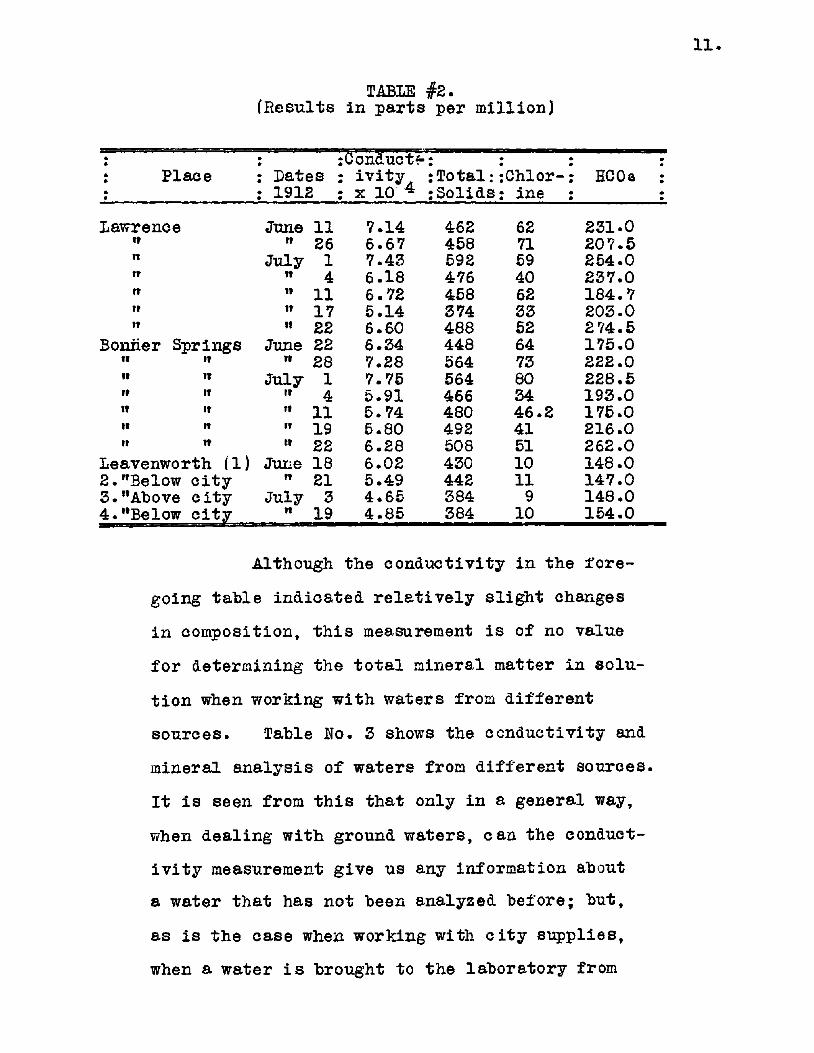
TABLE #2. (Results in parts per million)
: ; s s a • ( Jon&uct?-• • • •
: Place : Dates : ivityA x 10 4 .Total: : Chlor-: HCOa i
: 1912 : ivityA x 10 4 :Solids : ine :
Lawrence June li 7.14 462 62 231.0 TT tt 26 6.67 458 71 207.5 tt July
tt 1 7.43 592 59 254.0
ir July
tt 4 6.18 476 40 237.0 ff tt 11 6.72 458 62 184.7 tt tt 17 5.14 374 33 203.0 f? tt 22 6.60 488 52 2 74.5
Bonner Springs June 22 6.34 448 64 175.0 tt tt tt 28 7.28 564 73 222.0 tt tr July 1 7.75 564 80 228.5 tt tt tt 4 5.91 466 34 193.0 tt it rt 11 5.74 480 46.2 175.0 tt n tt 19 5.80 492 41 216.0 tt tt tt 22 6.28 508 51 262.0
Leavenworth (1) June 18 6.02 430 10 148.0 2."Below city tt 21 5.49 442 11 147.0 3.11 Above city July 3 4.65 384 9 148.0 4."Below city tt 19 4.85 384 10 154.0
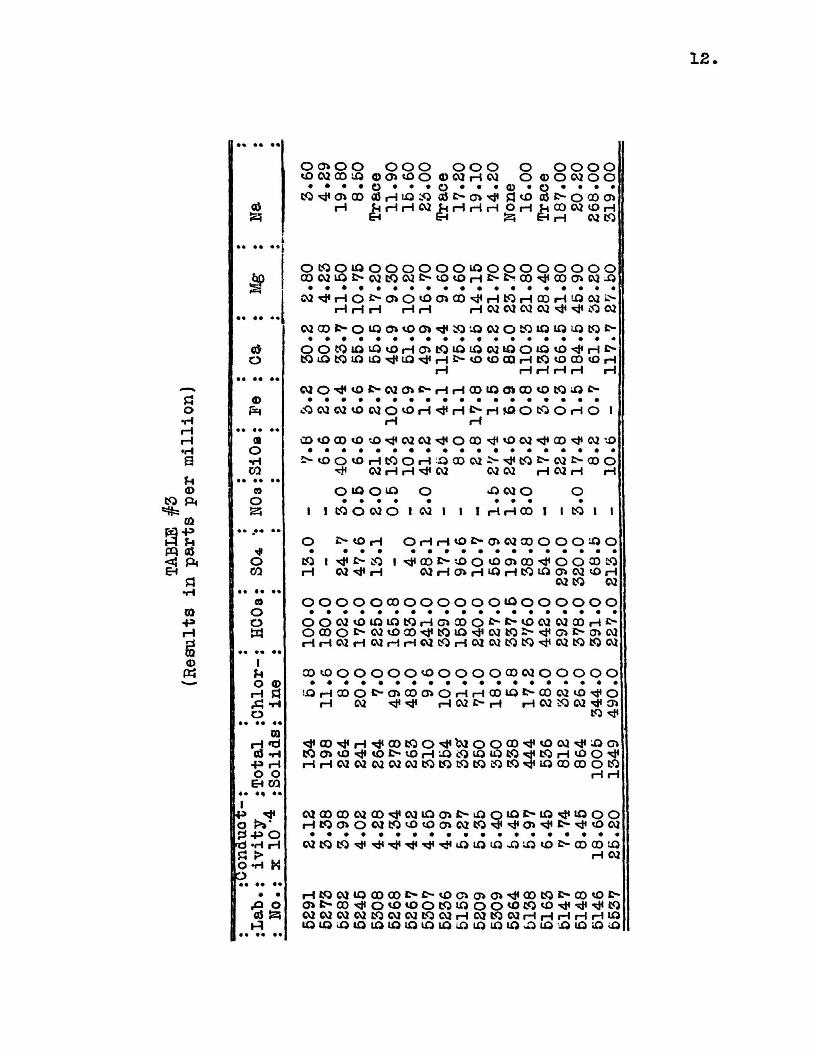
Although the conductivity in the foregoing table indicated relatively slight changes in composition, this measurement is of no value for determining the total mineral matter in solution when working with waters from different sources. Table Uo. 3 shows the conductivity and mineral analysis of waters from different sources. It is seen from this that only in a general way, when dealing with ground waters, can the conductivity measurement give us any information about a water that has not been analyzed before; but, as is the case when working with city supplies, when a water is brought to the laboratory from
0 0*00 o o o o o o o o o o o <£> CV2 CO LQ < D O > i O O © C V 2 H C Q O O O C Q O O C O ^ C n Q O flö H L O OÖ <T> xj< Ö tO cö *>- o oo o>
H h H H W ^ H H H O H ^ C D W ^ H EH EH Ö B H W W
o too 00 CV2 lO
l O O O O O O CV3 ooio
vO %D H
O O O O J>- fc- 00
O O O O CO O* CQ - I*
Cvi ^ rH H
O *> 0> O <J3 H H H H
O* 00 «tf H
H W H O O CM CVJ CV2 CV2
I—I '-Q CV2 i > kJ* ^ iQ < M
o o to to io to tO lO LQ C Q l O O i O <£> GQ H tO tD 00 ( O H
H H H
C V J O ^ ^ ^ C M 0 > O - H H 0 0
cO CV2 CV2 tO CVJ O tO H H H
• • • • H »00 tO
tO iO fc-• • •
O H O !
C O t O O O O ^ O ^ C V 2 C V 2 ^ 0 Q O ^ O C V 2 s t < O O ^ C V i \ 0
tO O
o 1 to
H 10 O H CV2H H ^
I Q O ^ O • • • •
O CM O I CV2
iO 00 CQ CV2
I I t
^ ^ tO 2 >
CV2 CV2 H
v O C Q O • • •
H H O O I
cvi i s oo o 02H H
O
I tO I I
tO H O H H < O t - 0 > 0 J 0 0 O O O « O
tO I xfl CO i^oo ^ t o o^oooo^ooooto H CV2 H W H O ^ H i O H t Q i Q a i W O H
CO tO CV2
O O O O O O O O O O O O O I O O O O O O O
O O C V j t O l O l O t O H G i O O O ^ - * > ^ > C V 2 C Q O O H i > O O O O O C v 2 t £ > O O ^ t O l O ^ C V J t O ^ ^ G i J > a ^ < X 2 H H O 2 H C V 2 H H C v 2 C 0 H C Q C Q t O t 0 ^ C Q t O t 0 C V l
O O t O O O O O O t O O O O O O O C M O O O O O
U 3 H O O O * > a > O O a > O H H O O l Q I > C O C Q t 0 < # O H W H 02 J> H H C Q * 0 O 2 < t f C f t
to <tf ^ O O T H H ^ O O t O O ^ t s i O O C O ^ H t O C Q ^ i O O C O O . t O ^ i t O i S t O H i O c O t O i O t O ^ t O H t O O ^ 4
H H C S 2 C Q C V 2 W C V 2 t O t O t O t O t O t 0 ^ l O C O O O O t O H H
0 2 0 0 G 0 C Q 0 0 ^ C Q l Q 0 > * > - i O O l O * S l O ^ l O O O H t O O > O W t O U ) t O C n M t O ^ ^ O > ^ S ^ O W
H CQ
H t 0 C M l 0 0 0 0 0 l > i > - t 0 O 0 * 0 . ^ 0 0 t 0 l S 0 0 < 0 C -0 > ^ 0 0 ^ O ^ ^ O O C Q ^ O O < 0 C Q U ) ^ ' v H ^ C Q C v 2 C V j C V 2 C v 2 t O C V l C v 2 t O C V 2 H C V J t O C V 2 H H H H H l O
13.
the same source, a second time, the conductivity will tell at once whether or not a new mineral analysis is necessary.
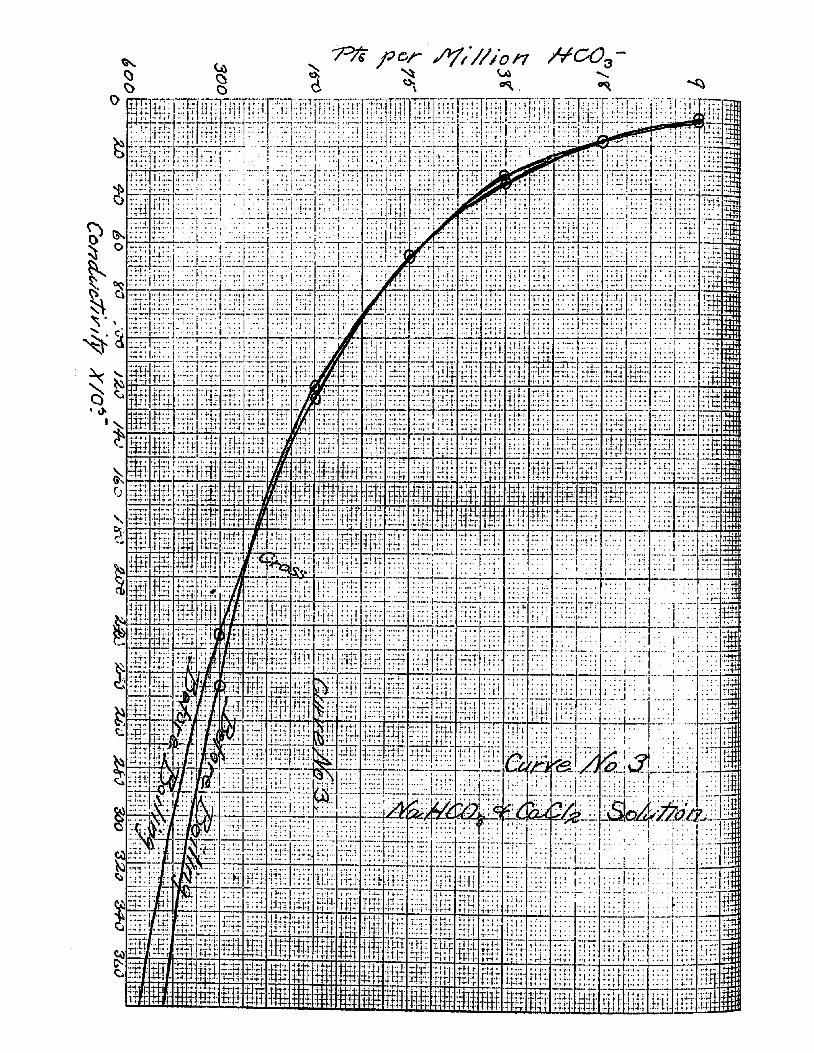
An attempt was made to determine the amount of HCOa present by noting the conductivity of the solutions before and after boiling. Solutions of known strength were made up both of sodium bicarbonate alone and of sodium bicarbonate with an excess of calcium chloride to precipitate the carbonate ion formed.
In the case of sodium bicarbonate alone, the conductivity was increased by boiling the solutions of various strengths. This is reasonable since not only is the COa ion which is formed by boiling nearly twice as mobile as the HCQa"" ion, but also some OH"" is liberated by hydrolysis. With sodium bicarbonate and calcium chloride solutions the conductivity decreased as long as the CaCOa was precipitated, but when the concentration of the CaCOa was so small as not to precipitate, the conductivity increased slightly. Curves Ho. 2 and Ho. 3 show the results.
The change in conductivity can not be taken as a measure of the bicarbonate present in solutions of unknown and various compositions because the hydrolysis of the C0a~~ ion and the
7=>tZ. per /y;///of7
14
solubility of CaC03 vary so greatly with the composition and concentration of the solutions thereby greatly changing the conductivities.
From these experiments it may be concluded that conductivity measurements are of value only when the information desired is a change in the composition of the solution. The conductivity is so sensitive to hydrolysis, solubility, and dissociation that no estimation can be made of the quantity of substances in solution.


![Journal of Applied Physics Volume Issue 2013 [Doi 10.1063_1.4793581] Kole, Madhusree; Dey, T. K. -- Investigation of Thermal Conductivity, Viscosity, And Electrical Conductivity of](https://img.pdfslide.net/doc/110x75/55cf8de4550346703b8c6169/journal-of-applied-physics-volume-issue-2013-doi-10106314793581-kole.jpg)