Embed Size (px)
Citation preview

.)
\
. J
.I\ 'lll 11(11 \._I 1 t 1 t..o ~.._... • ,...., ...., ...,. -·- - -
Scientific Research OPEN ACCESS 1 Journal
An Academic Publisher
-. ... , 1 c;. _, l[ ... ) f3ooks Confde . ~~.
> > 'I f. r. If I., ·n•<' Sr lf'IH ,. > l VARP
'·
!;·-: :c ,. , ~ndexinq
Prof. :I j t1
Dr. 1\sc;.td Ahmed At-Thu l<ais'
Prof. <><la' F. 1\tk in son
Dr. Amitava Bandyopadhyay
Dr. Helf-~n Bndlc:
Prof. .; f'' i 'il!on
Dr. ~~ ~~ tn n Gin
Dr. P;:l\:! f(;)v
Prof. );"'I l•u
Dr. _.,, ... ,,,!• i'lr, Ha,, !v1a llapall '
Prof. ?d·· 1· :'-1•n
Prof. Ping-F,~n~· Pat
Dr. ;."lhundr Raj Pt1fha~<
Prof. Moh<dlled Na9eeb Rashed
Dr. ''"'i:" ··il< , , <:><l!•c-
Prof. 'I' .::n:cr S•1id.~tc'
Prof. 1\,,.,.tthi"; 1 em pi
Dr. ...,;:-•1r1 1/.J H. V<ln Hu l lc~
Prof. • •. •.:·idt t<. \In·(~\'
· d P•·o, .i • .- ~ •on .. .. .. - --!-~:!. . .::.-"":::.:';..;::..:"""
Arms & Scope Editorial Board For Authors Pubircatir. .
College of William and Mary, USA
King Fahd University of Petroleum & Minera ls, Saudi Arabia
University of North Texas, USA
University of Calcutta, India
Heriot-Watt University, UK
Trent University, Canada
National University of Singapore, Singapore
University of Western Austral ia, Australia
Indian Institute of Technol~y, India
University of Leeds, UK
Hubei University, China
Wuhan University, China
University of Wisconsin, USA
The Catholic University of America, USA
Chonbuk National University, South Korea
National Chi Nan University, Chinese Taipei
Osaka Sangyo University, Japan
As wan University, Egypt
Ministry of Water Resources Government of India, I ndia
Institute of Physical Organic Chemistry, Bela rus
V1enna University of Technology, Austria
Ghent University, Belgium
Florida Gulf Coast University, USA
3
http://www .sci rp.org/j ourna 1/j warp/ 2015-05-25
-- --~-----· ( .... .
. .,

)
.louma/ of Water Resource a11d Protectio11, 20 13, 5, 930-940 IilLI' d ,_dni .I ·r~· I () ~ 2l&J~~drp)O I J .5 I 00% Published Onl ine October 2013 (http://www.scirp.org/joumal/jwarp)
Groundwater Quality and Identification of Hydrogeochemical Processes within
University of Lagos, Nigeria
•• ;:• Scientific ••!• Research
Abiodun Mary Odul<oya 1, Adetayo Femi Folorunsou', Elijah Adebowale Ayolabi\
Ezekiel Adelere Adeniran3
1 Department of Geosciences, Universi ty of Lagos, Lagos, Nigeria 20ccan University of China, College of Marine Geosciences, Qingdao, China
1Department of Works and Physical Planning. Ui1iversity of Lagos. Lagos. Nigeria l~mai 1: sesanbioclunl{i)yahoo.com. -detayofl(i)yahoo.com, [email protected]. [email protected] ...
Recci\ eel .lune 23. 2013: revised .luly 25. 20 I 3: accepted August 26, 20 13
Copyright ·1 2013 Abioclun Mar~ Odukoya eta/. This is an open access article distributed under the Creative Commons Auribution I iccnsc. '' htch permits unrestricted use. distribution. and reproduction in any medium. provided the original work is proper!) cited.
) ABSTRACT
I
.I
Water samples from twenty one boreholes were col lected within University of Lagos and analyzed for physical properties. trace elements and cations using inducti vely coupled plasma optical emission spectrometry (ICP-OES). Physical analysis of the samples shows slight acidity and alkalin ity with 78% of the samples exceeded recommended standards. They can be classified as fresh water based on TDS and EC. Chloride concentrations fall with in water standards in most s<1mples while AI, Na, Pb and Br exceeded·recommended standards in most samples. Gibbs plot, relationship between total c<1tions. Na + K . Ca .,. Mg and Cl showed that all the groundwater samples fall in the water-rock interaction field which suggests that the weathering of rocks and influence of sea water primari ly controls the major chemistry of groundwater in the area. Sodium Absorpti on Ratio (SA R) for all the water samples was less than 10 and excel lent for irrigntion purpose. Only 33% of water samples were su itable for irrigation based on Soluble Sodium Percentage (SSP) and Magnesium A dsorption Ratio (MAR), w hereas based on Kellys Ratios (KR) all the water samples were not good for irri.gation purpose having K R greater than I. Fi fty percent of the water samples showed pollution index (PI) above I with highest contribution (37.8%) from lead (Pb). Mn, AI , N i , Fe and As contributed 29.3%, 19.13%, 8.66%, 4.25% and 0.8:2% respectively .
Kl·~· worcls : Hydrogeochem ical Processes; Groundwater Geochemistry; Weathering; Irrigation; Pollution Index
J. lutroctuctiou
Ground water is an important source of water supply in many pe1rts of the wor ld and the most important source of drinking water for 70% of Nigerian population . It is w idely distributed under the ground and it is a replenishable resource unlike other resources of the earth .
One of the most important crises of the twenty - first century is the scarci ty of drinking water. Most freshwater bodies of the world over are becoming increasingly polluted. thus decreasing the potabi l ity of water [1). T he Universi ty w i th population of students and sta ff total ing fifty thouse1nd (50,000) depends on groundwater for water supply. This has led to disproportionate si nki ng of boreholes by nil organs of the University community in a bid to meet the water need of their units. In all, about
Corrcspond111g ~uthm
Cnpyrip.lll I! ~ 2013 Sci Res.
thirty (30) water boreholes distributed across the campus were located, with at least twenty one (21) of the boreholes functioning as at the time of the research work.
Chem istry of groundwater is an important factor determining its usc for domestic. irrigation nnd industr ial purposes. Interacti on of groundwater with aqu i fer minerals through which i t 1lows greatly controls the groundwater chemistry. Hydrogeochemical processes that are responsible for altering the chemical composition of groundwater vary with respect to space and time. In an) area, groundwater has unique chemistry due to severn! processes l ike soi lhock-water interaction during recharge and groundwater now, prolonged storage in the aquiJ'er. dissolution o f mineral species, etc. [2).
According to world health organization 40% or more o f the di sease outbreaks are attributed to pol luted groundwater consumption. Thus, it is absolutely necessary to
JWARP

\ 1
""'
)
•'
. ,.
A.M. ODUKOYA ET AL. 931
ascertain the potability of water before it is used for human consumption. Therefore, in the present study, an attempt is made to determine the chemical characteristics of groundwiller within Universi ty of Lagos and i ts suitability for both drinking and irrigation purposes.
2. Study Area
University of Lagos is located within Lagos, Southwestern Nigerin. The campus is nearly encompassed by water bodies with Lagos laggon on the east, swamp in the north and cana l in the west curving the southward (Figure 1).
Topography is general ly low and character ized by torrcntinl rainf<lll with a shallow water table (as shallow as 0.5 m around the coast). The geology o f the area is characterized by two bands of sand separated by si lty mud ly ing within the Dahomey Basin. Dahomey Basin, a co mbination of in land/coastal /offshore basin that stretches from southeastern Ghana through T ogo and the Republic of Benin to southwestern Nigeria has been variously described by many workers like [3-6]. Though there has been a nomenc lature problem in the stratigraph) of the Dahomey B<1sin [6], the <1ge range is from Crctnceous to Tertinry. Lagos mainland is underlain by sediment of Cl·etaceous through Tertiary to Quaternary. Quntcrnnry sed iments are alluvial deposits. covering most pmt of the Lagos Co<1stal areas and river valleys.
3. M aterial and M ethods
Twenty one boreholes and one lagoon water were collected Clt several locations within University of Lagos and nnalyzed for 73 constituents and physical · properties. The snmples were taken from boreholes located in different pmt of the University of Lagos (Figure 2). Several sensitive parameters of water such as total dissolved solids
(TDS), electrical conductivity, temperature and pH were determined during the on the spot sampl ing using the appropriate digital meters (e.g. water treatment works (WTW)-conductivity metermodel L/92 and WTW-pH meter model pH/9 1 ). Water samples of approximately 125 mL were collected for multi -element analysis; pressure fi ltered through 0.2 mm Nuclepore membranes and 3 mL analytical gr<We HN03 was added to bring the water acid solution to a pH - 2. The analysis of trace elements and cations in water were carried out using inductively coupled plasma optical emission spectrometry (lC:P-OES. All the analyses were carried out at the ACME laboratory, Ontario Canada. To check the accuracy; activation laboratories (Ontario Canada) employed two internal standards (each run twic!) and found that the errors were consistently minimal. Parameters such as Sodium Adsorption Ratio (SAR), Soluble Sodium Percentage (SSP), Magnesium Adsorption Ratio (MAR), Ke llys Ratio (KR) were also calculated from the resul t to determine the suitabi l ity of the water for i rrigation purpose using the equation in [7]. Results were further compared wi th recom mended standards and pollution index as well as other hydro-geochemical parameters were calcu lated to determine the water geochemist1y and its quality for both drinking and irrigation purposes.
4. Results and Discussion
More than one quarter (20) of the 73 constituents analyzed for were not detected above the laboratory reporting levels (L RLs) in any sample. Result summary of the remain ing 53 constituents and physical properties which include range, mean, standard deviation were presented in Table I for physical and major elements and Ta ble 2 for trace elements. A nalytical results for significant elements
Table I. Su m mary of p hysical/ maj or elements in university of Lagos water .
PhySICal Pnmmetcrs/MaJOI" Range Mean Standard Deviation Number of Sample
Lagoon Water [8, I 0] Standards (a. b. c. d.) Elements Exceeding standards
pi I .j 27 . 7.08 6.58 46 19 7.08 6 5-8 5"''1
11)5 I R · 312 88 9 58.4 0 2000 500'"
LC 37. 630 178 7 I 17 8 0 3999
c" ~76-2319 92 59 0 249
Mg I 92. 7 49 7 4 6.5 0 776
Na 19-l~-16468 56 8 39 4 0 6511 30'. 60"
I\ 0 (,(1 • II 03 26 05 64.39 0 223
I' <0 02. 0 16 0 059 0 041 0 2
s I 0 - 34 9 44 7 96 0 596
S1 4 5. 36 52 I I 8 7 03 0 40
Cl 14. ~86 79 70.3 8976 250'·"
'lJSEPI\ ma\lmum cnnlamiiH\Ill level . ''NYSDOH ma\lmum COillamman!level. 'USEPA seconda1y maximum conlaminanllevel; "National prima1y dnnkmg wt~tcr standrml .
Copyright((~ 2013 SciRcs. JIVARP

!
~ l.l:d
·~
Copy right 'L' 2013 SciRes.
A.M. ODliKOYA ET AL.
1 • . ..... lit•••'•
,,-: ~ '. -, ·!i,;7nl''"''
.·~
/ ./
I /
3 ~02
~lraina>\~ Wa1cr tx•d1cs
figu 1·c I . T he mar of unive rsity of Lagos cnmrus.
.. ;
b.5124
JIVARP

'
,1
.. r'
1\ \-1. ODUKOYA ET AL.
Tahle 2. Summ:u·y of truce clements in uni versity of Lagos water·.
I rarl~ l ·lcnH.'nt~ Rang~ ( ppl1) Mean Standard Devmtton Lagoon Water (ppb) [8.1 0] standards (a. b. c. d)
i'c' <10. 463 117 14
flr 7. 9"1 30·1 6~
,\ , <0 5 · I I 0 68
Nt 2 4. >n 1 II 38
1\l n ~<1 ·1 1- )4 8 37 96 5<1
l'h 0 I . 76 S ~4 93
Sc• <0 5. ~ 4 I 34
/n 1516 - 12592 378 64
Rh 2 89. 2J 44 12 07
St ~2 45 . I 89 79 77 43
B l'l. 127 46 75
Ba 31 96. 532 58 147 7
,\ I I · 133 I 251 95
<(} 02.0 4 1 () 184
v <0::! -::! 6 I 04
l;t () 04 . 15 ~4 5.15
It I 5 · 128 6 72
Sh <0 005 . 0 33 0 138
s,· I 0 · 6 0 16
C<l <() 05 . () -1 ~ 0 15
c~ () 07 . 34 07 4 54
Cr -:() s . 14 6 4' 45
c, 0 17 . 0 R!l 0 46
Cu 6 1 .90 I 30 28
i)\ <0 01 . I 71 0 32
1\d () 07. 1·1 ).1 2 13
lk <"0 005 · I 27 () 3 1
110 I R
230 68
019
7 6
70 97
23 65
0 88
2 82 06
5 19
42 16
31 09
10 2 18
34 7 28
0 159
0 91
6.28
41
0 1
0 55
009
7 89
3 97
0 25
21 13
0 4 1
3 4 5
0 ~9
1000
32.866
50
34
146
39
10 5
596
65
4106
2796
145
306
<2
52
<I
166
5
< 100
<5
<I
50
<I
21
<I
<I
5
300"1
10'"
20''
' 50 . 300'
10'1
so· •
~ sooo•·
2000' ·'
50'
30'"
100'''
1000'
'USI·PA ma\llnttm <:ontammnnt level. ''NYSDOH nW\ttnum contnmtnnnt level: 'USEPA secondary maximum contaminant level . "National primaty dnnk tng \\ ntcr standard
were compared with National Primary Drinking water standard and United State Environmental Protection stnndards (US EPA). The standards include Maximum Contaminant Levels (MCLs), Secondary \llaximum Contnminant Levels (SMCLs) established by the [8- I I] and [I ::!]. MCLs are enforceable standards that specify the highest level of a contaminant that is allowed in public water.
4. I . G roundwater Geochemistry
C 11'0lltHh\ ater samples o f university of Lagos are both
Cop~ t·ight ( 20 I ~ Sc i Res .
sl ightly acidic and alkaline w ith pH ranges between 4.2 1
and 7.08 and mean of 6.8 (Table 1). 78% of the samples exceeded [I I, 12] standards. The temperature of the water ranged from 28.9'C to 31.5' C; the mean was 30.2'C. Electrical conduct ivity (EC) and Total Disso lved Solids (TDS) of the samples ranged from 37 to 630 ~lS/cm, and 46 to 3 I 2 mg/1 wh ile the mean values were I I 7.8 and 88.9 respectively. EC and chloride show large variation between minimum anci'maximum value and also express
high standard deviation. This inference suggests the influences of complex contamination sources and geo-
JIVARP
(

r
')3 I A.M. ODUKOYA ET AL.
' "'121
+ ~wamp \\ 11h spillover !"rom th.; lagoon
N
u 1 ,
d '
~ nd <,.\II·
" ·,;
' •.
T
\~) T . l·unr11ontn~ llpr~hok
I )UilllhiiC
.\402
(, 51 1)(,
T b D~acl Borehole 'itrcam - D~;una~c \\"a1~1 hochcs
figure 2. 1\lap showing sample locations.
chemic:-~1 process as well as inhomogeneous water chemisll) in the stud) area (sec Tahir I ). All the water s:-~mplcs can be classified as fresh water and are within the recommended standards of 500 mg/1 for TDS [II, 12). A lithe samples are also colorless and odorless.
Chloride concentrations ranged from 14 to 286 mg L and the mean was 79. All the samples except sample W3 taking at the \Iarine Science department fall within [II, 12] of 250 mg/1 as shown in Table I . The cat ions that were detected in high concentrations were calcium, magnesium. phosphorus, sulfur. silica and potassium. Their concentrations ranged from 2.76 to 23.19 mg.'L, 1.58 to :!7.49 mg/1, <20 to 162 mg/1, I to 34 mg/1, 5.21 to 36.5 mg I and 0.66 to 12.5 mg/1 while the mean values \\'Cre 9. 72, 7.8. 60. 14, I 0. 12. I I. 98 and 6.1 0 respect ive ly.
Fourteen samples exceeded the USEPA non-regulatory drinking-water advisory taste threshold for sodium which recommends that concentrations in drinking water must not exceed the range of JO to 60 mg/L [8, I OJ, Table I . The remaining cations fall within the recommended standards.
Cnp) right <. 2013 Sci Res.
4.2. Hydrogeochemical Processes
Water quality is determined by reactions between groundwater and aquifer minerals which are also useful to un
derstand the genesis of groundwater [ 13). Since the study region experiences wet and dry climatic condition which promote weathering. this may also contribute to \\~lter
chemistry in the area. l ienee. Gibbs plot is employed in thi s study to understand and differentiate the influences of rock-water interaction, evaporation and precipitation
on water chemistry [ 14). Figure 3 illustrates that all the groundwater samples fall in the water-rock interaction
fi eld which suggests that the weathering of rocks primm·
ily controls the major ion chemistry of groundwater in this reg ion.
4.2. 1. Effect of Silicate Weathering on Water Ch emistry
T he ratios between total cations and Na + K as well as Ca + Mg are 0.99 and 0.88 respectively (Figure 4). This observat ion showed the involvement of si l icate weather-
J IVARP

.l. •
\ ;.
•
·; .
A. \I ODLKOYA ET AL. 935
fjil~l\
+ 4> ~ f(,ll ~
,~I -£
I"
,, I 2
11)011
11~1(,
t.. [1(1
II " Ill
Figure 3. Gihh~ plots l'Xp lain groundwater chemistry and gl·uchl·mica l process in the study region.
.::
.::
Ill
•)
II
IO
I)
(I
II
(I
_, .!) ./1~
,'\a " m~q I
I{ 0 S-IN
0 5 I I ~ (a· .\I!! rn~q I
Figun· -1. Rl'latilln het11 ccn t11tnl cation. ;\'n + I< and Ca + \lg in the ,r nd) regio n.
Cop) right 'l 2013 Sci Res.
ing in the geochemical processes, which contr ibute mainly sodium, calcium and potassium ions to the groundwater [15, 16]. Weatheri ng o f soda feldspar (albite) and pot
ash feldspars (orthoclase and microcline). which arc common in sand and clay occurring in this area is great!) responsible for the contribution of Na and K · ions to groundwater. Feldspars are more susceptible for weathering and alteration than quartz in silicate rocks. I he average Ca2
' + Mg2./CI and Na' + K/CI equivalent ra tio
of 0.27 and 0.88 suggest the influence of the sea water also. The 1-egional geology also implies that the alkali ca11h silicates occur everywhere in the area (Figure 5).
•)
..= 5 ? :; I
II II
20
15
I ll
- h
0 (l
~/ ...
/"+ * ~ . • • II'\
•
/ / • ~
('a ~ It• me~ I
2 Cal Mg(meq·1)
4 Nn·K(me~l)
I 'i
6
Figure 5. Relation between tota l cation, Na + I< and Ca + Mg in the ~tud} area.
JJVARP

J
I I
)'
9~6 A. M. ODUKOYA ET AL.
~.2.2. ion l·~xc hangc
One of the important processes respon~ible for the concentration of ions in groundwater is ion exchange. Chloro-alhaline index (CA I) calcu lated for the groundwater samples of the study area strongly suggest the oc-ctttTcncc of' ion exchange process. .
C:\1 CJ (Na' 1 I() CJ - (All values arc expressed
in tncq 1).
\~hen thL:rc is an C\changl: between Ca or Mg in the groundwntcr with 1\a and I< in the nq ui fer material. the above index is negative. and if there is a reverse ion exchange. then the index will be positive (1 7,18]. CAl vnl ucs o f the study area range between -0.86 to 5.5 (figure 6(a)). This observation indicates that reverse ion exchange is the dominant proccs~ in the groundwater (52%). whereas normal ion exchange is also noticed in 48 % of the ll'rttcr samples.
II
() ~ -I
I ~
I I•
I I
I ~
~ I
= OS
7 () (,
il -l
I)~
(I
(I
·s
.; - ~,
LO ...
(~
.... . ~ ~ r<;> .,.._-
:10 '$
-i
~ c 11
I, ;,
> • 15 + ~n
(<l)
100 200 .100 -100 :iOO 600 700 [ ('(uS ~m)
(b )
Figure (,_ (a) Chloro-all<alinc ind l'X (CAl) incticnting ion cxl'han:.:c prtiCl'SS in till' study area; (b) Relation between EC nnd 'ln/C J in the groundwlll e r.
Copyright 'l'1 2013 SciRes.
4.2.3. Evaporation "-laiC I ratio can be used to identify the evaporation process in groundwater. Evaporation wil l increase the concentration of total dissolved sol ids in grou ndwater. and the Na/CI rat io remains the same, and it is one of the good indicative factors of evaporation [ 19]. I f evaporation is the dom inant process, Na/CI ratio should be constan t when EC rises (20]. The EC vs Na/CI scatter diagram or the groundwater samples in the study area t figure 6(b)) shows that the trend l ine is inclined. and N a/CI ratio decr~ases wi th increasing salin ity ( EC) for most samples. This observation indicates that evaporation may not be the major geochemical process controlling the chemi stry of groundwater in this stud~ region or ion e\change reaction dominating over evaporation. However, the Gibbs diagrams ( Figure 4) also confirmed that evaporation is not a dominant process in the study area but
water rock interaction.
4.3. Suitability of Water for Irrigation Purpose
4.3.1. Sodium Absorption Ratio (SAR) Based on the Sodi um Absorption Ratio (SA R = Na./(Na' + Ca2. )/2) the water samples range from 1.75 - 8.9 and can be classified as e~ellent and good for irrigation (see Figure 7 (21]. A ll the values obtained for the Sodium Adsorption Ratio (SAR) during the present study are generally less than I 0 and can be classified as excellent.
4.3.2. Magnesium Absorption Ratio (MAR) The values obtained for the Magnesium Adsorption Ratio (MAR) within the study area vary between 33.46% -75.72%. Increasing amount of magnesium in water wil l
) II
Il l
S.-\R
·-- -------------
\\ I \\'~ W IO
\\I)>; \\ ~~I
S:uupk l .vt.'al1ons
•\1.-\ K
Figure 7. Plots of some parameter indices for rating the sustain ability of groundwntc1· quality for irrigation.
JIYARP
(

I '
t\ . \1. ODGKOYA £7" AL. 937
increase the salinity of the water and therefore decline the crop ) ield [22]. The values obtained in only 33% of the samples are less than 50% considered suitable with no hazardous effects to the soil according to [23], Fi gure 7.
-U.3. Soluhlc Sodium Pt rccnt a gc (SS P>" SSP is frequently used in the determination of the suitability of water for irrigat ion purpose. In this work, the values obtained for the SSP parameter range between 67.3°1o- 90 . ..J3°·o According to [24] (Figur e 7), 33°1o of the water samples fall within fair classification of 80% and the remaining samples fall within poor (>80%) for the purpose of irrigation. Also, the ranges of values for the !'ell; 's Ratio (KR) obtained for the water samples are I .R2 - 9.17 meq/1. The values obtained are higher than the permissible limit of 1.0 recommended by [23] in all the \\ ater samples.
.:1.-L T n lt'c l ~ lcmcnts in \ Vater
\I. Fe. Pb. \ln. Brand l\i exceeded recommended standards in 60.87%. 4.35%. 65.2%, 18.78%, I 00% and 13.04°o or the total samples respectively. Aluminum concentrations ranged from I I to 133 I mg I; the SMCL (50 pg/L) was exceeded in fourteen samples (Tab le 2). Iron concentrations ranged from <I 0 (the Laboratory Reporting Le\'el (LRL)) to 463 mg I; the Federal SMCL and the New York State MCL for iron was exceeded in one sample W5. Lead concentrations ranged from 0. 1 to 76.8 pg L; the [ 12] (I 0 pg/L) was exceeded in fifteen samples ( f able 2). Manganese, Bromate and Nickel concentrations ranged from 24.4 1 to 348.87 1-1g/L. 72 to 95 pg/1, and 2.4 to 30.1 pg/L while the MCLs of 50 pg/L, I 0 pg/L and 20 pg/L were exceeded in eighteen, twenty-three and two samples respectively (Table 2).
Some trace elements, Ge, Gd, Ho, Pr,Lu, Tb, Tl and Tm were detected less frequently or at lower concentrations (Ta hl e 2) than other const ituents. ·The MCLs for antimony (6 pg/L). arsenic ( 10 pg/L), be1yllium (4 1-1g/L), barium (2000 pg/L). cadmium (5 ~tg/L), ch romium ( 100 pgL). selenium (50 pg/L), zinc (5000 ~tg/L), and uranium (30 pg/L), and the SMCL for copper (1000 ~tg/L), 1\.lercury (2 pg/L ), silver ( 100 pg/L) and thallium (2 pg/L) were not exceeded in any sample. Co, Li, C, Cs, Dy. Er. Nd. Y. Yb, Zr. Lu, Rb and V were detected, but no I\1CLs have been established for them while W, Th, 1 i. Te. Ag. Au. Ga. Hf, In, Nb, Pd, Re, Rh and Ru were belo\\ laboratory detection limit for all the samples.
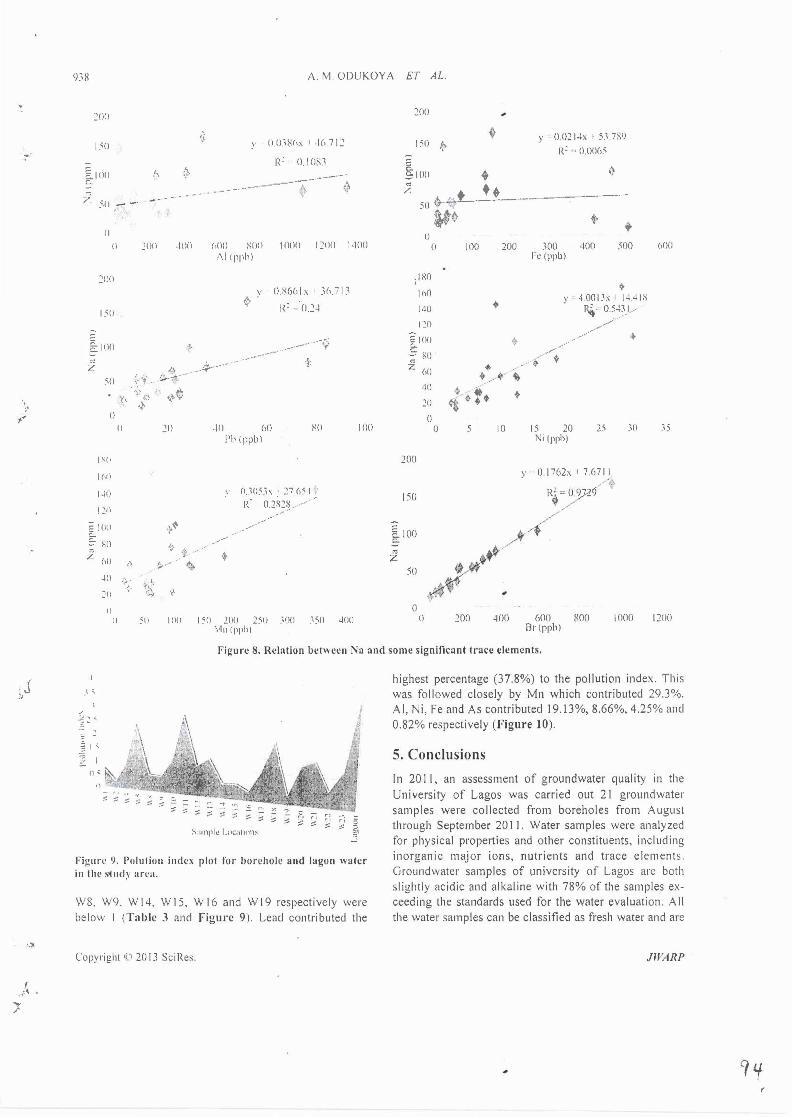
'\a showed very weak correlation with AI, Fe. Pb, Ni, 1\ln and very strong correlation with Br which are significant trace elements in the water samples (Figure 8). This indicates possible anthropogenic sourc'es for all the significant trace elements except Br which could be geegenic.
Cnpynglll 1 2013 Scil~cs.
4.5. Po llution Index ( PI)
The pollution index was used in this study to evaluate the degree of trace metal contam ination in water samples [25-30]. The tolerable level is the element concentration in the water considered safe for human consumption [3 I ,3 2] . The [I 0] were used as tolerable level for water and the pollution i nde~ can be ca lculated by the formulae below;
PI = (Heavy metal concentration in water/Tolerable Levei)!Number of Heavy metals. Tl~e PI lfmong all sites varied from 0.26 to 2.86 (T able
3 and Figure 9). Water sample w ith Pollution index great· er than I is regarded as being contaminated. 50% of the water samples showed pollution index above I (Figure 9 )
with W5, W II and W 18 showed high values of2.43. 2.86 and 2. 13 respecti vely. Samples W JO, Wl2, Wl3, Wl7. W20, W21 and W23 were above I with the following values 1.21, I , I 0, 1.40, 1.06, 1.37, 1.56 and 1.29 respecti vely. Pollu tion index for samples WI, W2, W4, W5 .
T able 3. Po lut ion index va lu es p er loca tion for the s t ud~
area.
Sample Pottuuontnde' Remarh
Wt 0 740922 Not Contammated
W2 0 262256 Not Contammated
WJ 0 940867 Not Contamtnated
W5 2 425822 Contammated
W8 0 626189 Not Contammmed
W9 0 598022 Not Contammated
WtO I :!13444 Contammated
WII 2 855622 Contammated
Wt2 1095922 Con tam mated
WI) ( .395667 Contamtnated
Wl4 0 :!'30256 Not Contammated
Wl5 0.575922 Not Contammated
Wl6 0 .3499 t ( Not Contammated
Wl7 t .059744 Contamtnated
W l 8 2. 126233 Contammaled
Wl9 0 347422 Not Contammated
W20 I 370467 Contammated
W2t I 562t78 Contamtnated
W22 061 1878 Not Contamtnatcd
W23 I 292933 Contammated
Lagoon 3 823 Contaminated
JIJIARP
r
,~
I . ~
A M. ODUKOY A ET AL.
~(I()
- I{· ll I 0S.1
~IIIII -~ --~
- .... -
II (I ~II() lOll (,(II) X Oil 1000 I ~Ill I l·lllO
,\lipph)
21111
0 X6!•1 \ y,713
-~ I( 021 I'll
tlllll ~ 't
~
/
'II
.~
II
II 20 Ill (,() XII 100 l'h ippbl
I sp
1(,1)
l~ll \ 0 \11.'\.h · 27 !1) I
120 I( 0 2~2S
~lilt)
§; ~I) +~
/ ~ • 1·11 :... ~ -HI
~~~ -~
~
II
II ~~~ IIIII 1511 2110 2511 ;no .\50 ~1111 \lo1pph1
~()()
tl n
.1 ~0
1(1()
1-Hl
120
:: llKl c. :;, ~!) <: z
(,()
·Ill
20 I)
0
20(1
150
~100 c.
2
ll ()
v
100 200
+
+
• /
·--- ~ ' •• *· ~ . • 10
\' 0 .021·h I 5.\ 7S1)
R' O.Ofll•'i
.\00 400 500 i'L' (ppbl
-IOOih 14 -!IS R' .... 05-DI
• , .. ~ ~ •
15 20 25 30 ,, (ppb)
V' 0.)7(,2~ I 7{J71) . ~-
200 -100 600 KOO 11100 nrtpphl
(l()()
1)
1~00
figure 8. Relation bct\\CCn Xa and some signi ficant trace clements.
t '
~. I "
:S I -~~-~::-.. . ~ ....
II
Figtll't' 9. l'olution index plot for borehole and lagon water in th t• ' i ud) area.
\\ 8. W9. \\ 14. W 15, W 16 and W 19 respectively were bclo"' I (Table 3 and figure 9). Lead contributed the
Cop) right '' 20 13 Sci Res.
highest percentage (37.8%) to the pollution index. This was followed closely by Mn which contributed 29.3%. A I, Ni, Fe and As contributed 19.13%, 8.66%, 4.25% and 0.82% respectively (F igure 10).
5. Conclusions
In 20 II , an assessment of groundwater quality in the University of Lagos was carried out 21 groundwater samples were co llected from boreholes from August through September 20 I I. Water samples were analyzed for physical properties and other constituents, including inorganic major ions, nutrients and trace elements. GroundY~ater samples of university of Lagos arc both slightly acidic and alkaline with 78% of the samples exceeding the standards used for the water evaluation. All the water samples can be classified as fresh water and are
JIVARP

.. ,.
. I
A.M. ODUKOYA ET AL . 939
II ~~111711111')
~.,/ '~ "' Jlh
29.31348?24 " \1
·r~ 1: < :-::q~
,, • I ... ·
\In ,\h.; .. ~ .:; I I ~.J
1 tt I ~ .. \O:'-" \<
Figure 10. Pnlution inctc~ percentage contribu t i on~ h~ \ ignill canl mctah.
within the recommended stilndards of 500 mg/1 for TDS. Bilsed on Gibbs classification, all the groundwater samples fa ll in the water-rock intt:raction field which suggests that the weathering of rocks primar ily controls the major ion chemistry of groundwater in this region. The relationship between total cation. a + K, Ca + Mg and Cl also confirmed the effect of silicate ''cathering and influence of sea water on water chemistry.
SAR. for all the water samples are <10 and excellent for irrigation purpose. Only 33% of water samples are suitable based on SSP and MAR while for KR al l the water samples are> I and not good for irrigation purpose. Each borehole sampled had at least one constituent that e.\ceeded USEPA drinking-water standard, Maximum Contaminant Levels (MCLs) or Secqndary Maximum Contaminant Levels set by the US Envi ronmental Protection Agency (USEPA) for major and trace elements. f\1. Fe, Pb, Mn, Brand Ni exceeded recommended standards in 60.87%, 4.35%, 65.2%. 18.78%, 100% and 13.04% of the total samples respect ively. The sources of the trace elements except Br in the stud.y area could be anthropogenic. Some trace elements, Ge, Gd, Ho, Pr, Lu, Tb. Tl. Tm were detected less frequently or at lower concentrations than other constituents whi le Sb, As, Be, Ba. Cd. Cr. Se. Zn. U. Cu. Hg, Ag and Ta were within L SEPA maximum contamimltion level for all the samples. Co. Li. C. Cs, Dy. Er, Nd, Y, Yb, Zr, Lu, Rb and V were detected. but no MCLs have been established for them while W, Th, Ti, Te, Ag, Au, Ga, Hf, In, Nb, Pd, Re. Rh and Ru were below laboratory detection limit for all the samples. 50% of the water samples showed pol lution inde\ above I and lead contributed the highest percemage (37.8%) to the pollution index. This was followed close!; by 1\ln which contributed 29.3%. AI, Ni, Fe and As contributed 19.13%, 8.66%, 4.25% and 0.82% respectively.
REFERENCES [I] S l)i,it. S. K. Gupta and S. Tiwari. "Nutrient Overload
in);! of a Freshwater Lake in 13hopnl. India ... Elrctmnic
Copyright < 20 13 Sci Res.
[21
[3)
(4)
Green Journal, Vol. I, No. 21, 2005, pp. 2-6.
.1. D. Hem, "Study and Interpretation of the Chemical Characteri stics of Natural Water," 3rd Edition, US Geological Survey, Wl\fer-Supply Paper 2254. 1985. 263 p.
H. A . .Iones and R. D. Hockey, "The Geolog) of Pan of Southwestern Nigeria," Bulletin (Geological Survey o.f Nigeria), No. 31, 1964, p. 87.
E. A. Okosun, "A Review of the Cretaceous Stratigraph) of the Dahomey Embayment. West Africa:· Crrtacrous Re.1eurch, Vol. II. No. I, 1990, pp. 17-27. http://d:-..doi.org/ I 0.1 0 16/SO 195-66 71 (051!!0040-0
[5] ll. G .• Bilhnan, "OfTshore Stratigraphy and Paleontolog) :of Dahomey Embayment. West Africa," Ntgrman AHO·
cwltUII ufPetruleum Explumtiunisl Bullettn. Vol. 70. No 2. 1992. pp. 12 1-130.
(6] N. G. Obaje. "Geology and Mineral~esou rces of Nigeria,"' Springer, Dordrecht, Heidelberg, London. Ne" York. 2009, p. 221. htlp://cluini.org/ I 0.1 007/97R-3-540-926S5-6
f7l 0. S. Oladeji, A. 0. Adewoye and A. A. Adegbola ""Suitability Assessment of Groundwater Resources for ln·igation around Otte Village. Kwara State. Nigeria,"' flltematiunul Juumul of Applied Science and E11gine<!nng Re.\earc:h. Vol. I, No.3, 2012, pp. 437-445. http.//d\.Cfoi.org/ I 0.608!Vijaser.0020 I 0 I 04-1
[8) US Environmental Protection Agency, "Drinking-Water Advisory-Consumer Acceptability Advice and Health Effects Analysis on Sodium," Office of Water, Washington DC. 2002, 34 p.
(9] US Environmental Protection Agency, "Proposed Radon in Drinking Water Rule," Office of Water, Washington DC, 2004. http :1 /www .epa.gov/sa fewater/radon/proposal html
[I OJ US Environmental Protection Agency, "National Primary Drinking Water Standards and National Secondary Drinking Water Standards,"' Office of Water, Washington DC. 2009, p. 6. http://www.epa.g~/safewater/consumer/pdf/mcl.pdf
[II) US Environmental Protection Agency, "US EPA's 2008 Report on the Environment (Final Report)," US Environmental Protection Agency, Washington DC. 2008.
[ 12) NSDQW, "Nigerian Standard for Drinking Water Quality," Nigerian Industria l Standard NIS 554. Standard Organization of Nigeria, 2007. p. 30
[13) D. J. Cederstorm, "Genesis of Ground waters in the Coastal. Plain of Virginia,"' Environmental Geology. Vol. 41. No. 3, 1946, pp. 218-245.
(14) R . .1. Gibbs, "Mechanisms Controll ing World Water Chc· mistry.'' Science Joumal. Vol. 170. No. 3962. 1970. pp. 795-840.
[15] R. F. Stallard and J. M. Edmond, "Geochemistrv of the Amazon: 2. The lnnuence of Geology and We~thering Environment on the Dissolved Load," Journal of Geophystcal Rrsenrclt, Ocean, Vol. 88, No. C 14. 1983. pp 967 1-9688.
[ 16] M. M. Sarin, S. Krishnaswamy, K. Dilli. B. L. K. Somayajulu and W. S. Moore, "Major Ion Chemistry of the Ganga-Brahmaputra River System: Weathering Process
JIVARP

I )
__ .,
!
<).10 A. M ODUKOY A ET AL.
and Flu~es to the 13a) of l3engal.'' Licoclwlllca e1 Cosmoclwnico Aclu. Vol 53. No. 5. I 989. pp 997-1009.
]17 ] II )choclil:r. "()u;Jiitatilc Evaluation of Groundwater Resources ... In II. Schoeller. Ed .. Me/hods and Techt1UJ1WS o.f Ground11'a/er ln• ·esltgalton~ and De••elopment. lhc L nitcd \iauons LducationaL Scientific and Cultural Organi/atJon. Paris. 1965. pp. 54-83.
]IS] II. '>chodlcr. "(leochemistr) ofGround,,atcr-An International (iuidc lor lh:scarch and Practice:· The United 1\;Hions l·ducationaL ~cicnti!ic and Cultural Organization. Paris. Chapter 15. 1967. pp. 1-1 R.
]I 9] I '>ubramani. N. Ra.1mohan and L. Elango. "Groundllater CieocheJnisll') and ldcnti lication or llydrogeochemical l'roc,.:sscs in a liard Rock Region. Southern India:· Em·troniiH' II/al \foni/IJnng al1ll A.1·,es.m1e111. Vol. 162. No. 1-4. 2010. pp 123-137. hUP. ~-~Im.,Qrg IJ.L lillF s I 0661-009-07& 1--1
]20] .I .lanko11si-.i and It I. Acworth. '·Impact of Debris Flo11 Deposits on II) drogeochemical Proct.:ss and the De' clopn1cnt of Dr) I and Salinit) in the Yass River Catchment. Nc11 '>outh Wales. Australia: · J-/i·clrugeulugy Journal. Vol. 5. No. I. 1997. pp. 71-88. lJI~ •ffiAnJ.ort.! J0. 1007 si00-100050JJ9
1211 () K. !odd. "Ground11atcr Hydrology." 2nd Edition, .lohn \\-ill c) and Sons Inc .. '.e11 York. 1980. 552 p.
1221 0. 1\1. .loshi. 1\. Kumar and N. Agrawal. "Assessment of the Irrigation Water Qual it) of River Ganga in llaridwar District India:· RASA YAN Journal of Chemim:•·. Vol. 2, No. 2. 2009. pp. 285 -292.
]23] It 'l. Ayers and D. W. Westcot. "Water Quality for Agriculture. f-1\0 liTigation and Drain:· Paper No. 29. Rev I. .. Food and , lgnmlfw·e 0Jgam=altOI1 of I he Untied Naltons Rome. 1985. pp. 1- 109. http://w11 ~~. tao.org./docrcp/003/t0234e/t0234eOO.htm#TOC
1 2~1 1.. V. Wilen\. "The Quality of Water for Irrigation Use:· lJS Department of Agriculture Techonology. Washington DC. 19~8. 40 pp.
Copyright 'C 2013 Sci Res.
[25] H. Nishida. M. Miy;i, F. Tada, S. Suzuki. "Computation of the Index of Pollution Caused by Heavy Metnls in River sediment,'' Enl'ironmental Pollution Sertes B. Chemtca/ and Physcal. Elsevier, Vol. 4, No. 4. 1982. pp. 2-1 I-248. http:/1lh.doi.orgll 0.1016/0 I-11- 14SXI!l2l900 I 0-6
[26] II. T. Chon. J. S. Aim and M. C. Jung, "Environmental Contamination of Toxic Heavy Metals in the Vicinit) of Some Au-Ag Mines in Korea." Proceedings of 1he -1111 Brennial SGA Meeling, Truku. 11-1 3 August 1997. p. 891.
[27] K. W. Kim, H. K. Lee and B. C. Yoo. ·'The En1 ironmental Impact of Gold Mines in the Yugu-Kwangchcon Au-Ag 'Metallogenic Province Republic of Korea." Etn·rr()n Technologies. Vol. 19, No.3, 1998, pp. 29 I -298. http:/idx.doi.org/1 0.1 OX0/0959333 I 908616683
[28] 0. 0. Emoyan, F. E. Ogban and E. A~rah. "Evaluation of I Ieavy Metals Loading of River ljana. Nigeria:· Journal of App!ted Sciences and Environmental Manageme/11. Vol. 10. No.2. 2005, pp. 12 1-1 27.
[29] NIER. "Investigation of the Impact of Mine Disclwrges on Han-River Watershed." 1st Year's Report. 2007.
[30] A.M. Odukoya and A. F. Abimbola. ··contamination Assessment of Surface and Groundwater within and around Two Dumpsites," lnlernalional Journal of Environmen/al Sc:rence and Technology. Vol. 7, No. 2. 2010, pp. 367-376. http: .. /d,.dni.org/1 0.1 007/0f-Ol.l2CJ 146
[3 1) A. Kloke, "Content of Arsenic, Cadmium. Chromium. fluorite. Lead, Mercury and Nickel in Plants Grown on Contaminated Soil," United Nations ECE Symposium on E.ff'e,·ts of Airborne Pollution on Vegetalion. Warsaw. August I 979.
[32] J. S. Lee, H. T. Chon, .1 . S. Kim, K. W. Kim and H. S Moon. "Enrichment of Potentially Toxic Elements in Areas Underlain by Black Shales and Slates in Korea." Envtrunmenlal Geoch6nistrl' and Heallh, Vol. 20, No. 30. 1998, pp. 135-147.
JIVARP