Embed Size (px)
Citation preview
Interim report January–June 2015
Fortum Corporation
17 July 2015

2
Disclaimer
This presentation does not constitute an invitation to underwrite, subscribe for,
or otherwise acquire or dispose of any Fortum shares
Past performance is no guide to future performance, and persons needing
advice should consult an independent financial adviser

IFRS restatement relating to discontinued operations
Distribution segment has been reclassified as discontinued operations in Q1/2015.
As a result, continuing operations and discontinued operations are presented
separately for Fortum Group. Comparative period information for 2014 has been
restated accordingly
Restated information for the interim periods of 2014 can be found in a stock
exchange release published 15 April 2015
3

Q2 2015 Results
4
Key figures (MEUR) II/2015 II/2014 I-II/2015 I-II/2014 2014 LTM
Sales, continuing operations 794 886 1,834 2,094 4,088 3,828
Comparable EBITDA, continuing operations 228 302 624 758 1,457 1,323
Operating profit:
Continuing operations 144 233 494 599 1,296 1,191
Discontinued operations 4,314 63 4,395 2,030 2,132 4,497
Fortum total 4,458 295 4,889 2,629 3,428 5,688
Comparable operating profit:
Continuing operations 143 210 486 568 1,085 1,003
Discontinued operations 32 45 114 164 266 216
Fortum total 175 255 600 732 1,351 1,219
Profit before taxes:
Continuing operations 143 224 493 597 1,232 1,128
Discontinued operations 4,313 61 4,394 2,029 2,128 4,493
Fortum total 4,456 284 4,887 2,626 3,360 5,621
Earnings per share:
Continuing operations 0.13 0.22 0.46 0.57 1.22 1.11
Discontinued operations 4.85 0.06 4.92 2.24 2.33 5.01
Fortum total 4.98 0.28 5.38 2.81 3.55 6.12
Net cash from operating activities, continuing operations 229 394 745 799 1,406 1,352
Summary of the second quarter of 2015
• Fortum’s results continued to be pressured by low electricity prices
• The second quarter was characterised by among the highest precipitation in recent
history, which resulted in high and partly must-run hydro power production
• Swedish electricity distribution business divestment completed the whole Distribution
sale
• The negotiations on Russian TGC-1 restructuring did not come to conclusions; Fortum
was unable to commit to the Finnish Fennovoima nuclear power project by the end of
June
– Should the negotiations proceed later, and depending on the conditions of the construction
license decision by the Finnish Government, Fortum would still be ready to participate with a
minority share of maximum 15% on the same terms and conditions as the other Finnish
companies currently participating
5
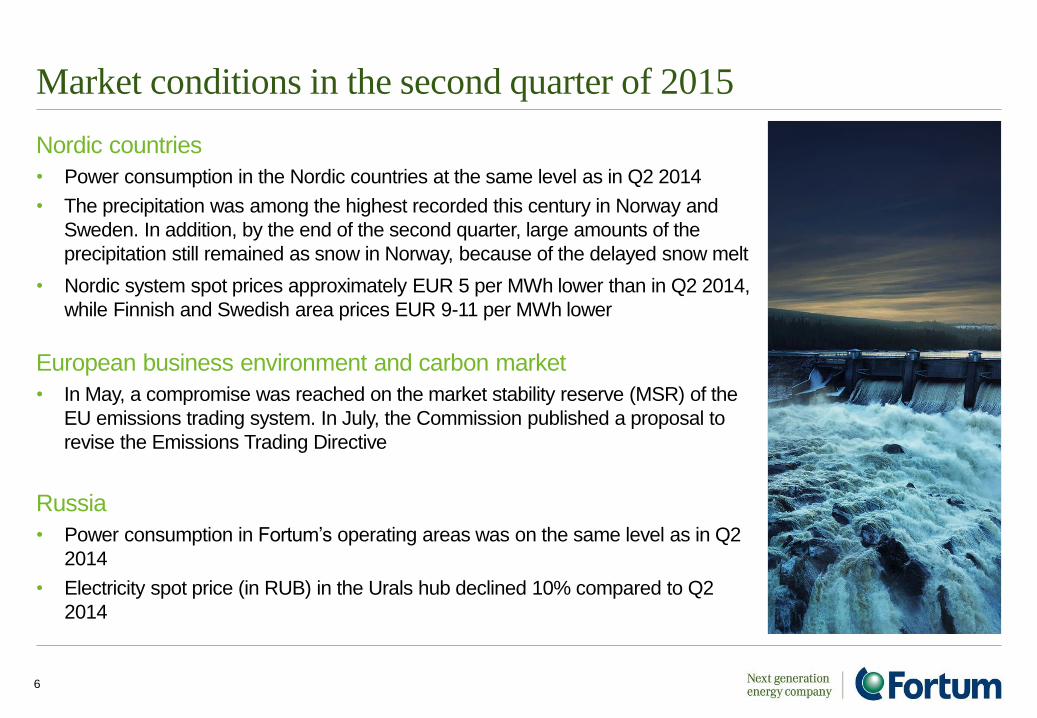
Market conditions in the second quarter of 2015
Nordic countries
• Power consumption in the Nordic countries at the same level as in Q2 2014
• The precipitation was among the highest recorded this century in Norway and
Sweden. In addition, by the end of the second quarter, large amounts of the
precipitation still remained as snow in Norway, because of the delayed snow melt
• Nordic system spot prices approximately EUR 5 per MWh lower than in Q2 2014,
while Finnish and Swedish area prices EUR 9-11 per MWh lower
European business environment and carbon market
• In May, a compromise was reached on the market stability reserve (MSR) of the
EU emissions trading system. In July, the Commission published a proposal to
revise the Emissions Trading Directive
Russia
• Power consumption in Fortum’s operating areas was on the same level as in Q2
2014
• Electricity spot price (in RUB) in the Urals hub declined 10% compared to Q2
2014
6
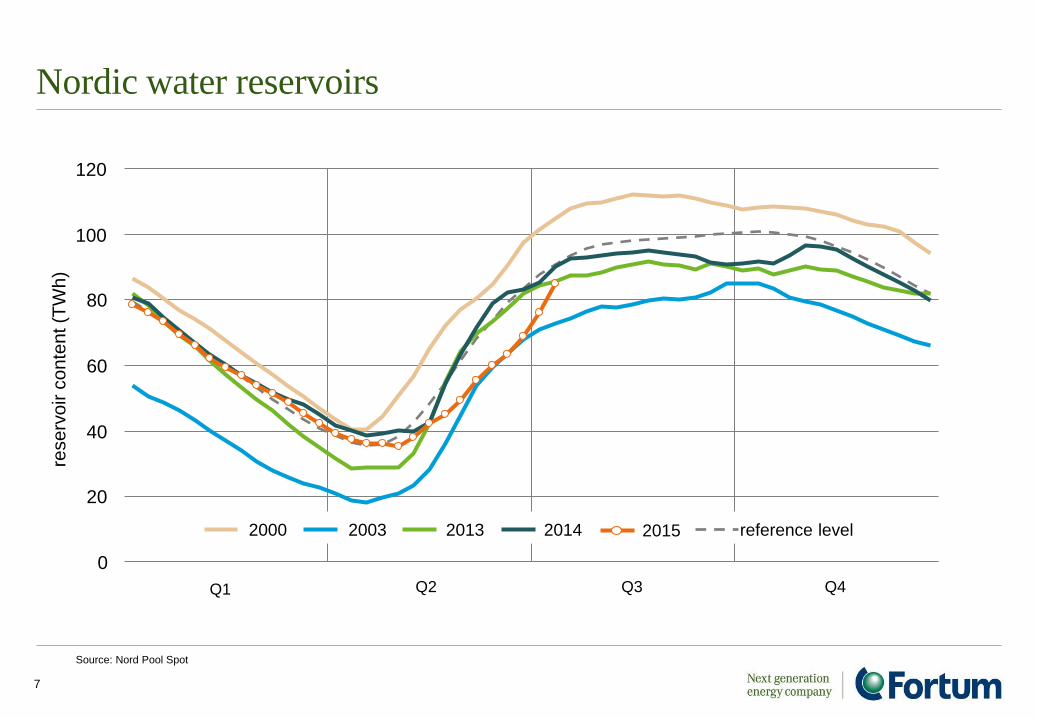
Nordic water reservoirs
7
Source: Nord Pool Spot
Q1 Q2 Q3 Q4
20
40
60
80
100
120
rese
rvo
ir c
on
ten
t (T
Wh)
0
2000 2003 2014 2013 reference level 2015
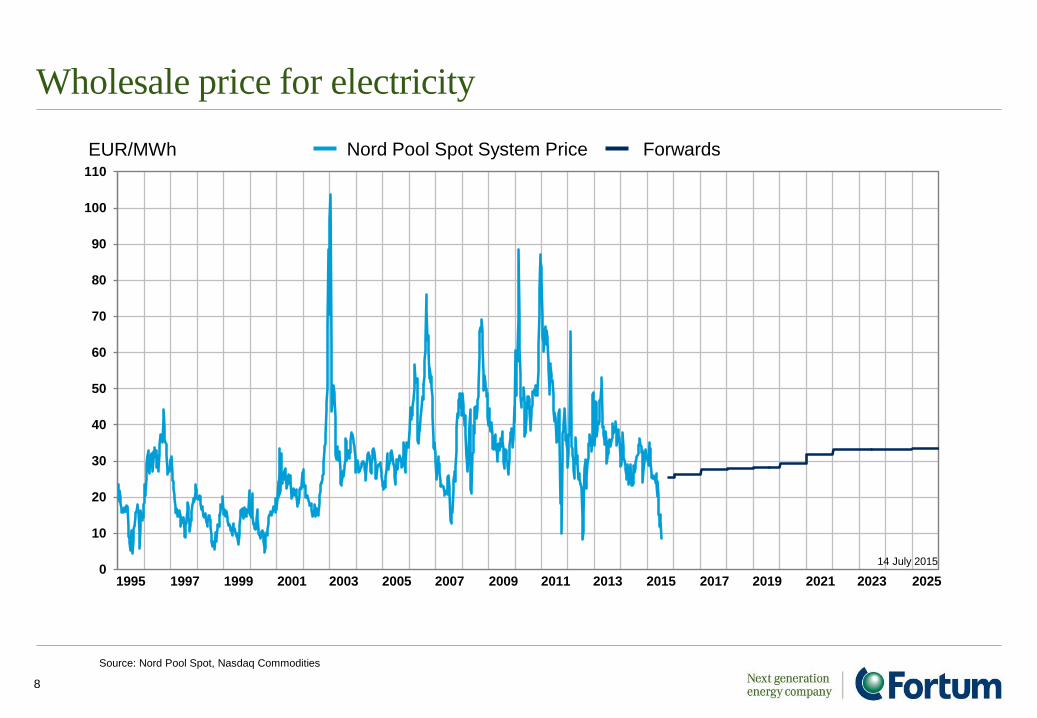
Wholesale price for electricity
8
Source: Nord Pool Spot, Nasdaq Commodities
0
10
20
30
40
50
60
70
80
90
100
110
EUR/MWh Nord Pool Spot System Price Forwards
14 July 2015
1995 1997 1999 2001 2003 2005 2007 2009 2011 2013 2015 2017 2019 2021 2023 2025
0
30
60
90
120
150
US
D /
bb
l
Crude oil price (ICE Brent)
2007 2008 20112009 2010 20132012 2014 2015 20160
7
14
21
28
35
EU
R /
tC
O2
CO2 price (ICE ECX EUA)
2007 2008 20112009 2010 20132012 2014 2015 2016
0
50
100
150
200
250
US
D /
t
Coal price (ICE Rotterdam)
2007 2008 20112009 2010 20132012 2014 2015 20160
20
40
60
80
100
GB
p /
th
erm
Gas price (ICE NBP)
2007 2008 20112009 2010 20132012 2014 2015 2016
9
Source: ICE
Market prices 14 July 2015; 2015-2016 future quotations
Fuel and CO2 allowance prices
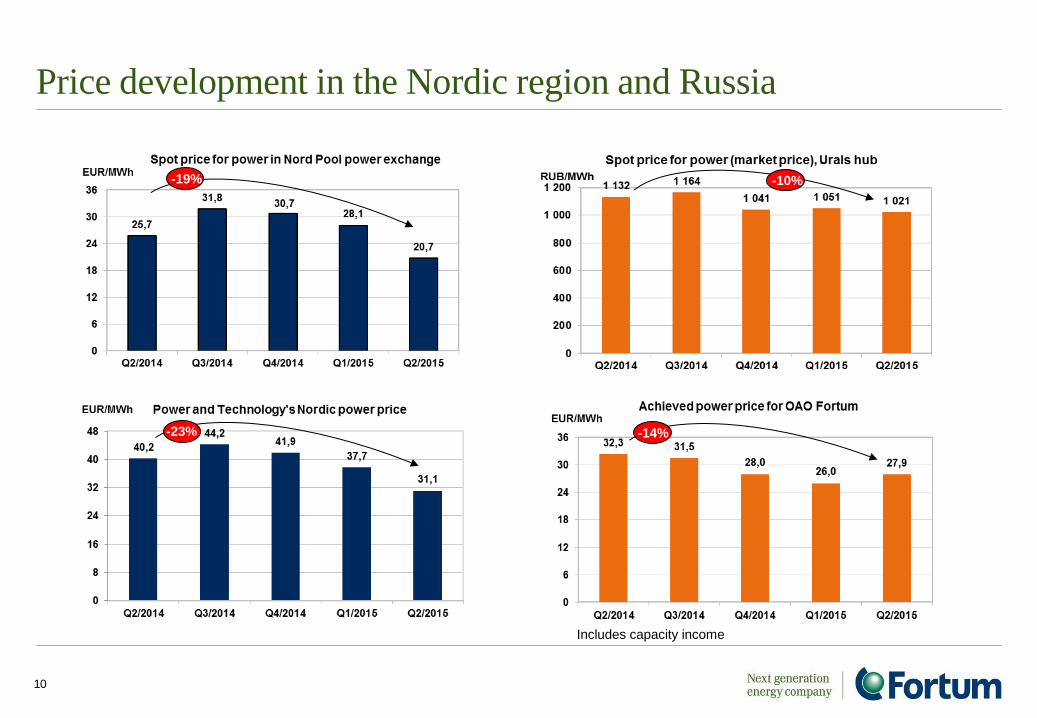
Price development in the Nordic region and Russia
10
Includes capacity income
-19%
-23% -14%
-10%
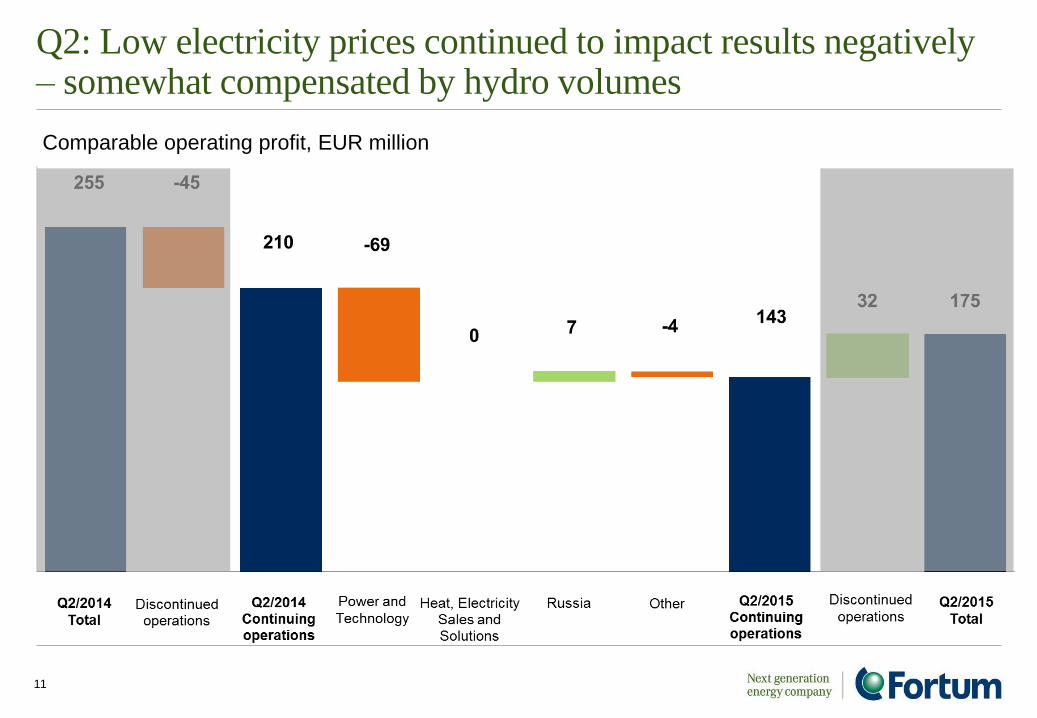
Q2: Low electricity prices continued to impact results negatively – somewhat compensated by hydro volumes
11
Comparable operating profit, EUR million

January - June: Clearly lower achieved power price
12
Comparable operating profit, EUR million
Financials

Comparable and reported operating profit
II/2015 II/2014 II/2015 II/2014 I-II/2015 I-II/2014 I-II/2015 I-II/2014
Power and Technology 114 183 117 151 317 434 320 413
Heat, Electricity Sales
and Solutions 11 11 9 67 68 59 73 112
Russia 35 28 36 28 132 102 133 101
Other -17 -13 -17 -13 -32 -27 -32 -28
Total, continuing
operations 143 210 144 233 486 568 494 599
Discontinued
operations 32 45 4,314 63 114 164 4,395 2,030
Total, Fortum 175 255 4,458 295 600 732 4,889 2,629
14
Comparable
operating profit
Reported
operating profit MEUR
Non-recurring items including approximately EUR -15 million effect from the cancellation of Olkiluoto 4 nuclear
power project, as well as an IFRS accounting treatment (IAS 39) of derivatives and nuclear fund adjustments for
continuing operations amounted to EUR 1 (23) million in the second quarter and EUR 8 (30) million in January-
June 2015.
Reported
operating profit Comparable
operating profit
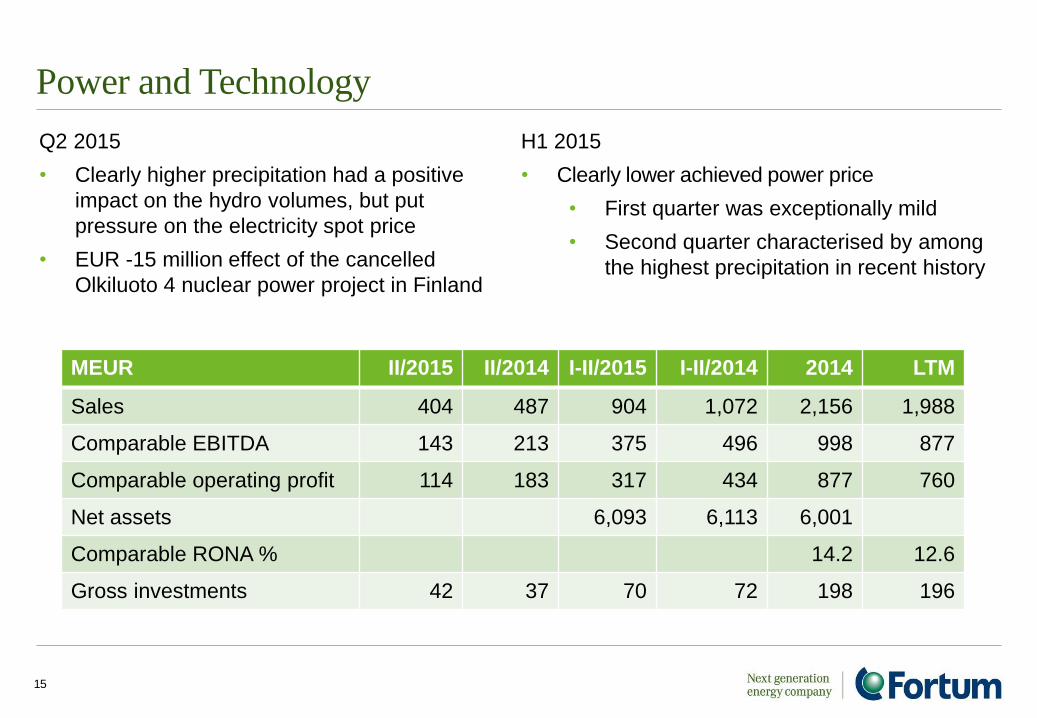
Power and Technology
MEUR II/2015 II/2014 I-II/2015 I-II/2014 2014 LTM
Sales 404 487 904 1,072 2,156 1,988
Comparable EBITDA 143 213 375 496 998 877
Comparable operating profit 114 183 317 434 877 760
Net assets 6,093 6,113 6,001
Comparable RONA % 14.2 12.6
Gross investments 42 37 70 72 198 196
15
Q2 2015
• Clearly higher precipitation had a positive
impact on the hydro volumes, but put
pressure on the electricity spot price
• EUR -15 million effect of the cancelled
Olkiluoto 4 nuclear power project in Finland
H1 2015
• Clearly lower achieved power price
• First quarter was exceptionally mild
• Second quarter characterised by among
the highest precipitation in recent history
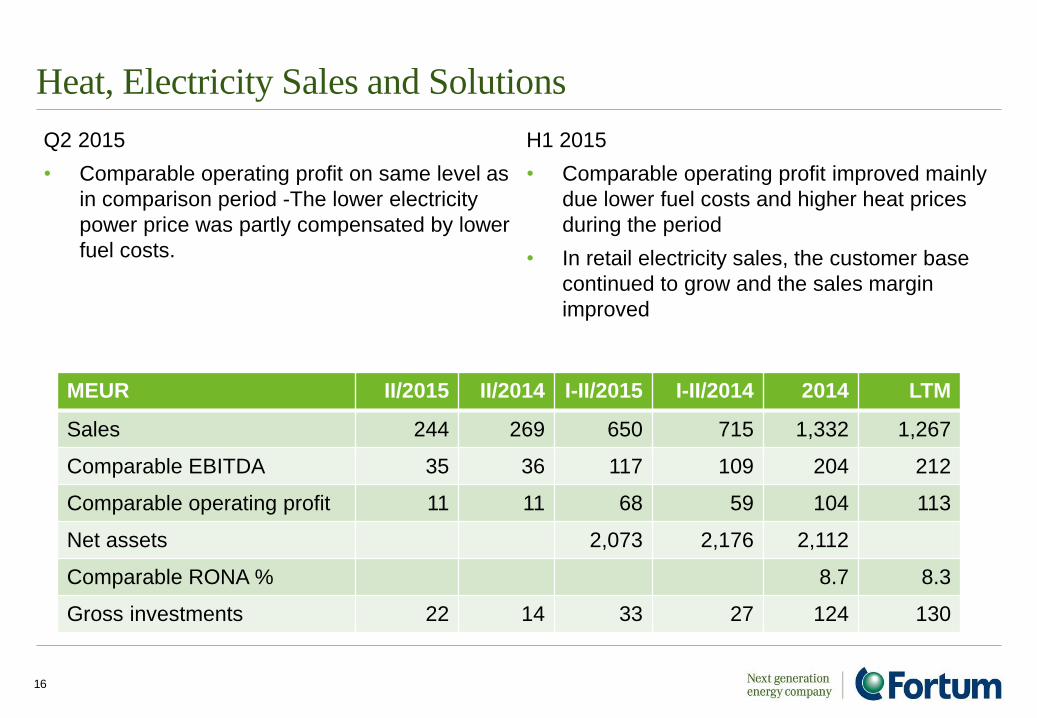
Heat, Electricity Sales and Solutions
16
Q2 2015
• Comparable operating profit on same level as
in comparison period -The lower electricity
power price was partly compensated by lower
fuel costs.
MEUR II/2015 II/2014 I-II/2015 I-II/2014 2014 LTM
Sales 244 269 650 715 1,332 1,267
Comparable EBITDA 35 36 117 109 204 212
Comparable operating profit 11 11 68 59 104 113
Net assets 2,073 2,176 2,112
Comparable RONA % 8.7 8.3
Gross investments 22 14 33 27 124 130
H1 2015
• Comparable operating profit improved mainly
due lower fuel costs and higher heat prices
during the period
• In retail electricity sales, the customer base
continued to grow and the sales margin
improved
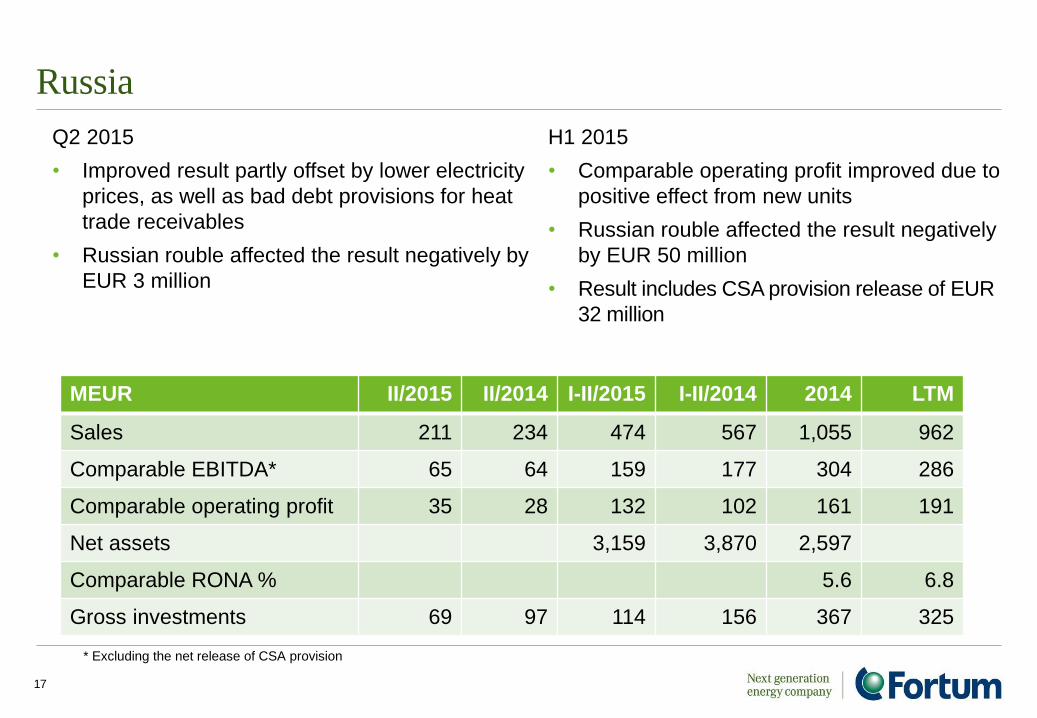
Russia
Q2 2015
• Improved result partly offset by lower electricity
prices, as well as bad debt provisions for heat
trade receivables
• Russian rouble affected the result negatively by
EUR 3 million
17
MEUR II/2015 II/2014 I-II/2015 I-II/2014 2014 LTM
Sales 211 234 474 567 1,055 962
Comparable EBITDA* 65 64 159 177 304 286
Comparable operating profit 35 28 132 102 161 191
Net assets 3,159 3,870 2,597
Comparable RONA % 5.6 6.8
Gross investments 69 97 114 156 367 325
H1 2015
• Comparable operating profit improved due to
positive effect from new units
• Russian rouble affected the result negatively
by EUR 50 million
• Result includes CSA provision release of EUR
32 million
* Excluding the net release of CSA provision
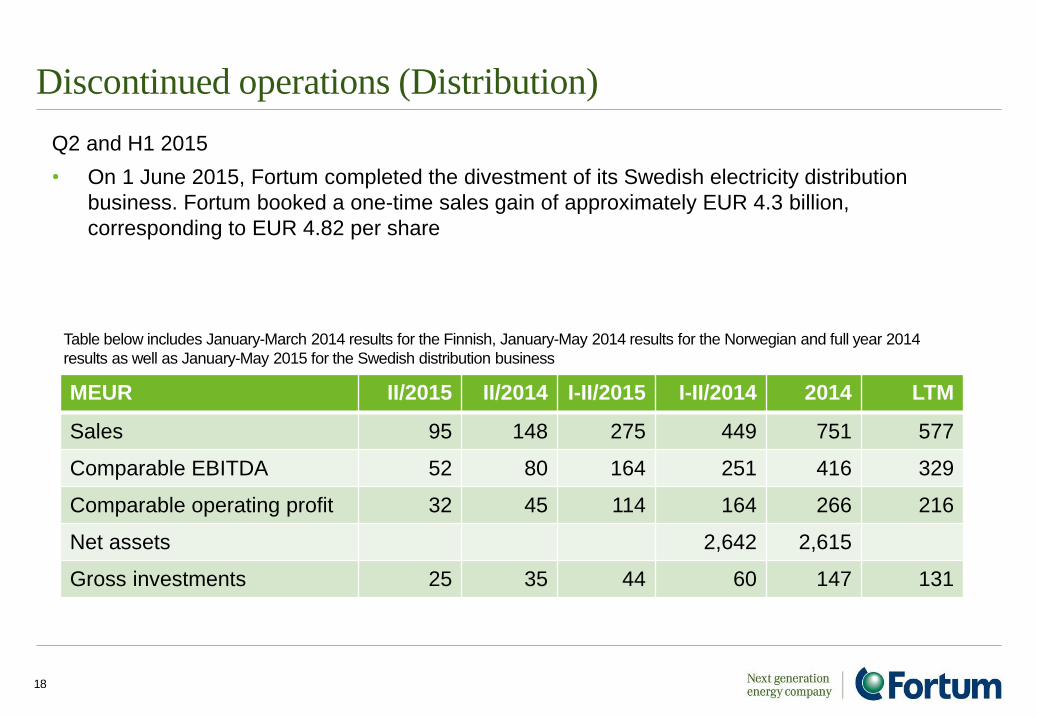
Discontinued operations (Distribution)
18
Q2 and H1 2015
• On 1 June 2015, Fortum completed the divestment of its Swedish electricity distribution
business. Fortum booked a one-time sales gain of approximately EUR 4.3 billion,
corresponding to EUR 4.82 per share
Table below includes January-March 2014 results for the Finnish, January-May 2014 results for the Norwegian and full year 2014
results as well as January-May 2015 for the Swedish distribution business
MEUR II/2015 II/2014 I-II/2015 I-II/2014 2014 LTM
Sales 95 148 275 449 751 577
Comparable EBITDA 52 80 164 251 416 329
Comparable operating profit 32 45 114 164 266 216
Net assets 2,642 2,615
Gross investments 25 35 44 60 147 131
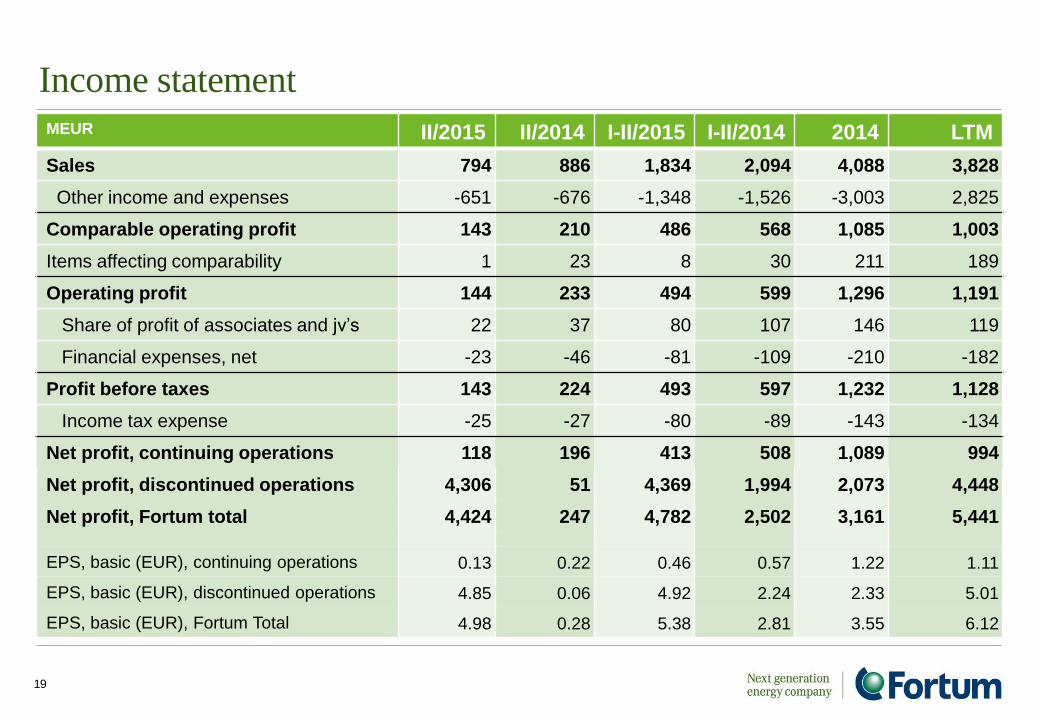
Income statement MEUR II/2015 II/2014 I-II/2015 I-II/2014 2014 LTM
Sales 794 886 1,834 2,094 4,088 3,828
Other income and expenses -651 -676 -1,348 -1,526 -3,003 2,825
Comparable operating profit 143 210 486 568 1,085 1,003
Items affecting comparability 1 23 8 30 211 189
Operating profit 144 233 494 599 1,296 1,191
Share of profit of associates and jv’s 22 37 80 107 146 119
Financial expenses, net -23 -46 -81 -109 -210 -182
Profit before taxes 143 224 493 597 1,232 1,128
Income tax expense -25 -27 -80 -89 -143 -134
Net profit, continuing operations 118 196 413 508 1,089 994
Net profit, discontinued operations 4,306 51 4,369 1,994 2,073 4,448
Net profit, Fortum total 4,424 247 4,782 2,502 3,161 5,441
EPS, basic (EUR), continuing operations 0.13 0.22 0.46 0.57 1.22 1.11
EPS, basic (EUR), discontinued operations 4.85 0.06 4.92 2.24 2.33 5.01
EPS, basic (EUR), Fortum Total 4.98 0.28 5.38 2.81 3.55 6.12
19
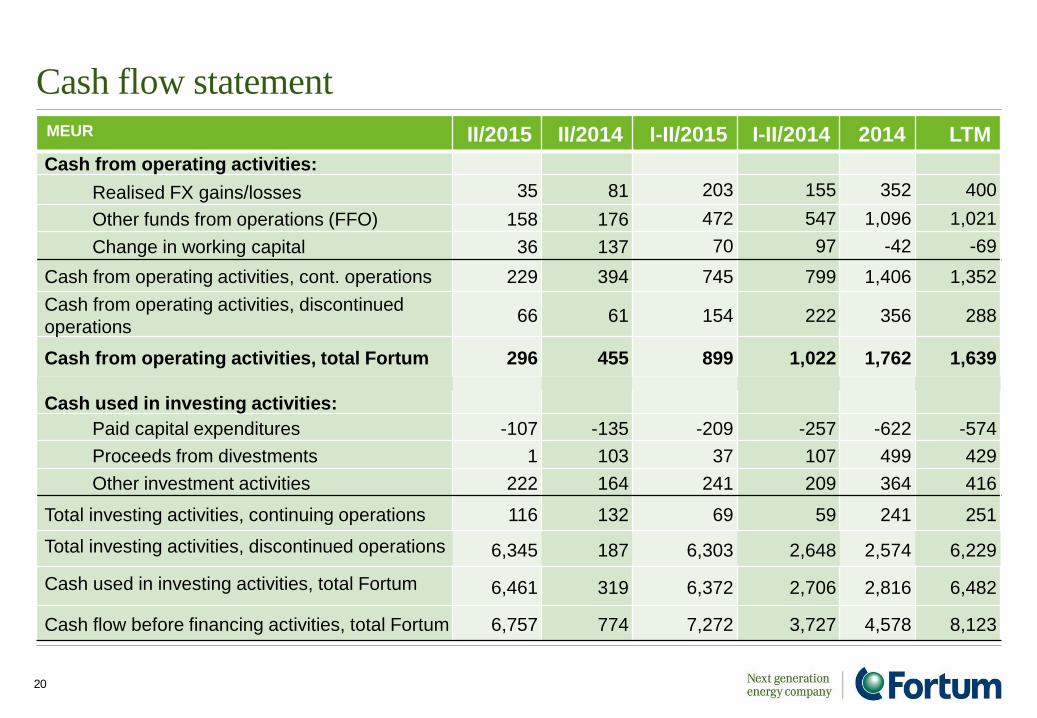
Cash flow statement
MEUR II/2015 II/2014 I-II/2015 I-II/2014 2014 LTM
Cash from operating activities:
Realised FX gains/losses 35 81 203 155 352 400
Other funds from operations (FFO) 158 176 472 547 1,096 1,021
Change in working capital 36 137 70 97 -42 -69
Cash from operating activities, cont. operations 229 394 745 799 1,406 1,352
Cash from operating activities, discontinued
operations 66 61 154 222 356 288
Cash from operating activities, total Fortum 296 455 899 1,022 1,762 1,639
Cash used in investing activities:
Paid capital expenditures -107 -135 -209 -257 -622 -574
Proceeds from divestments 1 103 37 107 499 429
Other investment activities 222 164 241 209 364 416
Total investing activities, continuing operations 116 132 69 59 241 251
Total investing activities, discontinued operations
6,345 187 6,303 2,648 2,574 6,229
Cash used in investing activities, total Fortum
6,461 319 6,372 2,706 2,816 6,482
Cash flow before financing activities, total Fortum 6,757 774 7,272 3,727 4,578 8,123
20
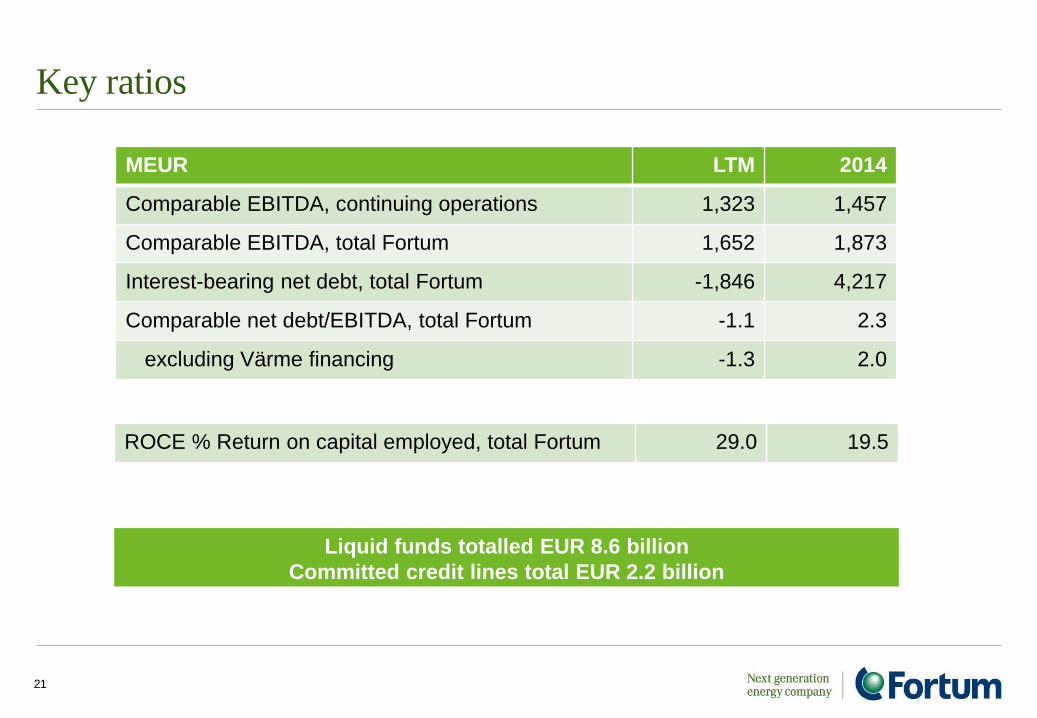
Key ratios
MEUR LTM 2014
Comparable EBITDA, continuing operations 1,323 1,457
Comparable EBITDA, total Fortum 1,652 1,873
Interest-bearing net debt, total Fortum -1,846 4,217
Comparable net debt/EBITDA, total Fortum -1.1 2.3
excluding Värme financing -1.3 2.0
21
ROCE % Return on capital employed, total Fortum 29.0 19.5
Liquid funds totalled EUR 8.6 billion
Committed credit lines total EUR 2.2 billion
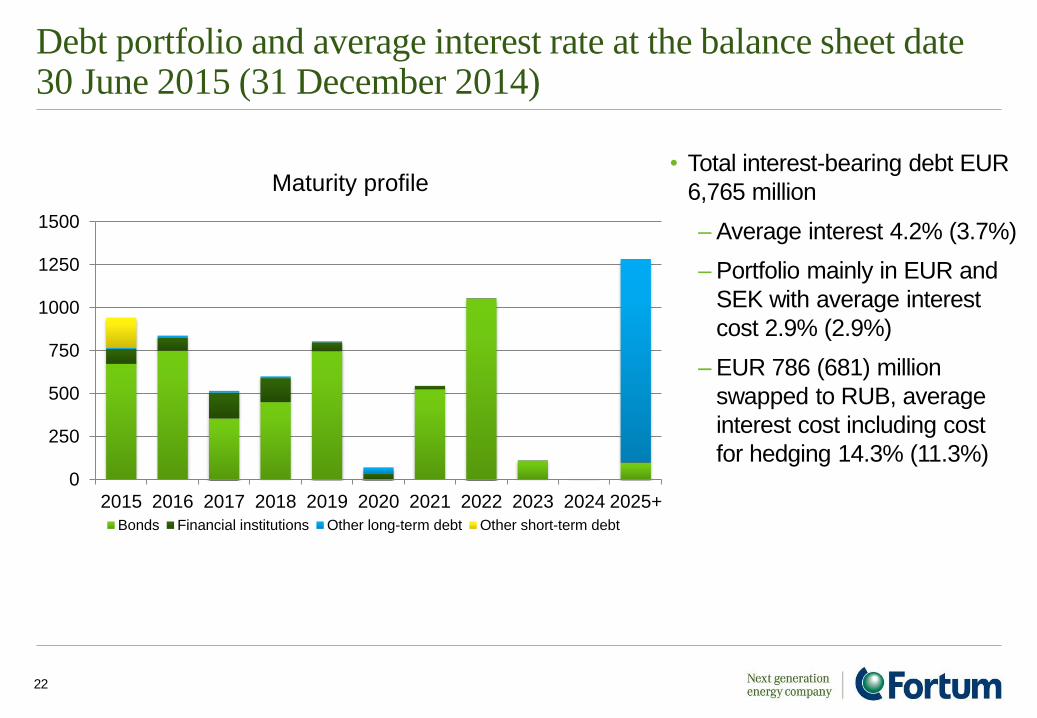
Debt portfolio and average interest rate at the balance sheet date 30 June 2015 (31 December 2014)
22
• Total interest-bearing debt EUR
6,765 million
– Average interest 4.2% (3.7%)
– Portfolio mainly in EUR and
SEK with average interest
cost 2.9% (2.9%)
– EUR 786 (681) million
swapped to RUB, average
interest cost including cost
for hedging 14.3% (11.3%) 0
250
500
750
1000
1250
1500
2015 2016 2017 2018 2019 2020 2021 2022 2023 2024 2025+
Bonds Financial institutions Other long-term debt Other short-term debt
Maturity profile

Outlook
Outlook
Nordic markets
• Fortum continues to expect that the average annual electricity demand
growth will be on average approximately 0.5% in the coming years
• Electricity is expected to continue to gain share of total energy consumption
Russia
• The run-rate operating profit (EBIT) level for the Russia Segment, RUB 18.2
billion, is targeted to be reached during 2015, but the euro result level will be
volatile, due to the translation effect
Key drivers and risks
• Economic
• Political
• Currency
• Wholesale price of electricity and volumes
• demand and supply • fuels
• hydrological situation • power plant availability
• CO2 emissions allowance prices
24
Outlook
Annual capex estimate, excluding potential acquisitions
• 2015 approximately EUR 0.8 billion
Hedging
• Rest of 2015 approx. 45% hedge ratio at approx. EUR 41/MWh
• 2016 approx. 25% hedge ratio at approx. EUR 35/MWh
Taxation
• Effective tax rate for 2015 for the Group 19-21%
• The Swedish Parliament decided to approve the proposed tax increase
of 17% on installed nuclear capacity. The tax will be implemented as of
1 August 2015. The estimated impact on Fortum is approximately EUR
15 million annually, albeit corporate tax-deductable
25
For more information www.fortum.com/investors