Embed Size (px)
Citation preview
Helge Berger, George Kopits and Istvan P. Székely Fiscal Indulgence in Central Europe: Loss of the External Anchor? Hotel "Grand Villa Argentina", Dubrovnik
Draft version
June 23 - 26, 2004 Please do not quote
The Tenth Dubrovnik Economic Conference
WP/04/62
Fiscal Indulgence in Central Europe: Loss of the External Anchor?
Helge Berger, George Kopits, and
István P. Székely
© 2004 International Monetary Fund WP/04/62
IMF Working Paper
European and Fiscal Affairs Departments
Fiscal Indulgence in Central Europe: Loss of the External Anchor?
Prepared by Helge Berger, George Kopits, and István P. Székely1
Authorized for distribution by Robert A. Feldman and Teresa Ter-Minassian
April 2004
Abstract
This Working Paper should not be reported as representing the views of the IMF. The views expressed in this Working Paper are those of the author(s) and do not necessarily represent those of the IMF or IMF policy. Working Papers describe research in progress by the author(s) and are published to elicit comments and to further debate.
In recent years, fiscal performance in Central Europe has steadily deteriorated, in contrast to the improvement in the Baltics. This paper explores the determinants of such differences among countries slated for EU accession. Regression estimates suggest that economic and institutional fundamentals do not provide a full explanation. An alternative explanation lies in the political economy of the accession process, and a game-theoretic model illustrates whya country with a stronger bargaining position might have an incentive to deviate from convergence to the Maastricht criteria. The model generates alternative fiscal policy regimes—allowing for regime shifts—depending on country characteristics and EU policies. JEL Classification Numbers: H6, C70 Keywords: Fiscal policy, EU economic and monetary union, game-theoretic approach Author’s E-Mail Address: [email protected], [email protected],
1 Helge Berger is professor of economics at the Free University of Berlin and George Kopits is a member of the Monetary Council, National Bank of Hungary. Earlier drafts of this paper were presented at the Central European University, the European Commission, and the National Bank of Austria. The authors are grateful to Eduard Hochreiter, Robert A. Feldman, seminar participants, and IMF colleagues for useful comments. The views expressed are those of the authors and do not necessarily represent those of the National Bank of Hungary.
- 2 -
Contents Page
I. Introduction ............................................................................................................................3
II. Fiscal Performance and Potential Determinants ...................................................................3
III. Empirical Results .................................................................................................................6
IV. External Anchor: Fiscal Strategies in the EU Accession...................................................10
V. A Game-theoretic Approach ...............................................................................................11 A. Analytical Framework.............................................................................................11 B. Policy Decisions......................................................................................................14 C. Implications.............................................................................................................17
VI. Conclusions........................................................................................................................19 Tables 1. EU Accession Countries: Selected Economic and Institutional Indicators, 2002 .................7 2. EU Accession Countries: Estimates of Fiscal Performance, 1997–2002 ..............................9 3. Model: Accession as a Game...............................................................................................16 Figures 1. Central Europe and the Baltics: General Government Overall Deficit, 1997–2002..............5 2. Model: The Critical Si Value ...............................................................................................15 3. Model: A Change in EU Accession Policy..........................................................................18
- 3 -
I. INTRODUCTION In recent years, European Union (EU) accession countries (ACs) have displayed increasing differences in fiscal behavior. While the large Central European ACs have, for the most part, significantly relaxed their fiscal stance, the fiscal position of the Baltic economies has converged well within the Maastricht treaties deficit reference value. Although these trends have been well documented (Kopits and Székely, 2004), there is limited understanding of the factors that are responsible for the difference between the two regions. The deterioration in the underlying fiscal position is not attributable to the transition shock, since its repercussions had faded by the middle of the 1990s, and were followed by a period of rapid growth. Moreover, the evolution of fiscal institutions—customarily helpful in explaining differences in fiscal performance—contribute little to our understanding of fiscal trends in the ACs. Thus, there may be other factors responsible for the deteriorating fiscal stance in Central Europe, including the EU accession process itself. For years, one of the most powerful arguments for an early EU enlargement was that the accession process and the conditionality associated with it would provide an external anchor for macroeconomic policies—and also possibly for political developments—in this region Somewhat surprisingly, the opposite seems to have happened in the large Central European countries regarding their fiscal policies. As we will argue below, the explanation for this apparent contradiction may lie in the political economy of the accession process. In what follows, the paper explores the determinants of cross-country differences in fiscal trends. It starts with a broad description of these trends, identifying some of the potential explanatory features of the ACs. It continues with a discussion of the main factors that are generally thought to determine fiscal outcomes and presents a regression analysis in an attempt to test the significance of these factors in the ACs. The estimates suggest that the unfavorable fiscal performance in the large Central European economies cannot be explained by standard factors alone. As a possible explanation for the observed differences in fiscal trends, we develop a simple game-theoretic model to capture key aspects of the political economy of policymaking in the ACs. The model is capable of generating different fiscal policy regimes depending on certain characteristics of the ACs and on policies pursued by the EU. The paper concludes with a summary of the findings and of possible implications for post-accession Europe, including for the Stability and Growth Pact (SGP).
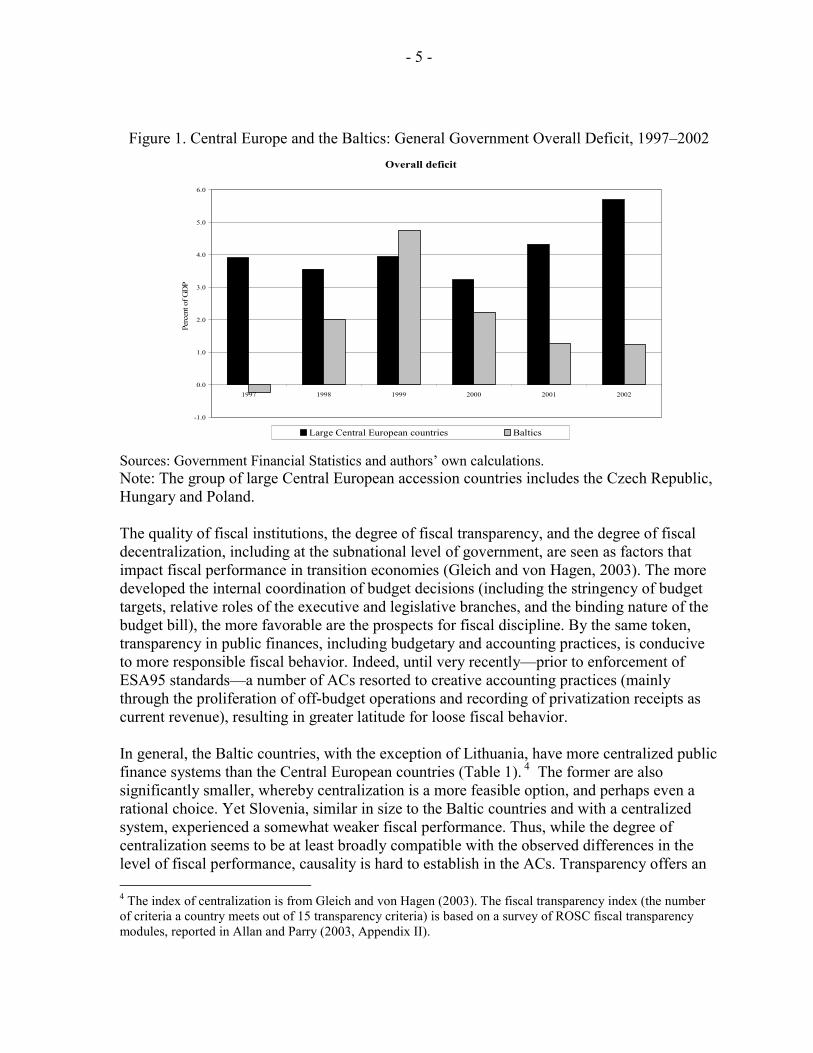
II. FISCAL PERFORMANCE AND POTENTIAL DETERMINANTS Following the adverse impact of the 1998 Russian crisis, the large Central European countries (Czech Republic, Hungary, and Poland) and the Baltic countries (Estonia, Latvia, and Lithuania) followed opposite fiscal strategies (Figure 1). The Baltic countries quickly returned to the close-to-balanced position that characterized them prior to the crisis. By contrast, the Central European countries, even though they faced a significantly smaller shock, set out on a course of rapid fiscal loosening, reaching dangerously high levels of fiscal imbalance.
- 4 -
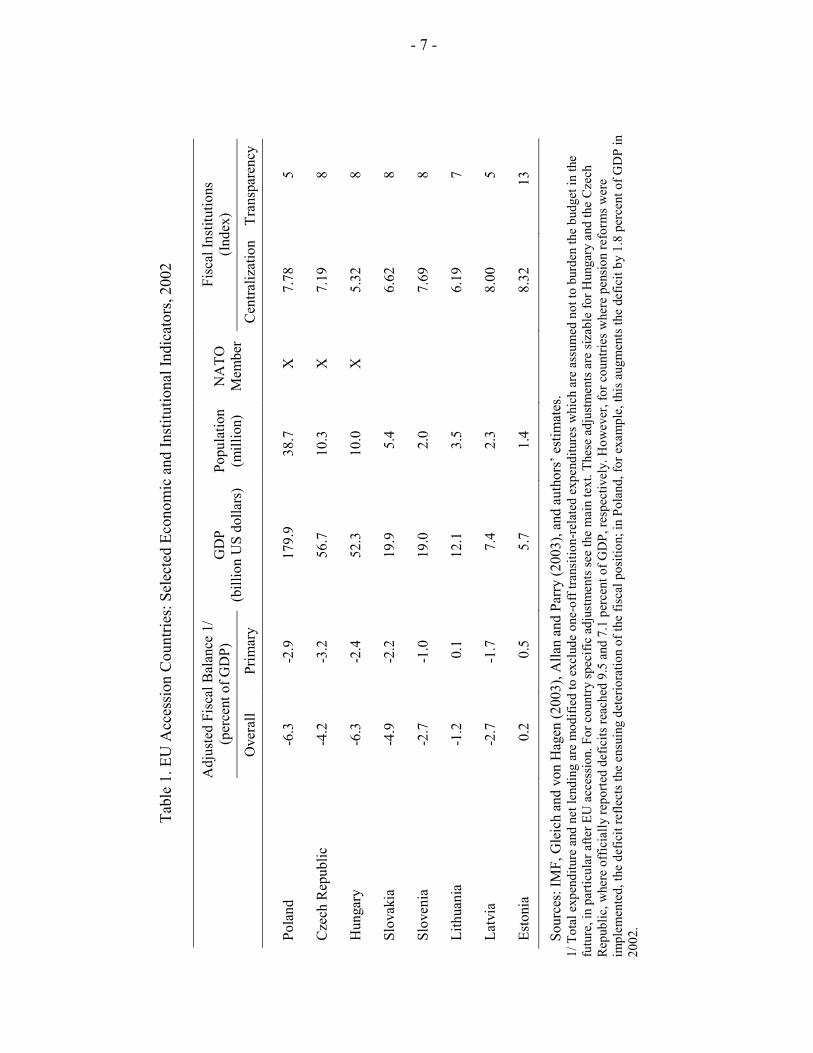
By 2002, the general government overall balance (adjusted for one-off transition related items) ranged from a surplus of about ¼ percent of GDP in Estonia to a deficit of 6 ½ percent of GDP in Hungary and Poland, with primary deficits reaching almost one half of this level (Table 1).2 A marked increase in primary expenditures in Central European countries, particularly government wages and transfer payments, account for most of the prevailing differences in fiscal performance vis-à-vis the Baltics (Kopits and Székely, 2004). These trends point to an obvious question: why have the Baltic countries been consistently more disciplined and why did the fiscal positions of the large Central European countries, which were already weak by the second half of the 1990s, deteriorate rapidly during 2001-03? As a first step toward answering this question, let us draw on the literature in search of possible explanations for differences in fiscal performance across countries and over time. With unchanged expenditure policy and tax structure, fiscal performance is bound to reflect the economic cycle. The effect of cyclical fluctuations in ACs may differ over time as they become integrated into the European economy to varying degrees, given differences in their openness to trade and their economic structure. While the large fiscal imbalances of the Baltic countries in 1998–99 were clearly associated with a large output gap—probably accentuated by a countercyclical fiscal impulse in the wake of the Russian crisis, the picture for Central Europe is less clear. While Hungary had no discernable output gap, fiscal deterioration in Poland was to some extent cyclical in nature in 2001–02.3 In addition to the economic cycle, the fiscal position is likely to be influenced by the political cycle. The deficit tends to increase in election years and return toward its previous level afterwards. Thus, the rapid widening of the fiscal imbalance in 2001–02 may have been at least partially attributable to the elections being held in several Central European countries.
2 Total expenditure and net lending and the overall deficit are modified to exclude one-off transition-related expenditures that are thought not to burden the budget in the future, in particular after EU accession and to make deficit measures comparable across countries. Specific country adjustments are as follow. Czech Republic: total expenditure and net lending and the overall balance are adjusted to exclude grants to transformation institutions which cover costs related to the management of bad assets. Hungary: one time, mainly capital expenditure made in 2002 are excluded. Lithuania: expenditure on the savings restitution program is excluded until 1999; no adjustment is made thereafter. Slovak Republic: expenditure on called guarantees is added to total expenditure. For Estonia, Latvia, Poland, and Slovenia, no adjustments are made.
3 The cyclically adjusted overall deficit relative to GDP rose by about 1 percentage point in Poland in 2001 (Székely, 2003).
- 5 -
Figure 1. Central Europe and the Baltics: General Government Overall Deficit, 1997–2002
Overall deficit
-1.0
0.0
1.0
2.0
3.0
4.0
5.0
6.0
1997 1998 1999 2000 2001 2002
Perc
ent o
f GD
P
Large Central European countries Baltics Sources: Government Financial Statistics and authors’ own calculations. Note: The group of large Central European accession countries includes the Czech Republic, Hungary and Poland. The quality of fiscal institutions, the degree of fiscal transparency, and the degree of fiscal decentralization, including at the subnational level of government, are seen as factors that impact fiscal performance in transition economies (Gleich and von Hagen, 2003). The more developed the internal coordination of budget decisions (including the stringency of budget targets, relative roles of the executive and legislative branches, and the binding nature of the budget bill), the more favorable are the prospects for fiscal discipline. By the same token, transparency in public finances, including budgetary and accounting practices, is conducive to more responsible fiscal behavior. Indeed, until very recently—prior to enforcement of ESA95 standards—a number of ACs resorted to creative accounting practices (mainly through the proliferation of off-budget operations and recording of privatization receipts as current revenue), resulting in greater latitude for loose fiscal behavior. In general, the Baltic countries, with the exception of Lithuania, have more centralized public finance systems than the Central European countries (Table 1). 4 The former are also significantly smaller, whereby centralization is a more feasible option, and perhaps even a rational choice. Yet Slovenia, similar in size to the Baltic countries and with a centralized system, experienced a somewhat weaker fiscal performance. Thus, while the degree of centralization seems to be at least broadly compatible with the observed differences in the level of fiscal performance, causality is hard to establish in the ACs. Transparency offers an 4 The index of centralization is from Gleich and von Hagen (2003). The fiscal transparency index (the number of criteria a country meets out of 15 transparency criteria) is based on a survey of ROSC fiscal transparency modules, reported in Allan and Parry (2003, Appendix II).
- 6 -
even less clear-cut explanation for differing fiscal performance. While Estonia stands out with a high degree of transparency, and Poland and Latvia lag behind, the remaining countries exhibit rather similar levels of fiscal transparency and significant differences in fiscal performance. More important, while neither the degree of centralization nor the transparency that characterizes the fiscal framework of these economies changed appreciably over time since the mid-1990s, fiscal behavior has fluctuated significantly over this period. Specifically, lacking evidence that the quality of fiscal institutions has deteriorated in Central Europe or has improved in the Baltics, this factor can hardly be responsible for the divergence in fiscal trends between these regions in the past few years. An additional potential explanation for differences in fiscal performance stems from the country’s exchange rate arrangement. This is based on the supposedly disciplining effect of a hard peg. A number of ACs (Czech Republic, Poland, and several Baltic countries) had introduced fixed exchange rate regimes early in the transition, which brought about rapid disinflation, and were accompanied by apparent fiscal balance. In particular, adherence of the Baltic countries to a currency board arrangement may be viewed as a determinant of fiscal discipline. However, recent theoretical work (Tornell and Velasco, 1998; Yan Sun, 2003), building on the earlier currency crisis literature (starting with Krugman, 1979), indicates that a fixed exchange rate regime does not in itself ensure fiscal discipline; on the contrary, sustained fiscal imbalance undermines the fixed parity. This has been amply corroborated by currency crisis episodes, including under a hard peg.5 Indeed, the chosen exchange rate arrangement is secondary to the quality of fiscal, monetary and financial institutions, in ensuring successful macroeconomic outcomes (Calvo and Mishkin, 2003). In turn, a solid institutional framework can only contribute to discipline in macroeconomic policies, including public finances, if supported by a wide political consensus.
III. EMPIRICAL RESULTS To test for the significance of the above determinants, a regression equation is estimated on a pooled sample of annual observations for eight ACs over the period 1997–2002.6 Estimates are shown for the overall balance and the primary balance of the general government
5 For a discussion of the role of fiscal misbehavior in recent currency crises, see Kopits (forthcoming). Furthermore, neither the currency board arrangement in Argentina, nor dollarization in Ecuador, has succeeded in removing fiscal dominance in these countries.
6 Besides the data sources noted above, the schedule of elections for each country is available from the University of Essex Project on Political Transformation and Electoral Process in Post-Communist Europe (www2.essex.ac.uk/elect/database).
- 7 -
Ta
ble
1. E
U A
cces
sion
Cou
ntrie
s: S
elec
ted
Econ
omic
and
Inst
itutio
nal I
ndic
ator
s, 20
02
A
djus
ted
Fisc
al B
alan
ce 1
/ (p
erce
nt o
f GD
P)
Fisc
al In
stitu
tions
(In
dex)
Ove
rall
Prim
ary
GD
P (b
illio
n U
S do
llars
) Po
pula
tion
(mill
ion)
N
ATO
M
embe
r C
entra
lizat
ion
Tran
spar
ency
Pola
nd
-6
.3
-2
.9
17
9.9
38
.7
X
7.
78
5 C
zech
Rep
ublic
-4.2
-3.2
56.7
10.3
X
7.
19
8 H
unga
ry
-6
.3
-2
.4
52
.3
10
.0
X
5.
32
8 Sl
ovak
ia
-4
.9
-2
.2
19
.9
5.
4
6.
62
8 Sl
oven
ia
-2
.7
-1
.0
19
.0
2.
0
7.
69
8 Li
thua
nia
-1
.2
0.
1
12.1
3.5
6.19
7
Latv
ia
-2
.7
-1
.7
7.
4
2.3
8.00
5
Esto
nia
0.
2
0.5
5.
7
1.4
8.32
13
Sour
ces:
IMF,
Gle
ich
and
von
Hag
en (2
003)
, Alla
n an
d Pa
rry
(200
3), a
nd a
utho
rs’ e
stim
ates
. 1/
Tot
al e
xpen
ditu
re a
nd n
et le
ndin
g ar
e m
odifi
ed to
exc
lude
one
-off
trans
ition
-rel
ated
exp
endi
ture
s w
hich
are
ass
umed
not
to b
urde
n th
e bu
dget
in th
e fu
ture
, in
parti
cula
r afte
r EU
acc
essi
on. F
or c
ount
ry sp
ecifi
c ad
just
men
ts se
e th
e m
ain
text
. The
se a
djus
tmen
ts a
re si
zabl
e fo
r Hun
gary
and
the
Cze
ch
Rep
ublic
, whe
re o
ffic
ially
repo
rted
defic
its re
ache
d 9.
5 an
d 7.
1 pe
rcen
t of G
DP,
resp
ectiv
ely.
How
ever
, for
cou
ntrie
s whe
re p
ensi
on re
form
s wer
e im
plem
ente
d, th
e de
ficit
refle
cts t
he e
nsui
ng d
eter
iora
tion
of th
e fis
cal p
ositi
on; i
n Po
land
, for
exa
mpl
e, th
is a
ugm
ents
the
defic
it by
1.8
per
cent
of G
DP
in
2002
.
- 8 -
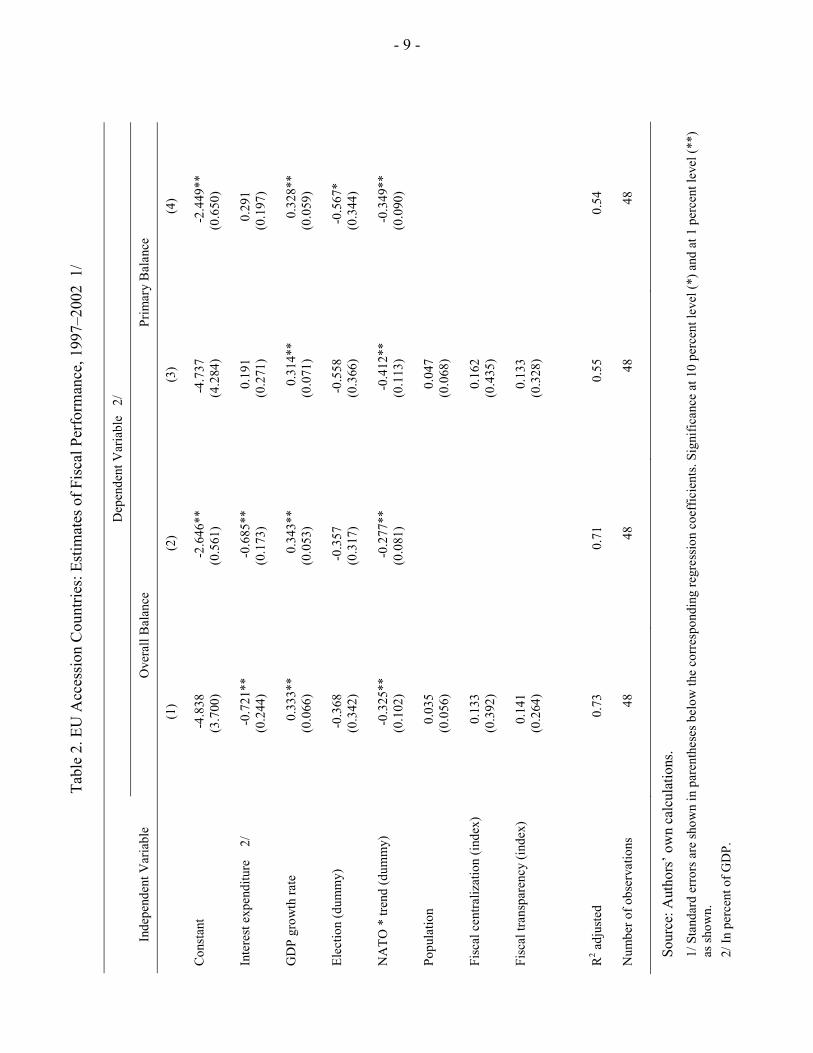
(Table 2).7 For all countries, the fiscal balance measure was adjusted for all transition-related budgetary outlays or receipts, as noted. The results confirm the hypothesized influence of the economic cycle and the political cycle, captured by the positive coefficient of the growth rate and the negative coefficient of the election dummy respectively.8 While an economic upswing brings about an improvement in the fiscal balance, an election tends to lead to a temporary deterioration in the balance. Although showing positive signs, in line with the hypothesized relationship, the indicators of fiscal centralization and transparency are not significant in any of the equations. The results, though displaying a better fit for the overall balance, are broadly similar for either measure of fiscal balance. The estimates also show that a change in the interest cost is less than fully reflected in a change in the overall balance. In other words, the change in the interest bill leads to a change in the primary position. As the interest bill declined in this period—owing to declining interest rates and public indebtedness—this result can be interpreted as a rather opportunistic policy approach: around one-third of the saving from lower interest costs was utilized to relax the primary position, while the remaining two thirds were translated into an improvement of the overall balance. Apart from testing for the above determinants, the equation was expanded to incorporate the effect of variables that reflect strategic factors that may have shaped the conduct of fiscal policy, including AC characteristics (size of the economy, population, etc.). However, none of these country characteristics turned out to be significant. After controlling for the aforementioned characteristics, there still remains a trend change in the fiscal performance of the large Central European countries (Czech Republic, Hungary, and Poland) starting in 1999, the year when they joined the North Atlantic Treaty Organization (NATO). This effect was captured by a variable constructed from the interaction of a dummy for NATO membership and a linear time trend, that turned out to be highly significant in all the specifications.9 The size of the trend decline implies an annual deterioration of the fiscal balance of about one-third of a percentage point of GDP—roughly equivalent to the effect of a one percentage point drop in real GDP growth. The sizable and significant time trend in the period following NATO accession, after allowing for all the factors described above, requires further investigation of the determinants of the ongoing fiscal expansion in the large Central European ACs.
7 Based on a random effects estimator, allowing for both individual country and time effects.
8 The election dummy is 1 in an election year and 0 otherwise.
9 The NATO dummy is 1 in the year when a country is a NATO member and 0 otherwise. The interaction variable multiplies this dummy with a linear time trend. Neither the trend nor the NATO dummy was significant separately.
- 9 -
Tabl
e 2.
EU
Acc
essi
on C
ount
ries:
Est
imat
es o
f Fis
cal P
erfo
rman
ce, 1
997–
2002
1/
Dep
ende
nt V
aria
ble
2/
Inde
pend
ent V
aria
ble
Ove
rall
Bal
ance
Pr
imar
y B
alan
ce
(1
) (2
) (3
) (4
)
Con
stan
t -4
.838
-2
.646
**
-4.7
37
-2.4
49**
(3.7
00)
(0.5
61)
(4.2
84)
(0.6
50)
In
tere
st e
xpen
ditu
re
2/
-0.7
21**
-0
.685
**
0.19
1 0.
291
(0
.244
) (0
.173
) (0
.271
) (0
.197
)
GD
P gr
owth
rate
0.33
3**
0.34
3**
0.31
4**
0.32
8**
(0
.066
) (0
.053
) (0
.071
) (0
.059
)
Elec
tion
(dum
my)
-0
.368
-0
.357
-0
.558
-0
.567
*
(0.3
42)
(0.3
17)
(0.3
66)
(0.3
44)
N
ATO
* tr
end
(dum
my)
-0
.325
**
-0.2
77**
-0
.412
**
-0.3
49**
(0.1
02)
(0.0
81)
(0.1
13)
(0.0
90)
Po
pula
tion
0.03
5
0.04
7
(0
.056
)
(0.0
68)
Fisc
al c
entra
lizat
ion
(inde
x)
0.13
3
0.16
2
(0
.392
)
(0.4
35)
Fisc
al tr
ansp
aren
cy (i
ndex
) 0.
141
0.
133
(0.2
64)
(0
.328
)
R
2 adj
uste
d 0.
73
0.71
0.
55
0.54
Num
ber o
f obs
erva
tions
48
48
48
48
Sour
ce: A
utho
rs’ o
wn
calc
ulat
ions
. 1/
Sta
ndar
d er
rors
are
show
n in
par
enth
eses
bel
ow th
e co
rres
pond
ing
regr
essi
on c
oeff
icie
nts.
Sign
ifica
nce
at 1
0 pe
rcen
t lev
el (*
) and
at 1
per
cent
leve
l (**
) as
show
n.
2/ In
per
cent
of G
DP.
- 10 -
IV. EXTERNAL ANCHOR: FISCAL STRATEGIES IN THE EU ACCESSION The conduct of fiscal policy, as well as the development of fiscal institutions, played a key role in assessing the preparation of ACs for EU membership. The latter involves close coordination of macroeconomic policies and imposes rule-based restrictions on the fiscal deficit and public debt. ACs were expected to demonstrate their capacity and willingness to comply with these restrictions, and the annual assessment of progress in meeting the membership criteria placed emphasis on fiscal policies and institutions. After joining the EU, the new members would be subject to the excessive deficit procedure and required to present a medium-term convergence program, summarizing their strategy to meet the Maastricht criteria and to adopt the euro. Although by the second half of the 1990s virtually all ACs had declared their intention to join the EU there were, as discussed above, widening differences in fiscal positions. While the Baltic countries seem to have converged within the fiscal reference values and, as a result, are well positioned for an early euro adoption, Central European countries will have to embark on a sizable fiscal adjustment to avoid excessive deficits. The prospect of EU accession has clearly failed to bring about sound fiscal policies in these countries. In a stylized sense, the choice for (fiscal) policymakers in ACs has been between a loose and a tight fiscal stance expressed in terms of the perceived consequences of each option: on the one hand, the immediate political payoff from a fiscal expansion (or the political cost of fiscal consolidation), and on the other, the potential reward (or penalty) associated with convergence (or non-convergence) to the fiscal reference values. In other words, improved electoral prospects upfront, at the cost of the probable penalty of postponed (or shelved) EU accession, had to be weighed against a less favorable electoral outcome but better prospects of eventual EU accession. This can be boiled down to a choice between the immediate political gain from pursuing a dynamically inconsistent strategy and the utility gain from accession by adhering to the intertemporal budget constraint.10 The actual choice was likely to depend on the AC’s perception of its bargaining power in the accession process, of the probability of sanctions for nonconvergence, of the political gain from accession (or the political costs of being left out), and of the policy stance of the EU. Information asymmetry may have played an important role. While in principle committed to early accession, neither the EU institutions nor the accession governments (with the exception of those with a relatively weak bargaining position) seem to have assigned priority to convergence to fiscal balance. The EU authorities had downplayed the importance of
10 This choice can be characterized as lying between two types of signaling according to the time consistency of the adopted policy stance, with differing effects on credibility. In the first type, initially declared excessive toughness, followed by laxity, lacks credibility. By contrast, in the second type, a moderately but persistently tough policy stance is credible. For an application in the context of monetary policy, see Drazen and Masson (1994).
- 11 -
compliance with the reference values;11 instead, they sought to focus the attention of policymakers in ACs on the completion of unfinished transition-related structural reforms, which, for the most part, entail major upfront fiscal costs.12 The objective was to avoid postponing these reform tasks for the sake of a seeming convergence to the reference values for inflation, interest rate, public debt, and deficit. Meanwhile, internally, politicians in some ACs found it convenient to ignore the need for convergence and—often under the cover of some creative accounting—to pursue fiscal expansion to enhance electoral prospects. In some instances, this posture was further justified by the fact that strict adherence to the reference values is a requirement for euro participation but not for EU membership. Therefore, during the accession process, the governments in the large ACs may have increasingly felt that they were in a relatively strong bargaining position regarding fiscal performance. Indeed, the above empirical results support the view that the large ACs, which also happened to participate in the first wave of NATO enlargement, experienced a continued worsening of the underlying fiscal position during 2001–03. This behavior can be depicted, in a stylized way, in a game-theoretical framework.
V. A GAME-THEORETIC APPROACH With the upshot of the empirical findings being that fiscal policy behavior in the ACs is less likely to have been influenced by conventional economic and institutional determinants than the political aspects of the accession process, we turn to a simple analytical framework in the spirit of the more recent political-economic literature (see, e.g., Persson and Tabellini, 2000). In particular, we develop a game-theoretic approach capable of generating distinct fiscal outcomes as rational strategic choices under certain well-defined circumstances.
A. Analytical Framework
Let us suppose that a decisionmaker faces a choice between a “loose” (L) or “tight” (T) fiscal policy (Fi) for country i. Further, assume that a “tight” policy would imply a fiscal deficit (or a surplus) in line with the conditions set for accession to the EU or the euro area, respectively, while a “loose” policy would constitute an excessive deficit in breach of these conditions. Fiscal policy is determined simultaneously in all ACs.
11 For example, in the words of Governor Balcerowicz of the National Bank of Poland, “the European Commission and the ECB speak too little about the need for fiscal consolidation in the context of stability and growth [pact] in the accession states;” see Financial Times, June 26, 2003.
12 According to European Commission (2002, p. 149), “Central and Eastern European Countries are not required to fulfill the Maastricht nominal convergence criteria, but rather to comply with the Copenhagen criteria. The primary fiscal concern in the pre-accession period is medium-term sustainability, rather than achieving any particular target for the government balance. As noted above, setting of specific budgetary targets could be misleading and the priority should remain on improving the functioning of the budgeting process, carrying out structural reforms, implementing the acquis communautaire, and supporting catching up.”
- 12 -
Fiscal policy will take into account both the expected utility from the selected deficit level (ui) and any expected utility loss or penalty (Si) the country might suffer when running a loose fiscal policy. Here Si is probably best interpreted as the (exogenous) utility loss associated with not joining the EU or euro area. Thus, Si will be specific to each country, differing perhaps with the preferences of decision makers, including their rate of time preference.13 Given the political nature of the accession process, a reasonable assumption is that this utility loss occurs only with a country-specific probability (pi). More specifically, a decision maker in country i will chose fiscal policy Fi to maximize the expected utility
iiiiiii SFFbpuEU ⋅−= ≠ ),,( , (1) where
=== LFu
TFuuii
iii if
if with ii uu > (2)
is the utility level associated with the type of fiscal policy chosen. The assumption ii uu > could reflect fiscal illusion or the neglect of the medium-run consequences of fiscal indulgence due to political-economic reasons.14 A crucial element of the setup in (1) is the nature of pi, which is intended to capture elements of the political process governing EU accession. Equation (3) describes the probability of being left behind in the accession process as a function of three arguments: the fiscal policy choice made by each country; its bargaining power; and the position taken by the EU.15 13 Alternatively, Si could also be interpreted as a fiscal charge, for instance the penalty foreseen in the SGP for a deficit exceeding 3 percent of GDP. In this case, the model would entail a sequence of two stages, with the first (“constitutional”) stage encompassing the determination of Si and the second stage the fiscal policy decision. Since the accession countries so far have no role in setting the penalties under the SGP, however, Si remains exogenous under the second interpretation as well. Moreover, it might still be individual to each country, as a given penalty set by the EU and defined in percent of GDP might cause different degrees of utility loss depending, for instance, on the GDP level. It is also important to emphasize that this model operates with a narrowly defined utility function of a policy maker and, thus, it does not incorporate the welfare implications of different fiscal policies.
14 Such reasons might include the election cycle (Nordhaus, 1975), the wish to restrict the financial room of maneuver of a successor government (Persson and Svensson, 1989), or simply the short time-horizon of an outgoing government with a low re-election probability. Alternatively, one might argue that it describes the policy maker’s view of the benefits of a more expansionary fiscal policy in the face of an adverse demand shock. However, our empirical results presented above do not suggest that the significant structural deterioration of the fiscal balances in the large Central European ACs observed in recent years could be explained by alluding to (a series of) demand shocks alone. 15 If Si were interpreted as a penalty under the SGP, pi would be the probability with which country i would expect to actually be forced to pay that fine in case of a “loose” fiscal policy.
- 13 -
=∧=−==−
==
≠
≠
TFLFbpLFFbp
TFp
iii
iii
i
i
ififif0
with 01 >>>> ibpp . (3)
The first argument in equation (3) is country i’s policy choice. The probability of being excluded from the accession process (or sanctioned in another way) is 0 if a country steers a fiscal course in line with the conditions set for EU or euro area accession (Fi = T); it is positive, however, if a country opts for a “loose” or excessive fiscal position (Fi = L). In the latter case, the probability level is a function of fiscal stance decision makers in i expect to prevail simultaneously in other accession countries ( iF≠ ) and country i's perceived bargaining position (bi) in the accession process vis-à-vis the EU. Another country-specific factor that plays a role in equation (3) is the political clout or bargaining power (bi) countries carry with respect to the EU. The role of bi in equation (3) is straightforward: the larger is a country’s political weight, the smaller is the probability of being left behind. While more than one factor influences a country’s bargaining position, a plausible set of determinants would include arguments such as economic size, historical ties to the EU, or a country’s strategic importance from a defense perspective—as discussed above. In addition, of course, fiscal policies are a function of the EU’s position vis-à-vis failures of policy conduct during the accession process. To capture the idea that the EU might vary the intensity with which it enforces fiscal discipline in the ACs, equation (3) incorporates common probability terms, p and p , which capture the likelihood that the EU will pursue the exclusion of countries from accession in the case of fiscal behavior not in line with expectations of the EU. While these probabilities are the same across all countries, they are assumed to change with their collective behavior. The fact that the probability of being sanctioned for excessive fiscal deficits is declining if other accession countries chose not to adhere to the “tight” policy rule, too, reflects the notion that, from the EU’s perspective, it is easier to sanction one candidate country for fiscal misbehavior than all (i.e., when
TFLF ii =∧= ≠ and not when LFF ii == ≠ ). This could be because a “big bang” approach to EU or euro area enlargement is viewed as advantageous by EU policy makers or because of “economies of scale” in the political resistance put up by accession countries against pressures for a tighter fiscal policy.16 Obviously, since fiscal policy in accession countries is determined simultaneously, the political externalities build into the accession process described by equation (3) hold the possibility of introducing elements of a coordination problem into each country i's decision
16 For instance, if all countries breach the accession conditions, it would be easier to argue that a common exogenous shock could be behind the fiscal slippage.
- 14 -
making. That is, fiscal policy decisions could take the form of a Nash-game where expectations about other accession countries’ policy decisions matter rather than only “national” preferences or parameters. We will discuss this possibility below.
B. Policy Decisions
To describe the fiscal decision by country i, it is useful to identify the point at which decision makers are indifferent between the two policy options L and T. This is the case if the expected utility (1) is the same under both policies, that is,
43421iEP
iiii Spuu≡
⋅−= . (4)
The definition iiii EPSpu ≡⋅− helps to simplify notation in what follows. Using (2) and (3) and rearranging allows identifying the level of Si that fulfills (4)
==≡−−
=∧=≡−−
=−
=≠
≠
LFFSbpuu
TFLFSbpuu
puu
Siii
i
ii
iiii
ii
i
iii
if
if
*
*
* . (5)
The resulting decision rule is quite straightforward: for penalties above *
iS , decision makers in country i will find it more attractive to choose a “tight” fiscal policy; conversely, for penalties below *
iS , running a “loose” fiscal policy will be more attractive. Obviously, since
ii uu > it will be true that **ii SS > . Moreover, note that both are decreasing in ii uu − and bi.
We will discuss some further characteristics of *iS and *
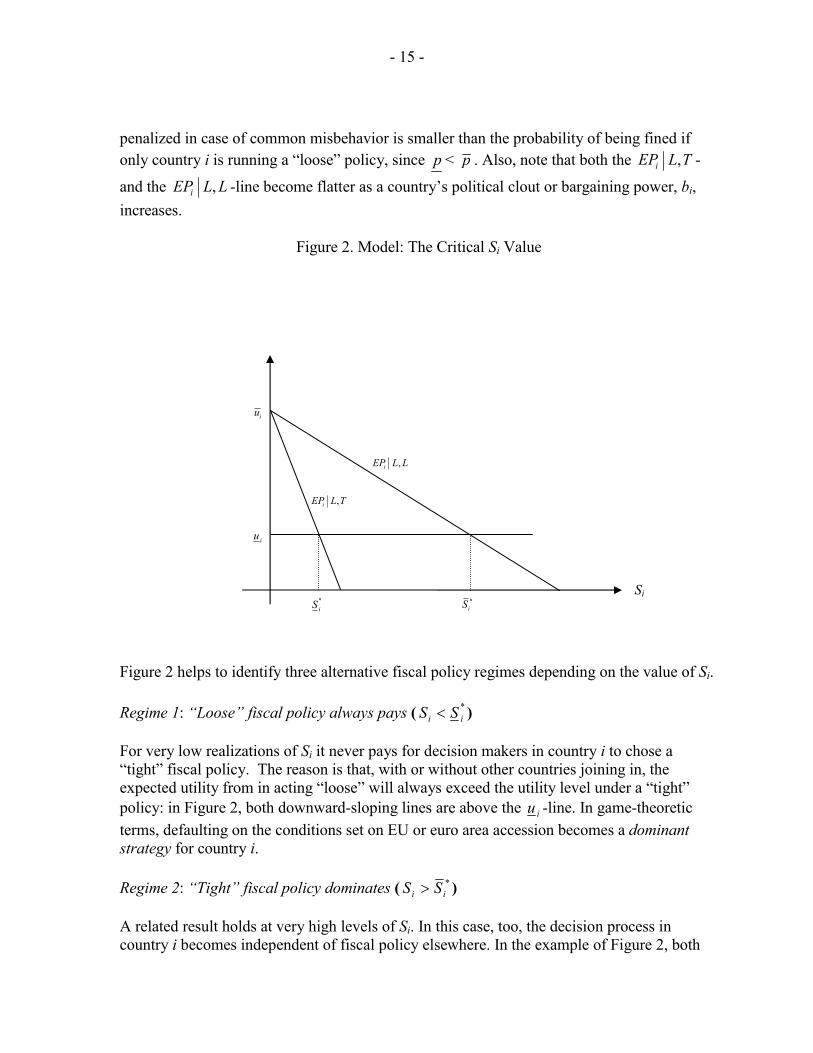
iS below. Figure 2 provides an illustration of these results. The horizontal iu -line marks the expected utility level that would result from a “tight” fiscal policy, while the downward sloping EPi-lines show the expected utility loss (or expected penalty) related to a “loose” fiscal policy. Note that we use LLEPi , to identify the expected utility loss in the case in which all
countries pick a “loose” fiscal policy and TLEPi , to mark the expected utility loss in the case in which only country i picks a “loose” fiscal policy. Under a “loose” policy, the expected utility always decreases in Si, but the speed of decline is a function of the fiscal strategy selected in other accession countries. If all candidate countries pick a “loose” policy, the probability of being excluded from EU accession will be lower, the curve will be flatter, and the intersection with the iu -line (which defines the indifference level *
iS ), will be further to the right than when only country i selects a “loose” policy. The reason is that, for a given level of bargaining power, bi, the probability of being
- 15 -
penalized in case of common misbehavior is smaller than the probability of being fined if only country i is running a “loose” policy, since p < p . Also, note that both the TLEPi , -
and the LLEPi , -line become flatter as a country’s political clout or bargaining power, bi, increases.
Figure 2. Model: The Critical Si Value
Figure 2 helps to identify three alternative fiscal policy regimes depending on the value of Si. Regime 1: “Loose” fiscal policy always pays ( *
ii SS < )
For very low realizations of Si it never pays for decision makers in country i to chose a “tight” fiscal policy. The reason is that, with or without other countries joining in, the expected utility from in acting “loose” will always exceed the utility level under a “tight” policy: in Figure 2, both downward-sloping lines are above the iu -line. In game-theoretic terms, defaulting on the conditions set on EU or euro area accession becomes a dominant strategy for country i. Regime 2: “Tight” fiscal policy dominates ( *
ii SS > )
A related result holds at very high levels of Si. In this case, too, the decision process in country i becomes independent of fiscal policy elsewhere. In the example of Figure 2, both
TLEPi ,
LLEPi ,
iu
iu
*iS *
iSSi
- 16 -
downward-sloping lines are below the iu -line. In this case, the level of Si is high enough to effectively prohibit fiscal misbehavior: the expected utility level under a “tight” policy will always exceed that under a “loose” policy, rendering the former a dominant strategy. Regime 3: Fiscal policy as a coordination game ( **
iii SSS << )
For intermediate values of Si, however, country i's policy choice will depend on its assumptions regarding the simultaneous fiscal policy selection in other accession countries. In Figure 2, in the interval **
iii SSS << , expected utility under a “tight” fiscal policy (the u -line) is higher than under a “loose” policy just in country i (indicated by the TLEPi , -line), but lower than in the case where all countries simultaneously run a “loose” fiscal policy (the
LLEPi , -line). Consequently, if decision makers expect that fiscal policy elsewhere will stick to the accession rules, the probability of being excluded from EU for fiscal misbehavior is sufficiently large to make a “tight” fiscal policy the more attractive policy option. If, on the other hand, the other accession countries are expected to chose a “loose” policy, country i will play “loose” as well. In other words, the fiscal stance is determined in a coordination game between accession countries.17 To simplify the exposition, it is helpful to reduce Regime 3 to a symmetric two-country setup, with country i on the one hand and “all other” accession countries ≠i on the other. In this case, equation (5) describes a normal (or strategic) form coordination game that can be summarized in a simple matrix (Table 3),
Table 3. Model: Accession as a Game
Country ≠iCountry i L T
L a, a d, c T c, d c, c
where
iii Sbpua ⋅−−≡ )( > iuc ≡ > iii Sbpud ⋅−−≡ )( .
While both countries are fully informed about the payout matrix, they cannot observe the other country’s actions before deciding on fiscal policy but move simultaneously. It is
17 To keep things simple, we retain the assumption that the EU is not an active player in the coordination phase of the game. However, while we do not model this explicitly, the EU is of course is crucial in defining the playing field ex ante through its influence on Si and/or p.
- 17 -
straightforward to show that the game has two Nash equilibria. If both countries expect the other country to choose to play L, both will choose L themselves. If, however, i and i≠ believe their counterpart to select T, both will find it optimal to choose T as well. Note that the equilibrium in which both countries decide to run a “loose” fiscal policy entails higher pay-offs for both, making it the more attractive solution for decision maker’s in i and
i≠ . This makes the equilibrium (L, L) more likely to be selected if the coordination game was played repeatedly or a refined Nash-equilibrium concept was to be applied.
C. Implications
Ultimately, fiscal policy decisions in this theoretical model depend on preferences expressed in the subjective penalty for misbehavior, Si, i.e. the utility loss from being excluded from EU or euro area accession. If the sanction associated with not adhering to the conditions attached to EU or euro area accession is very low, decision makers are likely to favor a “loose” fiscal policy. If, on the other hand, the penalty for fiscal misbehavior is very high, fiscal policy is more likely to follow a “tight” course. In addition, the expected utility associated with a “loose” or “tight” fiscal policy plays a role for the choice of fiscal policy. Obviously, the more developed a country’s preference for prudent fiscal policy or the better informed decision makers are regarding the intertemporal consequences of a “loose” fiscal policy, the larger is the difference ii uu − and the less attractive a “loose” fiscal policy and the “tighter” actual policy. An increase in iu simultaneously moves the intersection of the TLEPi , - and the LLEPi , -line with the y-axis
upward and the intersection with the x-axis to the left. This implies a decrease in both *S
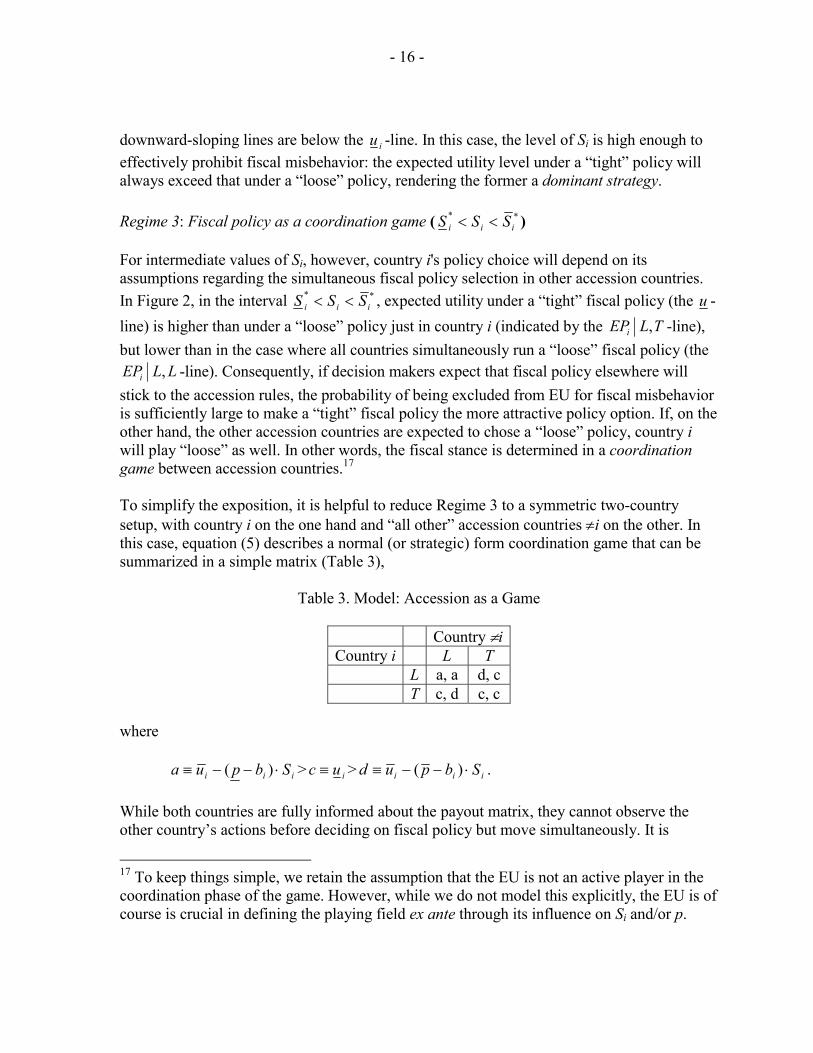
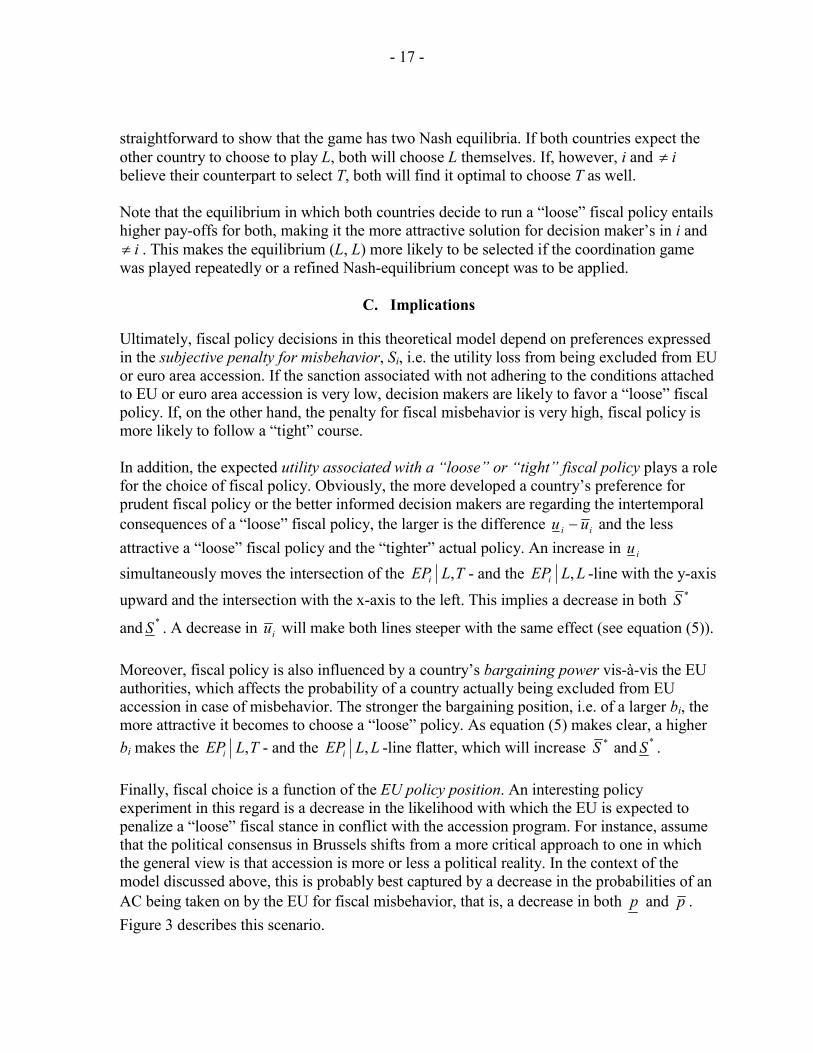
and *S . A decrease in iu will make both lines steeper with the same effect (see equation (5)). Moreover, fiscal policy is also influenced by a country’s bargaining power vis-à-vis the EU authorities, which affects the probability of a country actually being excluded from EU accession in case of misbehavior. The stronger the bargaining position, i.e. of a larger bi, the more attractive it becomes to choose a “loose” policy. As equation (5) makes clear, a higher bi makes the TLEPi , - and the LLEPi , -line flatter, which will increase *S and *S . Finally, fiscal choice is a function of the EU policy position. An interesting policy experiment in this regard is a decrease in the likelihood with which the EU is expected to penalize a “loose” fiscal stance in conflict with the accession program. For instance, assume that the political consensus in Brussels shifts from a more critical approach to one in which the general view is that accession is more or less a political reality. In the context of the model discussed above, this is probably best captured by a decrease in the probabilities of an AC being taken on by the EU for fiscal misbehavior, that is, a decrease in both p and p . Figure 3 describes this scenario.
- 18 -
Figure 3. Model: A Change in EU Accession Policy
For illustrative purposes, consider a country in the intermediate range (i.e., Regime 3). Before the EU policy change, decision makers in this country opted for a “loose” fiscal policy only after considering the actions of its fellow accession countries because its perceived losses form being left behind, (S1). With the EU policy change lowering the probability of being sanctioned for misbehavior, however, it will now be beneficial to select a “loose” fiscal stance irrespective of other countries’ choices. Similarly, when there is a relatively high fear of being left behind, S2 (Regime 2)—which before the EU policy change always preferred a “tight” fiscal stance—decision makers could now be tempted to select a “loose” fiscal stance if other accession countries did the same. In brief, intuitively, a higher tolerance for fiscal misbehavior is likely to lead to a looser fiscal stance in all but the most prudent and politically weaker ACs.
LFFEP iii == ≠
iu
TFLFEP iii =∧= ≠
iu
iS2S1S
- 19 -
VI. CONCLUSIONS Stylized facts for the period 1997–2002 reveal significant differences in the fiscal balances of the eight leading ACs. Whereas the fiscal stance in the Baltic countries had converged within the Maastricht deficit reference value, fiscal performance in the large Central European countries was on a path of divergence. In order to shed light on the future fiscal behavior of ACs in the process of euro adoption, the present paper attempts to explain the differences in past fiscal performance. Pooled annual cross-country regression estimates of various potential determinants of fiscal behavior suggest that the economic and electoral cycles had a statistically significant influence on the fiscal trends in these countries. The fiscal balance tended to deteriorate during recessions and elections. The effect of fiscal institutions was marginal at best. Centralized fiscal decision making and transparency seemed to be associated, though not significantly, with improved fiscal performance. Beyond these determinants, there is evidence that the improvement in the overall balance was significantly less than the saving from declining interest costs. After isolating the effect of the “usual suspects” on fiscal performance—namely, economic, electoral, and institutional determinants—we found that large Central European countries progressively relaxed their fiscal stance upon securing NATO membership in 1999. This statistically significant result can be interpreted as evidence of the role of political economy elements in the fiscal behavior of the ACs, including their perceived bargaining power in accession negotiations. Accordingly, a simple game-theoretic model is developed to capture the factors that might underlie observed differences in fiscal strategy in the ACs. The game-theoretic approach rests on a binary choice between a tight and a loose fiscal stance that depends on the expected utility from the selected deficit level and on the expected sanction—in terms of being excluded from the EU. Further, given the political economy of the accession process, a key element in the utility maximization in each AC is the probability of being excluded from the EU, expressed as a function of the country’s fiscal policy choice, its bargaining power, and the position of the EU regarding the imposition of sanctions. In this context, each AC chooses from among three policy regimes, depending on the value of the sanction for loose fiscal policy: a loose fiscal stance is dominant if the probability of sanction is low; a tight fiscal stance is dominant if the sanction is high; and for intermediate sanction values, the policy depends on the choices of other ACs—that is, it is determined in a coordination game. The approach is sufficiently flexible to accommodate shifts in fiscal policy—for example, in response to changes in the EU position. According to this model, the fiscal strategy of each AC, as reflected in its fiscal performance in recent years, can be a rational choice. In this framework, differences in fiscal stance between the Baltic countries and the large Central European NATO member countries would be ascribed to differences in their perceived bargaining strength. In addition, the progressive deterioration of fiscal performance in the Central European region would be consistent with an apparent relaxation of the requirement of fiscal discipline, up to the second Irish
- 20 -
referendum in October 2002 and the subsequent de facto admission of the ACs at the Copenhagen summit at the end of 2002. Arguably, the deterioration of the fiscal position in the large ACs can also be explained in terms of a coordinated game among these countries. With their EU membership secured, the critical issue at this stage is when and under what conditions the ACs will be eligible to join the euro area. As a corollary, it is of interest to analyze, at least theoretically, the determinants of fiscal behavior in the run-up to euro area participation from the standpoint of the model developed in this paper. According to the model, two factors will play critical role in this regard: the bargaining power of the ACs and the policy of the EU. The outcome will depend on the relative importance of these two factors. On the one hand, since the political clout of most of the ACs has been enhanced, there could be a more widespread tendency toward relaxation of the fiscal stance in the future. This trend may be further exacerbated by the budgetary implications of EU accession. Kopits and Székely (2004) estimate that unless ACs undertake major fiscal reforms, the direct budgetary effect of EU accession, on average, could widen the deficit by as much as 3 to 4¾ percent of GDP annually in the medium run. On the other hand, the EU may well harden its attitude toward ACs that fail to approach the deficit reference value—in the context of periodic convergence programs, subject to intensified monitoring—for purposes of joining the euro area, thereby offsetting in part the propensity to relax the fiscal stance. At the very least, the ACs will be subject to tougher transparency requirements, including full compliance with ESA 95 standards. Somewhat less ponderable is the possible demonstration effect on AC fiscal behavior of the enforcement of sanctions under the SGP with respect to large EU member countries.18 Laxity in this regard within the euro area could be interpreted by the ACs as tantamount to a dilution of sanctions—in terms of exclusion from the euro area—for failure to converge to the deficit reference value.
18 Serious concern about the adverse fallout on AC fiscal policies from exceeding the 3 percent of GDP reference value in major EU members has been voiced unanimously by the governors of central banks of the Czech Republic, Hungary, and Poland, during a recent visit to Frankfurt (Financial Times, August 29, 2003).
- 21 -
REFERENCES
Allan, William, and Taryn Parry, 2003, “Fiscal Transparency in EU Accession Countries:
Progress and Future Challenges,” IMF Working Paper 03/163 (Washington: International Monetary Fund).
Calvo, Guillermo, and Frederic Mishkin, 2003, “The Mirage of Exchange Rate Regimes for
Emerging Market Economies,” NBER Working Paper No. 9808 (Cambridge, Massachusetts: National Bureau of Edconomic Research).
Drazen, Allan and Paul R. Masson, 1994, “Credibility of Policies versus Credibility of
Policymakers,” Quarterly Journal of Economics, Vol. 109, pp. 735–54. European Commission, 2002, European Economy: Public Finances in EMU, No. 3 Gleich, Holger, and Jürgen von Hagen, 2003, “The Evolution of Budget Institutions:
Evidence from Central and Eastern European Countries,” ZEI, University of Bonn. Kopits, George, forthcoming, “Fiscal Policy and High Capital Mobility,” in G. Kopits (ed.)
Rules-Based Fiscal Policy in Emerging Markets: Background, Analysis and Prospects, London: Macmillan.
Kopits, George and István P. Székely, 2004, “Fiscal Policy Challenges of EU Accession for
the Baltics and Central Europe,” in G. Tumpel-Gugerell and P. Mooslechner (eds.), Structural Challenges for Europe, Cheltenham: Edward Elgar, pp. 277–97.
Krugman, Paul, 1979, “A Model of Balance-of-Payments Crises,” Journal of Money, Credit
and Banking, Vol. 11, pp. 311–25. Nordhaus, William, 1975, “Political Business Cycle,” Review of Economic Studies, Vol. 42,
pp. 169–89. Persson, Torsten, and Lars Svensson, 1989, “Why a Stubborn Conservative Would Run a
Deficit: Policy with Time-Inconsistent Preferences,” Quarterly Journal of Economics, Vol. 104, pp. 325–45.
Persson, Torsten, and Guido Tabellini, 2000, Political Economics: Explaining Economic
Policy, Cambridge, Mass.: MIT Press.
- 22 -
Sun, Yan, 2003, “Do Fixed Exchange Rates Induce More Fiscal Discipline?,” IMF Working Papers 03/78 (Washington: International Monetgary Fund).
Székely, István P., 2003, “Poland: Fiscal Policy, Fiscal Sustainability, and Fiscal Risk on the
Way to EU Accession,” Poland 2003 Article IV Report: Selected Issues, IMF, June Tornell, Aaron, and Andres Velasco, 1998, “Fiscal Discipline and the Choice of a Nominal
Anchor in Stabilization,” Journal of International Economics, Vol. 46, pp. 1–30.