Embed Size (px)
Citation preview
Confidential Financing Memorandum Sacramento, California
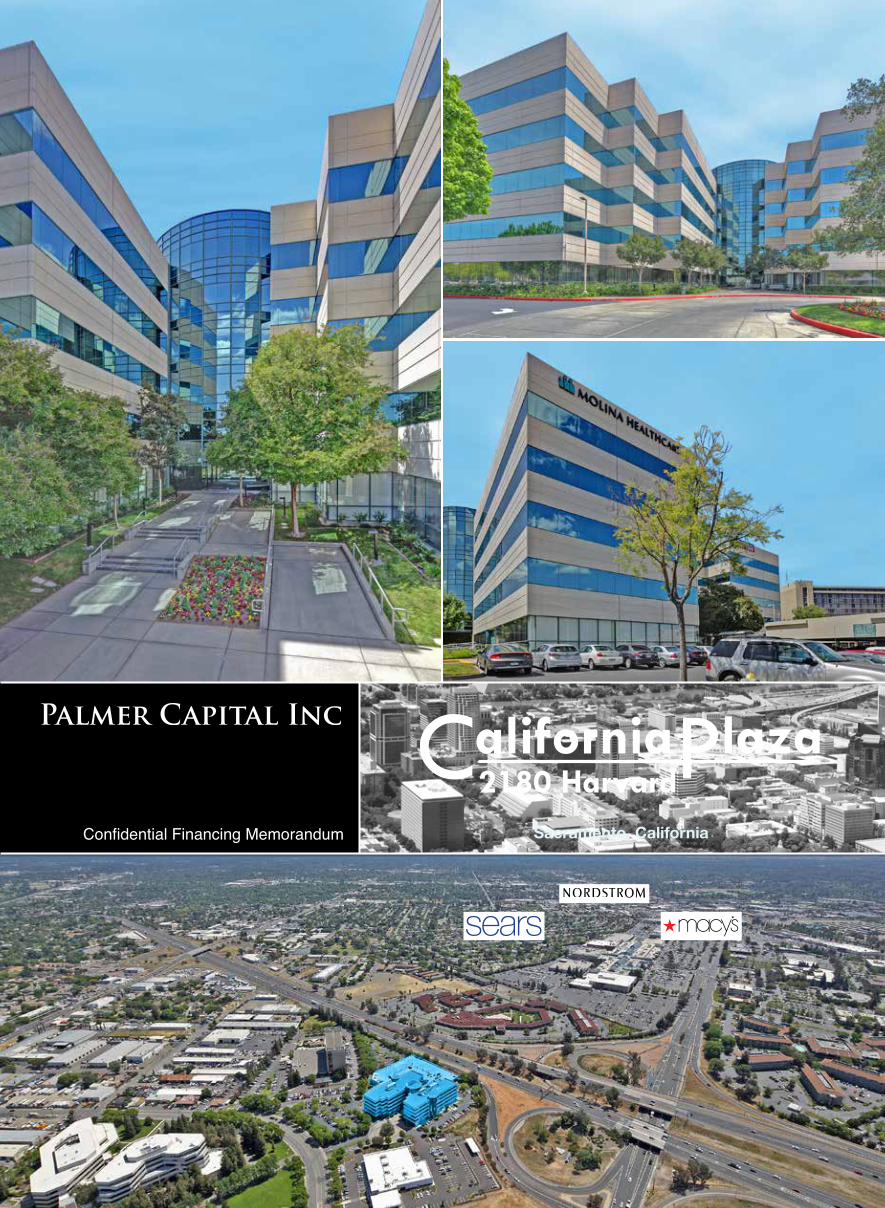
(916) 462-6300 • www.palmercapital.com
Palmer Capital, Inc. (“Palmer Capital”) and the buyer (“Buyer”) of the property referenced herein (“Property”) present this Confidential Financing Memorandum (“Memorandum”) to assist the recipient(s) (“You” or “Your”) in evaluating the Property and it is intended for Your use only. This Memorandum contains brief, selected information pertaining to the Property and should not be considered all-inclusive or permanent. The information in this Memorandum has been obtained from sources believed to be reliable, but has not been verified and is not guaranteed. You should independently verify each item of information and have the same reviewed by Your tax advisor and/or legal counsel. Assumptions, projections, estimates and/or opinions are provided as examples only and all information is subject to change, error, omissions and/or withdrawal without notice. Palmer Capital and Buyer assume no responsibility for and make no warranty as to the accuracy or completeness of any information in this Memorandum. Palmer Capital and Buyer expressly disclaim any implied or expressed warranties of merchantability, fitness for a particular purpose or non-infringement of intellectual property relating to this Memorandum. In no event shall Palmer Capital or Buyer be liable for any damages resulting from the reliance on or use of any information in this Memorandum, including but not limited to direct, special, indirect, consequential or incidental damages. By accepting receipt of this Memorandum, You agree to the following: (a) This Memorandum is of a highly confidential nature, will be held in the strictest confidence and shall be returned to Palmer Capital upon request; (b) You shall not contact any property manager, employee or tenant of the Property regarding the Property or this Memorandum, without prior approval of Palmer Capital or Buyer; and (c) You understand and agree that Palmer Capital represents Buyer and not You. Neither Palmer Capital nor Buyer shall have any obligation to pay any commission, finder’s fee, or any other compensation to any broker or other person. You may provide information to persons retained to evaluate the Property only after first obtaining a signed confidentiality agreement from such persons and providing a copy of such agreement to Palmer Capital. By accepting receipt of this Memorandum, you agree to defend, indemnify and hold harmless Palmer Capital and Buyer (including all of their agents, employees, subsidiaries, affiliated entities, successors and assigns) from and against any and all claims, disputes, litigation, demands, damages, liabilities, losses, judgments, expenses, fines, contributions, charges, injuries and/or costs and expenses, including reasonable attorneys’ fees, arising or resulting from acts by You. The Buyer expressly reserves the right, at its sole discretion, to reject any or all expressions of interest or offers to finance the Property, and/or to terminate discussions with any entity at any time with or without notice which may arise as a result of review of this Memorandum. The Buyer shall have no legal commitment or obligation to any entity reviewing this Memorandum or making an offer to lend on the Property unless and until written agreement(s) for the finance of the Property have been fully executed, delivered and approved by the Buyer and any conditions to the Buyer's obligations therein have been satisfied or waived.
Copyright © 2015 Palmer Capital, Inc.All use, disclosure and/or reproduction not specifically authorized is prohibited. All rights reserved. 00963368
INTRODUCTION
PROPERTY SPECIFICS
FINANCIAL ANALYSIS
TENANT/LEASE INFORMATION
MARKET INFORMATION
4 ExecutiveSummary
6 CreditHighlights
14 AdjacentOwners
18 ParcelMap
20 FloorPlans
22 PropertyDescription
24 CashFlowAnalysis
26 TenantSummary
36 LeaseRollover
40 Assumptions
41 ReplacementCost
42 HistoricalSummary
43 HistoricalSummary–Detail
44 TenantProfiles
48 MarketExecutiveSummary
50 MarketAnalysis
66 Comparables
TABLE OF CONTENTS | 3
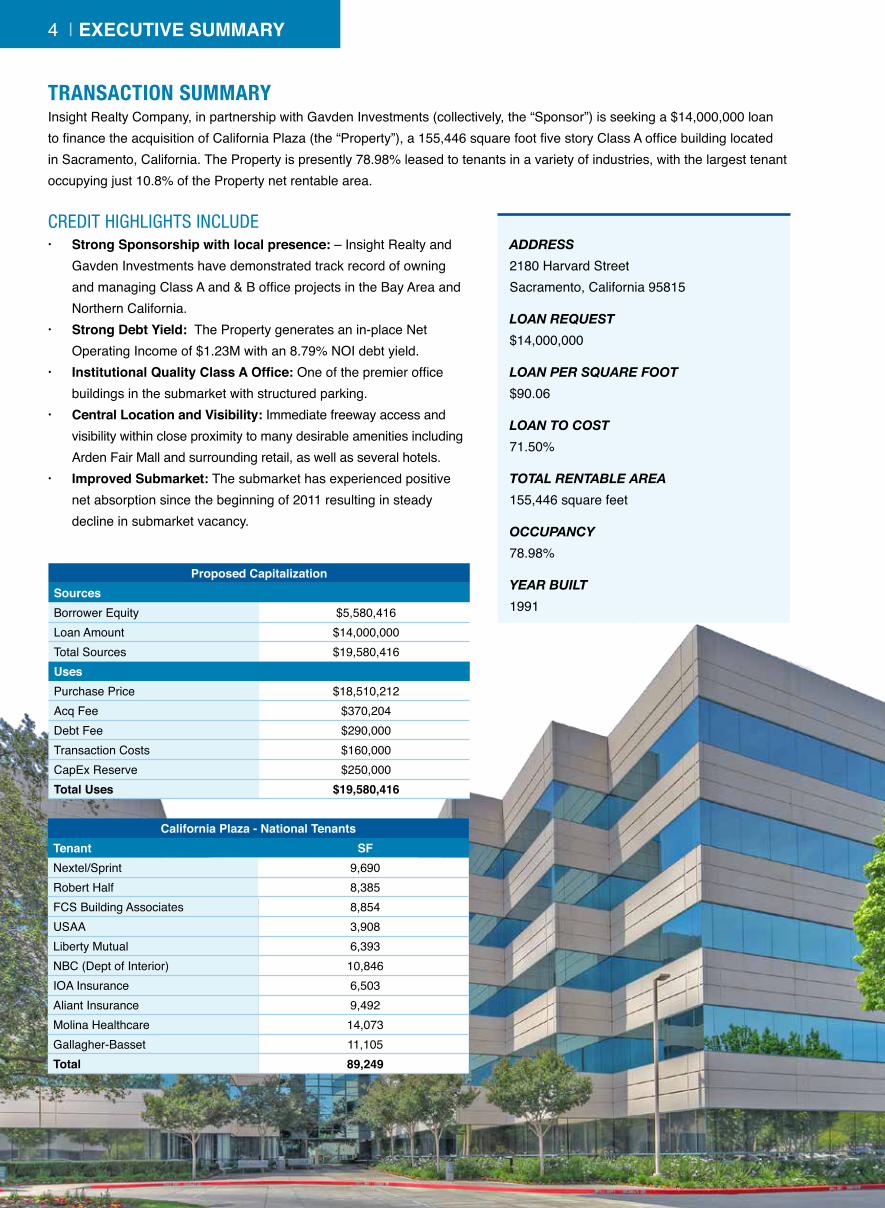
TRANSACTION SUMMARYInsight Realty Company, in partnership with Gavden Investments (collectively, the “Sponsor”) is seeking a $14,000,000 loan to finance the acquisition of California Plaza (the “Property”), a 155,446 square foot five story Class A office building located in Sacramento, California. The Property is presently 78.98% leased to tenants in a variety of industries, with the largest tenant occupying just 10.8% of the Property net rentable area.
CREDIT HIGHLIGHTS INCLUDE· Strong Sponsorship with local presence: – Insight Realty and
Gavden Investments have demonstrated track record of owning and managing Class A and & B office projects in the Bay Area and Northern California.
· Strong Debt Yield: The Property generates an in-place Net Operating Income of $1.23M with an 8.79% NOI debt yield.
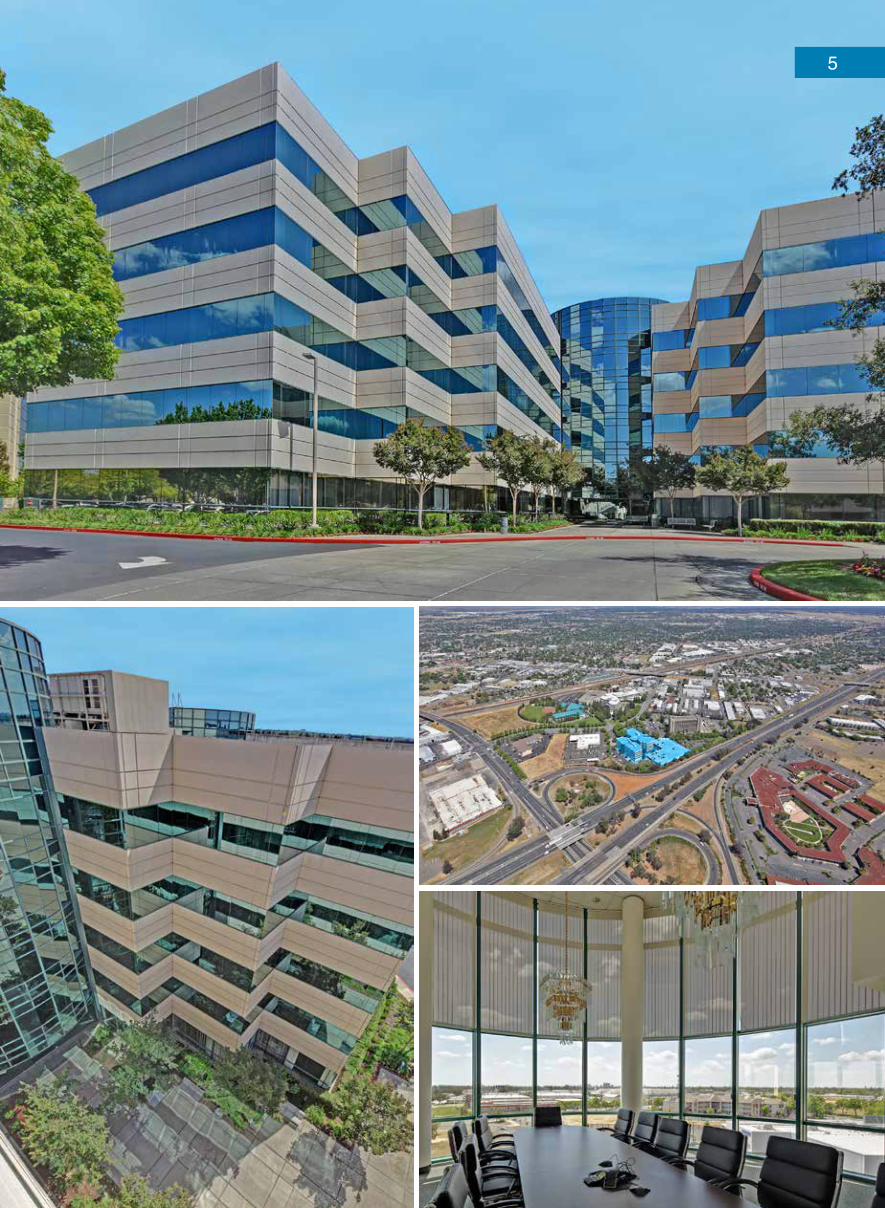
· Institutional Quality Class A Office: One of the premier office buildings in the submarket with structured parking.
· Central Location and Visibility: Immediate freeway access and visibility within close proximity to many desirable amenities including Arden Fair Mall and surrounding retail, as well as several hotels.
· Improved Submarket: The submarket has experienced positive net absorption since the beginning of 2011 resulting in steady decline in submarket vacancy.
4 | EXECUTIVE SUMMARY
ADDRESS2180 Harvard Street Sacramento, California 95815
LOAN REQUEST$14,000,000
LOAN PER SQUARE FOOT$90.06
LOAN TO COST71.50%
TOTAL RENTABLE AREA155,446 square feet
OCCUPANCY78.98%
YEAR BUILT1991
Proposed CapitalizationSourcesBorrower Equity $5,580,416 Loan Amount $14,000,000 Total Sources $19,580,416 UsesPurchase Price $18,510,212 Acq Fee $370,204 Debt Fee $290,000 Transaction Costs $160,000 CapEx Reserve $250,000 Total Uses $19,580,416
California Plaza - National TenantsTenant SF Nextel/Sprint 9,690 Robert Half 8,385 FCS Building Associates 8,854 USAA 3,908 Liberty Mutual 6,393 NBC (Dept of Interior) 10,846 IOA Insurance 6,503 Aliant Insurance 9,492 Molina Healthcare 14,073 Gallagher-Basset 11,105 Total 89,249
5
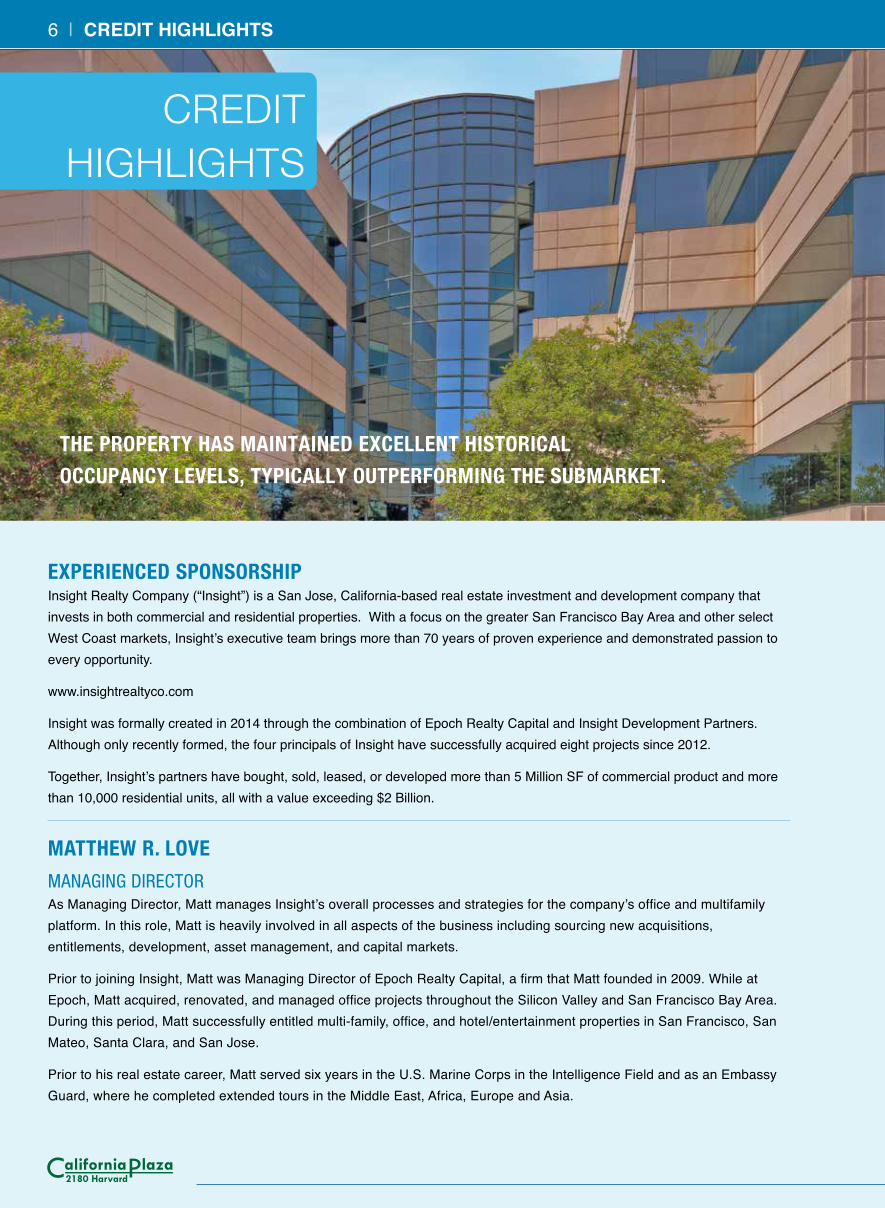
THE PROPERTY HAS MAINTAINED EXCELLENT HISTORICAL
OCCUPANCY LEVELS, TYPICALLY OUTPERFORMING THE SUBMARKET.
CREDITHIGHLIGHTS
EXPERIENCED SPONSORSHIPInsight Realty Company (“Insight”) is a San Jose, California-based real estate investment and development company that invests in both commercial and residential properties. With a focus on the greater San Francisco Bay Area and other select West Coast markets, Insight’s executive team brings more than 70 years of proven experience and demonstrated passion to every opportunity.
www.insightrealtyco.com
Insight was formally created in 2014 through the combination of Epoch Realty Capital and Insight Development Partners. Although only recently formed, the four principals of Insight have successfully acquired eight projects since 2012.
Together, Insight’s partners have bought, sold, leased, or developed more than 5 Million SF of commercial product and more than 10,000 residential units, all with a value exceeding $2 Billion.
MATTHEW R. LOVE
MANAGING DIRECTORAs Managing Director, Matt manages Insight’s overall processes and strategies for the company’s office and multifamily platform. In this role, Matt is heavily involved in all aspects of the business including sourcing new acquisitions, entitlements, development, asset management, and capital markets.
Prior to joining Insight, Matt was Managing Director of Epoch Realty Capital, a firm that Matt founded in 2009. While at Epoch, Matt acquired, renovated, and managed office projects throughout the Silicon Valley and San Francisco Bay Area. During this period, Matt successfully entitled multi-family, office, and hotel/entertainment properties in San Francisco, San Mateo, Santa Clara, and San Jose.
Prior to his real estate career, Matt served six years in the U.S. Marine Corps in the Intelligence Field and as an Embassy Guard, where he completed extended tours in the Middle East, Africa, Europe and Asia.
6 | CREDIT HIGHLIGHTS
CREDIT HIGHLIGHTS | 7
JOHN H. PRINGLE
MANAGING DIRECTORAs Managing Director, John is responsible for sourcing, underwriting and executing Insight’s multi-family investment, renovation and ground-up developments as well as asset management operations.
Prior to joining Insight, John was President of Los Angeles-based E&S Ring for more than a decade. During his tenure John was responsible for directing all company operations for this $2 Billion privately held firm, which operated a portfolio in California, Washington, Oregon and Nevada. John also directed the acquisition of over $400 Million in multifamily properties for the company. In addition to his investment and corporate duties, he headed the management operations for 10,000 multifamily units, including 2,500 apartments for a private investment company based in San Mateo, CA.
DENNIS L. RANDALL, JR.
MANAGING DIRECTORAs Managing Director, Dennis is responsible for sourcing, underwriting and executing Insight’s office/R&D platform consisting of investment, renovation and ground-up developments as well as asset management operations.
Insight’s predecessor entity, Insight Development Partners, was founded by Dennis in June of 2004 to take advantage of real estate opportunities in the Bay Area and Silicon Valley. Since founding Insight, Dennis has partnered with other firms to acquire or develop over one million square feet of office and R&D space in northern and southern California.
Prior to founding Insight Development Partners, Dennis was Senior Director of Real Estate Development overseeing the Silicon Valley Region for Opus Group, one of the largest development firms in the United States. During his tenure with Opus he developed one million square feet of “Class A” office, R&D and industrial properties and was awarded Employee of the Year in 2001.
VINCENT WOO
MANAGING DIRECTORAs Managing Director, Vincent has responsibility for investor relations and sourcing capital for Insight’s residential and commercial projects. Vincent is a technology entrepreneur and founded several successful companies over the past 15 years including a real estate-based asset and capital management firm that has overseen more than $100 Million of real estate investment in San Jose and the greater Silicon Valley.
PATRICK J. MOLLOY
PRESIDENT, GAVDEN INVESTMENTSPatrick has over 15 years of real estate investment, development, asset management, and project management experience with a focus in the Sacramento market. His experience covers multiple property types including commercial office, multifamily, mixed use, urban redevelopment, and adaptive reuse. Prior to founding Gavden Investments, Patrick was the Chief Operating Officer and Director of Acquisition & Development for Heller Pacific, a Sacramento based commercial real estate investment and development firm. In this role, Patrick was responsible for all acquisition, disposition, financing, entitlement, development, construction, leasing, and asset management activities for the firm.
STRONG CASH FLOW The Property will generate net operating income at closing that will provide ample cash flow to support the loan with a 8.79% debt yield on the total loan amount. The debt yield is projected to increase to 13.17% in year three once the Property is stabilized at 92.5% occupancy.
Strong Debt YieldIn Place Year Three
Occupancy 78.98% 92.50%Underwritten NOI $1,230,162 $1,844,007 Loan Amount $15,000,000 $15,000,000 DY - Loan Amount 8.79% 13.17%
INSTITUTIONAL QUALITY ASSETCalifornia Plaza is a 5-story Class “A” office building located in Sacramento, California. The 155,548 square foot multi-tenant building is currently 79.98% leased. The asset was developed by Watt Investment Properties in the early 1990’s and has been institutionally owned and managed since. California Plaza has many leasing advantages, including:
• Excellent visibility and access – positioned immediately off the Capital City Freeway (Business 80)• Steel frame construction – attractive architecture• Structured parking and surface lot• Close-In central location
TENANT COMMITMENTSix tenants currently occupying California Plaza have been in the building for more than five years. These tenants occupy 53% of the building and account for 67% of the rental income. Three of the building’s largest tenants, Gallagher-Basset, Robert Half, and Nextel, have been in the building for over 15 years.
8 | CREDIT HIGHLIGHTS
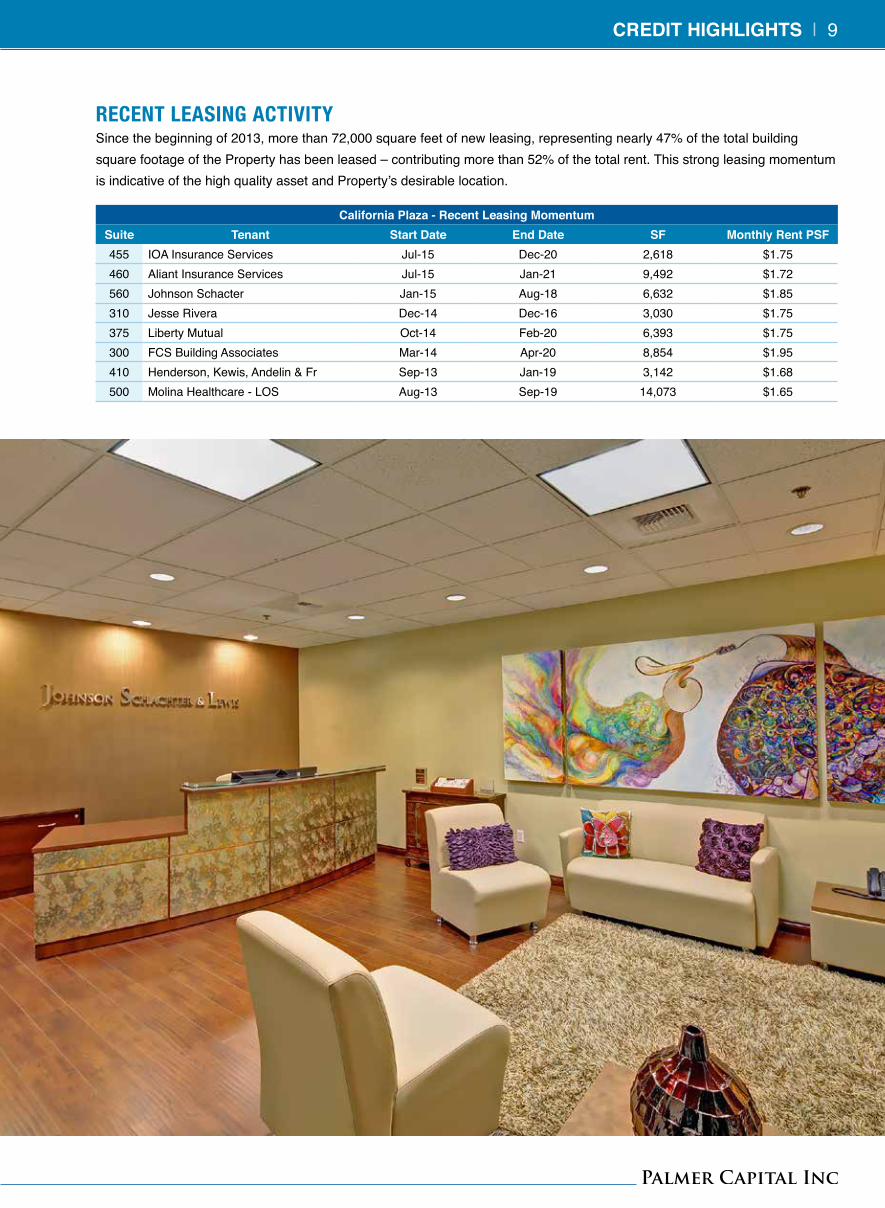
RECENT LEASING ACTIVITYSince the beginning of 2013, more than 72,000 square feet of new leasing, representing nearly 47% of the total building square footage of the Property has been leased – contributing more than 52% of the total rent. This strong leasing momentum is indicative of the high quality asset and Property’s desirable location.
California Plaza - Recent Leasing MomentumSuite Tenant Start Date End Date SF Monthly Rent PSF455 IOA Insurance Services Jul-15 Dec-20 2,618 $1.75460 Aliant Insurance Services Jul-15 Jan-21 9,492 $1.72560 Johnson Schacter Jan-15 Aug-18 6,632 $1.85310 Jesse Rivera Dec-14 Dec-16 3,030 $1.75375 Liberty Mutual Oct-14 Feb-20 6,393 $1.75300 FCS Building Associates Mar-14 Apr-20 8,854 $1.95410 Henderson, Kewis, Andelin & Fr Sep-13 Jan-19 3,142 $1.68500 Molina Healthcare - LOS Aug-13 Sep-19 14,073 $1.65
CREDIT HIGHLIGHTS | 9
VALUE-ADD LEASING PLAN
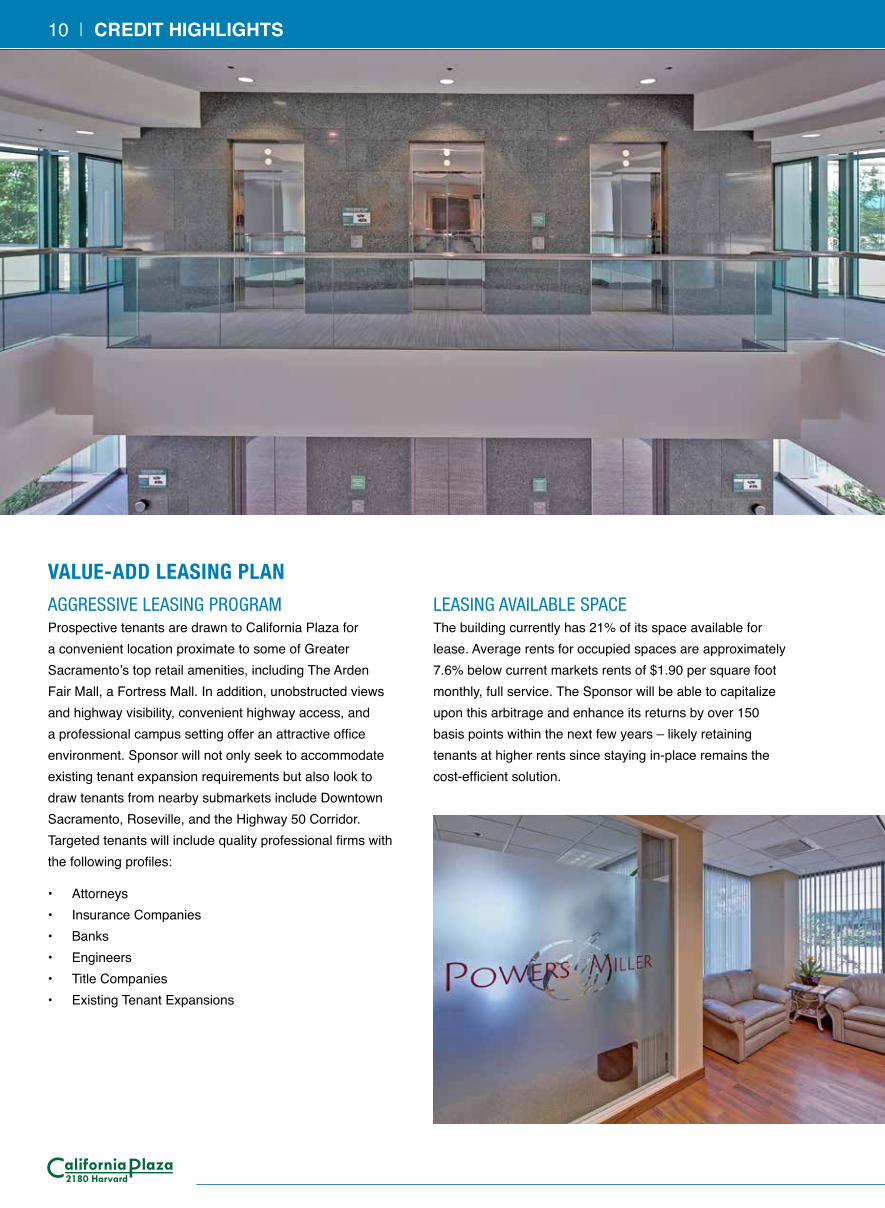
AGGRESSIVE LEASING PROGRAMProspective tenants are drawn to California Plaza for a convenient location proximate to some of Greater Sacramento’s top retail amenities, including The Arden Fair Mall, a Fortress Mall. In addition, unobstructed views and highway visibility, convenient highway access, and a professional campus setting offer an attractive office environment. Sponsor will not only seek to accommodate existing tenant expansion requirements but also look to draw tenants from nearby submarkets include Downtown Sacramento, Roseville, and the Highway 50 Corridor. Targeted tenants will include quality professional firms with the following profiles:
• Attorneys• Insurance Companies• Banks• Engineers• Title Companies• Existing Tenant Expansions
LEASING AVAILABLE SPACEThe building currently has 21% of its space available for lease. Average rents for occupied spaces are approximately 7.6% below current markets rents of $1.90 per square foot monthly, full service. The Sponsor will be able to capitalize upon this arbitrage and enhance its returns by over 150 basis points within the next few years – likely retaining tenants at higher rents since staying in-place remains the cost-efficient solution.
10 | CREDIT HIGHLIGHTS
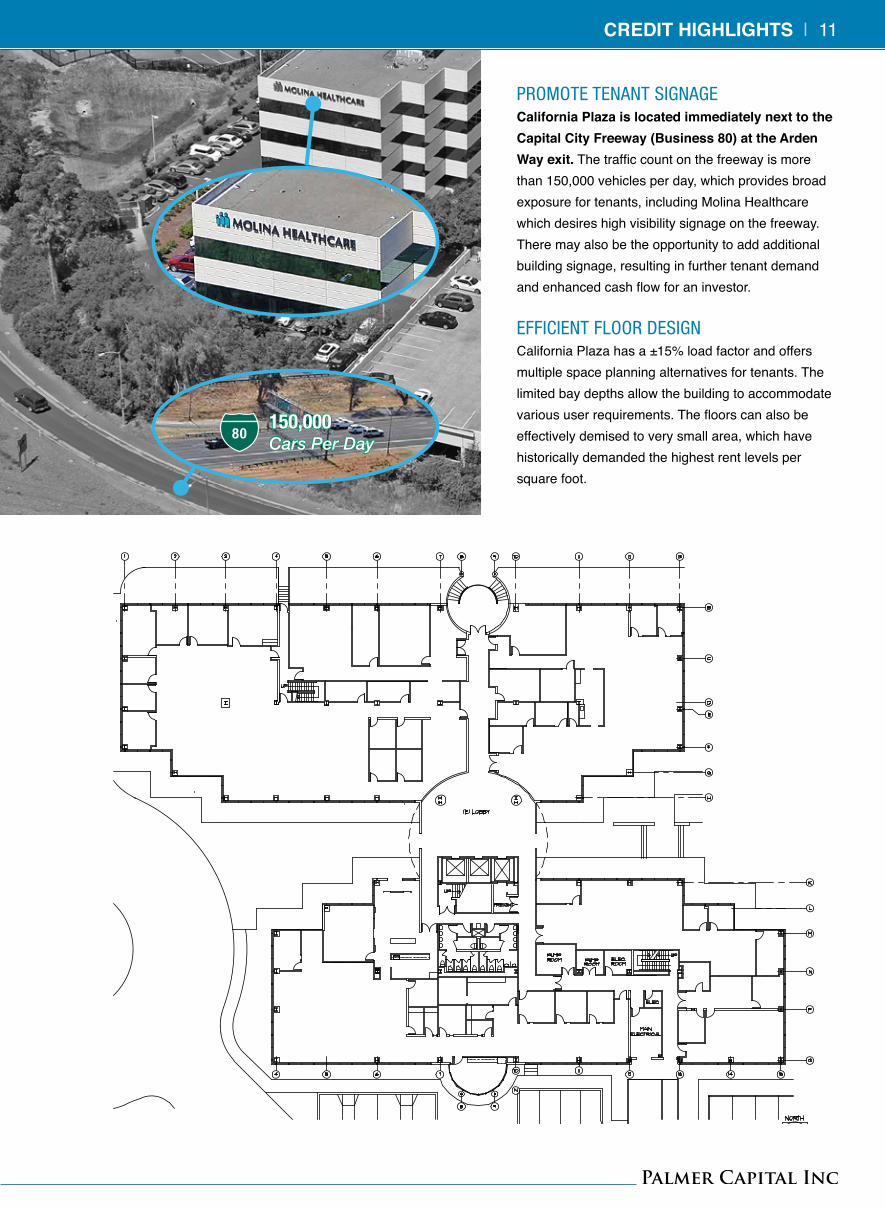
PROMOTE TENANT SIGNAGECalifornia Plaza is located immediately next to the Capital City Freeway (Business 80) at the Arden Way exit. The traffic count on the freeway is more than 150,000 vehicles per day, which provides broad exposure for tenants, including Molina Healthcare which desires high visibility signage on the freeway. There may also be the opportunity to add additional building signage, resulting in further tenant demand and enhanced cash flow for an investor.
EFFICIENT FLOOR DESIGNCalifornia Plaza has a ±15% load factor and offers multiple space planning alternatives for tenants. The limited bay depths allow the building to accommodate various user requirements. The floors can also be effectively demised to very small area, which have historically demanded the highest rent levels per square foot.
80150,000 Cars Per Day
CREDIT HIGHLIGHTS | 11
arden fair
80
ARDE
N W
AY
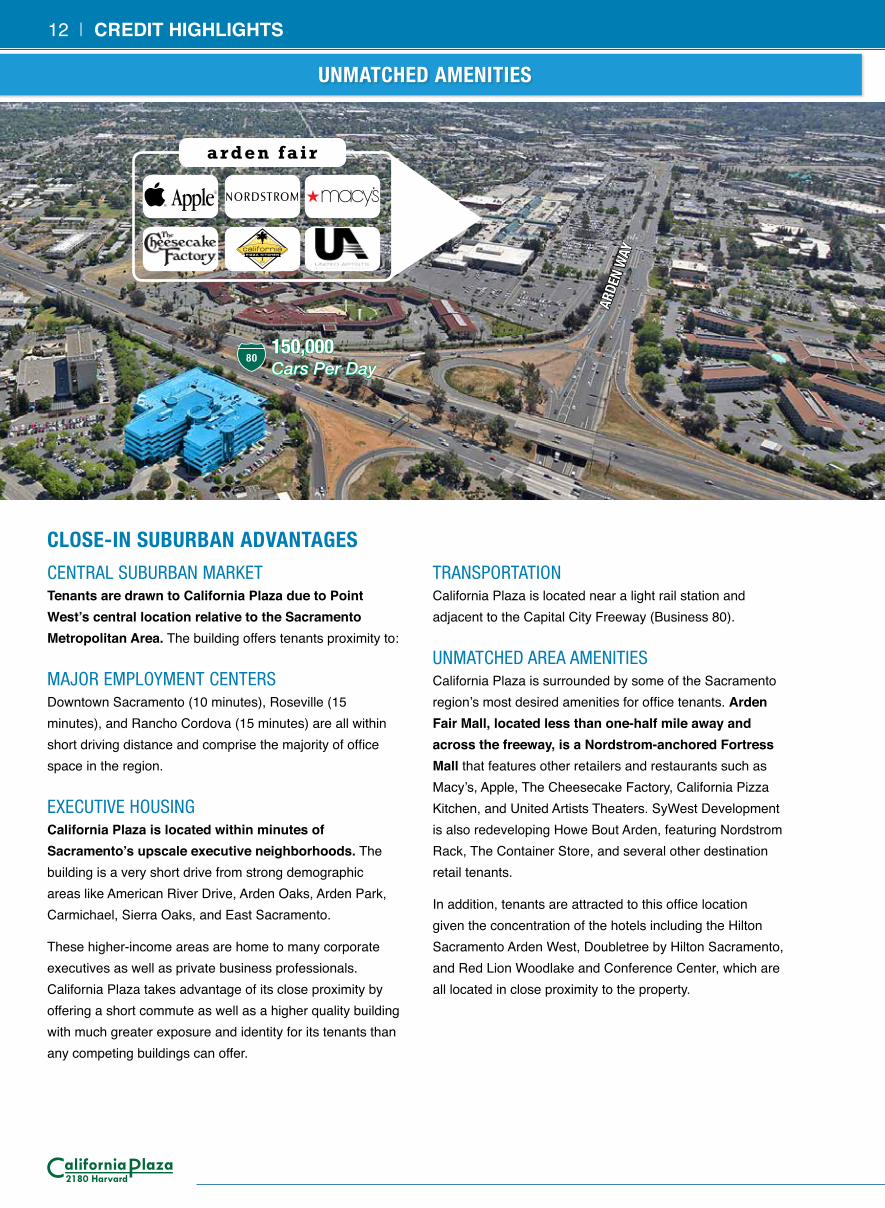
CLOSE-IN SUBURBAN ADVANTAGES
CENTRAL SUBURBAN MARKETTenants are drawn to California Plaza due to Point West’s central location relative to the Sacramento Metropolitan Area. The building offers tenants proximity to:
MAJOR EMPLOYMENT CENTERSDowntown Sacramento (10 minutes), Roseville (15 minutes), and Rancho Cordova (15 minutes) are all within short driving distance and comprise the majority of office space in the region.
EXECUTIVE HOUSINGCalifornia Plaza is located within minutes of Sacramento’s upscale executive neighborhoods. The building is a very short drive from strong demographic areas like American River Drive, Arden Oaks, Arden Park, Carmichael, Sierra Oaks, and East Sacramento.
These higher-income areas are home to many corporate executives as well as private business professionals. California Plaza takes advantage of its close proximity by offering a short commute as well as a higher quality building with much greater exposure and identity for its tenants than any competing buildings can offer.
TRANSPORTATIONCalifornia Plaza is located near a light rail station and adjacent to the Capital City Freeway (Business 80).
UNMATCHED AREA AMENITIESCalifornia Plaza is surrounded by some of the Sacramento region’s most desired amenities for office tenants. Arden Fair Mall, located less than one-half mile away and across the freeway, is a Nordstrom-anchored Fortress Mall that features other retailers and restaurants such as Macy’s, Apple, The Cheesecake Factory, California Pizza Kitchen, and United Artists Theaters. SyWest Development is also redeveloping Howe Bout Arden, featuring Nordstrom Rack, The Container Store, and several other destination retail tenants.
In addition, tenants are attracted to this office location given the concentration of the hotels including the Hilton Sacramento Arden West, Doubletree by Hilton Sacramento, and Red Lion Woodlake and Conference Center, which are all located in close proximity to the property.
150,000 Cars Per Day
12 | CREDIT HIGHLIGHTS
UNMATCHED AMENITIES
80
DOWNTOWN SACRAMENTO(5 Miles)
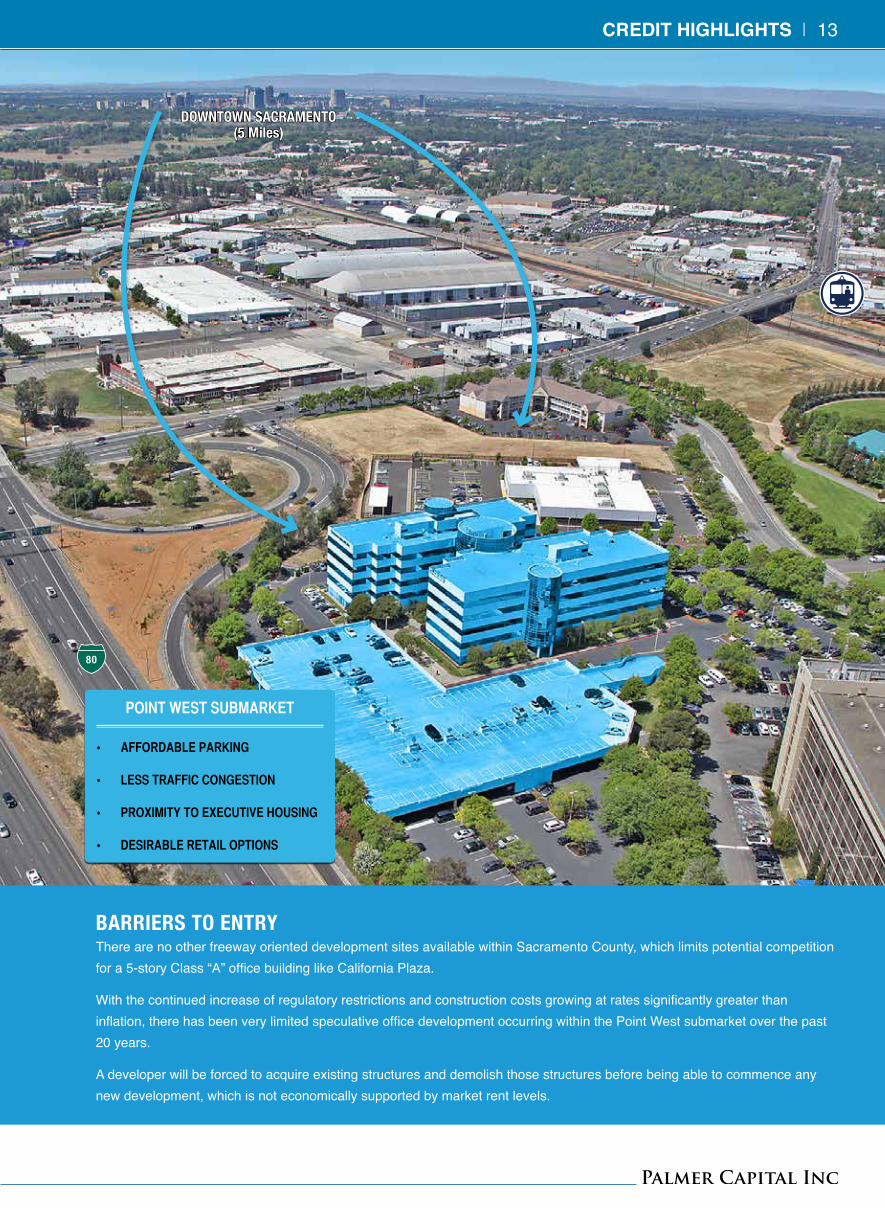
BARRIERS TO ENTRYThere are no other freeway oriented development sites available within Sacramento County, which limits potential competition for a 5-story Class “A” office building like California Plaza.
With the continued increase of regulatory restrictions and construction costs growing at rates significantly greater than inflation, there has been very limited speculative office development occurring within the Point West submarket over the past 20 years.
A developer will be forced to acquire existing structures and demolish those structures before being able to commence any new development, which is not economically supported by market rent levels.
CREDIT HIGHLIGHTS | 13
POINTWESTSUBMARKET
• AFFORDABLEPARKING
• LESSTRAFFICCONGESTION
• PROXIMITYTOEXECUTIVEHOUSING
• DESIRABLERETAILOPTIONS
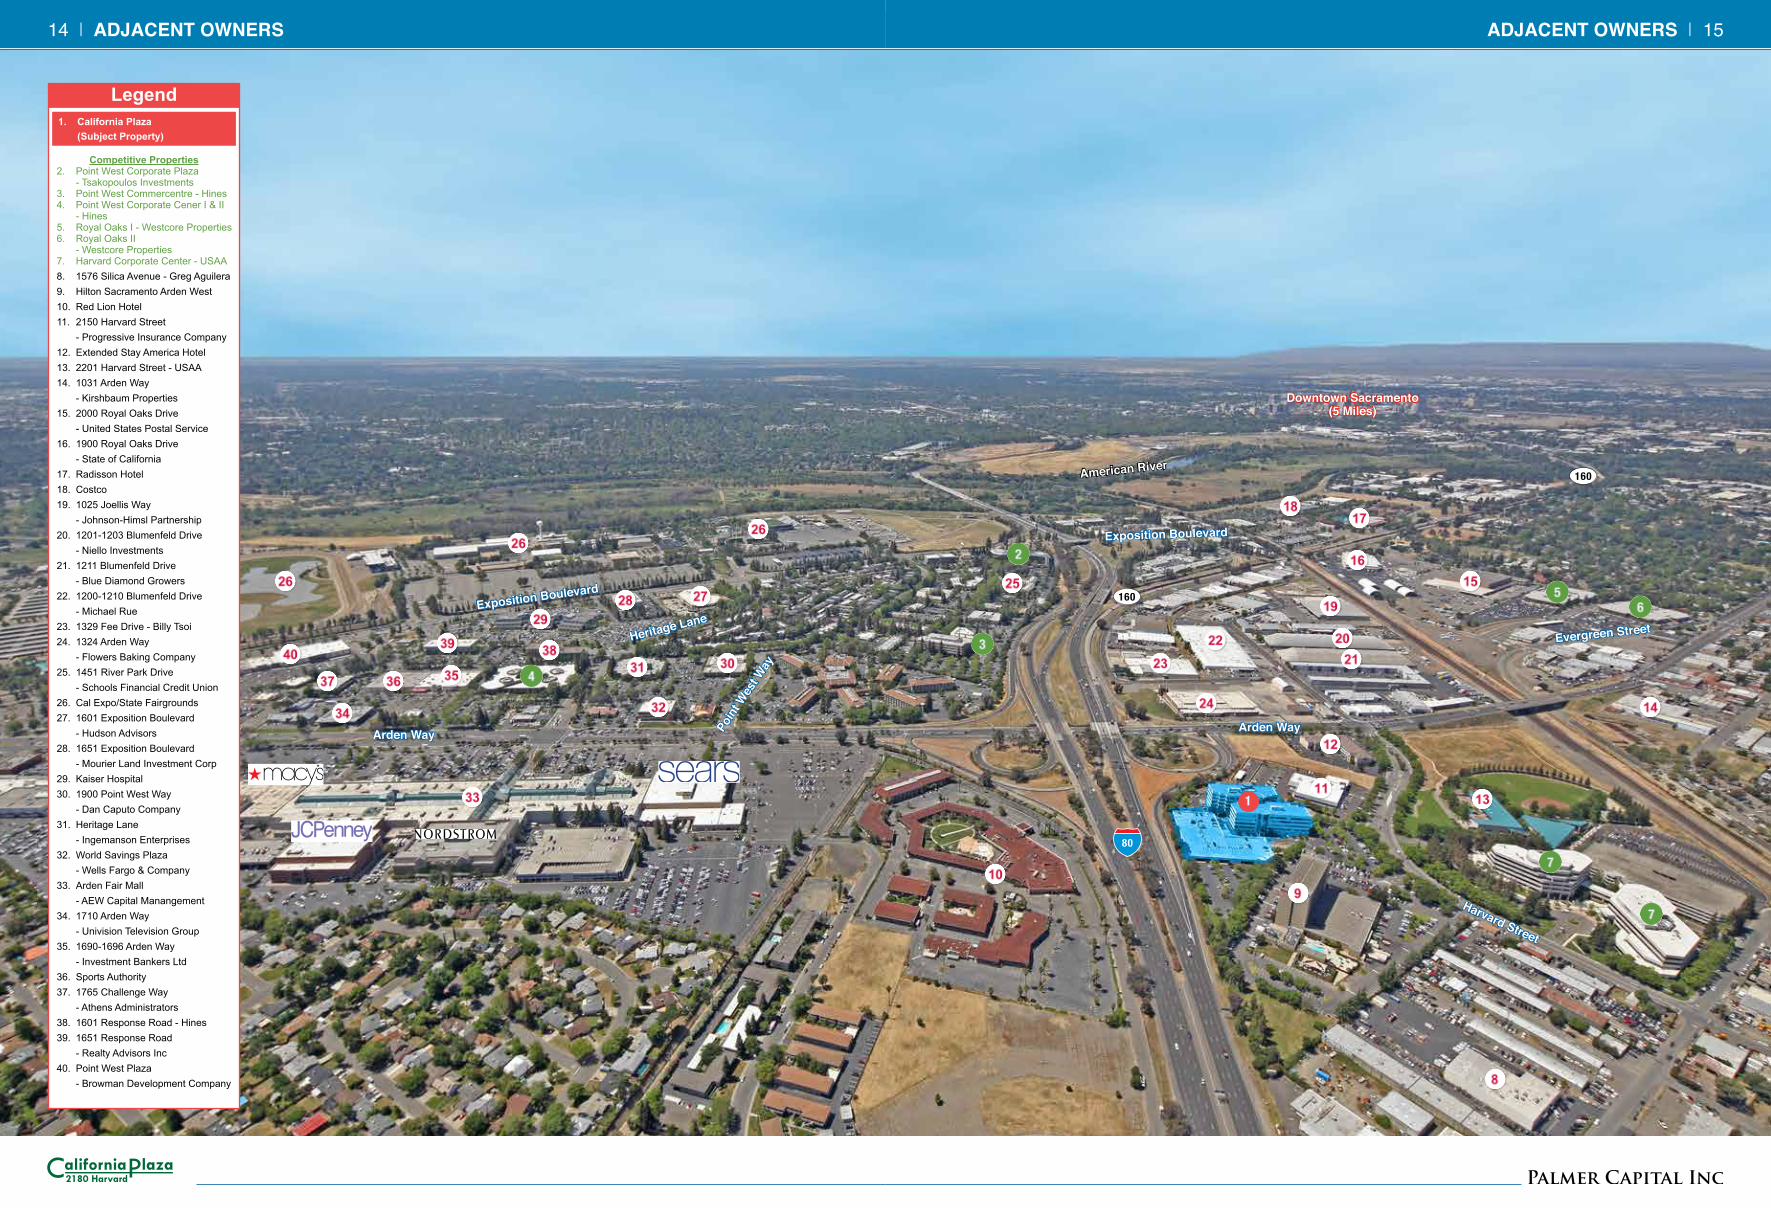
ADJACENT OWNERS | 1514 | ADJACENT OWNERS
Competitive Properties2. Point West Corporate Plaza
- Tsakopoulos Investments3. Point West Commercentre - Hines4. Point West Corporate Cener I & II
- Hines5. Royal Oaks I - Westcore Properties6. Royal Oaks II
- Westcore Properties7. Harvard Corporate Center - USAA8. 1576 Silica Avenue - Greg Aguilera9. Hilton Sacramento Arden West10. Red Lion Hotel11. 2150 Harvard Street
- Progressive Insurance Company12. Extended Stay America Hotel13. 2201 Harvard Street - USAA14. 1031 Arden Way
- Kirshbaum Properties15. 2000 Royal Oaks Drive
- United States Postal Service16. 1900 Royal Oaks Drive
- State of California17. Radisson Hotel18. Costco19. 1025 Joellis Way
- Johnson-Himsl Partnership20. 1201-1203 Blumenfeld Drive
- Niello Investments21. 1211 Blumenfeld Drive
- Blue Diamond Growers22. 1200-1210 Blumenfeld Drive
- Michael Rue23. 1329 Fee Drive - Billy Tsoi24. 1324 Arden Way
- Flowers Baking Company25. 1451 River Park Drive
- Schools Financial Credit Union26. Cal Expo/State Fairgrounds27. 1601 Exposition Boulevard
- Hudson Advisors28. 1651 Exposition Boulevard
- Mourier Land Investment Corp29. Kaiser Hospital30. 1900 Point West Way
- Dan Caputo Company31. Heritage Lane
- Ingemanson Enterprises32. World Savings Plaza
- Wells Fargo & Company33. Arden Fair Mall
- AEW Capital Manangement34. 1710 Arden Way
- Univision Television Group35. 1690-1696 Arden Way
- Investment Bankers Ltd36. Sports Authority37. 1765 Challenge Way
- Athens Administrators38. 1601 Response Road - Hines39. 1651 Response Road
- Realty Advisors Inc40. Point West Plaza
- Browman Development Company
Legend1. California Plaza
(Subject Property)
Arden Way
Exposition Boulevard
Heritage Lane
Poin
t Wes
t Way
Exposition Boulevard
Arden Way
Evergreen Street
Harvard Street
American River
Downtown Sacramento(5 Miles)
1
80
160
160
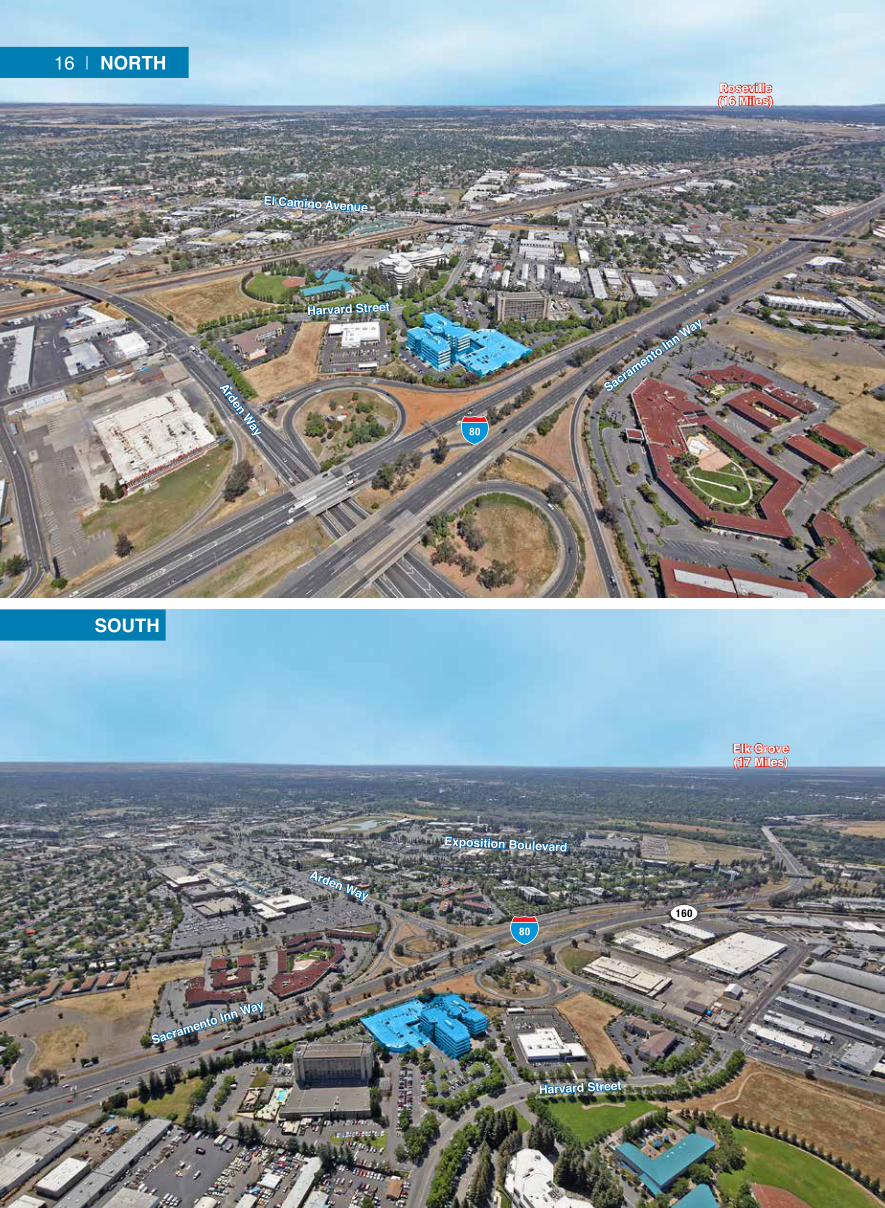
16 | NORTH
SOUTH
El Camino Avenue
Roseville(16 Miles)
80
80
Arden Way
Arden Way
Harvard Street
Harvard Street
Sacramento Inn Way
Sacramento Inn Way
Exposition Boulevard
160
Elk Grove(17 Miles)
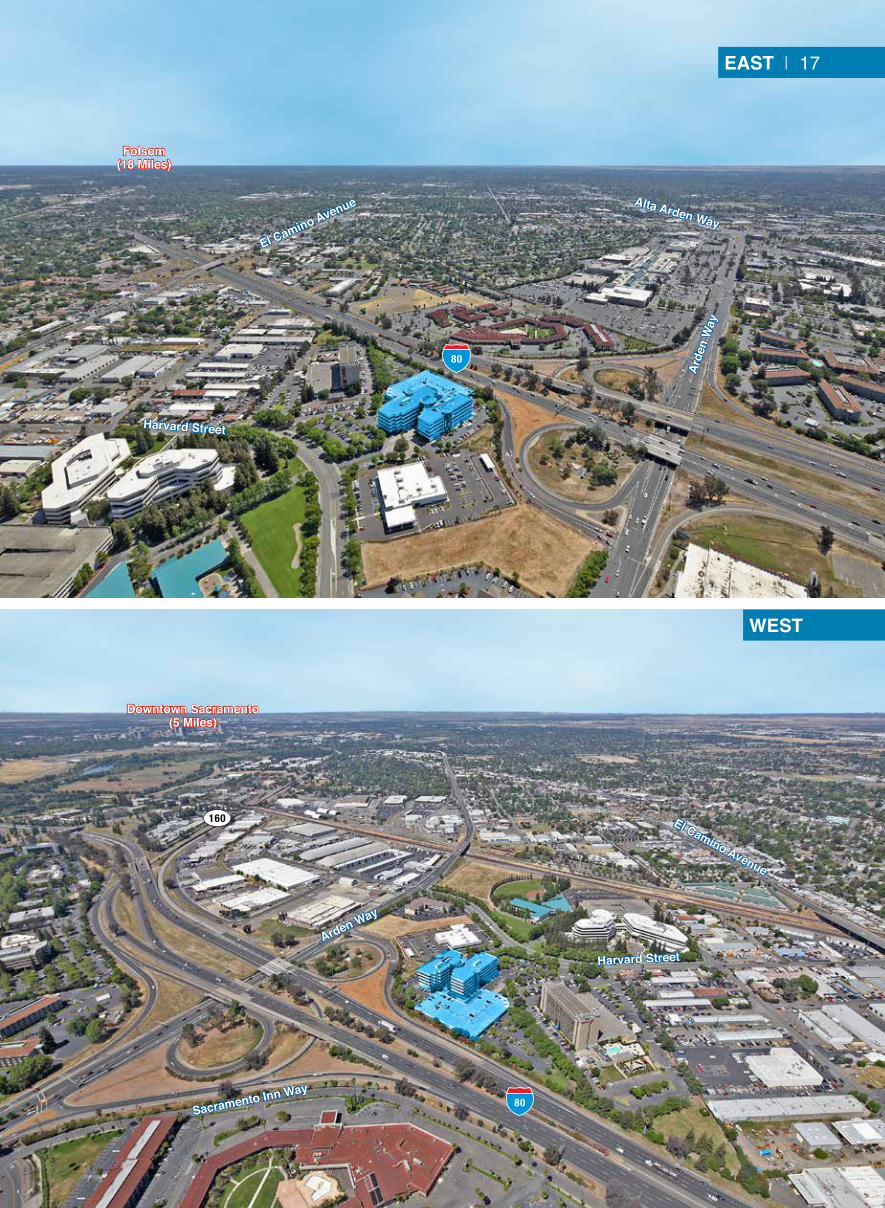
EAST | 17
WEST
El Camino Avenue
80
Arde
n W
ay
Harvard Street
Alta Arden Way
Folsom(18 Miles)
El Camino Avenue
80
Arden Way
Sacramento Inn Way
Harvard Street
160
Downtown Sacramento(5 Miles)
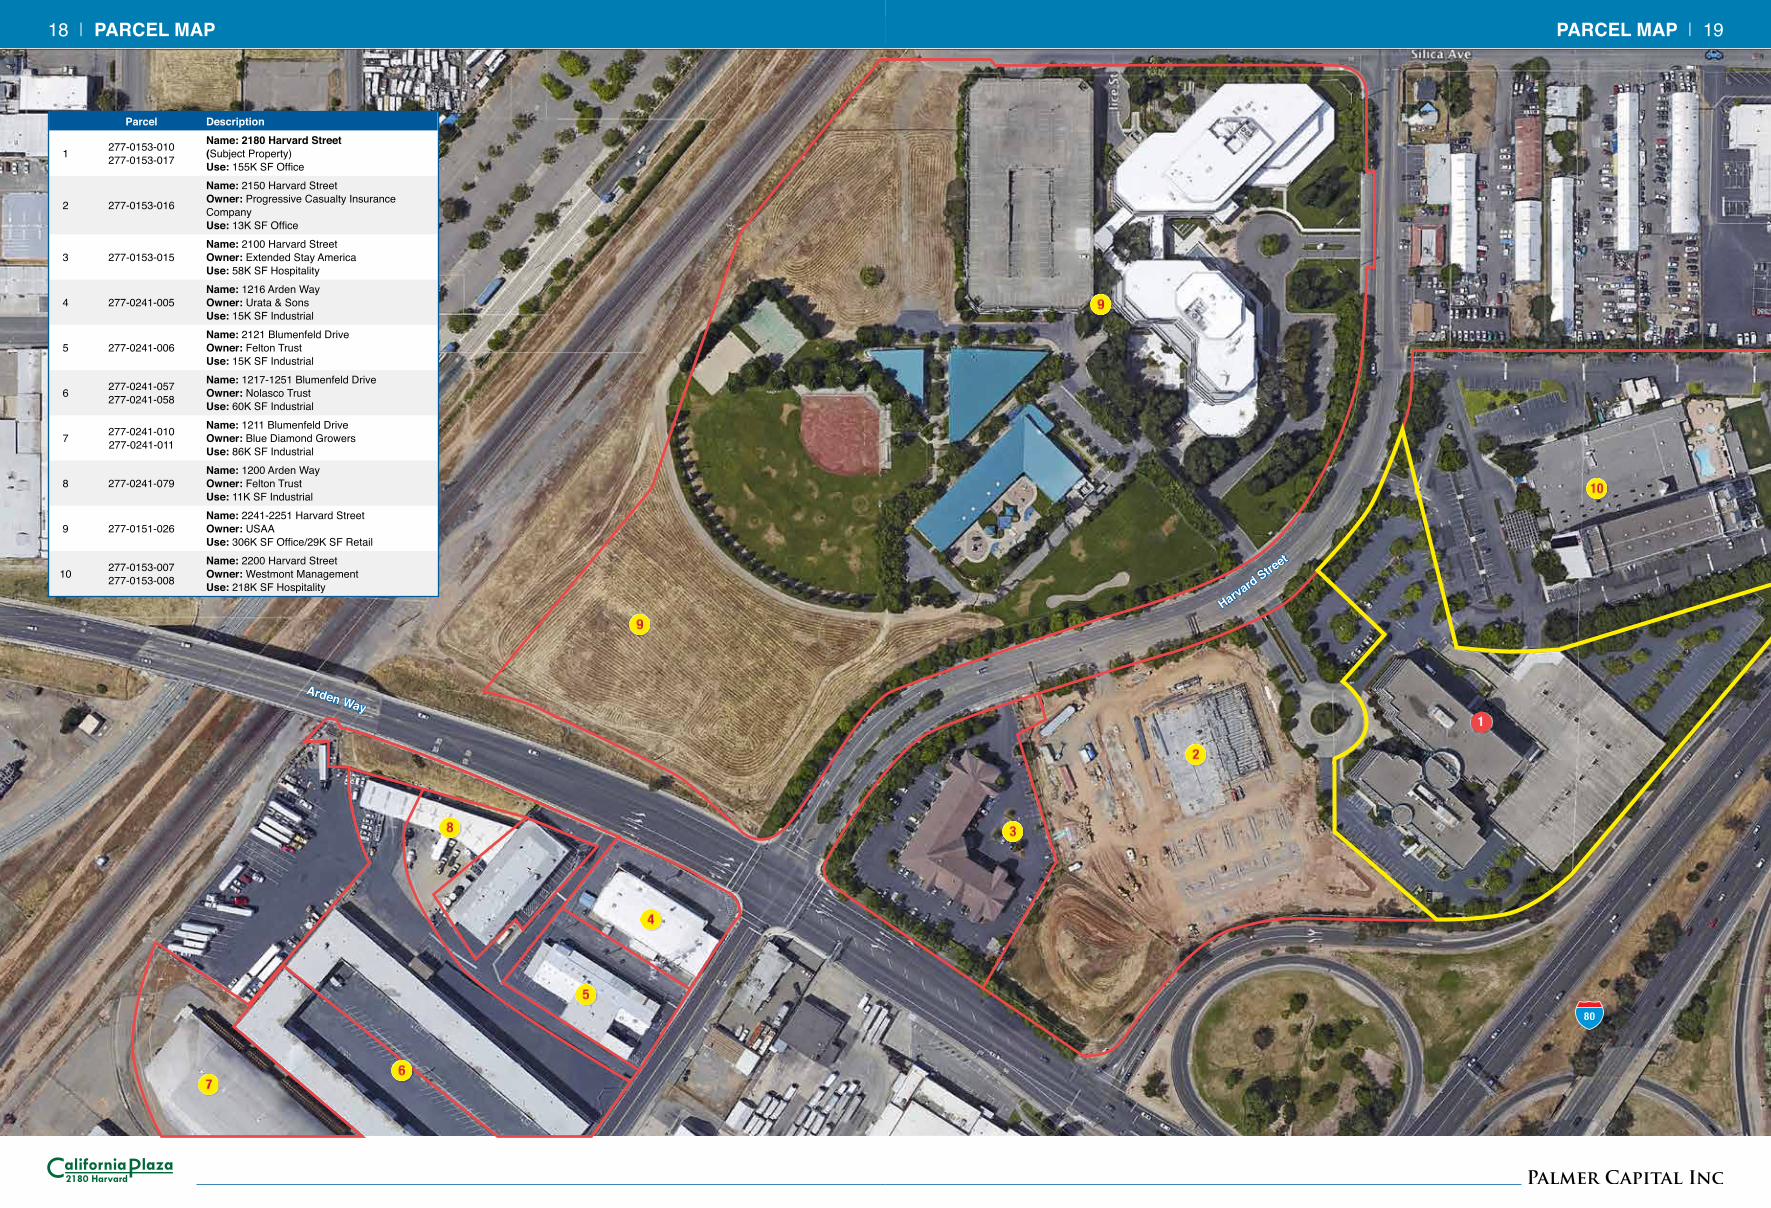
PARCEL MAP | 1918 | PARCEL MAP
Parcel Description
1 277-0153-010277-0153-017
Name: 2180 Harvard Street (Subject Property) Use: 155K SF Office
2 277-0153-016
Name: 2150 Harvard Street Owner: Progressive Casualty Insurance Company Use: 13K SF Office
3 277-0153-015Name: 2100 Harvard Street Owner: Extended Stay America Use: 58K SF Hospitality
4 277-0241-005Name: 1216 Arden Way Owner: Urata & Sons Use: 15K SF Industrial
5 277-0241-006Name: 2121 Blumenfeld Drive Owner: Felton Trust Use: 15K SF Industrial
6 277-0241-057 277-0241-058
Name: 1217-1251 Blumenfeld Drive Owner: Nolasco Trust Use: 60K SF Industrial
7 277-0241-010277-0241-011
Name: 1211 Blumenfeld Drive Owner: Blue Diamond Growers Use: 86K SF Industrial
8 277-0241-079Name: 1200 Arden Way Owner: Felton Trust Use: 11K SF Industrial
9 277-0151-026Name: 2241-2251 Harvard Street Owner: USAA Use: 306K SF Office/29K SF Retail
10 277-0153-007277-0153-008
Name: 2200 Harvard Street Owner: Westmont Management Use: 218K SF Hospitality
1
Harvard Street
Arden Way
80
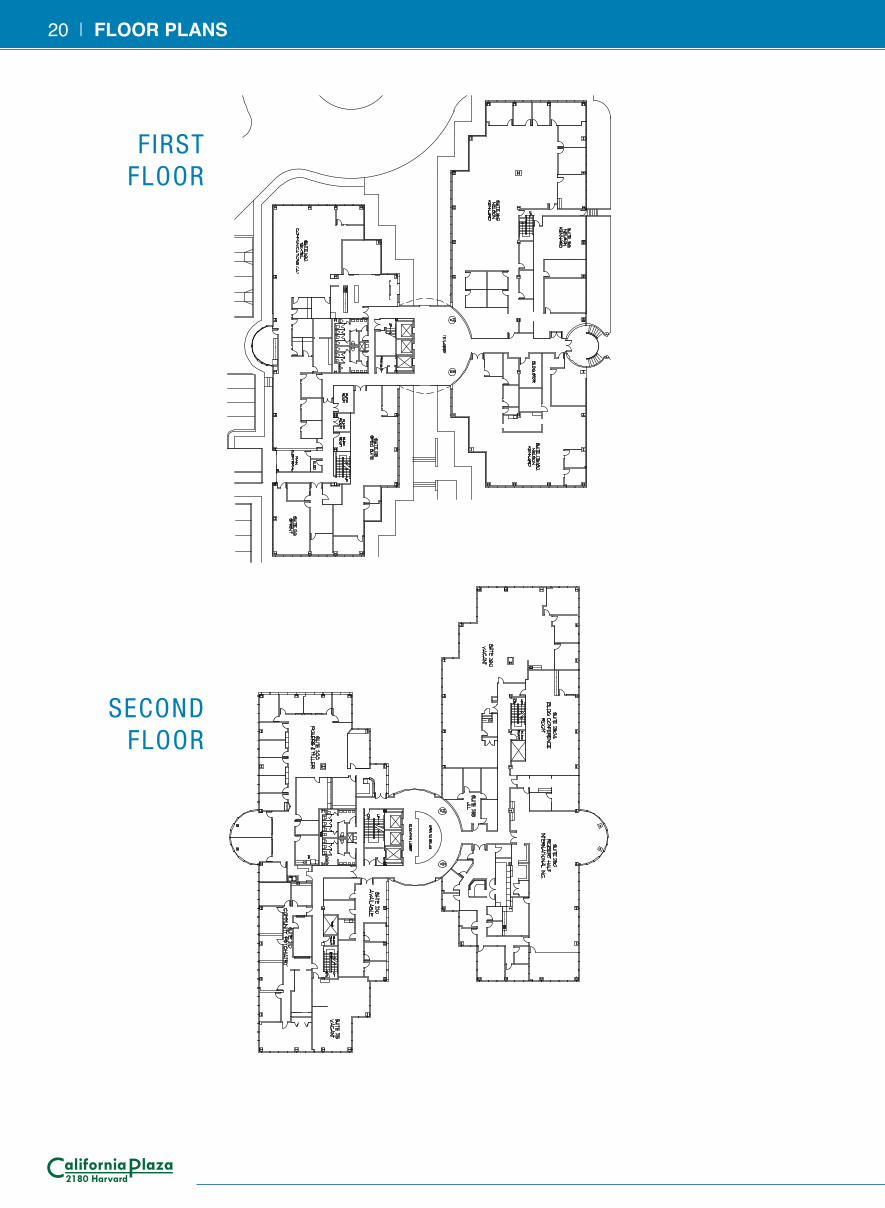
20 | FLOOR PLANS
FIRST FLOOR
SECOND FLOOR
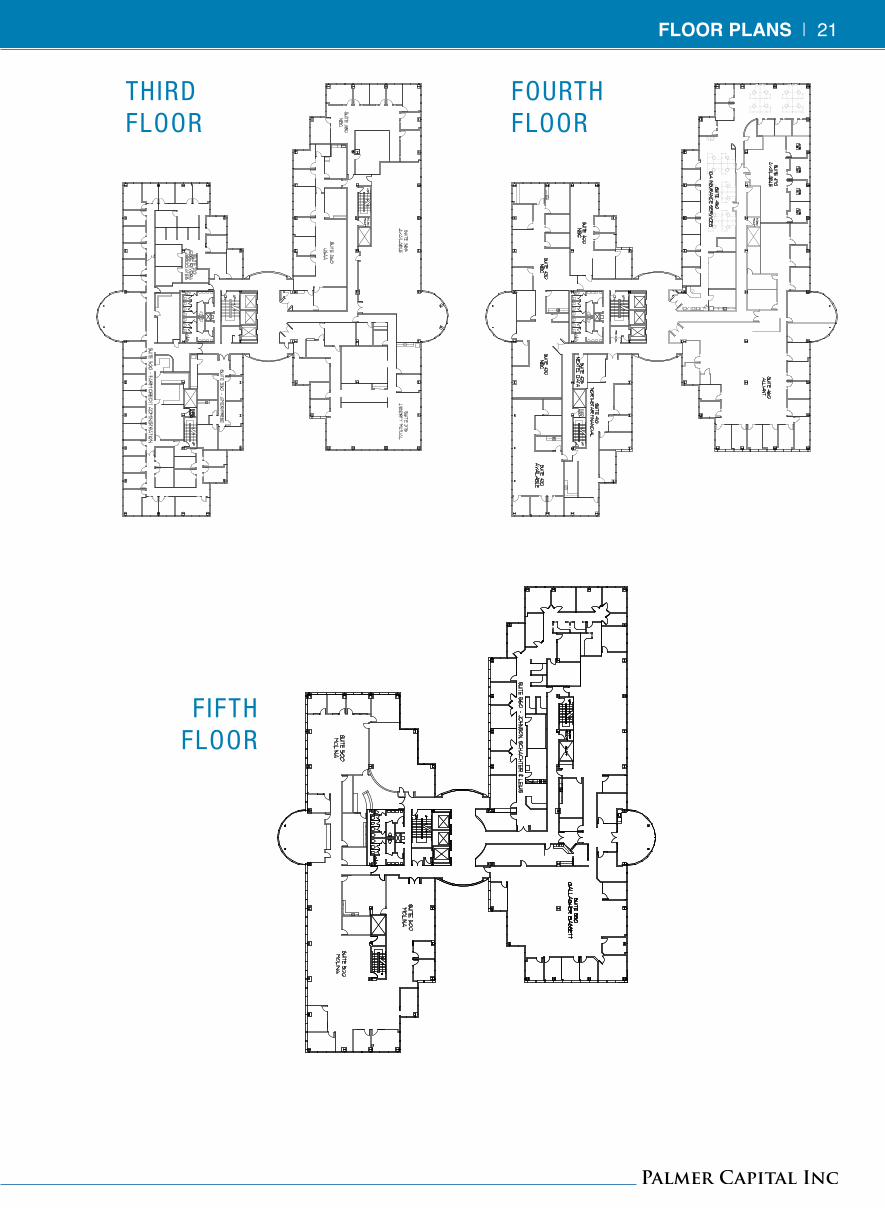
FLOOR PLANS | 21
THIRD FLOOR
FOURTH FLOOR
FIFTH FLOOR
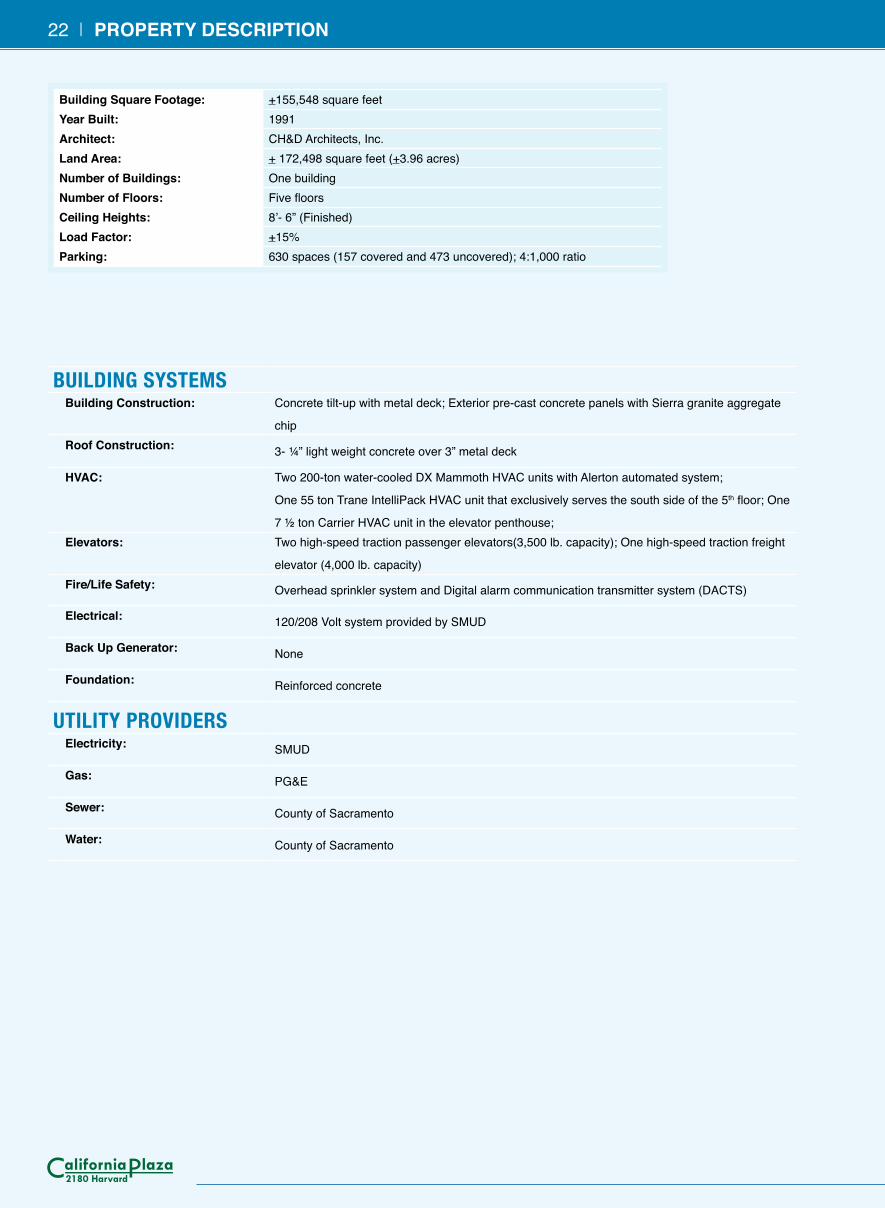
Building Square Footage: +155,548 square feetYear Built: 1991Architect: CH&D Architects, Inc.Land Area: + 172,498 square feet (+3.96 acres)Number of Buildings: One building Number of Floors: Five floorsCeiling Heights: 8’- 6” (Finished)Load Factor: +15%Parking: 630 spaces (157 covered and 473 uncovered); 4:1,000 ratio
BUILDING SYSTEMSBuilding Construction: Concrete tilt-up with metal deck; Exterior pre-cast concrete panels with Sierra granite aggregate
chipRoof Construction: 3- ¼” light weight concrete over 3” metal deck
HVAC: Two 200-ton water-cooled DX Mammoth HVAC units with Alerton automated system;
One 55 ton Trane IntelliPack HVAC unit that exclusively serves the south side of the 5th floor; One
7 ½ ton Carrier HVAC unit in the elevator penthouse; Elevators: Two high-speed traction passenger elevators(3,500 lb. capacity); One high-speed traction freight
elevator (4,000 lb. capacity)Fire/Life Safety: Overhead sprinkler system and Digital alarm communication transmitter system (DACTS)
Electrical: 120/208 Volt system provided by SMUD
Back Up Generator: None
Foundation: Reinforced concrete
UTILITY PROVIDERSElectricity: SMUD
Gas: PG&E
Sewer: County of Sacramento
Water: County of Sacramento
22 | PROPERTY DESCRIPTION
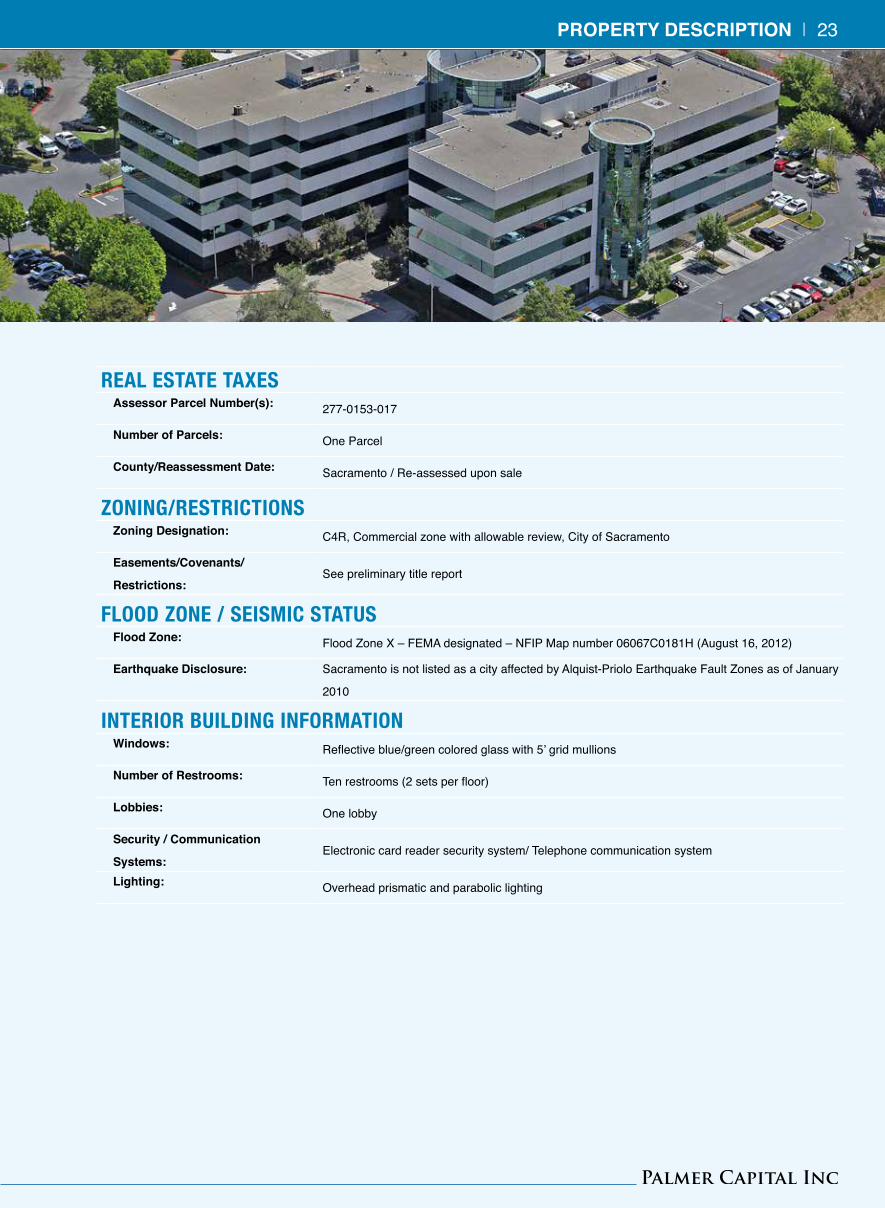
REAL ESTATE TAXESAssessor Parcel Number(s): 277-0153-017
Number of Parcels: One Parcel
County/Reassessment Date: Sacramento / Re-assessed upon sale
ZONING/RESTRICTIONSZoning Designation: C4R, Commercial zone with allowable review, City of Sacramento
Easements/Covenants/
Restrictions:See preliminary title report
FLOOD ZONE / SEISMIC STATUSFlood Zone: Flood Zone X – FEMA designated – NFIP Map number 06067C0181H (August 16, 2012)
Earthquake Disclosure: Sacramento is not listed as a city affected by Alquist-Priolo Earthquake Fault Zones as of January
2010
INTERIOR BUILDING INFORMATIONWindows: Reflective blue/green colored glass with 5’ grid mullions
Number of Restrooms: Ten restrooms (2 sets per floor)
Lobbies: One lobby
Security / Communication
Systems:Electronic card reader security system/ Telephone communication system
Lighting: Overhead prismatic and parabolic lighting
PROPERTY DESCRIPTION | 23
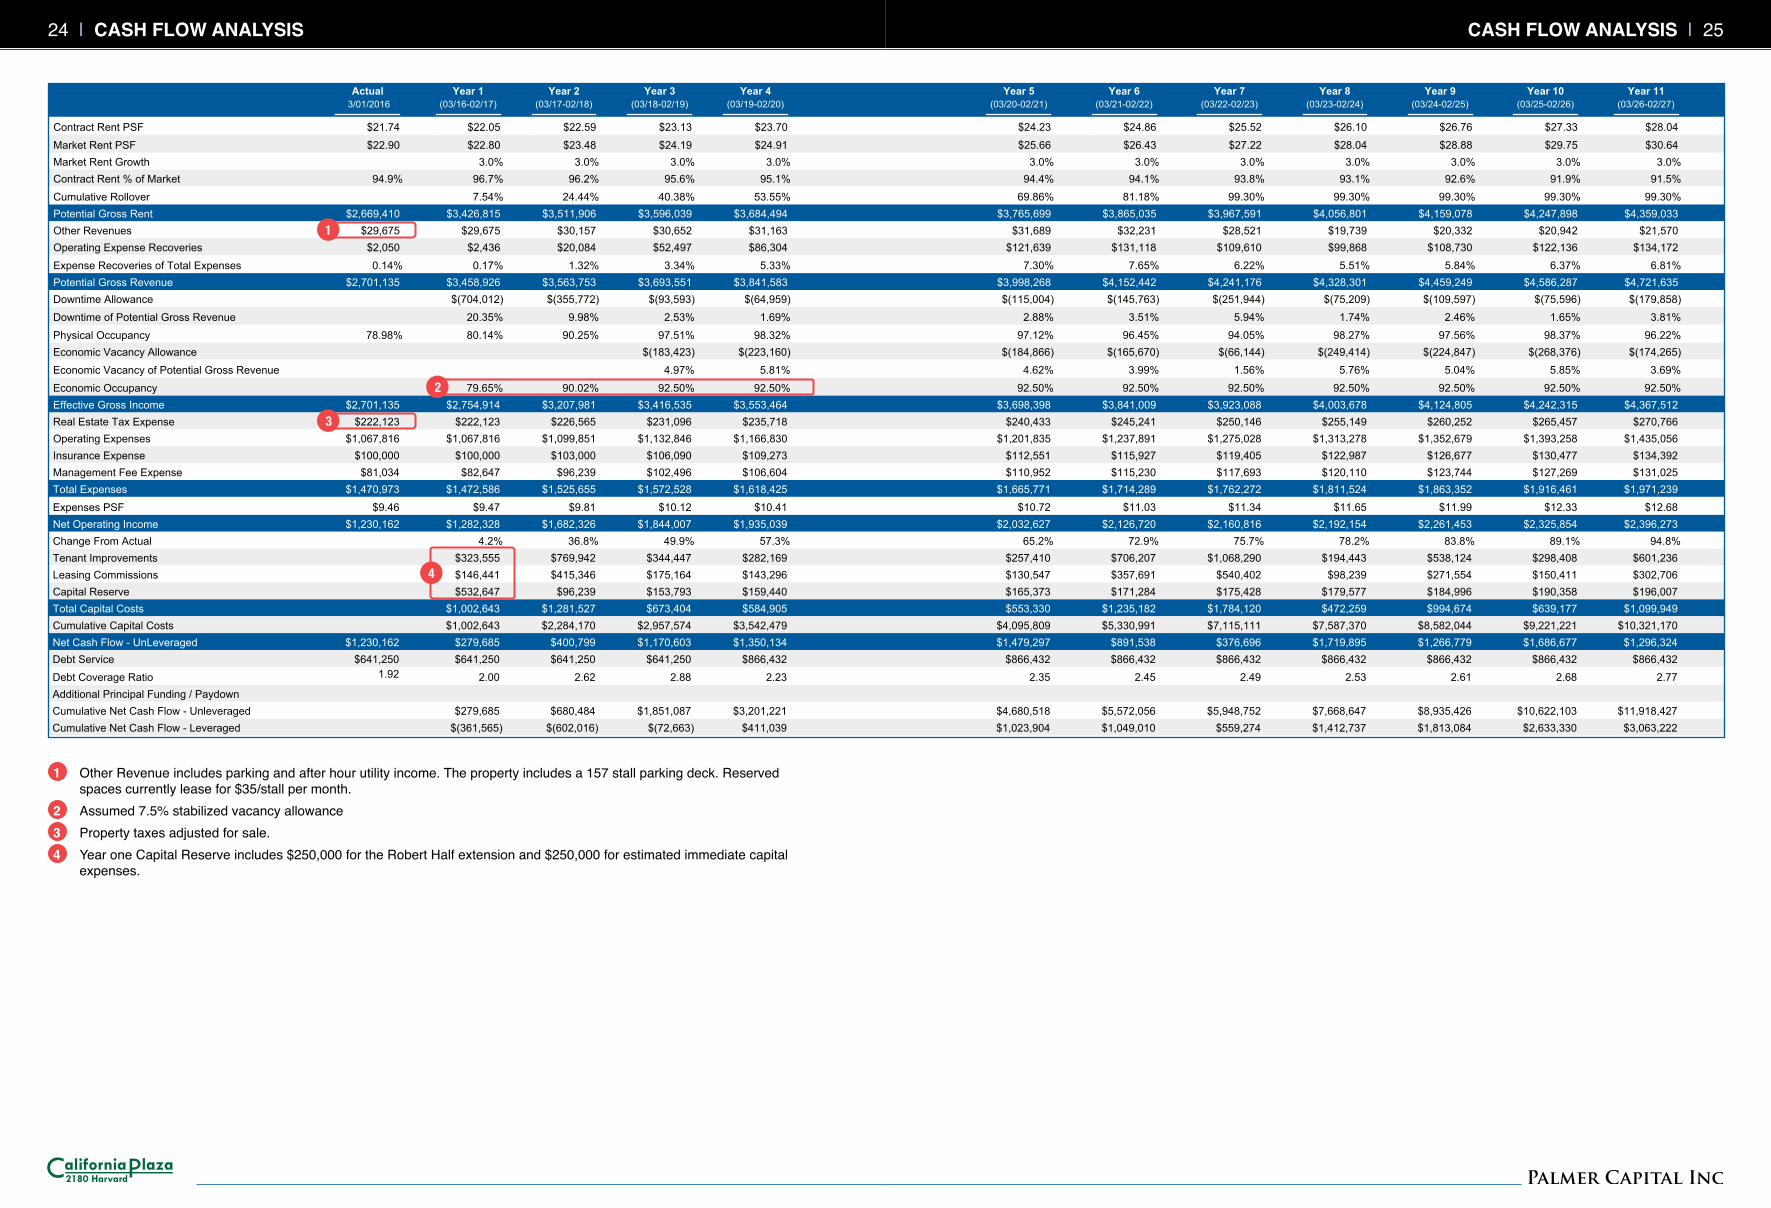
Actual Year 1 Year 2 Year 3 Year 4 Year 5 Year 6 Year 7 Year 8 Year 9 Year 10 Year 11 3/01/2016 (03/16-02/17) (03/17-02/18) (03/18-02/19) (03/19-02/20) (03/20-02/21) (03/21-02/22) (03/22-02/23) (03/23-02/24) (03/24-02/25) (03/25-02/26) (03/26-02/27)
Contract Rent PSF $21.74 $22.05 $22.59 $23.13 $23.70 $24.23 $24.86 $25.52 $26.10 $26.76 $27.33 $28.04
Market Rent PSF $22.90 $22.80 $23.48 $24.19 $24.91 $25.66 $26.43 $27.22 $28.04 $28.88 $29.75 $30.64
Market Rent Growth 3.0% 3.0% 3.0% 3.0% 3.0% 3.0% 3.0% 3.0% 3.0% 3.0% 3.0%
Contract Rent % of Market 94.9% 96.7% 96.2% 95.6% 95.1% 94.4% 94.1% 93.8% 93.1% 92.6% 91.9% 91.5%
Cumulative Rollover 7.54% 24.44% 40.38% 53.55% 69.86% 81.18% 99.30% 99.30% 99.30% 99.30% 99.30%
Potential Gross Rent $2,669,410 $3,426,815 $3,511,906 $3,596,039 $3,684,494 $3,765,699 $3,865,035 $3,967,591 $4,056,801 $4,159,078 $4,247,898 $4,359,033
Other Revenues $29,675 $29,675 $30,157 $30,652 $31,163 $31,689 $32,231 $28,521 $19,739 $20,332 $20,942 $21,570
Operating Expense Recoveries $2,050 $2,436 $20,084 $52,497 $86,304 $121,639 $131,118 $109,610 $99,868 $108,730 $122,136 $134,172
Expense Recoveries of Total Expenses 0.14% 0.17% 1.32% 3.34% 5.33% 7.30% 7.65% 6.22% 5.51% 5.84% 6.37% 6.81%
Potential Gross Revenue $2,701,135 $3,458,926 $3,563,753 $3,693,551 $3,841,583 $3,998,268 $4,152,442 $4,241,176 $4,328,301 $4,459,249 $4,586,287 $4,721,635
Downtime Allowance $(704,012) $(355,772) $(93,593) $(64,959) $(115,004) $(145,763) $(251,944) $(75,209) $(109,597) $(75,596) $(179,858)
Downtime of Potential Gross Revenue 20.35% 9.98% 2.53% 1.69% 2.88% 3.51% 5.94% 1.74% 2.46% 1.65% 3.81%
Physical Occupancy 78.98% 80.14% 90.25% 97.51% 98.32% 97.12% 96.45% 94.05% 98.27% 97.56% 98.37% 96.22%
Economic Vacancy Allowance $(183,423) $(223,160) $(184,866) $(165,670) $(66,144) $(249,414) $(224,847) $(268,376) $(174,265)
Economic Vacancy of Potential Gross Revenue 4.97% 5.81% 4.62% 3.99% 1.56% 5.76% 5.04% 5.85% 3.69%
Economic Occupancy 79.65% 90.02% 92.50% 92.50% 92.50% 92.50% 92.50% 92.50% 92.50% 92.50% 92.50%
Effective Gross Income $2,701,135 $2,754,914 $3,207,981 $3,416,535 $3,553,464 $3,698,398 $3,841,009 $3,923,088 $4,003,678 $4,124,805 $4,242,315 $4,367,512
Real Estate Tax Expense $222,123 $222,123 $226,565 $231,096 $235,718 $240,433 $245,241 $250,146 $255,149 $260,252 $265,457 $270,766
Operating Expenses $1,067,816 $1,067,816 $1,099,851 $1,132,846 $1,166,830 $1,201,835 $1,237,891 $1,275,028 $1,313,278 $1,352,679 $1,393,258 $1,435,056
Insurance Expense $100,000 $100,000 $103,000 $106,090 $109,273 $112,551 $115,927 $119,405 $122,987 $126,677 $130,477 $134,392
Management Fee Expense $81,034 $82,647 $96,239 $102,496 $106,604 $110,952 $115,230 $117,693 $120,110 $123,744 $127,269 $131,025
Total Expenses $1,470,973 $1,472,586 $1,525,655 $1,572,528 $1,618,425 $1,665,771 $1,714,289 $1,762,272 $1,811,524 $1,863,352 $1,916,461 $1,971,239
Expenses PSF $9.46 $9.47 $9.81 $10.12 $10.41 $10.72 $11.03 $11.34 $11.65 $11.99 $12.33 $12.68
Net Operating Income $1,230,162 $1,282,328 $1,682,326 $1,844,007 $1,935,039 $2,032,627 $2,126,720 $2,160,816 $2,192,154 $2,261,453 $2,325,854 $2,396,273
Change From Actual 4.2% 36.8% 49.9% 57.3% 65.2% 72.9% 75.7% 78.2% 83.8% 89.1% 94.8%
Tenant Improvements $323,555 $769,942 $344,447 $282,169 $257,410 $706,207 $1,068,290 $194,443 $538,124 $298,408 $601,236
Leasing Commissions $146,441 $415,346 $175,164 $143,296 $130,547 $357,691 $540,402 $98,239 $271,554 $150,411 $302,706
Capital Reserve $532,647 $96,239 $153,793 $159,440 $165,373 $171,284 $175,428 $179,577 $184,996 $190,358 $196,007
Total Capital Costs $1,002,643 $1,281,527 $673,404 $584,905 $553,330 $1,235,182 $1,784,120 $472,259 $994,674 $639,177 $1,099,949
Cumulative Capital Costs $1,002,643 $2,284,170 $2,957,574 $3,542,479 $4,095,809 $5,330,991 $7,115,111 $7,587,370 $8,582,044 $9,221,221 $10,321,170
Net Cash Flow - UnLeveraged $1,230,162 $279,685 $400,799 $1,170,603 $1,350,134 $1,479,297 $891,538 $376,696 $1,719,895 $1,266,779 $1,686,677 $1,296,324
Debt Service $641,250 $641,250 $641,250 $641,250 $866,432 $866,432 $866,432 $866,432 $866,432 $866,432 $866,432 $866,432
Debt Coverage Ratio 1.92 2.00 2.62 2.88 2.23 2.35 2.45 2.49 2.53 2.61 2.68 2.77
Additional Principal Funding / Paydown
Cumulative Net Cash Flow - Unleveraged $279,685 $680,484 $1,851,087 $3,201,221 $4,680,518 $5,572,056 $5,948,752 $7,668,647 $8,935,426 $10,622,103 $11,918,427
Cumulative Net Cash Flow - Leveraged $(361,565) $(602,016) $(72,663) $411,039 $1,023,904 $1,049,010 $559,274 $1,412,737 $1,813,084 $2,633,330 $3,063,222
CASH FLOW ANALYSIS | 2524 | CASH FLOW ANALYSIS
1
3
4
2
1 Other Revenue includes parking and after hour utility income. The property includes a 157 stall parking deck. Reserved spaces currently lease for $35/stall per month.
2 Assumed 7.5% stabilized vacancy allowance3 Property taxes adjusted for sale.4 Year one Capital Reserve includes $250,000 for the Robert Half extension and $250,000 for estimated immediate capital
expenses.
TenantSuite
% of Total
Square Ft
% of Total
Rent
Square
Footage
Actual
Monthly
Rent PSF
Market
Monthly
Rent PSF
Start
Date
End
Date
Monthly
Rent
Recovery
Method
Actual
Annual
Rent PSF
Market
Annual
Rent PSF
Occ
Date
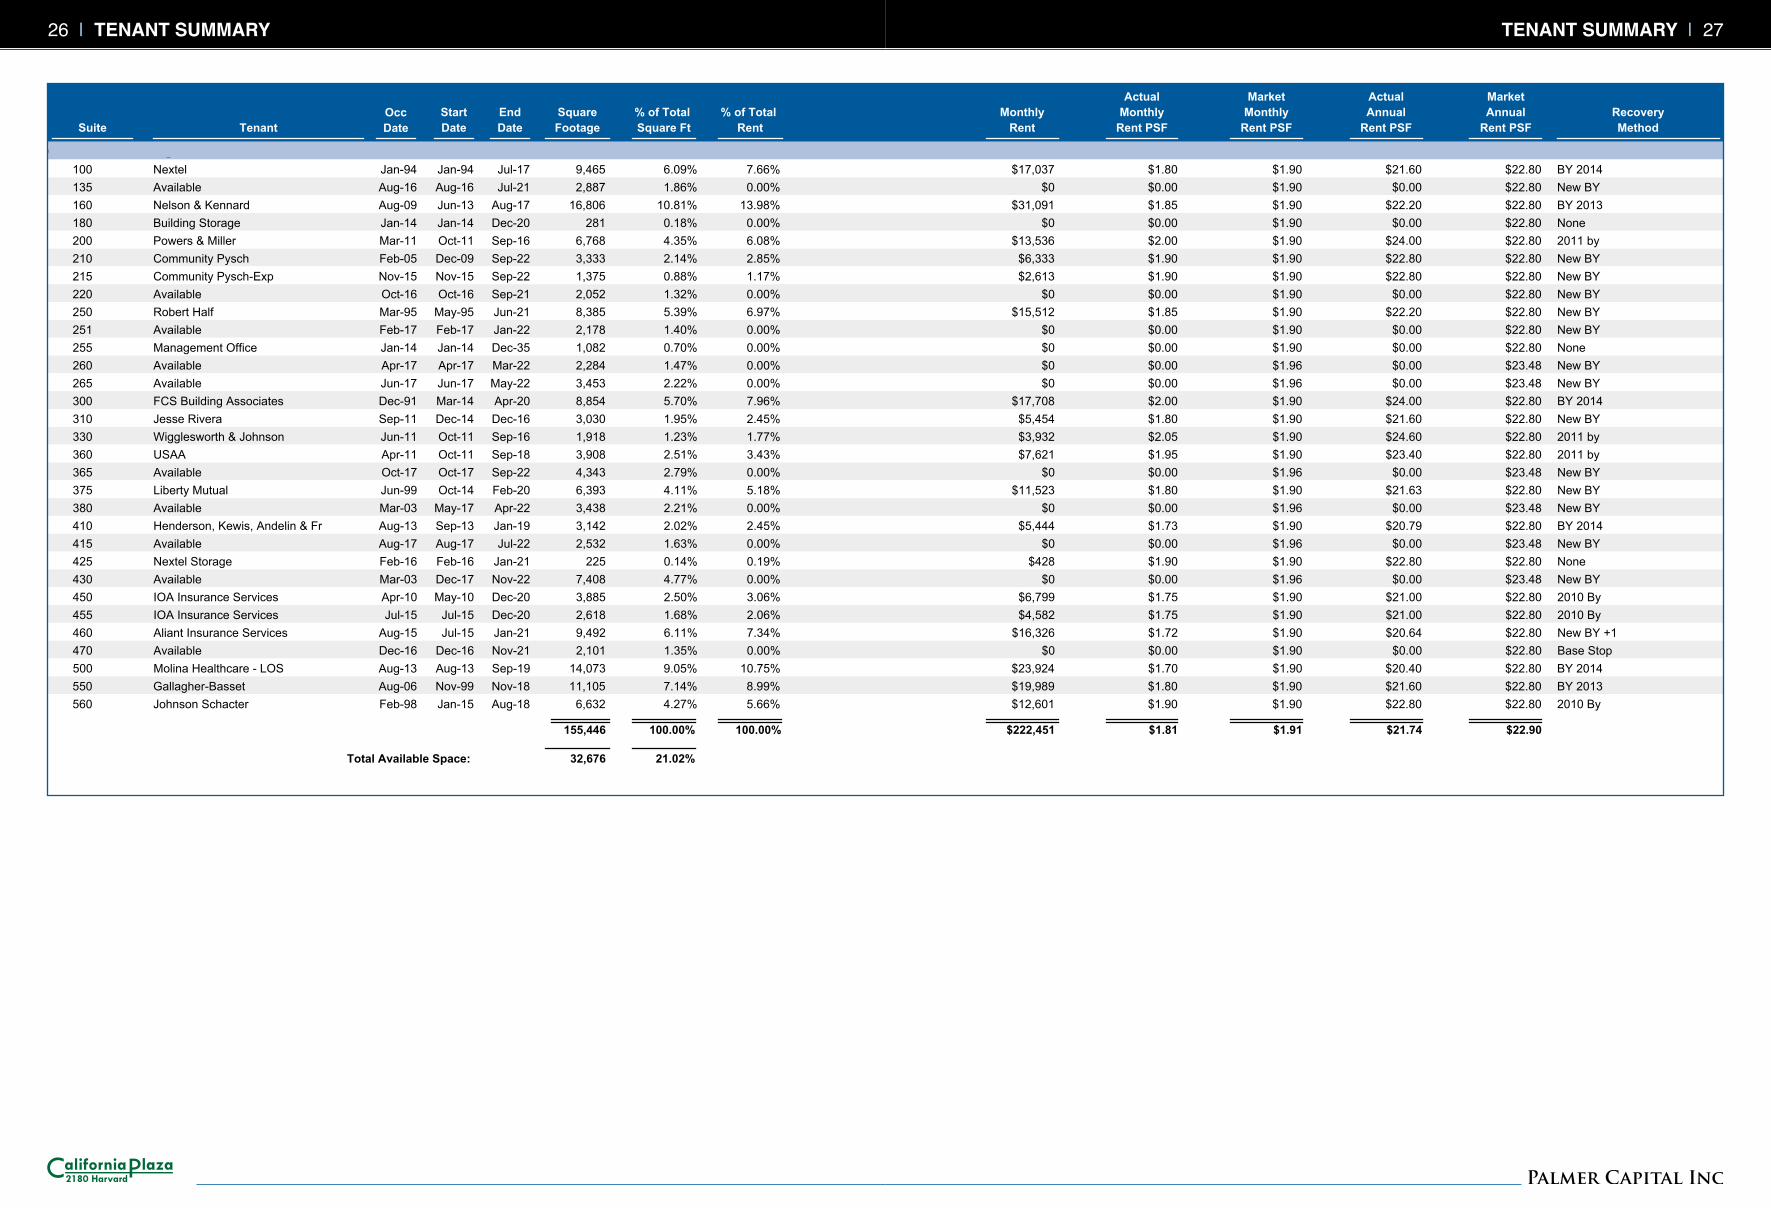
California Plaza - Insight
100 Nextel 9,465 7.66% $1.80 $1.90Jan-94 Jul-17 6.09% $17,037 BY 2014$21.60 $22.80Jan-94
135 Available 2,887 0.00% $0.00 $1.90Aug-16 Jul-21 1.86% $0 New BY$0.00 $22.80Aug-16
160 Nelson & Kennard 16,806 13.98% $1.85 $1.90Jun-13 Aug-17 10.81% $31,091 BY 2013$22.20 $22.80Aug-09
180 Building Storage 281 0.00% $0.00 $1.90Jan-14 Dec-20 0.18% $0 None$0.00 $22.80Jan-14
200 Powers & Miller 6,768 6.08% $2.00 $1.90Oct-11 Sep-16 4.35% $13,536 2011 by$24.00 $22.80Mar-11
210 Community Pysch 3,333 2.85% $1.90 $1.90Dec-09 Sep-22 2.14% $6,333 New BY$22.80 $22.80Feb-05
215 Community Pysch-Exp 1,375 1.17% $1.90 $1.90Nov-15 Sep-22 0.88% $2,613 New BY$22.80 $22.80Nov-15
220 Available 2,052 0.00% $0.00 $1.90Oct-16 Sep-21 1.32% $0 New BY$0.00 $22.80Oct-16
250 Robert Half 8,385 6.97% $1.85 $1.90May-95 Jun-21 5.39% $15,512 New BY$22.20 $22.80Mar-95
251 Available 2,178 0.00% $0.00 $1.90Feb-17 Jan-22 1.40% $0 New BY$0.00 $22.80Feb-17
255 Management Office 1,082 0.00% $0.00 $1.90Jan-14 Dec-35 0.70% $0 None$0.00 $22.80Jan-14
260 Available 2,284 0.00% $0.00 $1.96Apr-17 Mar-22 1.47% $0 New BY$0.00 $23.48Apr-17
265 Available 3,453 0.00% $0.00 $1.96Jun-17 May-22 2.22% $0 New BY$0.00 $23.48Jun-17
300 FCS Building Associates 8,854 7.96% $2.00 $1.90Mar-14 Apr-20 5.70% $17,708 BY 2014$24.00 $22.80Dec-91
310 Jesse Rivera 3,030 2.45% $1.80 $1.90Dec-14 Dec-16 1.95% $5,454 New BY$21.60 $22.80Sep-11
330 Wigglesworth & Johnson 1,918 1.77% $2.05 $1.90Oct-11 Sep-16 1.23% $3,932 2011 by$24.60 $22.80Jun-11
360 USAA 3,908 3.43% $1.95 $1.90Oct-11 Sep-18 2.51% $7,621 2011 by$23.40 $22.80Apr-11
365 Available 4,343 0.00% $0.00 $1.96Oct-17 Sep-22 2.79% $0 New BY$0.00 $23.48Oct-17
375 Liberty Mutual 6,393 5.18% $1.80 $1.90Oct-14 Feb-20 4.11% $11,523 New BY$21.63 $22.80Jun-99
380 Available 3,438 0.00% $0.00 $1.96May-17 Apr-22 2.21% $0 New BY$0.00 $23.48Mar-03
410 Henderson, Kewis, Andelin & Fr 3,142 2.45% $1.73 $1.90Sep-13 Jan-19 2.02% $5,444 BY 2014$20.79 $22.80Aug-13
415 Available 2,532 0.00% $0.00 $1.96Aug-17 Jul-22 1.63% $0 New BY$0.00 $23.48Aug-17
425 Nextel Storage 225 0.19% $1.90 $1.90Feb-16 Jan-21 0.14% $428 None$22.80 $22.80Feb-16
430 Available 7,408 0.00% $0.00 $1.96Dec-17 Nov-22 4.77% $0 New BY$0.00 $23.48Mar-03
450 IOA Insurance Services 3,885 3.06% $1.75 $1.90May-10 Dec-20 2.50% $6,799 2010 By$21.00 $22.80Apr-10
455 IOA Insurance Services 2,618 2.06% $1.75 $1.90Jul-15 Dec-20 1.68% $4,582 2010 By$21.00 $22.80Jul-15
460 Aliant Insurance Services 9,492 7.34% $1.72 $1.90Jul-15 Jan-21 6.11% $16,326 New BY +1$20.64 $22.80Aug-15
470 Available 2,101 0.00% $0.00 $1.90Dec-16 Nov-21 1.35% $0 Base Stop$0.00 $22.80Dec-16
500 Molina Healthcare - LOS 14,073 10.75% $1.70 $1.90Aug-13 Sep-19 9.05% $23,924 BY 2014$20.40 $22.80Aug-13
550 Gallagher-Basset 11,105 8.99% $1.80 $1.90Nov-99 Nov-18 7.14% $19,989 BY 2013$21.60 $22.80Aug-06
560 Johnson Schacter 6,632 5.66% $1.90 $1.90Jan-15 Aug-18 4.27% $12,601 2010 By$22.80 $22.80Feb-98
155,446 100.00% 100.00% $222,451 $1.81 $1.91
32,676 21.02%Total Available Space:
$21.74 $22.90
TenantSuite
% of Total
Square Ft
% of Total
Rent
Square
Footage
Actual
Monthly
Rent PSF
Market
Monthly
Rent PSF
Start
Date
End
Date
Monthly
Rent
Recovery
Method
Actual
Annual
Rent PSF
Market
Annual
Rent PSF
Occ
Date
California Plaza - Debt
100 Nextel 9,465 6.82% $1.80 $1.90Jan-94 Jul-17 6.09% $17,037 BY 2014$21.60 $22.80Jan-94
135 Available 2,887 0.00% $0.00 $1.90Mar-16 Jul-20 1.86% $0 New BY$0.00 $22.80Mar-16
160 Nelson & Kennard 16,806 12.11% $1.80 $1.90Jun-13 Aug-17 10.81% $30,251 BY 2013$21.60 $22.80Aug-09
180 Building Storage 281 0.00% $0.00 $1.90Jan-14 Dec-20 0.18% $0 None$0.00 $22.80Jan-14
200 Powers & Miller 6,768 5.42% $2.00 $1.90Oct-11 Sep-16 4.35% $13,536 2011 by$24.00 $22.80Mar-11
210 Community Pysch 3,333 2.54% $1.90 $1.90Dec-09 Sep-22 2.14% $6,333 New BY$22.80 $22.80Feb-05
215 Community Pysch-Exp 1,375 1.05% $1.90 $1.90Nov-15 Sep-22 0.88% $2,613 New BY$22.80 $22.80Nov-15
220 Available 2,052 0.00% $0.00 $1.90Sep-16 Aug-21 1.32% $0 New BY$0.00 $22.80Sep-16
250 Robert Half 8,385 7.16% $2.13 $1.90May-95 Dec-16 5.39% $17,867 New BY$25.57 $22.80Mar-95
251 Available 2,178 0.00% $0.00 $1.90Nov-16 Oct-19 1.40% $0 New BY$0.00 $22.80Nov-16
255 Management Office 1,082 0.00% $0.00 $1.90Jan-14 Dec-35 0.70% $0 None$0.00 $22.80Jan-14
260 Available 2,284 0.00% $0.00 $1.96Jan-17 Dec-21 1.47% $0 New BY$0.00 $23.48Jan-17
265 Available 3,453 0.00% $0.00 $1.96Mar-17 Feb-22 2.22% $0 New BY$0.00 $23.48Mar-17
300 FCS Building Associates 8,854 6.91% $1.95 $1.90Mar-14 Apr-20 5.70% $17,265 BY 2014$23.40 $22.80Dec-91
310 Jesse Rivera 3,030 2.12% $1.75 $1.90Dec-14 Dec-16 1.95% $5,303 New BY$21.00 $22.80Sep-11
330 Wigglesworth & Johnson 1,918 1.57% $2.05 $1.90Oct-11 Sep-16 1.23% $3,932 2011 by$24.60 $22.80Jun-11
360 USAA 3,908 3.05% $1.95 $1.90Oct-11 Sep-18 2.51% $7,621 2011 by$23.40 $22.80Apr-11
365 Available 4,343 0.00% $0.00 $1.90Jun-16 May-21 2.79% $0 New BY$0.00 $22.80Jun-16
375 Liberty Mutual 6,393 4.48% $1.75 $1.90Oct-14 Feb-20 4.11% $11,188 New BY$21.00 $22.80Jun-99
380 NBC (Dept of Interior) 3,438 3.46% $2.51 $1.90Jun-10 Feb-16 2.21% $8,629 None$30.12 $22.80Mar-03
410 Henderson, Kewis, Andelin & Fr 3,142 2.12% $1.68 $1.90Sep-13 Jan-19 2.02% $5,286 BY 2014$20.19 $22.80Aug-13
415 Available 2,532 0.00% $0.00 $1.96May-17 Apr-22 1.63% $0 New BY$0.00 $23.48May-17
425 Nextel Storage 225 0.14% $1.58 $1.58Feb-16 Jan-21 0.14% $356 None$19.00 $19.00Feb-16
430 NBC (Dept of Interior) 7,408 7.45% $2.51 $1.90Jun-10 Feb-16 4.77% $18,594 None$30.12 $22.80Mar-03
450 IOA Insurance Services 3,885 2.72% $1.75 $1.90May-10 Dec-20 2.50% $6,799 2010 By$21.00 $22.80Apr-10
455 IOA Insurance Services 2,618 1.83% $1.75 $1.90Jul-15 Dec-20 1.68% $4,582 2010 By$21.00 $22.80Jul-15
460 Aliant Insurance Services 9,492 6.54% $1.72 $1.90Jul-15 Jan-21 6.11% $16,326 New BY +1$20.64 $22.80Aug-15
470 Available 2,101 0.00% $0.00 $1.90Sep-16 Aug-21 1.35% $0 Base Stop$0.00 $22.80Sep-16
500 Molina Healthcare - LOS 14,073 9.58% $1.70 $1.90Aug-13 Sep-19 9.05% $23,924 BY 2014$20.40 $22.80Aug-13
550 Gallagher-Basset 11,105 8.01% $1.80 $1.90Nov-99 Nov-18 7.14% $19,989 BY 2013$21.60 $22.80Aug-06
560 Johnson Schacter 6,632 4.91% $1.85 $1.90Jan-15 Aug-18 4.27% $12,269 2010 By$22.20 $22.80Feb-98
155,446 100.00% 100.00% $249,699 $1.87 $1.90
21,830 14.04%Total Available Space:
$22.43 $22.83
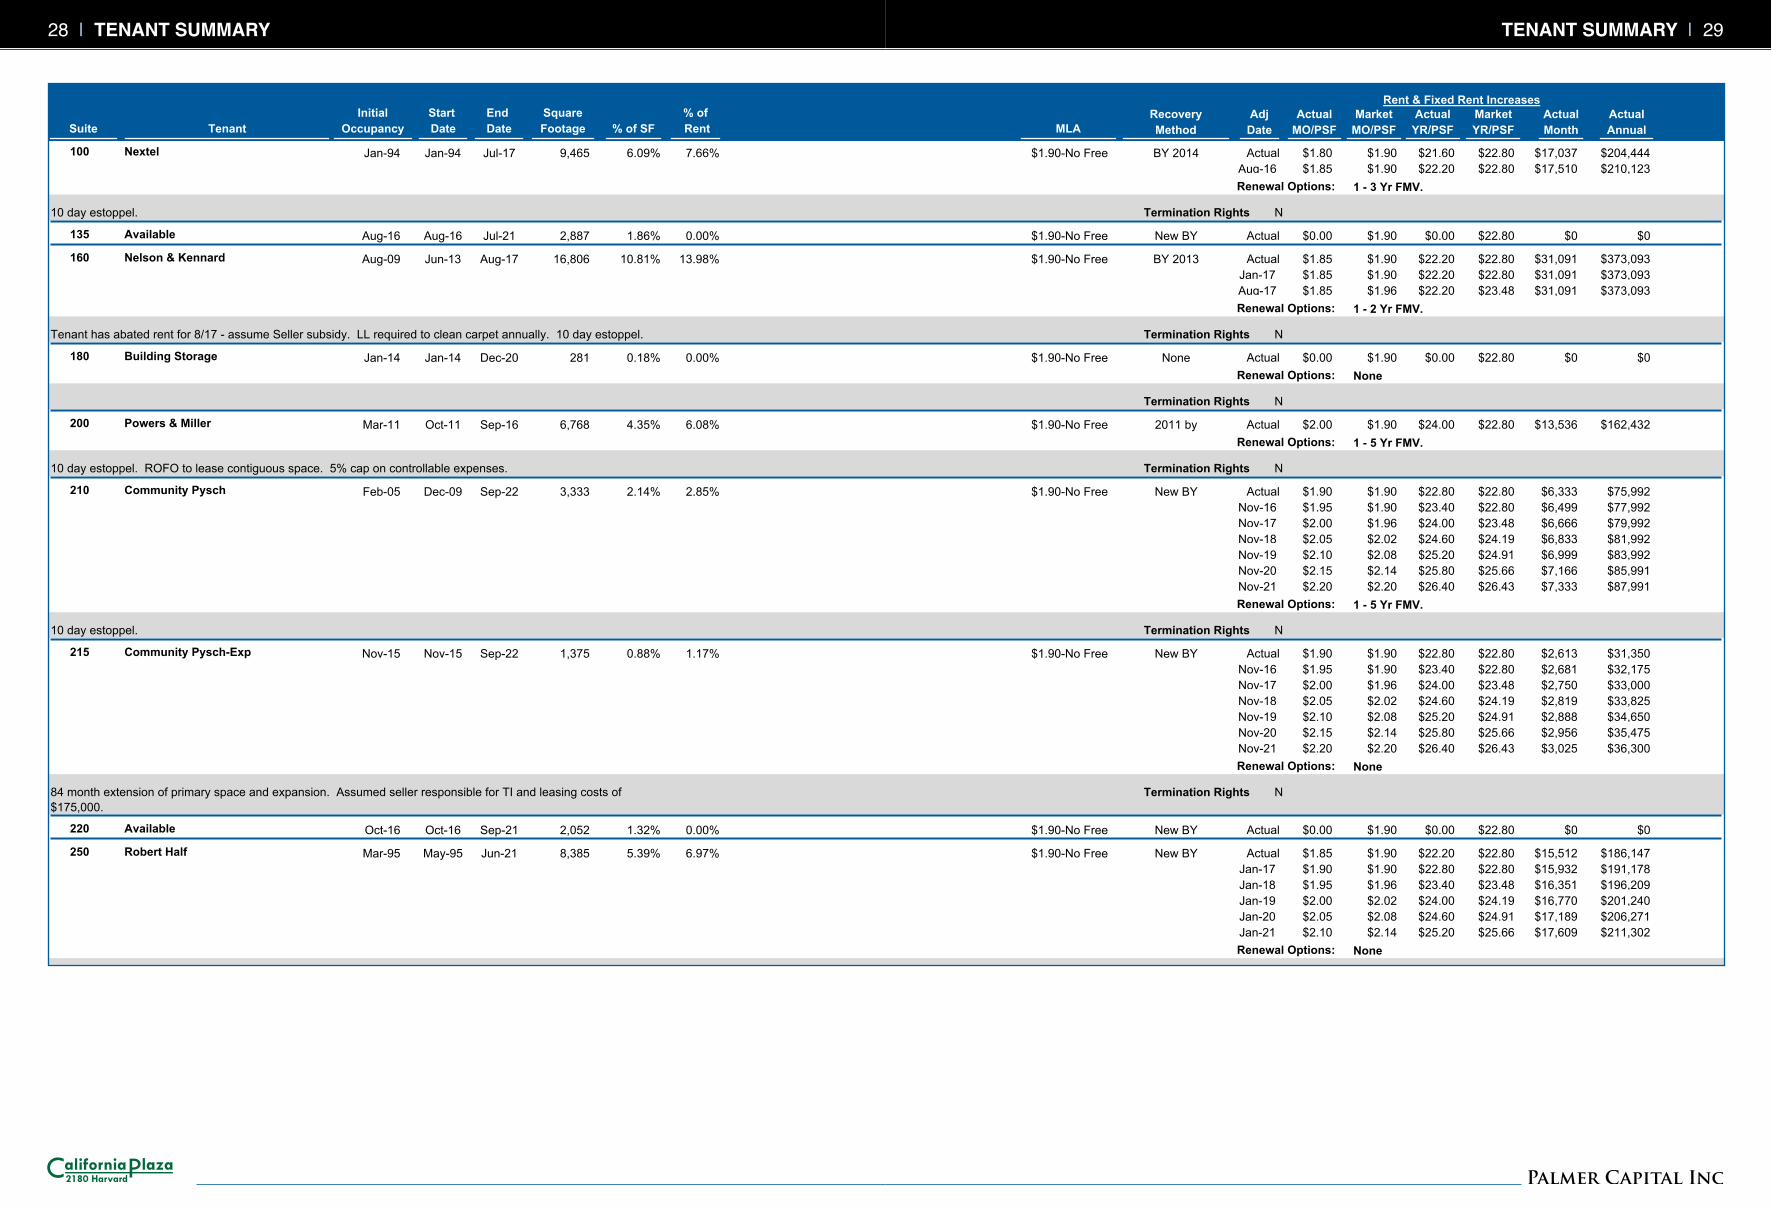
TENANT SUMMARY | 2726 | TENANT SUMMARY
TenantSuite
Rent & Fixed Rent IncreasesInitial
Occupancy
End
Date
Square
Footage % of SF
% of
Rent
Start
DateActual
Annual
Actual
Month
Market
YR/PSF
Actual
YR/PSF
Market
MO/PSF
Actual
MO/PSF
Adj
Date
Recovery
MethodMLA
Nextel 100 Actual $1.80 $21.60$1.90 $22.80 $17,037 $204,444
Aug-16 $1.85 $22.20$1.90 $22.80 $17,510 $210,123
1 - 3 Yr FMV.Renewal Options:
BY 2014 7.66% 6.09% 9,465 Jul-17Jan-94Jan-94 $1.90-No Free
10 day estoppel. Termination Rights N
Available 135 Actual $0.00 $0.00$1.90 $22.80 $0 $0 New BY 0.00% 1.86% 2,887 Jul-21Aug-16Aug-16 $1.90-No Free
Nelson & Kennard 160 Actual $1.85 $22.20$1.90 $22.80 $31,091 $373,093
Jan-17 $1.85 $22.20$1.90 $22.80 $31,091 $373,093
Aug-17 $1.85 $22.20$1.96 $23.48 $31,091 $373,093
1 - 2 Yr FMV.Renewal Options:
BY 2013 13.98% 10.81% 16,806 Aug-17Jun-13Aug-09 $1.90-No Free
Tenant has abated rent for 8/17 - assume Seller subsidy. LL required to clean carpet annually. 10 day estoppel. Termination Rights N
Building Storage 180 Actual $0.00 $0.00$1.90 $22.80 $0 $0
NoneRenewal Options:
None 0.00% 0.18% 281 Dec-20Jan-14Jan-14 $1.90-No Free
Termination Rights N
Powers & Miller 200 Actual $2.00 $24.00$1.90 $22.80 $13,536 $162,432
1 - 5 Yr FMV.Renewal Options:
2011 by 6.08% 4.35% 6,768 Sep-16Oct-11Mar-11 $1.90-No Free
10 day estoppel. ROFO to lease contiguous space. 5% cap on controllable expenses. Termination Rights N
Community Pysch 210 Actual $1.90 $22.80$1.90 $22.80 $6,333 $75,992
Nov-16 $1.95 $23.40$1.90 $22.80 $6,499 $77,992
Nov-17 $2.00 $24.00$1.96 $23.48 $6,666 $79,992
Nov-18 $2.05 $24.60$2.02 $24.19 $6,833 $81,992
Nov-19 $2.10 $25.20$2.08 $24.91 $6,999 $83,992
Nov-20 $2.15 $25.80$2.14 $25.66 $7,166 $85,991
Nov-21 $2.20 $26.40$2.20 $26.43 $7,333 $87,991
1 - 5 Yr FMV.Renewal Options:
New BY 2.85% 2.14% 3,333 Sep-22Dec-09Feb-05 $1.90-No Free
10 day estoppel. Termination Rights N
Community Pysch-Exp 215 Actual $1.90 $22.80$1.90 $22.80 $2,613 $31,350
Nov-16 $1.95 $23.40$1.90 $22.80 $2,681 $32,175
Nov-17 $2.00 $24.00$1.96 $23.48 $2,750 $33,000
Nov-18 $2.05 $24.60$2.02 $24.19 $2,819 $33,825
Nov-19 $2.10 $25.20$2.08 $24.91 $2,888 $34,650
Nov-20 $2.15 $25.80$2.14 $25.66 $2,956 $35,475
Nov-21 $2.20 $26.40$2.20 $26.43 $3,025 $36,300
NoneRenewal Options:
New BY 1.17% 0.88% 1,375 Sep-22Nov-15Nov-15 $1.90-No Free
84 month extension of primary space and expansion. Assumed seller responsible for TI and leasing costs of
$175,000.
Termination Rights N
Available 220 Actual $0.00 $0.00$1.90 $22.80 $0 $0 New BY 0.00% 1.32% 2,052 Sep-21Oct-16Oct-16 $1.90-No Free
Robert Half 250 Actual $1.85 $22.20$1.90 $22.80 $15,512 $186,147
Jan-17 $1.90 $22.80$1.90 $22.80 $15,932 $191,178
Jan-18 $1.95 $23.40$1.96 $23.48 $16,351 $196,209
Jan-19 $2.00 $24.00$2.02 $24.19 $16,770 $201,240
Jan-20 $2.05 $24.60$2.08 $24.91 $17,189 $206,271
Jan-21 $2.10 $25.20$2.14 $25.66 $17,609 $211,302
NoneRenewal Options:
New BY 6.97% 5.39% 8,385 Jun-21May-95Mar-95 $1.90-No Free
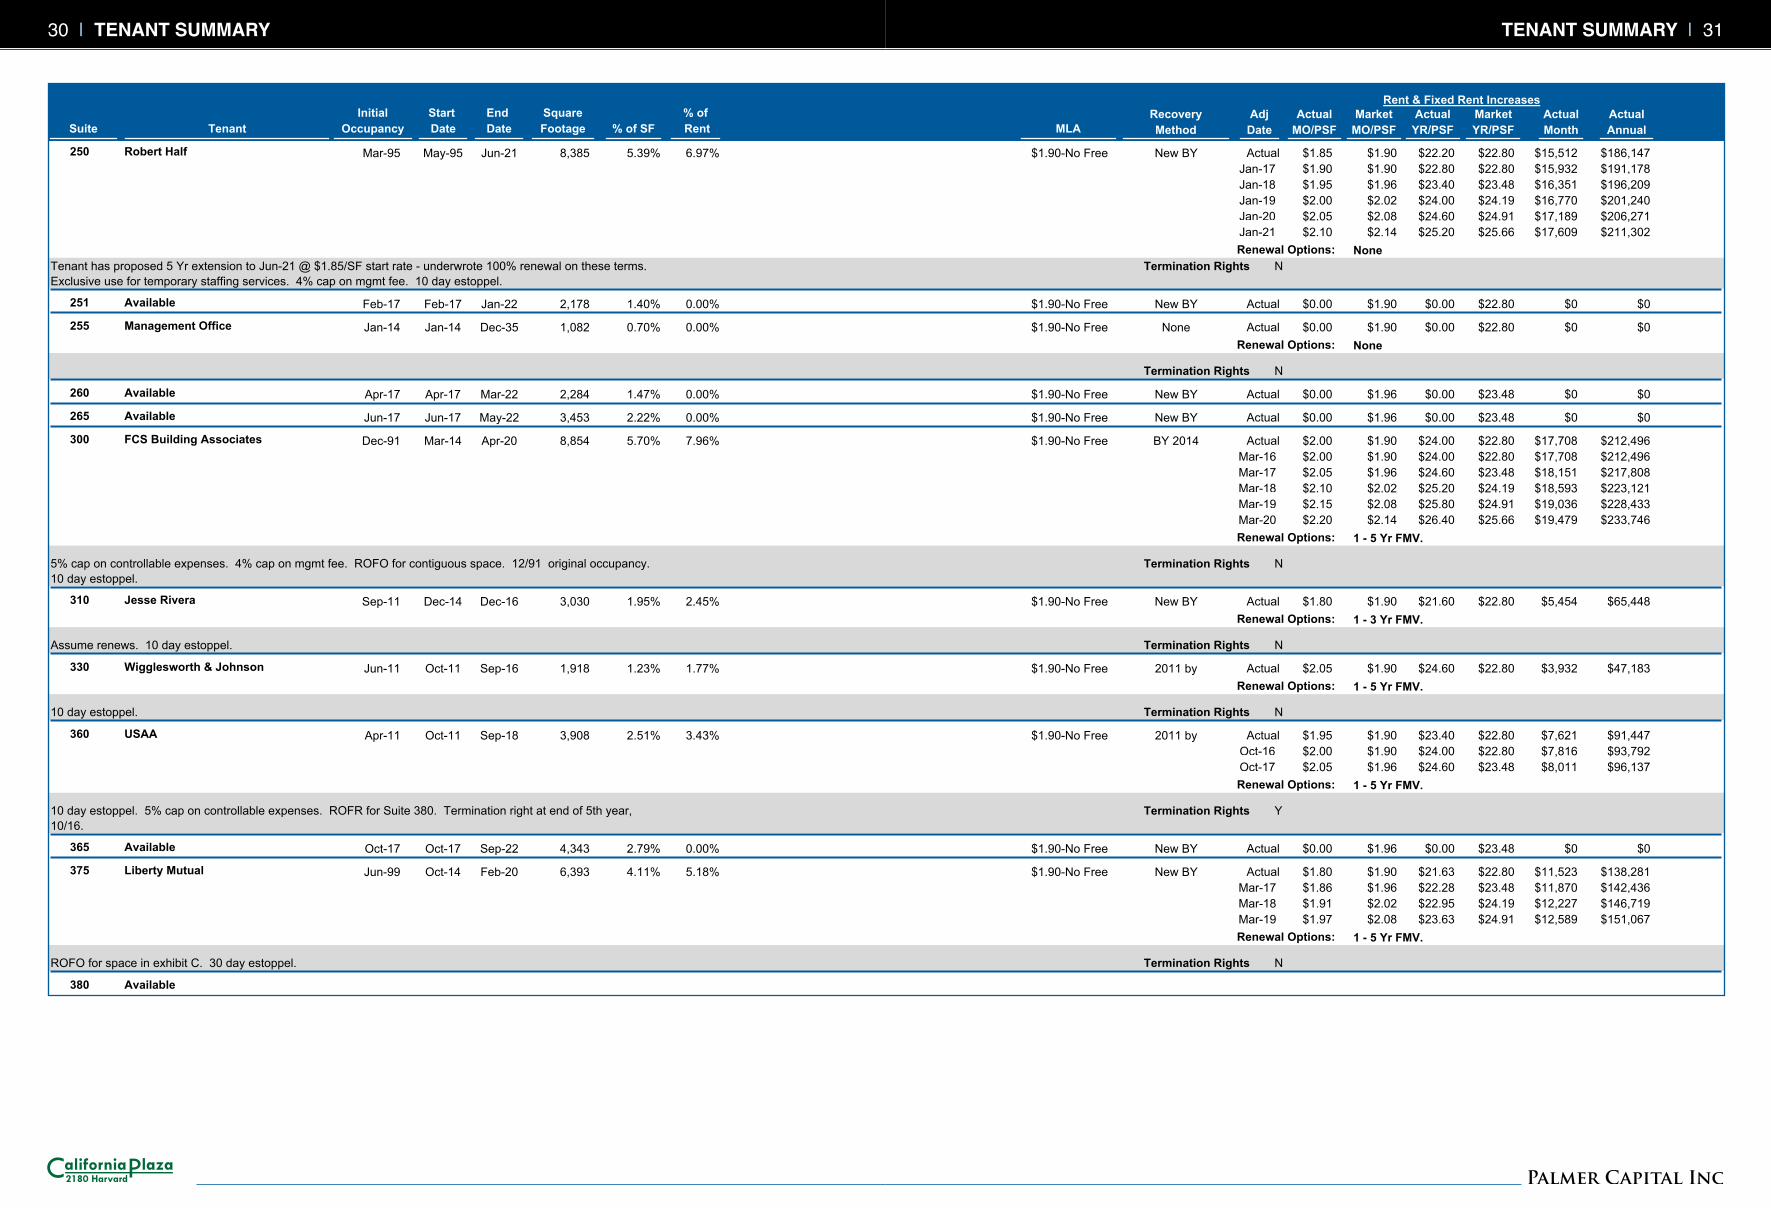
TENANT SUMMARY | 2928 | TENANT SUMMARY
TenantSuite
Rent & Fixed Rent IncreasesInitial
Occupancy
End
Date
Square
Footage % of SF
% of
Rent
Start
DateActual
Annual
Actual
Month
Market
YR/PSF
Actual
YR/PSF
Market
MO/PSF
Actual
MO/PSF
Adj
Date
Recovery
MethodMLA
Robert Half 250 Actual $1.85 $22.20$1.90 $22.80 $15,512 $186,147
Jan-17 $1.90 $22.80$1.90 $22.80 $15,932 $191,178
Jan-18 $1.95 $23.40$1.96 $23.48 $16,351 $196,209
Jan-19 $2.00 $24.00$2.02 $24.19 $16,770 $201,240
Jan-20 $2.05 $24.60$2.08 $24.91 $17,189 $206,271
Jan-21 $2.10 $25.20$2.14 $25.66 $17,609 $211,302
NoneRenewal Options:
New BY 6.97% 5.39% 8,385 Jun-21May-95Mar-95 $1.90-No Free
Tenant has proposed 5 Yr extension to Jun-21 @ $1.85/SF start rate - underwrote 100% renewal on these terms.
Exclusive use for temporary staffing services. 4% cap on mgmt fee. 10 day estoppel.
Termination Rights N
Available 251 Actual $0.00 $0.00$1.90 $22.80 $0 $0 New BY 0.00% 1.40% 2,178 Jan-22Feb-17Feb-17 $1.90-No Free
Management Office 255 Actual $0.00 $0.00$1.90 $22.80 $0 $0
NoneRenewal Options:
None 0.00% 0.70% 1,082 Dec-35Jan-14Jan-14 $1.90-No Free
Termination Rights N
Available 260 Actual $0.00 $0.00$1.96 $23.48 $0 $0 New BY 0.00% 1.47% 2,284 Mar-22Apr-17Apr-17 $1.90-No Free
Available 265 Actual $0.00 $0.00$1.96 $23.48 $0 $0 New BY 0.00% 2.22% 3,453 May-22Jun-17Jun-17 $1.90-No Free
FCS Building Associates 300 Actual $2.00 $24.00$1.90 $22.80 $17,708 $212,496
Mar-16 $2.00 $24.00$1.90 $22.80 $17,708 $212,496
Mar-17 $2.05 $24.60$1.96 $23.48 $18,151 $217,808
Mar-18 $2.10 $25.20$2.02 $24.19 $18,593 $223,121
Mar-19 $2.15 $25.80$2.08 $24.91 $19,036 $228,433
Mar-20 $2.20 $26.40$2.14 $25.66 $19,479 $233,746
1 - 5 Yr FMV.Renewal Options:
BY 2014 7.96% 5.70% 8,854 Apr-20Mar-14Dec-91 $1.90-No Free
5% cap on controllable expenses. 4% cap on mgmt fee. ROFO for contiguous space. 12/91 original occupancy.
10 day estoppel.
Termination Rights N
Jesse Rivera 310 Actual $1.80 $21.60$1.90 $22.80 $5,454 $65,448
1 - 3 Yr FMV.Renewal Options:
New BY 2.45% 1.95% 3,030 Dec-16Dec-14Sep-11 $1.90-No Free
Assume renews. 10 day estoppel. Termination Rights N
Wigglesworth & Johnson 330 Actual $2.05 $24.60$1.90 $22.80 $3,932 $47,183
1 - 5 Yr FMV.Renewal Options:
2011 by 1.77% 1.23% 1,918 Sep-16Oct-11Jun-11 $1.90-No Free
10 day estoppel. Termination Rights N
USAA 360 Actual $1.95 $23.40$1.90 $22.80 $7,621 $91,447
Oct-16 $2.00 $24.00$1.90 $22.80 $7,816 $93,792
Oct-17 $2.05 $24.60$1.96 $23.48 $8,011 $96,137
1 - 5 Yr FMV.Renewal Options:
2011 by 3.43% 2.51% 3,908 Sep-18Oct-11Apr-11 $1.90-No Free
10 day estoppel. 5% cap on controllable expenses. ROFR for Suite 380. Termination right at end of 5th year,
10/16.
Termination Rights Y
Available 365 Actual $0.00 $0.00$1.96 $23.48 $0 $0 New BY 0.00% 2.79% 4,343 Sep-22Oct-17Oct-17 $1.90-No Free
Liberty Mutual 375 Actual $1.80 $21.63$1.90 $22.80 $11,523 $138,281
Mar-17 $1.86 $22.28$1.96 $23.48 $11,870 $142,436
Mar-18 $1.91 $22.95$2.02 $24.19 $12,227 $146,719
Mar-19 $1.97 $23.63$2.08 $24.91 $12,589 $151,067
1 - 5 Yr FMV.Renewal Options:
New BY 5.18% 4.11% 6,393 Feb-20Oct-14Jun-99 $1.90-No Free
ROFO for space in exhibit C. 30 day estoppel. Termination Rights N
Available 380
TENANT SUMMARY | 3130 | TENANT SUMMARY
TenantSuite
Rent & Fixed Rent IncreasesInitial
Occupancy
End
Date
Square
Footage % of SF
% of
Rent
Start
DateActual
Annual
Actual
Month
Market
YR/PSF
Actual
YR/PSF
Market
MO/PSF
Actual
MO/PSF
Adj
Date
Recovery
MethodMLA
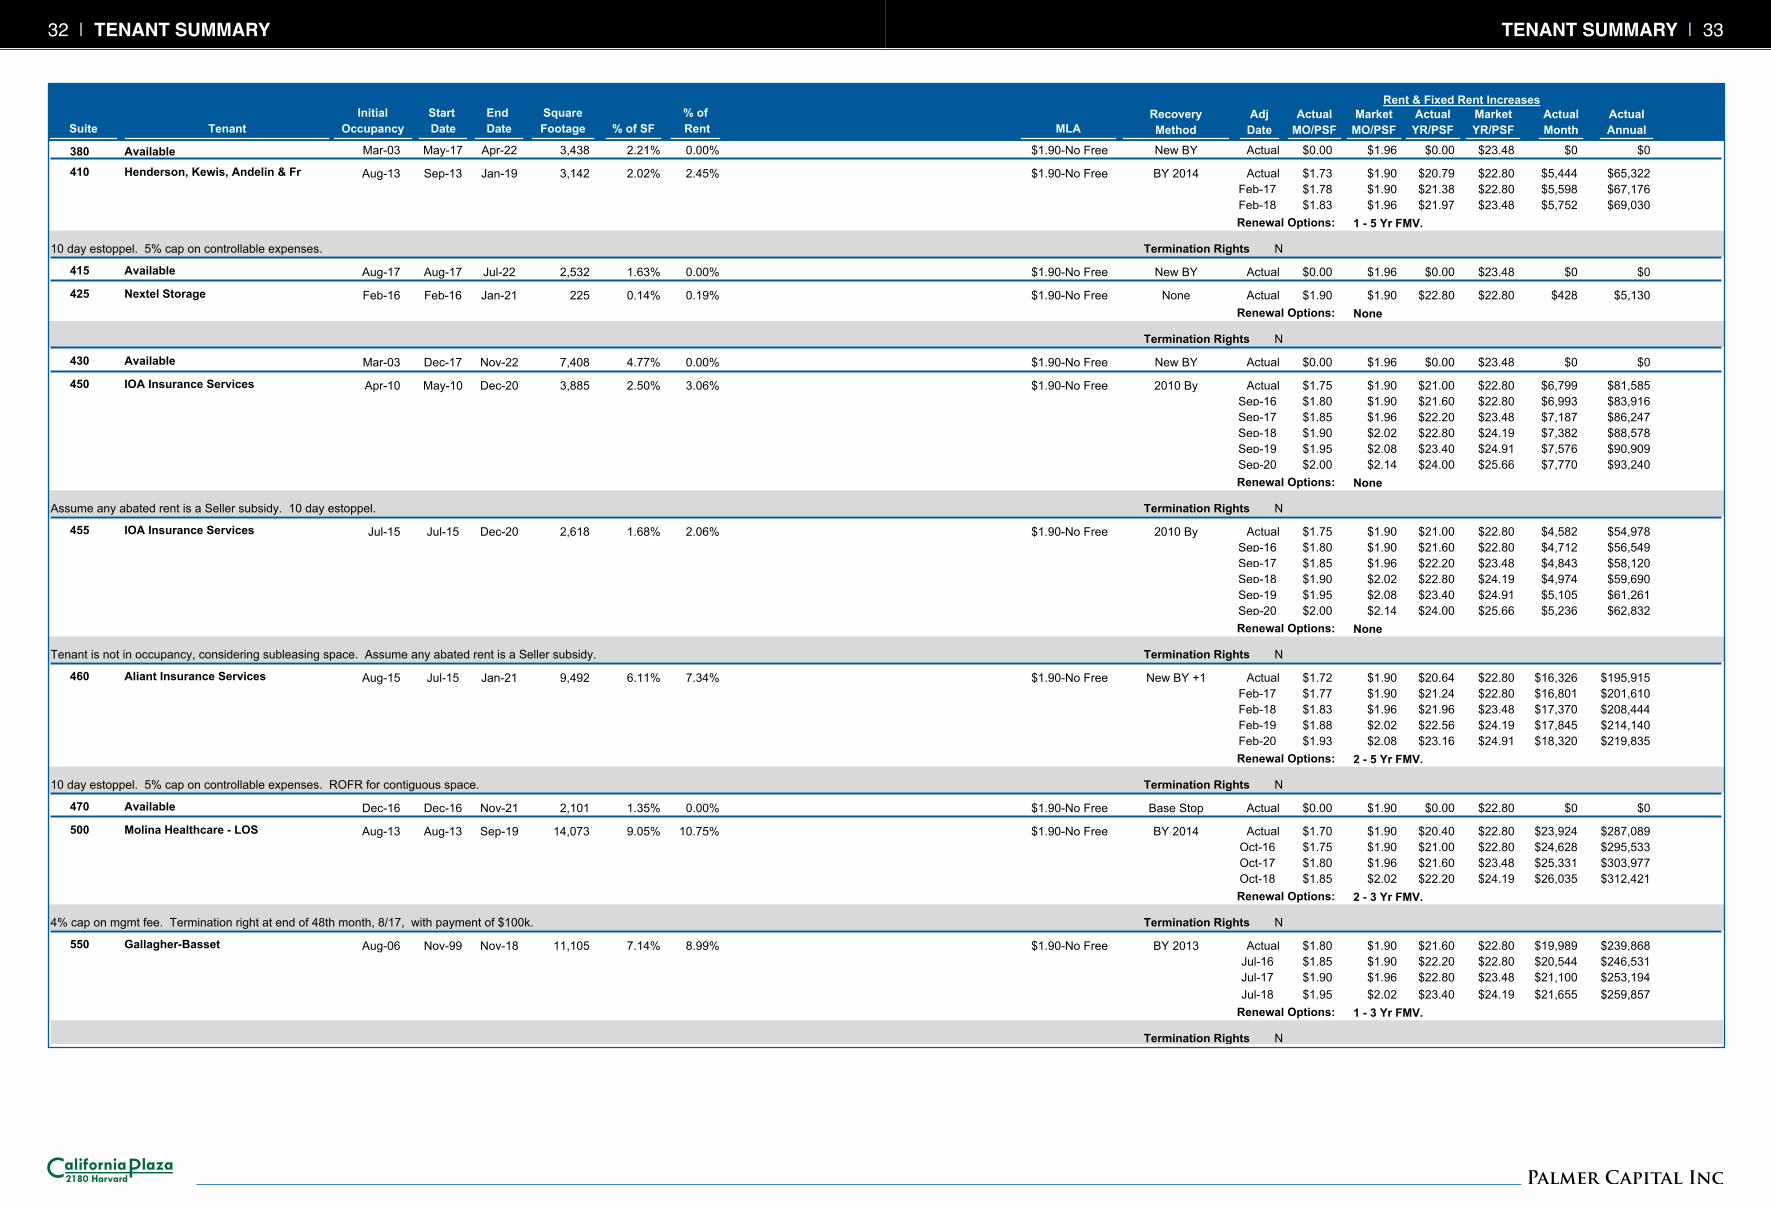
Available 380 Actual $0.00 $0.00$1.96 $23.48 $0 $0 New BY 0.00% 2.21% 3,438 Apr-22May-17Mar-03 $1.90-No Free
Henderson, Kewis, Andelin & Fr 410 Actual $1.73 $20.79$1.90 $22.80 $5,444 $65,322
Feb-17 $1.78 $21.38$1.90 $22.80 $5,598 $67,176
Feb-18 $1.83 $21.97$1.96 $23.48 $5,752 $69,030
1 - 5 Yr FMV.Renewal Options:
BY 2014 2.45% 2.02% 3,142 Jan-19Sep-13Aug-13 $1.90-No Free
10 day estoppel. 5% cap on controllable expenses. Termination Rights N
Available 415 Actual $0.00 $0.00$1.96 $23.48 $0 $0 New BY 0.00% 1.63% 2,532 Jul-22Aug-17Aug-17 $1.90-No Free
Nextel Storage 425 Actual $1.90 $22.80$1.90 $22.80 $428 $5,130
NoneRenewal Options:
None 0.19% 0.14% 225 Jan-21Feb-16Feb-16 $1.90-No Free
Termination Rights N
Available 430 Actual $0.00 $0.00$1.96 $23.48 $0 $0 New BY 0.00% 4.77% 7,408 Nov-22Dec-17Mar-03 $1.90-No Free
IOA Insurance Services 450 Actual $1.75 $21.00$1.90 $22.80 $6,799 $81,585
Sep-16 $1.80 $21.60$1.90 $22.80 $6,993 $83,916
Sep-17 $1.85 $22.20$1.96 $23.48 $7,187 $86,247
Sep-18 $1.90 $22.80$2.02 $24.19 $7,382 $88,578
Sep-19 $1.95 $23.40$2.08 $24.91 $7,576 $90,909
Sep-20 $2.00 $24.00$2.14 $25.66 $7,770 $93,240
NoneRenewal Options:
2010 By 3.06% 2.50% 3,885 Dec-20May-10Apr-10 $1.90-No Free
Assume any abated rent is a Seller subsidy. 10 day estoppel. Termination Rights N
IOA Insurance Services 455 Actual $1.75 $21.00$1.90 $22.80 $4,582 $54,978
Sep-16 $1.80 $21.60$1.90 $22.80 $4,712 $56,549
Sep-17 $1.85 $22.20$1.96 $23.48 $4,843 $58,120
Sep-18 $1.90 $22.80$2.02 $24.19 $4,974 $59,690
Sep-19 $1.95 $23.40$2.08 $24.91 $5,105 $61,261
Sep-20 $2.00 $24.00$2.14 $25.66 $5,236 $62,832
NoneRenewal Options:
2010 By 2.06% 1.68% 2,618 Dec-20Jul-15Jul-15 $1.90-No Free
Tenant is not in occupancy, considering subleasing space. Assume any abated rent is a Seller subsidy. Termination Rights N
Aliant Insurance Services 460 Actual $1.72 $20.64$1.90 $22.80 $16,326 $195,915
Feb-17 $1.77 $21.24$1.90 $22.80 $16,801 $201,610
Feb-18 $1.83 $21.96$1.96 $23.48 $17,370 $208,444
Feb-19 $1.88 $22.56$2.02 $24.19 $17,845 $214,140
Feb-20 $1.93 $23.16$2.08 $24.91 $18,320 $219,835
2 - 5 Yr FMV.Renewal Options:
New BY +1 7.34% 6.11% 9,492 Jan-21Jul-15Aug-15 $1.90-No Free
10 day estoppel. 5% cap on controllable expenses. ROFR for contiguous space. Termination Rights N
Available 470 Actual $0.00 $0.00$1.90 $22.80 $0 $0 Base Stop 0.00% 1.35% 2,101 Nov-21Dec-16Dec-16 $1.90-No Free
Molina Healthcare - LOS 500 Actual $1.70 $20.40$1.90 $22.80 $23,924 $287,089
Oct-16 $1.75 $21.00$1.90 $22.80 $24,628 $295,533
Oct-17 $1.80 $21.60$1.96 $23.48 $25,331 $303,977
Oct-18 $1.85 $22.20$2.02 $24.19 $26,035 $312,421
2 - 3 Yr FMV.Renewal Options:
BY 2014 10.75% 9.05% 14,073 Sep-19Aug-13Aug-13 $1.90-No Free
4% cap on mgmt fee. Termination right at end of 48th month, 8/17, with payment of $100k. Termination Rights N
Gallagher-Basset 550 Actual $1.80 $21.60$1.90 $22.80 $19,989 $239,868
Jul-16 $1.85 $22.20$1.90 $22.80 $20,544 $246,531
Jul-17 $1.90 $22.80$1.96 $23.48 $21,100 $253,194
BY 2013 8.99% 7.14% 11,105 Nov-18Nov-99Aug-06 $1.90-No Free
TenantSuite
Rent & Fixed Rent IncreasesInitial
Occupancy
End
Date
Square
Footage % of SF
% of
Rent
Start
DateActual
Annual
Actual
Month
Market
YR/PSF
Actual
YR/PSF
Market
MO/PSF
Actual
MO/PSF
Adj
Date
Recovery
MethodMLA
Gallagher-Basset 550 Jul-18 $1.95 $23.40$2.02 $24.19 $21,655 $259,857
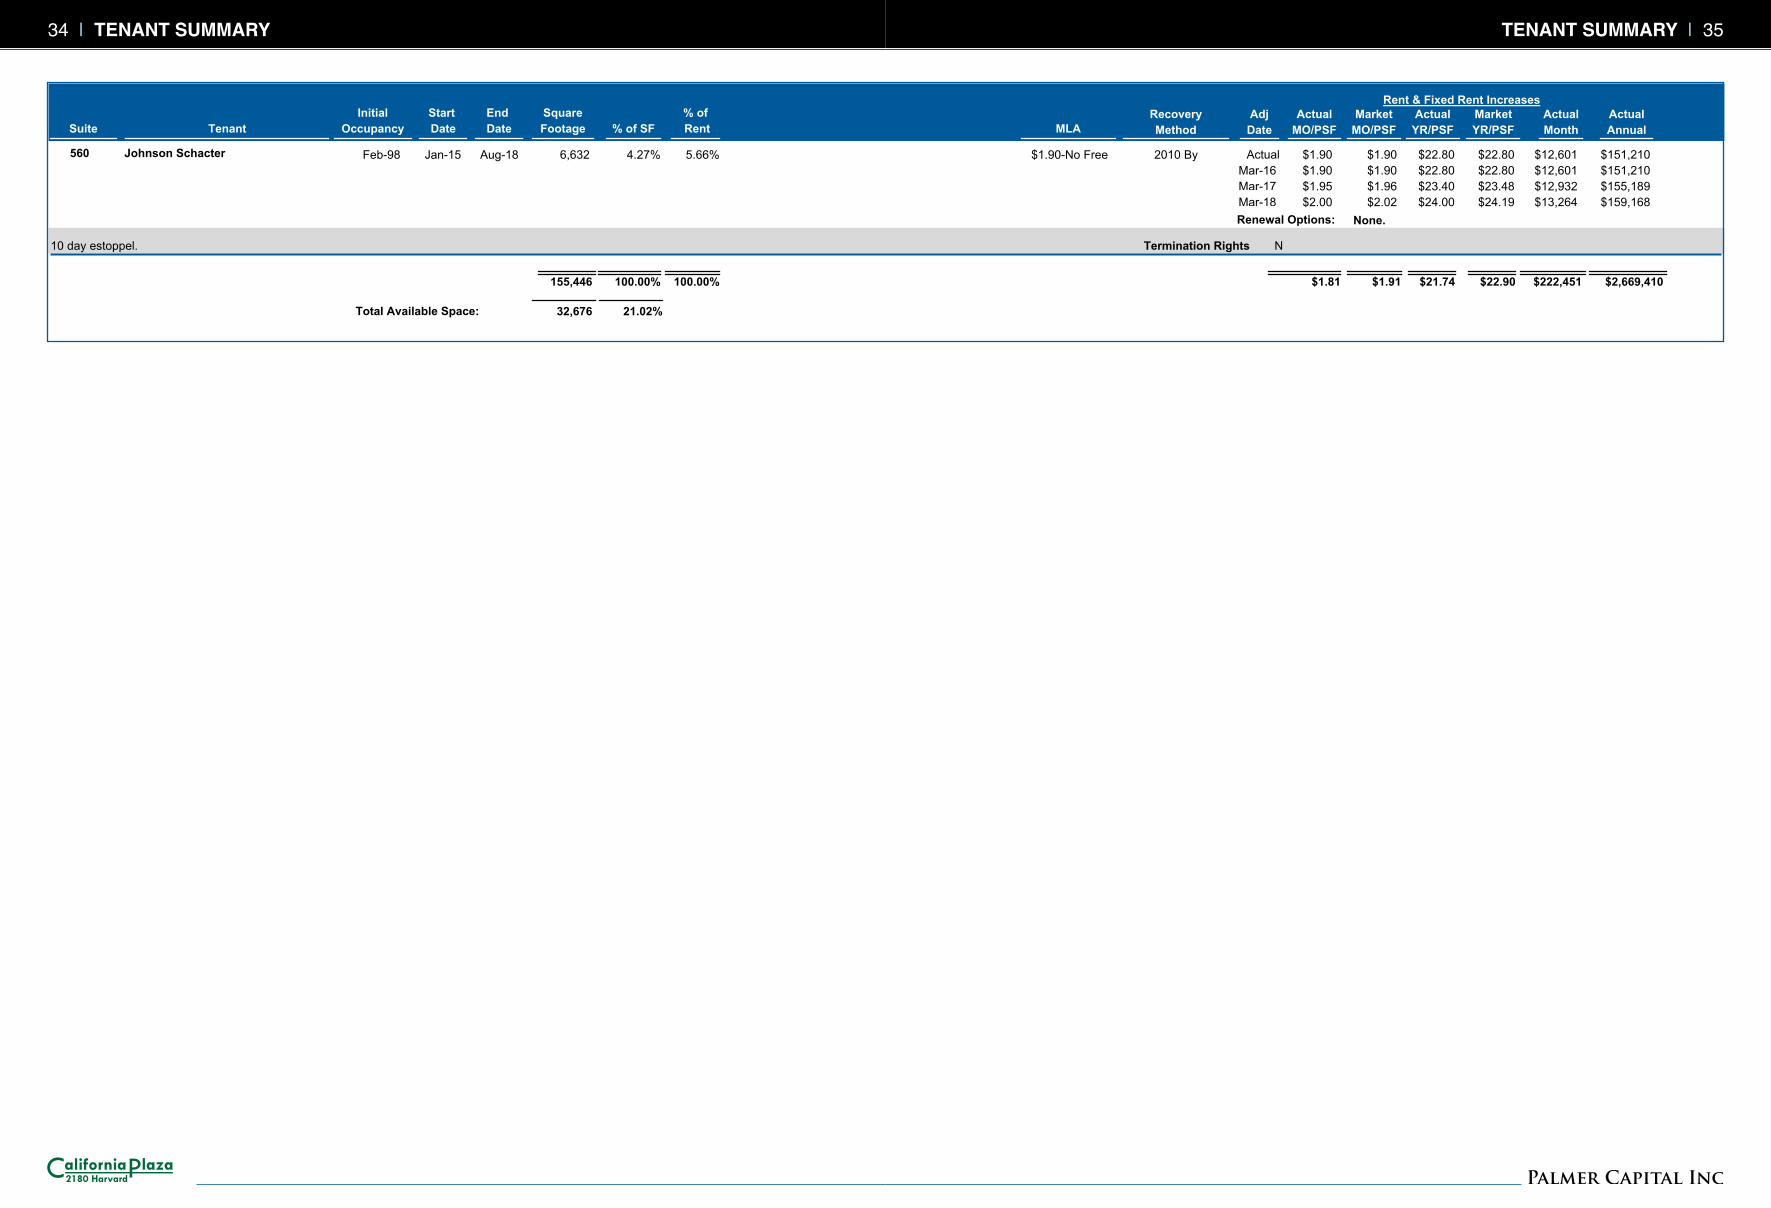
1 - 3 Yr FMV.Renewal Options:
Termination Rights N
Johnson Schacter 560 Actual $1.90 $22.80$1.90 $22.80 $12,601 $151,210
Mar-16 $1.90 $22.80$1.90 $22.80 $12,601 $151,210
Mar-17 $1.95 $23.40$1.96 $23.48 $12,932 $155,189
Mar-18 $2.00 $24.00$2.02 $24.19 $13,264 $159,168
None.Renewal Options:
2010 By 5.66% 4.27% 6,632 Aug-18Jan-15Feb-98 $1.90-No Free
10 day estoppel. Termination Rights N
Total Available Space:
100.00% 100.00% $1.81 $1.91
32,676
$21.74 $22.90 155,446
21.02%
$222,451 $2,669,410
TENANT SUMMARY | 3332 | TENANT SUMMARY
TenantSuite
Rent & Fixed Rent IncreasesInitial
Occupancy
End
Date
Square
Footage % of SF
% of
Rent
Start
DateActual
Annual
Actual
Month
Market
YR/PSF
Actual
YR/PSF
Market
MO/PSF
Actual
MO/PSF
Adj
Date
Recovery
MethodMLA
Gallagher-Basset 550 Jul-18 $1.95 $23.40$2.02 $24.19 $21,655 $259,857
1 - 3 Yr FMV.Renewal Options:
Termination Rights N
Johnson Schacter 560 Actual $1.90 $22.80$1.90 $22.80 $12,601 $151,210
Mar-16 $1.90 $22.80$1.90 $22.80 $12,601 $151,210
Mar-17 $1.95 $23.40$1.96 $23.48 $12,932 $155,189
Mar-18 $2.00 $24.00$2.02 $24.19 $13,264 $159,168
None.Renewal Options:
2010 By 5.66% 4.27% 6,632 Aug-18Jan-15Feb-98 $1.90-No Free
10 day estoppel. Termination Rights N
Total Available Space:
100.00% 100.00% $1.81 $1.91
32,676
$21.74 $22.90 155,446
21.02%
$222,451 $2,669,410
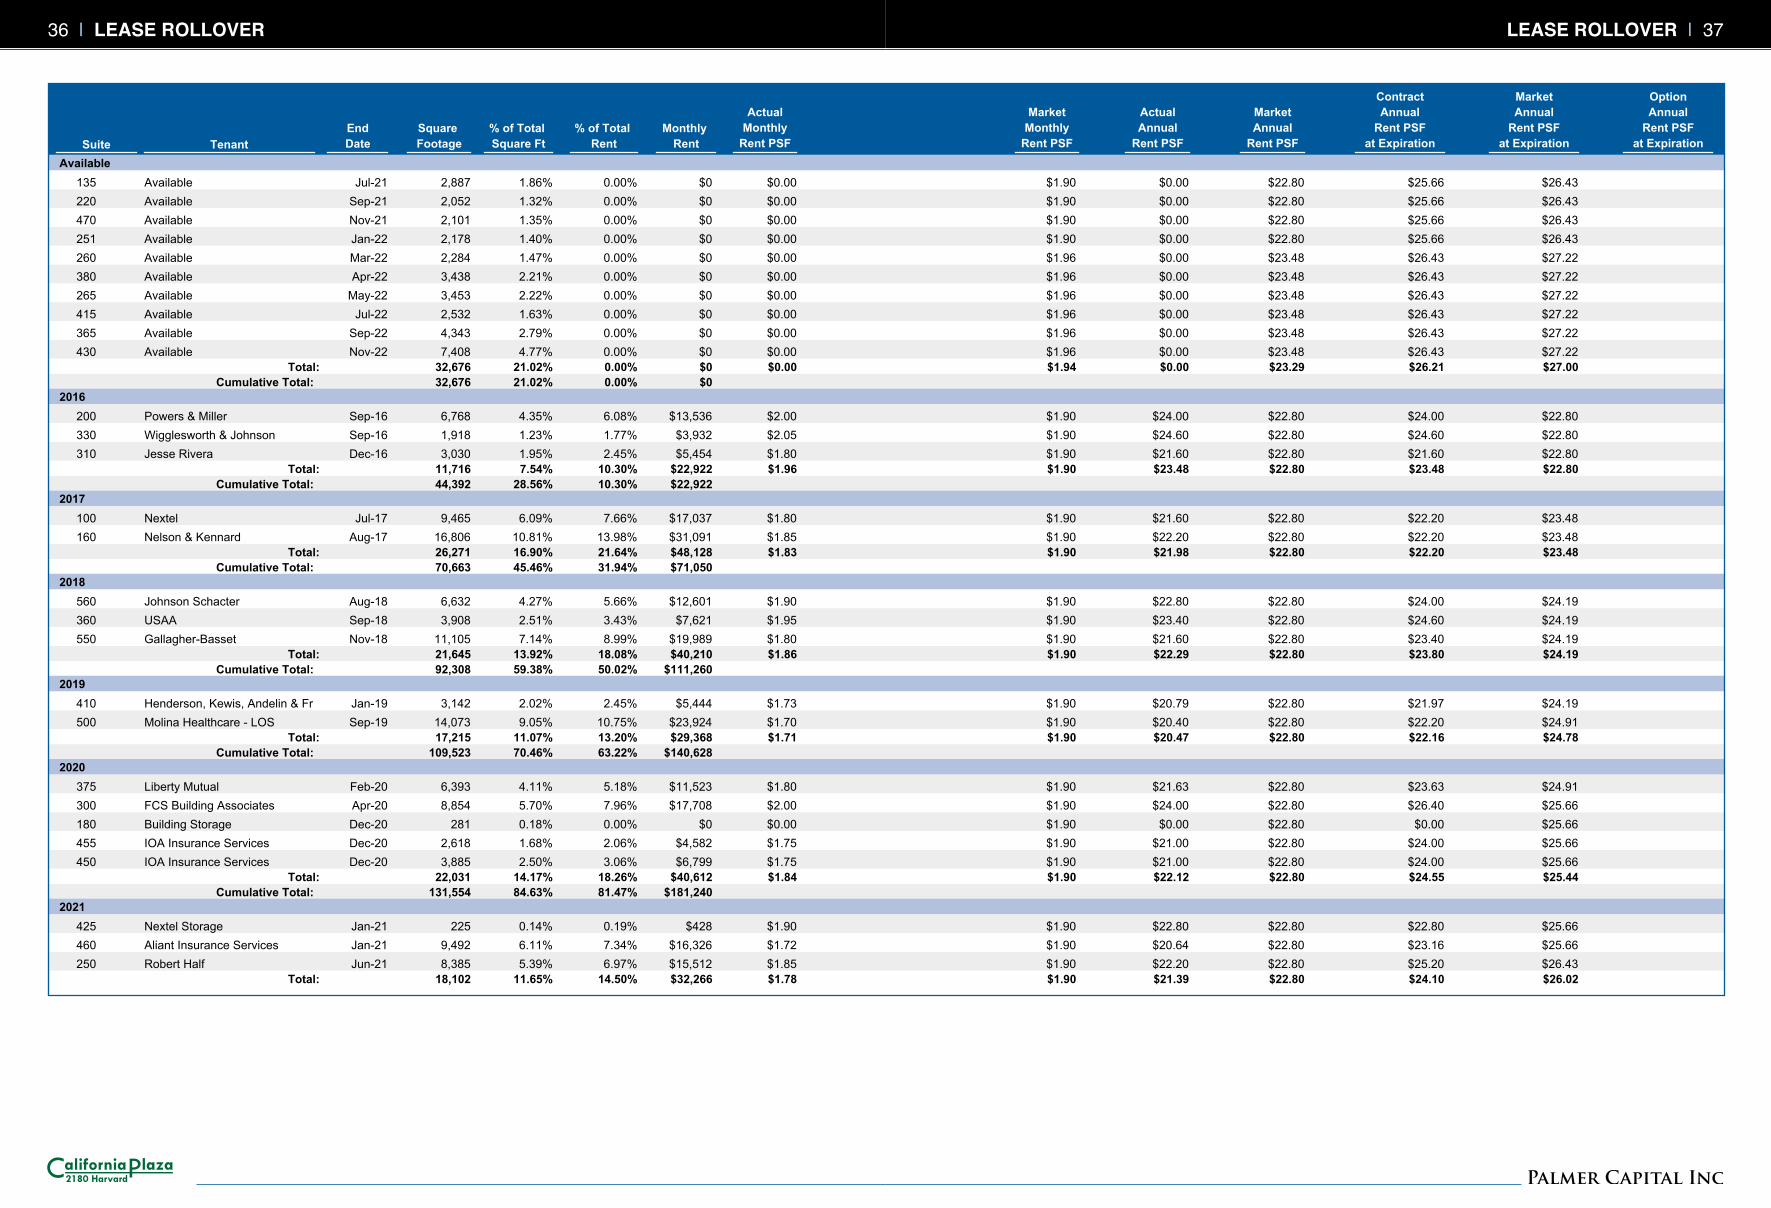
TENANT SUMMARY | 3534 | TENANT SUMMARY
TenantSuite
% of Total
Rent
Square
Footage
End
Date
Monthly
Rent
% of Total
Square Ft
Contract
Annual
Rent PSF
at Expiration
Market
Annual
Rent PSF
at Expiration
Option
Annual
Rent PSF
at Expiration
Market
Annual
Rent PSF
Actual
Monthly
Rent PSF
Actual
Annual
Rent PSF
Market
Monthly
Rent PSF
Available
135 Available 2,887 0.00% $1.90Jul-21 1.86% $0 $22.80 $26.43$0.00 $0.00 $25.66
220 Available 2,052 0.00% $1.90Sep-21 1.32% $0 $22.80 $26.43$0.00 $0.00 $25.66
470 Available 2,101 0.00% $1.90Nov-21 1.35% $0 $22.80 $26.43$0.00 $0.00 $25.66
251 Available 2,178 0.00% $1.90Jan-22 1.40% $0 $22.80 $26.43$0.00 $0.00 $25.66
260 Available 2,284 0.00% $1.96Mar-22 1.47% $0 $23.48 $27.22$0.00 $0.00 $26.43
380 Available 3,438 0.00% $1.96Apr-22 2.21% $0 $23.48 $27.22$0.00 $0.00 $26.43
265 Available 3,453 0.00% $1.96May-22 2.22% $0 $23.48 $27.22$0.00 $0.00 $26.43
415 Available 2,532 0.00% $1.96Jul-22 1.63% $0 $23.48 $27.22$0.00 $0.00 $26.43
365 Available 4,343 0.00% $1.96Sep-22 2.79% $0 $23.48 $27.22$0.00 $0.00 $26.43
430 Available 7,408 0.00% $1.96Nov-22 4.77% $0 $23.48 $27.22$0.00 $0.00 $26.43
32,676 0.00% $1.94 21.02% $0 $23.29 $27.00Total: $0.00 $0.00 $26.21
32,676 0.00% 21.02% $0 Cumulative Total:
2016
200 Powers & Miller 6,768 6.08% $1.90Sep-16 4.35% $13,536 $22.80 $22.80$2.00 $24.00 $24.00
330 Wigglesworth & Johnson 1,918 1.77% $1.90Sep-16 1.23% $3,932 $22.80 $22.80$2.05 $24.60 $24.60
310 Jesse Rivera 3,030 2.45% $1.90Dec-16 1.95% $5,454 $22.80 $22.80$1.80 $21.60 $21.60
11,716 10.30% $1.90 7.54% $22,922 $22.80 $22.80Total: $1.96 $23.48 $23.48
44,392 10.30% 28.56% $22,922 Cumulative Total:
2017
100 Nextel 9,465 7.66% $1.90Jul-17 6.09% $17,037 $22.80 $23.48$1.80 $21.60 $22.20
160 Nelson & Kennard 16,806 13.98% $1.90Aug-17 10.81% $31,091 $22.80 $23.48$1.85 $22.20 $22.20
26,271 21.64% $1.90 16.90% $48,128 $22.80 $23.48Total: $1.83 $21.98 $22.20
70,663 31.94% 45.46% $71,050 Cumulative Total:
2018
560 Johnson Schacter 6,632 5.66% $1.90Aug-18 4.27% $12,601 $22.80 $24.19$1.90 $22.80 $24.00
360 USAA 3,908 3.43% $1.90Sep-18 2.51% $7,621 $22.80 $24.19$1.95 $23.40 $24.60
550 Gallagher-Basset 11,105 8.99% $1.90Nov-18 7.14% $19,989 $22.80 $24.19$1.80 $21.60 $23.40
21,645 18.08% $1.90 13.92% $40,210 $22.80 $24.19Total: $1.86 $22.29 $23.80
92,308 50.02% 59.38% $111,260 Cumulative Total:
2019
410 Henderson, Kewis, Andelin & Fr 3,142 2.45% $1.90Jan-19 2.02% $5,444 $22.80 $24.19$1.73 $20.79 $21.97
500 Molina Healthcare - LOS 14,073 10.75% $1.90Sep-19 9.05% $23,924 $22.80 $24.91$1.70 $20.40 $22.20
17,215 13.20% $1.90 11.07% $29,368 $22.80 $24.78Total: $1.71 $20.47 $22.16
109,523 63.22% 70.46% $140,628 Cumulative Total:
2020
375 Liberty Mutual 6,393 5.18% $1.90Feb-20 4.11% $11,523 $22.80 $24.91$1.80 $21.63 $23.63
300 FCS Building Associates 8,854 7.96% $1.90Apr-20 5.70% $17,708 $22.80 $25.66$2.00 $24.00 $26.40
180 Building Storage 281 0.00% $1.90Dec-20 0.18% $0 $22.80 $25.66$0.00 $0.00 $0.00
455 IOA Insurance Services 2,618 2.06% $1.90Dec-20 1.68% $4,582 $22.80 $25.66$1.75 $21.00 $24.00
450 IOA Insurance Services 3,885 3.06% $1.90Dec-20 2.50% $6,799 $22.80 $25.66$1.75 $21.00 $24.00
22,031 18.26% $1.90 14.17% $40,612 $22.80 $25.44Total: $1.84 $22.12 $24.55
131,554 81.47% 84.63% $181,240 Cumulative Total:
2021
425 Nextel Storage 225 0.19% $1.90Jan-21 0.14% $428 $22.80 $25.66$1.90 $22.80 $22.80
460 Aliant Insurance Services 9,492 7.34% $1.90Jan-21 6.11% $16,326 $22.80 $25.66$1.72 $20.64 $23.16
250 Robert Half 8,385 6.97% $1.90Jun-21 5.39% $15,512 $22.80 $26.43$1.85 $22.20 $25.20
18,102 14.50% $1.90 11.65% $32,266 $22.80 $26.02Total: $1.78 $21.39 $24.10
LEASE ROLLOVER | 3736 | LEASE ROLLOVER
TenantSuite
% of Total
Rent
Square
Footage
End
Date
Monthly
Rent
% of Total
Square Ft
Contract
Annual
Rent PSF
at Expiration
Market
Annual
Rent PSF
at Expiration
Option
Annual
Rent PSF
at Expiration
Market
Annual
Rent PSF
Actual
Monthly
Rent PSF
Actual
Annual
Rent PSF
Market
Monthly
Rent PSF
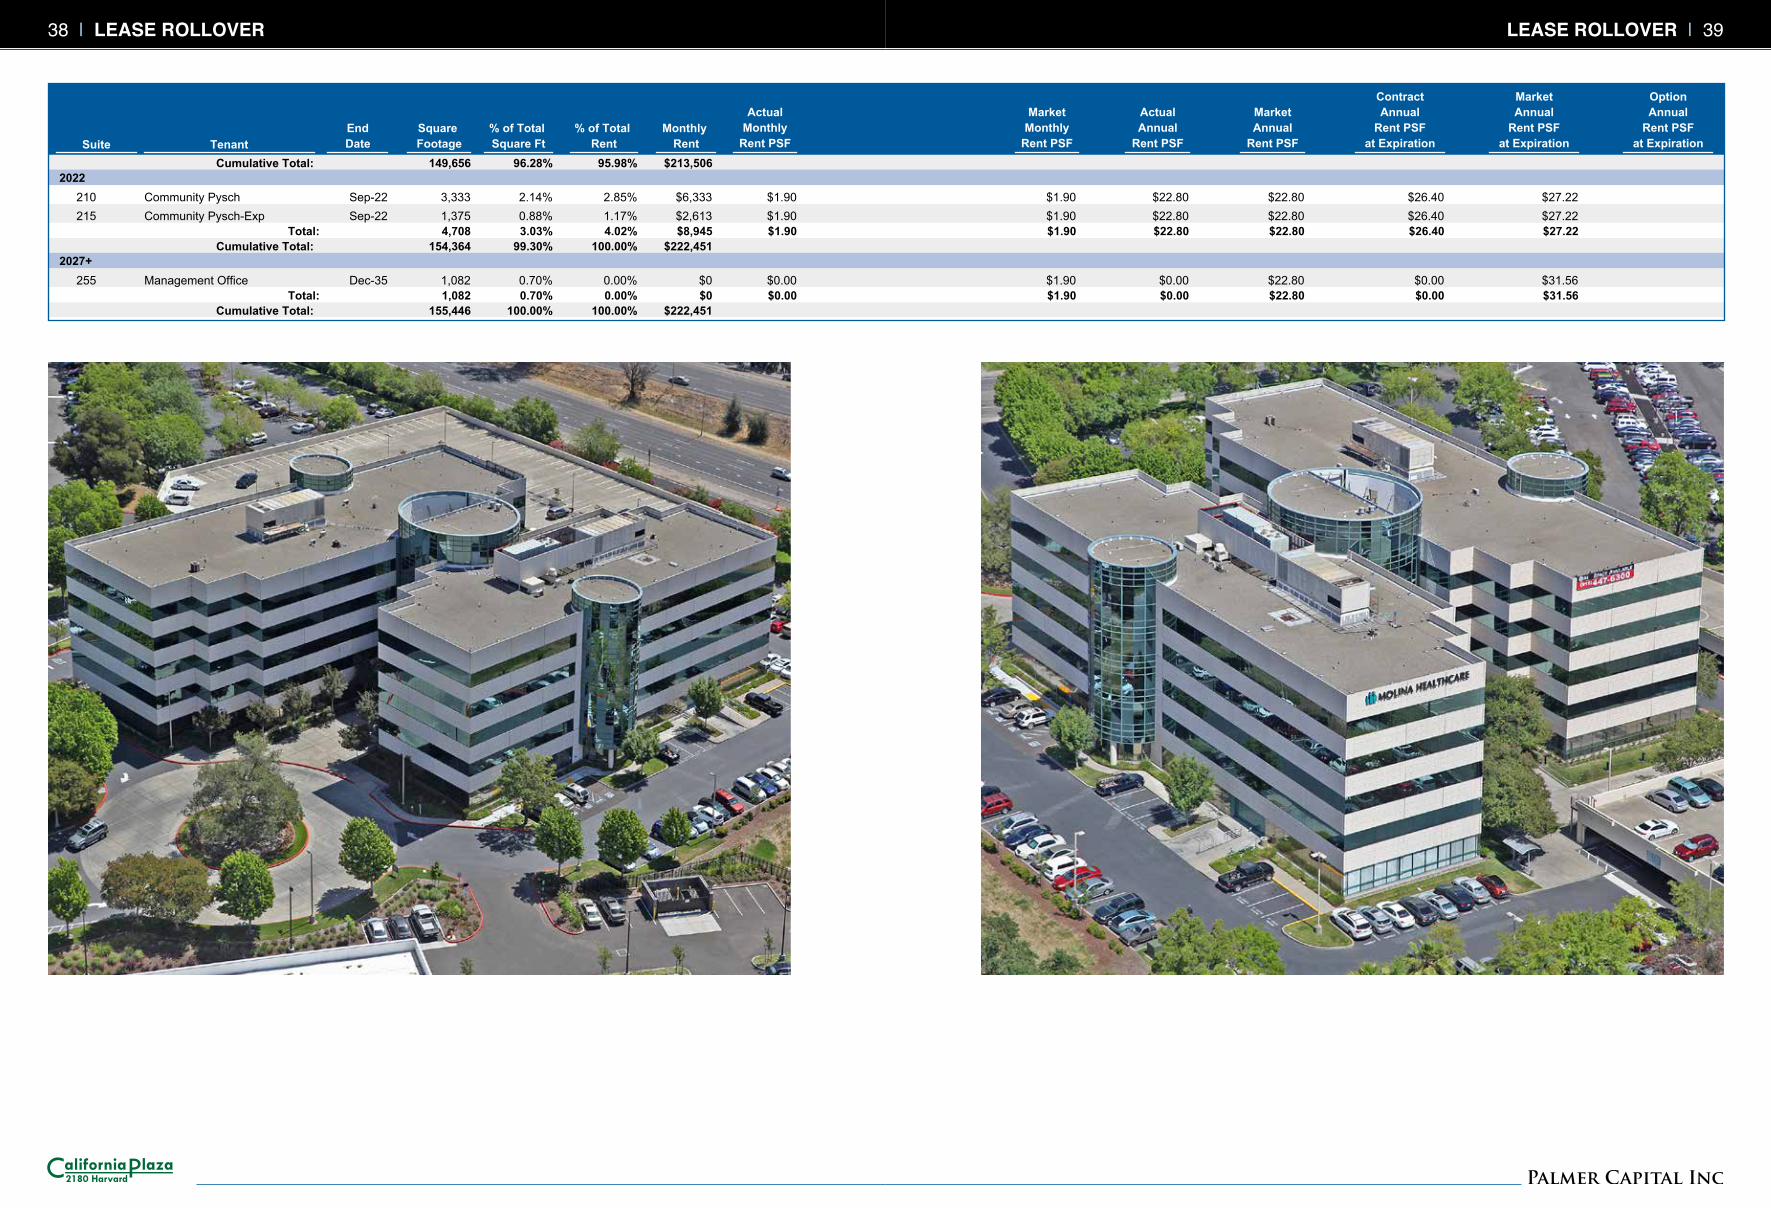
149,656 95.98% 96.28% $213,506 Cumulative Total:
2022
210 Community Pysch 3,333 2.85% $1.90Sep-22 2.14% $6,333 $22.80 $27.22$1.90 $22.80 $26.40
215 Community Pysch-Exp 1,375 1.17% $1.90Sep-22 0.88% $2,613 $22.80 $27.22$1.90 $22.80 $26.40
4,708 4.02% $1.90 3.03% $8,945 $22.80 $27.22Total: $1.90 $22.80 $26.40
154,364 100.00% 99.30% $222,451 Cumulative Total:
2027+
255 Management Office 1,082 0.00% $1.90Dec-35 0.70% $0 $22.80 $31.56$0.00 $0.00 $0.00
1,082 0.00% $1.90 0.70% $0 $22.80 $31.56Total: $0.00 $0.00 $0.00
155,446 100.00% 100.00% $222,451 Cumulative Total:
LEASE ROLLOVER | 3938 | LEASE ROLLOVER
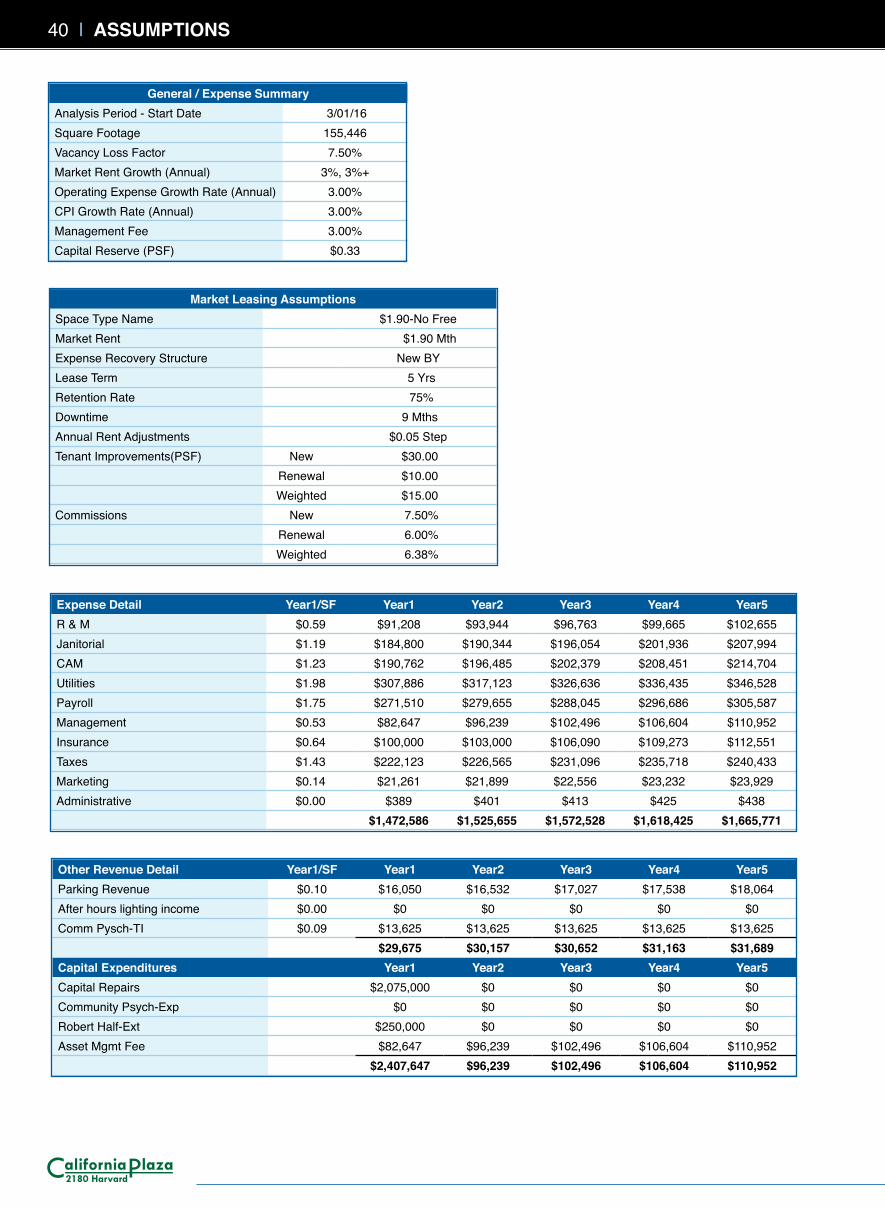
Market Leasing AssumptionsSpace Type Name $1.90-No FreeMarket Rent $1.90 MthExpense Recovery Structure New BYLease Term 5 YrsRetention Rate 75%Downtime 9 MthsAnnual Rent Adjustments $0.05 StepTenant Improvements(PSF) New $30.00
Renewal $10.00Weighted $15.00
Commissions New 7.50%Renewal 6.00%Weighted 6.38%
Expense Detail Year1/SF Year1 Year2 Year3 Year4 Year5R & M $0.59 $91,208 $93,944 $96,763 $99,665 $102,655Janitorial $1.19 $184,800 $190,344 $196,054 $201,936 $207,994CAM $1.23 $190,762 $196,485 $202,379 $208,451 $214,704Utilities $1.98 $307,886 $317,123 $326,636 $336,435 $346,528Payroll $1.75 $271,510 $279,655 $288,045 $296,686 $305,587Management $0.53 $82,647 $96,239 $102,496 $106,604 $110,952Insurance $0.64 $100,000 $103,000 $106,090 $109,273 $112,551Taxes $1.43 $222,123 $226,565 $231,096 $235,718 $240,433Marketing $0.14 $21,261 $21,899 $22,556 $23,232 $23,929Administrative $0.00 $389 $401 $413 $425 $438
$1,472,586 $1,525,655 $1,572,528 $1,618,425 $1,665,771
Other Revenue Detail Year1/SF Year1 Year2 Year3 Year4 Year5Parking Revenue $0.10 $16,050 $16,532 $17,027 $17,538 $18,064After hours lighting income $0.00 $0 $0 $0 $0 $0Comm Pysch-TI $0.09 $13,625 $13,625 $13,625 $13,625 $13,625
$29,675 $30,157 $30,652 $31,163 $31,689Capital Expenditures Year1 Year2 Year3 Year4 Year5Capital Repairs $2,075,000 $0 $0 $0 $0Community Psych-Exp $0 $0 $0 $0 $0Robert Half-Ext $250,000 $0 $0 $0 $0Asset Mgmt Fee $82,647 $96,239 $102,496 $106,604 $110,952
$2,407,647 $96,239 $102,496 $106,604 $110,952
General / Expense SummaryAnalysis Period - Start Date 3/01/16Square Footage 155,446 Vacancy Loss Factor 7.50%Market Rent Growth (Annual) 3%, 3%+Operating Expense Growth Rate (Annual) 3.00%CPI Growth Rate (Annual) 3.00%Management Fee 3.00%Capital Reserve (PSF) $0.33
40 | ASSUMPTIONS
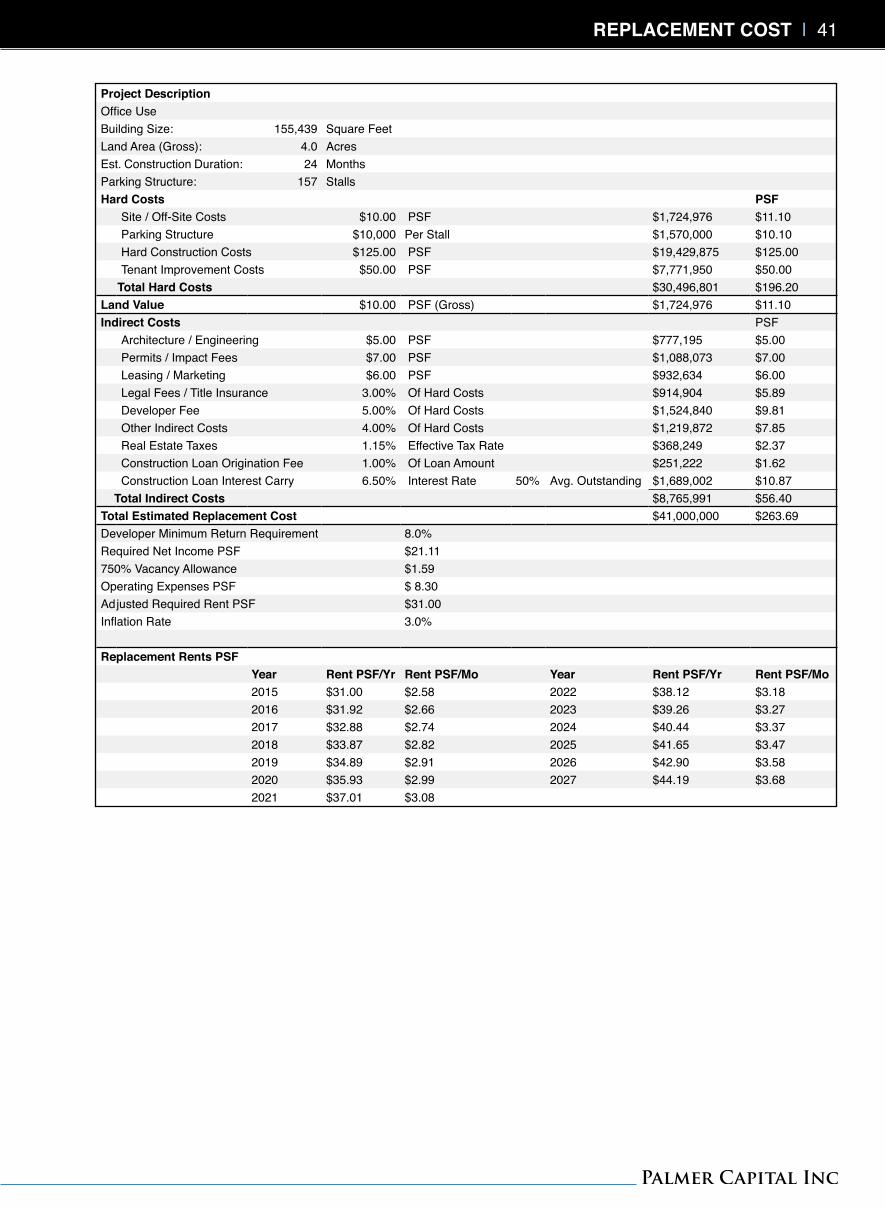
Project DescriptionOffice UseBuilding Size: 155,439 Square FeetLand Area (Gross): 4.0 AcresEst. Construction Duration: 24 MonthsParking Structure: 157 StallsHard Costs PSF
Site / Off-Site Costs $10.00 PSF $1,724,976 $11.10Parking Structure $10,000 Per Stall $1,570,000 $10.10Hard Construction Costs $125.00 PSF $19,429,875 $125.00 Tenant Improvement Costs $50.00 PSF $7,771,950 $50.00
Total Hard Costs $30,496,801 $196.20 Land Value $10.00 PSF (Gross) $1,724,976 $11.10Indirect Costs PSF
Architecture / Engineering $5.00 PSF $777,195 $5.00 Permits / Impact Fees $7.00 PSF $1,088,073 $7.00 Leasing / Marketing $6.00 PSF $932,634 $6.00 Legal Fees / Title Insurance 3.00% Of Hard Costs $914,904 $5.89 Developer Fee 5.00% Of Hard Costs $1,524,840 $9.81 Other Indirect Costs 4.00% Of Hard Costs $1,219,872 $7.85 Real Estate Taxes 1.15% Effective Tax Rate $368,249 $2.37 Construction Loan Origination Fee 1.00% Of Loan Amount $251,222 $1.62 Construction Loan Interest Carry 6.50% Interest Rate 50% Avg. Outstanding $1,689,002 $10.87
Total Indirect Costs $8,765,991 $56.40 Total Estimated Replacement Cost $41,000,000 $263.69 Developer Minimum Return Requirement 8.0%Required Net Income PSF $21.11 750% Vacancy Allowance $1.59Operating Expenses PSF $ 8.30Adjusted Required Rent PSF $31.00Inflation Rate 3.0%
Replacement Rents PSFYear Rent PSF/Yr Rent PSF/Mo Year Rent PSF/Yr Rent PSF/Mo2015 $31.00 $2.58 2022 $38.12 $3.182016 $31.92 $2.66 2023 $39.26 $3.272017 $32.88 $2.74 2024 $40.44 $3.372018 $33.87 $2.82 2025 $41.65 $3.472019 $34.89 $2.91 2026 $42.90 $3.582020 $35.93 $2.99 2027 $44.19 $3.682021 $37.01 $3.08
REPLACEMENT COST | 41
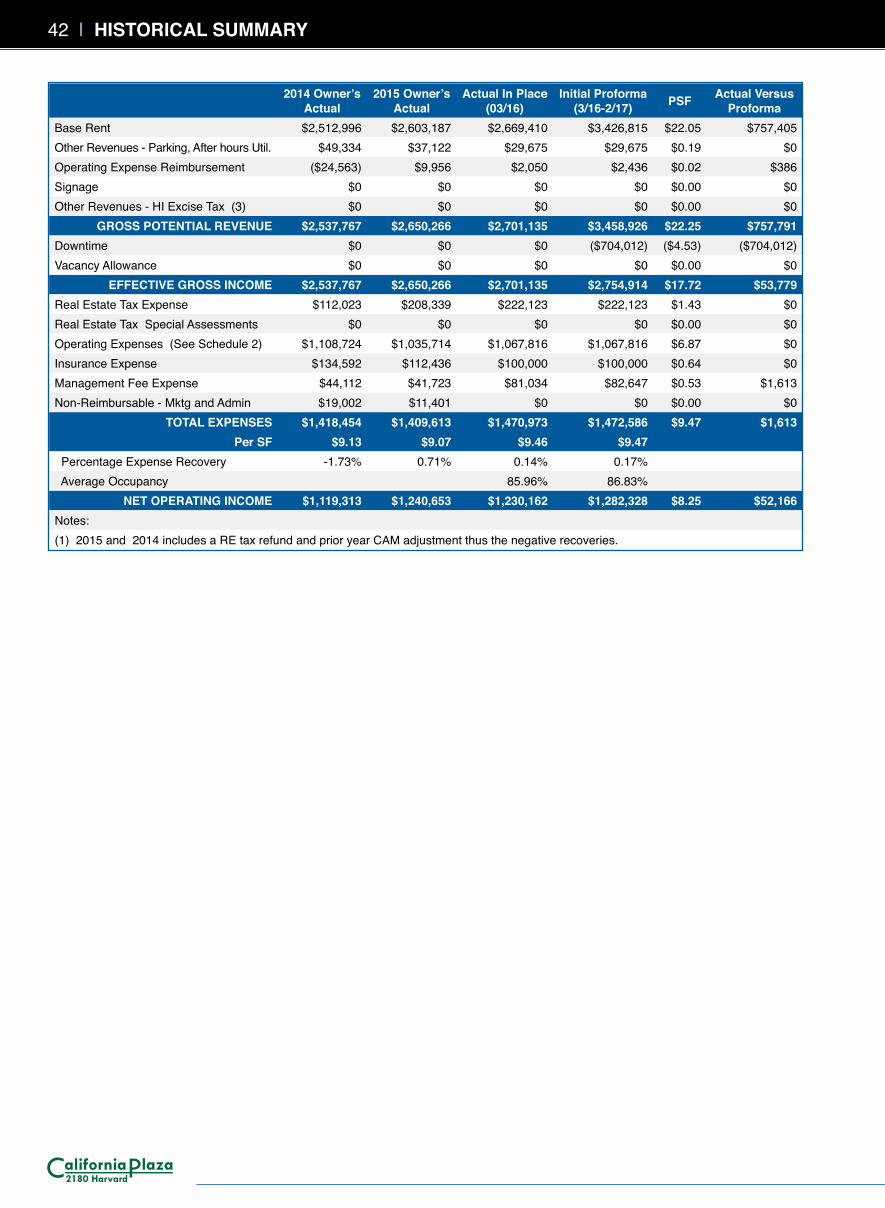
2014 Owner’s Actual
2015 Owner’s Actual
Actual In Place (03/16)
Initial Proforma (3/16-2/17) PSF Actual Versus
ProformaBase Rent $2,512,996 $2,603,187 $2,669,410 $3,426,815 $22.05 $757,405 Other Revenues - Parking, After hours Util. $49,334 $37,122 $29,675 $29,675 $0.19 $0 Operating Expense Reimbursement ($24,563) $9,956 $2,050 $2,436 $0.02 $386 Signage $0 $0 $0 $0 $0.00 $0 Other Revenues - HI Excise Tax (3) $0 $0 $0 $0 $0.00 $0
GROSS POTENTIAL REVENUE $2,537,767 $2,650,266 $2,701,135 $3,458,926 $22.25 $757,791 Downtime $0 $0 $0 ($704,012) ($4.53) ($704,012)Vacancy Allowance $0 $0 $0 $0 $0.00 $0
EFFECTIVE GROSS INCOME $2,537,767 $2,650,266 $2,701,135 $2,754,914 $17.72 $53,779 Real Estate Tax Expense $112,023 $208,339 $222,123 $222,123 $1.43 $0 Real Estate Tax Special Assessments $0 $0 $0 $0 $0.00 $0 Operating Expenses (See Schedule 2) $1,108,724 $1,035,714 $1,067,816 $1,067,816 $6.87 $0 Insurance Expense $134,592 $112,436 $100,000 $100,000 $0.64 $0 Management Fee Expense $44,112 $41,723 $81,034 $82,647 $0.53 $1,613 Non-Reimbursable - Mktg and Admin $19,002 $11,401 $0 $0 $0.00 $0
TOTAL EXPENSES $1,418,454 $1,409,613 $1,470,973 $1,472,586 $9.47 $1,613 Per SF $9.13 $9.07 $9.46 $9.47
Percentage Expense Recovery -1.73% 0.71% 0.14% 0.17% Average Occupancy 85.96% 86.83%
NET OPERATING INCOME $1,119,313 $1,240,653 $1,230,162 $1,282,328 $8.25 $52,166 Notes:(1) 2015 and 2014 includes a RE tax refund and prior year CAM adjustment thus the negative recoveries.
42 | HISTORICAL SUMMARY
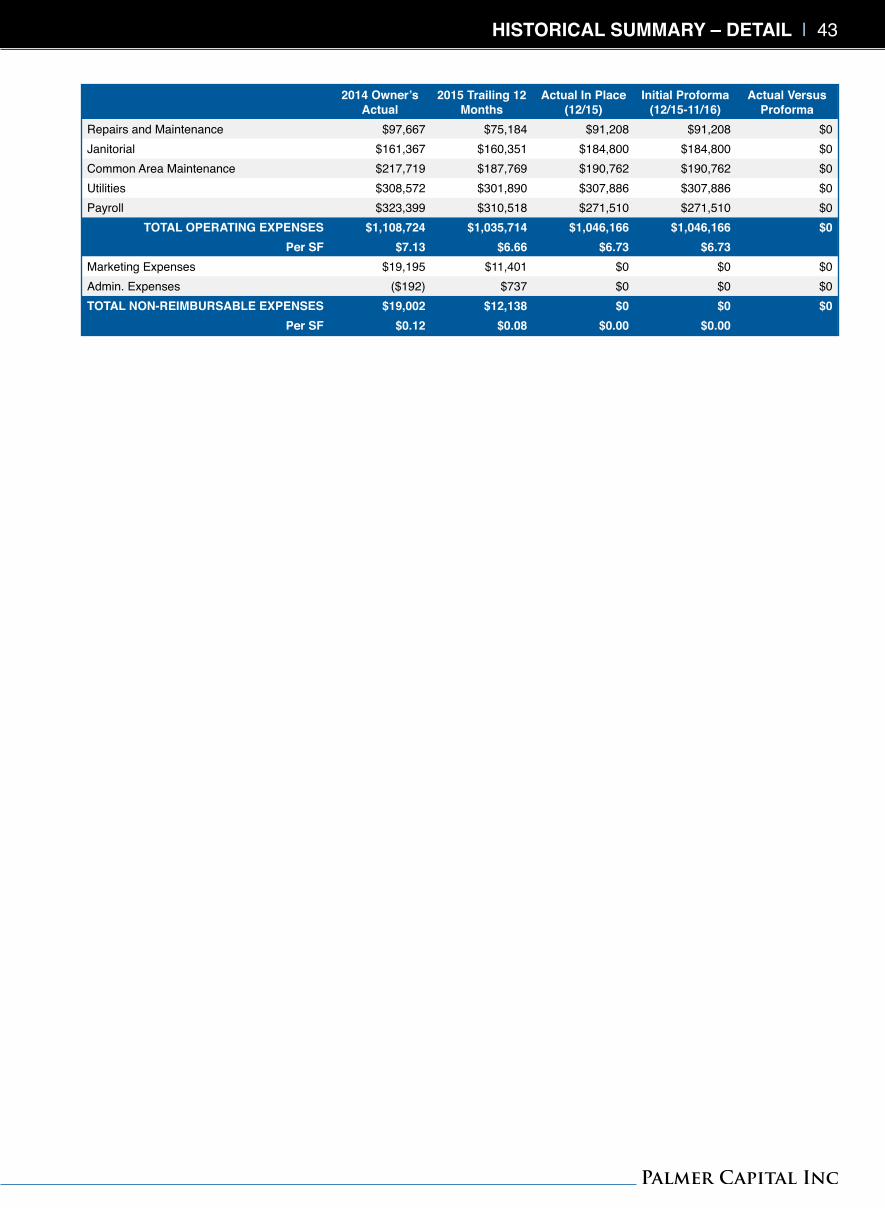
2014 Owner’s Actual
2015 Trailing 12 Months
Actual In Place (12/15)
Initial Proforma (12/15-11/16)
Actual Versus Proforma
Repairs and Maintenance $97,667 $75,184 $91,208 $91,208 $0 Janitorial $161,367 $160,351 $184,800 $184,800 $0 Common Area Maintenance $217,719 $187,769 $190,762 $190,762 $0 Utilities $308,572 $301,890 $307,886 $307,886 $0 Payroll $323,399 $310,518 $271,510 $271,510 $0
TOTAL OPERATING EXPENSES $1,108,724 $1,035,714 $1,046,166 $1,046,166 $0 Per SF $7.13 $6.66 $6.73 $6.73
Marketing Expenses $19,195 $11,401 $0 $0 $0 Admin. Expenses ($192) $737 $0 $0 $0 TOTAL NON-REIMBURSABLE EXPENSES $19,002 $12,138 $0 $0 $0
Per SF $0.12 $0.08 $0.00 $0.00
HISTORICAL SUMMARY – DETAIL | 43
100
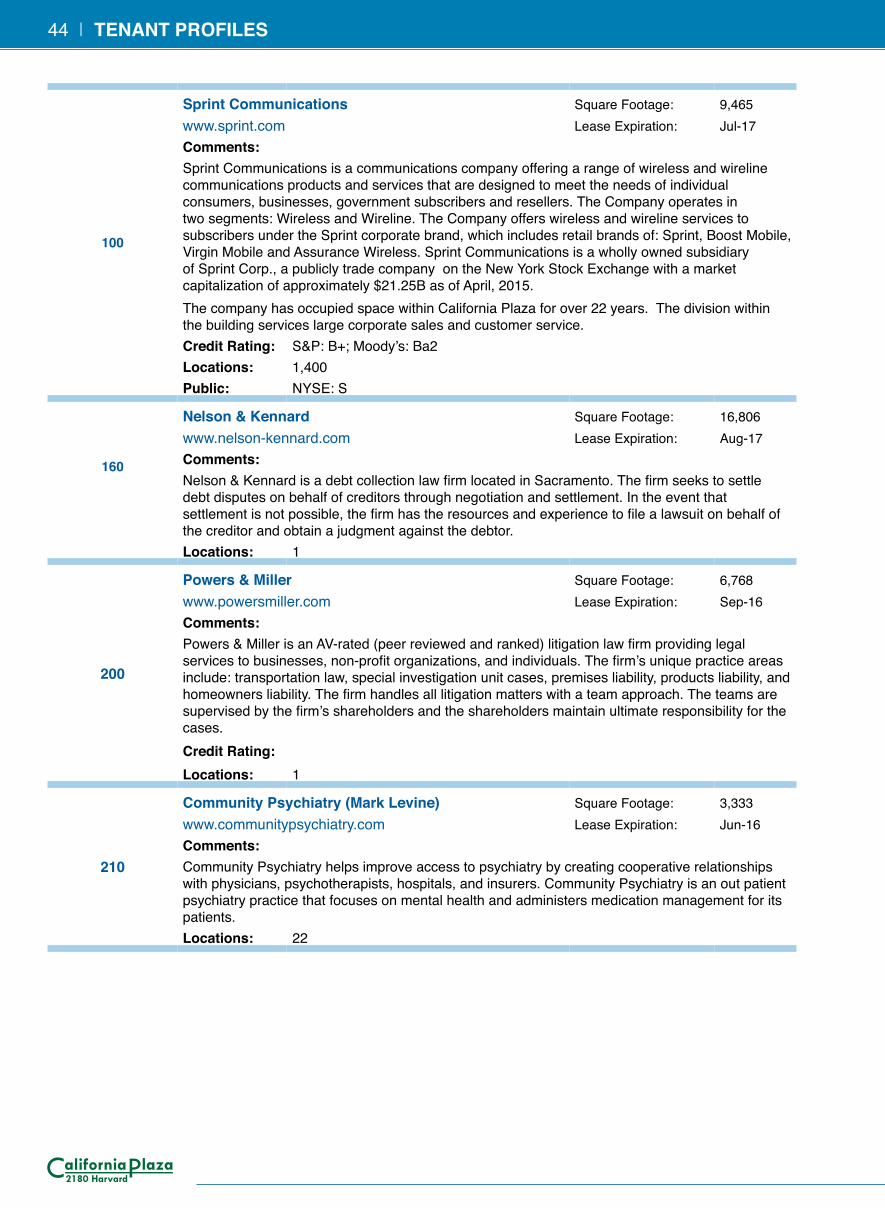
Sprint Communications Square Footage: 9,465www.sprint.com Lease Expiration: Jul-17Comments:Sprint Communications is a communications company offering a range of wireless and wireline communications products and services that are designed to meet the needs of individual consumers, businesses, government subscribers and resellers. The Company operates in two segments: Wireless and Wireline. The Company offers wireless and wireline services to subscribers under the Sprint corporate brand, which includes retail brands of: Sprint, Boost Mobile, Virgin Mobile and Assurance Wireless. Sprint Communications is a wholly owned subsidiary of Sprint Corp., a publicly trade company on the New York Stock Exchange with a market capitalization of approximately $21.25B as of April, 2015.The company has occupied space within California Plaza for over 22 years. The division within the building services large corporate sales and customer service. Credit Rating: S&P: B+; Moody’s: Ba2Locations: 1,400Public: NYSE: S
160
Nelson & Kennard Square Footage: 16,806www.nelson-kennard.com Lease Expiration: Aug-17Comments:Nelson & Kennard is a debt collection law firm located in Sacramento. The firm seeks to settle debt disputes on behalf of creditors through negotiation and settlement. In the event that settlement is not possible, the firm has the resources and experience to file a lawsuit on behalf of the creditor and obtain a judgment against the debtor.Locations: 1
200
Powers & Miller Square Footage: 6,768www.powersmiller.com Lease Expiration: Sep-16Comments:Powers & Miller is an AV-rated (peer reviewed and ranked) litigation law firm providing legal services to businesses, non-profit organizations, and individuals. The firm’s unique practice areas include: transportation law, special investigation unit cases, premises liability, products liability, and homeowners liability. The firm handles all litigation matters with a team approach. The teams are supervised by the firm’s shareholders and the shareholders maintain ultimate responsibility for the cases.Credit Rating:Locations: 1
210
Community Psychiatry (Mark Levine) Square Footage: 3,333www.communitypsychiatry.com Lease Expiration: Jun-16Comments:Community Psychiatry helps improve access to psychiatry by creating cooperative relationships with physicians, psychotherapists, hospitals, and insurers. Community Psychiatry is an out patient psychiatry practice that focuses on mental health and administers medication management for its patients.Locations: 22
44 | TENANT PROFILES
250
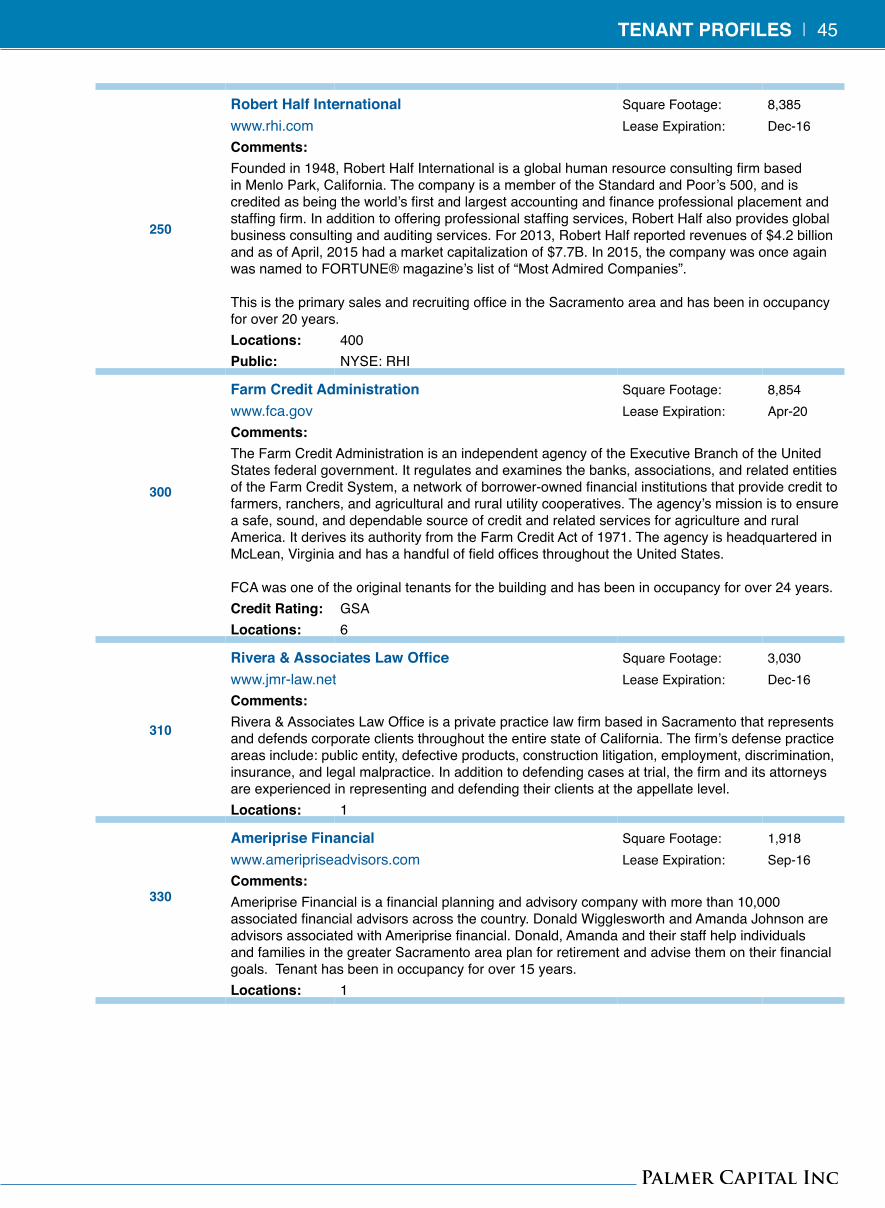
Robert Half International Square Footage: 8,385www.rhi.com Lease Expiration: Dec-16Comments:Founded in 1948, Robert Half International is a global human resource consulting firm based in Menlo Park, California. The company is a member of the Standard and Poor’s 500, and is credited as being the world’s first and largest accounting and finance professional placement and staffing firm. In addition to offering professional staffing services, Robert Half also provides global business consulting and auditing services. For 2013, Robert Half reported revenues of $4.2 billion and as of April, 2015 had a market capitalization of $7.7B. In 2015, the company was once again was named to FORTUNE® magazine’s list of “Most Admired Companies”. This is the primary sales and recruiting office in the Sacramento area and has been in occupancy for over 20 years.Locations: 400Public: NYSE: RHI
300
Farm Credit Administration Square Footage: 8,854www.fca.gov Lease Expiration: Apr-20Comments:The Farm Credit Administration is an independent agency of the Executive Branch of the United States federal government. It regulates and examines the banks, associations, and related entities of the Farm Credit System, a network of borrower-owned financial institutions that provide credit to farmers, ranchers, and agricultural and rural utility cooperatives. The agency’s mission is to ensure a safe, sound, and dependable source of credit and related services for agriculture and rural America. It derives its authority from the Farm Credit Act of 1971. The agency is headquartered in McLean, Virginia and has a handful of field offices throughout the United States. FCA was one of the original tenants for the building and has been in occupancy for over 24 years.Credit Rating: GSALocations: 6
310
Rivera & Associates Law Office Square Footage: 3,030www.jmr-law.net Lease Expiration: Dec-16Comments:Rivera & Associates Law Office is a private practice law firm based in Sacramento that represents and defends corporate clients throughout the entire state of California. The firm’s defense practice areas include: public entity, defective products, construction litigation, employment, discrimination, insurance, and legal malpractice. In addition to defending cases at trial, the firm and its attorneys are experienced in representing and defending their clients at the appellate level. Locations: 1
330
Ameriprise Financial Square Footage: 1,918www.ameripriseadvisors.com Lease Expiration: Sep-16Comments:Ameriprise Financial is a financial planning and advisory company with more than 10,000 associated financial advisors across the country. Donald Wigglesworth and Amanda Johnson are advisors associated with Ameriprise financial. Donald, Amanda and their staff help individuals and families in the greater Sacramento area plan for retirement and advise them on their financial goals. Tenant has been in occupancy for over 15 years.Locations: 1
TENANT PROFILES | 45
360
USAA Square Footage: 3,908www.usaa.com Lease Expiration: Sep-18Comments:The United Services Automobile Association (USAA) is a diversified financial services group of companies including subsidiaries that offer banking, investment services, retirement and financial planning, as well as insurance to people and families that serve, or have served, in the United States military. USAA was founded in 1922 by 25 army officers and has since grown to employ over 26,000 people. In 2014, the company provided financial services for approximately 10.1 million members. Because USAA is an association and has no shareholders, USAA’s profits are retained for financial strength or returned to its members. The division within the building is the regional legal group for USAA and separate from its operations across the street.Credit Rating: S&P: AA+; Moody’s: AaaLocations: 26
375
Liberty Mutual Square Footage: 6,393www.libertymutualgroup.com Lease Expiration: Feb-20Comments:Liberty Mutual Insurance, founded in 1912, is a diversified global insurer and the third-largest property and casualty insurer in the United States based on 2013 direct premium written as reported by the National Association of Insurance Commissioners. The company ranks 76th on the Fortune 100 list of largest corporations in the United States based on 2013 revenues. Headquartered in Boston, Massachusetts, Liberty Mutual employs over 50,000 people in locations throughout the world. The division within the building is the regional legal group for Liberty Mutual and been in occupancy for over 16 years.Credit Rating: S&P: A-; Moody’s: A2Locations: 900
380
Interior Business Center Square Footage: 3,438www.doi.gov/ibc Lease Expiration: May-16Comments:The Interior Business Center is an IT service provider of the United States Department of the Interior. The center was created in 2000 by the consolidation of three existing services centers within the Department of the Interior. The center supports more than 150 government agencies and also provides business management systems and services. It is currently the only federal agency designated by both OMB and OPM as a Center of Excellence in the financial management and human resources services.Locations: 7
410
North Star Financial Partners Square Footage: 3,142www.northstarfinancialpartners.com Lease Expiration: Jan-19Comments:North Star Financial Partners is an independent financial planning and advisory business focused on serving businesses and families in Northern California and Nevada. The firm offers four primary services to its clients: asset management, benefits consulting, insurance and estate planning, and retirement planning. The firm prides itself on its ability to create custom-tailored asset management plans that are designed for each client’s specific needs. Locations: 1
46 | TENANT PROFILES
450
Insurance Office of America Square Footage: 3,885www.ioausa.com Lease Expiration: Dec-20Comments:Insurance Office of America is a full-service insurance agency and was founded in 1988. First recognized as one of the top 100 U.S. insurance brokers in the year 2000, the company is a privately-held agency and one of the largest in the country employing over 950 people. The company is currently the 11th largest privately-held agency as ranked by the Insurance Journal, and the 27th largest U.S. broker according to Business Insurance magazine. The company specializes in large sporting events and team insurance.
Locations: 42
460
Alliant Insurance Services Square Footage: 9,492www.alliant.com Lease Expiration: Jan-21Comments:Alliant Insurance Services is one of the nation’s leading distributors of diversified insurance products and services and has a history dating back to 1925. The company brokers multi-line commercial property and casualty insurance, as well as surety bonds and employee benefits through offices scattered across the US and in Canada. Offering several specialty programs, the company operates a large public entity business, and it has expertise in providing insurance for energy and health care companies, tribal nations, law firms, and the real estate and construction industries. Alliant Insurance is owned by international private equity firm KKR.Credit Rating: S&P: B; Moody’s: B3Locations: 53
500
Molina Healthcare Square Footage: 14,073www.molinahealthcare.com Lease Expiration: Sep-19Comments:Molina Healthcare, founded in 1980 by Dr. C. David Molina, is a managed care company that arranges for the delivery of health care services and offers health information management solutions to nearly five million individuals and families who receive their care through Medicaid, Medicare and other government-funded programs in fifteen states. For 2014, Molina Healthcare reported total annual revenue of $9.67B and as of April, 2015 had a market cap. of $3.2B. The company has grown consistently since it was founded and now employs over 10,500 people.Locations: NA
550
Gallagher Bassett Services Square Footage: 11,105www.gallagherbassett.com Lease Expiration: Nov-18Comments:With a history dating back to 1927, Gallagher Bassett Services is the largest property and casualty third party administrator in the world. Gallagher Bassett Services is a subsidiary of publicly traded Arthur J. Gallagher & Co. With operations in the United States, Canada, the United Kingdom and Australia, the company is a trusted advisor and collaborative partner to more than 3400 companies from every sector of the economy, worldwide. The company employs 4,200 people in offices across the globe. The division within the building complete medical claim processing and has been in occupancy for over 15 years.Locations: 100
560
Johnson Schacter & Lewis Square Footage: 6,632www.jsl-law.com Lease Expiration: Aug-18Comments:Johnson Schachter & Lewis is an AV-rated (peer reviewed and ranked) litigation law firm that has provided legal services to clients throughout Northern and Central California for more than 30 years. The firm represents clients in state and federal courts throughout California, in contractual and judicial arbitrations, as well as in administrative matters before various agencies. The firm’s practice areas include: employment, discrimination, public entity, professional errors and omission, tort, insurance coverage, and business litigation. Locations: 1
TENANT PROFILES | 47
48 | MARKET EXECUTIVE SUMMARY
MARKET
EXECUTIVE SUMMARYPOINT WEST SUBMARKETThe Point West submarket is conveniently located just 10 minutes out of Downtown Sacramento and benefits from immediate access to Business 80, providing excellent accessibility to employee and executive housing. The submarket consists of 2.1 million square feet of Class A and B office space with a current vacancy of 17.80%, down 19.30% since fourth quarter 2010.
SACRAMENTO MARKETThe Sacramento market totals 71.3 million square feet of Class A & B office space spread among 1,921 buildings. Office vacancy in the Sacramento market has decreased 5.6% to 12.8% from a high of 18.4% in the second quarter of 2011. Sacramento’s large government sector employment base insulates it from cyclicality caused by economic trends.
Market Highlights Include:• Point West was the best performing submarket in Sacramento in 2014, measured by square footage absorbed as a
percent of total rentable inventory.• The current vacancy of 17.80% is a decline of 19.30% since fourth quarter 2010.• Point West is a popular office alternative to Downtown Sacramento, where tenants can expect to pay 37% higher rents.• Parking is more abundant and less costly in the Point West submarket compared to Downtown Sacramento.• Point West rents have been consistently stable over the past three years, fluctuating within a $0.03 range, making it
appealing for investors with a long-term horizon.• The Sacramento office market totals 71.3 million square feet of Class A & B office space spread among 1,921 buildings.• The Sacramento office market is well insulated from economic cycles due to a high concentration of public agency employers.• Office vacancy in the Sacramento market has decreased 5.6% to 12.8% from a high of 18.4% in the second quarter of 2011.
Market Overview Highlights Include:• California Plaza is conveniently located along Business 80 near Arden Way, one of the area’s primary arterial routes and
is surrounded by the area’s most desired amenities for office tenants.• Over the next three decades, the Sacramento region is forecasted to have the third largest population growth rate in the
state.• The Sacramento unemployment rate has consistently trended down since its peak of 12.8% in January 2011 and currently
stands at only 6.7%.• The technology sector in Sacramento has shown significant signs of strength, with growth in companies ranging from
startups to international companies.• The Sacramento MSA is home to two respected public universities; California State University Sacramento and University
of California, Davis. As well as a large number of vocational schools.• The proximity of Sacramento to the Bay Area will increasingly be a driving force for firms that are focused on their bottom
lines and push them to consider leasing or purchasing space in the Sacramento Region.
49
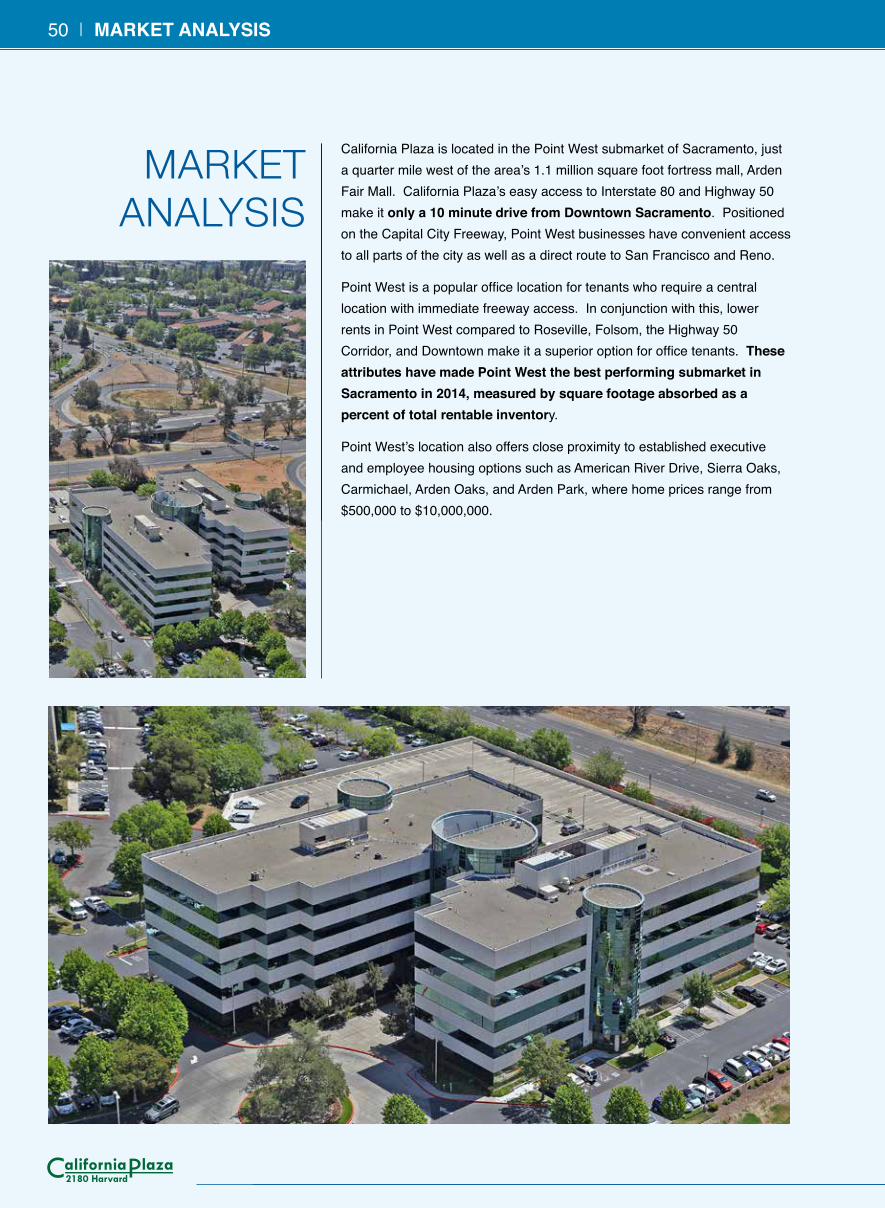
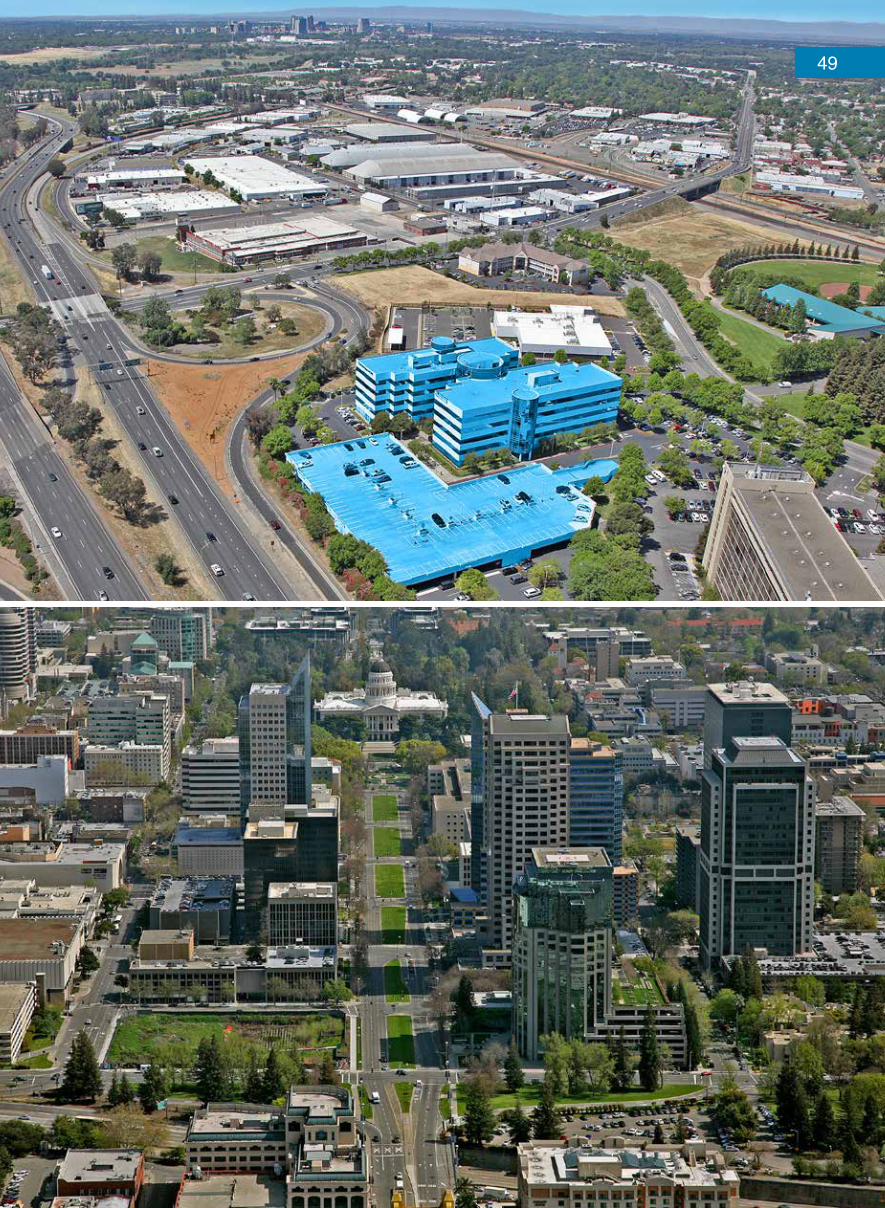
California Plaza is located in the Point West submarket of Sacramento, just a quarter mile west of the area’s 1.1 million square foot fortress mall, Arden Fair Mall. California Plaza’s easy access to Interstate 80 and Highway 50 make it only a 10 minute drive from Downtown Sacramento. Positioned on the Capital City Freeway, Point West businesses have convenient access to all parts of the city as well as a direct route to San Francisco and Reno.
Point West is a popular office location for tenants who require a central location with immediate freeway access. In conjunction with this, lower rents in Point West compared to Roseville, Folsom, the Highway 50 Corridor, and Downtown make it a superior option for office tenants. These attributes have made Point West the best performing submarket in Sacramento in 2014, measured by square footage absorbed as a percent of total rentable inventory.
Point West’s location also offers close proximity to established executive and employee housing options such as American River Drive, Sierra Oaks, Carmichael, Arden Oaks, and Arden Park, where home prices range from $500,000 to $10,000,000.
50 | SECTION50 | MARKET ANALYSIS
MARKET ANALYSIS
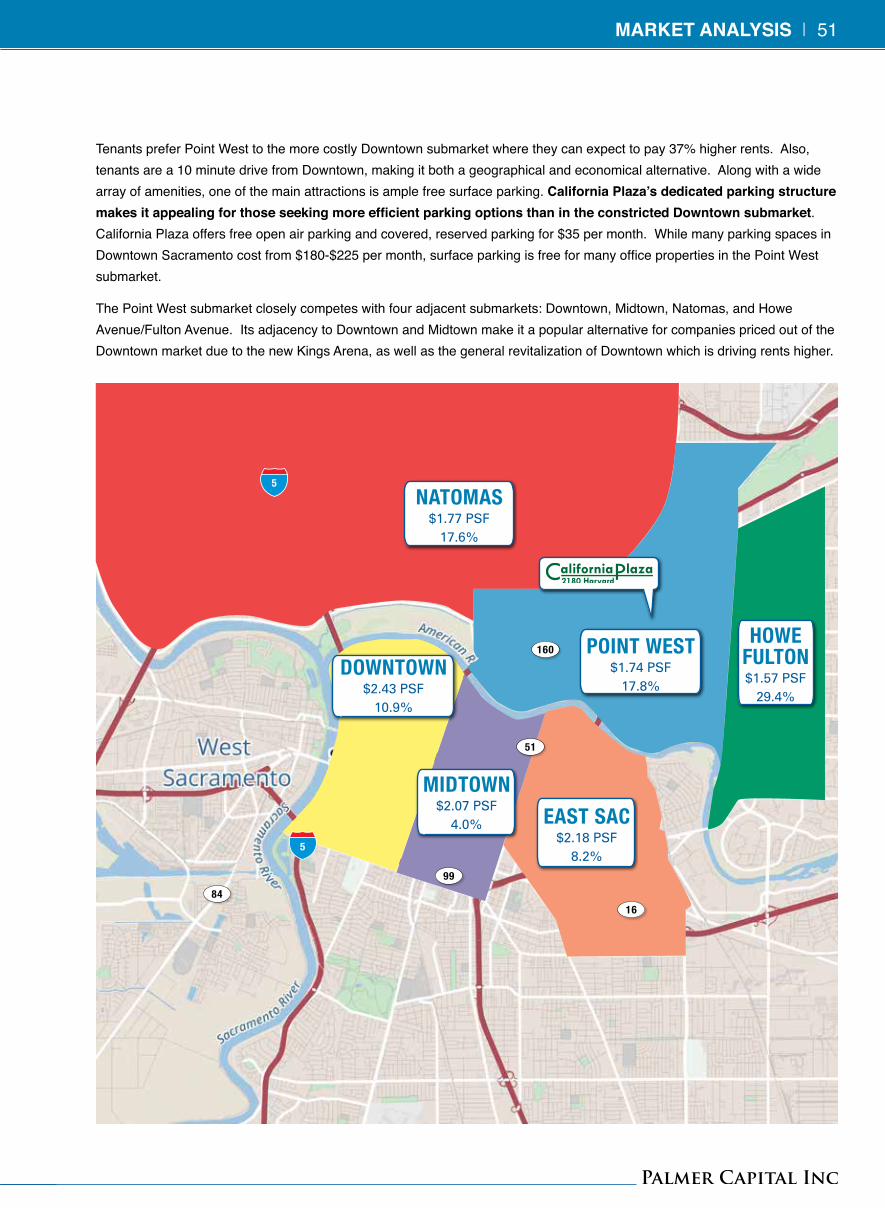
Tenants prefer Point West to the more costly Downtown submarket where they can expect to pay 37% higher rents. Also, tenants are a 10 minute drive from Downtown, making it both a geographical and economical alternative. Along with a wide array of amenities, one of the main attractions is ample free surface parking. California Plaza’s dedicated parking structure makes it appealing for those seeking more efficient parking options than in the constricted Downtown submarket. California Plaza offers free open air parking and covered, reserved parking for $35 per month. While many parking spaces in Downtown Sacramento cost from $180-$225 per month, surface parking is free for many office properties in the Point West submarket.
The Point West submarket closely competes with four adjacent submarkets: Downtown, Midtown, Natomas, and Howe Avenue/Fulton Avenue. Its adjacency to Downtown and Midtown make it a popular alternative for companies priced out of the Downtown market due to the new Kings Arena, as well as the general revitalization of Downtown which is driving rents higher.
NATOMAS$1.77 PSF
17.6%
POINT WEST$1.74 PSF
17.8%
HOWE FULTON$1.57 PSF
29.4%
EAST SAC$2.18 PSF
8.2%
MIDTOWN$2.07 PSF
4.0%
DOWNTOWN$2.43 PSF
10.9%
MARKET ANALYSIS | 51
5
5
99
8416
51
160
VACANCY ANALYSIS
MARKETCalifornia Plaza is a Class A multitenant office building and for the purposes of this analysis we have included both Class A and Class B buildings to show the comparison of both in the market. We have also included stats for just Class A buildings.
The Sacramento office market totals 71.3 million square feet of Class A & B office space spread among 1,921 buildings. Office vacancy in the Sacramento market has decreased 5.6% to 12.8% from a high of 18.4% in the second quarter of 2011. The Sacramento job market has shown improvement due to private sector employment growth of 13.8% since 2010. A total of 24,900 private sector jobs and 3,700 government jobs have been added in the past year alone. Additionally, the Sacramento office market is well insulated from economic cycles due to the high concentration of public agency employers. Historically, vacancy over the last 10 years has been consistently stable due to the large government presence, fluctuating within a modest 430 basis point range since 2005.
The Market Class A office has a current vacancy of 11.6% or 1.2% below Class A and Class B combined.
SUBMARKETThe Point West Class A & B office submarket contains 2.1 million square feet among 44 office buildings. The current vacancy rate in this submarket is 17.8%. Vacancy has dropped precipitously since peaking in the fourth quarter of 2010, having declined by 19.3% since then. Half of that is attributable to 2014 alone. The Point West submarket accounts for 2.9% of the total Class A & B office space in the Sacramento market.
Vacancy for Class A office in the submarket is currently 17.8% in line with Class B office.
VACANCY ANALYSIS
RENTAL RATE ANALYSIS
MARKETThe average quoted asking rental rates in the Sacramento Class A & B office market were $1.79 per square foot, full service gross at the end of the third quarter 2015. Average rents in the Class A & B office market have stabilized since the recession, fluctuating in a very tight range for the past three years. Sacramento Class A & B office rents on average are still 14% below their peak achieved in 2008.
The average quoted asking rental rates in the market for just Class A office is currently $2.13 per square foot per year full service gross or a 19% premium over the average rental rates of Class and Class B combined.
SUBMARKETThe Point West submarket currently has asking rents of $1.74 per square foot, full service gross. Rents have been consistently stable over the past three years, moving within a $0.03 range. Over a 10 year horizon, rents have exhibited similar consistency relative to economic cycles, fluctuating between $1.70 and $2.04. The low volatility in lease rates makes this submarket appealing to investors with a long-term horizon.
The average quoted asking rental rates in the submarket for just Class A office is currently $1.86 per square foot per year full service gross in line with our current contract rate at California Plaza and a 7% premium over the average rental rates of Class and Class B combined however 12.6% lower than the overall Class A office market offering a lower cost alternative to other submarket in Sacramento.
RENTAL RATE ANALYSIS
52 | MARKET ANALYSIS
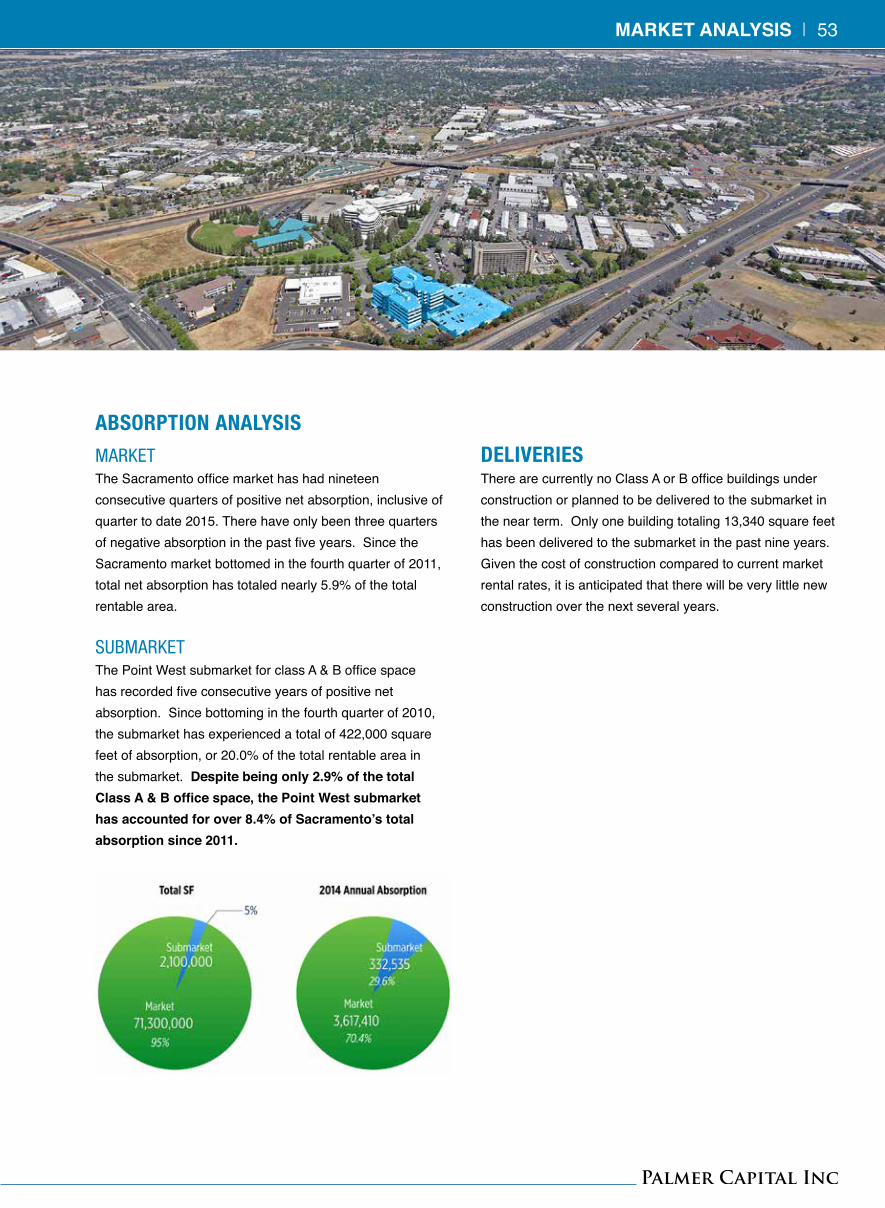
ABSORPTION ANALYSIS
MARKETThe Sacramento office market has had nineteen consecutive quarters of positive net absorption, inclusive of quarter to date 2015. There have only been three quarters of negative absorption in the past five years. Since the Sacramento market bottomed in the fourth quarter of 2011, total net absorption has totaled nearly 5.9% of the total rentable area.
SUBMARKETThe Point West submarket for class A & B office space has recorded five consecutive years of positive net absorption. Since bottoming in the fourth quarter of 2010, the submarket has experienced a total of 422,000 square feet of absorption, or 20.0% of the total rentable area in the submarket. Despite being only 2.9% of the total Class A & B office space, the Point West submarket has accounted for over 8.4% of Sacramento’s total absorption since 2011.
DELIVERIESThere are currently no Class A or B office buildings under construction or planned to be delivered to the submarket in the near term. Only one building totaling 13,340 square feet has been delivered to the submarket in the past nine years. Given the cost of construction compared to current market rental rates, it is anticipated that there will be very little new construction over the next several years.
MARKET ANALYSIS | 53
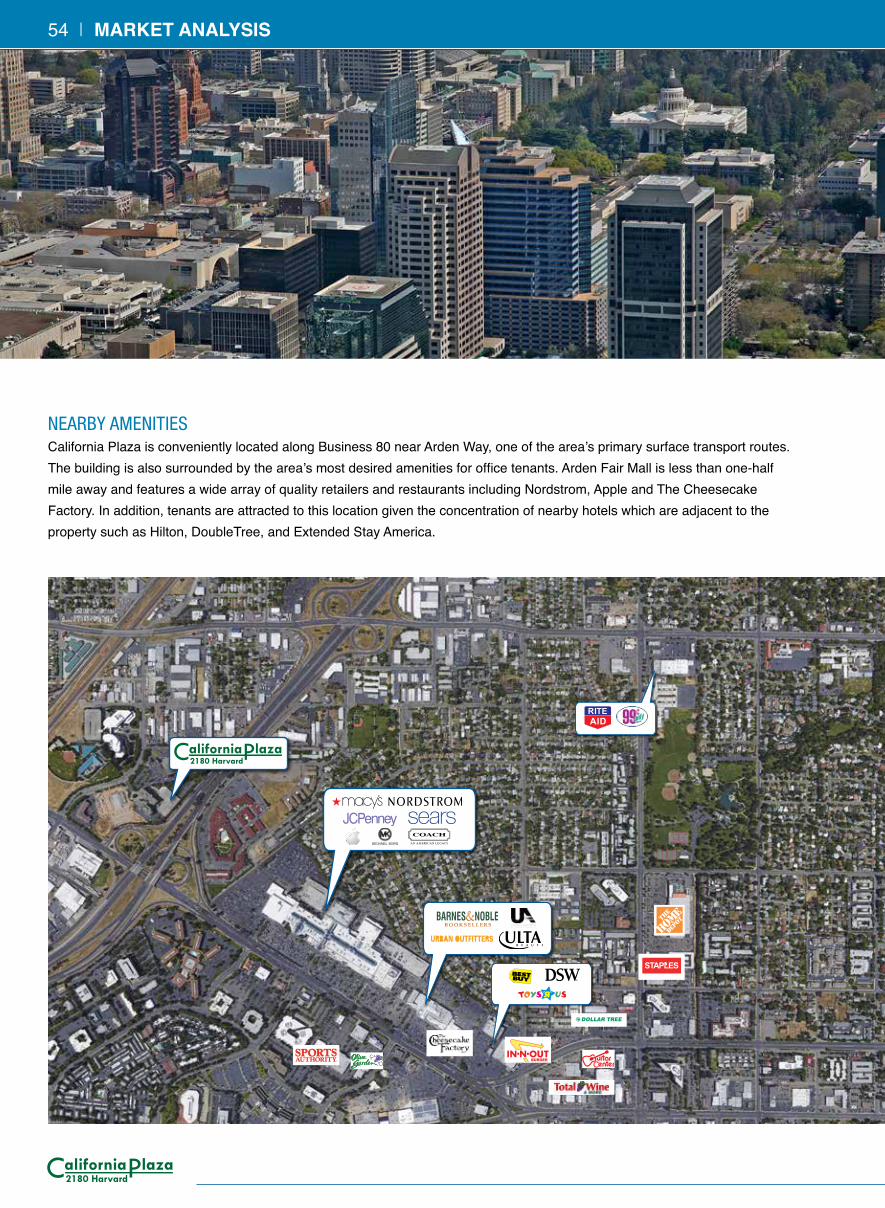
NEARBY AMENITIES California Plaza is conveniently located along Business 80 near Arden Way, one of the area’s primary surface transport routes. The building is also surrounded by the area’s most desired amenities for office tenants. Arden Fair Mall is less than one-half mile away and features a wide array of quality retailers and restaurants including Nordstrom, Apple and The Cheesecake Factory. In addition, tenants are attracted to this location given the concentration of nearby hotels which are adjacent to the property such as Hilton, DoubleTree, and Extended Stay America.
54 | MARKET ANALYSIS
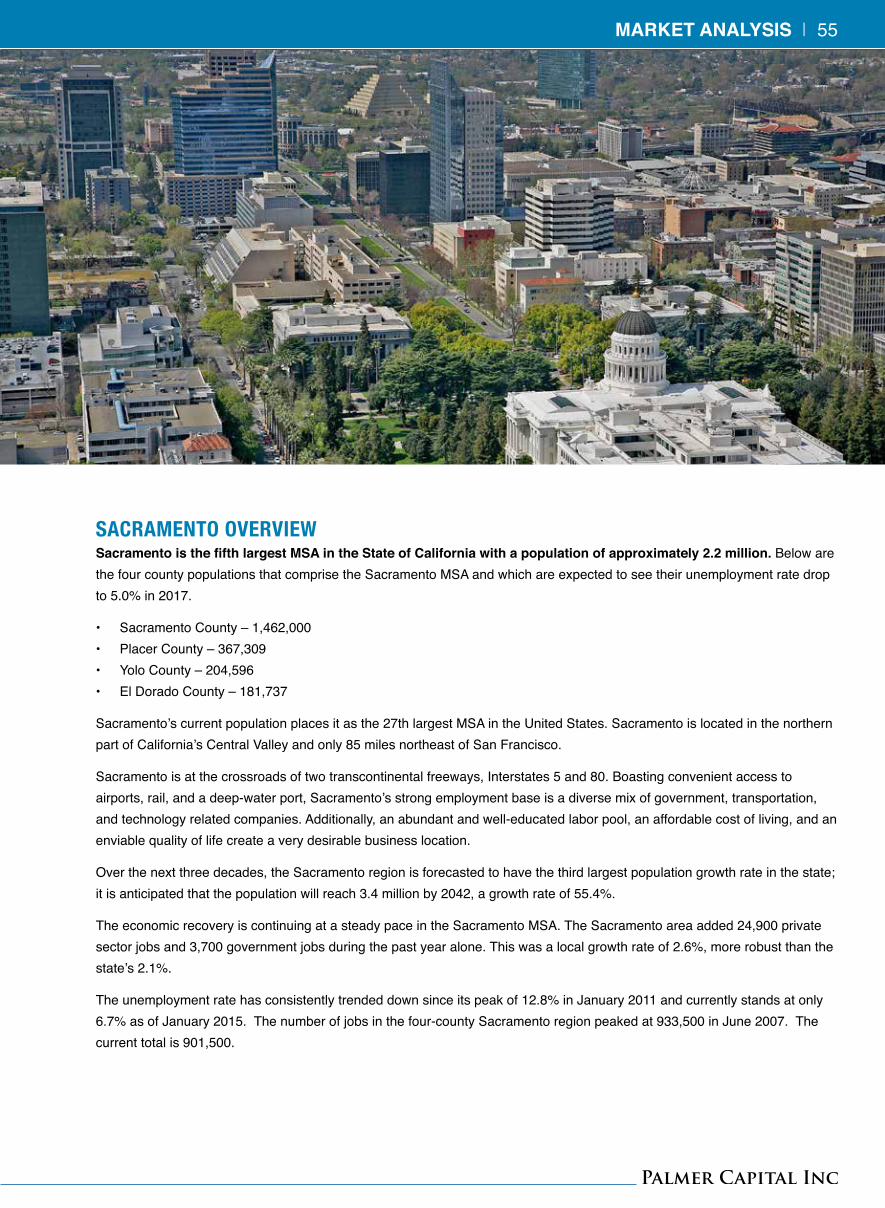
SACRAMENTO OVERVIEWSacramento is the fifth largest MSA in the State of California with a population of approximately 2.2 million. Below are the four county populations that comprise the Sacramento MSA and which are expected to see their unemployment rate drop to 5.0% in 2017.
• Sacramento County – 1,462,000• Placer County – 367,309• Yolo County – 204,596• El Dorado County – 181,737
Sacramento’s current population places it as the 27th largest MSA in the United States. Sacramento is located in the northern part of California’s Central Valley and only 85 miles northeast of San Francisco.
Sacramento is at the crossroads of two transcontinental freeways, Interstates 5 and 80. Boasting convenient access to airports, rail, and a deep-water port, Sacramento’s strong employment base is a diverse mix of government, transportation, and technology related companies. Additionally, an abundant and well-educated labor pool, an affordable cost of living, and an enviable quality of life create a very desirable business location.
Over the next three decades, the Sacramento region is forecasted to have the third largest population growth rate in the state; it is anticipated that the population will reach 3.4 million by 2042, a growth rate of 55.4%.
The economic recovery is continuing at a steady pace in the Sacramento MSA. The Sacramento area added 24,900 private sector jobs and 3,700 government jobs during the past year alone. This was a local growth rate of 2.6%, more robust than the state’s 2.1%.
The unemployment rate has consistently trended down since its peak of 12.8% in January 2011 and currently stands at only 6.7% as of January 2015. The number of jobs in the four-county Sacramento region peaked at 933,500 in June 2007. The current total is 901,500.
MARKET ANALYSIS | 55
SACRAMENTO FACTS• Sacramento—the “City of Trees”—is home to one
of the ten best urban forests in the country (2013)
• California had the most LEED building space
certified in 2014 among the top ten states and
ranks 7th per capita in the U.S.
• Sacramento has the fastest job growth rate among
the top 50 largest countries with most employees
(2015)
• UC Davis ranks 14th among U.S. ranked public
universities in research funding (2015)
• Sacramento RANKED 15th on list of top 25 “Best
Places for New College Grads” (2012)
• Sacramento is second - safest U.S. Community for
natural disasters (2014)
• Local farmers and restaurants featuring local
ingredients made the Sacramento Region the Farm-
to-Fork Capital of America (2012)
• The City of Rancho Cordova was named 21st best
small workplace in the U.S. on the FORBES “Great
Places to Work” list (2014)
• Sacramento ranks 4th of top 50 metros on the
Clean Edge 2012 U.S. Metro Clean Tech Index with
rankings in the top 10 in all indicator categories
• Sacramento ranked the 5th most bike friendly city
in the nation (2015)
• Sacramento projected to be the 4th fastest growing
metro area in California through 2020 (2014)
• Sacramento ranks 19th on EPA list of top U.S.
cities with the most Energy Star certified buildings
(2015)
• Forbes ranking finds the Sacramento River Cats are
the #1 most valuable minor league baseball team in
the U.S. (2015)
• Sacramento ranks 7th in the nation for urban park
funding and access (2014)
• Brookings Institution study ranked Sacramento in
top 25 of U.S. metro areas for percent of “very
high-tech” manufacturing jobs (2012)
• Davis ranks 7th in nation on FODOR'S TRAVEL'S
list of top 10 greatest farmers markets
• Sacramento RANKED 5th on list of U.S. cities with
the fastest growth in tech jobs (2014)
• Sacramento’s Core Green Economy grew faster
than every other region in the state from 1995 to
2010
• The Sacramento area had the fastest rate of clean
economy job growth in 2011-2012, at 5 percent
(2014)
• Sacramento ranked one of top 10 cities adopting
smart grid technology (2011)
• Sacramento one of only six U.S. cities on both
General Electric and Ford’s lists of most electric-
vehicle ready cities (2011)
56 | MARKET ANALYSIS
EMPLOYMENTIn addition to being the state capitol of California, Sacramento has a diverse base of public and private sector employers. The largest public sector employer is the State of California with over 109,000 employees based in Sacramento, or about 13.6% of the workforce. The area’s educational system combines to employ over 26,700 people and the UC Davis Health System employs another 8,500 people. This large public sector employment base helps insulate the market during times of economic uncertainty.
The Sacramento Region’s major private sector employers represent industries ranging from healthcare and financing services to manufacturing. As noted on the Private Sector Employment chart shown on the right, seven companies have their corporate headquarters in the Sacramento Region.
The private sector is dominated by healthcare providers that currently employ over 87,200 people. For example, Molina Healthcare is a service provider that is located in California Plaza. The Sacramento MSA has 21 acute care hospitals with more than 4,500 beds. The largest hospitals in Sacramento are the University of California, Davis Medical Center, Sutter Memorial Hospital, Mercy General Hospital, and Kaiser Foundation Hospitals. These hospitals alone account for over 2,300 beds.
PRIVATESECTOREMPLOYMENT
Company IndustryNumberofEmployees
Kaiser Permanente Health Care 10,140
Sutter Health* Health Care 9,112
Raley’s Inc.* Retail Grocery 7,283
Dignity Health Health Care 7,054
Intel Corp. R&D - Smiconductors 6,500
Hewlett-Packard Co. Computer Hardware Manufacturer 3,200
Wells Fargo & Co. Financial Services 3,188
Health Net of California Health Care 2,552
Cache Creek Casino Resort Casino Resort 2,400
Pacific Gas and Electric Co. Utilities 2,247
VSP Global* Health Care 2,070
Thunder Valley Casino Resort Casino Resort 2,000
Union Pacific Railroad Co. Inc. Transportation of Goods 2,000
Northstar-at-Tahoe Resort Ski Resort 1,950
Bank of America Financial Services 1,892
PRIDE Industries* Manufacturing and Logistics 1,844
Blue Shield of California Health Care 1,744
Aerojet* Manufacturing 1,700
Delta Dental Health Care 1,300
Marshall Medical Center* Health Care 1,187
Eskaton* Community Living 1,160
Franklin Templeton Investments Financial Services 1,000
*Headquartered in the Sacramento Region.
Source: Sacramento Business Journal Top 25 Book of Lists 2012
MARKET ANALYSIS | 57
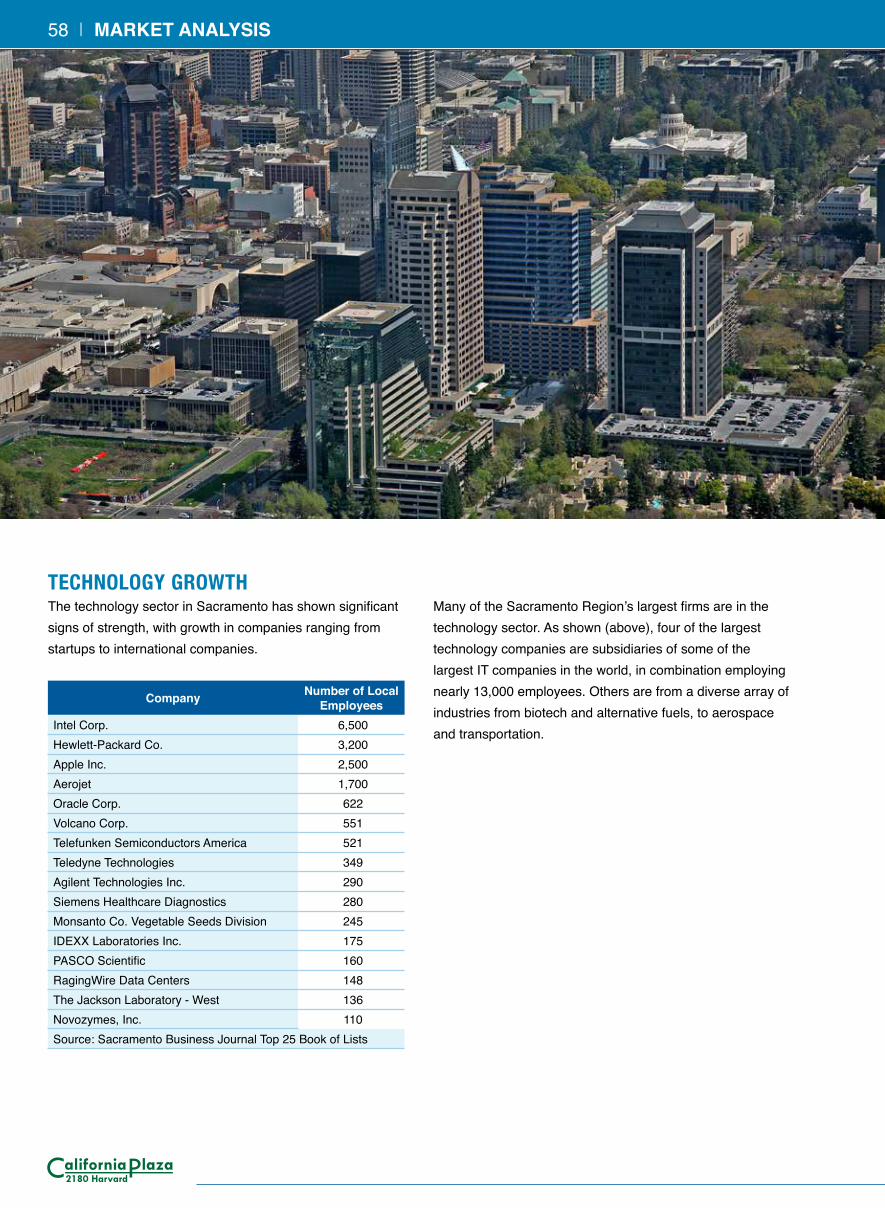
TECHNOLOGY GROWTHThe technology sector in Sacramento has shown significant signs of strength, with growth in companies ranging from startups to international companies.
Company Number of Local Employees
Intel Corp. 6,500 Hewlett-Packard Co. 3,200 Apple Inc. 2,500 Aerojet 1,700 Oracle Corp. 622 Volcano Corp. 551 Telefunken Semiconductors America 521 Teledyne Technologies 349 Agilent Technologies Inc. 290 Siemens Healthcare Diagnostics 280 Monsanto Co. Vegetable Seeds Division 245 IDEXX Laboratories Inc. 175 PASCO Scientific 160 RagingWire Data Centers 148 The Jackson Laboratory - West 136 Novozymes, Inc. 110 Source: Sacramento Business Journal Top 25 Book of Lists
Many of the Sacramento Region’s largest firms are in the technology sector. As shown (above), four of the largest technology companies are subsidiaries of some of the largest IT companies in the world, in combination employing nearly 13,000 employees. Others are from a diverse array of industries from biotech and alternative fuels, to aerospace and transportation.
58 | MARKET ANALYSIS
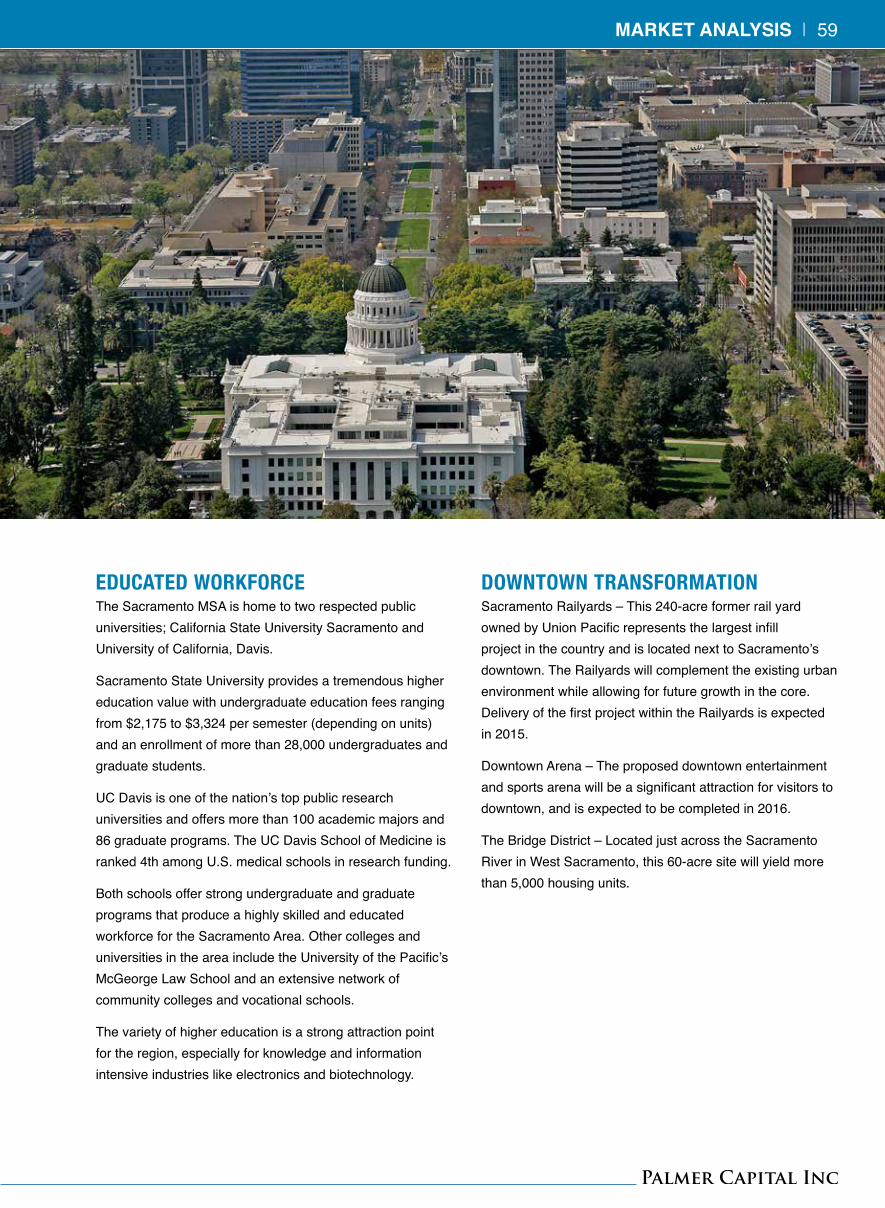
EDUCATED WORKFORCEThe Sacramento MSA is home to two respected public universities; California State University Sacramento and University of California, Davis.
Sacramento State University provides a tremendous higher education value with undergraduate education fees ranging from $2,175 to $3,324 per semester (depending on units) and an enrollment of more than 28,000 undergraduates and graduate students.
UC Davis is one of the nation’s top public research universities and offers more than 100 academic majors and 86 graduate programs. The UC Davis School of Medicine is ranked 4th among U.S. medical schools in research funding.
Both schools offer strong undergraduate and graduate programs that produce a highly skilled and educated workforce for the Sacramento Area. Other colleges and universities in the area include the University of the Pacific’s McGeorge Law School and an extensive network of community colleges and vocational schools.
The variety of higher education is a strong attraction point for the region, especially for knowledge and information intensive industries like electronics and biotechnology.
DOWNTOWN TRANSFORMATIONSacramento Railyards – This 240-acre former rail yard owned by Union Pacific represents the largest infill project in the country and is located next to Sacramento’s downtown. The Railyards will complement the existing urban environment while allowing for future growth in the core. Delivery of the first project within the Railyards is expected in 2015.
Downtown Arena – The proposed downtown entertainment and sports arena will be a significant attraction for visitors to downtown, and is expected to be completed in 2016.
The Bridge District – Located just across the Sacramento River in West Sacramento, this 60-acre site will yield more than 5,000 housing units.
MARKET ANALYSIS | 59
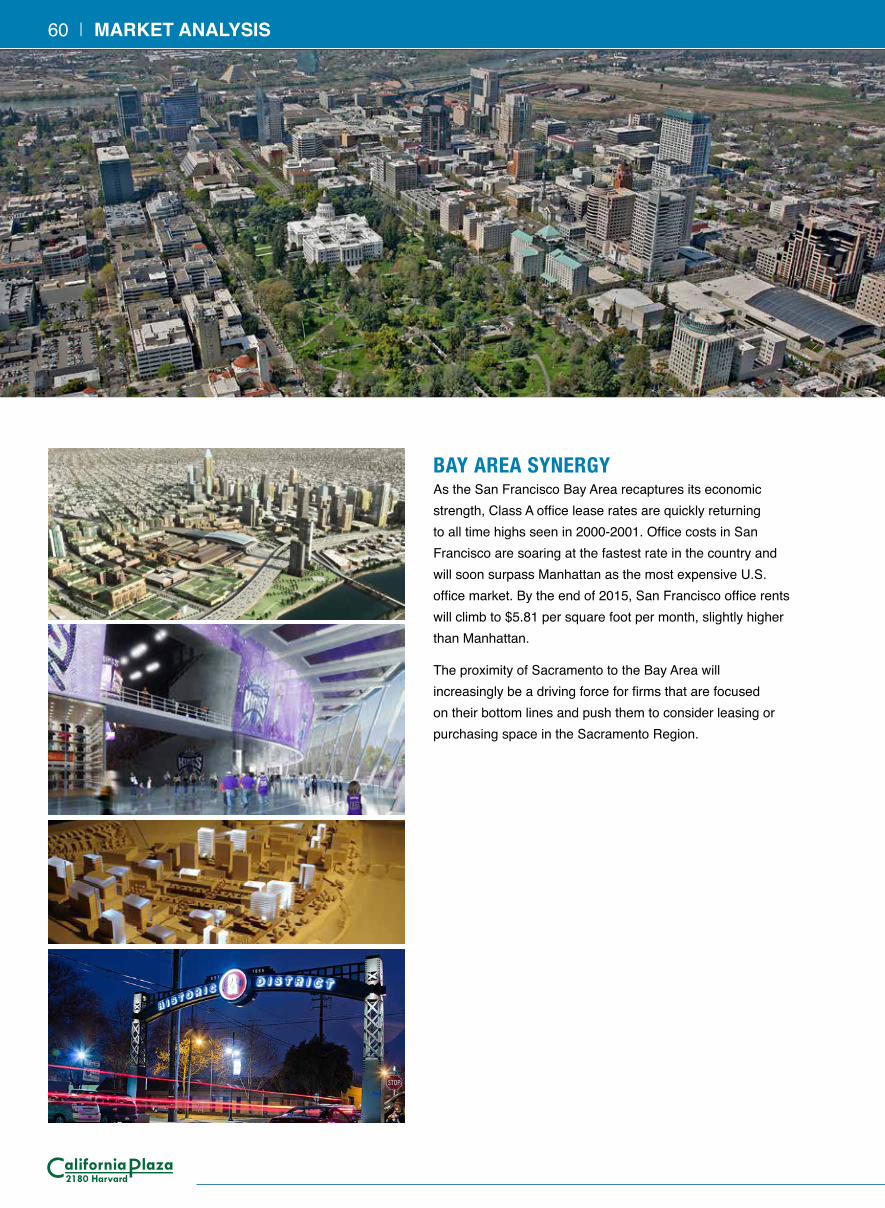
BAY AREA SYNERGYAs the San Francisco Bay Area recaptures its economic strength, Class A office lease rates are quickly returning to all time highs seen in 2000-2001. Office costs in San Francisco are soaring at the fastest rate in the country and will soon surpass Manhattan as the most expensive U.S. office market. By the end of 2015, San Francisco office rents will climb to $5.81 per square foot per month, slightly higher than Manhattan.
The proximity of Sacramento to the Bay Area will increasingly be a driving force for firms that are focused on their bottom lines and push them to consider leasing or purchasing space in the Sacramento Region.
60 | MARKET ANALYSIS
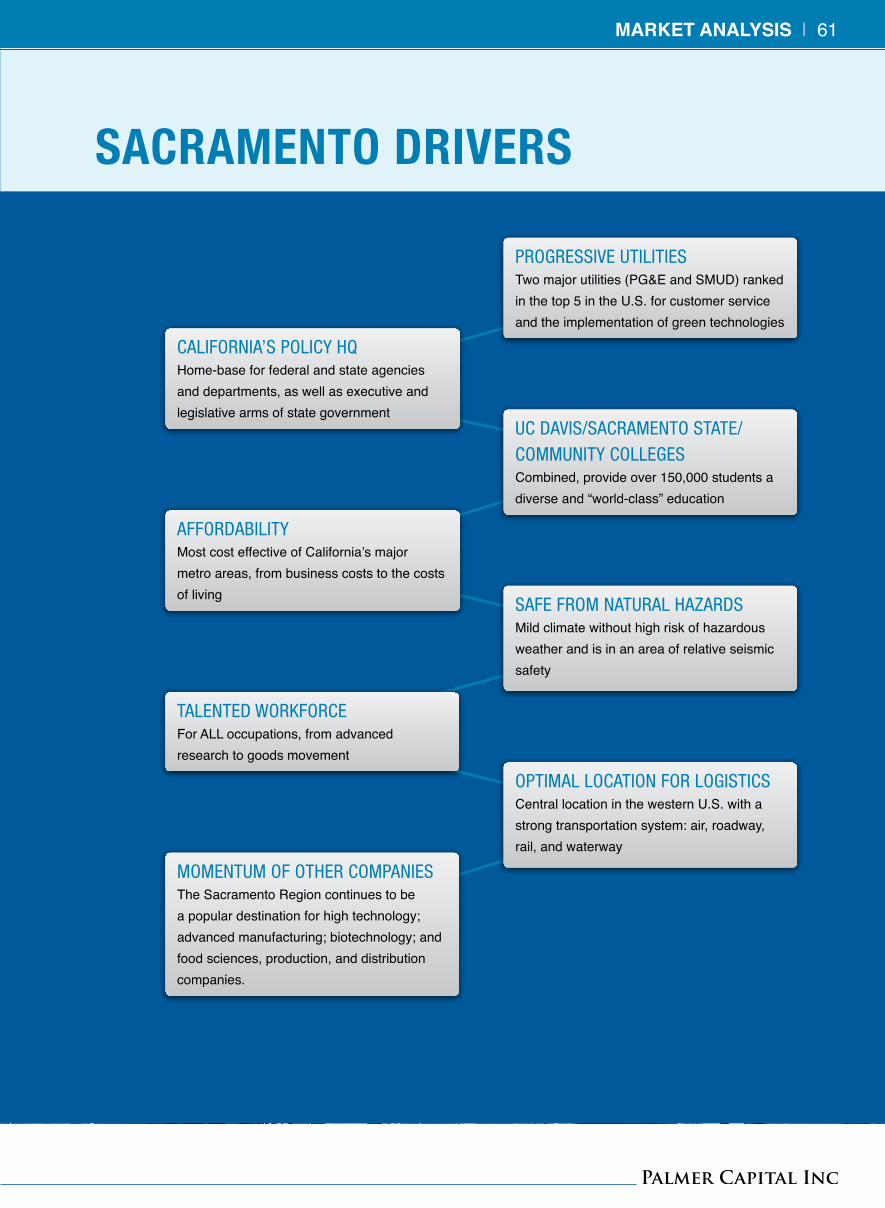
SACRAMENTO DRIVERS
CALIFORNIA’S POLICY HQHome-base for federal and state agencies and departments, as well as executive and legislative arms of state government
AFFORDABILITYMost cost effective of California’s major metro areas, from business costs to the costs of living
TALENTED WORKFORCEFor ALL occupations, from advanced research to goods movement
PROGRESSIVE UTILITIESTwo major utilities (PG&E and SMUD) ranked in the top 5 in the U.S. for customer service and the implementation of green technologies
UC DAVIS/SACRAMENTO STATE/COMMUNITY COLLEGESCombined, provide over 150,000 students a diverse and “world-class” education
SAFE FROM NATURAL HAZARDSMild climate without high risk of hazardous weather and is in an area of relative seismic safety
OPTIMAL LOCATION FOR LOGISTICSCentral location in the western U.S. with a strong transportation system: air, roadway, rail, and waterway
MOMENTUM OF OTHER COMPANIESThe Sacramento Region continues to be a popular destination for high technology; advanced manufacturing; biotechnology; and food sciences, production, and distribution companies.
MARKET ANALYSIS | 61
THE CAPITAL OF “EMERALD VALLEY”As the capital of California and the largest city in the central valley, Sacramento is the center of a region, coined the “Emerald Valley,” known as a hub for green technology and agriculture.
In a recent State of the City address, Mayor Kevin Johnson reiterated his goal to continue transforming the Sacramento region into the greenest region in the country. With the help of the Greenwise Task Force – the region’s action committee, Sacramento leads the nation in clean energy job growth, with over 200 clean tech companies located in the Sacramento region. These companies include Blue Point Energy, Pacific Ethanol, Clean Energy Systems and fuel cell manufacturers Altergy and Jadoo.
In addition, the University of California, Davis, the region’s premier public university, is ranked No. 1 in the world for teaching and research in the area of agriculture and forestry. Given Sacramento’s geographic and economic advantages, as well as the City’s focus, it’s likely that green technology and agriculture will continue to be significant job drivers for the region.
62 | MARKET ANALYSIS
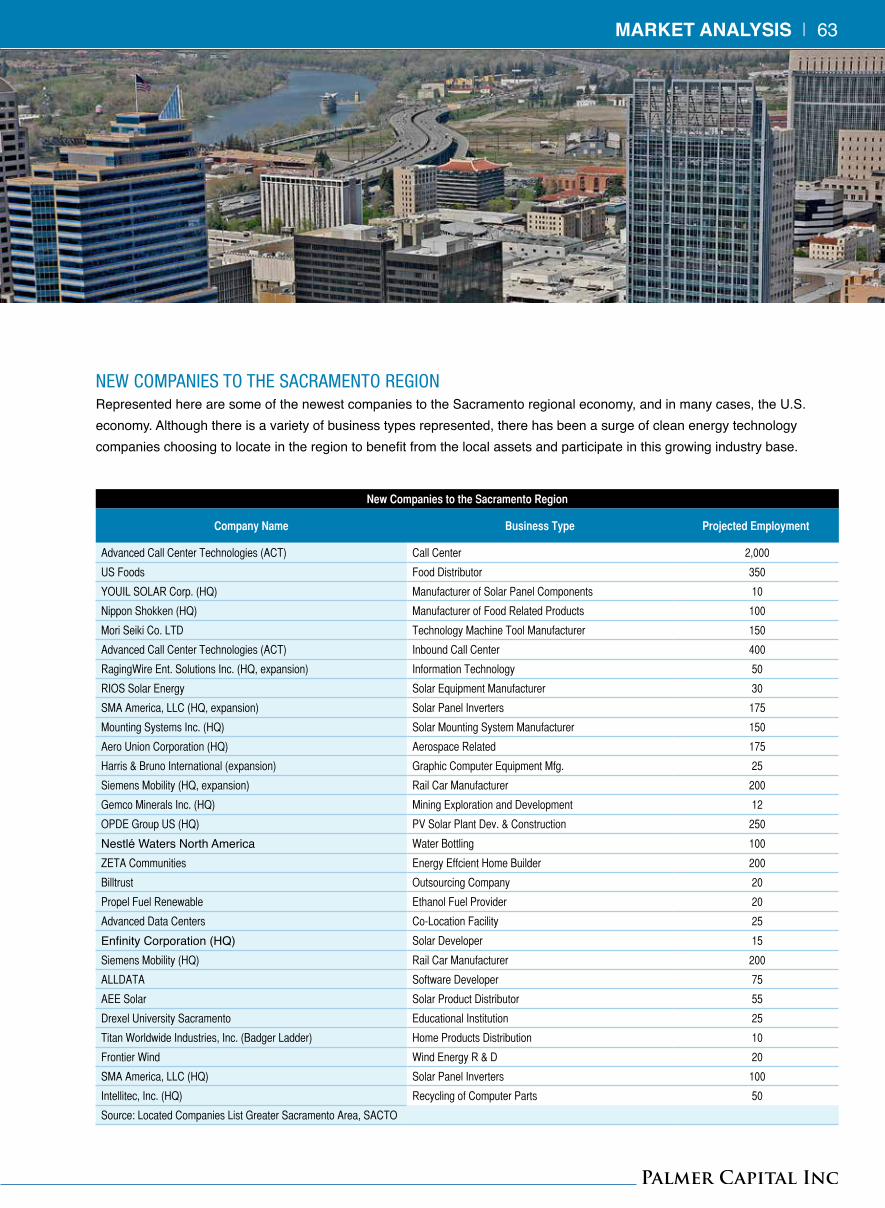
NEW COMPANIES TO THE SACRAMENTO REGIONRepresented here are some of the newest companies to the Sacramento regional economy, and in many cases, the U.S. economy. Although there is a variety of business types represented, there has been a surge of clean energy technology companies choosing to locate in the region to benefit from the local assets and participate in this growing industry base.
NewCompaniestotheSacramentoRegion
CompanyName BusinessType ProjectedEmployment
Advanced Call Center Technologies (ACT) Call Center 2,000
US Foods Food Distributor 350
YOUIL SOLAR Corp. (HQ) Manufacturer of Solar Panel Components 10
Nippon Shokken (HQ) Manufacturer of Food Related Products 100
Mori Seiki Co. LTD Technology Machine Tool Manufacturer 150
Advanced Call Center Technologies (ACT) Inbound Call Center 400
RagingWire Ent. Solutions Inc. (HQ, expansion) Information Technology 50
RIOS Solar Energy Solar Equipment Manufacturer 30
SMA America, LLC (HQ, expansion) Solar Panel Inverters 175
Mounting Systems Inc. (HQ) Solar Mounting System Manufacturer 150
Aero Union Corporation (HQ) Aerospace Related 175
Harris & Bruno International (expansion) Graphic Computer Equipment Mfg. 25
Siemens Mobility (HQ, expansion) Rail Car Manufacturer 200
Gemco Minerals Inc. (HQ) Mining Exploration and Development 12
OPDE Group US (HQ) PV Solar Plant Dev. & Construction 250
Nestlé Waters North America Water Bottling 100
ZETA Communities Energy Effcient Home Builder 200
Billtrust Outsourcing Company 20
Propel Fuel Renewable Ethanol Fuel Provider 20
Advanced Data Centers Co-Location Facility 25
Enfinity Corporation (HQ) Solar Developer 15
Siemens Mobility (HQ) Rail Car Manufacturer 200
ALLDATA Software Developer 75
AEE Solar Solar Product Distributor 55
Drexel University Sacramento Educational Institution 25
Titan Worldwide Industries, Inc. (Badger Ladder) Home Products Distribution 10
Frontier Wind Wind Energy R & D 20
SMA America, LLC (HQ) Solar Panel Inverters 100
Intellitec, Inc. (HQ) Recycling of Computer Parts 50
Source: Located Companies List Greater Sacramento Area, SACTO
MARKET ANALYSIS | 63
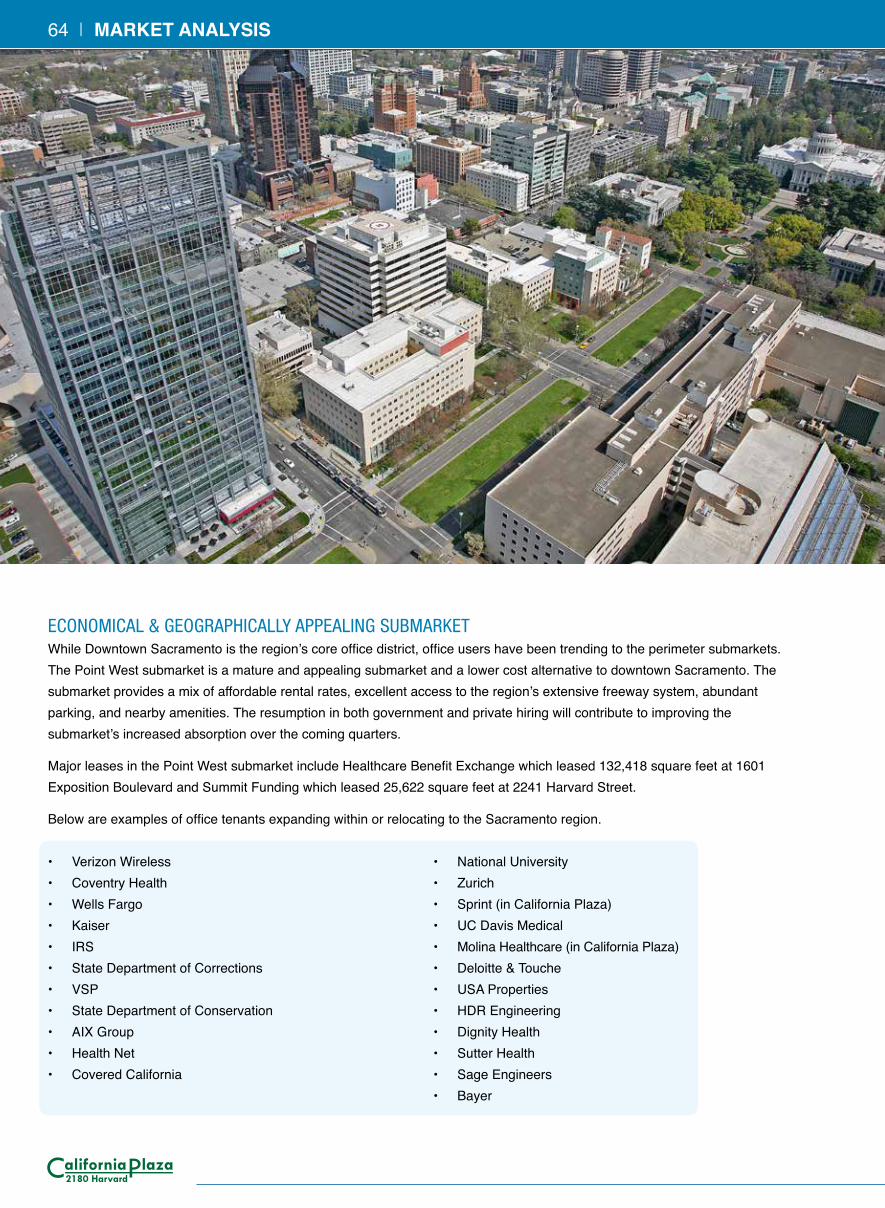
ECONOMICAL & GEOGRAPHICALLY APPEALING SUBMARKETWhile Downtown Sacramento is the region’s core office district, office users have been trending to the perimeter submarkets. The Point West submarket is a mature and appealing submarket and a lower cost alternative to downtown Sacramento. The submarket provides a mix of affordable rental rates, excellent access to the region’s extensive freeway system, abundant parking, and nearby amenities. The resumption in both government and private hiring will contribute to improving the submarket’s increased absorption over the coming quarters.
Major leases in the Point West submarket include Healthcare Benefit Exchange which leased 132,418 square feet at 1601 Exposition Boulevard and Summit Funding which leased 25,622 square feet at 2241 Harvard Street.
Below are examples of office tenants expanding within or relocating to the Sacramento region.
• Verizon Wireless• Coventry Health• Wells Fargo• Kaiser• IRS• State Department of Corrections• VSP• State Department of Conservation• AIX Group• Health Net• Covered California
• National University• Zurich• Sprint (in California Plaza)• UC Davis Medical• Molina Healthcare (in California Plaza)• Deloitte & Touche• USA Properties• HDR Engineering• Dignity Health• Sutter Health• Sage Engineers• Bayer
64 | MARKET ANALYSIS
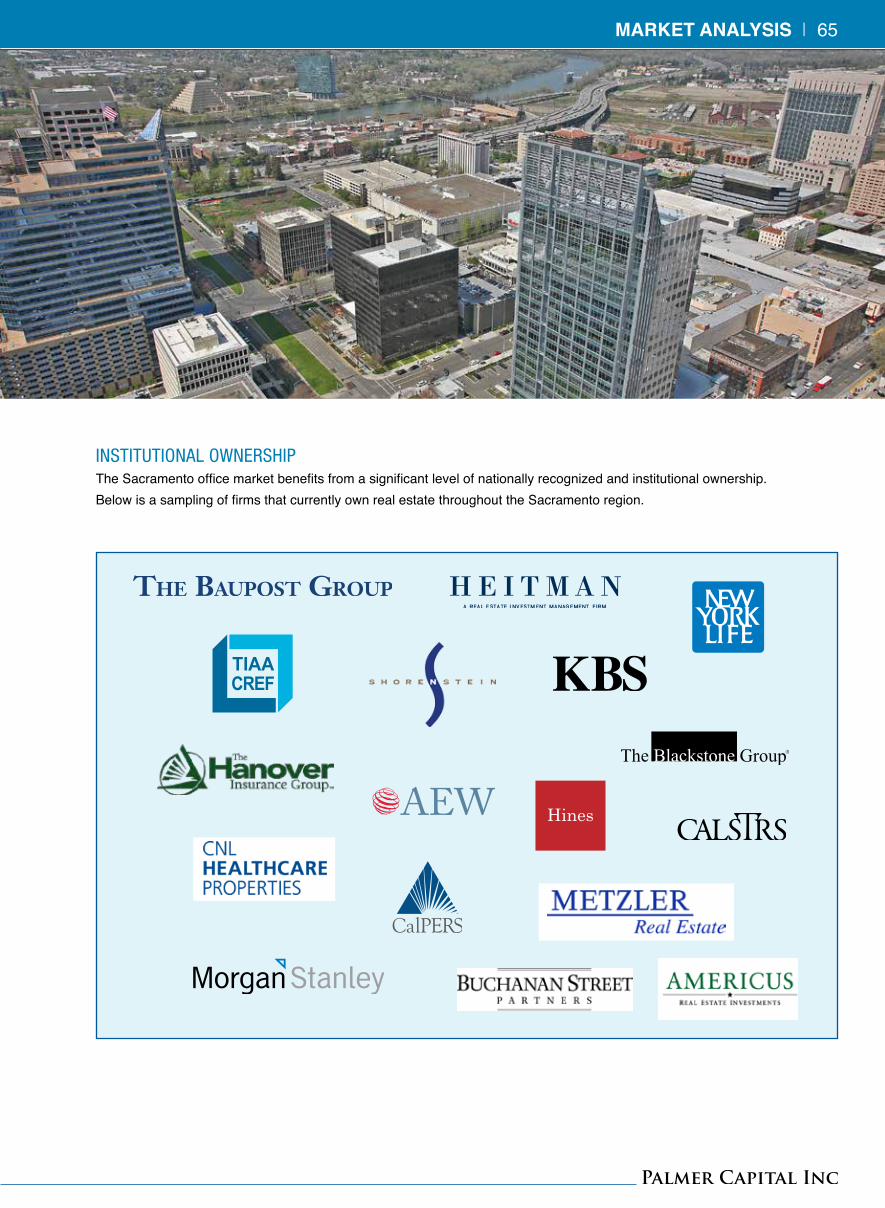
INSTITUTIONAL OWNERSHIPThe Sacramento office market benefits from a significant level of nationally recognized and institutional ownership. Below is a sampling of firms that currently own real estate throughout the Sacramento region.
MARKET ANALYSIS | 65
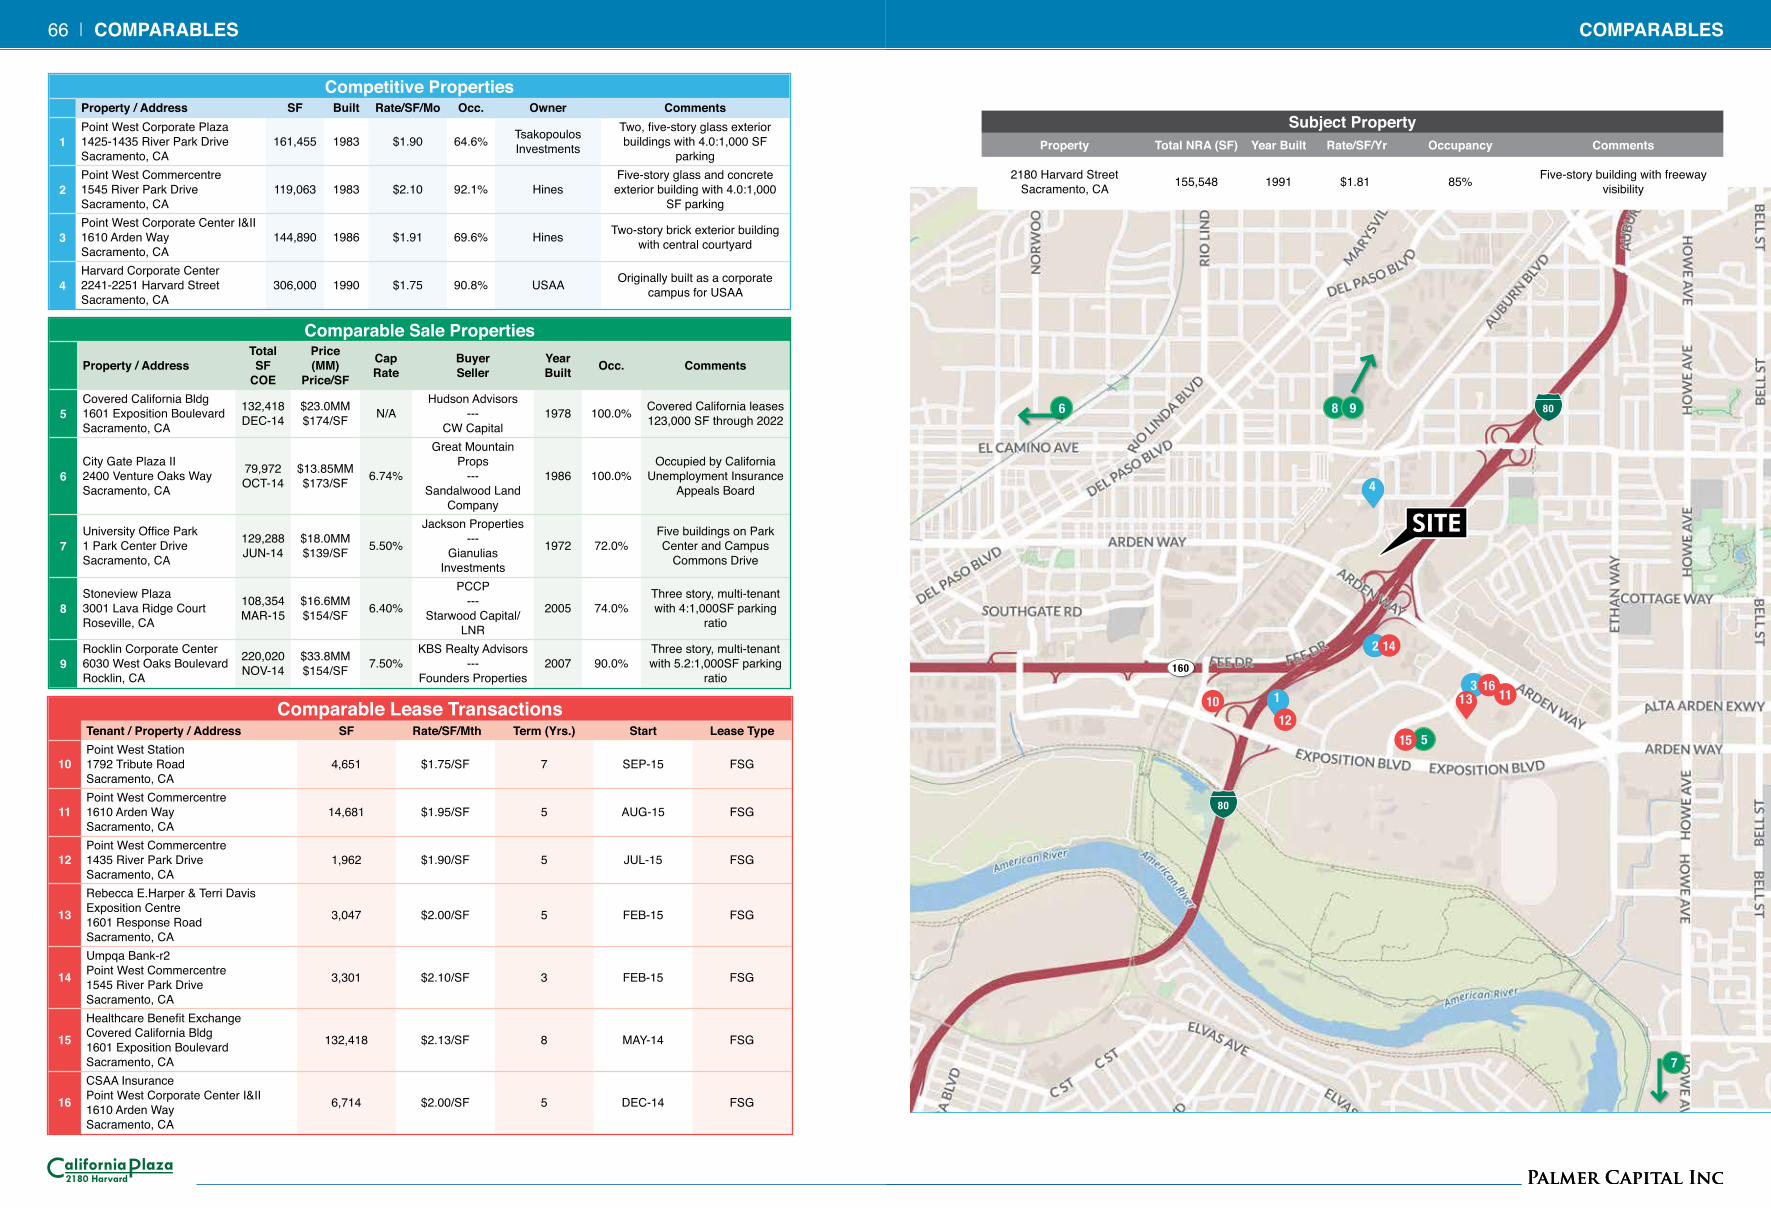
Comparable Sale Properties
Property / AddressTotal SF
COE
Price (MM)
Price/SF
Cap Rate
Buyer Seller
Year Built Occ. Comments
5Covered California Bldg 1601 Exposition Boulevard Sacramento, CA
132,418 DEC-14
$23.0MM $174/SF N/A
Hudson Advisors ---
CW Capital1978 100.0% Covered California leases
123,000 SF through 2022
6City Gate Plaza II 2400 Venture Oaks Way Sacramento, CA
79,972 OCT-14
$13.85MM $173/SF 6.74%
Great Mountain Props
--- Sandalwood Land
Company
1986 100.0%Occupied by California
Unemployment Insurance Appeals Board
7University Office Park 1 Park Center Drive Sacramento, CA
129,288 JUN-14
$18.0MM $139/SF 5.50%
Jackson Properties ---
Gianulias Investments
1972 72.0%Five buildings on Park Center and Campus
Commons Drive
8Stoneview Plaza 3001 Lava Ridge Court Roseville, CA
108,354 MAR-15
$16.6MM $154/SF 6.40%
PCCP ---
Starwood Capital/LNR
2005 74.0%Three story, multi-tenant with 4:1,000SF parking
ratio
9Rocklin Corporate Center 6030 West Oaks Boulevard Rocklin, CA
220,020 NOV-14
$33.8MM $154/SF 7.50%
KBS Realty Advisors ---
Founders Properties2007 90.0%
Three story, multi-tenant with 5.2:1,000SF parking
ratio
Competitive PropertiesProperty / Address SF Built Rate/SF/Mo Occ. Owner Comments
1Point West Corporate Plaza 1425-1435 River Park Drive Sacramento, CA
161,455 1983 $1.90 64.6% Tsakopoulos Investments
Two, five-story glass exterior buildings with 4.0:1,000 SF
parking
2Point West Commercentre 1545 River Park Drive Sacramento, CA
119,063 1983 $2.10 92.1% HinesFive-story glass and concrete exterior building with 4.0:1,000
SF parking
3Point West Corporate Center I&II 1610 Arden Way Sacramento, CA
144,890 1986 $1.91 69.6% Hines Two-story brick exterior building with central courtyard
4Harvard Corporate Center 2241-2251 Harvard Street Sacramento, CA
306,000 1990 $1.75 90.8% USAA Originally built as a corporate campus for USAA
Comparable Lease TransactionsTenant / Property / Address SF Rate/SF/Mth Term (Yrs.) Start Lease Type
10Point West Station 1792 Tribute Road Sacramento, CA
4,651 $1.75/SF 7 SEP-15 FSG
11Point West Commercentre 1610 Arden Way Sacramento, CA
14,681 $1.95/SF 5 AUG-15 FSG
12Point West Commercentre 1435 River Park Drive Sacramento, CA
1,962 $1.90/SF 5 JUL-15 FSG
13
Rebecca E.Harper & Terri Davis Exposition Centre 1601 Response Road Sacramento, CA
3,047 $2.00/SF 5 FEB-15 FSG
14
Umpqa Bank-r2 Point West Commercentre 1545 River Park Drive Sacramento, CA
3,301 $2.10/SF 3 FEB-15 FSG
15
Healthcare Benefit Exchange Covered California Bldg 1601 Exposition Boulevard Sacramento, CA
132,418 $2.13/SF 8 MAY-14 FSG
16
CSAA Insurance Point West Corporate Center I&II 1610 Arden Way Sacramento, CA
6,714 $2.00/SF 5 DEC-14 FSG
COMPARABLES | 6766 | COMPARABLES
Subject PropertyProperty Total NRA (SF) Year Built Rate/SF/Yr Occupancy Comments
COMPARABLES
Subject PropertyProperty Total NRA (SF) Year Built Rate/SF/Yr Occupancy Comments
2180 Harvard Street Sacramento, CA 155,548 1991 $1.81 85% Five-story building with freeway
visibility
7
6 8 9
5
3
2
4
1 13
160
16 11
15
1012
14
80
80

1478 Stone Point Drive, Suite 250 • Roseville, California 95661(916)462-6300 • www.palmercapital.com