Embed Size (px)
Citation preview

© 2018 ADA-ES, Inc., An Advanced Emissions Solutions, Inc. CompanyAll rights reserved.
Mercury Control Technologies
Connie Senior&Sharon Sjostrom
WPCA, Kansas City, June 5-6, 2018

© 2018 ADA-ES, Inc. All rights reserved. -2-
Disclaimer
This presentation includes general information on coal and coal-fired boilers intended for education and illustration purposes only. All information is provided “AS-IS” and without warranty or liability of any kind.

© 2018 ADA-ES, Inc. All rights reserved. -3-
Overview
Factors affecting Hg control usingBaghousesWet FGD scrubbersDry FGD ScrubbersESPs
We’ll also look at balance-of-plant effects of Hg control, including corrosion from added halogens

© 2018 ADA-ES, Inc. All rights reserved. -4-
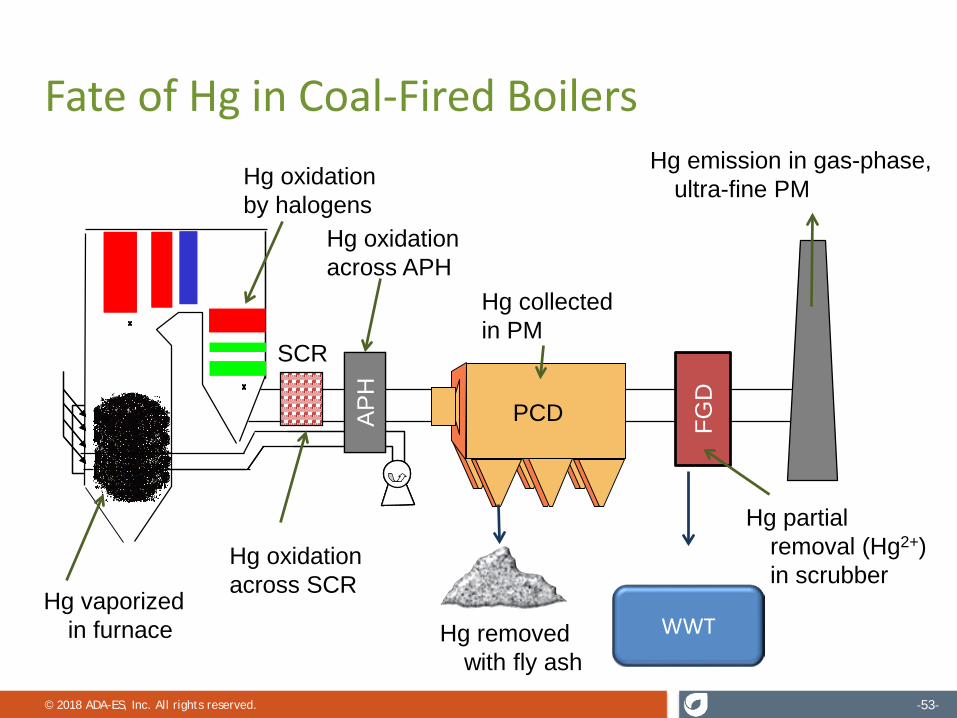
Fate of Hg in Coal-Fired Boilers
ESP or FFAP
H
PCD FGD
SCR
Hg vaporized in furnace
Hg oxidation by halogens
Hg oxidationacross SCR
Hg oxidation across APH
Hg collected in PM
Hg removed with fly ash
Hg emission in gas-phase, ultra-fine PM
Hg partial removal (Hg2+) in scrubber
WWT

© 2018 ADA-ES, Inc. All rights reserved. -5-
MercuryEmissions Control

© 2018 ADA-ES, Inc. All rights reserved. -6-
What Do We Mean by Hg Speciation? Gas-phase mercury:
Elemental: Hg0
Oxidized: Hg+2
(HgCl2, other species?)
Particulate mercury Hgp
Mercury (adsorbedon particles)
HgCl2
Gas-phase Reactions withhalogens
Hgp
HgHg0
Adsorption
Oxidation

© 2018 ADA-ES, Inc. All rights reserved. -7-
Two Ways to Remove Mercury
Adsorb Hg on particlesUnburned carbon in
fly ashSorbent injectionFixed adsorption
structures
Absorb Hg (Primarily Hg2+)Wet flue gas
desulfurization (FGD) scrubbersDry FGD scrubbers

© 2018 ADA-ES, Inc. All rights reserved. -8-
Mercury Control Technology Strategies
Three main strategies for Hg air emissions controlActivated carbon injection (ACI)Coal halogen injection (CHI)Wet or dry FGDs
These may be combined (e.g., ACI+CHI, CHI+FGD, ACI+FGD, etc.)
Hg control can have an impact on halogens and selenium in flue gas, ash, and water
© 2018 ADA-ES, Inc. All rights reserved. -9-
Mercury Control in Particulate Control Devices: Sorbents and Halogen Addition

© 2018 ADA-ES, Inc. All rights reserved. -10-
Factors Affecting Hg Control in Particulate Control Devices
Capacity of PAC/Fly ash Temperature SO3
Cleaning frequency (for baghouses) Residence time (for ESPs)

© 2018 ADA-ES, Inc. All rights reserved. -11-
0
50
100
150
200
250
300
350
400
200 250 300 350 400 450
Equi
libriu
m C
apac
ity (µ
g/m
3 )at
8 µ
g/m
3H
g
Temp (F)
PAC Adsorption Capacity vs. Temperature The higher the temperature, the less Hg can be held on PAC This “equilibrium capacity” is also a function of the Hg
concentration in the gas: Higher inlet Hg concentration => higher equilibrium capacity on PAC
Fixed Bed Data
Lab data – simulated flue gas

© 2018 ADA-ES, Inc. All rights reserved. -12-
Mercury “Breakthrough” and Baghouses
In a baghouse, gas passes across a “fixed bed” of PAC on the filter cake
If PAC is allowed to remain on the filter after becoming saturated with Hg, it will release mercury, especially if the temperature increases
High oxidized Hg at the stack on a unit firing low halogen coal (e.g. PRB) suggests that the PAC is adsorbing and releasing Hg
This looks a lot like re-emission

© 2018 ADA-ES, Inc. All rights reserved. -13-
Example: BH Temperature and Hg Emissions PRB boiler with oversized BH using brominated PAC (fixed injection rate at
high load; no injection at low load) Long times between cleaning mean that PAC approaches equilibrium
capacity for Hg Hg typically increases at higher BH temperatures as maximum “capacity”
decreases
0
1
2
3
4
5
6
220 240 260 280 300 320
HgT,
ug/
m3
Baghouse inlet temperature, F
HgT (low load)
HgT (high load)

© 2018 ADA-ES, Inc. All rights reserved. -14-
Example: BH Temperature and Hg EmissionsEstimated Hg loading on the PAC Long times between cleaning in this baghouse mean that PAC approaches
“equilibrium capacity” for Hg => consistent with lab fixed bed data As temperature increases, the PAC holds less Hg on average Which means more PAC must be injected at higher temperatures to remove Hg
0
50
100
150
200
250
300
350
400
225 245 265 285 305 325
Load
ing,
ug/
g
Baghouse inlet temperature, F
Hg capacity
Lab data
Hg loading on PAC as a function of temperature
© 2018 ADA-ES, Inc. All rights reserved. -15-
Suggestions for Managing Re-emissions from Baghouses
Increase the PAC injection rate at higher temperatures
Managing cleaning Cleaning more frequently to remove PAC saturated with
Hg (does not overcome injection below required rates) Remove excess PAC before ramping load (large increase
in temp = potential to release previously collected Hg)
Improve the capacity of the PAC at higher temperatures (carbon selection)
© 2018 ADA-ES, Inc. All rights reserved. -16-
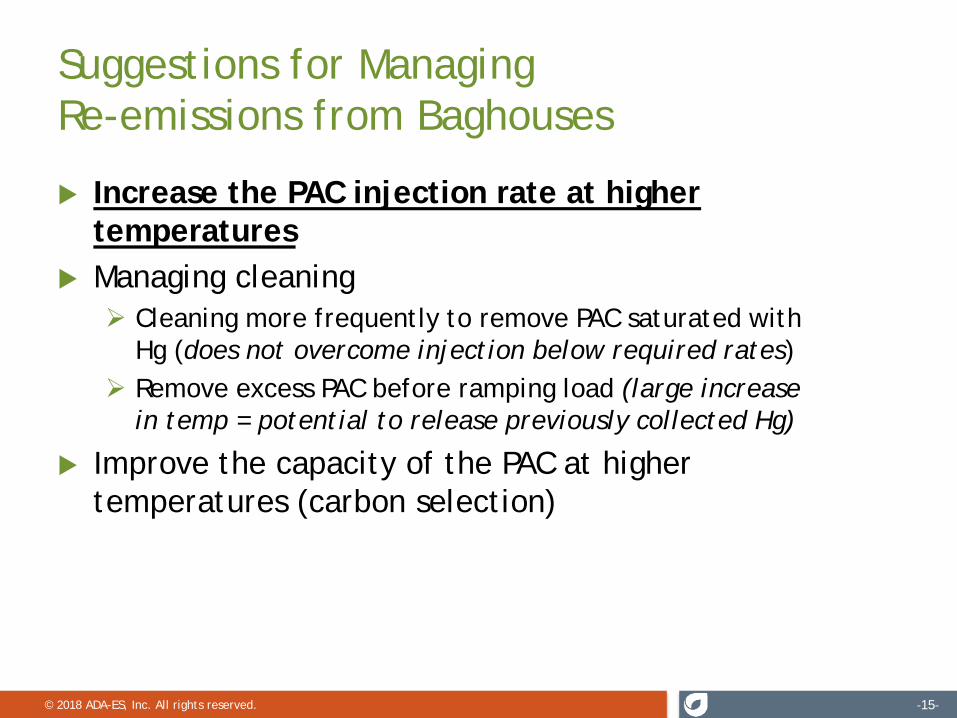
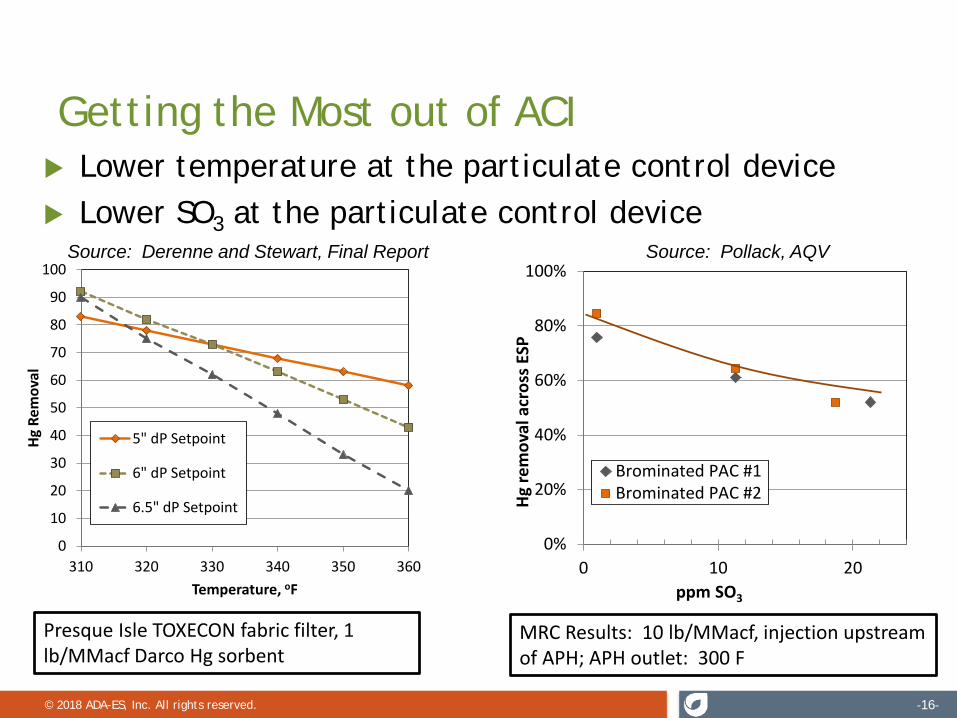
Lower temperature at the particulate control device
Getting the Most out of ACI
0
10
20
30
40
50
60
70
80
90
100
310 320 330 340 350 360
Hg
Rem
oval
Temperature, oF
5" dP Setpoint
6" dP Setpoint
6.5" dP Setpoint
Presque Isle TOXECON fabric filter, 1 lb/MMacf Darco Hg sorbent
MRC Results: 10 lb/MMacf, injection upstream of APH; APH outlet: 300 F
0%
20%
40%
60%
80%
100%
0 10 20
Hg re
mov
al a
cros
s ESP
ppm SO3
Brominated PAC #1Brominated PAC #2
Lower SO3 at the particulate control deviceSource: Pollack, AQVSource: Derenne and Stewart, Final Report

© 2018 ADA-ES, Inc. All rights reserved. -17-
Residence time: Challenge for ESPs Short residence times on ESPs make it difficult to
capture enough mercury, especially for injection downstream of APH
Solution: inject upstream of APH
0
10
20
30
40
50
60
70
80
90
100
0 2 4 6 8 10
Hg R
emov
al
lb/MMacf
Plant A, APH INLET
Plant A, APH OUTLET
Plant B, APH INLET
Plant B, APH OUTLET
Brominated PA C and no SO3 FGC

© 2018 ADA-ES, Inc. All rights reserved. -18-
Residence time: Challenge for ESPs
Two units burn similar PRB coals
Boiler A has longer duct residence time
Boiler B has short residence time between APH and ESP inlet AND Chevron-style inlets
Testing of pre-APH brominated PAC injection on both units at 315-320 F
0%
10%
20%
30%
40%
50%
60%
70%
80%
90%
100%
0.0 0.5 1.0 1.5 2.0 2.5
Hg R
emov
al
lb/MMacf
Boiler A
Boiler B

© 2018 ADA-ES, Inc. All rights reserved. -19-
Summary: Sorbent Addition
For ACI: lower temperature and lower SO3 at the particulate control device is always better
PAC usage with an ESP can be reduced by improving mass transfer to the PAC Reducing particle size Using mixing devices to improve distribution Injecting upstream of APH Using a PAC with faster reaction kinetics
© 2018 ADA-ES, Inc. All rights reserved. -20-
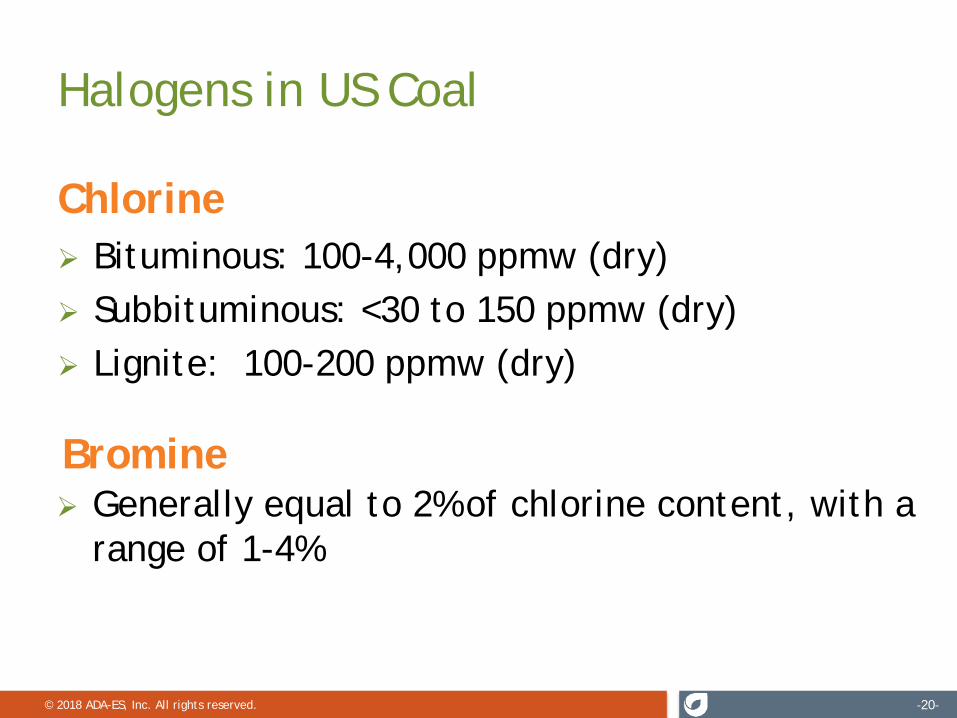
Halogens in US Coal
Chlorine Bituminous: 100-4,000 ppmw (dry) Subbituminous: <30 to 150 ppmw (dry) Lignite: 100-200 ppmw (dry)
Bromine Generally equal to 2% of chlorine content, with a
range of 1-4%

© 2018 ADA-ES, Inc. All rights reserved. -21-http://ugs.utah.gov/emp/mercury/index.htm © 2014 ADA-ES, Inc

© 2018 ADA-ES, Inc. All rights reserved. -22-
Bromine in Coal
Scatter-plot showing average chlorine (Cl) and bromine (Br) contents, in parts per million (ppm), for various ranks (grades) of coal produced in 110 US counties
Contents of Br in coal are commonly about 2 percent of the Cl content (Br/Cl = 0.02), the ratio generally ranging from 1 to 4 percent (dashed lines indicate this range)
Source: Kolker et al., 2012
© 2018 ADA-ES, Inc. All rights reserved. -23-
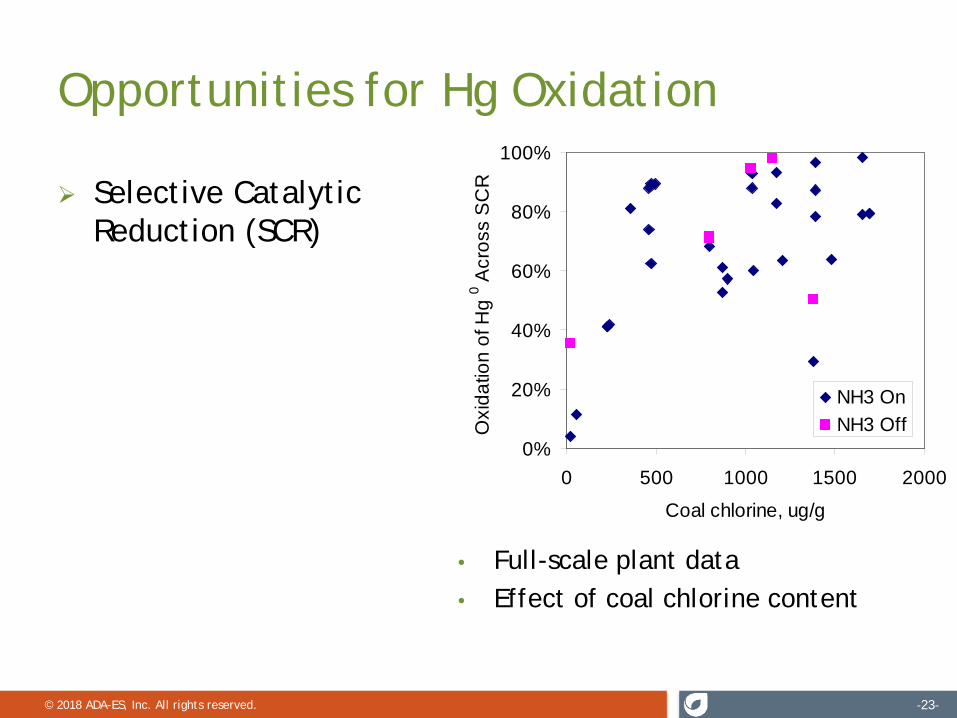
Opportunities for Hg Oxidation
Selective Catalytic Reduction (SCR)
• Full-scale plant data• Effect of coal chlorine content
0%
20%
40%
60%
80%
100%
0 500 1000 1500 2000
Coal chlorine, ug/gO
xida
tion
of H
g0 A
cros
s S
CR
NH3 OnNH3 Off
© 2018 ADA-ES, Inc. All rights reserved. -24-
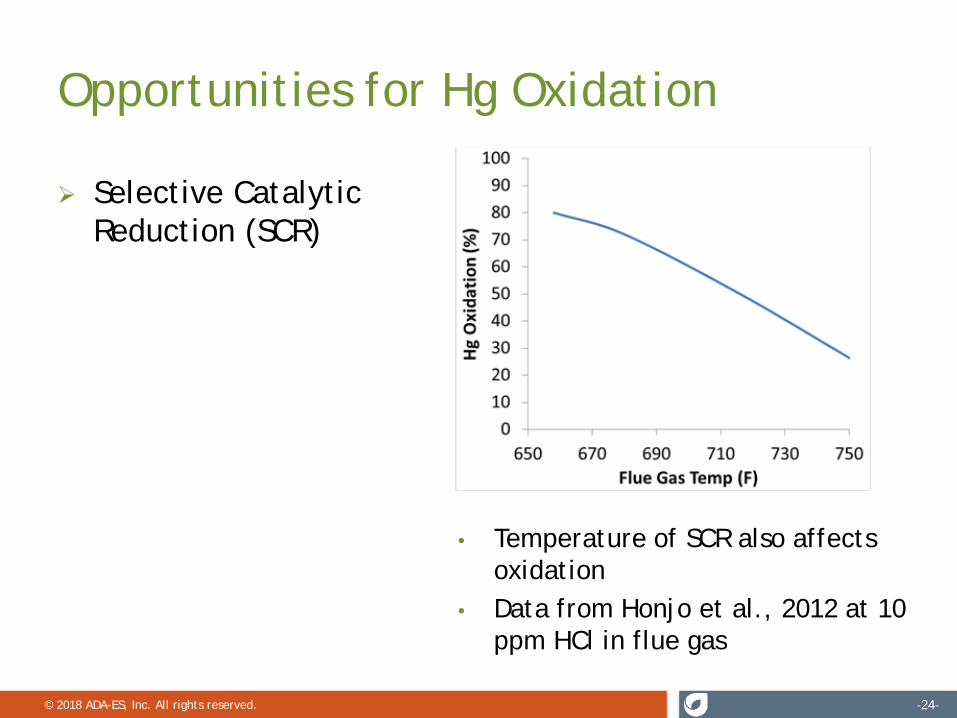
Opportunities for Hg Oxidation
Selective Catalytic Reduction (SCR)
• Temperature of SCR also affects oxidation
• Data from Honjo et al., 2012 at 10 ppm HCl in flue gas
© 2018 ADA-ES, Inc. All rights reserved. -25-
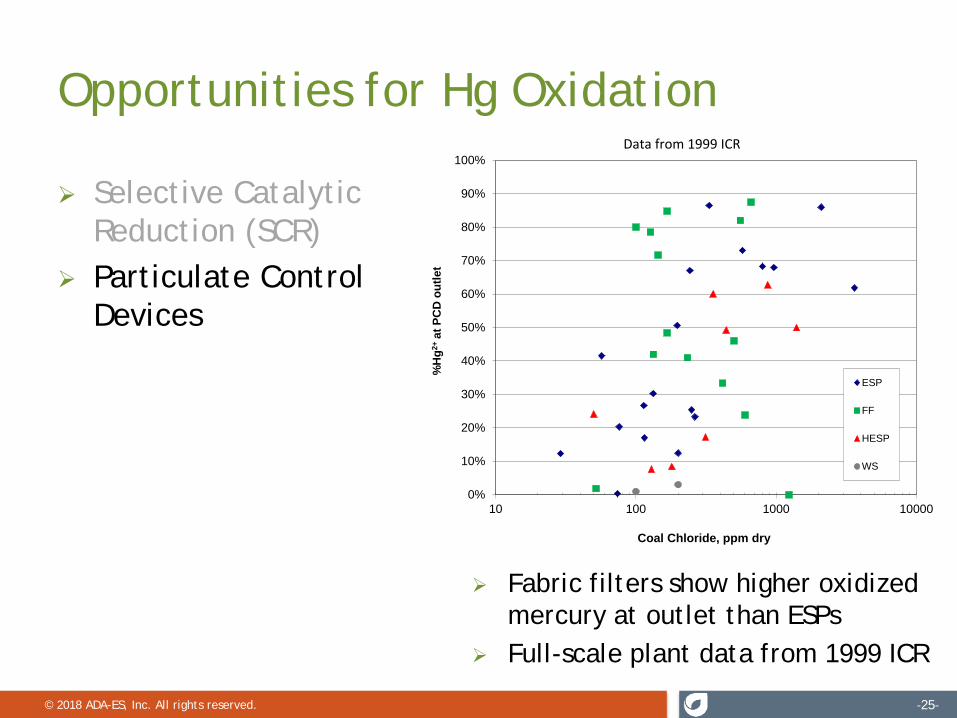
Opportunities for Hg Oxidation
Selective Catalytic Reduction (SCR)
Particulate Control Devices
Fabric filters show higher oxidized mercury at outlet than ESPs
Full-scale plant data from 1999 ICR
0%
10%
20%
30%
40%
50%
60%
70%
80%
90%
100%
10 100 1000 10000
%H
g2+
at P
CD
out
let
Coal Chloride, ppm dry
ESP
FF
HESP
WS
Data from 1999 ICR
© 2018 ADA-ES, Inc. All rights reserved. -26-
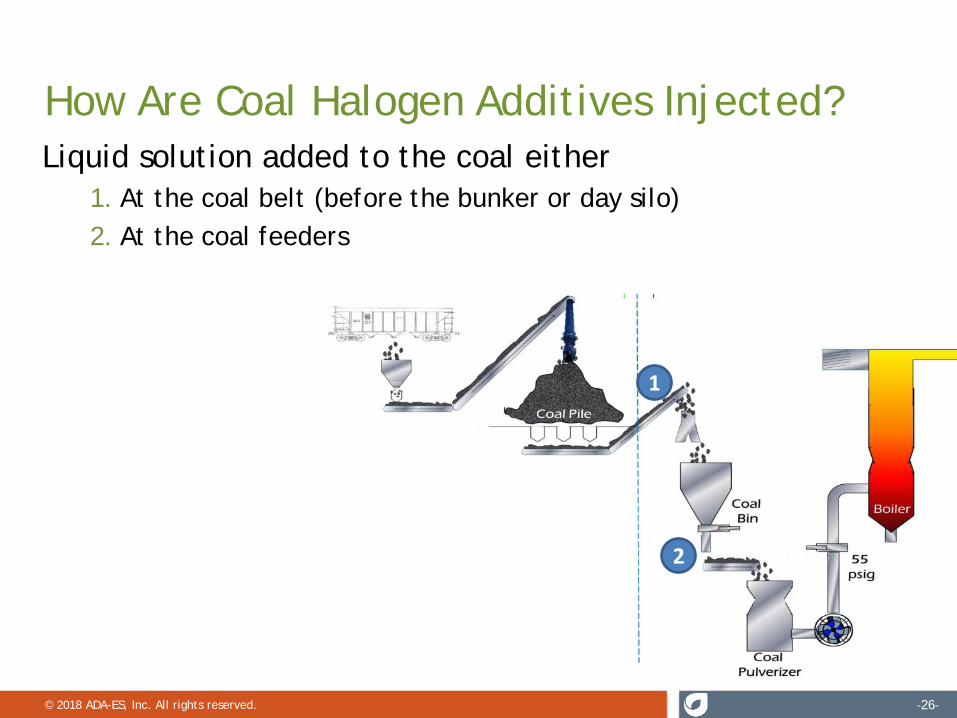
Liquid solution added to the coal either1. At the coal belt (before the bunker or day silo)2. At the coal feeders
How Are Coal Halogen Additives Injected?
1
2

© 2018 ADA-ES, Inc. All rights reserved. -27-
Opportunities for Hg Oxidation
Selective Catalytic Reduction (SCR)
Particulate Control Devices
How adding more halogens helps
Bromine addition more effective than chlorine, lb per lb of coal
Full-scale data from Dombrowski et al., 2006
0
20
40
60
80
100
0 500 1000 1500 2000 2500 3000
Halogen in Coal, ppmw dry
%O
xidi
zed
Hg
at A
ir P
rehe
ater
O
utle
t
NaClMgCl2CaCl2HClCaBr2

© 2018 ADA-ES, Inc. All rights reserved. -28-
Opportunities for Hg Oxidation
Selective Catalytic Reduction (SCR)
Particulate Control Devices
How adding more halogens helps
Iodine addition more effective than bromine, lb per lb of coal
Full-scale data from Gadgil, et al., 2015
0%10%20%30%40%50%60%70%80%90%
100%
0 50 100 150 200
Hg2+
at E
SP O
utle
t
Halogen addition, µg/g
Iodine
Bromine

© 2018 ADA-ES, Inc. All rights reserved. -29-
Opportunities for Hg Oxidation
Selective Catalytic Reduction (SCR)
Particulate Control Devices
How adding more halogens helps
• Having an SCR helps!
0102030405060708090
100
0 10 20 30H
g0O
xida
tion
Halogen concentration, ppmv
751oF, 350 ppmv NO, 0.9 MR, 3.5% O2, 12% H2O1000 ppmv SO2, 11 ppmv SO3, 100 ppmv CO
Source: Bertole, NOx Roundtable 2015
Bromine
Iodine
Chlorine
© 2018 ADA-ES, Inc. All rights reserved. -30-
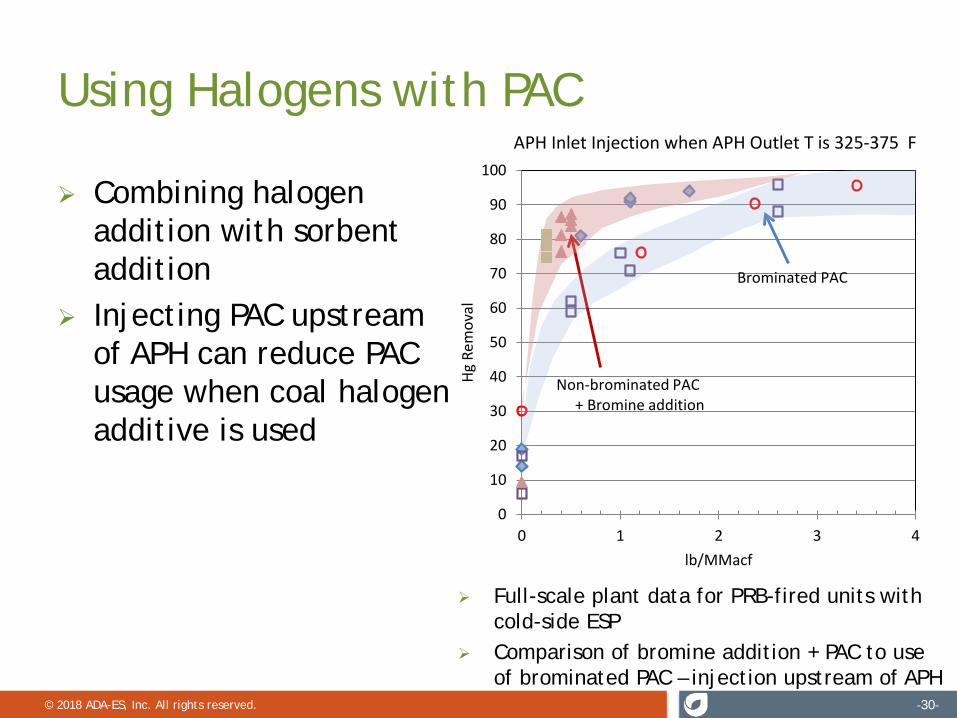
Using Halogens with PAC
Combining halogen addition with sorbent addition
Injecting PAC upstream of APH can reduce PAC usage when coal halogen additive is used
Full-scale plant data for PRB-fired units with cold-side ESP
Comparison of bromine addition + PAC to use of brominated PAC – injection upstream of APH
0
10
20
30
40
50
60
70
80
90
100
0 1 2 3 4
Hg R
emov
al
lb/MMacf
APH Inlet Injection when APH Outlet T is 325-375 F
Non-brominated PAC+ Bromine addition
Brominated PAC
© 2018 ADA-ES, Inc. All rights reserved. -31-
Mercury Control in Scrubbers: FGD Operation and Halogen Addition

© 2018 ADA-ES, Inc. All rights reserved. -32-
Opportunities for Hg Absorption
Wet or dry scrubbers
Full-scale plant data Scrubbers take advantage of native
capture…if there’s enough oxidized Hg (Hg2+) Note difference between dry and wet FGDs:
effect of FF (dry) and re-emission of Hg0 (wet)
0%
20%
40%
60%
80%
100%
0% 20% 40% 60% 80% 100%
Rem
oval
of H
g ac
ross
FG
D
Fraction Hg2+ at Inlet
Dry FGD, FF
Wet FGD

© 2018 ADA-ES, Inc. All rights reserved. -33-
Using Halogens with Wet Scrubbers Bromine addition at subbituminous-fired plant with ESP and wet FGD Adding bromine to the fuel:
- Increased Hg2+ at FGD inlet- Decreased concentration of Hg at the stack- Can result in transient changes in Hg speciation:
- Higher Hg0 at stack than at FGD inlet
0
100
200
300
400
500
600
0.0
1.0
2.0
3.0
4.0
5.0
6.0
7.0
23-Sep 27-Sep 1-Oct 5-Oct
Load
, MW
/ C
aBr2
, ug/
g
Hg, μ
g/w
scm
Hg0 at FGD Inlet Hg0 at FGD Outlet Load CaBr2

© 2018 ADA-ES, Inc. All rights reserved. -34-
Factors Affecting Hg Control in Wet Scrubbers
Inlet Hg speciation: how much gas-phase oxidized Hg
Scrubber ORP… and all the things that affect ORP
© 2018 ADA-ES, Inc. All rights reserved. -35-
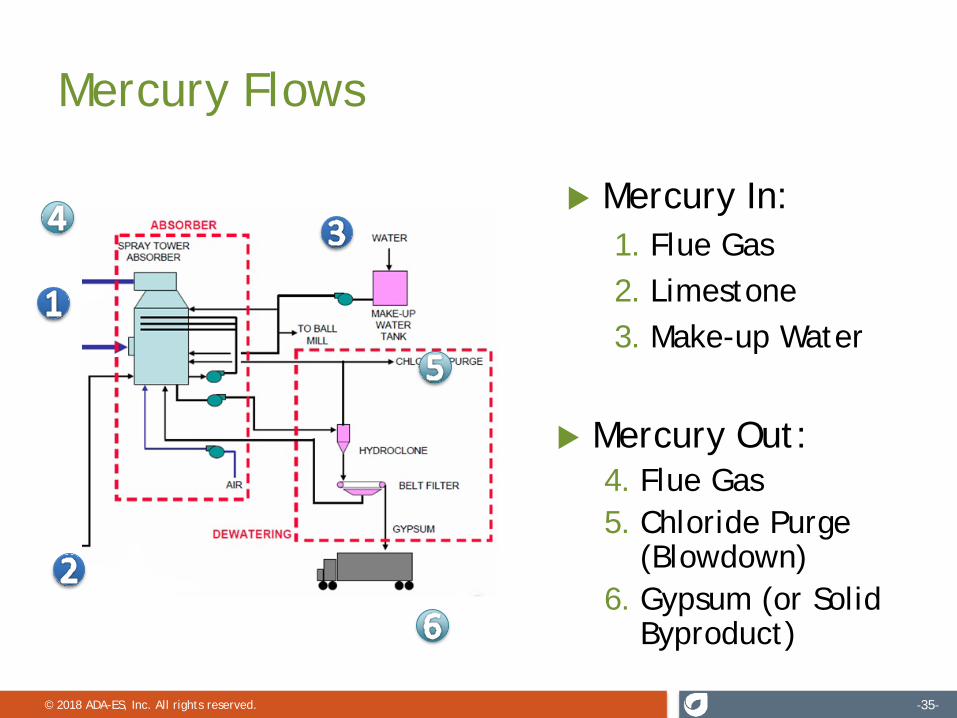
Mercury Flows
Mercury In:1. Flue Gas2. Limestone3. Make-up Water
Mercury Out:4. Flue Gas5. Chloride Purge
(Blowdown)6. Gypsum (or Solid
Byproduct)

© 2018 ADA-ES, Inc. All rights reserved. -36-
Mercury Flows: IN
Species Solubility at 50oC, mg/kg (ppmw)*
Hg0 0.12
HgCl2 1 x 10⁵
HgBr2 7 x 10³
*as Hg elemental
Mercury In:1. Flue Gas2. Limestone3. Maker-up Water
Most Hg enters FGD in flue gas
Different Hg species have different solubilities
© 2018 ADA-ES, Inc. All rights reserved. -37-
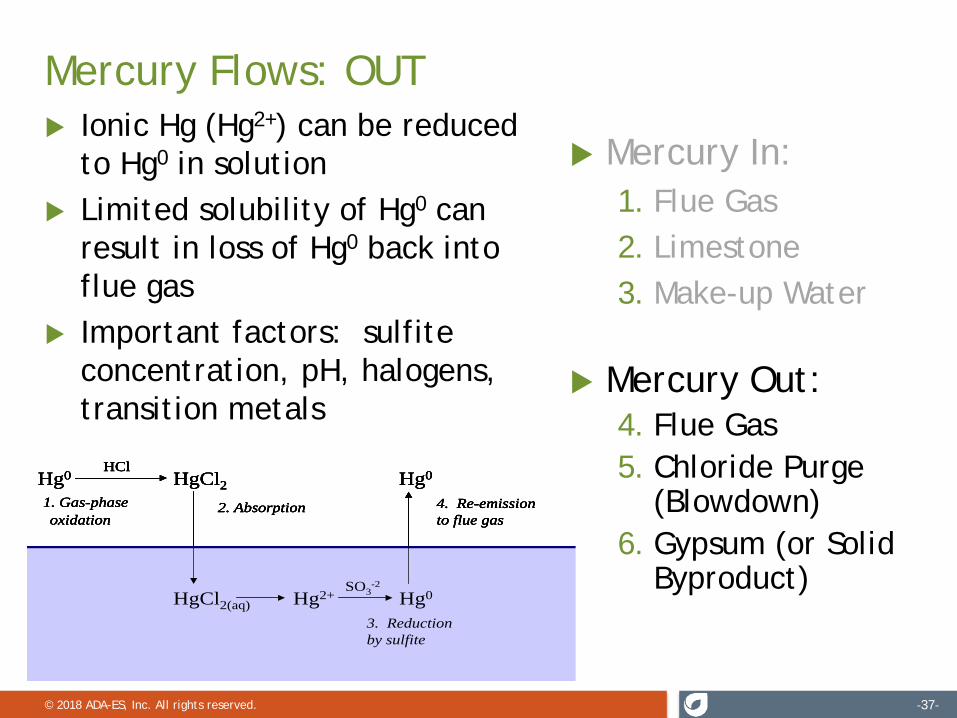
Mercury Flows: OUT Ionic Hg (Hg2+) can be reduced
to Hg0 in solution Limited solubility of Hg0 can
result in loss of Hg0 back into flue gas
Important factors: sulfite concentration, pH, halogens, transition metals
Hg0 HgCl21. Gas-phase oxidation in quench tower
HgCl2(aq) Hg2+ Hg0
2. Absorption in quench brine
3. Reduction by sulfite in brine
4. Re-emission to flue gas
Hg0HCl
SO3-2
Hg0 HgCl21. Gas-phase oxidation in quench tower
HgCl2(aq) Hg2+ Hg0
2. Absorption in quench brine
3. Reduction by sulfite in brine
4. Re-emission to flue gas
Hg0HCl
SO3-2
Hg0 HgCl21. Gas-phase oxidation in quench tower
HgCl2(aq) Hg2+ Hg0
2. Absorption in quench brine
3. Reduction by sulfite in brine
4. Re-emission to flue gas
Hg0HCl
SO3-2
Hg0 HgCl21. Gas-phase oxidation in quench tower
HgCl2(aq) Hg2+ Hg0
2. Absorption in quench brine
3. Reduction by sulfite in brine
4. Re-emission to flue gas
Hg0HCl
SO3-2
Mercury In:1. Flue Gas2. Limestone3. Make-up Water
Mercury Out:4. Flue Gas5. Chloride Purge
(Blowdown)6. Gypsum (or Solid
Byproduct)

© 2018 ADA-ES, Inc. All rights reserved. -38-
Mercury Flows: OUT Distribution of Hg between FGD byproduct, gypsum
fines, and fines liquor
Source: Richardson et al., 2003
0
20
40
60
80
100
120
140
%H
g in
Coa
l
Fines Liquor
Gypsum Fines
FGD Byproduct
Fly Ash
LSF = Limestone Forced Oxidation LS = Lime Forced Oxidation
LSI - Limestone Inhibited LSN = Limestone Natural Oxidation
Mercury In:1. Flue Gas2. Limestone3. Make-up Water
Mercury Out:4. Flue Gas5. Chloride Purge
(Blowdown)6. Gypsum (or Solid
Byproduct)

© 2018 ADA-ES, Inc. All rights reserved. -39-
Example: Increasing Capture of Hg2+
Bromine addition at subbituminous-fired plant with ESP and wet FGD
0
100
200
300
400
500
600
0.0
1.0
2.0
3.0
4.0
5.0
6.0
7.0
23-Sep 27-Sep 1-Oct 5-Oct
Load
, MW
/ C
aBr2
, ug/
g
Hg, μ
g/w
scm
Hg0 at FGD Inlet Hg0 at FGD Outlet Load CaBr2
Adding bromine to the fuel:- Increased Hg2+ at FGD
inlet- Decreased concentration
of Hg at the stack- Can result in transient
changes in Hg speciation:
- Higher Hg0 at stack than at FGD inlet

© 2018 ADA-ES, Inc. All rights reserved. -40-
Impact of Load Cycling Cycling load affects ORP and Hg emissions Load affects L/G ratio, ratio of O2 to SO2 in flue gas and
reaction tank
Source: Workshop 04, Effects of MATS Control and Variable Unit Load on ORP and Trace Metals in FGD Wastewater Reinhold APC Roundtable, 2016

© 2018 ADA-ES, Inc. All rights reserved. -41-
ORP Primer Oxidation-Reduction Potential (ORP) is a measurement
that indicates the degree to which a solution is capable of oxidizing or reducing another substance
ORP is measured in millivolts (mV) using an ORP meter The higher the ORP reading, the more oxidizing the
solution
Why is ORP important?Measure of sulfite oxidation rate in scrubber slurryProvides insight into trace metal behavior (Hg, Se,
Mn, As)

© 2018 ADA-ES, Inc. All rights reserved. -42-
ORP & Wet FGDs Why is it important to control ORP?Reduce corrosion in FGD absorberMaintain FGD product qualityReduce trace metals (Hg, As, Se) in scrubber dischargeReduce impact of load changes on Hg emissions
What impacts ORP?Mass rate of SO2 scrubbedAmount of O2 absorbed by scrubber slurrypHTransition metal catalysts in scrubber slurry (Cu, Mn, Fe)Reducing or oxidizing species added to scrubber (e.g.,
organic acid buffers, sulfur/thiosulfate, Hg re-emission additives)

© 2018 ADA-ES, Inc. All rights reserved. -43-
ORP Affects Dissolved Hg Fraction of Hg in
the liquid phase of scrubber slurry related to ORP
LESS Hg in liquid phase meansLess potential
for Hg re-emission during upsets
Less burden on WWT system
Source: Blythe et al., 2011

© 2018 ADA-ES, Inc. All rights reserved. -44-
Controlling ORP in Wet FGDs
Forced oxidation scrubbers: lower oxidation air rate or turn off, if possible
Raise pH set point Lower L/G ratio (fewer recycle pumps) at low load Increase SO2/O2 ratio in flue gas (lower excess air,
higher sulfur coal) Increase TDS by tightening water balance Use reducing additives (e.g., organosulfides) Improve ESP performance to reduce transition metals
from fly ash

© 2018 ADA-ES, Inc. All rights reserved. -45-
Downstream Effects on WWT:FGD Design & Operation
Design of the FGD and its operation affect speciation and concentration of Hg, Se, and As in the scrubber solutionScrubber reagentDesign: Forced oxidation vs. natural or
inhibited oxidationOperation:
• Load-following• ORP control

© 2018 ADA-ES, Inc. All rights reserved. -46-
Balance of Plant Considerations

© 2018 ADA-ES, Inc. All rights reserved. -47-
Dew Point Corrosion• Direct condensation when
process temperature drops below respective dew point temperature
• Sufficiently low temperatures possible at any air leak location
Deliquescent Corrosion • Formation of halogen salts on
cold surfaces -- reaction with flue gas moisture forms concentrated corrosive
Active Corrosion• Gas-phase reactions with metals
Halogen Corrosion Mechanismsin Flue Gas
Bromine Refined Coal Application
Brominated PAC - Upstream Injection
Corrosion from The Operator’s Perspective –PacifiCorp, Steag - Reinhold, 2014
© 2018 ADA-ES, Inc. All rights reserved. -48-
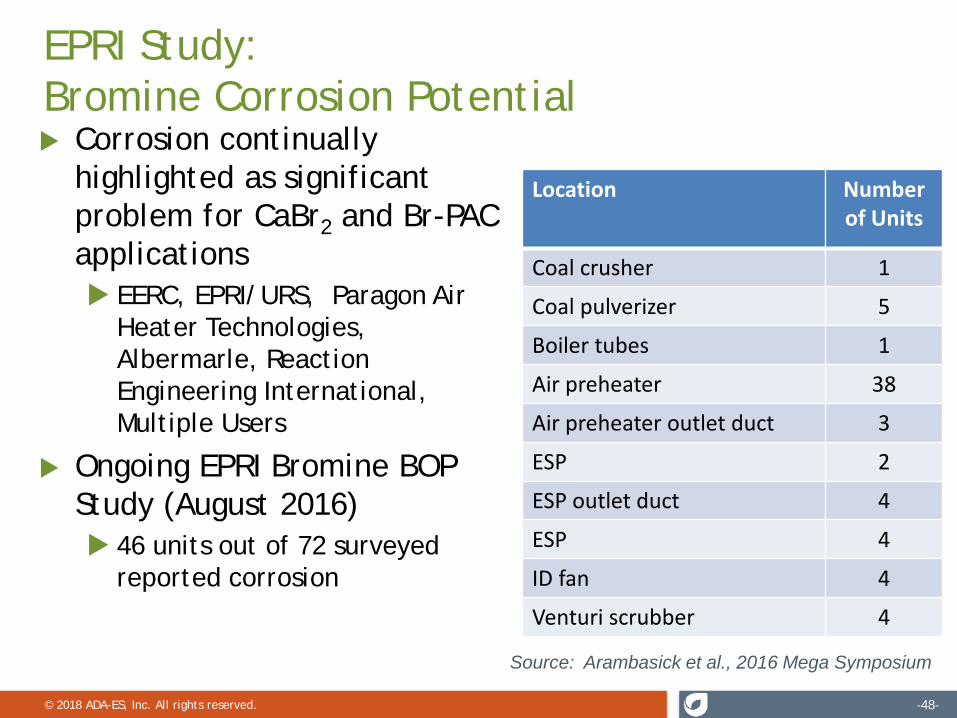
Corrosion continually highlighted as significant problem for CaBr2 and Br-PAC applications EERC, EPRI/URS, Paragon Air
Heater Technologies, Albermarle, Reaction Engineering International, Multiple Users
Ongoing EPRI Bromine BOP Study (August 2016) 46 units out of 72 surveyed
reported corrosion
EPRI Study:Bromine Corrosion Potential
Location Number of Units
Coal crusher 1
Coal pulverizer 5
Boiler tubes 1
Air preheater 38
Air preheater outlet duct 3
ESP 2
ESP outlet duct 4
ESP 4
ID fan 4
Venturi scrubber 4
Source: Arambasick et al., 2016 Mega Symposium

© 2018 ADA-ES, Inc. All rights reserved. -49-
Corrosion from Bromine Fuel Additives Studied by EPRI EPRI surveyed plants using bromine fuel additives or brominated PAC PRB-fired boilers observed corrosion, primarily in air preheater (AH),
but bituminous-fired boilers did not
49
Source: Arambasick et al., 2016 Mega Symposium
© 2018 ADA-ES, Inc. All rights reserved. -50-
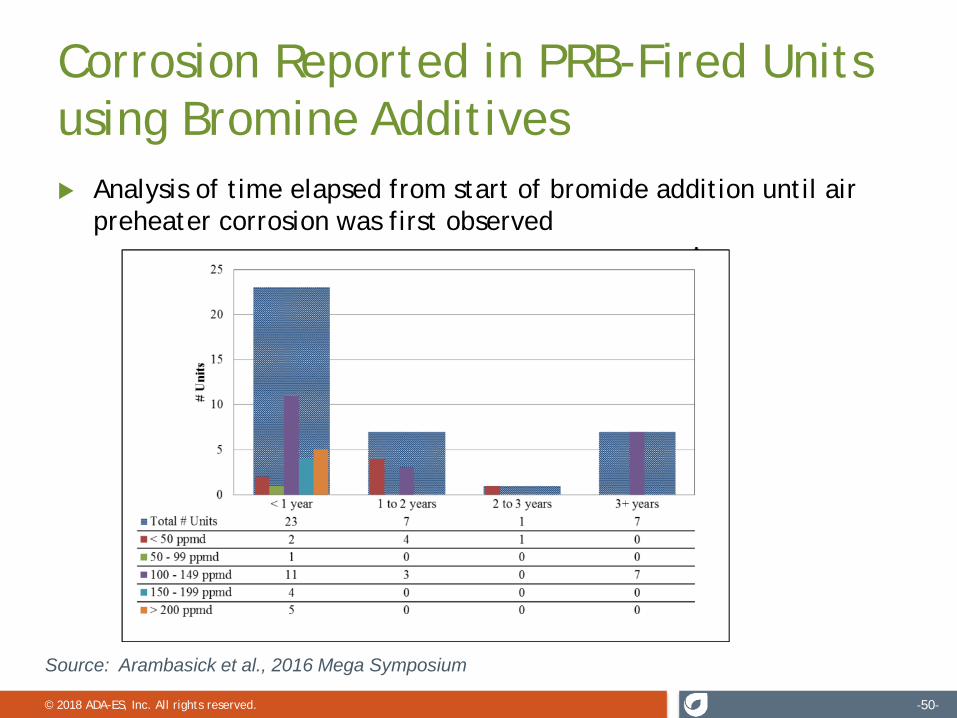
Corrosion Reported in PRB-Fired Units using Bromine Additives Analysis of time elapsed from start of bromide addition until air
preheater corrosion was first observed
Source: Arambasick et al., 2016 Mega Symposium

© 2018 ADA-ES, Inc. All rights reserved. -51-
Dew Point Corrosion
Bromine corrosion in PRB air preheaters appears to be because of lower dewpoint
Source: Arambasick et al., 2016 Mega Symposium
© 2018 ADA-ES, Inc. All rights reserved. -52-
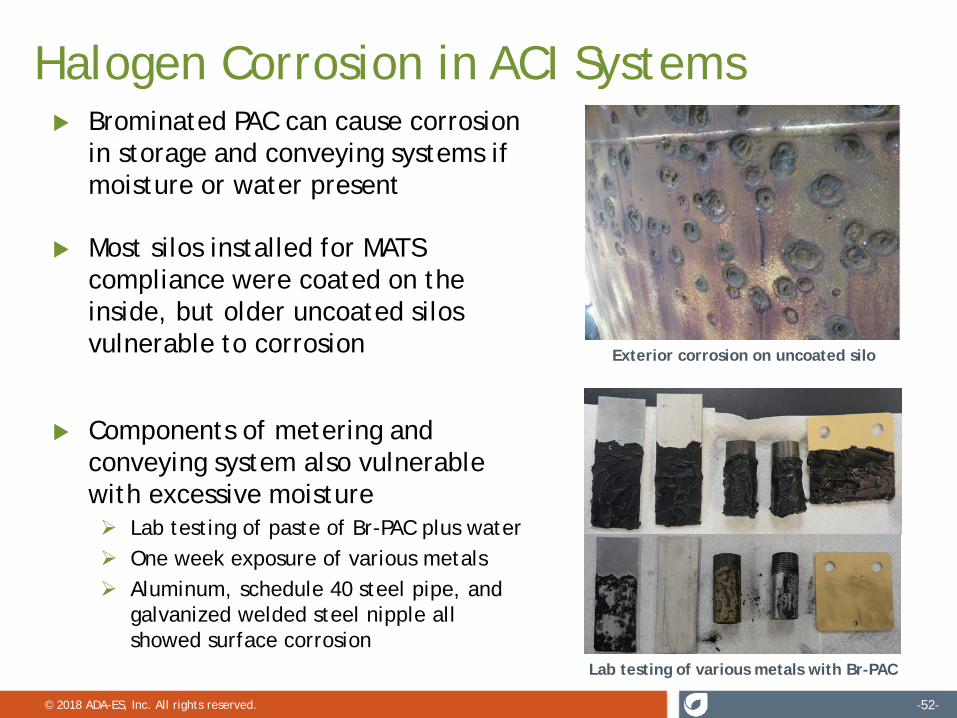
Brominated PAC can cause corrosion in storage and conveying systems if moisture or water present
Halogen Corrosion in ACI Systems
Exterior corrosion on uncoated silo
Most silos installed for MATS compliance were coated on the inside, but older uncoated silos vulnerable to corrosion
Components of metering and conveying system also vulnerable with excessive moisture Lab testing of paste of Br-PAC plus water One week exposure of various metals Aluminum, schedule 40 steel pipe, and
galvanized welded steel nipple all showed surface corrosion
Lab testing of various metals with Br-PAC
© 2018 ADA-ES, Inc. All rights reserved. -53-
Fate of Hg in Coal-Fired Boilers
ESP or FFAP
H
PCD FGD
SCR
Hg vaporized in furnace
Hg oxidation by halogens
Hg oxidationacross SCR
Hg oxidation across APH
Hg collected in PM
Hg removed with fly ash
Hg emission in gas-phase, ultra-fine PM
Hg partial removal (Hg2+) in scrubber
WWT