Embed Size (px)
Citation preview

191ECONOMIE ET STATISTIQUE / ECONOMICS AND STATISTICS N° 517-518-519, 2020
Consistency in a Globalised Economy: Aligning the Treatment of R&D in the Irish National Accounts and Balance of Payments
Niamh Holton, Margaret Kinsella, Oisín Mangan, Shaun McLaughlin and Patrick Quill *
Abstract – Increasing globalisation of the world’s business economy presents challenges to compilers of official statistics when producing consistent economic accounts. This paper examines two inconsistencies between national accounts and balance of payments – firstly, in the measurement of depreciation of intellectual property products, and secondly, in the record‑ing of expenditure on research and development services. These inconsistencies can lead to sizeable discrepancies in net factor flows in the national accounts. Business data collected by the Central Statistics Office in Ireland is used to measure the divergence between the balance of payments and national accounts. The findings suggest that it is necessary to adjust the balance of payments data related to intellectual property products and R&D services to ensure consistency with national accounting methodology.
JEL Classification: F23, F62, O34Keywords: globalisation, balance of payments, intellectual property, research and development, depreciation
*Central Statistics Office, Dublin ([email protected]; [email protected]; [email protected]; [email protected]; [email protected])We are grateful to Jennifer Banim, Michael Connolly, other colleagues in the Central Statistics Office and two anonymous reviewers for helpful comments on an earlier draft of this paper.
Received on 20 July 2018, accepted after revisions on 6 May 2019.Citation: Holton, N., Kinsella, M., Mangan, O., McLaughlin, S. & Quill, P. (2020). Consistency in a Globalised Economy: Aligning the Treatment of R&D in the Irish National Accounts and Balance of Payments. Economie et Statistique / Economics and Statistics, 517‑518‑519, 191–204. https://doi.org/10.24187/ecostat.2020.517t.2025
Rem
inde
r: Th
e opin
ions a
nd an
alyse
s in t
his ar
ticle
are t
hose
of th
e auth
or(s)
and d
o not
nece
ssar
ily re
flect
their i
nstitu
tion’s
or In
see’s
view
s.

ECONOMIE ET STATISTIQUE / ECONOMICS AND STATISTICS N° 517-518-519, 2020192
B alance of payments data are an essential input into the production of national
accounts statistics. In particular, the net fac‑tor flows to/from abroad are subtracted from/added to gross domestic product (GDP) in the calculation of gross national income (GNI). In an economy like Ireland’s, where the dif‑ference between GDP and GNI is large, these flows are particularly important. Differences in methodology between national accounts and balance of payments have the potential to affect the measurement of the factor flows and consequently GNI. In this paper, we focus on the challenges and possible inconsistencies that may arise when measuring a globalised economy. More specifically, we examine two examples – both of which concern differences in the treatment of research and development (R&D) by national accounts and balance of payments – and describe the approach taken to resolve the inconsistency.
In company accounts, and in the balance of payments data, expenditure on research and development appears as an expense and is deducted from profits. Expenditure on intellec‑tual property products (i.e. patents) is treated as investment in intangible assets, which are added to the balance sheet and give rise to depreciation.
In national accounts, however, no distinction is made between expenditure on research and development services and expenditure on intel‑lectual property products. Both are treated as
investment in intangible assets. Both are added to the capital stock of fixed assets and give rise to depreciation. This difference in approach causes an inconsistency between the balance of payments factor flows and the national accounts net operating surplus, in that the net operating surplus figures have been adjusted to include the expenditure on R&D services, and to exclude any depreciation of those assets, while the equivalent figures in balance of payments have undergone no such adjustment.
A second inconsistency was also identified, where the depreciation of intellectual prop‑erty assets recorded by companies was not in agreement with the depreciation recorded in the national accounts.
Since 2015, when trade in R&D services and intellectual property products in Ireland increased starkly, these have become pressing issues in the calculation of economic statistics, requiring adjustments to address discrepancies. Figure I illustrates the magnitude of the overall adjustment made to net factor flows. It shows the contribution made by the realignment of depre‑ciation for large intellectual property assets, and that made by the treatment of R&D services as investment (and the depreciation which results from this).
We start by considering the literature and guidelines surrounding R&D activity and intel‑lectual property products, before discussing the
Figure I – Adjustment to net factor flows, Ireland, 2012-2017
-6
-4
-2
0
2
4
6
8
10
2012 2013 2014 2015 2016 2017
% of
GNI
R&D services CFC on R&D servicesCFC adjustment on intellectual property products Adjustment to net factor flows
Notes: Data on the individual components of the adjustment for 2013-2015 are withheld for confidentiality reasons.Sources: Authors’ calculations.
ECONOMIE ET STATISTIQUE / ECONOMICS AND STATISTICS N° 517-518-519, 2020 193
Consistency in a Globalised Economy: Aligning the Treatment of R&D
challenges in recording these activities in a small globalised economy like Ireland. The potential for inconsistencies in economic statistics resulting from a misalignment in methodology are iden‑tified and the approach taken by the Central Statistics Office (CSO) to achieve a consistent treatment across the domains of national accounts and balance of payments is illustrated.
1. Literature Review
Haskel & Westlake (2018) state that there has been a long‑term shift from tangible to intan‑gible investment, and that “much of that shift does not appear in company balance sheets and national accounts because accountants and statis ticians tend not to count intangible spending as an investment, but rather as day‑to‑day expenses”. However, this has been changing in the case of national accounts based on the most recent updates to the standard systems of national accounts.
The decision to treat R&D as investment in The System of National Accounts, 2008 (2008 SNA) is the latest point in a progression towards expanding the asset boundary in the national accounts (UN et al., 2008). The 1968 SNA defines gross fixed capital formation as the value of durable goods for civilian use; significant improvements to durable goods; reclamation of land; margins on transactions in land; and breeder stocks (UN, 1968). The System of National Accounts, 1993 (1993 SNA) extends gross fixed capital formation to include expendi‑ture on mineral exploration, computer software and entertainment, and literary or artistic origi‑nals (UN et al., 1993). The current standard, 2008 SNA, extends the definition further. Expenditure on R&D and the outright transfer of the ownership rights of the outcome of R&D now fall within the asset boundary (UN et al., 2008). The Frascati Manual (OECD, 2015) sets out the guidance on collecting statistics on R&D. Ker & Galindo‑Rueda (2017) describe the common background of the Frascati Manual and the 2008 SNA about this issue and how the fundamental change to the treatment of R&D in the 2008 SNA marks the convergence of the two frameworks.
The Balance of Payments and International Investment Positions Manual – Sixth Edition (BPM6) is harmonised with the 2008 SNA. Just as the SNA has evolved the asset boundary over time, the update to the balance of payments standard now records the provision of R&D
services and the outright sales of intellectual property products under the service category ‘Research and Development Services’ (IMF, 2009). Previously, intellectual property products which are the result of R&D, such as patents and copyrights, were treated as non‑produced assets and appeared in the capital account. By 2014, most OECD countries had implemented the new 2008 SNA standards. There was focus initially on the capitalisation of R&D, being the largest and most wide‑reaching effect of the transition to the new standard. Expenditure on R&D is now treated as investment and not inter‑mediate consumption and output is increased in the case of own‑account R&D. Van de Ven (2015) shows an average increase of 2.2% of GDP due to the capitalisation of R&D (for OECD countries).
The recording of intellectual property products as assets in the accounting framework was not central to the discussion at the time of imple‑mentation of the new standards. When the CSO published the exceptional national accounts results for 2015, this aspect of the 2008 SNA took on a new significance. Commentators were baffled by these results when they were first published. The Irish Times said, “trying to interpret the official economic figures for 2015 is next to near impossible” (Taylor, 2016). The Economist (2016) called it a “virtual reality”. What was illustrated was that the ability to measure domestic production in a meaningful way is tested when factors of production can be in different parts of the world, for instance through contract manufacturing. The robust‑ness of the 2008 SNA standards in measuring activity in a globalised world was nevertheless demonstrated. The increase in capital stock of €262bn in 2015 helps to explain the increase in GDP in Ireland. The 2015 results would have been more difficult to comprehend without having intellectual property products within the asset boundary of the accounts, what Haskel & Westlake (2018, p. 5) refer to as “capitalism without capital”.
Since the events in Ireland in 2015, the major role that intellectual property products play in modern production arrangements has been brought into sharp focus. The value of these assets can be extremely large, and they can transfer between multinational units in different countries relatively easily. These issues are discussed in Globalisation, Intellectual Property Products and Measurement of GDP (OECD, 2018, p.7) where it is noted that the change in treatment of R&D is often misunderstood to
ECONOMIE ET STATISTIQUE / ECONOMICS AND STATISTICS N° 517-518-519, 2020194
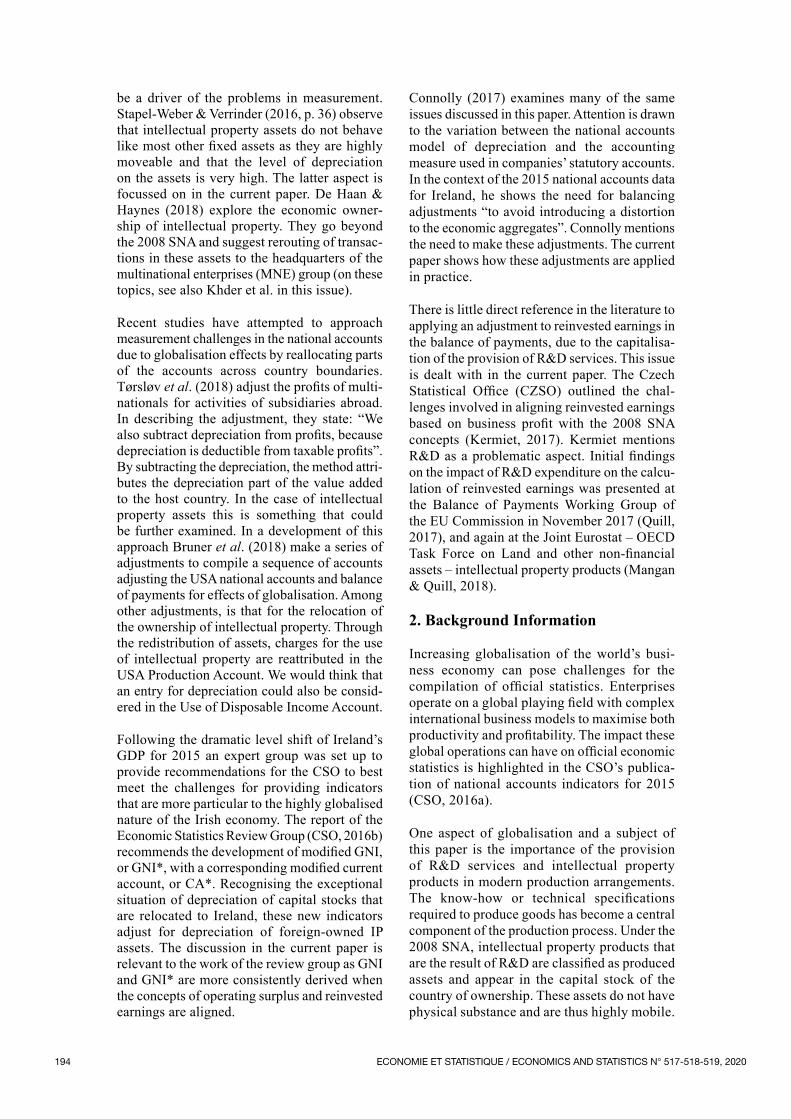
be a driver of the problems in measurement. Stapel‑Weber & Verrinder (2016, p. 36) observe that intellectual property assets do not behave like most other fixed assets as they are highly moveable and that the level of depreciation on the assets is very high. The latter aspect is focussed on in the current paper. De Haan & Haynes (2018) explore the economic owner‑ship of intellectual property. They go beyond the 2008 SNA and suggest rerouting of transac‑tions in these assets to the headquarters of the multinational enterprises (MNE) group (on these topics, see also Khder et al. in this issue).
Recent studies have attempted to approach measurement challenges in the national accounts due to globalisation effects by reallocating parts of the accounts across country boundaries. Tørsløv et al. (2018) adjust the profits of multi‑nationals for activities of sub sidiaries abroad. In describing the adjustment, they state: “We also subtract depreciation from profits, because depreciation is deductible from taxable profits”. By subtracting the depreciation, the method attri‑butes the depreciation part of the value added to the host country. In the case of intellectual property assets this is something that could be further examined. In a development of this approach Bruner et al. (2018) make a series of adjustments to compile a sequence of accounts adjusting the USA national accounts and balance of payments for effects of globalisation. Among other adjustments, is that for the relocation of the ownership of intellectual property. Through the redistribution of assets, charges for the use of intellectual property are reattributed in the USA Production Account. We would think that an entry for depreciation could also be consid‑ered in the Use of Disposable Income Account.
Following the dramatic level shift of Ireland’s GDP for 2015 an expert group was set up to provide recommendations for the CSO to best meet the challenges for providing indicators that are more particular to the highly globalised nature of the Irish economy. The report of the Economic Statistics Review Group (CSO, 2016b) recommends the development of modified GNI, or GNI*, with a corresponding modified current account, or CA*. Recognising the exceptional situation of depreciation of capital stocks that are relocated to Ireland, these new indicators adjust for depreciation of foreign‑owned IP assets. The discussion in the current paper is relevant to the work of the review group as GNI and GNI* are more consistently derived when the concepts of operating surplus and reinvested earnings are aligned.
Connolly (2017) examines many of the same issues discussed in this paper. Attention is drawn to the variation between the national accounts model of depreciation and the accounting measure used in companies’ statutory accounts. In the context of the 2015 national accounts data for Ireland, he shows the need for balancing adjustments “to avoid introducing a distortion to the economic aggregates”. Connolly mentions the need to make these adjustments. The current paper shows how these adjustments are applied in practice.
There is little direct reference in the literature to applying an adjustment to reinvested earnings in the balance of payments, due to the capitalisa‑tion of the provision of R&D services. This issue is dealt with in the current paper. The Czech Statistical Office (CZSO) outlined the chal‑lenges involved in aligning reinvested earnings based on business profit with the 2008 SNA concepts (Kermiet, 2017). Kermiet mentions R&D as a problematic aspect. Initial findings on the impact of R&D expenditure on the calcu‑lation of reinvested earnings was presented at the Balance of Payments Working Group of the EU Commission in November 2017 (Quill, 2017), and again at the Joint Eurostat – OECD Task Force on Land and other non‑financial assets – intellectual property products (Mangan & Quill, 2018).
2. Background Information
Increasing globalisation of the world’s busi‑ness economy can pose challenges for the compilation of official statistics. Enterprises operate on a global playing field with complex international business models to maximise both productivity and profitability. The impact these global operations can have on official economic statistics is highlighted in the CSO’s publica‑tion of national accounts indicators for 2015 (CSO, 2016a).
One aspect of globalisation and a subject of this paper is the importance of the provision of R&D services and intellectual property products in modern production arrangements. The know‑how or technical specifications required to produce goods has become a central component of the production process. Under the 2008 SNA, intellectual property products that are the result of R&D are classified as produced assets and appear in the capital stock of the country of ownership. These assets do not have physical substance and are thus highly mobile.

ECONOMIE ET STATISTIQUE / ECONOMICS AND STATISTICS N° 517-518-519, 2020 195
Consistency in a Globalised Economy: Aligning the Treatment of R&D
This mobility can have a significant impact on the national accounts of the countries involved.
The provision of R&D services and the sale of proprietary rights arising from R&D are classified under the one heading ‘Research and development services’ in the balance of payments and are classified as investment in the national accounts. Both types of transactions are discussed in this paper. In general, the provision of R&D services tends to be a relatively smooth series in the accounts, whereas the acquisition and disposal of intellectual property products is much more erratic, characterised by one‑off large transactions. In Ireland there has been a significant growth in the imports of R&D services and cross‑border transactions in intel‑lectual property products.
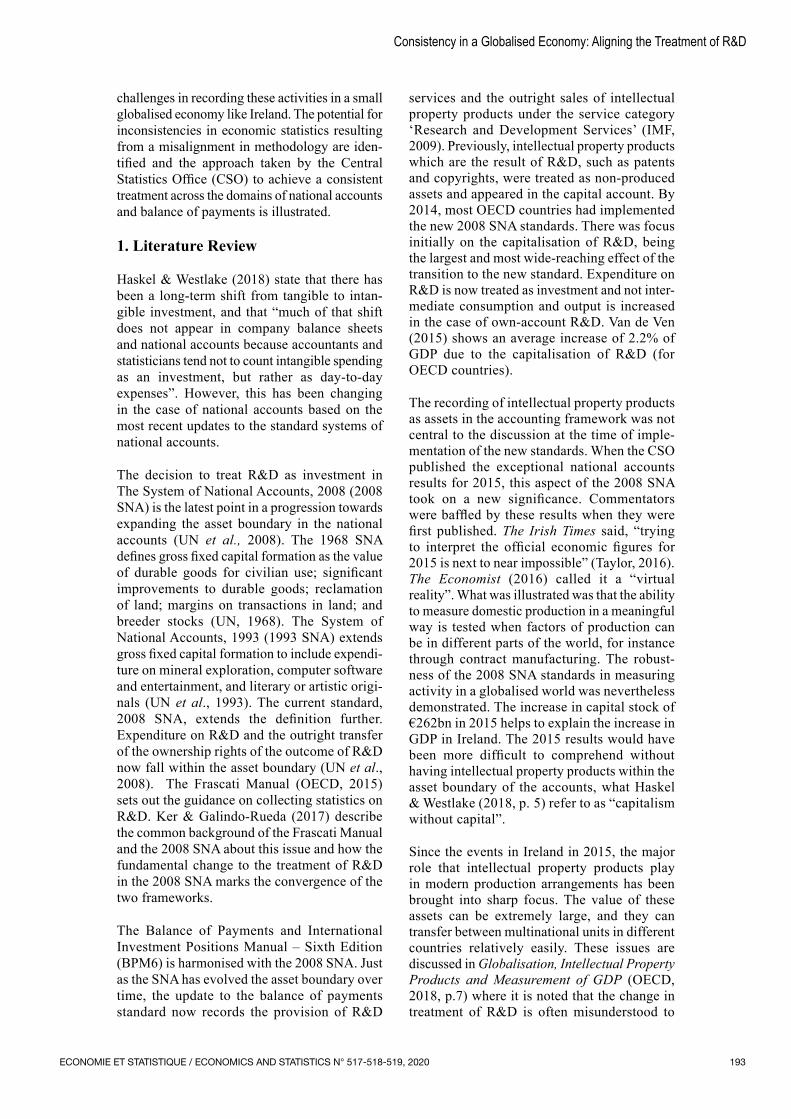
Figure II illustrates the value of net stock of fixed capital in Ireland from 2012 to 2017. There was steady growth in the capital stock before the level shift in 2015, and continuous strong growth since. The 2015 movement in the capital stock was driven by growth in the stock of Transport Equipment (which predominantly consists of aircraft) and Intangible Fixed Assets. These two asset types have been combined into a single category for confidentiality reasons. The pairing however is not unreasonable as they are both highly mobile assets which give rise to economic activity overseas that contri‑butes to Ireland’s GDP. These asset categories have soared in significance, equating to 46%
of the total net capital stock of assets in 2017, in comparison to 24% in 2014, illustrating the changing composition of Ireland’s balance sheet and business landscape. This increase in the capital stock is a combined result of the relocations of enterprises (and their entire balance sheets) to Ireland, the “onshoring” of IP assets by MNEs resident in Ireland, as well as the growth of the aircraft leasing industry.
The large increases in capital stock in Ireland coincide with two measures in the 2014 and 2015 Finance Acts. Firstly, the Finance Act (Government of Ireland, 2014) introduced measures to ensure that any enterprise incor‑porated in Ireland must also be tax resident, addressing the issue of so‑called “stateless companies”. Secondly, tax initiatives to promote R&D expenditure and the development of R&D assets by enterprises resident in Ireland were introduced. Coffey (2017, p. 124) discusses the 2015 level shift in capital assets alongside a consequential increase in capital allowances for intangible assets. He concludes that while income increases substantially, corporation tax receipts grow much more slowly due to the offsetting capital allowances.
Alongside the onshoring of intellectual prop‑erty products, Ireland has seen a very strong growth in imports of R&D services. This service category has always been an important compo‑nent of the balance of payments, illustrating the technical character of the MNE sector in Ireland.
Figure II – Total net stock of fixed capital assets at current prices as a % of GNI, 2012-2017
0
50
100
150
200
250
300
350
400
2012 2013 2014 2015 2016 2017
% of
GNI
Transport equipment and intangible fixed assets Other fixed assets
Sources: Central Statistics Office, Estimates of the Capital Stock of Fixed Assets 2017. https://www.cso.ie/en/releasesandpublications/er/csfa/estimatesofthecapitalstockoffixedassets2017/
ECONOMIE ET STATISTIQUE / ECONOMICS AND STATISTICS N° 517-518-519, 2020196
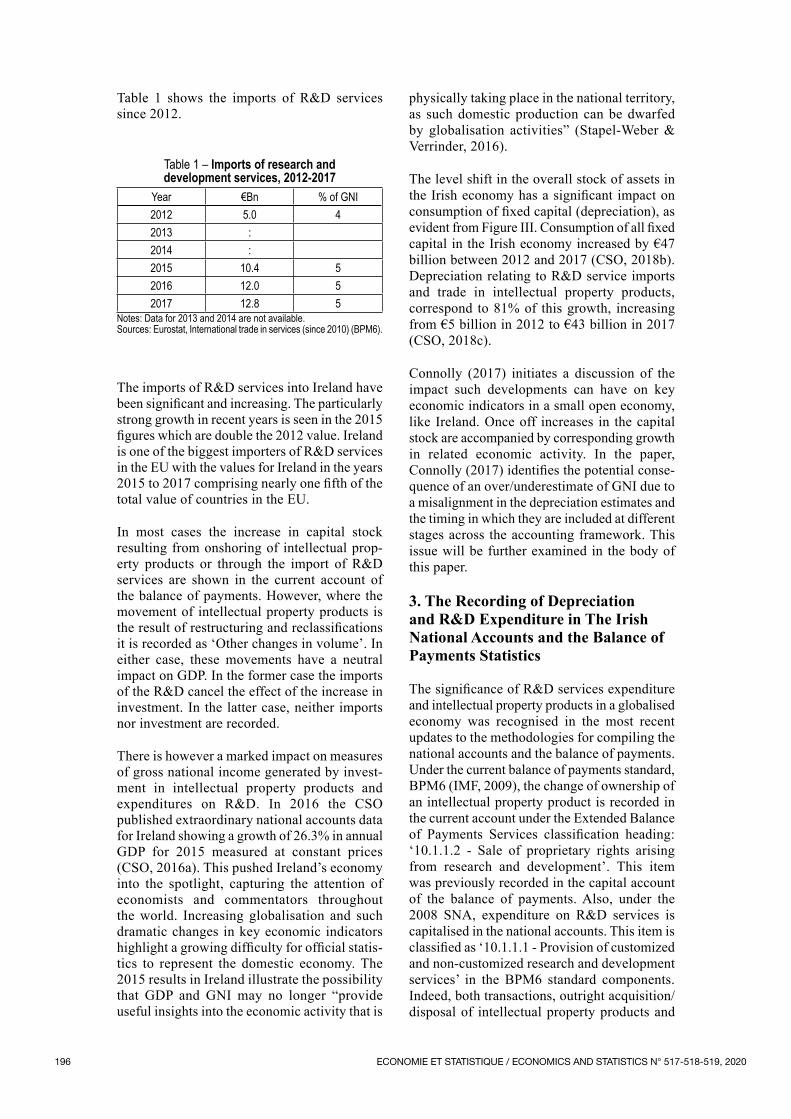
Table 1 shows the imports of R&D services since 2012.
Table 1 – Imports of research and development services, 2012-2017
Year €Bn % of GNI2012 5.0 42013 : 2014 : 2015 10.4 52016 12.0 52017 12.8 5
Notes: Data for 2013 and 2014 are not available.Sources: Eurostat, International trade in services (since 2010) (BPM6).
The imports of R&D services into Ireland have been significant and increasing. The particularly strong growth in recent years is seen in the 2015 figures which are double the 2012 value. Ireland is one of the biggest importers of R&D services in the EU with the values for Ireland in the years 2015 to 2017 comprising nearly one fifth of the total value of countries in the EU.
In most cases the increase in capital stock resulting from onshoring of intellectual prop‑erty products or through the import of R&D services are shown in the current account of the balance of payments. However, where the movement of intellectual property products is the result of restructuring and reclassifications it is recorded as ‘Other changes in volume’. In either case, these movements have a neutral impact on GDP. In the former case the imports of the R&D cancel the effect of the increase in investment. In the latter case, neither imports nor investment are recorded.
There is however a marked impact on measures of gross national income generated by invest‑ment in intellectual property products and expenditures on R&D. In 2016 the CSO published extraordinary national accounts data for Ireland showing a growth of 26.3% in annual GDP for 2015 measured at constant prices (CSO, 2016a). This pushed Ireland’s economy into the spotlight, capturing the attention of economists and commentators throughout the world. Increasing globalisation and such dramatic changes in key economic indicators highlight a growing difficulty for official statis‑tics to represent the domestic economy. The 2015 results in Ireland illustrate the possibility that GDP and GNI may no longer “provide useful insights into the economic activity that is
physically taking place in the national territory, as such domestic production can be dwarfed by globalisation activities” (Stapel‑Weber & Verrinder, 2016).
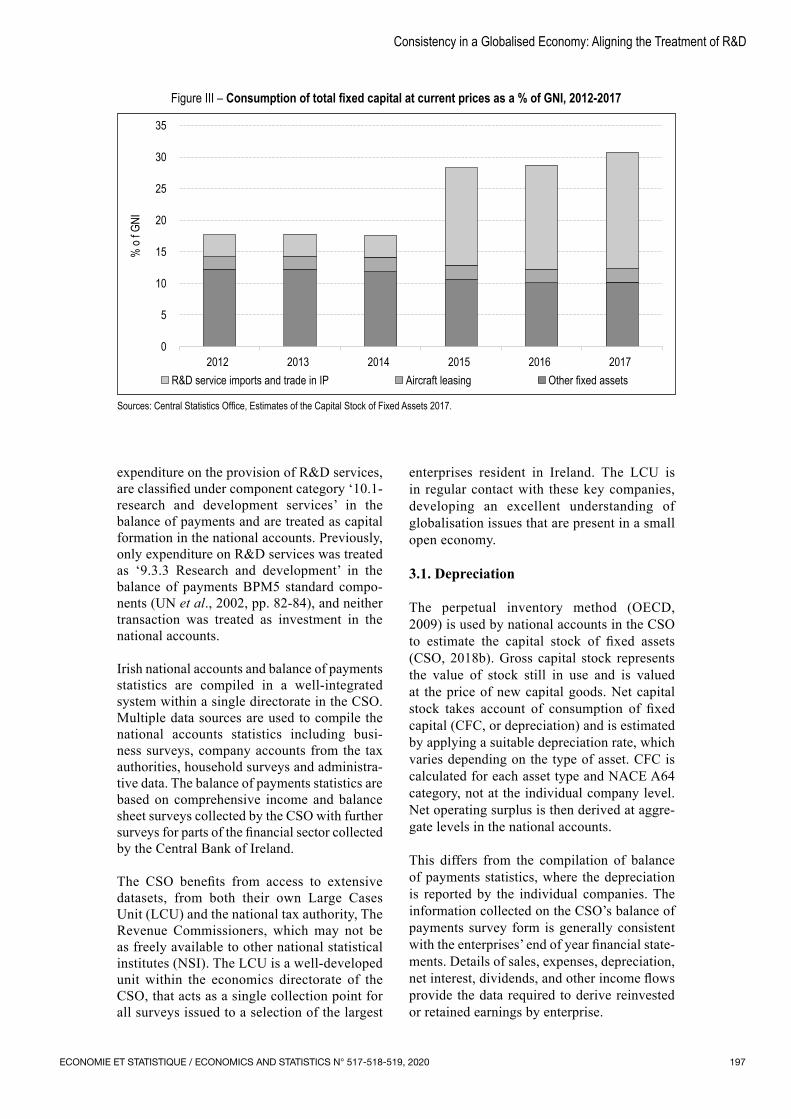
The level shift in the overall stock of assets in the Irish economy has a significant impact on consumption of fixed capital (depreciation), as evident from Figure III. Consumption of all fixed capital in the Irish economy increased by €47 billion between 2012 and 2017 (CSO, 2018b). Depreciation relating to R&D service imports and trade in intellectual property products, correspond to 81% of this growth, increasing from €5 billion in 2012 to €43 billion in 2017 (CSO, 2018c).
Connolly (2017) initiates a discussion of the impact such developments can have on key economic indicators in a small open economy, like Ireland. Once off increases in the capital stock are accompanied by corresponding growth in related economic activity. In the paper, Connolly (2017) identifies the potential conse‑quence of an over/underestimate of GNI due to a misalignment in the depreciation estimates and the timing in which they are included at different stages across the accounting framework. This issue will be further examined in the body of this paper.
3. The Recording of Depreciation and R&D Expenditure in The Irish National Accounts and the Balance of Payments Statistics
The significance of R&D services expenditure and intellectual property products in a globalised economy was recognised in the most recent updates to the methodologies for compiling the national accounts and the balance of payments. Under the current balance of payments standard, BPM6 (IMF, 2009), the change of ownership of an intellectual property product is recorded in the current account under the Extended Balance of Payments Services classification heading: ‘10.1.1.2 ‑ Sale of proprietary rights arising from research and development’. This item was previously recorded in the capital account of the balance of payments. Also, under the 2008 SNA, expenditure on R&D services is capitalised in the national accounts. This item is classified as ‘10.1.1.1 ‑ Provision of customized and non‑customized research and development services’ in the BPM6 standard components. Indeed, both transactions, outright acquisition/disposal of intellectual property products and
ECONOMIE ET STATISTIQUE / ECONOMICS AND STATISTICS N° 517-518-519, 2020 197
Consistency in a Globalised Economy: Aligning the Treatment of R&D
expenditure on the provision of R&D services, are classified under component category ‘10.1‑ research and development services’ in the balance of payments and are treated as capital formation in the national accounts. Previously, only expenditure on R&D services was treated as ‘9.3.3 Research and development’ in the balance of payments BPM5 standard compo‑nents (UN et al., 2002, pp. 82‑84), and neither transaction was treated as investment in the national accounts.
Irish national accounts and balance of payments statistics are compiled in a well‑integrated system within a single directorate in the CSO. Multiple data sources are used to compile the national accounts statistics including busi‑ness surveys, company accounts from the tax authorities, household surveys and administra‑tive data. The balance of payments statistics are based on comprehensive income and balance sheet surveys collected by the CSO with further surveys for parts of the financial sector collected by the Central Bank of Ireland.
The CSO benefits from access to extensive datasets, from both their own Large Cases Unit (LCU) and the national tax authority, The Revenue Commissioners, which may not be as freely available to other national statistical institutes (NSI). The LCU is a well‑developed unit within the economics directorate of the CSO, that acts as a single collection point for all surveys issued to a selection of the largest
enterprises resident in Ireland. The LCU is in regular contact with these key companies, developing an excellent understanding of globalisation issues that are present in a small open economy.
3.1. Depreciation
The perpetual inventory method (OECD, 2009) is used by national accounts in the CSO to estimate the capital stock of fixed assets (CSO, 2018b). Gross capital stock represents the value of stock still in use and is valued at the price of new capital goods. Net capital stock takes account of consumption of fixed capital (CFC, or depreciation) and is estimated by applying a suitable depreciation rate, which varies depending on the type of asset. CFC is calculated for each asset type and NACE A64 category, not at the individual company level. Net operating surplus is then derived at aggre‑gate levels in the national accounts.
This differs from the compilation of balance of payments statistics, where the depreciation is reported by the individual companies. The information collected on the CSO’s balance of payments survey form is generally consistent with the enterprises’ end of year financial state‑ments. Details of sales, expenses, depreciation, net interest, dividends, and other income flows provide the data required to derive reinvested or retained earnings by enterprise.
Figure III – Consumption of total fixed capital at current prices as a % of GNI, 2012-2017
0
5
10
15
20
25
30
35
2012 2013 2014 2015 2016 2017
% o
f GNI
R&D service imports and trade in IP Aircraft leasing Other fixed assets
Sources: Central Statistics Office, Estimates of the Capital Stock of Fixed Assets 2017.

ECONOMIE ET STATISTIQUE / ECONOMICS AND STATISTICS N° 517-518-519, 2020198
Although depreciation does not feature as an individual item in the balance of payments, it is indirectly included as an expense that reduces the income earned by an enterprise. If the enterprise is owned by a foreign shareholder this will result in a reduction in the related direct investment outflow. Section 11.43 of the BPM6 manual outlines the transition from net oper‑ating surplus to reinvested earnings in a series of steps adding and subtracting dividends, interest, taxes and other items (IMF, 2009). The manual goes on to say that “these items correspond exactly to SNA items”. To achieve consistency, NSIs give guidance to respondents on how to record these items and closely monitor big items in the survey returns, such as the payment of dividends. It is not feasible to expect that the enterprise would adopt the national accounts PIM model to calculate depreciation. Blanchet et al. (2018) mention the difficulty in evaluating depreciation in intangible assets.
Each entity depreciates their stock of assets based on individual procedures that comply with national financial reporting standards. Enterprises resident in Ireland who participate in R&D are granted capital allowances which offset the total value of corporation tax they are liable for, possibly encouraging efficient planning in relation to the optimum depreciation strategies. There is little evidence that the methodologies and assumptions used at the enterprise level for depreciation of asset categories are in line with those used by national accounts. It is worth noting that any changes in the accounting rules and/or tax legislation relating to these assets could have an impact on the level of divergence between the depreciation reported in the balance of payments and the depreciation calculated for national accounts.
3.2. Expenditure on R&D Services
Under the 2008 SNA, R&D is treated as capital formation in the national accounts. This requires expenditure on in‑house R&D activities, or the provision of R&D services by a third party, to be treated as investment, adding to the capital stock (UN et al., 2008, p. 122). Expenditure on R&D activities in the domestic economy is collected in enterprise surveys for the compilation of statistics. The CSO’s Business Expenditure on Research and Development (BERD) survey, is an example (CSO, 2017). Cross border expenditure on R&D services are captured in the international trade in services survey of domestic enterprises. In Ireland, the trade in
services survey is part of the comprehensive balance of payments collection system.
In the national accounts, the sum of domestic R&D expenditure and trade in R&D services are the basis of the R&D services component of capital formation. R&D activities that are performed within the economy are either capi‑talised under the 2008 SNA or exported, with a positive impact on GDP in the period of activity. Imported R&D services have a neutral impact on GDP in the period when the expenditure occurs, as the increase in imports which would have a negative impact on GDP is balanced by a corre‑sponding positive value in investment. While the collection of data relating to expenditure in R&D is relatively uncomplicated, difficulties arise when deriving data on direct investment flows arising from reinvested earnings for companies with R&D expenditure. As R&D is not regarded as intermediate consumption in the national accounts, it should not be subtracted in the calculation of operating surplus. Moreover, depreciation of R&D expenditure is necessary under the 2008 SNA.
This results in a challenge for compilers of statistics as reporting entities generally regard R&D as an expense, rather than a capital item. Specifically, companies consider R&D a busi‑ness cost rather than an asset.
As a result, the usual accounting calculation for operating surplus will give a result which differs from the SNA calculation. This differ‑ence is equal to the value of R&D expenditure in the current period less the depreciation on any prior R&D expenditure. A further explanation is available in an information note on the CSO website (CSO, 2018a).
3.3. Misalignment of National Accounts and Balance of Payments Items
Connolly (2017) identifies a potential mismatch between national accounts’ measurement of operating surplus and balance of payments measurement of primary income which is the main contributing factor in the calculation of net factor income. He suggests that if different estimates of depreciation are used at different stages in the accounting framework they may give rise to an over/under estimate in GNI.
Gross operating surplus in the national accounts corresponds to the income generated by enter‑prises based on production activities. It excludes
ECONOMIE ET STATISTIQUE / ECONOMICS AND STATISTICS N° 517-518-519, 2020 199
Consistency in a Globalised Economy: Aligning the Treatment of R&D
market price changes, interest payments and receipts but includes an estimate for financial intermediation service charges.
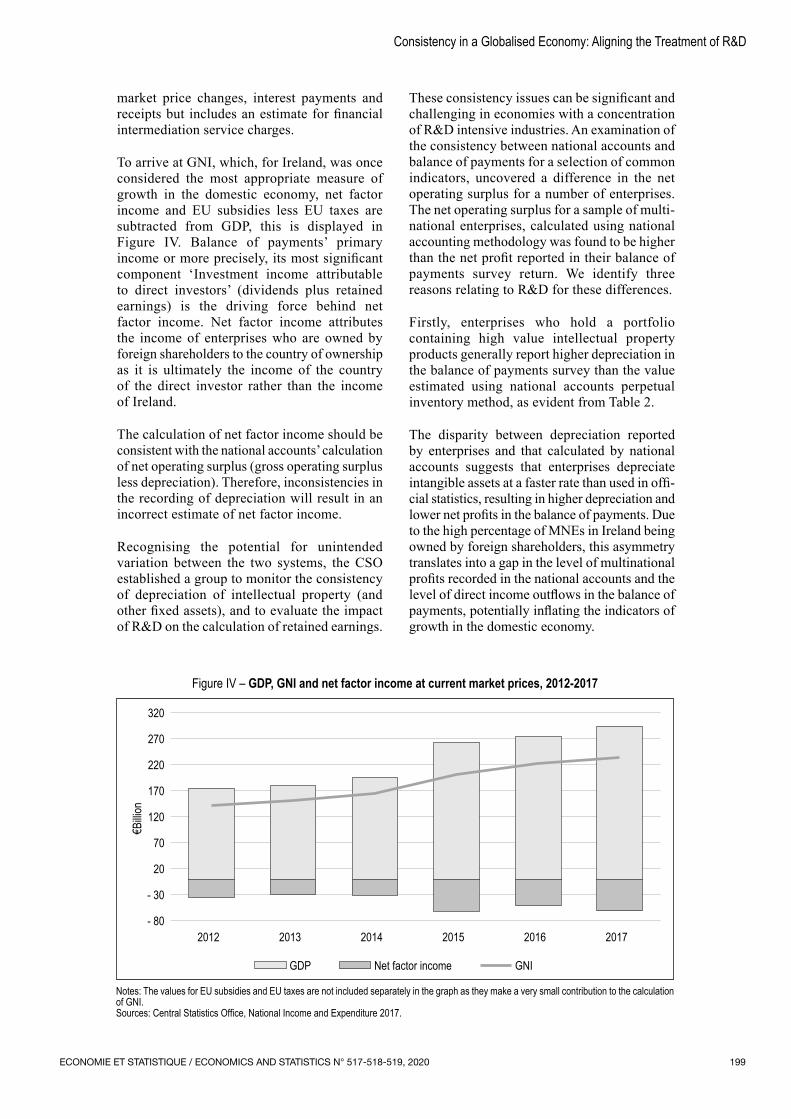
To arrive at GNI, which, for Ireland, was once considered the most appropriate measure of growth in the domestic economy, net factor income and EU subsidies less EU taxes are subtracted from GDP, this is displayed in Figure IV. Balance of payments’ primary income or more precisely, its most significant component ‘Investment income attributable to direct investors’ (dividends plus retained earnings) is the driving force behind net factor income. Net factor income attributes the income of enterprises who are owned by foreign shareholders to the country of ownership as it is ultimately the income of the country of the direct investor rather than the income of Ireland.
The calculation of net factor income should be consistent with the national accounts’ calculation of net operating surplus (gross operating surplus less depreciation). Therefore, inconsistencies in the recording of depreciation will result in an incorrect estimate of net factor income.
Recognising the potential for unintended variation between the two systems, the CSO established a group to monitor the consistency of depreciation of intellectual property (and other fixed assets), and to evaluate the impact of R&D on the calculation of retained earnings.
These consistency issues can be significant and challenging in economies with a concentration of R&D intensive industries. An examination of the consistency between national accounts and balance of payments for a selection of common indicators, uncovered a difference in the net operating surplus for a number of enterprises. The net operating surplus for a sample of multi‑national enterprises, calculated using national accounting methodology was found to be higher than the net profit reported in their balance of payments survey return. We identify three reasons relating to R&D for these differences.
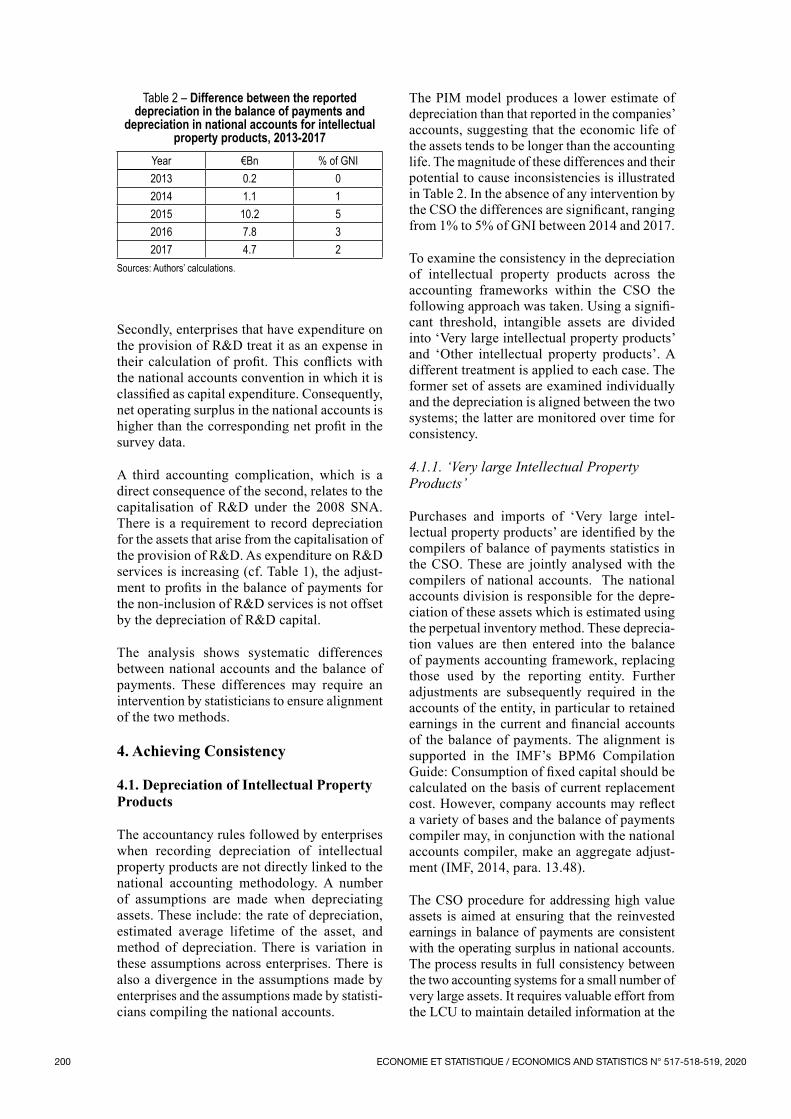
Firstly, enterprises who hold a portfolio containing high value intellectual property products generally report higher depreciation in the balance of payments survey than the value estimated using national accounts perpetual inventory method, as evident from Table 2.
The disparity between depreciation reported by enterprises and that calculated by national accounts suggests that enterprises depreciate intangible assets at a faster rate than used in offi‑cial statistics, resulting in higher depreciation and lower net profits in the balance of payments. Due to the high percentage of MNEs in Ireland being owned by foreign shareholders, this asymmetry translates into a gap in the level of multinational profits recorded in the national accounts and the level of direct income outflows in the balance of payments, potentially inflating the indicators of growth in the domestic economy.
Figure IV – GDP, GNI and net factor income at current market prices, 2012-2017
- 80
- 30
20
70
120
170
220
270
320
2012 2013 2014 2015 2016 2017
GDP Net factor income GNI
€Billi
on
Notes: The values for EU subsidies and EU taxes are not included separately in the graph as they make a very small contribution to the calculation of GNI.Sources: Central Statistics Office, National Income and Expenditure 2017.
ECONOMIE ET STATISTIQUE / ECONOMICS AND STATISTICS N° 517-518-519, 2020200
Table 2 – Difference between the reported depreciation in the balance of payments and
depreciation in national accounts for intellectual property products, 2013-2017
Year €Bn % of GNI2013 0.2 02014 1.1 12015 10.2 52016 7.8 32017 4.7 2
Sources: Authors’ calculations.
The PIM model produces a lower estimate of depreciation than that reported in the companies’ accounts, suggesting that the economic life of the assets tends to be longer than the accounting life. The magnitude of these differences and their potential to cause inconsistencies is illustrated in Table 2. In the absence of any intervention by the CSO the differences are significant, ranging from 1% to 5% of GNI between 2014 and 2017.
To examine the consistency in the depreciation of intellectual property products across the accounting frameworks within the CSO the following approach was taken. Using a signifi‑cant threshold, intangible assets are divided into ‘Very large intellectual property products’ and ‘Other intellectual property products’. A different treatment is applied to each case. The former set of assets are examined individually and the depreciation is aligned between the two systems; the latter are monitored over time for consistency.
4.1.1. ‘Very large Intellectual Property Products’
Purchases and imports of ‘Very large intel‑lectual property products’ are identified by the compilers of balance of payments statistics in the CSO. These are jointly analysed with the compilers of national accounts. The national accounts division is responsible for the depre‑ciation of these assets which is estimated using the perpetual inventory method. These deprecia‑tion values are then entered into the balance of payments accounting framework, replacing those used by the reporting entity. Further adjustments are subsequently required in the accounts of the entity, in particular to retained earnings in the current and financial accounts of the balance of payments. The alignment is supported in the IMF’s BPM6 Compilation Guide: Consumption of fixed capital should be calculated on the basis of current replacement cost. However, company accounts may reflect a variety of bases and the balance of payments compiler may, in conjunction with the national accounts compiler, make an aggregate adjust‑ment (IMF, 2014, para. 13.48).
The CSO procedure for addressing high value assets is aimed at ensuring that the reinvested earnings in balance of payments are consistent with the operating surplus in national accounts. The process results in full consistency between the two accounting systems for a small number of very large assets. It requires valuable effort from the LCU to maintain detailed information at the
Secondly, enterprises that have expenditure on the provision of R&D treat it as an expense in their calculation of profit. This conflicts with the national accounts convention in which it is classified as capital expenditure. Consequently, net operating surplus in the national accounts is higher than the corresponding net profit in the survey data.
A third accounting complication, which is a direct consequence of the second, relates to the capitalisation of R&D under the 2008 SNA. There is a requirement to record depreciation for the assets that arise from the capitalisation of the provision of R&D. As expenditure on R&D services is increasing (cf. Table 1), the adjust‑ment to profits in the balance of payments for the non‑inclusion of R&D services is not offset by the depreciation of R&D capital.
The analysis shows systematic differences between national accounts and the balance of payments. These differences may require an intervention by statisticians to ensure alignment of the two methods.
4. Achieving Consistency
4.1. Depreciation of Intellectual Property Products
The accountancy rules followed by enterprises when recording depreciation of intellectual property products are not directly linked to the national accounting methodology. A number of assumptions are made when depreciating assets. These include: the rate of depreciation, estimated average lifetime of the asset, and method of depreciation. There is variation in these assumptions across enterprises. There is also a divergence in the assumptions made by enterprises and the assumptions made by statisti‑cians compiling the national accounts.

ECONOMIE ET STATISTIQUE / ECONOMICS AND STATISTICS N° 517-518-519, 2020 201
Consistency in a Globalised Economy: Aligning the Treatment of R&D
company level relating to the assets and adjust‑ments, along with the completion of updates to the balance of payments and national accounts data systems. This is time‑consuming and requires manual input over an extended number of accounting periods, which is not ideal within what is otherwise a largely automated system.
4.1.2. ‘Other Intellectual Property Products’
The smaller ‘other intellectual property prod‑ucts’ are first identified by the balance of payments compilers. Here the approach is to use the reporting entity’s depreciation in the balance of payments. The assets are indepen‑dently added to the capital stock of the economy and are depreciated in the usual way, at a macro level in the national accounts. This can lead to inconsistencies, as outlined previously. The aim here, however, is to achieve a broad agreement between the total depreciation of companies holding ‘other intellectual property products’ across the two accounting frameworks.
Each company’s contribution to the macro‑level depreciation can be estimated based on a profile of its assets and an application of the perpetual inventory method at a micro level. These data allow ongoing analysis, at the individual company level, of the consistency of depreciation in the two accounting systems. Thus, although the national accounts apply depreciation at an economy wide level, for this exercise, estimates of the contribution of individual companies to the total depreciation are made.
Experience of monitoring the intellectual prop‑erty products has shown that there are features that compilers of statistics should be on alert for. For example, it is important to establish, from the beginning, if an intangible asset is a fran‑chise or trademark; or if the asset is the outcome of research and development. Otherwise, there may be depreciation in the balance of payments company accounts but not in the national accounts, or vice versa. Another experience is that depreciation in the company accounts can behave erratically. Under a merger of two enti‑ties that hold intellectual property products, for example, the combined value of the assets may not equal the sum of the asset values prior to the merger. The perpetual inventory method is flexible enough to allow for this type of scenario (OECD, 2009, p. 49). If the asset is not too large, then the change in the value of the combined intellectual property products may not disturb the symmetry of the two accounting frameworks at the level of the whole economy.
The exercise in the CSO aims to measure and improve on discrepancies in the values of depre‑ciation in the two accountancy frameworks. Currently we estimate close to full alignment for intellectual property products. For these assets the balance of payments depreciation differs from national accounts depreciation by around 2% on average over the years 2015 to 2017. Currently no adjustments have been implemented in this case, however, possible asymmetries will continue to be monitored and the need for adjustments will be reassessed.
4.2. Expenditure on R&D Services
As previously discussed, a further potential for divergence between net operating surplus in the national accounts and retained earnings in balance of payments, is the conceptual difference between the treatments of R&D expenditure. In national accounts R&D is treated as investment whereas in company accounts it is generally considered an expense.
The different treatment can lead to significantly different calculations of retained earnings in the balance of payments in economies with a concentration of R&D intensive multi‑national enterprises, such as Ireland. For this reason, the CSO finds it necessary to apply an adjustment to the retained earnings in the balance of payments for certain companies, who have purchases of R&D services. The modification is twofold: in the first instance, the cost incurred for expendi‑ture on R&D must be removed in the calculation of the net profits of the enterprise, resulting in higher net profits. Secondly, depreciation of prior years’ R&D has to be considered as an expense item, reducing the net profits. The CSO has found that combining these two adjust‑ments results in a higher net operating surplus for companies with expenditure on R&D than would have been the case, for example, under the 1993 SNA (UN et al., 1993).
The CSO is aware that this treatment may be necessary for companies whose reinvested earnings are recorded as inflows to Ireland. However, this data is not so readily available, and no adjustments have been implemented to inflows in the balance of payments. The effect of the modification to retained earnings has been to increase factor income outflows by between 1 and 2 percentage points of GDP in recent years.
The actual implementation of this process is not entirely straightforward. Removing current expenditure on R&D from the profit calculation
ECONOMIE ET STATISTIQUE / ECONOMICS AND STATISTICS N° 517-518-519, 2020202
involves handling the company data. The second adjustment requires a calculation of depreciation on R&D expenditures, up to the current period, estimated in accordance with the national accounts perpetual inventory method. The process also needs manual input over all accounting periods.
* * *
Increasing globalisation of the world’s business economy presents challenges to compilers of official statistics when producing consistent economic accounts.
The extraordinary growth in the Irish economy experienced in 2015 shows how sensitive small open economies, like Ireland, are to globalisa‑tion measurement standards. The CSO became acutely aware of the possible inconsistencies in the measurement of activity related to globalisation with the onshoring of intellectual property products in 2015 and put in place a group of practitioners to monitor the alignment
of depreciation and the treatment of R&D across the two accounting frameworks of national accounts and balance of payments. The scale of events relating to R&D required interven‑tion by the CSO to align company reporting with concepts of national accounts. The result of this project is consistency in R&D related data, so that the factor flows, calculated in the balance of payments and used in the national accounts, are based on national accounting rules and are therefore consistent with other concepts in the national accounts. An indication of the magnitude of the overall adjustment is given in Figure I in the introduction. This shows sepa‑rately the realignment of depreciation for large intellectual property assets, the alignment of income through the treatment of R&D services as investment, and the further adjustment needed to allow for depreciation on the R&D services.
Due to the magnitude of differences and the need for an adjustment in Ireland we recommend that compilers of balance of payment statistics and international organisations take note of the CSO’s experience, and that any future manuals or guidance could contain a discussion of these items.
BIBLIOGRAPHY
Blanchet, T., Khder, M., Leclair, M., Lee, R., Poncet, H. & Ragache, N. (2018). Is growth underestimated? Insee Références, L’économie française - comptes et dossiers, édition 2018, pp. 59–79. https://www.insee.fr/en/statistiques/fichier/3614242/ECOFRA18b_D1_croissance_EN.pdf
Bruner, J., Rassier, D. & Ruhl, K. (2018). Multinational Profit Shifting and Measures throughout Economic Accounts. Bureau of Economic Analysis Working Papers N°0150. https://ideas.repec.org/p/bea/wpaper/0150.html
Central Statistics Office (2016a). National Income and Expenditure 2016. https://www.cso.ie/en/media/csoie/methods/nationalincomeandexpenditureannualresults/NIE2016Methodolo‑gyNote.pdf
Central Statistics Office (2016b). Report of the Economic Statistics Review Group (ESRG), December 2016. https://www.cso.ie/en/media/csoie/newsevents/documents/reportoftheeconomicstatisticsreviewgroup/Econo‑mic_Statistics_Review_(ESRG)_Report_Dec_2016.pdf
Central Statistics Office (2017). Business Expenditure on Research and Development 2015‑2016. https://www.cso.ie/en/releasesandpublications/er/berd/businessexpenditureonresearchdevelopment2015‑2016/
Central Statistics Office (2018a). Consistency of Treatment of R&D in the National Accounts and the Balance of Payments. https://www.cso.ie/en/releasesandpublications/in/rdnabop/consistencyoftreatmentofrdinthenationalaccount‑sandthebalanceofpayments/
Central Statistics Office (2018b). Estimates of the Capital Stock of Fixed Assets 2017. https://www.cso.ie/en/releasesandpublications/er/csfa/estimatesofthecapitalstockoffixedassets2017/

ECONOMIE ET STATISTIQUE / ECONOMICS AND STATISTICS N° 517-518-519, 2020 203
Consistency in a Globalised Economy: Aligning the Treatment of R&D
Central Statistics Office (2018c). National Income and Expenditure 2017. https://www.cso.ie/en/releasesandpublications/ep/p‑nie/nie2017/
Coffey, S. (2017). Review of Ireland’s Corporation Tax Code. Report for Minister for Finance and Public Expenditure and Reform, 12 September 2017. https://www.gov.ie/en/publication/fa53d4‑review‑of‑irelands‑corporation‑tax‑code/
Connolly, M. (2017). The expected and unexpected consequences of ESA 2010 ‑ an Irish perspective. Read before the second meeting of the 2017/2018 session of the Statistical and Social Inquiry of Ireland on 30 November 2017. http://www.ssisi.ie/CSO_Connolly_SSISI_v4.pdf
De Haan, M. & Haynes, J. (2018). R&D capitalization: where did we go wrong? Eurostat Review on National Accounts and Microeconomic Indicators. Massachusetts: University of Chicago Press. https://ec.europa.eu/eurostat/cros/system/files/euronaissue1‑2018‑article1.pdf
Eurostat (2013). European System of Accounts (ESA 2010). Luxembourg: Publication Office of the European Union. http://ec.europa.eu/eurostat/documents/3859598/5925693/KS‑02‑13‑269‑EN.PDF/44cd9d01‑bc64‑ 40e5‑bd40‑d17df0c69334
Eurostat (2017). International trade in services (since 2004). http://appsso.eurostat.ec.europa.eu/nui/show.do?dataset=bop_its_det&lang=en
Eurostat (2019). International trade in services (since 2010) (BPM6). http://appsso.eurostat.ec.europa.eu/nui/show.do?dataset=bop_its6_det&lang=en
Government of Ireland. Finance Act 2014. Number 37 of 2014. Ss.26, 43. Dublin: Houses of the Oireachtas. http://www.irishstatutebook.ie/eli/2014/act/37/section/43/enacted/en/html#sec43
Government of Ireland. Finance Act 2015. Number 52 of 2015. Ss.31, 32. Dublin: Houses of the Oireachtas. https://data.oireachtas.ie/ie/oireachtas/act/2015/52/eng/enacted/a5215.pdf
Haskel, J. & Westlake, S. (2018). Capitalism without Capital: The Rise of the Intangible Economy. New Jersey: Princeton University Press.
IMF (2009). Balance of Payments and International Investment Position Manual – Sixth Edition (BPM6). Washington D.C.: International Monetary Fund. https://www.imf.org/external/pubs/ft/bop/2007/pdf/bpm6.pdf
IMF (2014). BPM6 Compilation Guide – Companion Document to the Sixth Edition of The Balance of Pay-ments and International Investment Position Manual. Washington D.C.: International Monetary Fund. http://www.imf.org/external/pubs/ft/bop/2014/pdf/guide.pdf
Kermiet, V. (2017). Reinvested earnings on FDI. Presented at Balance of Payments Working Group in November 2017.
Ker, D. & Galindo-Rueda, F. (2017). Frascati Manual R&D and the System of National Accounts. OECD Science, Technology and Industry Working Papers, 2017/06. http://dx.doi.org/10.1787/edb6e020‑en
Khder, M.-B., Montornes, J. & Ragache, N. (2020). Irish GDP Growth in 2015: A Puzzle and Propositions for a Solution. Economie et Statistique / Economics and Statistics, this issue.
Mangan, O. & Quill, P. (2018). The impact on reinvested earnings of expenditure in R&D. Presented at Joint Eurostat ‑ OECD Task Force on Land and other non-financial assets – Intellectual Property Products (February 2018).
OECD (2009). Measuring Capital - OECD Manual 2009: Second edition. Paris: OECD Publishing.https://doi.org/10.1787/9789264068476‑en
OECD (2015). Frascati Manual 2015 guidelines for collecting and reporting data on research and experimen-tal development. Paris: OECD publishing. https://www.oecd‑ilibrary.org/docserver/9789264239012‑en.pdf?expires=1554216827&id=id&accname=guest&checksum=786A11CD6334CE55744F9106B00BE2D5
OECD (2018). Globalisation, Intellectual Property Products and Measurement of GDP: Issues and Proposals. Committee on Statistics and Statistical Policy Informal Reflection Group, 15th Meeting of the Committee on Statistics and Statistical Policy 20‑21 June 2018, Geneva. http://www.oecd.org/officialdocuments/publicdisplaydocumentpdf/?cote=SDD/CSSP(2018)6&doc Language=En
Quill, P. (2017). Treatment of research and development and investment income in balance of payments and national accounts. Presented at Balance of Payments Working Group in November 2017.

ECONOMIE ET STATISTIQUE / ECONOMICS AND STATISTICS N° 517-518-519, 2020204
Stapel-Weber, S. & Verrinder, J. (2016). Globalisation at work in statistics – Questions arising from the ‘Irish case’. Eurostat Review on National Accounts and Macroeconomic Indicators, 2/2016, 29‑44. http://ec.europa.eu/eurostat/documents/3217494/7784358/KS‑GP‑16‑002‑EN‑N.pdf/af4b1474‑cc3a‑4453‑ 9814‑bfbcb74e31d0
Taylor, C. (2016). Ireland’s GDP figures: Why 26% economic growth is a problem. Irish Times, 15 July 2016. https://www.irishtimes.com/business/economy/ireland‑s‑gdp‑figures‑why‑26‑economic‑growth‑is‑a‑pro‑blem‑1.2722170
The Economist (2016, July 16). Not the full shilling. Why GDP growth of 26% a year is mad. Europe, Jul 16th 201. https://www.economist.com/europe/2016/07/16/not‑the‑full‑shilling
Tørsløv, T., Wier, L. & Zucman, G. (2018). The Missing Profit of Nations. NBER, Working Paper N° 24701. https://gabriel‑zucman.eu/files/TWZ2018.pdf
UN (1968). A System of National Accounts. New York: United Nations Publications. https://unstats.un.org/unsd/nationalaccount/docs/1968SNA.pdf
UN, Eurostat, IMF, OECD, World Bank (1993). System of National Accounts 1993. Brussels/Luxembourg, New York, Paris, Washington, D.C. https://unstats.un.org/unsd/nationalaccount/docs/1993sna.pdf
UN, EC, IMF, OECD, UNCTAD, WTO (2002). Manual on Statistics of International Trade in Services, pp. 82–84. New York: United Nations Publications. https://www.oecd.org/trade/its/2404428.pdf
UN, Eurostat, IMF, OECD, World Bank (2008). System of National Accounts 2008. New York. https://unstats.un.org/unsd/nationalaccount/docs/sna2008.pdf
UN, IMF, OECD, Eurostat, UNCTAD, World Tourism Organisation, WTO (2011). Manual on Statistics of International Trade in Services 2010, pp. 145–148. New York: United Nations Publications. https://unstats.un.org/unsd/publication/seriesm/seriesm_86rev1e.pdf
van de Ven, P. (2015). New standards for compiling national accounts: what’s the impact on GDP and other macro‑economic indicators? OECD Statistics Brief N° 20. http://www.oecd.org/sdd/na/new‑standards‑for‑compiling‑national‑accounts‑SNA2008‑OECDSB20.pdf