Embed Size (px)
Citation preview

1
Consolidated Financial Results
for the Fiscal Year Ended March 31, 2019
[Japan GAAP]
Prepared in accordance with accounting principles generally accepted in Japan
Translated from the original Japanese-language document
May 10, 2019
Daifuku Co., Ltd.
Stock code: 6383, First Section of Tokyo Stock Exchange
URL: www.daifuku.com/jp
Representative: Hiroshi Geshiro, President and CEO
Contact: Tsukasa Saito, General Manager of Finance & Accounting Division
Tel: +81-6-6472-1261
Scheduled date of general meeting of shareholders: June 21, 2019
Scheduled date of commencing dividend payment: June 24, 2019
Scheduled date for filing financial statements: June 24, 2019
Earnings supplementary materials: Yes
Earnings presentation: Yes (for institutional investors and securities analysts)
Note: Figures are rounded down to the nearest one million yen.
1. Consolidated Financial Results for Fiscal 2018
(April 1, 2018 - March 31, 2019)
(1) Operating results
(Figures in percentages denote the year-on-year change)
Net sales Operating income Ordinary income
Net income attributable to
shareholders of the parent company
Million yen % Million yen % Million yen % Million yen %
Fiscal 2018 459,486 13.5 54,681 37.0 55,842 35.9 39,567 36.4
Fiscal 2017 404,925 26.2 39,924 72.8 41,105 73.0 29,008 73.2
Note: Comprehensive income
Fiscal 2018: 40,800 million yen (22.0 %)
Fiscal 2017: 33,433 million yen (108.4 %)
Net income per share
Diluted net income per share
Return on equity Ratio of
ordinary income to total assets
Ratio of operating income
to net sales
Yen Yen % % %
Fiscal 2018 314.54 - 19.5 14.3 11.9
Fiscal 2017 235.62 - 17.7 12.2 9.9
Reference: Equity in earnings of affiliates during the period
Fiscal 2018: 172 million yen
Fiscal 2017: 734 million yen

2
(2) Financial position
Total assets Net assets Equity ratio Net assets per share
Million yen Million yen % Yen
Fiscal 2018 409,982 222,885 53.3 1,738.20
Fiscal 2017 373,013 191,474 50.4 1,493.69
Reference: Shareholders’ equity
Fiscal 2018: 218,689 million yen
Fiscal 2017: 187,878 million yen
(3) Cash flows
Cash flows
from operating activities
Cash flows from investing
activities
Cash flows from financing
activities
Cash and cash equivalents, end of year
Million yen Million yen Million yen Million yen
Fiscal 2018 8,559 5,937 (6,893) 90,903
Fiscal 2017 11,497 (5,600) 13,444 85,152
2. Dividends
Dividend per share Total cash dividends (annual)
Dividends payout
(consolidated)
Net assets dividend ratio (consolidated) Q1-end Q2-end Q3-end Year-end Annual
Yen Yen Yen Yen Yen Million yen % %
Fiscal 2017 - 25.00 - 45.00 70.00 8,710 29.7 5.3
Fiscal 2018 - 30.00 - 60.00 90.00 11,338 28.6 5.6
Fiscal 2019 (forecast)
- 30.00 - 60.00 90.00 -
3. Consolidated Earnings Forecast for the Fiscal 2019
(April 1, 2019- March 31, 2020)
(Figures in percentage denote the year-on-year change from the same period of the previous fiscal year.)
Net sales Operating income Ordinary income
Net income attributable to
shareholders of the parent company
Net income per share
Million yen % Million yen % Million yen % Million yen % Yen
Interim 230,000 9.2 23,000 (0.5) 23,400 (1.5) 16,300 (25.2) 129.58
Full-year 480,000 4.5 52,800 (3.4) 53,500 (4.2) 38,200 (3.5) 303.67

3
Notes:
(1) Changes in significant subsidiaries that affected the scope of consolidation during the fiscal year: None
(2) Changes in accounting policies, accounting estimates, and restatement
1) Changes in accounting standards associated with the revisions of accounting standards: Yes
2) Other changes: None
3) Changes in accounting estimates: None
4) Restatement: None
(3) Number of shares issued (Common stock)
1) Number of shares issued including treasury stock at the end of the period
Fiscal 2018: 126,610,077 shares
Fiscal 2017: 126,610,077 shares
2) Number of treasury stock at the end of the period
Fiscal 2018: 795,986 shares
Fiscal 2017: 828,727 shares
3) Average number of shares during the period
Fiscal 2018: 125,794,780 shares
Fiscal 2017: 123,115,953 shares
Note: For the number of shares, which is the basis for the calculation of net income per share, please see “Per
Share Information” on page 35. The number of treasury stock at the end of the fiscal year ended March
31, 2019 included 75,300 shares owned by the Board Benefit Trust (BBT). The number of treasury stock at
the end of the fiscal year ended March 31, 2018 included 87,600 shares owned by the BBT. In addition,
the number of treasury stock at the end of the fiscal year ended March 31, 2019 includes 149,400 shares
owned by a trust on behalf of Daifuku employees’ shareholding association.
These consolidated financial statements are not subject to audit through the certified public accountant or audit
company.
Disclaimer
The business forecasts contained in this document are based on information available to management at the
present time and certain assumptions judged to be rational. As such, actual sales and income may differ from
this forecast due to uncertain factors present in the forecast or future changes in business circumstances. For
the business forecasts, please see 1-(5) “Outlook for the fiscal year ending March 31, 2020.”
Earnings supplementary materials are available at the TDnet and our website: www.daifuku.com/ir.

4
Contents
1. Operating Results and Financial Review 5
(1) Operating results 5
(2) Financial position 9
(3) Cash flows 10
(4) Basic policy for dividends for the fiscal year under review and the following fiscal year 11
(5) Outlook for the fiscal year ending March 31, 2020 12
2. Management Policy 14
(1) Basic management policy and medium- and long-term goals 14
(2) Management environment 14
(3) Challenges to address 15
3. Basic Stance on Selecting Accounting Standards 16
4. Consolidated Financial Statements 17
(1) Consolidated balance sheets 17
(2) Consolidated statements of income and comprehensive income 19
(3) Consolidated statements of changes in net assets 21
(4) Consolidated statements of cash flows 25
(5) Notes on consolidated financial statements 27
Note on going concern assumption 27
Changes in significant accounting policies 27
Reclassification 27
Additional information 28
Segment information 30
Related information 35
Per share information 35
Major subsequent events 36
5. Other 37
Changes in Officers 37

5
1. Operating Results and Financial Review
(1) Operating results
During the fiscal year under review, the global economy benefited from an expansion in the U.S. and
generally firm trends in Japan as well as in European and emerging nations in the first half. Meanwhile, in
the second half, a trade conflict between the U.S. and China, a slowdown in economic growth in China, and
other issues are creating uncertainty about the future.
The Daifuku Group’s mainstay material handling systems continued to enjoy robust investment as a whole,
bolstered by demand from a broad range of industries, including e-commerce and other distribution sectors,
semiconductors, flat-panel displays (FPDs), automobiles, and airports. In the background are increases in
the global movement of people and goods, transformations of distribution systems, and changes in the
industrial structure associated with technological innovations, including the Internet of Things (IoT).
Investment in automatization was spurred by labor shortages.
Amid these economic and business conditions, the operating results of the Daifuku Group remained
favorable and achieved new record highs in terms of orders, sales and income during the fiscal year under
review. The fiscal year under review was the second year of the four-year business plan Value Innovation
2020 (April 2017 to March 2021), and the plan’s targets were already achieved. For a brief description, please
refer to “Basic management policy and medium- and long-term goals” (page 14).
Orders remained strong, driven by large projects from semiconductor manufacturers in East Asia and North
America, as well as from pharmaceutical wholesalers and distributors including e-commerce in Japan. In
systems for airports, which non-Japanese subsidiaries have been handling, large orders were posted in
North America. In addition, the Group continued to build its track record in Japan, where demand for
equipment upgrades is rising in preparation for the 2020 Tokyo Summer Olympics.
Sales were positive, underpinned by the high level of orders. With increased production capacity due to
continued capital investment and increased supply capacity to meet rapidly rising demand, achieved in
cooperation among Group companies worldwide, the Group was able to achieve growth in sales.
As a consequence, the Group received orders of 503,399 million yen, up 3.2% from the previous fiscal year
and recorded sales of 459,486 million yen, up 13.5%.
In terms of profits, operating income significantly surpassed the year-ago figure, reflecting increased
earnings strength from higher revenue and cost cutting by the parent company Daifuku Co., Ltd., while also
benefiting from the strong performance of an East Asian subsidiary that handles systems for the
semiconductor and FPD sectors.
With the transfer of shares of Knapp AG, which was an equity-method affiliate in Austria, Daifuku posted
extraordinary income from a gain on the sale of shares in affiliates of 6,948 million yen (balance of

6
consolidated book value). A buyout* of part of the defined benefit pension plan of a consolidated subsidiary,
Jervis B. Webb Company (a wholly owned subsidiary of Daifuku North America Holding Company, a
company overseeing operations in North America) resulted in retirement benefit expenses of 6,897 million
yen (including consolidated adjustment) in extraordinary losses. The purpose of the transfer of shares of
Knapp was concentrating management resources in the growth markets of Asia and North America. The
buyout of the pension plan of Jervis B. Webb was intended to remove accounting and financial uncertainties,
including pension fund management risk and financial deterioration risk.
Consequently, the Group posted operating income of 54,681 million yen, up 37.0% from a year earlier, and
ordinary income of 55,842 million yen, up 35.9%. Net income attributable to shareholders of the parent
company was 39,567 million yen, up 36.4%.
ROE improved from the previous fiscal year (17.7%), to 19.5%. This primarily reflected an improvement in
the return on sales (from 7.2% to 8.6%).
The average exchange rate used for transactions within the Group during the fiscal year under review was
110.37 yen to the U.S. dollar, compared with an exchange rate of 112.04 yen for the same period of the
previous fiscal year. The change reduced net sales by about 1.8 billion yen, but its impact on operating
income was minor. Orders were reduced by about 7.7 billion yen. As for the breakdown of the impact on
orders, the impact on orders received during the fiscal year under review was about 2.5 billion yen, and the
impact on the order backlog was about 5.2 billion yen.
Results by reportable segment are described below. Orders from and sales to outside customers are
presented as segment orders and sales, and net income attributable to shareholders of the parent company
is recorded as segment income. For more details about segments, please see “Segment information” below.
Clean Factomation, Inc. (South Korea), which was previously included in Other, has been changed to a
reportable segment due to its increased quantitative significance since the second quarter.
* A pension buyout is a scheme to transfer all or part of a defined benefit pension plan to an insurance
company, etc. in exchange for the payment of premiums whereby the insurance company will operate the
pension plan after the transfer.
Daifuku Co., Ltd.
Orders were robust for systems for semiconductor factories in East Asia and North America through
exports to each region, as well as for large systems for manufacturers and distributors in Japan. Orders
remained firm in automobile production line systems, mainly for production re-building and development,
services and small upgrade projects in Japan. As for systems for airports, the first order in Japan was
received from New Chitose Airport, Hokkaido. Other orders were received subsequently.
Sales of systems for semiconductor and FPD factories grew significantly. Also, sales of systems for
manufacturers, distributors, and automobile production lines were positive.

7
Income rose significantly, mainly attributable to the increased sales and reduced costs. In addition,
extraordinary income of 8,030 million yen from a gain on the sale of shares in Knapp AG, which was an
equity-method affiliate, (balance of acquisition cost) boosted income.
As a result, the Company recorded orders of 231,480 million yen, up 7.2% from the same period of the
previous fiscal year, sales of 202,528 million yen, up 8.3%, and segment income of 33,760 million yen, up
33.9%.
Contec Co., Ltd. and its affiliates
- Industrial computers
In Japan, uncertainty increased chiefly due to the U.S.-China trade friction, and sales were flat. In the
United States, sales of industrial computers for airport security were favorable.
- Measuring and control boards
Sales of wireless LAN products fell; however, sales of products for the IoT market, including CONPROSYS,
increased.
- Solution products
Sales of remote monitoring systems and cloud services increased. Sales of repair and maintenance
services also climbed.
Income rose, reflecting an increase in sales, an improvement in productivity, and extraordinary income as
a result of sales of investment securities.
As a result, Contec posted orders of 16,398 million yen, down 0.4% from the previous fiscal year, sales of
16,391 million yen, up 4.3%, and segment income of 1,617 million yen, up 77.6%.
Daifuku North America Holding Company and its affiliates
Orders for systems for airports and semiconductor production lines remained favorable. In systems for
manufacturers and distributors, orders from the e-commerce sector remained firm. In automobile
production line systems, orders were influenced by the fact that automakers were carefully considering
their car model strategies.
Sales fell slightly chiefly due to delays in orders and installation.
Operating income improved chiefly due to an improvement in costs and the end of unprofitable projects.
However, segment income was adversely affected by extraordinary losses of 6,513 million yen attributable
to a buyout of part of the defined benefit pension plan of Jervis B. Webb, a subsidiary, and a non-current
asset impairment loss of 807 million yen at Wynright Corporation.

8
As a result, Daifuku North America achieved orders of 109,450 million yen, down 0.9% from the previous
fiscal year, sales of 97,186 million yen, down 2.6%, and segment income of 432 million yen, down 85.0%.
Clean Factomation, Inc.
Clean Factomation, Daifuku’s wholly owned subsidiary in South Korea, mainly provides cleanroom
transport systems to the country’s semiconductor manufacturers. The company also strives to improve
peripheral related equipment and develop related improvements. Playing an additional role in global
production of the same system in collaboration with Group factories in Japan, China, and Taiwan, the
company’s results remained strong.
As a result, Clean Factomation posted orders of 41,783 million yen, up 39.6% from the same period the
previous year, sales of 34,211 million yen, up 61.1%, and segment income of 2,545 million yen, up 75.3%.
Daifuku Plusmore Co., Ltd.
Daifuku Plusmore benefited from strong sales to its main customers, such as car service stations and car
dealerships; however, its profits reflected an intensifying competitive environment.
The company will promote sales in the car dealerships market and the bus business by launching new
products to improve working environments in response to work-style reform. Zechs, a space-saving, gate-
type car wash machine for the car dealerships market, can be installed in maintenance facilities with
limited space. A dryer system for large vehicle washing machines, Z-Blow, was launched to tap into
demand for tour buses, which is rising with the increased number of visitors to Japan.
As a result, Daifuku Plusmore recorded orders of 11,814 million yen, up 6.7% from the previous fiscal year,
sales of 11,611 million yen, up 7.7%, and segment income of 91 million yen, down 7.9%.
Other
The Group has a total of 53 consolidated subsidiaries worldwide. The Other segment includes all Group
companies excluding the aforementioned Contec and its affiliates, Daifuku North America and its affiliates,
Clean Factomation, and Daifuku Plusmore.
Outside Japan, major subsidiaries include Daifuku (China) Co., Ltd., Taiwan Daifuku Co., Ltd., Daifuku Korea
Co., Ltd., and Daifuku (Thailand) Ltd., which primarily manufacture and sell material handling systems and
equipment. Each of these companies plays a global role in optimizing the local production and
procurement framework of the Group, while also increasing its exports.
China:
Orders from FPD factories fell from the fiscal year ended March 31, 2018, when there was a concentration
of large projects, but exceeded the initial plan. Sales rose significantly. Meanwhile, in systems for the food,

9
pharmaceutical, auto parts, e-commerce and other distribution sectors, demand for material handling
systems is increasing. In the automotive sector, orders, sales and income remained favorable, bolstered
by brisk capital investment from Japanese automakers.
Taiwan:
Orders for systems for most advanced semiconductor factories increased. Taiwan Daifuku was recognized
for its contributions as a supplier by its customers with an award. Daifuku’s technology, quality, and ability
to execute projects were acclaimed.
South Korea:
Orders for automobile production line systems and sales of car wash machines were firm. MEGA
CLENS750, a new tunnel-type car wash machine, was well received.
ASEAN countries and India:
Capital investment in systems for manufacturers, including the food, miscellaneous daily goods, and
pharmaceutical sectors, is rising. In particular, demand from the frozen-food sector is growing. In Thailand,
the momentum toward capital investment in automobile factories is rising. In addition, inquiries from the
food, pharmaceutical, and beverage sectors are increasing. Daifuku Thailand started to construct a new
factory building on its premises to respond to increasing demand in Vietnam and other parts of the
ASEAN region.
New Zealand:
BCS Group Limited sells airport baggage handling systems, self-service baggage check-in systems, and
other products, and is bolstering its business extensively in Western countries and Japan by collaborating
with other Group companies.
As a result, the segment reported orders of 93,309 million yen, down 10.4% from the same period the
previous year, sales of 99,280 million yen, up 33.2%, and segment income of 5,658 million yen, up 72.2%.
(2) Financial position
The Group’s financial position is as described below. Daifuku adopted the "Partial Amendments to
Accounting Standard for Tax Effect Accounting" (ASBJ Statement No. 28, February 16, 2018) and other
standards from the beginning of the first quarter of the fiscal year under review. A year-on-year comparison
and analysis of the financial position were made after retroactively applying the above standards to the
values for the previous fiscal year.
Assets
Total assets at the end of the fiscal year under review stood at 409,982 million yen, an increase of 36,968
million yen from the end of the previous fiscal year. Current assets increased by 40,151 million yen,
principally reflecting an increase of 28,765 million yen in notes and accounts receivable and unbilled
receivables and an increase of 5,755 million yen in cash on hand and in banks. The former reflected the

10
increased sales. The latter was mainly due to sales of shares in affiliates, and principally in Japan the
collection of notes and accounts receivable for completed contracts of large projects that concluded at the
end of the previous fiscal year and advances received on uncompleted construction contracts.
Non-current assets decreased by 3,182 million yen, mainly attributable to a decrease of 3,372 million yen in
investments and other assets resulting from a sale of shares in affiliates among others.
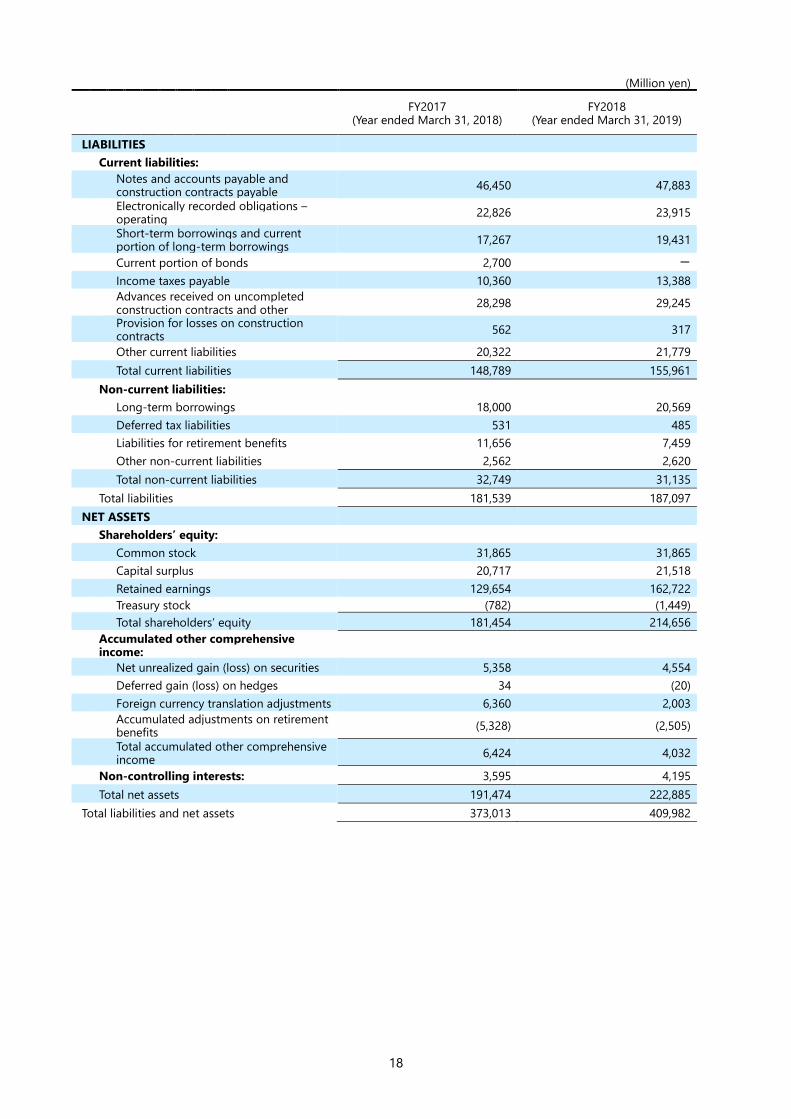
Liabilities
Total liabilities at the end of the fiscal year under review amounted to 187,097 million yen, an increase of
5,557 million yen from the end of the previous fiscal year. Current liabilities increased by 7,172 million yen.
Primary factors included an increase of 2,164 million yen in short-term borrowings mainly due to an increase
in borrowings of foreign subsidiaries and an increase of 3,028 million yen in income taxes payable due to
income taxes paid, despite the repayment of current portion of long-term borrowings by Japanese
companies.
Non-current liabilities decreased by 1,614 million yen, mainly attributable to a decrease of 4,196 million yen
in liabilities for retirement benefits and an increase of 2,569 million yen in long-term borrowings centering
around borrowings in Japan.
Net assets
Net assets at the end of the fiscal year under review were 222,885 million yen, an increase of 31,410 million
yen from the end of the previous fiscal year. The main factors were an increase of 33,067 million yen in
retained earnings due to the recording of net income attributable to shareholders of the parent company
and a rise of 2,823 million yen in accumulated adjustments on retirement benefits, which was attributable
chiefly to a buyout of part of the defined benefit pension plan of a subsidiary in North America.
(3) Cash flows
Cash and cash equivalents at the end of the fiscal year under review increased by 5,751 million yen from the
end of the previous fiscal year, to 90,903 million yen, compared with 85,152 million yen in the same period
of the previous fiscal year.
Individual cash flows in the fiscal year under review and contributing factors were as follows:
Cash flows from operating activities
Cash provided by operating activities totaled 8,559 million yen, compared with cash provided of 11,497
million yen in the same period of the previous fiscal year. Extraordinary items, mainly retirement benefit
expenses of 6,897 million yen and a gain on sales of shares in affiliates of 6,948 million yen, are included in
income before income taxes, 55,329 million yen. Cash was provided principally by an increase in notes and
accounts receivable of 32,172 million yen, an increase in inventories of 7,509 million yen, and income taxes
paid of 16,278 million yen. The main factors decreasing cash were an increase in notes and accounts payable
of 4,052 million yen and an increase in advances received on uncompleted construction contracts of 4,279

11
million yen.
Cash flows from investing activities
Cash provided in investing activities was 5,937 million yen (compared with cash provided of 5,600 million
yen in the same period of the previous fiscal year). Major factors included proceeds of 13,223 million yen
including a sale of shares in affiliates, offsetting an outlay of 7,744 million yen for the purchase of property,
plant and equipment.
Cash flows from financing activities
Cash used in financing activities was 6,893 million yen, compared with cash provided of 13,444 million yen
in the same period of the previous fiscal year, mainly attributable to repayments of long-term borrowings
and the redemption of bonds of 15,339 million yen and payments of cash dividends of 9,428 million yen
chiefly at Japanese companies, offsetting an increase in short-term borrowings, net of 12,844 million yen at
non-Japanese subsidiaries and proceeds from long-term borrowings of 5,188 million yen at Japanese
companies.
<Reference> Changes in cash flow indicators
Equity ratio: (Net assets − Non-controlling interests − Equity warrants)/Total assets
Equity ratio based on market capitalization: Market capitalization of shares/Total assets
Ratio of interest-bearing liabilities to cash flows: Interest-bearing liabilities/Operating cash flows
Instant coverage ratio: Cash flows/Interest paid
(Note 1) The above indicators are calculated based on the figures in the consolidated financial statements.
(Note 2) Market capitalization is calculated based on the following formula: Closing price of shares at the end
of the period × Number of shares issued at the end of the period (excluding treasury stock)
(Note 3) Operating cash flows are used for cash flows.
(Note 4) Interest-bearing liabilities are all liabilities recorded in the consolidated balance sheets that pay interest.
(Note 5) Additionally, interest paid is the amount of interest paid in the consolidated statements of cash flows.
(4) Basic policy for dividends for the fiscal year under review and the following fiscal year
Daifuku regards the return of profits to shareholders as its most important management task and has
adopted a performance-based policy for cash dividends based on consolidated net income, with the aim of
achieving additional profit distribution to shareholders. We appropriate the remaining surplus to internal
reserves for future growth.
FY2014 FY2015 FY2016 FY2017 FY2018
Equity ratio (%) 39.8 42.9 45.8 50.4 53.3
Equity ratio based on market capitalization (%)
64.9 77.9 111.3 214.8 176.8
Ratio of interest-bearing liabilities to cash flows (Year)
9.6 5.7 1.5 3.3 4.7
Interest coverage ratio (Times) 12.9 14.4 64.8 30.9 20.2

12
Under its four-year medium-term business plan, Value Innovation 2020, Daifuku aims to achieve a dividend
payout ratio of 30% and increase its corporate value through investment in growth.
For the fiscal year ended March 31, 2019, Daifuku paid an interim dividend of 30 yen per share, and the
Board of Directors passed a resolution to pay a year-end dividend of 60 yen per share at a meeting held on
May 10, 2019, for an annual dividend of 90 yen per share. The annual dividend rose for the 6th consecutive
year from the fiscal year ended March 31, 2014, when the annual dividend increased 3 yen, to 18 yen.
With respect to dividends for the fiscal year ending March 31, 2020, the Company plans to pay an annual
dividend of 90 yen (an interim dividend of 30 yen per share and a year-end dividend of 60 yen), taking into
consideration the earnings forecast for the fiscal year ending March 31, 2020 and the basic policy described
above.
(5) Outlook for the fiscal year ending March 31, 2020
Daifuku Group has revised its management targets (consolidated net sales and operating margin) for the
fiscal year ending March 2021, the final year of Value Innovation 2020, its four-year business plan, as a result
of a review taking into account the recent business environment. The earnings forecast for the fiscal year
ending March 31, 2020 is as follows:
Consolidated earnings forecast for the fiscal year ending March 31, 2020
Orders received 530 billion yen (up 5.3% year-on-year)
Net sales 480 billion yen (up 4.5% year-on-year)
Operating income 52.8 billion yen (down 3.4% year-on-year)
Ordinary income 53.5 billion yen (down 4.2% year-on-year)
Net income attributable to shareholders of
the parent company 38.2 billion yen (down 3.5% year-on-year)
This forecast is based on the following economic and business environments.
Impact from currency exchange
The actual exchange rate of 110.37 yen to the U.S. dollar was used for the results of the fiscal year under
review. The same exchange rate is assumed in preparing the plan for the next fiscal year. No significant
impact from the exchange rate is factored in.
Orders received
Daifuku Group’s mainstay business of material handling systems is bolstered by demand in a broad range
of sectors, including distribution, manufacturing, and airports. In the fiscal year ending March 31, 2020,
orders are expected to be driven by orders for systems in the distribution industry, where e-commerce is
increasing. Orders for systems for airports are likely to be strong as the number of air travelers are increasing.

13
Capital investment in the semiconductor sector is expected to remain at a high level, underpinned by factors
including the progress of 5G mobile telecommunications. Overall, the environment for orders is expected
to support sustainable growth.
Net sales
Given an extensive order backlog, net sales are likely to reach a new record high. To ensure supply capacity,
the Group is expanding production capacity systematically around the world.
Operating income
The ratio of operating income to net sales increased steadily from 7.2% in the fiscal year ended March 31,
2017, to 9.9% in the fiscal year ended March 31, 2018, to 11.9% in the fiscal year ended March 31, 2019. In
the fiscal year ending March 31, 2020, the business environment and the competitive environment
surrounding customers in the semiconductor and FPD sectors are anticipated to be harsh. Despite that
environment, the Group will strive to further improve profitability.
This forecast represents the judgment of the Company based on information presently available. Actual
results may differ materially from forecasts due to various uncertainties, including economic and competitive
conditions worldwide as well as various risk factors.

14
2. Management Policy
(1) Basic management policy and medium- and long-term goals
Under its management philosophy: “provide the best solutions to benefit global markets and the
development of society” and “focus on healthy, growth-driven global management under a diverse and
positive corporate culture,” Daifuku has responded to the logistics needs of customers in a variety of sectors,
including manufacturing, distribution and services, with its long-established material handling technologies
for storage, transport, sortation and picking.
Daifuku Group has strived to develop its operations for customers worldwide and has grown to become the
world leading material handling equipment manufacturer* in terms of nets sales.
*Source: Modern Materials Handling - May 2018
In the fiscal year ended March 31, 2019, income far exceeded the initial plan. Daifuku improved its financial
position. ROE exceeded 10%, and the debt-equity ratio was under 0.2. The issue was selected as a
constituent of JPX-Nikkei Index 400 for the third consecutive year.
The management targets of the four-year business plan Value Innovation 2020 were achieved in the fiscal
year ended March 31, 2019, and the management targets (consolidated net sales and operating margin) for
the final year of the plan (fiscal year ending March 31, 2021) were revised. For more details, please see the
Company's statement “Notice of Revision of the Management Targets for the Medium-Term Business Plan”
separately announced on May 10, 2019.
Revision of management targets for the medium-term business plan, Value Innovation 2020
Initially planned Revised
Consolidated net sales JPY 420 billion JPY 500 billion
Operating margin 8.0% 11.5%
(2) Management environment
1) Business environment
The customers in Daifuku’s four core businesses—(i) systems for manufacturers and distributors, (ii)
systems for semiconductor and FPD production lines, (iii) systems for automobile production lines, and
(iv) systems for airports—are facing major changes in their business environment: e-commerce, the
digital revolution, shifts to automated driving and electric vehicles, and increasing air travelers. They
thus have high expectations for the logistics solutions that the Company provides.
2) Competitive environment
As the material handling market expands, competitors from emerging countries are now entering the
market, joining the traditional competitors from the West. Competition is anticipated to intensify.
Daifuku will succeed in this highly competitive environment by taking advantage globally of the Group’s

15
strength: providing the optimum and best systems to meet any logistics needs using its integrated
system encompassing consulting, manufacture, and after-sales service and its product lineup consisting
of an abundance of devices and software.
3) Globalization, localization
The Group has focused on globalization, and now has facilities in 23 countries and regions. In addition
to globalization, the Group has been promoting localization. In recent years, it has been actively
investing in local production.
Looking at factories outside of Japan, in 2018, production capacity at Daifuku Korea Co., Ltd. in South
Korea increased 1.5 fold. In 2019, a new factory of Wynright Corporation in North America will be
completed, and its production capacity will be twice that of the previous factory. Production at Daifuku
(China) Manufacturing Co., Ltd. in China will increase approximately threefold. In April 2019, the Group
acquired a logistics system company in India to improve the local production framework.
(3) Challenges to address
The Group considers safety, compliance, governance, work-style reform, and the environment, as well as
increasing its results and financial position, as important issues.
In the fiscal year ending March 31, 2020, as in the fiscal year ended March 31, 2019, the Group will address
the following challenges:
1) Full-enforcement of “safety first” across the Group
“Safety is not a relative comparison such as ranking first or second. It is an absolute and is the most
important thing in all situations.” The Group is determined to follow that principle and make efforts to
eradicate accidents. Considering it a precondition for the activities of a company that can be trusted in
society, the Group will continue to focus on safety.
2) Strengthening compliance
As a compliance initiative, the Group reviewed its whistleblowing system and established an
independent, external point of contact to receive reports from across the nation and overseas, including
those from anonymous whistleblowers. The Group will strive to thoroughly prevent violations of law
and manage risks.
3) Pursue best combination of localization and globalization
The non-Japan sales ratio of the Group has reached 72%. With corporate management of non-Japanese
subsidiaries increasingly important, localization that promotes the locally oriented management of non-
Japanese subsidiaries and globalization that increases benefits from collaboration and the brand power
of the Group as a whole – in other words, Group governance that effectively balances a centrifugal force
with a centripetal force – is becoming increasingly vital.
In terms of localization, non-Japanese subsidiaries will promote sales, production, installation, and

16
service activities rooted in their respective areas, using the power delegated to them. In terms of
globalization, we will strive to build the Daifuku brand and foster a sense of unity in the Group, including
non-Japanese subsidiaries that have joined the Group, particularly those through M&A.
Daifuku took a unique step to strengthen corporate governance. The Company established the Audit
Division and appointed an Audit Officer, who is on the same level as a Corporate Officer, as General
Manager of the division. The Audit Officer attends board meetings and other important meetings. The
Audit Officer also reviews the development and operation of the internal control system and promotes
improvement from a position independent of executives, considering a variety of issues, including
compliance with applicable laws and regulations, risk management, ensuring appropriate and efficient
business management, and ensuring the reliability of financial reports.
4) Promotion of work-style reform
In the work-style reform led by the Work-Style Reform Committee, management for the leveling and
streamlining of tasks is promoted to avoid the concentration of tasks on certain people. This initiative
is producing results.
5) Environmentally-friendly management
The Group has been enhancing environmentally-friendly management. It established the Environment
Enhancement Management Committee and formed Daifuku Group Environmental Vision 2020. In the
fiscal year ended March 31, 2019, Daifuku received the minister of the environment’s award for activities
to mitigate global warming. In the fiscal year ending March 31, 2020, the Company aims to formulate
and promote an Environmental Management Strategy for contributing to achieving decarbonized
society and the Sustainable Development Goals (SDGs) and for the sustainable growth of the Group.
The Group will deepen its efforts for environment, society, and corporate governance to enhance its
corporate value and social value.
3. Basic Stance on Selecting Accounting Standards
Daifuku has adopted Japan GAAP.
With regard to the adoption of the International Financial Reporting Standards (IFRS), the Company will
properly address the issue by taking into consideration the accounting standards adopted by other
companies in Japan.

17
4. Consolidated Financial Statements
(1) Consolidated balance sheets (Million yen)
FY2017
(Year ended March 31, 2018) FY2018
(Year ended March 31, 2019)
ASSETS
Current assets:
Cash on hand and in banks 85,160 90,916
Notes and accounts receivable and unbilled receivables
163,101 191,867
Merchandise and finished goods 5,084 5,497
Costs incurred on uncompleted construction contracts and other
10,657 14,074
Raw materials and supplies 11,296 14,634
Other current assets 10,915 9,475
Allowance for doubtful accounts (128) (226)
Total current assets 286,088 326,239
Non-current assets:
Property, plant and equipment
Buildings and structures, net 15,091 15,041
Machinery and vehicles, net 4,411 4,379
Tools and fixtures, net 1,768 1,915
Land 11,800 12,162
Other, net 2,179 3,522
Total property, plant and equipment 35,252 37,020
Intangible assets
Software 3,208 3,425
Goodwill 8,794 7,561
Other 2,035 1,473
Total intangible assets 14,037 12,460
Investments and other assets
Investments in securities 23,976 15,341
Long-term loans 140 145
Assets for retirement benefits 3,967 4,932
Deferred tax assets 6,367 10,529
Other 3,319 3,510
Allowance for doubtful accounts (136) (198)
Total investments and other assets 37,635 34,262
Total non-current assets 86,925 83,742
Total assets 373,013 409,982
18
(Million yen)
FY2017
(Year ended March 31, 2018) FY2018
(Year ended March 31, 2019)
LIABILITIES
Current liabilities:
Notes and accounts payable and construction contracts payable
46,450 47,883
Electronically recorded obligations – operating
22,826 23,915
Short-term borrowings and current portion of long-term borrowings
17,267 19,431
Current portion of bonds 2,700 -
Income taxes payable 10,360 13,388
Advances received on uncompleted construction contracts and other
28,298 29,245
Provision for losses on construction contracts
562 317
Other current liabilities 20,322 21,779
Total current liabilities 148,789 155,961
Non-current liabilities:
Long-term borrowings 18,000 20,569
Deferred tax liabilities 531 485
Liabilities for retirement benefits 11,656 7,459
Other non-current liabilities 2,562 2,620
Total non-current liabilities 32,749 31,135
Total liabilities 181,539 187,097
NET ASSETS
Shareholders’ equity:
Common stock 31,865 31,865
Capital surplus 20,717 21,518
Retained earnings 129,654 162,722
Treasury stock (782) (1,449)
Total shareholders’ equity 181,454 214,656
Accumulated other comprehensive income:
Net unrealized gain (loss) on securities 5,358 4,554
Deferred gain (loss) on hedges 34 (20)
Foreign currency translation adjustments 6,360 2,003
Accumulated adjustments on retirement benefits
(5,328) (2,505)
Total accumulated other comprehensive income
6,424 4,032
Non-controlling interests: 3,595 4,195
Total net assets 191,474 222,885
Total liabilities and net assets 373,013 409,982
19
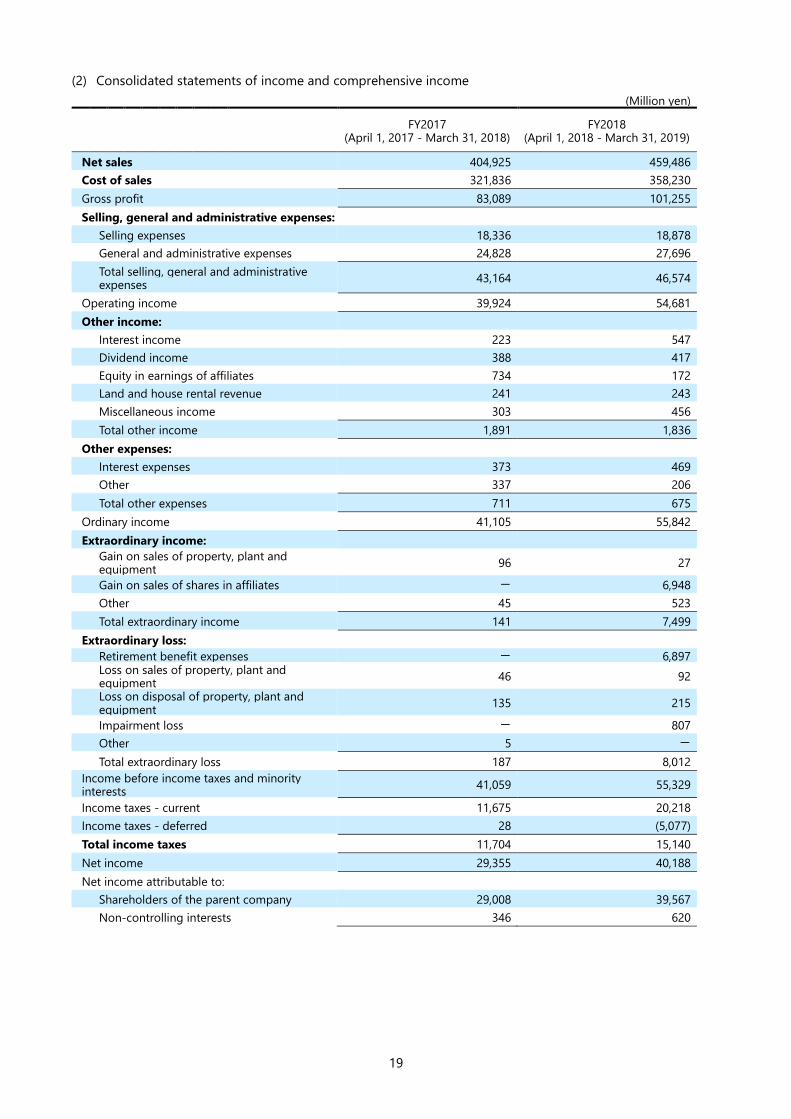
(2) Consolidated statements of income and comprehensive income (Million yen)
FY2017
(April 1, 2017 - March 31, 2018) FY2018
(April 1, 2018 - March 31, 2019)
Net sales 404,925 459,486
Cost of sales 321,836 358,230
Gross profit 83,089 101,255
Selling, general and administrative expenses:
Selling expenses 18,336 18,878
General and administrative expenses 24,828 27,696
Total selling, general and administrative expenses
43,164 46,574
Operating income 39,924 54,681
Other income:
Interest income 223 547
Dividend income 388 417
Equity in earnings of affiliates 734 172
Land and house rental revenue 241 243
Miscellaneous income 303 456
Total other income 1,891 1,836
Other expenses:
Interest expenses 373 469
Other 337 206
Total other expenses 711 675
Ordinary income 41,105 55,842
Extraordinary income:
Gain on sales of property, plant and equipment
96 27
Gain on sales of shares in affiliates - 6,948
Other 45 523
Total extraordinary income 141 7,499
Extraordinary loss:
Retirement benefit expenses - 6,897
Loss on sales of property, plant and equipment
46 92
Loss on disposal of property, plant and equipment
135 215
Impairment loss - 807
Other 5 -
Total extraordinary loss 187 8,012
Income before income taxes and minority interests
41,059 55,329
Income taxes - current 11,675 20,218
Income taxes - deferred 28 (5,077)
Total income taxes 11,704 15,140
Net income 29,355 40,188
Net income attributable to:
Shareholders of the parent company 29,008 39,567
Non-controlling interests 346 620

20
(Million yen)
FY2017
(April 1, 2017 - March 31, 2018) FY2018
(April 1, 2018 - March 31, 2019)
Other comprehensive income
Net unrealized gain (loss) on securities 1,097 (693)
Deferred gain (loss) on hedges 26 (55)
Foreign currency translation adjustments 1,154 (3,321)
Adjustments on retirement benefits 1,701 5,760
Share of other comprehensive income (loss) of affiliates accounted for using the equity method
97 (1,078)
Total other comprehensive income (loss) 4,078 611
Comprehensive income: 33,433 40,800
Comprehensive income attributable to:
Shareholders of the parent company 33,034 40,116
Non-controlling interests 399 683

21
(3) Consolidated statements of changes in net assets
FY2017 (April 1, 2017 - March 31, 2018)
(Million yen)
Shareholders' equity
Common stock Capital surplus Retained earnings Treasury stock Total
shareholders’ equity
Balance at the beginning of the period
15,016 15,915 107,349 (1,586) 136,694
Cumulative effects of changes in accounting policies
Restated balance 15,016 15,915 107,349 (1,586) 136,694
Changes of items during the period
Cash dividends (6,702) (6,702)
Issuance of new shares 16,849 16,849
Net income attributable to shareholders of the parent company
29,008 29,008
Purchase of treasury stock (15) (15)
Disposal of treasury stock 4,802 819 5,621
Change in treasury shares of parent arising from transactions with non- controlling shareholders
(0) (0)
Net changes of items other than shareholders’ equity
Total changes of items during the period
16,849 4,802 22,305 803 44,760
Balance at the end of the period
31,865 20,717 129,654 (782) 181,454

22
Accumulated other comprehensive income
Non- controlling interests
Total net assets
Net unrealized gain (loss)
on securities
Deferred gain (loss) on hedges
Foreign currency
translation adjustments
Accumulated adjustments
on retirement benefits
Total accumulated
other comprehensive
income
Balance at the beginning of the period
4,290 (5) 5,102 (6,989) 2,398 3,247 142,340
Cumulative effects of changes in accounting policies
Restated balance 4,290 (5) 5,102 (6,989) 2,398 3,247 142,340
Changes of items during the period
Cash dividends (6,702)
Issuance of new shares 16,849
Net income attributable to shareholders of the parent company
29,008
Purchase of treasury stock (15)
Disposal of treasury stock 5,621
Change in treasury shares of parent arising from transactions with non- controlling shareholders
(0)
Net changes of items other than shareholders’ equity
1,067 39 1,258 1,660 4,025 347 4,373
Total changes of items during the period
1,067 39 1,258 1,660 4,025 347 49,133
Balance at the end of the period
5,358 34 6,360 (5,328) 6,424 3,595 191,474

23
FY2018 (April 1, 2018 - March 31, 2019)
(Million yen)
Shareholders' equity
Common stock Capital surplus Retained earnings Treasury stock Total
shareholders' equity
Balance at the beginning of the period
31,865 20,717 129,654 (782) 181,454
Cumulative effects of changes in accounting policies
- - 2,940 - 2,940
Restated balance 31,865 20,717 132,595 (782) 184,394
Changes of items during the period
Cash dividends (9,440) (9,440)
Issuance of new shares - -
Net income attributable to shareholders of the parent company
39,567 39,567
Purchase of treasury stock (957) (957)
Disposal of treasury stock 804 290 1,094
Change in treasury shares of parent arising from transactions with non- controlling shareholders
(3) (3)
Net changes of items other than shareholders’ equity
Total changes of items during the period
- 800 30,127 (666) 30,261
Balance at the end of the period
31,865 21,518 162,722 (1,449) 214,656

24
Accumulated other comprehensive income
Non- controlling interests
Total net assets
Net unrealized gain (loss)
on securities
Deferred gain (loss) on hedges
Foreign currency
translation adjustments
Accumulated adjustments
on retirement benefits
Total accumulated
other comprehensive
income
Balance at the beginning of the period
5,358 34 6,360 (5,328) 6,424 3,595 191,474
Cumulative effects of changes in accounting policies
(2,940) (2,940)
Restated balance 5,358 34 6,360 (8,268) 3,484 3,595 191,474
Changes of items during the period
Cash dividends (9,440)
Issuance of new shares -
Net income attributable to shareholders of the parent company
39,567
Purchase of treasury stock (957)
Disposal of treasury stock 1,094
Change in treasury shares of parent arising from transactions with non- controlling shareholders
(3)
Net changes of items other than shareholders’ equity
(803) (54) (4,356) 5,763 548 600 1,148
Total changes of items during the period
(803) (54) (4,356) 5,763 548 600 31,410
Balance at the end of the period
4,554 (20) 2,003 (2,505) 4,032 4,195 222,885

25
(4) Consolidated statements of cash flows (Million yen)
FY2017
(April 1, 2017 - March 31, 2018) FY2018
(April 1, 2018 - March 31, 2019)
Cash flows from operating activities:
Income before income taxes 41,059 55,329
Depreciation 4,419 4,598
Impairment loss - 807
Retirement benefit expenses - 6,897
Loss (gain) on sales of shares in affiliates - (6,948)
Amortization of goodwill 943 927
Amortization of negative goodwill (59) -
Interest and dividend income (612) (964)
Interest expenses 373 469
(Loss) gain on disposal or sales of property, plant and equipment
82 281
Decrease (increase) in notes and accounts receivable
(37,923) (32,172)
Decrease (increase) in inventories (4,155) (7,509)
Increase (decrease) in notes and accounts payable
9,464 4,052
Increase (decrease) in advances received on uncompleted construction contracts
(4,462) 4,279
Other, net 5,275 (6,371)
Subtotal 14,403 23,674
Interest and dividend income received 610 964
Interest paid (372) (423)
Income taxes refund (paid) (3,493) (16,278)
Other, net 350 622
Net cash provided by (used in) operating activities
11,497 8,559
Cash flows from investing activities:
Investments in time deposits (0) (4)
Proceeds from refund of time deposits 3 -
Payments for purchase of property, plant and equipment
(6,417) (7,744)
Proceeds from sales of property, plant and equipment
740 102
Payments for purchase of investments in securities
(24) (33)
Collection of loans receivable 10 6
Proceeds from sales of shares in affiliates - 13,223
Other, net 88 387
Net cash provided by (used in) investing activities
(5,600) 5,937

26
(Million yen)
FY2017
(April 1, 2017 - March 31, 2018) FY2018
(April 1, 2018 - March 31, 2019)
Cash flows from financing activities:
Increase (decrease) in short-term borrowings, net
(1,400) 12,844
Proceeds from long-term borrowings 15,100 5,188
Repayments of long-term borrowings (15,605) (12,639)
Redemption of bonds - (2,700)
Proceeds from issuance of shares 16,697 -
Proceeds from disposal of treasury stock 5,621 1,088
Payments for purchase of treasury stock (15) (957)
Payments of cash dividends (6,695) (9,428)
Other, net (256) (290)
Net cash provided by (used in) financing activities
13,444 (6,893)
Effect of exchange rate change on cash and cash equivalents
1,018 (1,851)
Net increase (decrease) in cash and cash equivalents
20,361 5,751
Cash and cash equivalents at beginning of year
64,790 85,152
Cash and cash equivalents at end of year 85,152 90,903

27
(5) Notes on consolidated financial statements
Note on going concern assumption
Not applicable
Changes in significant accounting policies
(Adoption of IFRS 15 Revenue from Contracts with Customers)
From the beginning of the fiscal year under review, the Group has adopted IFRS 15 Revenue from Contracts with
Customers for Group companies excluding Daifuku Co., Ltd. and its subsidiaries in Japan, which have adopted
Japan GAAP, and its subsidiaries in the United States, which have adopted U.S. GAAP.
The above standard has introduced a single comprehensive model for recognizing revenue arising from
contracts with customers.
The impact of the above change on the consolidated financial statements for the fiscal year under review is
insignificant.
(Adoption of Reclassification of Certain Tax Effects from Accumulated Other Comprehensive Income)
The subsidiaries in North America that have adopted the U.S. standards adopted ASU 2018-02 “Reclassification
of Certain Tax Effects from Accumulated Other Comprehensive Income” (February 14, 2018) in the fiscal year
under review.
The adoption resulted in a 2,940 million yen increase in retained earnings and a 2,940 million yen decrease in
accumulated adjustments on retirement benefits at the beginning of the fiscal year under review. It does not
have any impact on consolidated earnings or per share information in the fiscal year under review.
Reclassification
(Change according to adoption of Partial Amendments to Accounting Standard for Tax Effect Accounting)
The Group has adopted the “Partial Amendments to Accounting Standard for Tax Effect Accounting” (ASBJ
Statement No. 28, February 16, 2018) the beginning of the fiscal year under review. As a result, “Deferred tax
assets” are classified as “Investments and other assets” and “Deferred tax liabilities” as “Non-current liabilities.”
In the consolidated financial statements for the previous fiscal year, of deferred tax assets of 4,988 million yen
in current assets, 4,289 million yen is included in deferred tax assets of 6,367 million yen in investments and
other assets, and deferred tax liabilities of 19 million yen in current liabilities are included in deferred tax liabilities
of 531 million yen in non-current liabilities.
Deferred tax assets are offset by deferred tax liabilities at the same taxable entities, which results in a 698 million
yen decrease in total assets for the previous fiscal year.

28
Additional information
(Board Benefit Trust)
The Company has introduced the Board Benefit Trust (BBT) system for its directors and corporate officers
(hereinafter “Directors, etc.”)
By introducing the plan, we aim to further clarify the link between remuneration for our directors, etc., and our
business performance and stock value. We also seek to provide a greater incentive for directors, etc. to
contribute to the improvement of our business performance over the medium and long term and to boosting
corporate value by sharing with our shareholders not only the benefits of a rising stock value but also the risks
of a decline in stock prices.
(1) Outline of the transaction
The plan is a stock compensation plan linked directly to its business performance by acquiring its stock
through the trust using the funds that the Company contributes (hereinafter referred to as “the Trust”) and
providing remuneration for directors, etc. through the Trust, in accordance with the stock compensation
regulations for its officers. The remuneration is the Company’s shares commensurate with points granted
based on business performance and the monies equivalent to the amount obtained by converting the
Company’s shares at a market price as of the retirement date. The Company’s shares to be acquired by the
trust this time are treasury shares held by the Company that are allotted through private placement. As a
general rule, our stocks are provided to our directors, etc., upon retirement.
The Company follows the Practical Solution on Transactions of Delivering the Company’s Own Stock to
Employees etc. through Trusts (ASBJ PITF No. 30, March 26, 2015) with respect to accounting for the trust
agreement.
(2) The Company’s shares still held by the Trust
The Company records the shares of the Company, which are held by the Trust and are yet to be sold to the
Shareholding Association, as treasury stock in net assets, using the book value (excluding incidental
expenses) in the Trust. The book value and the number of the treasury stock were 151 million yen and 75,000
shares, respectively, at the end of the fiscal year ended March 31, 2019.
(Transactions of delivering the Company’s own stock to employees, etc. through a trust)
Under the resolution adopted at a meeting of the Board of Directors on November 22, 2018, the Company has
introduced an employee shareholding incentive plan through a trust (E-Ship; hereinafter “the Plan”). The purpose
of the Plan is to provide an incentive for the Company’s employees to help enhance the Company’s enterprise
value over the medium to long term, to expand employee benefits and welfare, and to encourage the continuous
development of the Company by boosting employees’ morale through their capital participation as shareholders.
(1) Outline of the transaction
The Plan is an incentive plan for all employees who are members of the Daifuku Employee Shareholding

29
Association (“the Shareholding Association”). Under the Plan, the Company has set up a trust exclusively for
the Shareholding Association (“the E-Ship Trust”) at a trust bank. The E-Ship Trust acquires shares of the
Company that it anticipates the Shareholding Association will acquire during the trust period from
November 22, 2018 to March 29, 2021 through a private placement by the Company, using borrowed money.
Subsequently, the E-Ship Trust regularly sells shares of the Company to the Shareholding Association. If the
equivalent of gains on the sale of shares is accumulated in the E-Ship Trust upon termination of the trust,
the equivalent of the gains will be distributed to qualified beneficiaries as residual assets. The Company
provides loan guarantees for the E-Ship Trust’s borrowings to purchase shares of the Company, and if the
equivalent of losses on the sale of shares is accumulated in the E-Ship Trust due to a decline in the
Company’s share price and the E-Ship Trust has outstanding debt equivalent to losses on the sale of shares
upon termination of the trust, the Company will repay the outstanding debt under the guarantee agreement.
(2) The Company’s shares still held by the Trust
The Company records the shares of the Company, which are held by the Trust and are yet to be sold to the
Shareholding Association, as treasury stock in net assets, using the book value (excluding incidental
expenses) in the Trust. The book value and the number of the treasury stock were 823 million yen and
149,000 shares, respectively, at the end of the fiscal year ended March 31, 2019.
(3) The book value of borrowings posted using the gross price method
828 million yen for the fiscal year ended March 31, 2019

30
Segment information
1. Overview of reportable segments
Reportable segments comprise components for which discrete financial information is available, and which
the Board of Directors reviews regularly to determine the allocation of management resources and assess
operating results.
The Daifuku Group manufactures and sells material handling systems, car wash machines, industrial personal
computers, interface boards, and other equipment in Japan and overseas. Each company within the Group
conducts manufacturing and sales activities based on its roles as an independent management unit.
There are five reportable segments: Daifuku Co., Ltd., the core company dealing in material handling systems
and equipment, and car wash machines; Contec Co., Ltd. and its affiliates, the core company group engaging
in the manufacture and sale of industrial personal computers, interface boards, and other equipment in
Japan and overseas; Daifuku North America Holding Company and its affiliates; Clean Factomation, Inc., and
Daifuku Plusmore Co., Ltd.
In addition to the manufacture and sale of material handling systems and equipment and car wash machines
in Japan as the core company of the Daifuku Group, Daifuku Co., Ltd. develops and supplies key components
to companies around the world. Overseas subsidiaries assemble material handling system components
supplied by Daifuku Co., Ltd. with locally manufactured or purchased materials, sell the products, and
perform installation work as well as after-sales services. Daifuku North America Holding Company is a U.S.
subsidiary that is responsible for key business activities, primarily in North America, with a significant volume
of sales. It manufactures and sells leading airport baggage handling systems on its own as part of its material
handling systems. Daifuku Plusmore sells car wash machines and provides after-sales services.
Clean Factomation, Inc., which was previously included in Other, had been changed to a reportable segment
due to its increased quantitative significance since the second quarter of the fiscal year under review. Clean
Factomation provides cleanroom transport systems semiconductor manufacturers mainly in South Korea.
Accordingly, the change in the segment classification is as follows.
Formerly:
Daifuku Co., Ltd.
Contec Co., Ltd. and its affiliates
Daifuku North America Holding Company and its affiliates
Daifuku Plusmore Co., Ltd.
From the second quarter of the fiscal year under review:
Daifuku Co., Ltd.
Contec Co., Ltd. and its affiliates
Daifuku North America Holding Company and its affiliates
Clean Factomation, Inc.
Daifuku Plusmore Co., Ltd.

31
2. Methods of calculating the amount of net sales, income or losses, assets, liabilities and other items by
reportable segment
The method of accounting for the reported business segments is based on the principles and procedures
of accounting policies adopted for preparing consolidated financial statements. Intersegment sales or
transfers are determined based on the prevailing market price.

32
3. Information on the amount of net sales, income or losses, assets, liabilities and other items by reportable
segment
Fiscal year under review (April 1, 2018 - March 31, 2019)
(Million yen)
Reportable segments
Other* Total Daifuku Contec
Daifuku
North
America
Clean
Factomation
Daifuku
Plusmore Subtotal
Net sales
Sales to outside
customers 202,528 16,391 97,186 34,211 11,611 361,929 99,280 461,209
Intersegment
sales or
transfers
44,261 11,495 1,039 4,862 0 61,660 15,486 77,147
Total 246,790 27,887 98,226 39,073 11,612 423,590 114,766 538,357
Segment income 33,760 1,617 432 2,545 91 38,447 5,658 44,105
Segment assets 278,695 21,874 65,631 16,087 3,982 386,271 86,276 472,547
Segment liabilities 98,975 11,078 28,060 8,835 2,552 149,502 55,488 204,990
Other
Depreciation 2,747 315 733 83 15 3,895 703 4,598
Amortization of
goodwill 109 133 586 - 106 936 - 936
Interest income 25 3 277 118 12 436 155 592
Interest
expenses 185 34 17 - - 236 277 514
Extraordinary
income 8,061 343 164 6 - 8,576 109 8,686
(Gain on sales
of property,
plant and
equipment)
(-) (0) (15) (6) (-) (22) (4) (27)
(Gain on sales
of shares in
affiliates)
(8,030) (-) (-) (-) (-) (8,030) (-) (8,030)
Extraordinary loss 226 6 7,337 0 - 7,570 108 7,679
(Loss on sales
of property,
plant and
equipment)
(89) (-) (-) (-) (-) (89) (3) (92)
(Loss on
disposal of
property,
plant and
equipment)
(90) (6) (17) (0) (-) (114) (101) (215)
(Retirement
benefit
expenses)
(-) (-) (6,513) (-) (-) (6,513) (-) (6,513)
(Impairment
loss) (-) (-) (807) (-) (-) (807) (-) (807)
Income tax
expenses 13,101 537 -868 727 78 13,577 1,700 15,278
Investments in
equity-method
affiliates
- - - - - - 163 163
Increase in
property, plant
and equipment
and intangible
assets
3,944 407 1,985 101 1 6,440 1,482 7,922
Note: "Other" represents an operating segment comprising Japanese and overseas subsidiaries that are not in reportable
segments.

33
4. Differences between total amounts for reportable segments and the reported amount in the consolidated
financial statements and main details of the differences (matters relating to difference reconsideration) (Million yen)
Net sales Fiscal year ended March 31, 2019
Reportable segments total 423,590
Segment net sales classified in “Other” 114,766
Elimination of intersegment transactions (77,147)
Other adjustment for consolidation (1,723)
Net sales in consolidated financial statements 459,486
(Million yen)
Segment income Fiscal year ended March 31, 2019
Reportable segments total 38,447
Segment income classified in “Other” 5,658
Elimination of dividends from affiliates (2,545)
Other adjustment for consolidation (1,992)
Net income in consolidated financial statements 39,567
(Million yen)
Segment assets Fiscal year ended March 31, 2019
Reportable segments total 386,271
Segment assets classified in “Other” 86,276
Elimination of investment securities in affiliates in consolidation process
(43,559)
Elimination of intercompany receivables (26,136)
Other adjustment for consolidation 7,130
Total assets in consolidated financial statements 409,982
(Million yen)
Segment liabilities Fiscal year ended March 31, 2019
Reportable segments total 149,502
Segment liabilities classified in “Other” 55,488
Elimination of intercompany payables (26,136)
Other adjustments for consolidation 8,243
Total liabilities in consolidated financial statements
187,097

34
(Million yen)
Other Reportable segments
total Other Adjustment Consolidated total
Depreciation 3,895 703 - 4,598
Amortization of goodwill 936 - -9 927
Interest income 436 155 -44 547
Interest expenses 236 277 -44 469
Gain (loss) on investments accounted for under equity method
- - 172 172
Extraordinary income 8,576 109 -1,186 7,499
(Gain on sales of property, plant and equipment)
(22) (4) (-) (27)
(Gain on sales of shares in affiliates)
(8,030) (-) (-1,081) (6,948)
Extraordinary loss 7,570 108 333 8,012
(Loss on sales of property, plant and equipment)
(89) (3) (-) (92)
(Loss on disposal of property, plant and equipment)
(114) (101) (-) (215)
(Retirement benefit expenses)
(6,513) (-) (383) (6,897)
(Impairment loss) (807) (-) (-) (807)
Income taxes 13,577 1,700 -137 15,140
Investments in equity- method affiliates
- 163 108 271
Increase in property, plant and equipment and intangible assets
6,440 1,482 -2 7,920
Note: The main items in the adjustment above are as follows:
A gain on sales of shares in affiliates of minus 1,081 million yen is for an adjustment of the difference between the
book value of a gain on sales of shares in Knapp AG, which was an equity-method affiliate of the Company, in the
non-consolidated results and the book value of it in the consolidated results.

35
Related Information
Fiscal year under review (April 1, 2018 - March 31, 2019)
1. Information by product and service
(Million yen)
Logistics systems Electronics Other Total
Net sales to outside customers
424,857 16,392 18,236 459,486
2. Information by geographic area
Net sales
(Million yen)
Japan U. S. A. China South Korea Other Total
127,602 91,554 111,330 56,745 72,252 459,486
Note: Sales are classified into countries or regions based on the location of customers.
Per Share Information
(Yen)
Fiscal year ended March 31, 2018
Fiscal year ended March 31, 2019
Net assets per share 1,493.69 1,738.20
Net income per share 235.62 314.54
Notes:
1. Diluted net income per share is not recorded, as dilutive shares do not exist.
2. The shares of Daifuku remaining in the employee shareholding incentive plan through a trust (“E-Ship”) and the Board
Benefit Trust (BBT), which are recorded as treasury stock under equity capital, are included in the treasury stock to be
deducted in the calculation of the average number of shares during the year for the purpose of calculation of net income
per share, and are also included in the number of treasury stock to be deducted from the aggregate number of issued
shares as of the end of the year for the purpose of calculation of net assets per share. The average number of shares of
treasury stock deducted during the year for the purpose of calculation of net income per share is 52,000 shares for the
year ended March 31, 2019 and 78,000 shares for the year ended March 31, 2019 and 87,000 shares for the year ended
March 31, 2018. The number of shares of treasury stock at the end of the fiscal year for the purpose of calculating net
assets per share is 149,000 shares for the employee shareholding incentive plan through a trust (E-Ship) in the year
ended March 31, 2019, 75,000 shares for the BBT in the year ended March 31, 2019, and 87,000 shares for the BBT in
the year ended March 31, 2018.

36
3. The basis for the calculation of net income per share and diluted net income per share was as shown in the table below.
Fiscal year ended March 31, 2018
Fiscal year ended March 31, 2019
Net income per share
Net income attributable to shareholders of the parent company (million yen)
29,008 39,567
Amount not attributable to holders of common stock (million yen)
- -
Net income attributable to shareholders of the parent company (million yen)
29,008 39,567
Weighted average number of common stock issued and outstanding during the year (thousand shares)
123,115 125,794
4. The basis for the calculation of net assets per share is as shown in the table below.
Fiscal year ended March 31, 2018
Fiscal year ended March 31, 2019
Total net assets (million yen) 191,474 222,885
Amount deducted from total net assets (million yen) 3,595 4,195
(Of which, non-controlling interests) (million yen) (3,595) (4,195)
Total net assets attributable to common stock at fiscal year-end (million yen)
187,878 218,689
Number of common stock issued and outstanding at fiscal year-end for the purpose of calculation of net assets per share (thousand shares)
125,781 125,814
Major subsequent events
Not applicable

37
5. Other
Changes in Officers
(Effective June 21, 2019)
1. Changes in representatives
Not applicable
2. Candidates for new directors
Kaku Kato, Director (outside)
Current: Advisor of Mitsui Oil Exploration Co., Ltd.
Keiko Kaneko, Director (outside)
Current: Partner of Anderson Mori & Tomotsune
External Statutory Auditor of Fast Retailing Co., Ltd.
External Statutory Auditor of UNIQLO Co., Ltd.
External Statutory Auditor of The Asahi Shimbun Company
Mr. Kaku Kato and Ms. Keiko Kaneko are candidates for outside directors as stipulated in Article 2, Item 15
of the Companies Act.
3. Directors to retire
Noboru Kashiwagi, Director (outside)
4. Candidates for new audit & supervisory board members
Nobuo Wada, Audit & Supervisory Board Member (outside)
Current: Professor emeritus at Nagoya University
Mr. Nobuo Wada is a candidate for an outside auditor as stipulated in Article 2, Item 16 of the Companies
Act.
5. Audit & supervisory board members to retire
Isao Kitamoto, Audit & Supervisory Board Member (outside)


![© 2020 Daifuku Co., Ltd./Media/daifukucom/ir/... · Consolidated Balance Sheets (Billion yen) 4 Total assets: Increased by ¥0.9 billion [Factors] Increases: ¥10.8 billion in notes](https://img.pdfslide.net/doc/110x75/5fc63a432908640ded75f026/-2020-daifuku-co-ltd-mediadaifukucomir-consolidated-balance-sheets.jpg)