Embed Size (px)
Citation preview
Consolidated Financial Statements Annual report 2014
Contents
The Board of Directors' and CEO's Report 2
Independent Auditor's report 5
Consolidated Statement of Comprehensive Income 6
Consolidated Statement of Financial Position 7
Consolidated Statement of Changes in Equity 8
Consolidated Statement of Cash Flows 9
Notes to the Consolidated Financial Statements 10

.
Marel hf., Condensed Consolidated Interim Financial Statements 31 December 2014 2
.
The Board of Directors' and CEO's Report
Marel is a leading global provider of advanced equipment, systems and services for the poultry, fish, meat and further processing industries. Marel has offices and subsidiaries in over 30 countries and a global network of more than 100 agents and distributors.
The Consolidated Financial Statements for the year 2014 comprise the financial statements of Marel hf. (“the Company”) and its subsidiaries (together “the Group”). The Consolidated Financial Statements are prepared in accordance with International Financial Reporting Standards (IFRS) as adopted by the European Union (EU) and additional Icelandic disclosure requirements.
Operations in 2014
According to the Consolidated Statement of Comprehensive Income for 2014, the Group's operating revenue amounted to EUR 712.6 million (2013: EUR 661.5 million), an increase of 7.7%. The result from operations, before refocusing cost of EUR 19.6 million, was 48.8 million (2013: EUR 42.9 million), an increase of 13.7%. Profit for the year amounted to EUR 11.7 million (2013: EUR 20.6 million). Total comprehensive income amounted to EUR 13.6 million (2013: EUR 21.8 million). In 2014 the Company expensed EUR 53.4 million (2013: EUR 44.4 million) for research and development.
Marel bought back the right to supply service and sell spare parts for Marel equipment to customers in Denmark and Sweden from Scanvaegt Nordic A/S. The purchase price was EUR 5.7 million and the total amount was allocated to goodwill, as the payment primarily was related to access to specific business information.
According to the Consolidated Statement of Financial Position, the Company's assets amounted to EUR 851.4 million at the end of 2014 (2013: EUR 839.6 million). Equity amounted to EUR 427.5 million at the end of 2014 (at year-end 2013: EUR 419.3 million) or 50.2% of total assets (at year-end 2013: 49.9%). Net interest bearing debt decreased from EUR 217.1 million at the end of 2013 to EUR 174.3 million at the end of 2014.
In beginning of January 2015 Marel finalized an amendment and extension of its current long term financing which includes an addition of a Junior facility of EUR 50 million. The Senior facility is now extended with final maturity in November 2018 and the Junior facility in February 2019.The changes increase strategic and operational flexibility. The average number of full time employees was 4,115 in 2014 (2013: 4,117). Total salaries and wages were EUR 226.1 million (2013: 210.3 million). The number of own personnel in full time equivalents decreased from 3,980 at the end of December 2013 to 3,799 at the end of 2014. At the same time there is an increase of over 120 temporary employees to cope with increased volume in manufacturing.
According to the Company's 2014 Annual General Meeting decision, no dividend was paid out to shareholders for the operational year 2013. The dividend paid for the year before amounted to EUR 7.1 million or 0.97 euro cents per share.
The goodwill of the Group was tested for impairment at year-end by calculating its recoverable amount. The results of these impairment tests were that there was no impairment as the recoverable amount of the goodwill was well above book value.
At the end of 2014 the Company’s order book amounted to EUR 175 million (2013: EUR 132 million).
In the beginning of the year 2014 the refocusing plan of becoming simpler, smarter and faster was launched and has proceeded according to plan during the year. The plan’s objective is to serve customers’ needs more effectively and to reduce the annual cost base by EUR 20-25 million over the course of 2014 and 2015. The one-off cost in 2014 related to the activation of the plan amounted to EUR 19.6 million.
The management and the Board of Directors of the Group believe that they are taking all the necessary measures to support the sustainability and growth of the Group’s business in the current circumstances. Accordingly they continue to adopt the going concern basis in preparing the annual report and financial statements.
The management of the Group believes it is well placed to manage its business risks successfully based on the present economic outlook. Further information is disclosed in note 3 to the Consolidated Financial Statements 2014. Share Capital and Articles of Association
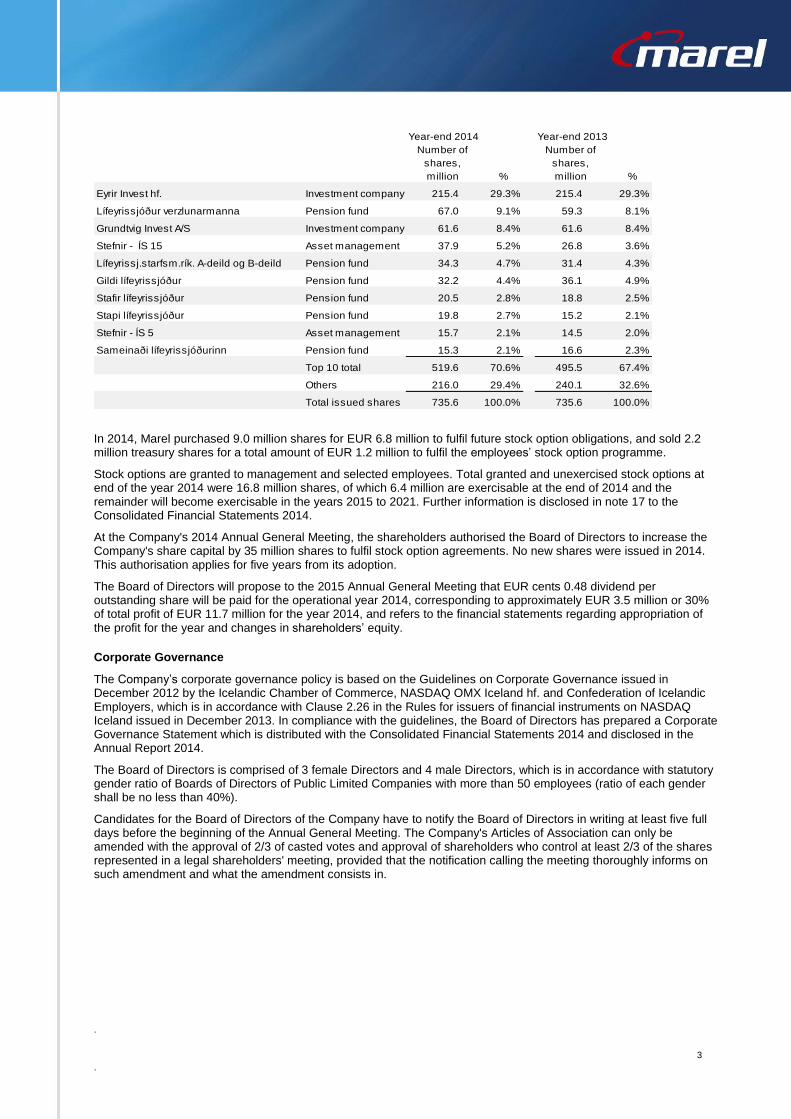
At year-end Marel’s shares totalled 735.6 million, all in one class, and unchanged from the end of 2013. Thereof Marel holds 7.0 million treasury shares. The number of shareholders at year-end 2014 was 1,864 compared to 1,846 at the end of 2013. The ten biggest shareholders were:
.
Marel hf., Condensed Consolidated Interim Financial Statements 31 December 2014 3
.
In 2014, Marel purchased 9.0 million shares for EUR 6.8 million to fulfil future stock option obligations, and sold 2.2 million treasury shares for a total amount of EUR 1.2 million to fulfil the employees’ stock option programme.
Stock options are granted to management and selected employees. Total granted and unexercised stock options at end of the year 2014 were 16.8 million shares, of which 6.4 million are exercisable at the end of 2014 and the remainder will become exercisable in the years 2015 to 2021. Further information is disclosed in note 17 to the Consolidated Financial Statements 2014.
At the Company's 2014 Annual General Meeting, the shareholders authorised the Board of Directors to increase the Company's share capital by 35 million shares to fulfil stock option agreements. No new shares were issued in 2014. This authorisation applies for five years from its adoption.
The Board of Directors will propose to the 2015 Annual General Meeting that EUR cents 0.48 dividend per outstanding share will be paid for the operational year 2014, corresponding to approximately EUR 3.5 million or 30% of total profit of EUR 11.7 million for the year 2014, and refers to the financial statements regarding appropriation of the profit for the year and changes in shareholders’ equity.
Corporate Governance
The Company’s corporate governance policy is based on the Guidelines on Corporate Governance issued in December 2012 by the Icelandic Chamber of Commerce, NASDAQ OMX Iceland hf. and Confederation of Icelandic Employers, which is in accordance with Clause 2.26 in the Rules for issuers of financial instruments on NASDAQ Iceland issued in December 2013. In compliance with the guidelines, the Board of Directors has prepared a Corporate Governance Statement which is distributed with the Consolidated Financial Statements 2014 and disclosed in the Annual Report 2014.
The Board of Directors is comprised of 3 female Directors and 4 male Directors, which is in accordance with statutory gender ratio of Boards of Directors of Public Limited Companies with more than 50 employees (ratio of each gender shall be no less than 40%).
Candidates for the Board of Directors of the Company have to notify the Board of Directors in writing at least five full days before the beginning of the Annual General Meeting. The Company's Articles of Association can only be amended with the approval of 2/3 of casted votes and approval of shareholders who control at least 2/3 of the shares represented in a legal shareholders' meeting, provided that the notification calling the meeting thoroughly informs on such amendment and what the amendment consists in.
Number of
shares,
million %
Number of
shares,
million %
Eyrir Invest hf. Investment company 215.4 29.3% 215.4 29.3%
Lífeyrissjóður verzlunarmanna Pension fund 67.0 9.1% 59.3 8.1%
Grundtvig Invest A/S Investment company 61.6 8.4% 61.6 8.4%
Stefnir - ÍS 15 Asset management 37.9 5.2% 26.8 3.6%
Lífeyrissj.starfsm.rík. A-deild og B-deild Pension fund 34.3 4.7% 31.4 4.3%
Gildi lífeyrissjóður Pension fund 32.2 4.4% 36.1 4.9%
Stafir lífeyrissjóður Pension fund 20.5 2.8% 18.8 2.5%
Stapi lífeyrissjóður Pension fund 19.8 2.7% 15.2 2.1%
Stefnir - ÍS 5 Asset management 15.7 2.1% 14.5 2.0%
Sameinaði lífeyrissjóðurinn Pension fund 15.3 2.1% 16.6 2.3%
Top 10 total 519.6 70.6% 495.5 67.4%
Others 216.0 29.4% 240.1 32.6%
Total issued shares 735.6 100.0% 735.6 100.0%
Year-end 2014 Year-end 2013
.
Marel hf., Condensed Consolidated Interim Financial Statements 31 December 2014 4
.
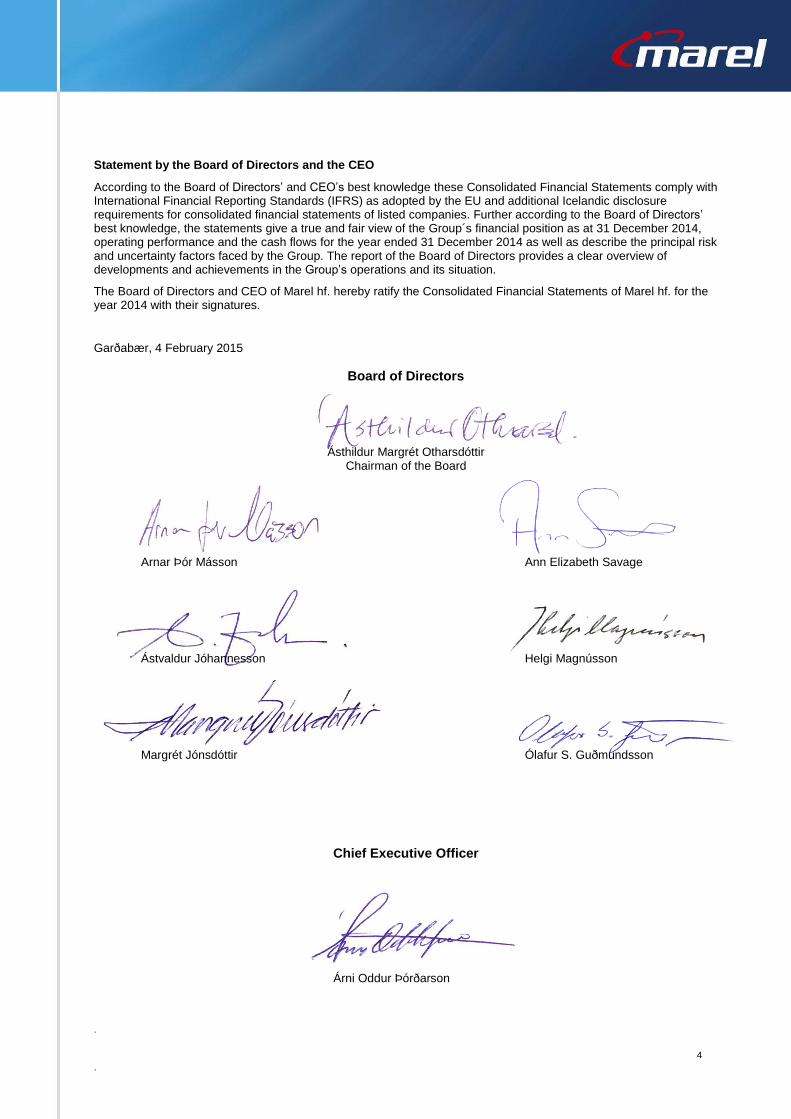
Statement by the Board of Directors and the CEO
According to the Board of Directors’ and CEO’s best knowledge these Consolidated Financial Statements comply with International Financial Reporting Standards (IFRS) as adopted by the EU and additional Icelandic disclosure requirements for consolidated financial statements of listed companies. Further according to the Board of Directors’ best knowledge, the statements give a true and fair view of the Group´s financial position as at 31 December 2014, operating performance and the cash flows for the year ended 31 December 2014 as well as describe the principal risk and uncertainty factors faced by the Group. The report of the Board of Directors provides a clear overview of developments and achievements in the Group’s operations and its situation.
The Board of Directors and CEO of Marel hf. hereby ratify the Consolidated Financial Statements of Marel hf. for the year 2014 with their signatures.
Garðabær, 4 February 2015
Board of Directors
Ásthildur Margrét Otharsdóttir Chairman of the Board
Arnar Þór Másson Ann Elizabeth Savage
Ástvaldur Jóhannesson Helgi Magnússon Margrét Jónsdóttir Ólafur S. Guðmundsson
Chief Executive Officer
Árni Oddur Þórðarson
.
Marel hf., Condensed Consolidated Interim Financial Statements 31 December 2014 5
.
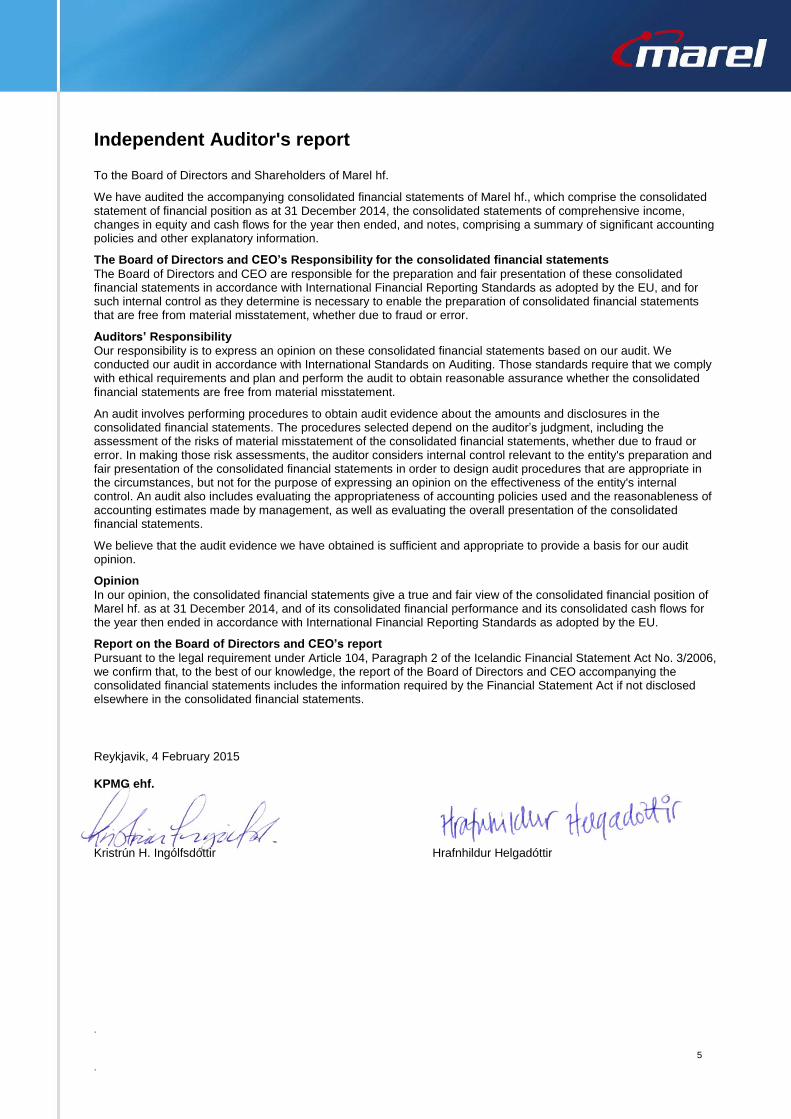
Independent Auditor's report To the Board of Directors and Shareholders of Marel hf.
We have audited the accompanying consolidated financial statements of Marel hf., which comprise the consolidated statement of financial position as at 31 December 2014, the consolidated statements of comprehensive income, changes in equity and cash flows for the year then ended, and notes, comprising a summary of significant accounting policies and other explanatory information.
The Board of Directors and CEO’s Responsibility for the consolidated financial statements
The Board of Directors and CEO are responsible for the preparation and fair presentation of these consolidated financial statements in accordance with International Financial Reporting Standards as adopted by the EU, and for such internal control as they determine is necessary to enable the preparation of consolidated financial statements that are free from material misstatement, whether due to fraud or error.
Auditors’ Responsibility
Our responsibility is to express an opinion on these consolidated financial statements based on our audit. We conducted our audit in accordance with International Standards on Auditing. Those standards require that we comply with ethical requirements and plan and perform the audit to obtain reasonable assurance whether the consolidated financial statements are free from material misstatement.
An audit involves performing procedures to obtain audit evidence about the amounts and disclosures in the consolidated financial statements. The procedures selected depend on the auditor’s judgment, including the assessment of the risks of material misstatement of the consolidated financial statements, whether due to fraud or error. In making those risk assessments, the auditor considers internal control relevant to the entity's preparation and fair presentation of the consolidated financial statements in order to design audit procedures that are appropriate in the circumstances, but not for the purpose of expressing an opinion on the effectiveness of the entity's internal control. An audit also includes evaluating the appropriateness of accounting policies used and the reasonableness of accounting estimates made by management, as well as evaluating the overall presentation of the consolidated financial statements.
We believe that the audit evidence we have obtained is sufficient and appropriate to provide a basis for our audit opinion.
Opinion
In our opinion, the consolidated financial statements give a true and fair view of the consolidated financial position of Marel hf. as at 31 December 2014, and of its consolidated financial performance and its consolidated cash flows for the year then ended in accordance with International Financial Reporting Standards as adopted by the EU.
Report on the Board of Directors and CEO’s report
Pursuant to the legal requirement under Article 104, Paragraph 2 of the Icelandic Financial Statement Act No. 3/2006, we confirm that, to the best of our knowledge, the report of the Board of Directors and CEO accompanying the consolidated financial statements includes the information required by the Financial Statement Act if not disclosed elsewhere in the consolidated financial statements.
Reykjavik, 4 February 2015 KPMG ehf.
Kristrún H. Ingólfsdóttir Hrafnhildur Helgadóttir
The notes on pages 10-49 are an integral part of the Consolidated Financial Statements.
Marel hf., Consolidated Financial Statements 31 December 2014 6
All amounts in EUR*1000 unless otherwise stated.
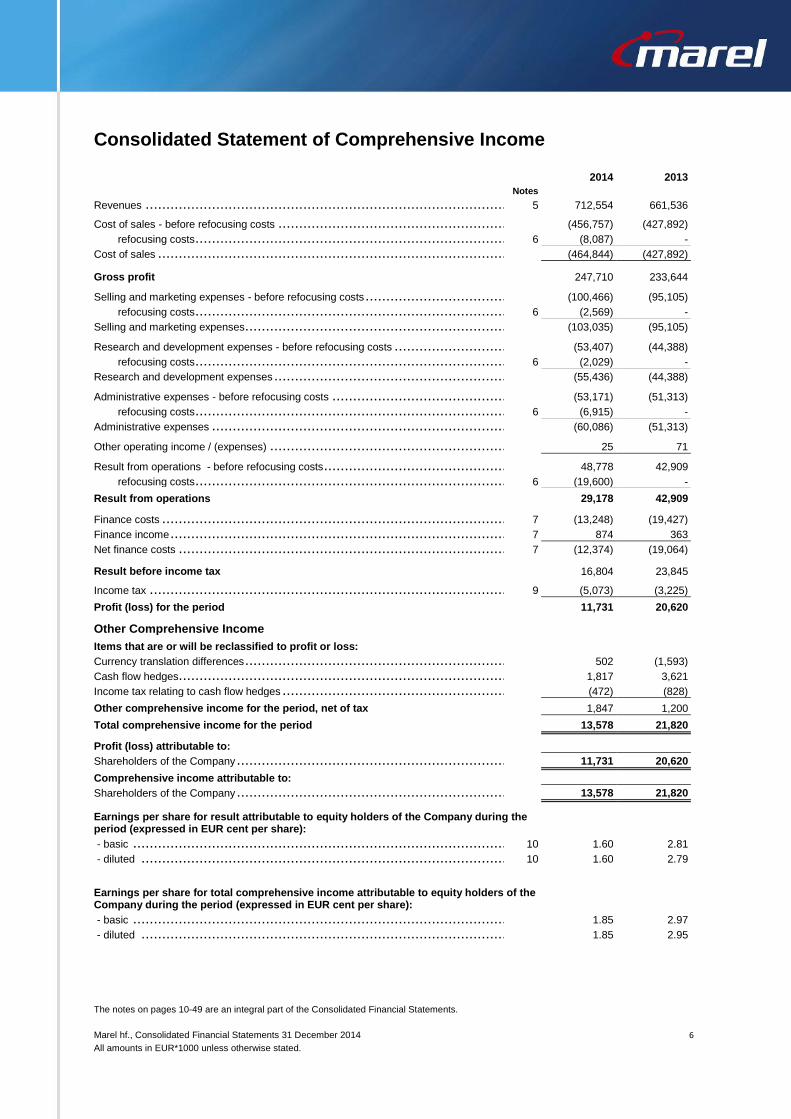
Consolidated Statement of Comprehensive Income
2014 2013
Notes
Revenues ................................................................................................................................................................................... 5 712,554 661,536 Cost of sales - before refocusing costs ................................................................................................................................................... (456,757) (427,892)
refocusing costs ............................................................................................................................................................................. 6 (8,087) -
Cost of sales ................................................................................................................................................................................ (464,844) (427,892)
............................................................................................................................................................................................... Gross profit 247,710 233,644 Selling and marketing expenses - before refocusing costs .............................................................................................................................. (100,466) (95,105)
refocusing costs ............................................................................................................................................................................. 6 (2,569) -
Selling and marketing expenses ........................................................................................................................................................... (103,035) (95,105) Research and development expenses - before refocusing costs ....................................................................................................................... (53,407) (44,388)
refocusing costs ............................................................................................................................................................................. 6 (2,029) -
Research and development expenses .................................................................................................................................................... (55,436) (44,388) Administrative expenses - before refocusing costs ...................................................................................................................................... (53,171) (51,313)
refocusing costs ............................................................................................................................................................................. 6 (6,915) -
Administrative expenses ................................................................................................................................................................... (60,086) (51,313) Other operating income / (expenses) ..................................................................................................................................................... 25 71
Result from operations - before refocusing costs ........................................................................................................................................ 48,778 42,909
refocusing costs ............................................................................................................................................................................. 6 (19,600) -
Result from operations 29,178 42,909 Finance costs ............................................................................................................................................................................... 7 (13,248) (19,427)
Finance income ............................................................................................................................................................................. 7 874 363
Net finance costs ........................................................................................................................................................................... 7 (12,374) (19,064) Result before income tax 16,804 23,845 Income tax .................................................................................................................................................................................. 9 (5,073) (3,225)
Profit (loss) for the period 11,731 20,620 Other Comprehensive Income
Items that are or will be reclassified to profit or loss:
Currency translation differences ........................................................................................................................................................... 502 (1,593)
Cash flow hedges........................................................................................................................................................................... 1,817 3,621
Income tax relating to cash flow hedges .................................................................................................................................................. (472) (828)
Other comprehensive income for the period, net of tax 1,847 1,200
Total comprehensive income for the period 13,578 21,820
Profit (loss) attributable to:
Shareholders of the Company ............................................................................................................................................................. 11,731 20,620
Comprehensive income attributable to:
Shareholders of the Company ............................................................................................................................................................. 13,578 21,820
Earnings per share for result attributable to equity holders of the Company during the period (expressed in EUR cent per share):
- basic ...................................................................................................................................................................................... 10 1.60 2.81
- diluted .................................................................................................................................................................................... 10 1.60 2.79
Earnings per share for total comprehensive income attributable to equity holders of the Company during the period (expressed in EUR cent per share):
- basic ...................................................................................................................................................................................... 1.85 2.97
- diluted .................................................................................................................................................................................... 1.85 2.95
The notes on pages 10-49 are an integral part of the Consolidated Financial Statements.
Marel hf., Consolidated Financial Statements 31 December 2014 7
All amounts in EUR*1000 unless otherwise stated.
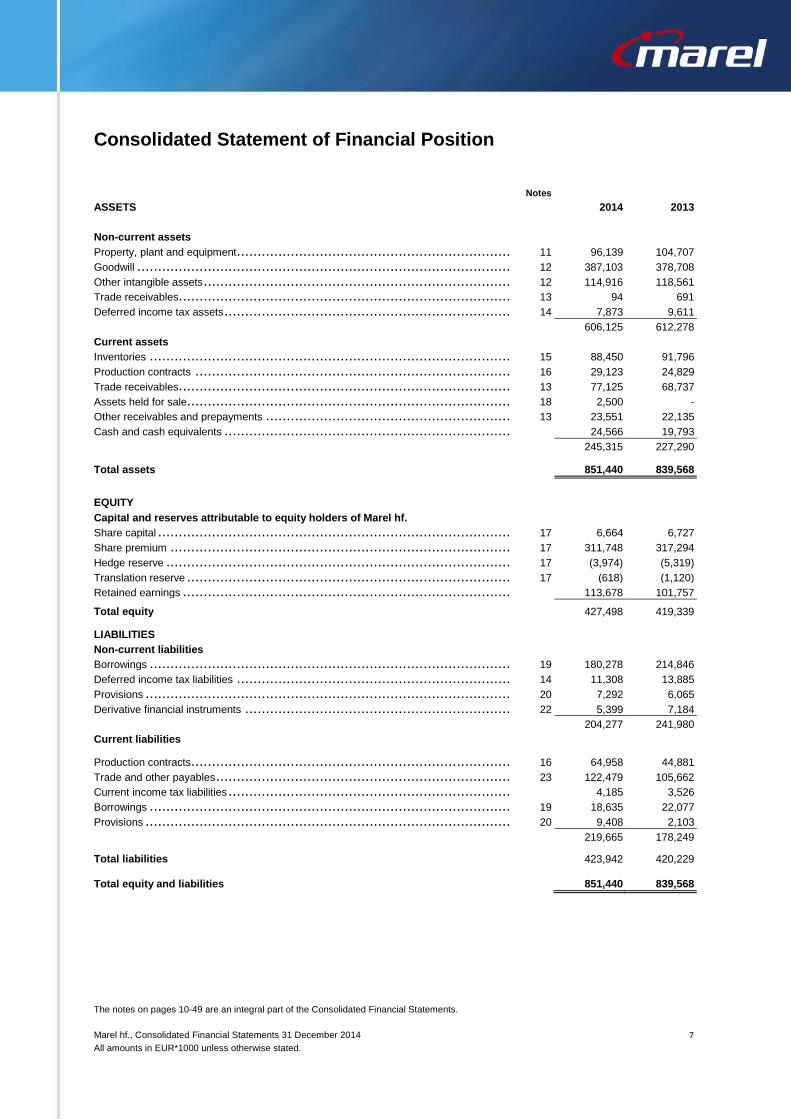
Consolidated Statement of Financial Position
Notes
ASSETS 2014 2013
Non-current assets Property, plant and equipment ............................................................................................................................................................. 11 96,139 104,707
Goodwill ..................................................................................................................................................................................... 12 387,103 378,708
Other intangible assets ..................................................................................................................................................................... 12 114,916 118,561
Trade receivables........................................................................................................................................................................... 13 94 691
Deferred income tax assets ................................................................................................................................................................ 14 7,873 9,611
606,125 612,278
Current assets Inventories .................................................................................................................................................................................. 15 88,450 91,796
Production contracts ....................................................................................................................................................................... 16 29,123 24,829
Trade receivables........................................................................................................................................................................... 13 77,125 68,737
Assets held for sale......................................................................................................................................................................... 18 2,500 -
Other receivables and prepayments ...................................................................................................................................................... 13 23,551 22,135
Cash and cash equivalents ................................................................................................................................................................ 24,566 19,793
245,315 227,290
Total assets 851,440 839,568
EQUITY Capital and reserves attributable to equity holders of Marel hf. Share capital ................................................................................................................................................................................ 17 6,664 6,727
Share premium ............................................................................................................................................................................. 17 311,748 317,294
Hedge reserve .............................................................................................................................................................................. 17 (3,974) (5,319)
Translation reserve ......................................................................................................................................................................... 17 (618) (1,120)
Retained earnings .......................................................................................................................................................................... 113,678 101,757
Total equity 427,498 419,339 LIABILITIES Non-current liabilities Borrowings .................................................................................................................................................................................. 19 180,278 214,846
Deferred income tax liabilities ............................................................................................................................................................. 14 11,308 13,885
Provisions ................................................................................................................................................................................... 20 7,292 6,065
Derivative financial instruments ........................................................................................................................................................... 22 5,399 7,184
204,277 241,980
Current liabilities Production contracts........................................................................................................................................................................ 16 64,958 44,881
Trade and other payables .................................................................................................................................................................. 23 122,479 105,662
Current income tax liabilities ............................................................................................................................................................... 4,185 3,526
Borrowings .................................................................................................................................................................................. 19 18,635 22,077
Provisions ................................................................................................................................................................................... 20 9,408 2,103
219,665 178,249 Total liabilities 423,942 420,229 Total equity and liabilities 851,440 839,568
The notes on pages 10-49 are an integral part of the Consolidated Financial Statements.
Marel hf., Consolidated Financial Statements 31 December 2014 8
All amounts in EUR*1000 unless otherwise stated.
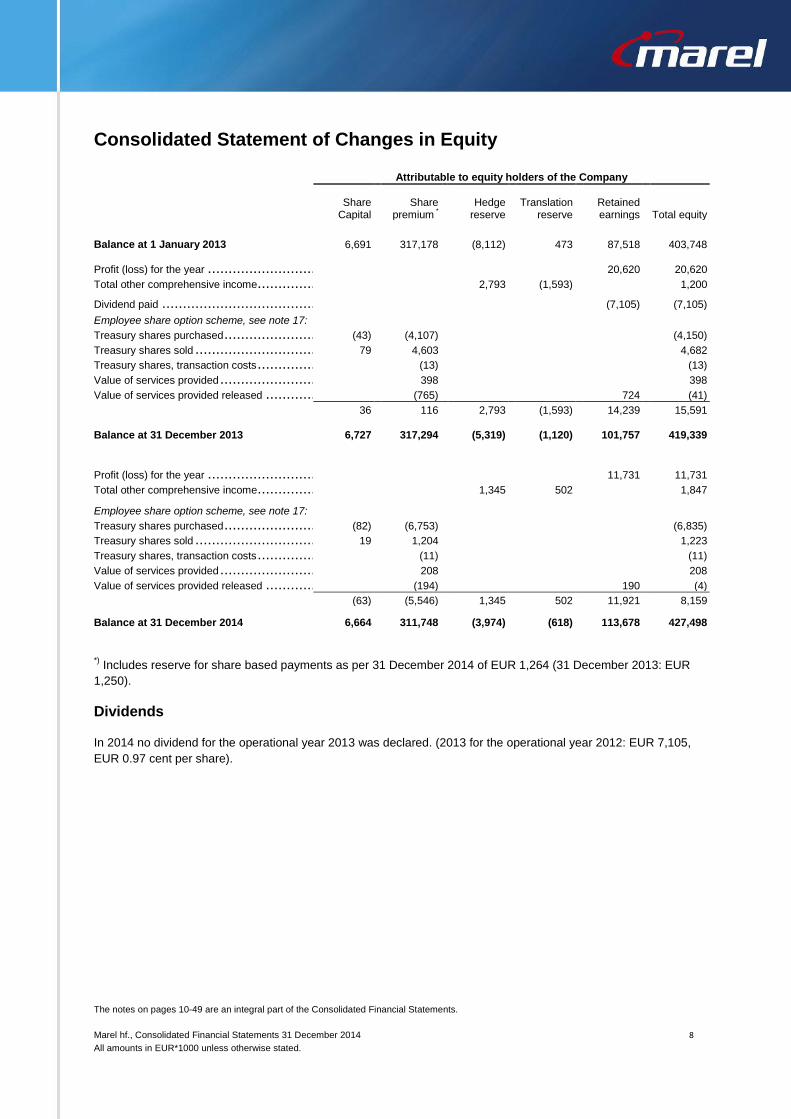
Consolidated Statement of Changes in Equity
Attributable to equity holders of the Company
Share
Capital Share
premium *
Hedge reserve
Translation reserve
Retained earnings Total equity
Balance at 1 January 2013 6,691 317,178 (8,112) 473 87,518 403,748 Profit (loss) for the year .................................................................................................................................................................... 20,620 20,620
Total other comprehensive income ........................................................................................................................................................ 2,793 (1,593) 1,200 Dividend paid ............................................................................................................................................................................... (7,105) (7,105) ............................................................................................................................................................................................... Employee share option scheme, see note 17:
Treasury shares purchased ................................................................................................................................................................ (43) (4,107) (4,150)
Treasury shares sold ....................................................................................................................................................................... 79 4,603 4,682
Treasury shares, transaction costs ........................................................................................................................................................ (13) (13)
Value of services provided ................................................................................................................................................................. 398 398
Value of services provided released ...................................................................................................................................................... (765) 724 (41)
36 116 2,793 (1,593) 14,239 15,591 Balance at 31 December 2013 6,727 317,294 (5,319) (1,120) 101,757 419,339 Profit (loss) for the year .................................................................................................................................................................... 11,731 11,731
Total other comprehensive income ........................................................................................................................................................ 1,345 502 1,847 Employee share option scheme, see note 17:
Treasury shares purchased ................................................................................................................................................................ (82) (6,753) (6,835)
Treasury shares sold ....................................................................................................................................................................... 19 1,204 1,223
Treasury shares, transaction costs ........................................................................................................................................................ (11) (11)
Value of services provided ................................................................................................................................................................. 208 208
Value of services provided released ...................................................................................................................................................... (194) 190 (4)
(63) (5,546) 1,345 502 11,921 8,159 Balance at 31 December 2014 6,664 311,748 (3,974) (618) 113,678 427,498
*) Includes reserve for share based payments as per 31 December 2014 of EUR 1,264 (31 December 2013: EUR
1,250).
Dividends
In 2014 no dividend for the operational year 2013 was declared. (2013 for the operational year 2012: EUR 7,105,
EUR 0.97 cent per share).
The notes on pages 10-49 are an integral part of the Consolidated Financial Statements.
Marel hf., Consolidated Financial Statements 31 December 2014 9
All amounts in EUR*1000 unless otherwise stated.
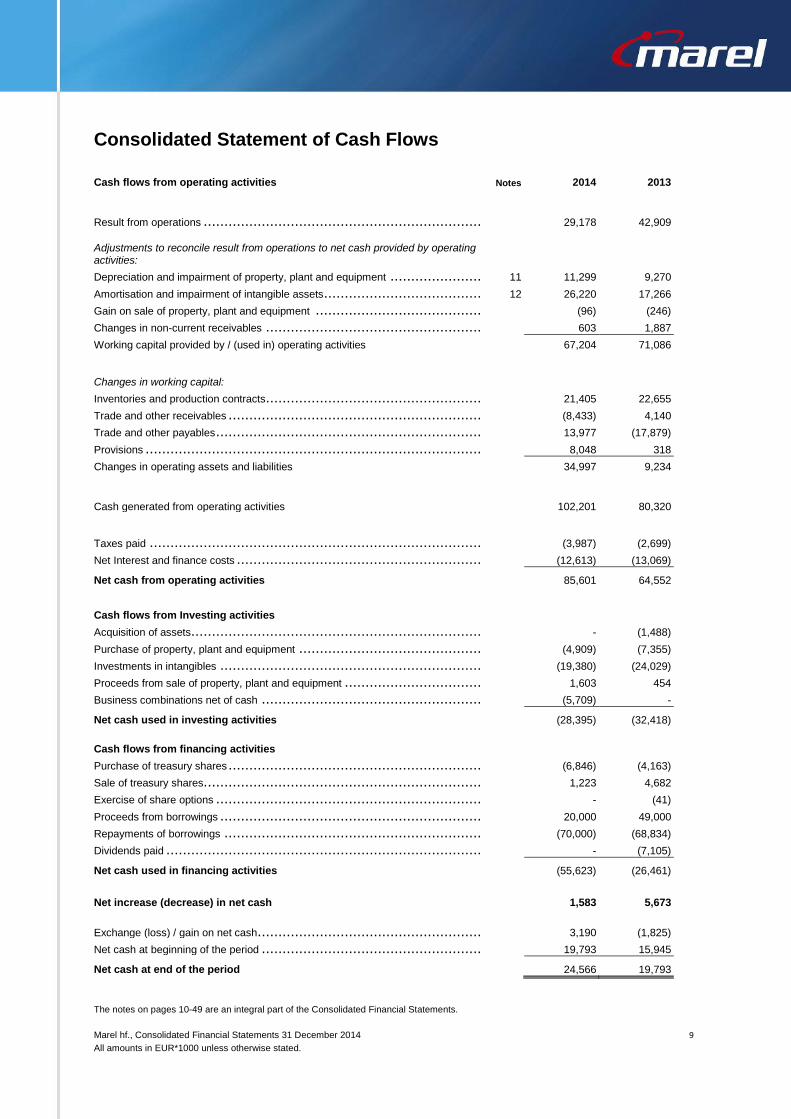
Consolidated Statement of Cash Flows
Cash flows from operating activities Notes 2014 2013
Result from operations ..................................................................................................................................................................... 29,178 42,909
Adjustments to reconcile result from operations to net cash provided by operating activities:
Depreciation and impairment of property, plant and equipment ........................................................................................................................ 11 11,299 9,270
Amortisation and impairment of intangible assets ........................................................................................................................................ 12 26,220 17,266
Gain on sale of property, plant and equipment .......................................................................................................................................... (96) (246)
Changes in non-current receivables ...................................................................................................................................................... 603 1,887
Working capital provided by / (used in) operating activities 67,204 71,086
Changes in working capital:
Inventories and production contracts ...................................................................................................................................................... 21,405 22,655
Trade and other receivables ............................................................................................................................................................... (8,433) 4,140
Trade and other payables .................................................................................................................................................................. 13,977 (17,879)
Provisions ................................................................................................................................................................................... 8,048 318
Changes in operating assets and liabilities 34,997 9,234
Cash generated from operating activities 102,201 80,320
Taxes paid .................................................................................................................................................................................. (3,987) (2,699)
Net Interest and finance costs ............................................................................................................................................................. (12,613) (13,069)
Net cash from operating activities 85,601 64,552
Cash flows from Investing activities
Acquisition of assets........................................................................................................................................................................ - (1,488)
Purchase of property, plant and equipment .............................................................................................................................................. (4,909) (7,355)
Investments in intangibles ................................................................................................................................................................. (19,380) (24,029)
Proceeds from sale of property, plant and equipment ................................................................................................................................... 1,603 454
Business combinations net of cash ....................................................................................................................................................... (5,709) -
Net cash used in investing activities (28,395) (32,418)
Cash flows from financing activities
Purchase of treasury shares ............................................................................................................................................................... (6,846) (4,163)
Sale of treasury shares..................................................................................................................................................................... 1,223 4,682
Exercise of share options .................................................................................................................................................................. - (41)
Proceeds from borrowings ................................................................................................................................................................. 20,000 49,000
Repayments of borrowings ................................................................................................................................................................ (70,000) (68,834)
Dividends paid .............................................................................................................................................................................. - (7,105)
Net cash used in financing activities (55,623) (26,461)
Net increase (decrease) in net cash 1,583 5,673
Exchange (loss) / gain on net cash ........................................................................................................................................................ 3,190 (1,825)
Net cash at beginning of the period ....................................................................................................................................................... 19,793 15,945
Net cash at end of the period 24,566 19,793
Marel hf., Consolidated Financial Statements 31 December 2014
All amounts in EUR*1000 unless otherwise stated. 10
Notes to the Consolidated Financial Statements
1. General information Marel hf. ("the Company") is a limited liability company incorporated and domiciled in Iceland. The address of its registered office is Austurhraun 9, Gardabaer. The Consolidated Financial Statements of the Company as at and for the year ended 31 December 2014 comprise the Company and its subsidiaries (together "the Group"). The Group is primarily involved in the manufacture, development, distribution and sales of solutions for use in all major sectors of the food processing industry. All amounts are in EUR*1000 unless otherwise stated. The Company has its listing on the Nasdaq Iceland exchange. The Financial Statements as presented in this report are subject to the adoption by the Annual General Meeting of Shareholders, to be held on 4 March 2015.
2. Summary of significant accounting policies The principal accounting policies applied in the preparation of these Consolidated Financial Statements are set out below. These policies have been consistently applied to the years presented, unless otherwise stated.
2.1 Basis of preparation
A. Statement of Compliance The Consolidated Financial Statements of the Group have been prepared in accordance with International Financial Reporting Standards (IFRSs) as adopted by the European Union (EU) and additional Icelandic disclosure requirements for consolidated financial information of listed companies in accordance with Icelandic Financial Statements Act No. 3/2006 and rules for issuers of financial instruments in Nasdaq in Iceland. These Consolidated Financial Statements have been approved for issue by the Board of Directors on 4 February 2015. B. Basis of Measurement These Consolidated Financial Statements have been prepared under the historical cost convention, as modified by the revaluation of available-for-sale financial assets and financial assets (including derivative instruments) at fair value through profit or loss or other comprehensive income. C. Functional and presentation currency Items included in the Financial Statements of each entity in the Group are measured using the currency that best reflects the economic substance of the underlying events and circumstances relevant to that entity (“the functional currency”). The Consolidated Financial Statements are presented in Euro (EUR), which is the Group's reporting currency. All financial information presented in Euro has been rounded to the nearest thousand. D. Use of estimates and judgements The preparation of the Consolidated Financial Statements in accordance with IFRS requires the use of certain critical accounting estimates. It also requires management to exercise judgement in the process of applying the Group's accounting policies. The areas involving a higher degree of judgement or complexity, or areas where assumptions and estimates are significant to the Consolidated Financial Statements are disclosed in note 4. Estimates and underlying assumptions are reviewed on an on-going basis. Revisions to accounting estimates are recognised in the period in which the estimates are revised and in any future period affected.
Marel hf., Consolidated Financial Statements 31 December 2014
All amounts in EUR*1000 unless otherwise stated. 11
E. Changes in accounting policies Standards, amendments and interpretations to existing standards that are not yet effective have not been early adopted by the Group. The following standards have been adopted as per 2013 and have a non-material effect on the Group’s Consolidated Financial Statements.
IFRS 10 Consolidated Financial Statements
IFRS 11 Joint Arrangements
IFRS 12 Disclosure of Interest in Other Entities
The following standards and amendments to existing standards have been published and have an effective date on or after 1 January 2014.
IFRS 9 Financial Instruments
IFRIC 21 Levies
IAS 36 Amendments Recoverable Amount Disclosures for Non-Financial Assets
IFRS 14 Regulatory Deferral Accounts
Accounting for Acquisitions of Interests in Joint Operations
Clarification of Acceptable Methods of Depreciation and Amortisation
These standards have been adopted as per 1 January 2014 and have a non-material effect on the Group’s Consolidated Financial Statements of 2014.
The following new standard is effective for annual periods beginning after 1 January 2016; however the Group has not early adopted the following new standard in preparing these consolidated financial statements.
IFRS 15 Revenue from Contracts with Customers The impact of this new standard will be investigated in 2015.
2.2 Consolidation
Subsidiaries Subsidiaries are entities controlled by the Group. The Group controls an entity when it is exposed to, or has rights to, variable returns from its involvement with the entity and has the ability to affect those returns through its power over the entity. The financial statements of subsidiaries are included in the consolidated financial statements from the date on which control commences until the date on which control ceases. When the Group loses control over a subsidiary, it derecognizes the assets and liabilities of the subsidiary, and any related Non-Controlling Interest (NCI) and other components of equity. Any resulting gain or loss is recognised in profit or loss. Any interest retained in the former subsidiary is measured at fair value when control is lost. Business combinations The Group accounts for business combinations using the acquisition method when control is transferred to the Group. The consideration transferred in the acquisition is generally measured at fair value, as are the identifiable net assets acquired. Any goodwill that arises is tested annually for impairment. Any gain on a purchase is recognized in profit or loss immediately. Transaction costs are expensed as incurred, except if related to the issue of debt or equity securities. The consideration transferred does not include amounts related to the settlement of pre-existing relationships. Such amounts are generally recognized in profit or loss. Any contingent consideration payable is measured at fair value at the acquisition date. If the contingent consideration is classified as equity, then it is not remeasured and settlement is accounted for within equity. Otherwise, subsequent changes in the fair value of the contingent consideration are recognized in profit or loss.
Marel hf., Consolidated Financial Statements 31 December 2014
All amounts in EUR*1000 unless otherwise stated. 12
If share-based payment awards (replacement awards) are required to be exchanged for awards held by the acquiree’s employees (acquiree’s award), then all or a portion of the amount of the acquirer’s replacement awards is included in measuring the consideration transferred in the business combination. This determination is based on the market-based measure of the replacement awards compared with the market-based measure of the acquiree’s awards and the extent to which the replacement awards relate to pre-combination service. Transactions eliminated on consolidation Intercompany transactions, balances and unrealised gains on transactions between Group companies are eliminated. Unrealised losses are also eliminated unless the transaction provides evidence of an impairment of the asset transferred. Accounting policies of subsidiaries have been changed where necessary to ensure consistency with the policies adopted by the Group. Transactions and non-controlling interests Transactions that result in changes in ownership interests while retaining control are accounted for as transactions with equity holders in their capacity as equity holders. As a result, no gain or loss on such changes is recognised in profit or loss but rather in equity. Also, no change in the carrying amounts of assets (including goodwill) or liabilities is recognised as a result of such transactions. This approach is consistent with NCI being a component of equity. Associates Associates are all entities over which the Group has significant influence but not control, generally accompanying a shareholding of between 20% and 50% of the voting rights. Investments in associates are accounted for by the equity method of accounting and are initially recognised at cost. The Group’s investment in associates includes goodwill identified on acquisition, net of any accumulated impairment loss. See note 2.7 for the impairment of non-financial assets including goodwill. The Group's share of its associates' post-acquisition profits or losses is recognised in the Statement of Comprehensive Income, and its share of post-acquisition movements in reserves is recognised in reserves. The cumulative post-acquisition movements are adjusted against the carrying amount of the investment. When the Group's share of losses in an associate equals or exceeds its interest in the associate, including any other unsecured receivables, the Group does not recognise further losses, unless it has incurred obligations or made payments on behalf of the associate. Unrealised gains on transactions between the Group and its associates are eliminated to the extent of the Group's interest in the associates. Unrealised losses are also eliminated unless the transaction provides evidence of an impairment of the asset transferred. Accounting policies of associates have been changed where necessary to ensure consistency with the policies adopted by the Group. Dilution gains and losses arising in investments in associates are recognised in the Statement of Comprehensive Income.
2.3 Segment information
An operating segment is a component of the Group that engages in business activities from which it may earn revenues and incur expenses, including revenues and expenses that relate to transactions with any of the Group's other components. All operating segments' operating results are reviewed regularly by the Group's CEO and strategic decisions are based on these operating segments. The operating structure in the Group is developing further towards the operating segments.
2.4 Foreign currency translation
Transactions and balances Foreign currency transactions are translated into the respective functional currencies of Group entities, and from there into the Group's reporting currency using the exchange rates prevailing at the dates of the transactions or valuation where items are revaluated. Foreign exchange gains and losses resulting from the settlement of such transactions and from the translation at year-end exchange rates of monetary assets and liabilities denominated in foreign currencies are recognised in the Statement of Comprehensive Income, except when deferred in equity as permanent loan, as qualifying cash flow hedges and qualifying net investment hedges as explained in note 2.9. Foreign exchange gains and losses that relate to borrowings and cash and cash equivalents as well as all other foreign exchange gains and losses are recognised immediately in the Statement of Comprehensive Income within 'Finance income' or 'Finance costs'.
Marel hf., Consolidated Financial Statements 31 December 2014
All amounts in EUR*1000 unless otherwise stated. 13
Group companies The results and financial position of all the Group entities (none of which has the currency of a hyperinflationary economy) that have a functional currency different from the presentation currency are translated into the presentation currency as follows: (i) assets and liabilities presented are translated at the closing rate at the date of that Consolidated Statement of Financial Position; (ii) income and expenses for each Statement of Comprehensive Income are translated at average exchange rates, unless this average is not a reasonable approximation of the cumulative effect of the rates prevailing on the transaction dates, in which case income and expenses are translated at the dates of the transactions; and (iii) all resulting exchange differences are recognised as a separate component of equity (Translation reserve). On consolidation, exchange differences arising from the translation of the net investment in foreign operations, and of borrowings and other currency instruments designated as hedges of such investments, are recognised in Translation reserve. When a foreign operation is partially disposed of or sold, exchange differences that were recorded in other comprehensive income are recognised in the profit or loss for the period as part of the gain or loss on sale. Goodwill and fair value adjustments arising on the acquisition of a foreign entity are treated as assets and liabilities of the foreign entity and translated at the closing rate. In case of a non-wholly-owned subsidiary, the relevant proportionate share of the translation difference is allocated to the non-controlling interests. When a foreign operation is disposed of such that control, significant influence or joint control is lost, the cumulative amount in the translation reserve related to that foreign operation is reclassified to profit or loss as part of the gain or loss on disposal. When the Group disposes of only part of its interest in a subsidiary that includes a foreign operation while retaining control, the relevant proportion of the cumulative amount is reattributed to non-controlling interests. When the Group disposes of only part of its investment in an associate or joint venture that includes a foreign operation while retaining significant influence or joint control, the relevant proportion of the cumulative amount is reclassified to profit or loss.
2.5 Property, plant and equipment
Land and buildings comprise mainly factories and offices. All property, plant and equipment (PPE) is recognised at cost less subsequent depreciation and impairment, except for land, which is shown at cost less impairment. Cost includes expenditure that is directly attributable to the acquisition of the items. Subsequent costs are included in the asset’s carrying amount or recognised as a separate asset, as appropriate, only when it is probable that future economic benefits associated with the item will flow to the Group and the cost of the item can be measured reliably. The carrying amount of the replaced part is derecognised. All other repairs and maintenance are charged to the profit or loss for the period during the financial period in which they are incurred. Land is not depreciated. Depreciation on assets is calculated using the straight-line method to allocate the cost of each asset to its residual value over its estimated useful life, as follows:
Land and buildings...................................................................................................... 30-50 years
Plant and machinery................................................................................................... 4-15 years
Vehicles & equipment................................................................................................. 3-7 years
Major renovations are depreciated over the remaining useful life of the related asset or to the date of the next major renovation, whichever is sooner. The assets’ residual values and useful lives are reviewed, and adjusted if appropriate, at each reporting date. An asset’s carrying amount is written down immediately to its recoverable amount if the asset’s carrying amount is greater than its estimated recoverable amount (see note 2.7). Gains and losses on disposals are determined by comparing proceeds with carrying amount. These are recognised within other operating income (expenses) in the Statement of Comprehensive Income. Borrowing cost is expensed as incurred except when directly attributable to acquisition or construction of an asset that necessarily takes a substantial period of time to get ready for its intended use. Such borrowing cost is capitalised as part of the cost of the asset when it is probable that it will result in future economic benefits to the entity and the cost can be measured reliably.
Marel hf., Consolidated Financial Statements 31 December 2014
All amounts in EUR*1000 unless otherwise stated. 14
2.6 Intangible assets
Goodwill Goodwill represents the excess of the cost of an acquisition over the fair value of the Group’s share of the net identifiable assets of the acquired subsidiary at the date of acquisition. Gains and losses on the disposal of an entity include the carrying amount of goodwill relating to the entity sold. Goodwill on some acquisitions that occurred prior to 1 January 2004 has been charged in full to retained earnings in shareholders’ equity, such goodwill has not been retroactively capitalised. Goodwill is allocated to cash-generating units for the purpose of impairment testing. The allocation is made to those cash-generating units or groups of cash-generating units that are expected to benefit from the business combination in which the goodwill arose. Research and development Research expenditure is recognised as an expense as incurred. Costs incurred on development projects relating to the design and testing of new or improved products are recognised as intangible assets when it is probable that the project will generate future economic benefits, considering its commercial and technological feasibility, and costs can be measured reliably. Other development expenditures are recognised as an expense as incurred. Development costs previously recognised as an expense are not recognised as an asset in a subsequent period. Development costs that have a finite useful life and that have been capitalised are amortised from the commencement of the commercial production of the product on a straight-line basis over the period of its expected benefit, not exceeding five years. Patents & Trade name Expenditure to acquire patents, trademarks and licenses (recognised as cost) is capitalised and amortised using the straight-line method over their useful lives, but not exceeding 8 years, or 11 years in case of trademarks, with the exception of Stork and Townsend. Other intangible assets Costs associated with maintaining computer software programmes are recognised as an expense as incurred. Development costs that are directly attributable to the design and testing of identifiable and unique software products controlled by the group are recognised as intangible assets when the following criteria are met: – it is technically feasible to complete the software product so that it will be available for use; – management intends to complete the software product and use or sell it; – there is an ability to use or sell the software product; – it can be demonstrated how the software product will generate probable future economic benefits; – adequate technical, financial and other resources to complete the development and to use or sell the software product are available; and – the expenditure attributable to the software product during its development can be measured reliably. Directly attributable costs capitalised as part of the software product include the software development employee costs and an appropriate portion of relevant overheads. Other development expenditures that do not meet these criteria are recognised as an expense as incurred. Development costs previously recognised as an expense are not recognised as an asset in a subsequent period. Computer software development costs recognised as assets are amortised over their estimated useful lives, which can vary from 3 to 5 years. Intangible assets with an indefinite use or that are not depreciated are tested annually for impairment.
2.7 Impairment of non-financial assets
Assets that have an indefinite useful life are not subject to amortisation and are tested annually for impairment. Assets that are subject to amortisation are reviewed for impairment whenever events or changes in circumstances indicate that the carrying amount may not be recoverable. Non-financial assets other than goodwill that suffer impairment are reviewed for possible reversal of the impairment at each reporting date. Assets held for sale which are valued at fair value, are reviewed at each reporting date. At each reporting date, the Group reviews the carrying amounts of its non-financial assets (other than inventories and deferred tax assets) to determine whether there is any indication of impairment. If any such indication exists, then the asset’s recoverable amount is estimated. Goodwill is tested annually for impairment. For impairment testing, assets are grouped together into the smallest group of assets that generates cash inflows from continuing use that are largely independent of the cash inflows of other assets or Cash Generating Units (CGU). Goodwill arising from a business combination is allocated to CGUs or groups of CGUs that are expected to benefit from the synergies of the combination.
Marel hf., Consolidated Financial Statements 31 December 2014
All amounts in EUR*1000 unless otherwise stated. 15
The recoverable amount of an asset or CGU is the greater of its value in use and its fair value less costs to sell. Value in use is based on the estimated future cash flows, discounted to their present value using a pre-tax discount rate that reflects current market assessments of the time value of money and the risks specific to the asset or CGU. An impairment loss is recognised if the carrying amount of an asset or CGU exceeds its recoverable amount. Impairment losses are recognised in profit or loss. They are allocated first to reduce the carrying amount of any goodwill allocated to the CGU, and then to reduce the carrying amounts of the other assets in the CGU on a pro rata basis. An impairment loss in respect of goodwill is not reversed. For other assets, an impairment loss is reversed only to the extent that the asset’s carrying amount does not exceed the carrying amount that would have been determined, net of depreciation or amortisation, if no impairment loss had been recognised.
2.8 Financial assets
Financial assets other than derivatives The Group classifies its investments in the following categories: financial assets at fair value through profit or loss, held-to-maturity financial assets, loans and receivables and available-for-sale financial assets. The classification depends on the purpose for which the investments were acquired. Management determines the classification of its investments at initial recognition. Financial assets at fair value through profit or loss A financial asset is classified at fair value through profit or loss if it is classified as held for trading or is designated as such upon initial recognition. Financial assets are designated at fair value through profit or loss if the Group manages such investments and makes purchase and sale decisions based on their fair value in accordance with the Group’s documented risk management or investment strategy. Upon initial recognition attributable transaction costs are recognised in profit or loss as incurred. Financial assets at fair value through profit or loss are measured at fair value, and changes therein are recognised in profit or loss. If the Group has the positive intent and ability to hold debt securities to maturity, then such financial assets are classified as held-to-maturity. Held-to-maturity financial assets If the Group has the positive intent and ability to hold debt securities to maturity, then such financial assets are classified as held to maturity. Held-to-maturity financial assets are recognised initially at fair value plus any directly attributable transaction costs. Subsequent to initial recognition held-to-maturity financial assets are measured at amortised cost using the effective interest method, less any impairment losses. Any sale or reclassification of a more than insignificant amount of held-to-maturity investments not close to their maturity would result in the reclassification of all held-to-maturity investments as available for sale, and prevent the Group from classifying investment securities as held to maturity for the current and the following two financial years. Loans and receivables Receivables are non-derivative financial assets with fixed or determinable payments that are not quoted in an active market. They are included in current assets, except for maturities greater than 12 months after the reporting date. These are classified as non-current assets. The Group’s receivables comprise ‘trade receivables’ and ‘cash and cash equivalents’ in the Consolidated Statement of Financial Position (notes 2.12 and 2.13) and are recognised initially at fair value and subsequently measured at amortised cost using the effective interest method. Available-for-sale financial assets Available-for-sale financial assets are non-derivatives that are either designated in this category or not classified in any of the other categories. They are recognised initially at fair value and included in non-current assets unless management intends to dispose of the investment within 12 months of the reporting date. Regular purchases and sales of financial assets are recognised on trade-date, the date on which the Group commits to purchase or sell the asset. Investments are initially recognised at fair value plus transaction costs for all financial assets not carried at fair value through profit or loss. Financial assets are derecognised when the rights to receive cash flows from the investments have expired or have been transferred and the Group has transferred substantially all risks and rewards of ownership. Available-for-sale financial assets are subsequently carried at fair value. Fair value measurement The fair values of quoted investments are based on current bid prices. If the market for a financial asset is not active (and for unlisted securities), the Group establishes fair value by using valuation techniques. These include the use of recent arm’s length transactions, reference to other instruments that are substantially the same and discounted cash flow analysis refined to reflect the issuer’s specific circumstances. The fair value of investments traded in active markets (such as trading and available-for-sale securities) is based on quoted market prices at the reporting date.
Marel hf., Consolidated Financial Statements 31 December 2014
All amounts in EUR*1000 unless otherwise stated. 16
The fair value of investments that are not traded in an active market is determined by using valuation techniques. The Group uses a variety of methods and makes assumptions that are based on market conditions existing at each reporting date.
Impairment of financial assets The Group assesses at each reporting date whether there is objective evidence that a financial asset or a group of financial assets is impaired. In the case of equity securities classified as available for sale, a significant or prolonged decline in the fair value of the security below its cost is considered as an indicator that the securities are impaired. If any such evidence exists for available-for-sale financial assets, the cumulative loss – measured as the difference between the acquisition cost and the current fair value, less any impairment loss on that financial asset previously recognised in profit or loss – is removed from Equity and recognised in the Consolidated Statement of Comprehensive Income for the period. Impairment losses recognised in the Consolidated Statement of Comprehensive Income for the period on equity instruments are not reversed through the Consolidated Statement of Comprehensive Income for the period. Impairment testing of receivables is described in note 2.12.
The carrying value less impairment provision of trade receivables are assumed to approximate their fair values due to the short-term nature of trade receivables. The fair value of financial liabilities for disclosure purposes is estimated by discounting the future contractual cash flows at the current market interest rate that is available to the Group for similar financial instruments. Non-derivative financial liabilities Non-derivative financial liabilities are initially recognised at fair value less any directly attributable transaction costs. Subsequent to initial recognition, these liabilities are measured at amortised cost using the effective interest method.
2.9 Derivative financial instruments and hedging activities
Derivatives are initially recognised at fair value on the date a derivative contract is entered into and are subsequently revaluated at their fair value. The method of recognising the resulting gain or loss depends on whether the derivative is designated as a hedging instrument, and if so, the nature of the item being hedged. The Group designates certain derivatives as either: (a) Hedges of a particular risk associated with a recognised asset or liability or a highly probable forecast transaction (cash flow hedge); or (b) Hedges of a net investment in a foreign operation (net investment hedge). The Group documents at the inception of the transaction the relationship between hedging instruments and hedged items, as well as its risk management objectives and strategy for undertaking various hedging transactions. The Group also documents its assessment, both at hedge inception and on an on-going basis, of whether the derivatives that are used in hedging transactions are highly effective in offsetting changes in fair values or cash flows of hedged items. Movements on the hedge reserve in equity are shown in the Statement of Changes in Equity. The full fair value of a hedging derivative is classified as a non-current asset or liability when the remaining hedged item is more than 12 months and as a current asset or liability when the remaining maturity of the hedged item is less than 12 months. Trading derivatives are classified as current asset or liabilities. (a) Cash flow hedge The effective portion of changes in the fair value of derivatives that are designated and qualify as cash flow hedges is recognised in other comprehensive income and presented in the hedge reserve in equity. The profit or loss relating to the ineffective portion is recognised immediately in the Statement of Comprehensive Income within Finance income or Finance costs. Amounts accumulated in equity are recycled in the Consolidated Statement of Comprehensive Income for the period in the periods when the hedged item affects profit or loss. However, when the forecast transaction that is hedged results in the recognition of a non-financial asset (for example, inventory or non-current assets) the gains and losses previously deferred in equity are transferred from equity and included in the initial measurement of the cost of the asset. The deferred amounts are ultimately recognised in cost of goods sold in case of inventory or in depreciation in case of non-current assets.
Marel hf., Consolidated Financial Statements 31 December 2014
All amounts in EUR*1000 unless otherwise stated. 17
When a hedging instrument expires or is sold, or when a hedge no longer meets the criteria for hedge accounting, any cumulative gain or loss existing in equity at that time remains in equity and is recognised when the forecast transaction is ultimately recognised in the Statement of Comprehensive Income. When a forecast transaction is no longer expected to occur, the cumulative gain or loss that was reported in equity is immediately transferred to the Statement of Comprehensive Income within Finance income or Finance costs. (b) Net investment hedge Hedges of net investments in foreign operations are accounted for similarly to cash flow hedges. Any gain or loss on the hedging instrument relating to the effective portion of the hedge is recognised in other comprehensive income and presented in the hedge reserve in equity. The gain or loss relating to the ineffective portion is recognised immediately in the Statement of Comprehensive Income within Finance income or Finance costs. Gains and losses accumulated in equity are included in profit or loss when the foreign operation is partially disposed of or sold. (c) Derivatives at fair value through profit or loss are accounted for at fair value through profit or loss. Certain derivative instruments do not qualify for hedge accounting. Changes in the fair value of any of these derivative instruments are recognised immediately in the Consolidated Statement of Comprehensive Income within Finance income or Finance costs.
2.10 Inventories
Inventories are stated at the lower of historical cost or net realisable value. Cost is determined using the weighted average method and an adjustment to net realisable value is considered for items, which have not moved during the last 12 months. The cost of finished goods and work in process comprise raw materials, direct labour, other direct costs and related production overheads based on normal operating capacity but exclude borrowing costs. Net realisable value is the estimated selling price in the ordinary course of business, less the costs of completion and any applicable variable selling expenses. Costs of inventories include the transfer from equity of gains or losses on qualifying cash flow hedges relating to production cost.
2.11 Production contracts
Production costs are recognised when incurred. When the outcome of a production contract can be estimated reliably and it is probable that the contract will be profitable, contract revenue is recognised over the period of the contract. When it is probable that total contract costs will exceed total contract revenue, the expected loss is recognised as an expense immediately. When the outcome of a production contract cannot be estimated reliably, contract revenue is recognised only to the extent of production costs incurred that are likely to be recoverable. The Group uses the ‘percentage of completion method’ to determine the appropriate amount to recognise in a given period. The stage of completion is measured by reference to the contract costs incurred up to the reporting date as a percentage of total estimated costs for each contract. Costs incurred in the year in connection with future activity on a contract are excluded from contract costs in determining the stage of completion. They are presented as inventories, prepayments or other assets, depending on their nature. The Group presents as an asset the gross amount due from customers for contract work for all contracts in progress for which costs incurred plus recognised profits or less recognised losses exceeds progress billings. The Group presents as a liability the gross amount due to customers for contract work for all contracts in progress for which progress billings exceed costs incurred plus recognised profits or less recognised losses.
2.12 Receivables and prepayments
Trade receivables are recognised initially at fair value and subsequently measured at amortised cost using the effective interest method, less provision for impairment. All trade receivables are monitored closely and aging analysis is performed on a regular basis. Annually counterparty confirmation is performed. A provision for impairment of trade receivables is established when there is objective evidence that the Group will not be able to collect all amounts due according to the original terms of receivables. Significant financial difficulties of the debtor, probability that the debtor will enter bankruptcy or financial reorganisation, and default or delinquency in payments are considered indicators that the trade receivable is impaired. The amount of the provision is the difference between the asset’s carrying amount and the present value of estimated future cash flows, discounted at the effective interest rate.
Marel hf., Consolidated Financial Statements 31 December 2014
All amounts in EUR*1000 unless otherwise stated. 18
The carrying amount of the assets is reduced through the use of an allowance account, and the amount of the loss is recognised in profit or loss. When a trade receivable is uncollectable, it is written off against the allowance account for trade receivables. Subsequent recoveries of amounts previously written off are credited in profit or loss.
2.13 Cash and cash equivalents
Cash and cash equivalents can include cash on hand, deposits held at call with banks and other short-term highly liquid investments with original maturities of three months or less. Bank overdrafts are shown within borrowings in current liabilities on the Consolidated Statement of Financial Position.
2.14 Share capital
Ordinary shares are classified as equity. Incremental costs directly attributable to the issue of new shares or options are shown in shareholders' equity as a deduction, net of tax, from the proceeds. Where any group company purchases the Company’s equity share capital (treasury shares), the consideration paid, including any directly attributable incremental costs (net of income taxes), is deducted from equity attributable to the Company's shareholders until the shares are cancelled or reissued. Where such shares are subsequently sold or reissued, any consideration received, net of any directly attributable incremental transaction costs and the related income tax effects, is included in equity attributable to the Company's shareholders. Private placements need to be approved by the shareholders in the Company‘s Annual General Meeting. Based on such resolution, where the shareholders waive their pre-emptive rights, the Board of Directors can approve for a private placement.
2.15 Trade payables
Trade payables are recognised initially at fair value and subsequently measured at amortised cost using the effective interest method.
2.16 Assets held for Sale
Non-current assets, or disposal groups comprising assets and liabilities, are classified as held-for-sale if it is highly probable that they will be recovered primarily through sale rather than through continuing use. Such assets are measured at the lower of carrying amount and fair value less costs to sell. Any impairment loss on a disposal group is allocated first to goodwill, and then to remaining assets and liabilities on a pro rata basis, except that no loss is allocated to inventories, financial assets, deferred tax assets, employee benefits and investment property, which continue to be measured in accordance with the Group’s other accounting policies. Impairment losses on initial classification as held-for sale are recognized in profit or loss. Once classified as assets held-for-sale, intangible assets and property, plant and equipment are no longer amortised or depreciated.
2.17 Borrowings
Borrowings are recognised initially at fair value, net of transaction costs incurred. Borrowings are subsequently stated at amortised cost; any difference between the proceeds (net of transaction costs) and the redemption value is recognised in the Statement of Comprehensive Income over the period of the borrowings using the effective interest method. Borrowings are classified as current liabilities unless the Group has an unconditional right to defer settlement of the liability for at least 12 months after the reporting date.
2.18 Current and deferred income tax
The tax expense for the period comprises current and deferred tax. Tax is recognised in the Statement of Comprehensive Income, except to the extent that it relates to items recognised directly in shareholders' equity. In this case, the tax on this item is included in deferred taxes; the net amount is recognised in equity. The current income tax charge is calculated on the basis of the tax laws enacted or substantively enacted at the reporting date in the countries where the Company’s subsidiaries and associates operate and generate taxable income. Management periodically evaluates positions taken in tax returns with respect to situations in which applicable tax regulations are subject to interpretation and establishes provisions where appropriate on the basis of amounts expected to be paid to the tax authorities.
Marel hf., Consolidated Financial Statements 31 December 2014
All amounts in EUR*1000 unless otherwise stated. 19
Deferred income tax is provided in full, using the liability method, on temporary differences arising between the tax bases of assets and liabilities and their carrying amounts in the financial statements. Deferred income tax is determined using tax rates (and laws) that have been enacted or substantially enacted by reporting date and are expected to apply when the related deferred income tax asset is realised or the deferred income tax liability is settled. Deferred tax assets are recognised to the extent that it is probable that future taxable profit will be available against which the temporary differences can be utilised.
2.19 Employee benefits
Share-based compensation The Group operates a number of equity-settled, share-based compensation plans, under which the entity receives services from employees as consideration for equity instruments (options) of the Group. The fair value of the employee services received in exchange for the grant of the options is recognised as an expense. The total amount to be expensed is determined by reference to the fair value of the options granted, excluding the impact of any non-market service and performance vesting conditions (for example, profitability, sales growth targets and remaining an employee of the entity over a specified time period). Non-market vesting conditions are included in assumptions about the number of options that are expected to vest. The total amount expensed is recognised over the vesting period, which is the period over which all of the specified vesting conditions are to be satisfied. At reporting date, the entity revises its estimates of the number of options that are expected to vest based on the non-market vesting conditions. It recognises the impact of the revision to original estimates, if any, in the Statement of Comprehensive Income, with a corresponding adjustment to equity. The proceeds received net of any directly attributable transaction costs are credited to share capital (nominal value) and share premium when the options are exercised. The fair value of the employee share options granted is measured using the Black-Scholes formula. Measurement inputs include share price on measurement date, exercise price of the options, expected volatility based on weighted average historic volatility adjusted for changes expected due to publicly available information, weighted average expected life of the instruments based on historical experience and general option holder behaviour, expected dividends, and the risk-free interest rate based on government bonds. Service and non-market performance conditions attached to the transactions are not taken into account in determining fair value. Profit sharing and bonus plans Under some circumstances, a liability for key employee benefits in the form of profit sharing and bonus plans is recognised in other provisions when there is no realistic alternative but to settle the liability and at least the condition is met that there is a formal plan and the amounts to be paid are determined before the time of issuing the financial statements. Liabilities for profit sharing and bonus plans are expected to be settled within 12 months and are measured at the amounts expected to be paid when they are settled. Pension plans Marel has several pension plans in accordance with local rules and conditions. Based on IAS 19, only one arrangement with regards to early retirement rights can be classified as defined benefit until the moment of settlement expected in 2020 (VPL in the Netherlands). Two other defined benefit obligations refer to jubilee rights in the Netherlands and the medical benefit plan in the USA. Because of their non-material character, these arrangements are not disclosed separately. For the majority of its employees, the Group has pension plans, classified as defined contribution plans, in which the liabilities to the employees are based on the number of years of service and the salary levels. A defined contribution plan is a plan to provide benefits after retirement in which an entity makes fixed contributions to a separate entity, and legally has no constructive obligation to make further contributions. Obligations relating to defined contribution pension plans are charged to profit or loss as employee remuneration expenses when the contributions are payable. Contributions paid in advance are presented as assets to the extent that cash repayment or a reduction in future contributions is available.
2.20 Provisions
Provisions for restructuring costs and legal claims are recognised when the Group has a present legal or constructive obligation as a result of past events, it is probable that an outflow of resources will be required to settle the obligation, and the amount has been reliably estimated. Restructuring provisions comprise lease termination penalties and employee termination payments. Provisions are not recognised for future operating losses. The Group gives guarantee on certain products and undertakes to repair or replace items that fail to perform satisfactorily. If the Group expects a provision to be reimbursed, for example under an insurance contract, the reimbursement is recognised as a separate asset but only when the reimbursement is virtually certain. Provisions are measured at the present value of the expenditures expected to be required to settle the obligation using a pre-tax rate that reflects current market assessments of the time value of money and the risks specific to the obligation. The increase in the provision due to passage of time is recognised as interest expense.
Marel hf., Consolidated Financial Statements 31 December 2014
All amounts in EUR*1000 unless otherwise stated. 20
A provision for guarantee commitments is recognised when the underlying product and services are sold, based on historical warranty data and a weighting of possible outcomes against their associated probabilities. A provision for restructuring is recognised when the Group has approved a detailed and formal restructuring plan, and the restructuring either has commenced or has been announced publicly. Further operation losses are not provided for. The pension provisions for defined contributions are recognised at costs.
2.21 Revenue recognition
Revenue comprises the fair value for the sale of goods and services net of value-added tax, rebates and discounts, and after eliminating sales within the Group. Revenue from the sale of goods is recognised when significant risks and rewards of ownership of the goods are transferred to the buyer. The Group recognises revenue when the amount of revenue can be reliably measured, it is probable that future economic benefits will flow to the entity and when specific criteria have been met. The amount of revenue is considered to be “not reliably measurable” until all contingencies relating to the sale have been resolved. The Group bases its estimates on historical results, taking into consideration the type of customer, the type of transaction and the specifics of each arrangement. Revenue from fixed-price contracts for delivering design services and solutions is recognised under the percentage-of-completion (POC) method. Under the POC method, revenue is generally recognised based on the services performed and direct expenses incurred to date as a percentage of the total services to be performed and total expenses to be incurred. Interest income is recognised on a time proportion basis, taking account of the principal outstanding and the effective rate over the period to maturity. When a receivable is impaired, the Group reduces the carrying amount to its recoverable amount, being the estimated future cash flow discounted at original effective interest rate of the instrument, and continues unwinding the discount as interest income.
2.22 Leases
Leases of property, plant and equipment where the Group has substantially obtained all the risks and rewards of ownership are classified as finance leases. Finance leases are capitalised at the inception of the lease at the lower of the fair value of the leased property or the present value of the minimum lease payments. Each lease payment is allocated between the liability and finance charges so as to achieve a constant rate on the finance balance outstanding. The corresponding rental obligations, net of finance charges, are included in other long-term borrowings. The interest element of the lease payment is charged to the profit or loss over the lease period so as to produce a constant periodic rate of interest on the remaining balance of the liability for each period. The property, plant and equipment acquired under finance leases are depreciated over the shorter of the useful life of the asset and the lease term. Leases where a significant portion of the risks and rewards of ownership are retained by the lessor are classified as operating leases. Payments made under operating leases, net of any incentives received from the lessor are charged to the profit or loss on a straight-line basis over the period of the lease. In those cases where the Group is the lessor of a finance lease, the finance lease is recorded in the Statement of Financial Position as a receivable, at an amount equal to the net investment in the lease. The finance income is recorded in the profit or loss based on a pattern reflecting a constant periodic rate of return on the lessor’s net investment outstanding in respect of the finance lease. Assets held by the Group for operating leases are presented in the Statement of Financial Position according to the nature of the asset. Operating lease income is recognized in the profit or loss over the lease term on a straight line basis.
2.23 Dividend distribution
Dividend distribution to the Company’s shareholders is recognised in the Group’s financial statements in the period in which the dividends are approved by the Company’s shareholders. Dividends are recognised when the right to receive payment is established.
Marel hf., Consolidated Financial Statements 31 December 2014
All amounts in EUR*1000 unless otherwise stated. 21
3. Financial risk management
Financial risk factors
The Group’s activities expose to financial risk consisting of market risks (interest and currency risk), credit risk and liquidity risk. This note presents information about the Group´s exposure to each of the above mentioned risks, the Group’s objectives, policies and processes for measuring and managing the risk. Further quantitative disclosures are included throughout these Consolidated Financial Statements. Risk management framework
Risk management is carried out by a central treasury department (Group Treasury) under policies and with instruments approved by the Board of Directors. Group Treasury identifies, evaluates and hedges financial risks in close co-operation with the Group’s operating units. The Group´s overall risk management program focuses on the unpredictability of financial markets and seeks to minimize potential adverse effects on the Group´s financial performance. The Group uses derivative financial instruments to hedge certain risk exposures and does not enter into financial contracts for speculative purposes. On a weekly basis the group Treasury and Corporate Control staff meet with CFO to monitor the risk management process. (a) Market risk
In November 2010, the Group entered into a EUR 350 million facilities agreement with six international banks, led by ING bank, Rabobank and ABN Amro. Marel amended and extended this facilities agreement with the consortium with effective date 14. March 2014, while the terms and conditions generally remained in line with Loan Market Association (LMA) corporate standards. The key amendments were:
The facility was extended by one year with final maturity in November 2017
Initial interest terms EURIBOR/LIBOR +250 bps for the facility depending on leverage.
The Group has a financing structure which can accommodate the Group´s financing requirements till 2016 with USD and EUR borrowings matching the Group´s exposure in these currencies to a large extent. (i) Foreign exchange risk The Group operates internationally and is exposed to currency risk arising from mainly the USD and GBP, primarily with respect to the EUR, as the EUR is the Group´s reporting currency. With regards to the ISK only a fraction of a percentage of revenues is denominated in ISK, while around 6.3% (2013: 6.6%) of costs is in ISK. Financial exposure is hedged in accordance with the Group´s general policy and within set limits. The Group monitors foreign exchange risk arising from commercial transactions, recognized assets and liabilities (transaction risk) that are determined in a currency other than the entity´s functional currency. Derivative hedging is applied if the exposure is outside of the risk tolerance band on a consolidated basis. Currently all exposures are within risk tolerance and the group has no FX derivatives in place. Currency exposure arising from net assets of the Group´s major foreign operations (translation risk) is managed primarily through borrowings denominated in the relevant foreign currencies as the policy is to apply natural exchange rate hedging where possible. Economic risk is defined as the extent to which currency fluctuations can alter a company’s future operating cash flows, that is future revenues and costs. Economic risk is not hedged.
The year end and average rates used for the currencies mentioned above are:
Year-end rate 2014
Average rate 2014
Year-end rate 2013
Average rate 2013
EUR/USD ........................................................................................................................................................................................................... 1.2156 1.3293 1.3768 1.3283
EUR/GBP ........................................................................................................................................................................................................... 0.7826 0.8066 0.8350 0.8493
The following table details the Group's sensitivity of transaction and translation risk to a 10% increase and decrease in the EUR against the relevant foreign currencies. 10% is the sensitivity rate used when reporting foreign currency risk internally to key management personnel and represents management's assessment of the reasonably possible change in foreign exchange rates. The sensitivity analysis includes only outstanding foreign currency denominated monetary items and adjusts their translation at the period-end for a 10% change in foreign currency rates. The sensitivity analysis includes external loans as well as loans to foreign operations within the Group where the denomination of the loan is in a currency other than the functional currency of the lender or the borrower. A positive number below indicates an increase in profit or equity where the EUR strengthens 10% against the relevant currency.
For a 10% weakening of the EUR against the relevant currency, there would be a comparable impact on the profit or equity, and the balances below would be opposite.
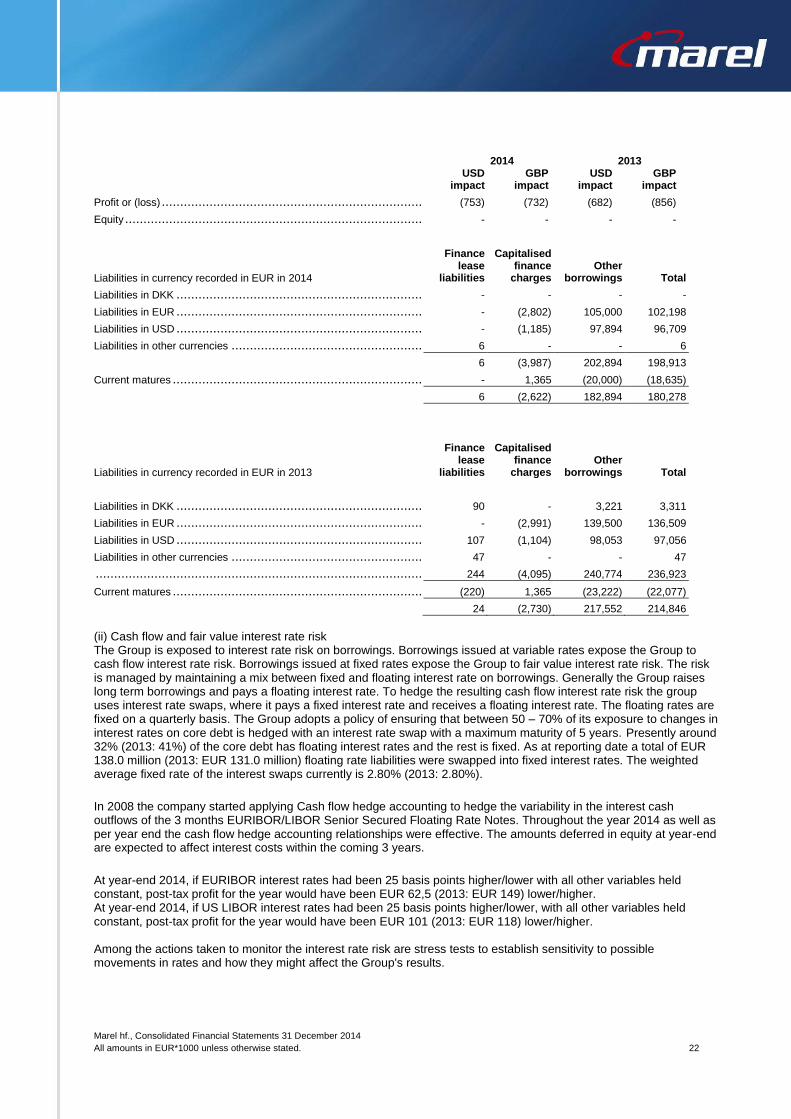
Marel hf., Consolidated Financial Statements 31 December 2014
All amounts in EUR*1000 unless otherwise stated. 22
2014 2013
USD
impact GBP
impact USD
impact GBP
impact
Profit or (loss) ...................................................................................................................................................................................................... (753) (732) (682) (856)
Equity ................................................................................................................................................................................................................ - - - -
Liabilities in currency recorded in EUR in 2014
Finance lease
liabilities
Capitalised finance
charges Other
borrowings Total
Liabilities in DKK .................................................................................................................................................................................................. - - - -
Liabilities in EUR .................................................................................................................................................................................................. - (2,802) 105,000 102,198
Liabilities in USD .................................................................................................................................................................................................. - (1,185) 97,894 96,709
Liabilities in other currencies ................................................................................................................................................................................... 6 - - 6
6 (3,987) 202,894 198,913
Current matures ................................................................................................................................................................................................... - 1,365 (20,000) (18,635)
6 (2,622) 182,894 180,278
Liabilities in currency recorded in EUR in 2013
Finance lease
liabilities
Capitalised finance
charges Other
borrowings Total
Liabilities in DKK .................................................................................................................................................................................................. 90 - 3,221 3,311
Liabilities in EUR .................................................................................................................................................................................................. - (2,991) 139,500 136,509
Liabilities in USD .................................................................................................................................................................................................. 107 (1,104) 98,053 97,056
Liabilities in other currencies ................................................................................................................................................................................... 47 - - 47
........................................................................................................................................................................................................................ 244 (4,095) 240,774 236,923
Current matures ................................................................................................................................................................................................... (220) 1,365 (23,222) (22,077)
24 (2,730) 217,552 214,846
(ii) Cash flow and fair value interest rate risk The Group is exposed to interest rate risk on borrowings. Borrowings issued at variable rates expose the Group to cash flow interest rate risk. Borrowings issued at fixed rates expose the Group to fair value interest rate risk. The risk is managed by maintaining a mix between fixed and floating interest rate on borrowings. Generally the Group raises long term borrowings and pays a floating interest rate. To hedge the resulting cash flow interest rate risk the group uses interest rate swaps, where it pays a fixed interest rate and receives a floating interest rate. The floating rates are fixed on a quarterly basis. The Group adopts a policy of ensuring that between 50 – 70% of its exposure to changes in interest rates on core debt is hedged with an interest rate swap with a maximum maturity of 5 years. Presently around 32% (2013: 41%) of the core debt has floating interest rates and the rest is fixed. As at reporting date a total of EUR 138.0 million (2013: EUR 131.0 million) floating rate liabilities were swapped into fixed interest rates. The weighted average fixed rate of the interest swaps currently is 2.80% (2013: 2.80%).
In 2008 the company started applying Cash flow hedge accounting to hedge the variability in the interest cash outflows of the 3 months EURIBOR/LIBOR Senior Secured Floating Rate Notes. Throughout the year 2014 as well as per year end the cash flow hedge accounting relationships were effective. The amounts deferred in equity at year-end are expected to affect interest costs within the coming 3 years.
At year-end 2014, if EURIBOR interest rates had been 25 basis points higher/lower with all other variables held constant, post-tax profit for the year would have been EUR 62,5 (2013: EUR 149) lower/higher. At year-end 2014, if US LIBOR interest rates had been 25 basis points higher/lower, with all other variables held constant, post-tax profit for the year would have been EUR 101 (2013: EUR 118) lower/higher. Among the actions taken to monitor the interest rate risk are stress tests to establish sensitivity to possible movements in rates and how they might affect the Group's results.
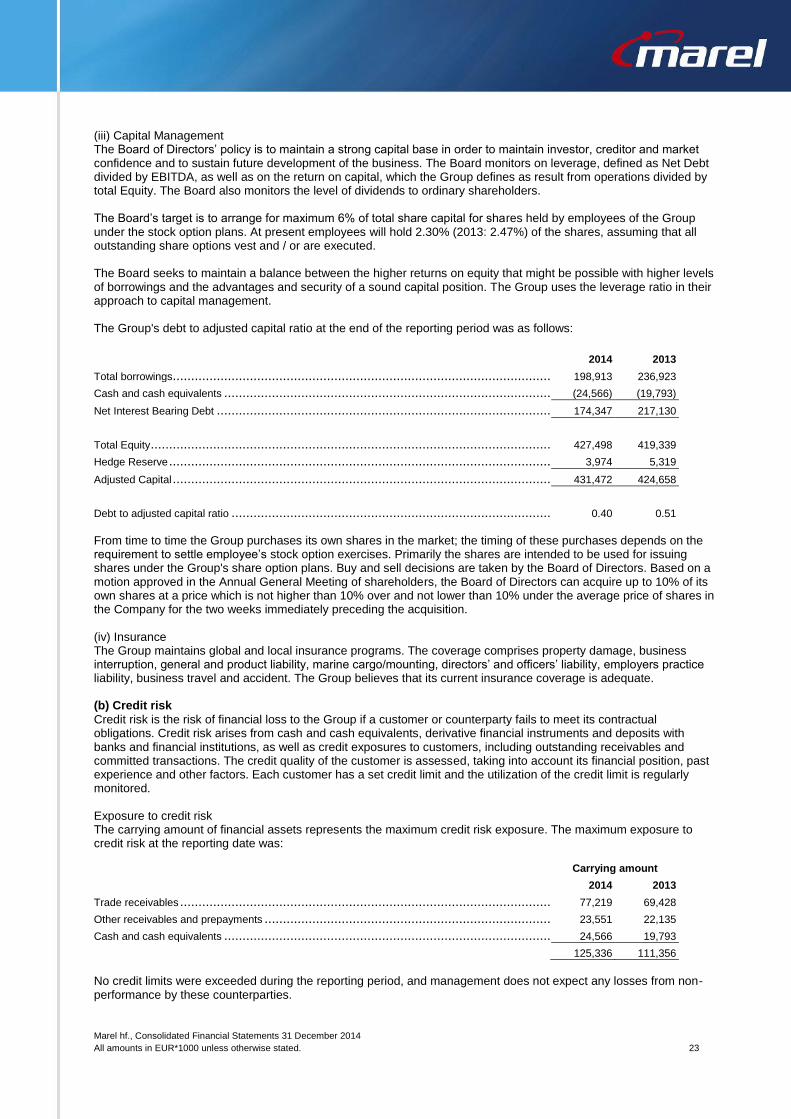
Marel hf., Consolidated Financial Statements 31 December 2014
All amounts in EUR*1000 unless otherwise stated. 23
(iii) Capital Management The Board of Directors’ policy is to maintain a strong capital base in order to maintain investor, creditor and market confidence and to sustain future development of the business. The Board monitors on leverage, defined as Net Debt divided by EBITDA, as well as on the return on capital, which the Group defines as result from operations divided by total Equity. The Board also monitors the level of dividends to ordinary shareholders. The Board’s target is to arrange for maximum 6% of total share capital for shares held by employees of the Group under the stock option plans. At present employees will hold 2.30% (2013: 2.47%) of the shares, assuming that all outstanding share options vest and / or are executed. The Board seeks to maintain a balance between the higher returns on equity that might be possible with higher levels of borrowings and the advantages and security of a sound capital position. The Group uses the leverage ratio in their approach to capital management. The Group's debt to adjusted capital ratio at the end of the reporting period was as follows:
2014 2013
Total borrowings................................................................................................................................................................................................... 198,913 236,923
Cash and cash equivalents ..................................................................................................................................................................................... (24,566) (19,793)
Net Interest Bearing Debt ....................................................................................................................................................................................... 174,347 217,130
Total Equity ......................................................................................................................................................................................................... 427,498 419,339
Hedge Reserve .................................................................................................................................................................................................... 3,974 5,319
Adjusted Capital ................................................................................................................................................................................................... 431,472 424,658
Debt to adjusted capital ratio ................................................................................................................................................................................... 0.40 0.51
From time to time the Group purchases its own shares in the market; the timing of these purchases depends on the requirement to settle employee’s stock option exercises. Primarily the shares are intended to be used for issuing shares under the Group's share option plans. Buy and sell decisions are taken by the Board of Directors. Based on a motion approved in the Annual General Meeting of shareholders, the Board of Directors can acquire up to 10% of its own shares at a price which is not higher than 10% over and not lower than 10% under the average price of shares in the Company for the two weeks immediately preceding the acquisition. (iv) Insurance The Group maintains global and local insurance programs. The coverage comprises property damage, business interruption, general and product liability, marine cargo/mounting, directors’ and officers’ liability, employers practice liability, business travel and accident. The Group believes that its current insurance coverage is adequate. (b) Credit risk
Credit risk is the risk of financial loss to the Group if a customer or counterparty fails to meet its contractual obligations. Credit risk arises from cash and cash equivalents, derivative financial instruments and deposits with banks and financial institutions, as well as credit exposures to customers, including outstanding receivables and committed transactions. The credit quality of the customer is assessed, taking into account its financial position, past experience and other factors. Each customer has a set credit limit and the utilization of the credit limit is regularly monitored. Exposure to credit risk The carrying amount of financial assets represents the maximum credit risk exposure. The maximum exposure to credit risk at the reporting date was:
Carrying amount
2014 2013
Trade receivables ................................................................................................................................................................................................. 77,219 69,428
Other receivables and prepayments .......................................................................................................................................................................... 23,551 22,135
Cash and cash equivalents ..................................................................................................................................................................................... 24,566 19,793
125,336 111,356
No credit limits were exceeded during the reporting period, and management does not expect any losses from non-performance by these counterparties.
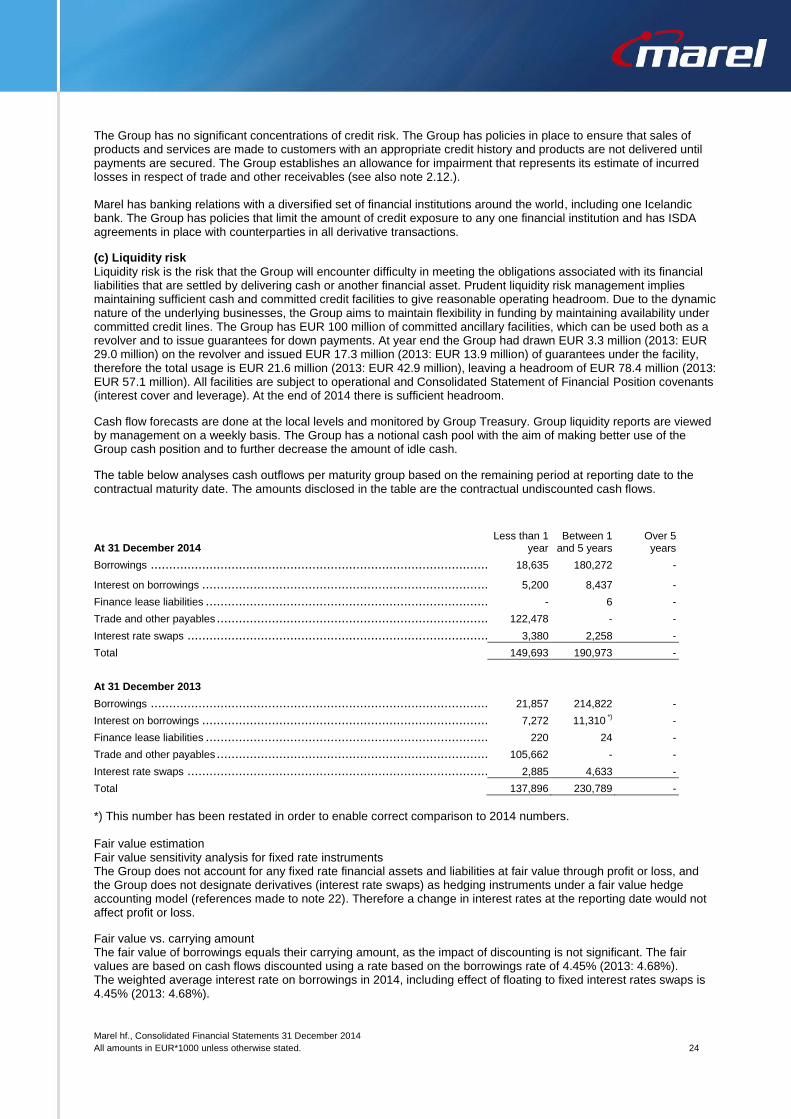
Marel hf., Consolidated Financial Statements 31 December 2014
All amounts in EUR*1000 unless otherwise stated. 24
The Group has no significant concentrations of credit risk. The Group has policies in place to ensure that sales of products and services are made to customers with an appropriate credit history and products are not delivered until payments are secured. The Group establishes an allowance for impairment that represents its estimate of incurred losses in respect of trade and other receivables (see also note 2.12.). Marel has banking relations with a diversified set of financial institutions around the world, including one Icelandic bank. The Group has policies that limit the amount of credit exposure to any one financial institution and has ISDA agreements in place with counterparties in all derivative transactions.
(c) Liquidity risk
Liquidity risk is the risk that the Group will encounter difficulty in meeting the obligations associated with its financial liabilities that are settled by delivering cash or another financial asset. Prudent liquidity risk management implies maintaining sufficient cash and committed credit facilities to give reasonable operating headroom. Due to the dynamic nature of the underlying businesses, the Group aims to maintain flexibility in funding by maintaining availability under committed credit lines. The Group has EUR 100 million of committed ancillary facilities, which can be used both as a revolver and to issue guarantees for down payments. At year end the Group had drawn EUR 3.3 million (2013: EUR 29.0 million) on the revolver and issued EUR 17.3 million (2013: EUR 13.9 million) of guarantees under the facility, therefore the total usage is EUR 21.6 million (2013: EUR 42.9 million), leaving a headroom of EUR 78.4 million (2013: EUR 57.1 million). All facilities are subject to operational and Consolidated Statement of Financial Position covenants (interest cover and leverage). At the end of 2014 there is sufficient headroom.
Cash flow forecasts are done at the local levels and monitored by Group Treasury. Group liquidity reports are viewed by management on a weekly basis. The Group has a notional cash pool with the aim of making better use of the Group cash position and to further decrease the amount of idle cash.
The table below analyses cash outflows per maturity group based on the remaining period at reporting date to the contractual maturity date. The amounts disclosed in the table are the contractual undiscounted cash flows.
At 31 December 2014 Less than 1
year Between 1
and 5 years Over 5 years
Borrowings ......................................................................................................................................................................................................... 18,635 180,272 -
Interest on borrowings ........................................................................................................................................................................................... 5,200 8,437 -
Finance lease liabilities .......................................................................................................................................................................................... - 6 -
Trade and other payables ....................................................................................................................................................................................... 122,478 - -
Interest rate swaps ............................................................................................................................................................................................... 3,380 2,258 -
Total 149,693 190,973 -
At 31 December 2013
Borrowings ......................................................................................................................................................................................................... 21,857 214,822 -
Interest on borrowings ........................................................................................................................................................................................... 7,272 11,310 *)
-
Finance lease liabilities .......................................................................................................................................................................................... 220 24 -
Trade and other payables ....................................................................................................................................................................................... 105,662 - -
Interest rate swaps ............................................................................................................................................................................................... 2,885 4,633 -
Total 137,896 230,789 -
*) This number has been restated in order to enable correct comparison to 2014 numbers. Fair value estimation Fair value sensitivity analysis for fixed rate instruments The Group does not account for any fixed rate financial assets and liabilities at fair value through profit or loss, and the Group does not designate derivatives (interest rate swaps) as hedging instruments under a fair value hedge accounting model (references made to note 22). Therefore a change in interest rates at the reporting date would not affect profit or loss.
Fair value vs. carrying amount The fair value of borrowings equals their carrying amount, as the impact of discounting is not significant. The fair values are based on cash flows discounted using a rate based on the borrowings rate of 4.45% (2013: 4.68%). The weighted average interest rate on borrowings in 2014, including effect of floating to fixed interest rates swaps is 4.45% (2013: 4.68%).
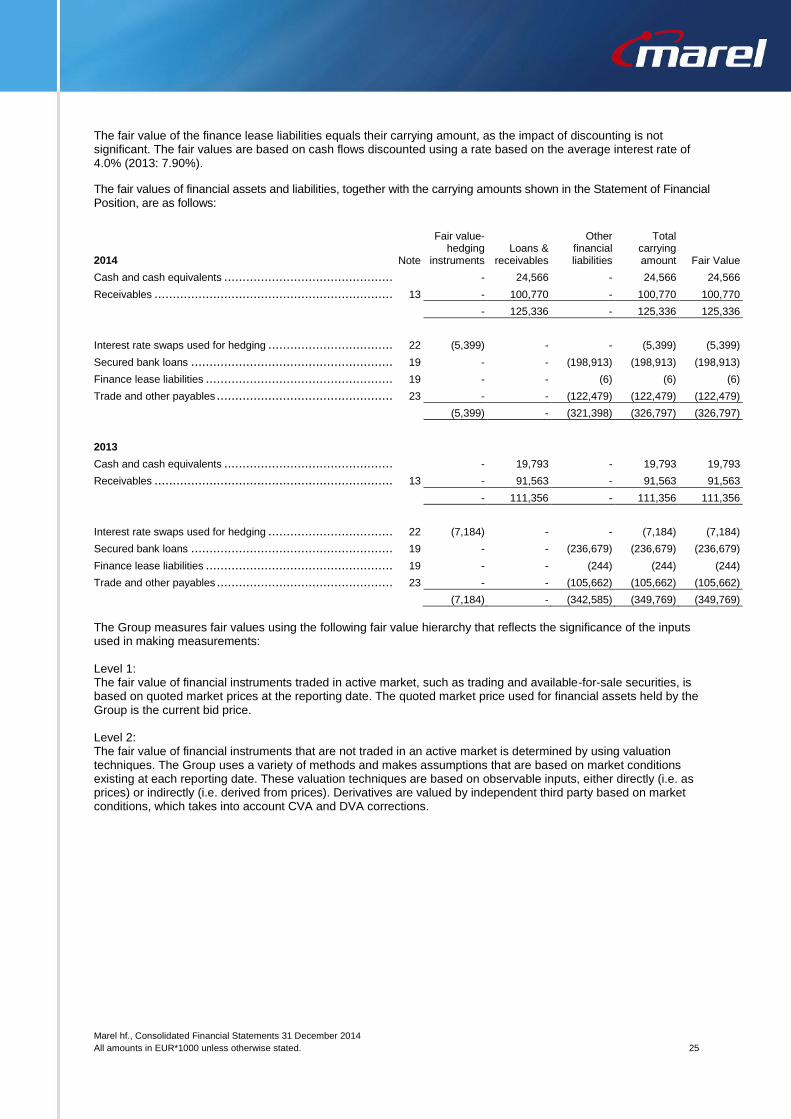
Marel hf., Consolidated Financial Statements 31 December 2014
All amounts in EUR*1000 unless otherwise stated. 25
The fair value of the finance lease liabilities equals their carrying amount, as the impact of discounting is not significant. The fair values are based on cash flows discounted using a rate based on the average interest rate of 4.0% (2013: 7.90%).
The fair values of financial assets and liabilities, together with the carrying amounts shown in the Statement of Financial Position, are as follows:
2014 Note
Fair value- hedging
instruments Loans &
receivables
Other financial liabilities
Total carrying amount Fair Value
Cash and cash equivalents ..................................................................................................................................................................................... - 24,566 - 24,566 24,566
Receivables ........................................................................................................................................................................................................ 13 - 100,770 - 100,770 100,770
- 125,336 - 125,336 125,336
Interest rate swaps used for hedging ......................................................................................................................................................................... 22 (5,399) - - (5,399) (5,399)
Secured bank loans .............................................................................................................................................................................................. 19 - - (198,913) (198,913) (198,913)
Finance lease liabilities .......................................................................................................................................................................................... 19 - - (6) (6) (6)
Trade and other payables ....................................................................................................................................................................................... 23 - - (122,479) (122,479) (122,479)
(5,399) - (321,398) (326,797) (326,797)
2013
Cash and cash equivalents ..................................................................................................................................................................................... - 19,793 - 19,793 19,793
Receivables ........................................................................................................................................................................................................ 13 - 91,563 - 91,563 91,563
- 111,356 - 111,356 111,356
Interest rate swaps used for hedging ......................................................................................................................................................................... 22 (7,184) - - (7,184) (7,184)
Secured bank loans .............................................................................................................................................................................................. 19 - - (236,679) (236,679) (236,679)
Finance lease liabilities .......................................................................................................................................................................................... 19 - - (244) (244) (244)
Trade and other payables ....................................................................................................................................................................................... 23 - - (105,662) (105,662) (105,662)
(7,184) - (342,585) (349,769) (349,769)
The Group measures fair values using the following fair value hierarchy that reflects the significance of the inputs used in making measurements: Level 1: The fair value of financial instruments traded in active market, such as trading and available-for-sale securities, is based on quoted market prices at the reporting date. The quoted market price used for financial assets held by the Group is the current bid price. Level 2: The fair value of financial instruments that are not traded in an active market is determined by using valuation techniques. The Group uses a variety of methods and makes assumptions that are based on market conditions existing at each reporting date. These valuation techniques are based on observable inputs, either directly (i.e. as prices) or indirectly (i.e. derived from prices). Derivatives are valued by independent third party based on market conditions, which takes into account CVA and DVA corrections.
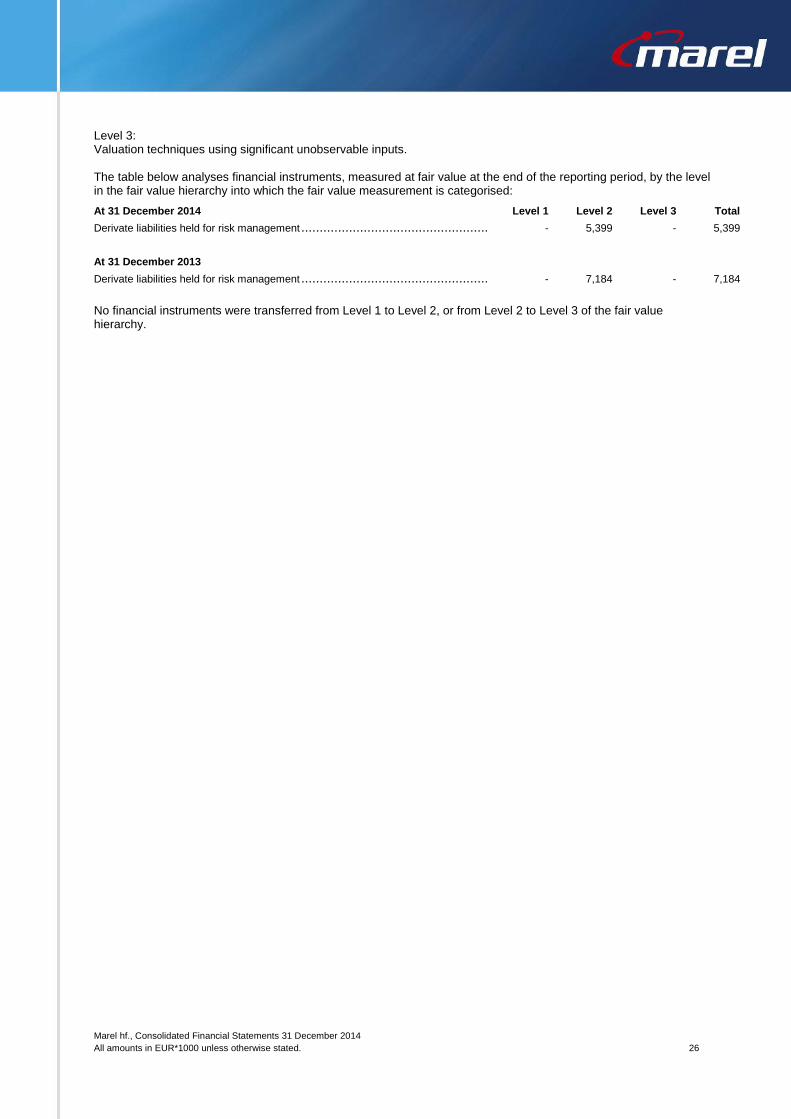
Marel hf., Consolidated Financial Statements 31 December 2014
All amounts in EUR*1000 unless otherwise stated. 26
Level 3: Valuation techniques using significant unobservable inputs. The table below analyses financial instruments, measured at fair value at the end of the reporting period, by the level in the fair value hierarchy into which the fair value measurement is categorised:
At 31 December 2014 Level 1 Level 2 Level 3 Total
Derivate liabilities held for risk management ................................................................................................................................................................ - 5,399 - 5,399
At 31 December 2013
Derivate liabilities held for risk management ................................................................................................................................................................ - 7,184 - 7,184
No financial instruments were transferred from Level 1 to Level 2, or from Level 2 to Level 3 of the fair value hierarchy.
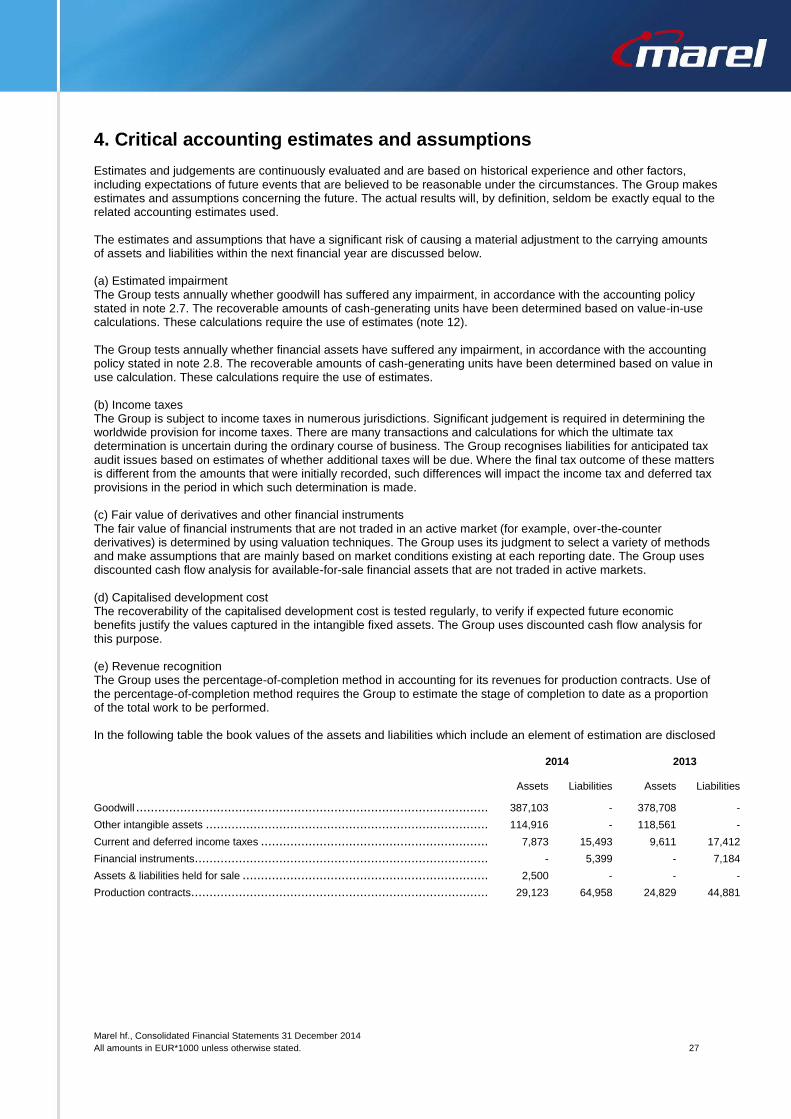
Marel hf., Consolidated Financial Statements 31 December 2014
All amounts in EUR*1000 unless otherwise stated. 27
4. Critical accounting estimates and assumptions Estimates and judgements are continuously evaluated and are based on historical experience and other factors, including expectations of future events that are believed to be reasonable under the circumstances. The Group makes estimates and assumptions concerning the future. The actual results will, by definition, seldom be exactly equal to the related accounting estimates used. The estimates and assumptions that have a significant risk of causing a material adjustment to the carrying amounts of assets and liabilities within the next financial year are discussed below. (a) Estimated impairment The Group tests annually whether goodwill has suffered any impairment, in accordance with the accounting policy stated in note 2.7. The recoverable amounts of cash-generating units have been determined based on value-in-use calculations. These calculations require the use of estimates (note 12). The Group tests annually whether financial assets have suffered any impairment, in accordance with the accounting policy stated in note 2.8. The recoverable amounts of cash-generating units have been determined based on value in use calculation. These calculations require the use of estimates. (b) Income taxes The Group is subject to income taxes in numerous jurisdictions. Significant judgement is required in determining the worldwide provision for income taxes. There are many transactions and calculations for which the ultimate tax determination is uncertain during the ordinary course of business. The Group recognises liabilities for anticipated tax audit issues based on estimates of whether additional taxes will be due. Where the final tax outcome of these matters is different from the amounts that were initially recorded, such differences will impact the income tax and deferred tax provisions in the period in which such determination is made. (c) Fair value of derivatives and other financial instruments The fair value of financial instruments that are not traded in an active market (for example, over-the-counter derivatives) is determined by using valuation techniques. The Group uses its judgment to select a variety of methods and make assumptions that are mainly based on market conditions existing at each reporting date. The Group uses discounted cash flow analysis for available-for-sale financial assets that are not traded in active markets. (d) Capitalised development cost The recoverability of the capitalised development cost is tested regularly, to verify if expected future economic benefits justify the values captured in the intangible fixed assets. The Group uses discounted cash flow analysis for this purpose. (e) Revenue recognition The Group uses the percentage-of-completion method in accounting for its revenues for production contracts. Use of the percentage-of-completion method requires the Group to estimate the stage of completion to date as a proportion of the total work to be performed. In the following table the book values of the assets and liabilities which include an element of estimation are disclosed
2014 2013
Assets Liabilities Assets Liabilities
Goodwill ............................................................................................................................................................................................................. 387,103 - 378,708 -
Other intangible assets .......................................................................................................................................................................................... 114,916 - 118,561 -
Current and deferred income taxes ........................................................................................................................................................................... 7,873 15,493 9,611 17,412
Financial instruments ............................................................................................................................................................................................. - 5,399 - 7,184
Assets & liabilities held for sale ................................................................................................................................................................................ 2,500 - - -
Production contracts.............................................................................................................................................................................................. 29,123 64,958 24,829 44,881
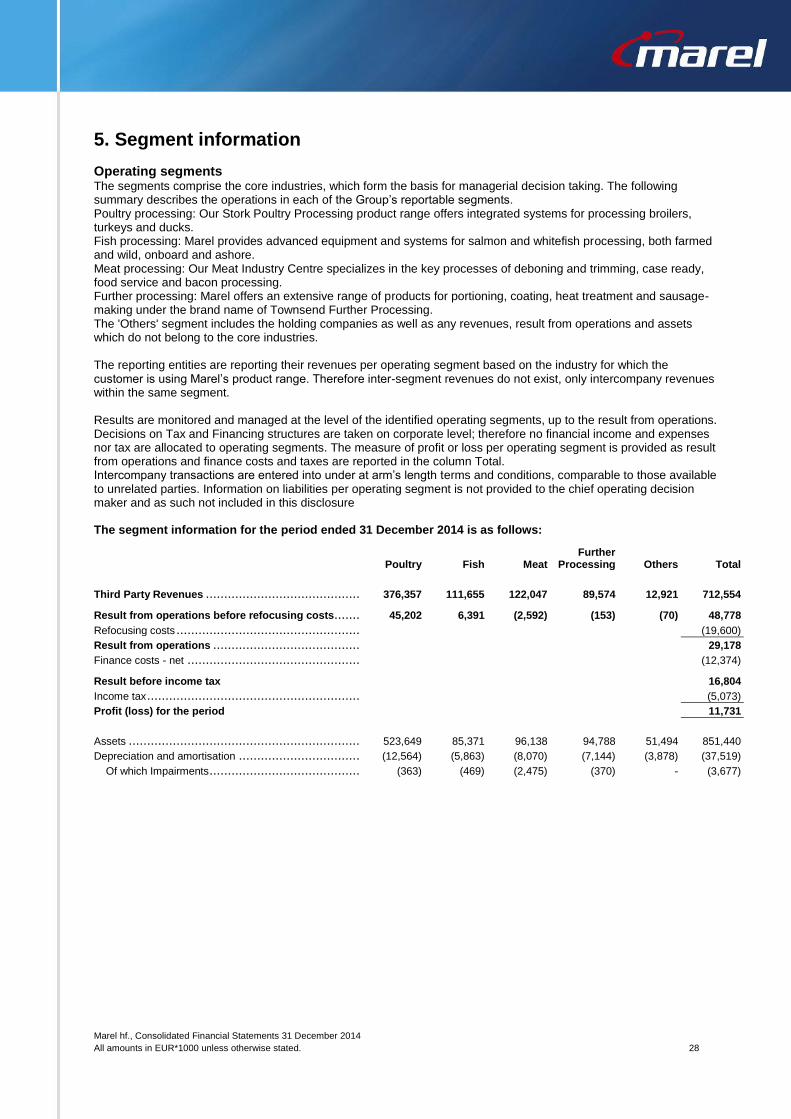
Marel hf., Consolidated Financial Statements 31 December 2014
All amounts in EUR*1000 unless otherwise stated. 28
5. Segment information
Operating segments The segments comprise the core industries, which form the basis for managerial decision taking. The following summary describes the operations in each of the Group’s reportable segments. Poultry processing: Our Stork Poultry Processing product range offers integrated systems for processing broilers, turkeys and ducks. Fish processing: Marel provides advanced equipment and systems for salmon and whitefish processing, both farmed and wild, onboard and ashore. Meat processing: Our Meat Industry Centre specializes in the key processes of deboning and trimming, case ready, food service and bacon processing. Further processing: Marel offers an extensive range of products for portioning, coating, heat treatment and sausage-making under the brand name of Townsend Further Processing. The 'Others' segment includes the holding companies as well as any revenues, result from operations and assets which do not belong to the core industries. The reporting entities are reporting their revenues per operating segment based on the industry for which the customer is using Marel’s product range. Therefore inter-segment revenues do not exist, only intercompany revenues within the same segment. Results are monitored and managed at the level of the identified operating segments, up to the result from operations. Decisions on Tax and Financing structures are taken on corporate level; therefore no financial income and expenses nor tax are allocated to operating segments. The measure of profit or loss per operating segment is provided as result from operations and finance costs and taxes are reported in the column Total. Intercompany transactions are entered into under at arm’s length terms and conditions, comparable to those available to unrelated parties. Information on liabilities per operating segment is not provided to the chief operating decision maker and as such not included in this disclosure The segment information for the period ended 31 December 2014 is as follows:
Poultry Fish Meat Further
Processing Others Total
Third Party Revenues .......................................................................................................................................................................................... 376,357 111,655 122,047 89,574 12,921 712,554 Result from operations before refocusing costs....................................................................................................................................................... 45,202 6,391 (2,592) (153) (70) 48,778
Refocusing costs .................................................................................................................................................................................................. (19,600)
Result from operations ........................................................................................................................................................................................ 29,178
Finance costs - net ............................................................................................................................................................................................... (12,374) Result before income tax 16,804
Income tax .......................................................................................................................................................................................................... (5,073)
Profit (loss) for the period 11,731
Assets ............................................................................................................................................................................................................... 523,649 85,371 96,138 94,788 51,494 851,440
Depreciation and amortisation ................................................................................................................................................................................. (12,564) (5,863) (8,070) (7,144) (3,878) (37,519)
Of which Impairments ............................................................................................................................................................................................. (363) (469) (2,475) (370) - (3,677)
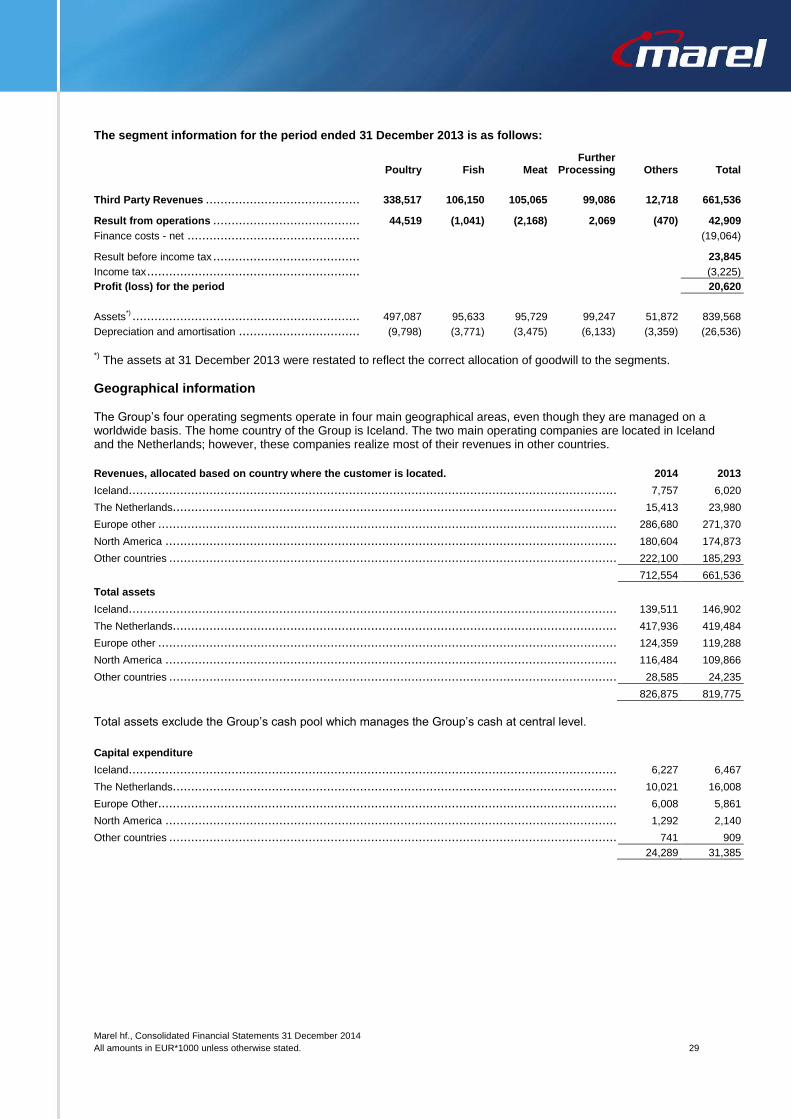
Marel hf., Consolidated Financial Statements 31 December 2014
All amounts in EUR*1000 unless otherwise stated. 29
The segment information for the period ended 31 December 2013 is as follows:
Poultry Fish Meat Further
Processing Others Total
Third Party Revenues .......................................................................................................................................................................................... 338,517 106,150 105,065 99,086 12,718 661,536 Result from operations ........................................................................................................................................................................................ 44,519 (1,041) (2,168) 2,069 (470) 42,909
Finance costs - net ............................................................................................................................................................................................... (19,064) Result before income tax ........................................................................................................................................................................................ 23,845
Income tax .......................................................................................................................................................................................................... (3,225)
Profit (loss) for the period 20,620
Assets*) .............................................................................................................................................................................................................. 497,087 95,633 95,729 99,247 51,872 839,568
Depreciation and amortisation ................................................................................................................................................................................. (9,798) (3,771) (3,475) (6,133) (3,359) (26,536)
*) The assets at 31 December 2013 were restated to reflect the correct allocation of goodwill to the segments.
Geographical information
The Group’s four operating segments operate in four main geographical areas, even though they are managed on a worldwide basis. The home country of the Group is Iceland. The two main operating companies are located in Iceland and the Netherlands; however, these companies realize most of their revenues in other countries.
Revenues, allocated based on country where the customer is located. 2014 2013
Iceland ............................................................................................................................................................................................................... 7,757 6,020
The Netherlands................................................................................................................................................................................................... 15,413 23,980
Europe other ....................................................................................................................................................................................................... 286,680 271,370
North America ..................................................................................................................................................................................................... 180,604 174,873
Other countries .................................................................................................................................................................................................... 222,100 185,293
712,554 661,536
Total assets
Iceland ............................................................................................................................................................................................................... 139,511 146,902
The Netherlands................................................................................................................................................................................................... 417,936 419,484
Europe other ....................................................................................................................................................................................................... 124,359 119,288
North America ..................................................................................................................................................................................................... 116,484 109,866
Other countries .................................................................................................................................................................................................... 28,585 24,235
826,875 819,775
Total assets exclude the Group’s cash pool which manages the Group’s cash at central level.
Capital expenditure
Iceland ............................................................................................................................................................................................................... 6,227 6,467
The Netherlands................................................................................................................................................................................................... 10,021 16,008
Europe Other ....................................................................................................................................................................................................... 6,008 5,861
North America ..................................................................................................................................................................................................... 1,292 2,140
Other countries .................................................................................................................................................................................................... 741 909
24,289 31,385
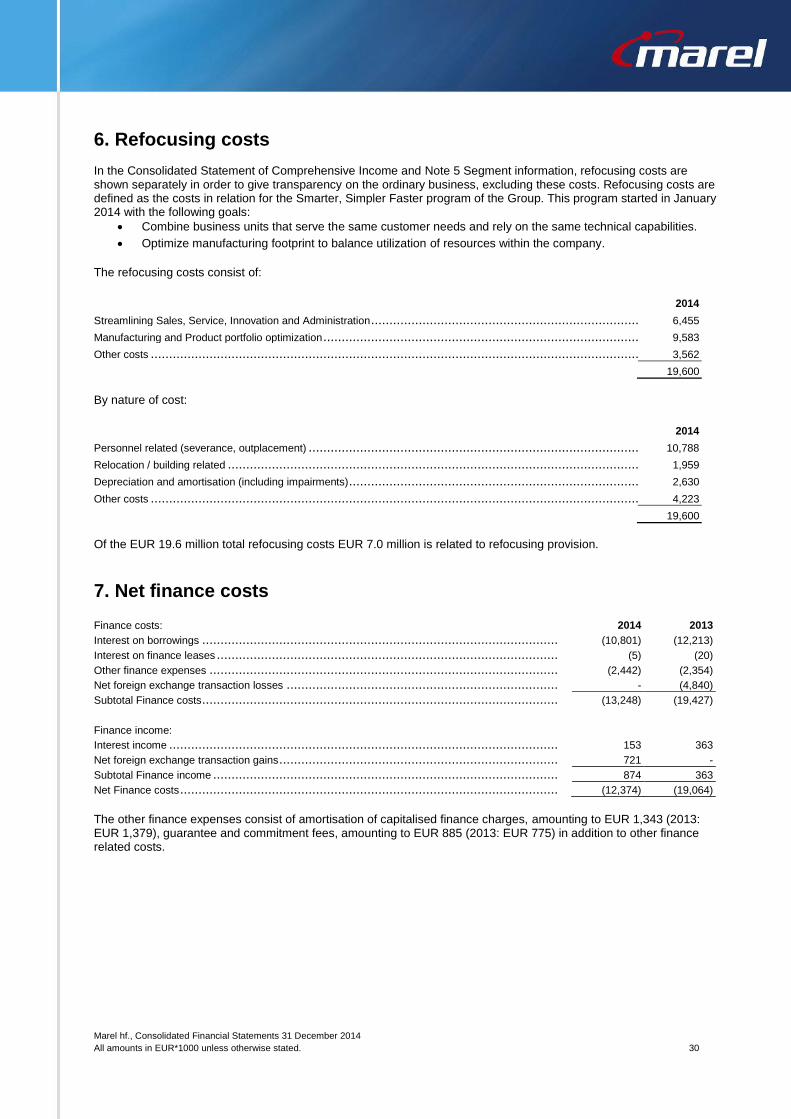
Marel hf., Consolidated Financial Statements 31 December 2014
All amounts in EUR*1000 unless otherwise stated. 30
6. Refocusing costs In the Consolidated Statement of Comprehensive Income and Note 5 Segment information, refocusing costs are shown separately in order to give transparency on the ordinary business, excluding these costs. Refocusing costs are defined as the costs in relation for the Smarter, Simpler Faster program of the Group. This program started in January 2014 with the following goals:
Combine business units that serve the same customer needs and rely on the same technical capabilities.
Optimize manufacturing footprint to balance utilization of resources within the company.
The refocusing costs consist of:
2014
Streamlining Sales, Service, Innovation and Administration ............................................................................................................................................. 6,455
Manufacturing and Product portfolio optimization .......................................................................................................................................................... 9,583
Other costs ......................................................................................................................................................................................................... 3,562
19,600
By nature of cost:
2014
Personnel related (severance, outplacement) .............................................................................................................................................................. 10,788
Relocation / building related .................................................................................................................................................................................... 1,959
Depreciation and amortisation (including impairments) ................................................................................................................................................... 2,630
Other costs ......................................................................................................................................................................................................... 4,223
19,600
Of the EUR 19.6 million total refocusing costs EUR 7.0 million is related to refocusing provision.
7. Net finance costs Finance costs: 2014 2013
Interest on borrowings ........................................................................................................................................................................................... (10,801) (12,213)
Interest on finance leases ....................................................................................................................................................................................... (5) (20)
Other finance expenses ......................................................................................................................................................................................... (2,442) (2,354)
Net foreign exchange transaction losses .................................................................................................................................................................... - (4,840)
Subtotal Finance costs ........................................................................................................................................................................................... (13,248) (19,427)
Finance income:
Interest income .................................................................................................................................................................................................... 153 363
Net foreign exchange transaction gains ...................................................................................................................................................................... 721 -
Subtotal Finance income ........................................................................................................................................................................................ 874 363
Net Finance costs ................................................................................................................................................................................................. (12,374) (19,064)
The other finance expenses consist of amortisation of capitalised finance charges, amounting to EUR 1,343 (2013: EUR 1,379), guarantee and commitment fees, amounting to EUR 885 (2013: EUR 775) in addition to other finance related costs.
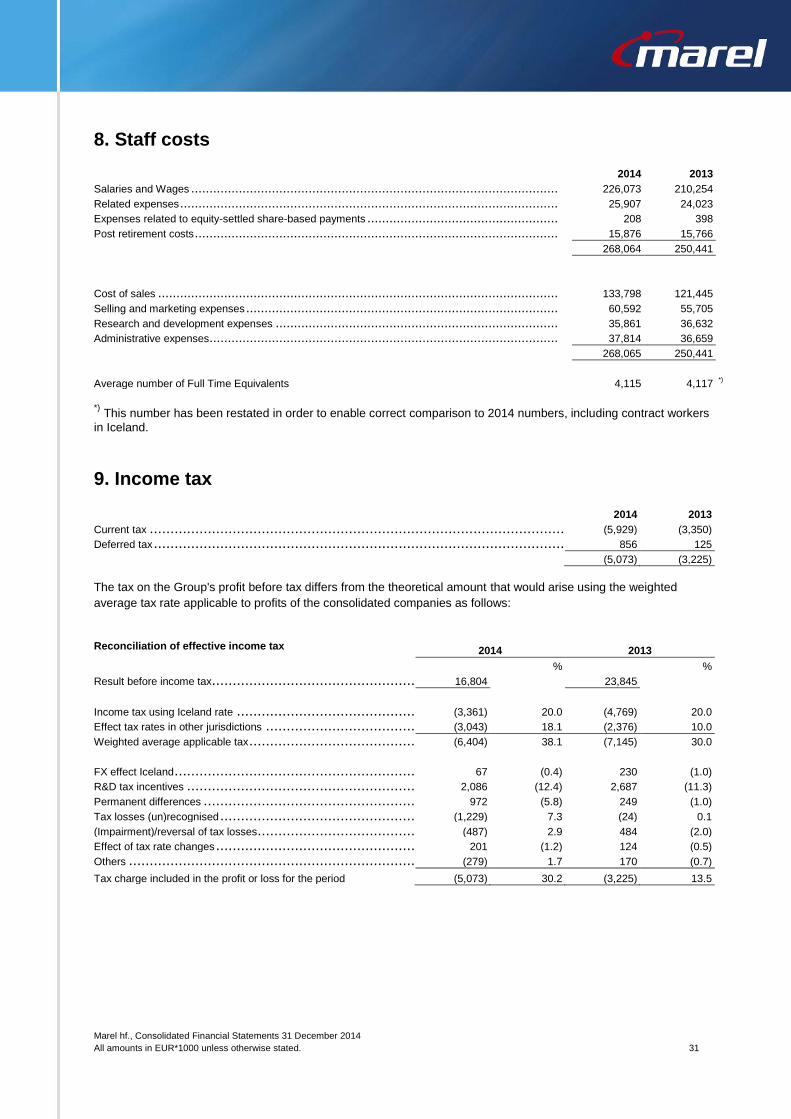
Marel hf., Consolidated Financial Statements 31 December 2014
All amounts in EUR*1000 unless otherwise stated. 31
8. Staff costs 2014 2013
Salaries and Wages .............................................................................................................................................................................................. 226,073 210,254
Related expenses ................................................................................................................................................................................................. 25,907 24,023
Expenses related to equity-settled share-based payments .............................................................................................................................................. 208 398
Post retirement costs ............................................................................................................................................................................................. 15,876 15,766
268,064 250,441
Cost of sales ....................................................................................................................................................................................................... 133,798 121,445
Selling and marketing expenses ............................................................................................................................................................................... 60,592 55,705
Research and development expenses ....................................................................................................................................................................... 35,861 36,632
Administrative expenses......................................................................................................................................................................................... 37,814 36,659
268,065 250,441 Average number of Full Time Equivalents 4,115 4,117
*)
*) This number has been restated in order to enable correct comparison to 2014 numbers, including contract workers
in Iceland.
9. Income tax
2014 2013
Current tax .................................................................................................................................................................................. (5,929) (3,350)
Deferred tax ................................................................................................................................................................................. 856 125
(5,073) (3,225)
The tax on the Group's profit before tax differs from the theoretical amount that would arise using the weighted
average tax rate applicable to profits of the consolidated companies as follows:
Reconciliation of effective income tax 2014 2013
% %
Result before income tax ................................................................................................................................................................... 16,804 23,845
Income tax using Iceland rate ............................................................................................................................................................. (3,361) 20.0 (4,769) 20.0
Effect tax rates in other jurisdictions ...................................................................................................................................................... (3,043) 18.1 (2,376) 10.0
Weighted average applicable tax .......................................................................................................................................................... (6,404) 38.1 (7,145) 30.0
FX effect Iceland ............................................................................................................................................................................ 67 (0.4) 230 (1.0)
R&D tax incentives ......................................................................................................................................................................... 2,086 (12.4) 2,687 (11.3)
Permanent differences ..................................................................................................................................................................... 972 (5.8) 249 (1.0)
Tax losses (un)recognised ................................................................................................................................................................. (1,229) 7.3 (24) 0.1
(Impairment)/reversal of tax losses ........................................................................................................................................................ (487) 2.9 484 (2.0)
Effect of tax rate changes .................................................................................................................................................................. 201 (1.2) 124 (0.5)
Others ....................................................................................................................................................................................... (279) 1.7 170 (0.7)
Tax charge included in the profit or loss for the period (5,073) 30.2 (3,225) 13.5
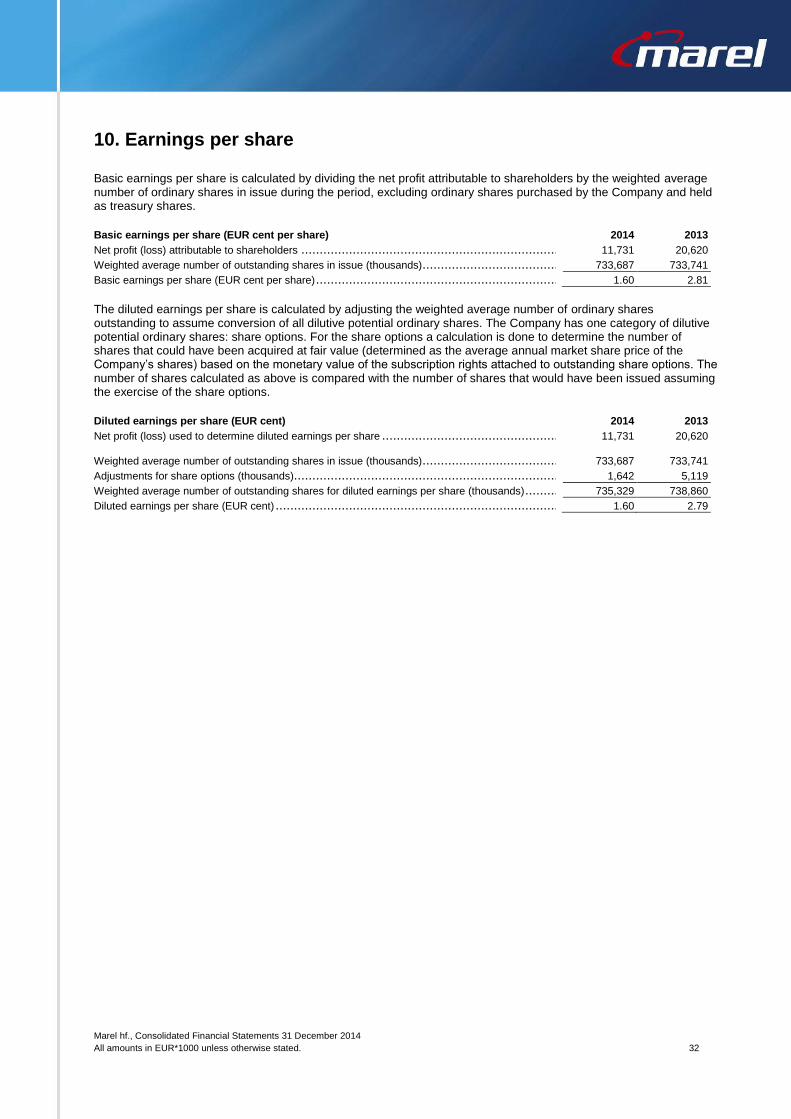
Marel hf., Consolidated Financial Statements 31 December 2014
All amounts in EUR*1000 unless otherwise stated. 32
10. Earnings per share Basic earnings per share is calculated by dividing the net profit attributable to shareholders by the weighted average number of ordinary shares in issue during the period, excluding ordinary shares purchased by the Company and held as treasury shares.
Basic earnings per share (EUR cent per share) 2014 2013
Net profit (loss) attributable to shareholders ................................................................................................................................................................ 11,731 20,620
Weighted average number of outstanding shares in issue (thousands)............................................................................................................................... 733,687 733,741
Basic earnings per share (EUR cent per share) ............................................................................................................................................................ 1.60 2.81
The diluted earnings per share is calculated by adjusting the weighted average number of ordinary shares outstanding to assume conversion of all dilutive potential ordinary shares. The Company has one category of dilutive potential ordinary shares: share options. For the share options a calculation is done to determine the number of shares that could have been acquired at fair value (determined as the average annual market share price of the Company’s shares) based on the monetary value of the subscription rights attached to outstanding share options. The number of shares calculated as above is compared with the number of shares that would have been issued assuming the exercise of the share options.
Diluted earnings per share (EUR cent) 2014 2013
Net profit (loss) used to determine diluted earnings per share .......................................................................................................................................... 11,731 20,620
Weighted average number of outstanding shares in issue (thousands)............................................................................................................................... 733,687 733,741
Adjustments for share options (thousands).................................................................................................................................................................. 1,642 5,119
Weighted average number of outstanding shares for diluted earnings per share (thousands) ................................................................................................... 735,329 738,860
Diluted earnings per share (EUR cent) ....................................................................................................................................................................... 1.60 2.79
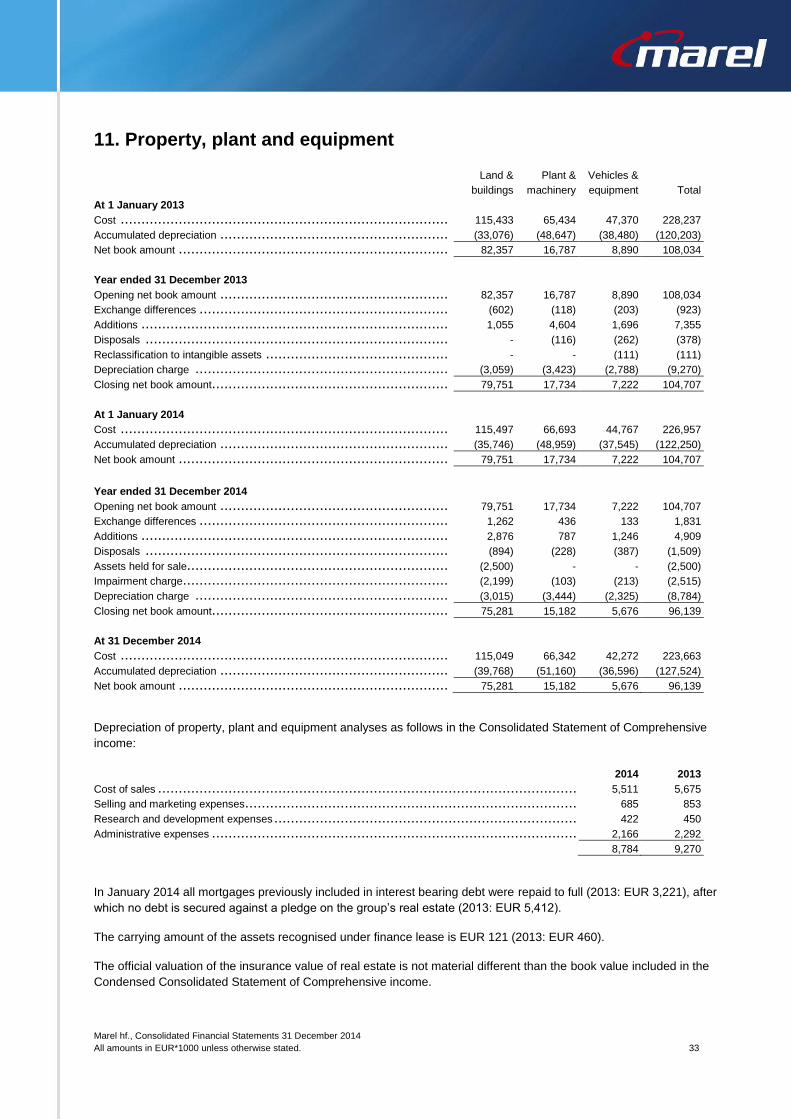
Marel hf., Consolidated Financial Statements 31 December 2014
All amounts in EUR*1000 unless otherwise stated. 33
11. Property, plant and equipment
Land & Plant & Vehicles &
buildings machinery equipment Total
At 1 January 2013
Cost ......................................................................................................................................................................................... 115,433 65,434 47,370 228,237
Accumulated depreciation ................................................................................................................................................................. (33,076) (48,647) (38,480) (120,203)
Net book amount ........................................................................................................................................................................... 82,357 16,787 8,890 108,034
Year ended 31 December 2013
Opening net book amount ................................................................................................................................................................. 82,357 16,787 8,890 108,034
Exchange differences ...................................................................................................................................................................... (602) (118) (203) (923)
Additions .................................................................................................................................................................................... 1,055 4,604 1,696 7,355
Disposals ................................................................................................................................................................................... - (116) (262) (378)
Reclassification to intangible assets ...................................................................................................................................................... - - (111) (111)
Depreciation charge ....................................................................................................................................................................... (3,059) (3,423) (2,788) (9,270)
Closing net book amount................................................................................................................................................................... 79,751 17,734 7,222 104,707
At 1 January 2014
Cost ......................................................................................................................................................................................... 115,497 66,693 44,767 226,957
Accumulated depreciation ................................................................................................................................................................. (35,746) (48,959) (37,545) (122,250)
Net book amount ........................................................................................................................................................................... 79,751 17,734 7,222 104,707
Year ended 31 December 2014
Opening net book amount ................................................................................................................................................................. 79,751 17,734 7,222 104,707
Exchange differences ...................................................................................................................................................................... 1,262 436 133 1,831
Additions .................................................................................................................................................................................... 2,876 787 1,246 4,909
Disposals ................................................................................................................................................................................... (894) (228) (387) (1,509)
Assets held for sale......................................................................................................................................................................... (2,500) - - (2,500)
Impairment charge.......................................................................................................................................................................... (2,199) (103) (213) (2,515)
Depreciation charge ....................................................................................................................................................................... (3,015) (3,444) (2,325) (8,784)
Closing net book amount................................................................................................................................................................... 75,281 15,182 5,676 96,139
At 31 December 2014
Cost ......................................................................................................................................................................................... 115,049 66,342 42,272 223,663
Accumulated depreciation ................................................................................................................................................................. (39,768) (51,160) (36,596) (127,524)
Net book amount ........................................................................................................................................................................... 75,281 15,182 5,676 96,139
Depreciation of property, plant and equipment analyses as follows in the Consolidated Statement of Comprehensive
income:
2014 2013
Cost of sales ................................................................................................................................................................................ 5,511 5,675
Selling and marketing expenses ........................................................................................................................................................... 685 853
Research and development expenses .................................................................................................................................................... 422 450
Administrative expenses ................................................................................................................................................................... 2,166 2,292
8,784 9,270
In January 2014 all mortgages previously included in interest bearing debt were repaid to full (2013: EUR 3,221), after
which no debt is secured against a pledge on the group’s real estate (2013: EUR 5,412).
The carrying amount of the assets recognised under finance lease is EUR 121 (2013: EUR 460).
The official valuation of the insurance value of real estate is not material different than the book value included in the
Condensed Consolidated Statement of Comprehensive income.
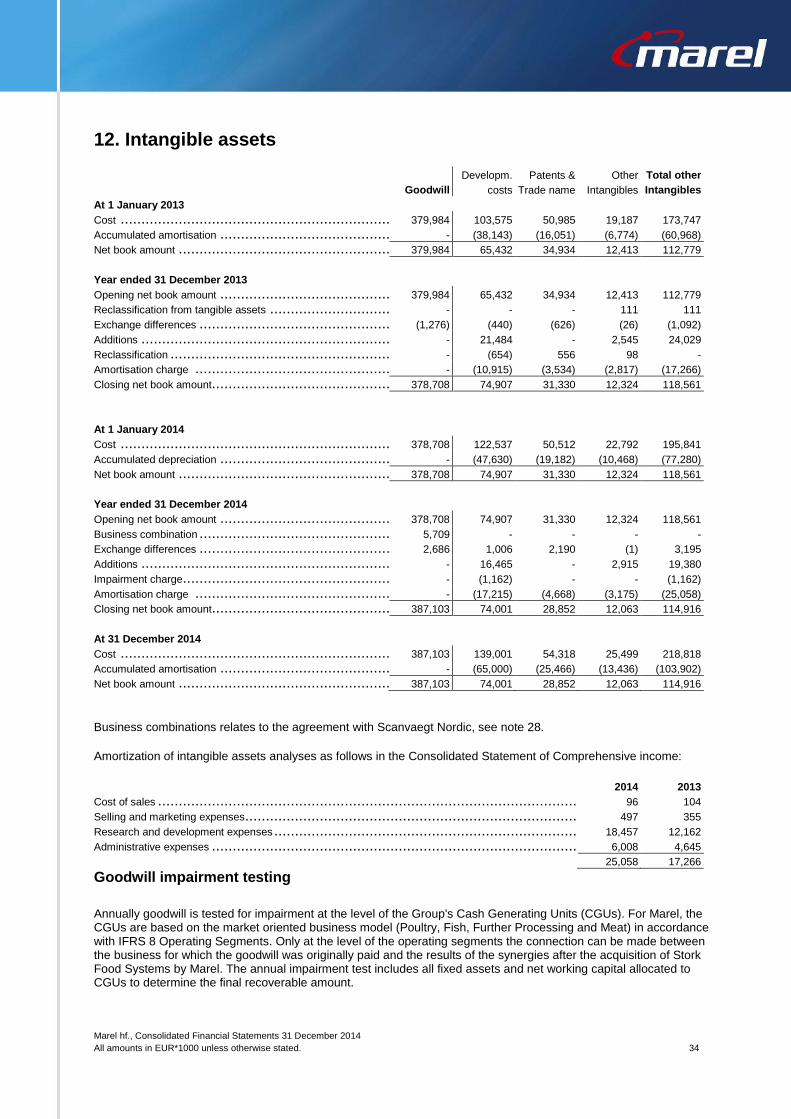
Marel hf., Consolidated Financial Statements 31 December 2014
All amounts in EUR*1000 unless otherwise stated. 34
12. Intangible assets
Developm. Patents & Other Total other
Goodwill costs Trade name Intangibles Intangibles
At 1 January 2013
Cost ......................................................................................................................................................................................... 379,984 103,575 50,985 19,187 173,747
Accumulated amortisation ................................................................................................................................................................. - (38,143) (16,051) (6,774) (60,968)
Net book amount ........................................................................................................................................................................... 379,984 65,432 34,934 12,413 112,779
Year ended 31 December 2013
Opening net book amount ................................................................................................................................................................. 379,984 65,432 34,934 12,413 112,779
Reclassification from tangible assets ..................................................................................................................................................... - - - 111 111
Exchange differences ...................................................................................................................................................................... (1,276) (440) (626) (26) (1,092)
Additions .................................................................................................................................................................................... - 21,484 - 2,545 24,029
Reclassification ............................................................................................................................................................................. - (654) 556 98 -
Amortisation charge ....................................................................................................................................................................... - (10,915) (3,534) (2,817) (17,266)
Closing net book amount................................................................................................................................................................... 378,708 74,907 31,330 12,324 118,561
At 1 January 2014
Cost ......................................................................................................................................................................................... 378,708 122,537 50,512 22,792 195,841
Accumulated depreciation ................................................................................................................................................................. - (47,630) (19,182) (10,468) (77,280)
Net book amount ........................................................................................................................................................................... 378,708 74,907 31,330 12,324 118,561
Year ended 31 December 2014
Opening net book amount ................................................................................................................................................................. 378,708 74,907 31,330 12,324 118,561
Business combination ...................................................................................................................................................................... 5,709 - - - -
Exchange differences ...................................................................................................................................................................... 2,686 1,006 2,190 (1) 3,195
Additions .................................................................................................................................................................................... - 16,465 - 2,915 19,380
Impairment charge.......................................................................................................................................................................... - (1,162) - - (1,162)
Amortisation charge ....................................................................................................................................................................... - (17,215) (4,668) (3,175) (25,058)
Closing net book amount................................................................................................................................................................... 387,103 74,001 28,852 12,063 114,916
At 31 December 2014
Cost ......................................................................................................................................................................................... 387,103 139,001 54,318 25,499 218,818
Accumulated amortisation ................................................................................................................................................................. - (65,000) (25,466) (13,436) (103,902)
Net book amount ........................................................................................................................................................................... 387,103 74,001 28,852 12,063 114,916
Business combinations relates to the agreement with Scanvaegt Nordic, see note 28.
Amortization of intangible assets analyses as follows in the Consolidated Statement of Comprehensive income:
2014 2013
Cost of sales ................................................................................................................................................................................ 96 104
Selling and marketing expenses ........................................................................................................................................................... 497 355
Research and development expenses .................................................................................................................................................... 18,457 12,162
Administrative expenses ................................................................................................................................................................... 6,008 4,645
25,058 17,266
Goodwill impairment testing
Annually goodwill is tested for impairment at the level of the Group's Cash Generating Units (CGUs). For Marel, the CGUs are based on the market oriented business model (Poultry, Fish, Further Processing and Meat) in accordance with IFRS 8 Operating Segments. Only at the level of the operating segments the connection can be made between the business for which the goodwill was originally paid and the results of the synergies after the acquisition of Stork Food Systems by Marel. The annual impairment test includes all fixed assets and net working capital allocated to CGUs to determine the final recoverable amount.
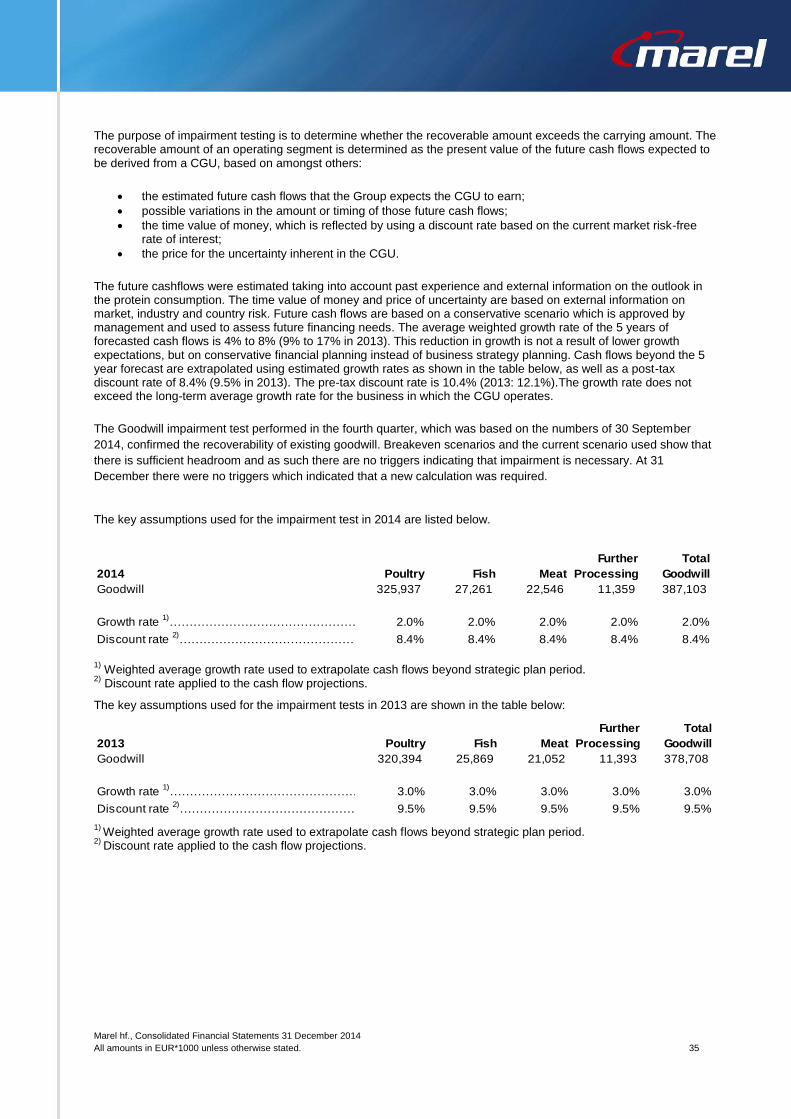
Marel hf., Consolidated Financial Statements 31 December 2014
All amounts in EUR*1000 unless otherwise stated. 35
The purpose of impairment testing is to determine whether the recoverable amount exceeds the carrying amount. The recoverable amount of an operating segment is determined as the present value of the future cash flows expected to be derived from a CGU, based on amongst others:
the estimated future cash flows that the Group expects the CGU to earn;
possible variations in the amount or timing of those future cash flows;
the time value of money, which is reflected by using a discount rate based on the current market risk-free rate of interest;
the price for the uncertainty inherent in the CGU.
The future cashflows were estimated taking into account past experience and external information on the outlook in the protein consumption. The time value of money and price of uncertainty are based on external information on market, industry and country risk. Future cash flows are based on a conservative scenario which is approved by management and used to assess future financing needs. The average weighted growth rate of the 5 years of forecasted cash flows is 4% to 8% (9% to 17% in 2013). This reduction in growth is not a result of lower growth expectations, but on conservative financial planning instead of business strategy planning. Cash flows beyond the 5 year forecast are extrapolated using estimated growth rates as shown in the table below, as well as a post-tax discount rate of 8.4% (9.5% in 2013). The pre-tax discount rate is 10.4% (2013: 12.1%).The growth rate does not exceed the long-term average growth rate for the business in which the CGU operates.
The Goodwill impairment test performed in the fourth quarter, which was based on the numbers of 30 September
2014, confirmed the recoverability of existing goodwill. Breakeven scenarios and the current scenario used show that
there is sufficient headroom and as such there are no triggers indicating that impairment is necessary. At 31
December there were no triggers which indicated that a new calculation was required.
The key assumptions used for the impairment test in 2014 are listed below.
2014 Poultry Fish Meat
Further
Processing
Total
Goodwill
Goodwill 325,937 27,261 22,546 11,359 387,103
Growth rate 1)
………………………………………………………………………………………………………………2.0% 2.0% 2.0% 2.0% 2.0%
Discount rate 2)
………………………………………………………………………………………………………………………………8.4% 8.4% 8.4% 8.4% 8.4%
1) Weighted average growth rate used to extrapolate cash flows beyond strategic plan period.
2) Discount rate applied to the cash flow projections.
The key assumptions used for the impairment tests in 2013 are shown in the table below:
2013 Poultry Fish Meat
Further
Processing
Total
Goodwill
Goodwill 320,394 25,869 21,052 11,393 378,708
Growth rate 1)
………………………………………………………………………………………………………………3.0% 3.0% 3.0% 3.0% 3.0%
Discount rate 2)
………………………………………………………………………………………………………………………………9.5% 9.5% 9.5% 9.5% 9.5% 1)
Weighted average growth rate used to extrapolate cash flows beyond strategic plan period. 2)
Discount rate applied to the cash flow projections.
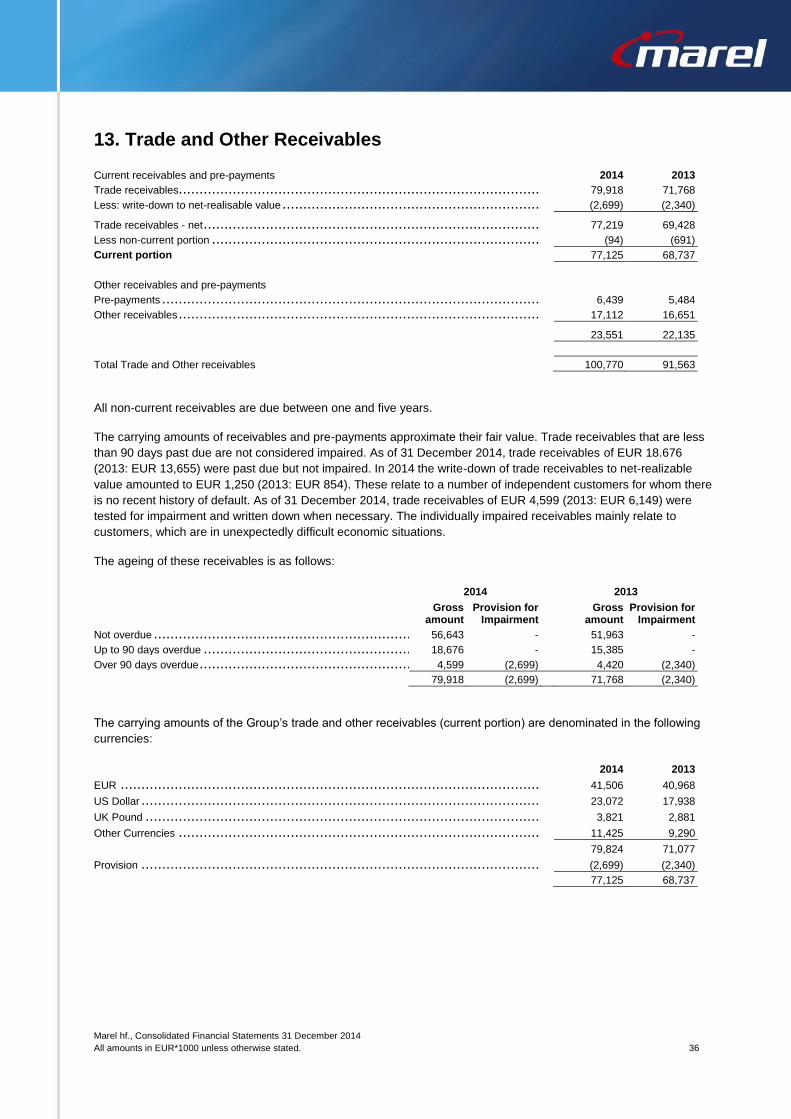
Marel hf., Consolidated Financial Statements 31 December 2014
All amounts in EUR*1000 unless otherwise stated. 36
13. Trade and Other Receivables
Current receivables and pre-payments 2014 2013
Trade receivables........................................................................................................................................................................... 79,918 71,768
Less: write-down to net-realisable value .................................................................................................................................................. (2,699) (2,340)
Trade receivables - net ..................................................................................................................................................................... 77,219 69,428
Less non-current portion ................................................................................................................................................................... (94) (691)
Current portion 77,125 68,737
Other receivables and pre-payments
Pre-payments ............................................................................................................................................................................... 6,439 5,484
Other receivables ........................................................................................................................................................................... 17,112 16,651
23,551 22,135
Total Trade and Other receivables 100,770 91,563
All non-current receivables are due between one and five years.
The carrying amounts of receivables and pre-payments approximate their fair value. Trade receivables that are less
than 90 days past due are not considered impaired. As of 31 December 2014, trade receivables of EUR 18.676
(2013: EUR 13,655) were past due but not impaired. In 2014 the write-down of trade receivables to net-realizable
value amounted to EUR 1,250 (2013: EUR 854). These relate to a number of independent customers for whom there
is no recent history of default. As of 31 December 2014, trade receivables of EUR 4,599 (2013: EUR 6,149) were
tested for impairment and written down when necessary. The individually impaired receivables mainly relate to
customers, which are in unexpectedly difficult economic situations.
The ageing of these receivables is as follows:
2014 2013
Gross
amount Provision for
Impairment Gross
amount Provision for
Impairment
Not overdue ................................................................................................................................................................................. 56,643 - 51,963 -
Up to 90 days overdue ..................................................................................................................................................................... 18,676 - 15,385 -
Over 90 days overdue ...................................................................................................................................................................... 4,599 (2,699) 4,420 (2,340)
79,918 (2,699) 71,768 (2,340)
The carrying amounts of the Group’s trade and other receivables (current portion) are denominated in the following
currencies:
2014 2013
EUR ......................................................................................................................................................................................... 41,506 40,968
US Dollar .................................................................................................................................................................................... 23,072 17,938
UK Pound ................................................................................................................................................................................... 3,821 2,881
Other Currencies ........................................................................................................................................................................... 11,425 9,290
79,824 71,077
Provision .................................................................................................................................................................................... (2,699) (2,340)
77,125 68,737
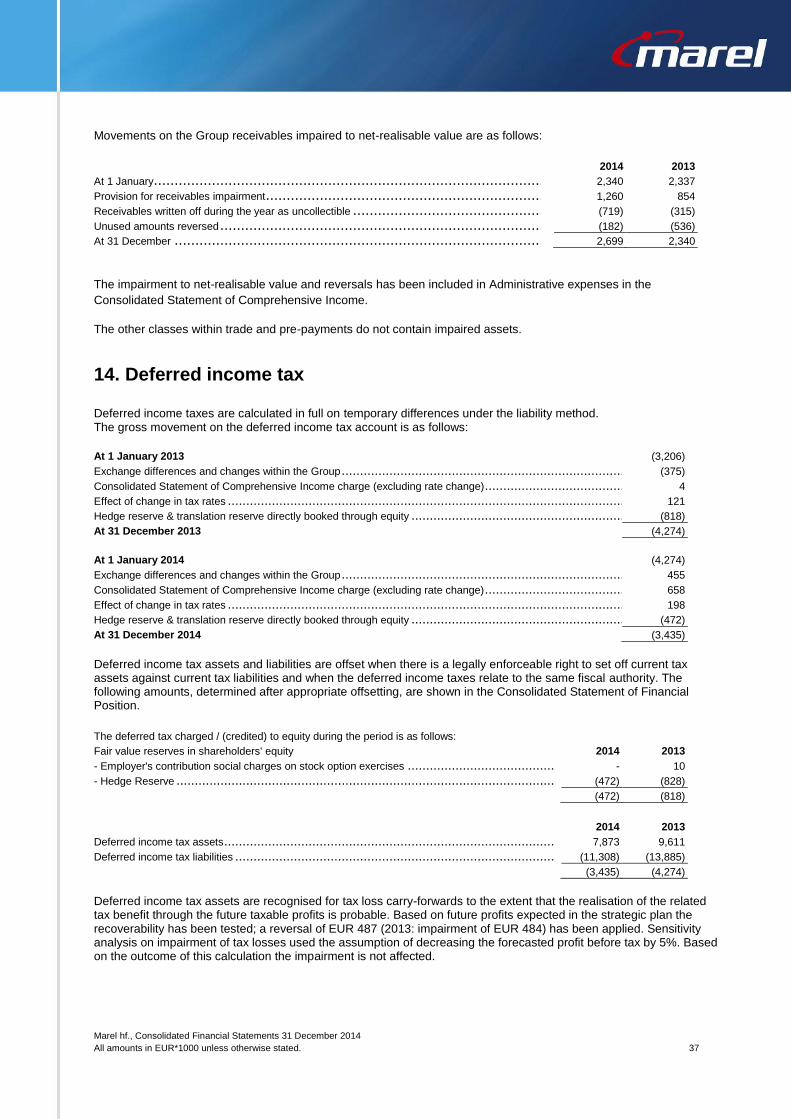
Marel hf., Consolidated Financial Statements 31 December 2014
All amounts in EUR*1000 unless otherwise stated. 37
Movements on the Group receivables impaired to net-realisable value are as follows:
2014 2013
At 1 January................................................................................................................................................................................. 2,340 2,337
Provision for receivables impairment ...................................................................................................................................................... 1,260 854
Receivables written off during the year as uncollectible ................................................................................................................................. (719) (315)
Unused amounts reversed ................................................................................................................................................................. (182) (536)
At 31 December ............................................................................................................................................................................ 2,699 2,340
The impairment to net-realisable value and reversals has been included in Administrative expenses in the
Consolidated Statement of Comprehensive Income.
The other classes within trade and pre-payments do not contain impaired assets.
14. Deferred income tax Deferred income taxes are calculated in full on temporary differences under the liability method. The gross movement on the deferred income tax account is as follows:
At 1 January 2013 (3,206)
Exchange differences and changes within the Group ..................................................................................................................................................... (375)
Consolidated Statement of Comprehensive Income charge (excluding rate change) .............................................................................................................. 4
Effect of change in tax rates .................................................................................................................................................................................... 121
Hedge reserve & translation reserve directly booked through equity .................................................................................................................................. (818)
At 31 December 2013 (4,274)
At 1 January 2014 (4,274)
Exchange differences and changes within the Group ..................................................................................................................................................... 455
Consolidated Statement of Comprehensive Income charge (excluding rate change) .............................................................................................................. 658
Effect of change in tax rates .................................................................................................................................................................................... 198
Hedge reserve & translation reserve directly booked through equity .................................................................................................................................. (472)
At 31 December 2014 (3,435)
Deferred income tax assets and liabilities are offset when there is a legally enforceable right to set off current tax assets against current tax liabilities and when the deferred income taxes relate to the same fiscal authority. The following amounts, determined after appropriate offsetting, are shown in the Consolidated Statement of Financial Position.
The deferred tax charged / (credited) to equity during the period is as follows: Fair value reserves in shareholders' equity 2014 2013
- Employer's contribution social charges on stock option exercises ................................................................................................................................... - 10
- Hedge Reserve .................................................................................................................................................................................................. (472) (828)
(472) (818)
2014 2013
Deferred income tax assets ..................................................................................................................................................................................... 7,873 9,611
Deferred income tax liabilities .................................................................................................................................................................................. (11,308) (13,885)
(3,435) (4,274)
Deferred income tax assets are recognised for tax loss carry-forwards to the extent that the realisation of the related tax benefit through the future taxable profits is probable. Based on future profits expected in the strategic plan the recoverability has been tested; a reversal of EUR 487 (2013: impairment of EUR 484) has been applied. Sensitivity analysis on impairment of tax losses used the assumption of decreasing the forecasted profit before tax by 5%. Based on the outcome of this calculation the impairment is not affected.
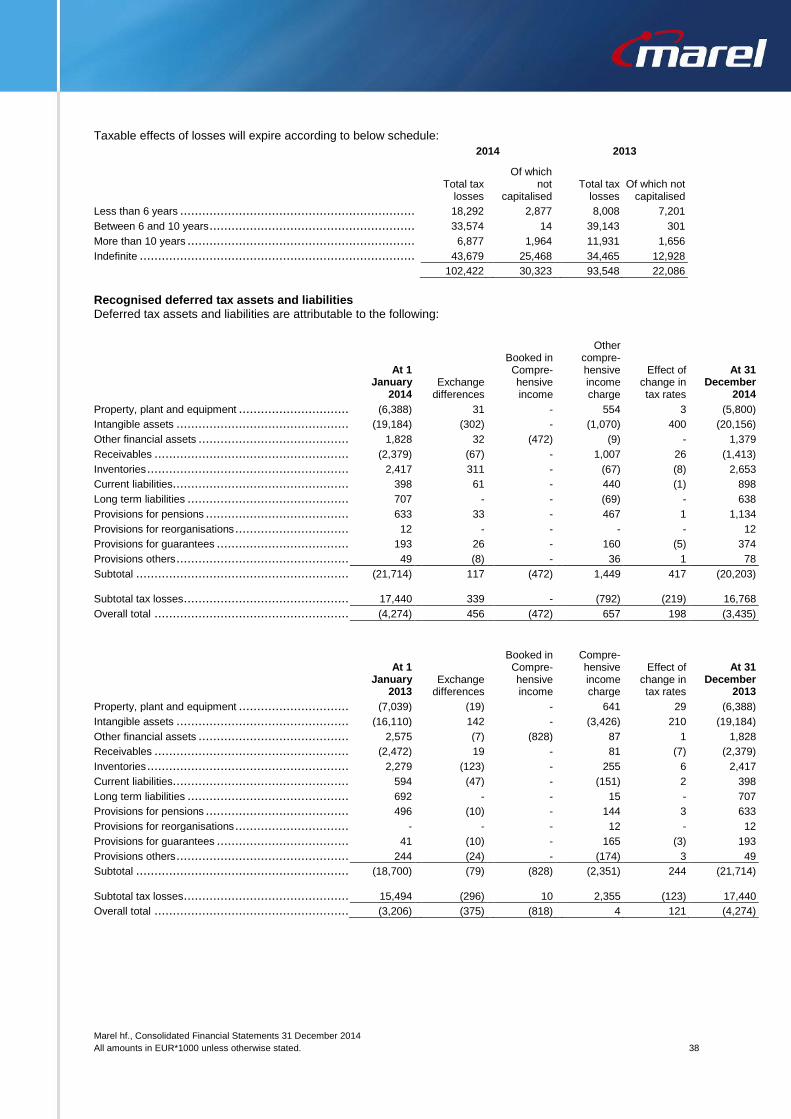
Marel hf., Consolidated Financial Statements 31 December 2014
All amounts in EUR*1000 unless otherwise stated. 38
Taxable effects of losses will expire according to below schedule:
2014 2013
Total tax
losses
Of which not
capitalised Total tax
losses Of which not
capitalised
Less than 6 years ................................................................................................................................................................................................. 18,292 2,877 8,008 7,201
Between 6 and 10 years ......................................................................................................................................................................................... 33,574 14 39,143 301
More than 10 years ............................................................................................................................................................................................... 6,877 1,964 11,931 1,656
Indefinite ............................................................................................................................................................................................................ 43,679 25,468 34,465 12,928
102,422 30,323 93,548 22,086
Recognised deferred tax assets and liabilities
Deferred tax assets and liabilities are attributable to the following:
At 1 January
2014 Exchange
differences
Booked in Compre- hensive income
Other compre- hensive income charge
Effect of change in tax rates
At 31 December
2014
Property, plant and equipment ................................................................................................................................................................................. (6,388) 31 - 554 3 (5,800)
Intangible assets .................................................................................................................................................................................................. (19,184) (302) - (1,070) 400 (20,156)
Other financial assets ............................................................................................................................................................................................ 1,828 32 (472) (9) - 1,379
Receivables ........................................................................................................................................................................................................ (2,379) (67) - 1,007 26 (1,413)
Inventories .......................................................................................................................................................................................................... 2,417 311 - (67) (8) 2,653
Current liabilities................................................................................................................................................................................................... 398 61 - 440 (1) 898
Long term liabilities ............................................................................................................................................................................................... 707 - - (69) - 638
Provisions for pensions .......................................................................................................................................................................................... 633 33 - 467 1 1,134
Provisions for reorganisations .................................................................................................................................................................................. 12 - - - - 12
Provisions for guarantees ....................................................................................................................................................................................... 193 26 - 160 (5) 374
Provisions others .................................................................................................................................................................................................. 49 (8) - 36 1 78
Subtotal ............................................................................................................................................................................................................. (21,714) 117 (472) 1,449 417 (20,203)
Subtotal tax losses ................................................................................................................................................................................................ 17,440 339 - (792) (219) 16,768
Overall total ........................................................................................................................................................................................................ (4,274) 456 (472) 657 198 (3,435)
At 1 January
2013 Exchange
differences
Booked in Compre- hensive income
Compre- hensive income charge
Effect of change in tax rates
At 31 December
2013
Property, plant and equipment ................................................................................................................................................................................. (7,039) (19) - 641 29 (6,388)
Intangible assets .................................................................................................................................................................................................. (16,110) 142 - (3,426) 210 (19,184)
Other financial assets ............................................................................................................................................................................................ 2,575 (7) (828) 87 1 1,828
Receivables ........................................................................................................................................................................................................ (2,472) 19 - 81 (7) (2,379)
Inventories .......................................................................................................................................................................................................... 2,279 (123) - 255 6 2,417
Current liabilities................................................................................................................................................................................................... 594 (47) - (151) 2 398
Long term liabilities ............................................................................................................................................................................................... 692 - - 15 - 707
Provisions for pensions .......................................................................................................................................................................................... 496 (10) - 144 3 633
Provisions for reorganisations .................................................................................................................................................................................. - - - 12 - 12
Provisions for guarantees ....................................................................................................................................................................................... 41 (10) - 165 (3) 193
Provisions others .................................................................................................................................................................................................. 244 (24) - (174) 3 49
Subtotal ............................................................................................................................................................................................................. (18,700) (79) (828) (2,351) 244 (21,714)
Subtotal tax losses ................................................................................................................................................................................................ 15,494 (296) 10 2,355 (123) 17,440
Overall total ........................................................................................................................................................................................................ (3,206) (375) -
(818) -
4 121 (4,274)
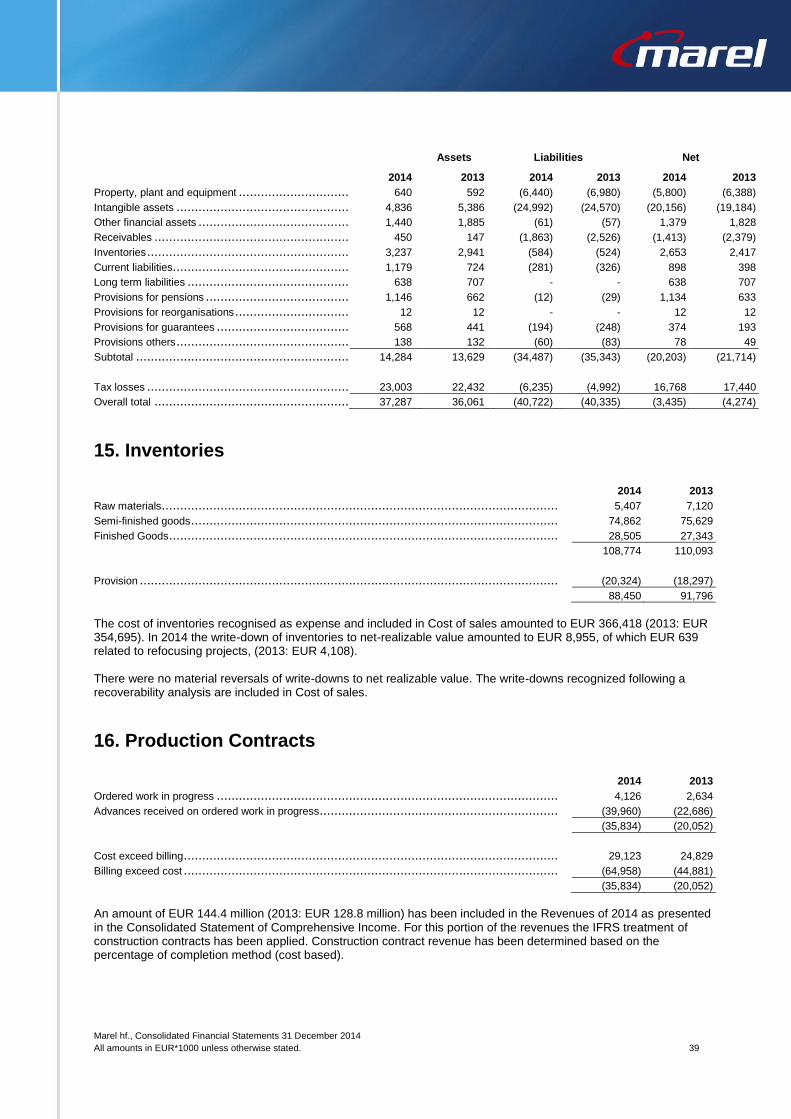
Marel hf., Consolidated Financial Statements 31 December 2014
All amounts in EUR*1000 unless otherwise stated. 39
Assets Liabilities Net
2014 2013 2014 2013 2014 2013
Property, plant and equipment ................................................................................................................................................................................. 640 592 (6,440) (6,980) (5,800) (6,388)
Intangible assets .................................................................................................................................................................................................. 4,836 5,386 (24,992) (24,570) (20,156) (19,184)
Other financial assets ............................................................................................................................................................................................ 1,440 1,885 (61) (57) 1,379 1,828
Receivables ........................................................................................................................................................................................................ 450 147 (1,863) (2,526) (1,413) (2,379)
Inventories .......................................................................................................................................................................................................... 3,237 2,941 (584) (524) 2,653 2,417
Current liabilities................................................................................................................................................................................................... 1,179 724 (281) (326) 898 398
Long term liabilities ............................................................................................................................................................................................... 638 707 - - 638 707
Provisions for pensions .......................................................................................................................................................................................... 1,146 662 (12) (29) 1,134 633
Provisions for reorganisations .................................................................................................................................................................................. 12 12 - - 12 12
Provisions for guarantees ....................................................................................................................................................................................... 568 441 (194) (248) 374 193
Provisions others .................................................................................................................................................................................................. 138 132 (60) (83) 78 49
Subtotal ............................................................................................................................................................................................................. 14,284 13,629 (34,487) (35,343) (20,203) (21,714)
Tax losses .......................................................................................................................................................................................................... 23,003 22,432 (6,235) (4,992) 16,768 17,440
Overall total ........................................................................................................................................................................................................ 37,287 36,061 (40,722) (40,335) (3,435) (4,274)
15. Inventories 2014 2013
Raw materials ...................................................................................................................................................................................................... 5,407 7,120
Semi-finished goods .............................................................................................................................................................................................. 74,862 75,629
Finished Goods .................................................................................................................................................................................................... 28,505 27,343
108,774 110,093
Provision ............................................................................................................................................................................................................ (20,324) (18,297)
88,450 91,796
The cost of inventories recognised as expense and included in Cost of sales amounted to EUR 366,418 (2013: EUR 354,695). In 2014 the write-down of inventories to net-realizable value amounted to EUR 8,955, of which EUR 639 related to refocusing projects, (2013: EUR 4,108). There were no material reversals of write-downs to net realizable value. The write-downs recognized following a recoverability analysis are included in Cost of sales.
16. Production Contracts 2014 2013
Ordered work in progress ....................................................................................................................................................................................... 4,126 2,634
Advances received on ordered work in progress ........................................................................................................................................................... (39,960) (22,686)
(35,834) (20,052)
Cost exceed billing ................................................................................................................................................................................................ 29,123 24,829
Billing exceed cost ................................................................................................................................................................................................ (64,958) (44,881)
(35,834) (20,052)
An amount of EUR 144.4 million (2013: EUR 128.8 million) has been included in the Revenues of 2014 as presented in the Consolidated Statement of Comprehensive Income. For this portion of the revenues the IFRS treatment of construction contracts has been applied. Construction contract revenue has been determined based on the percentage of completion method (cost based).
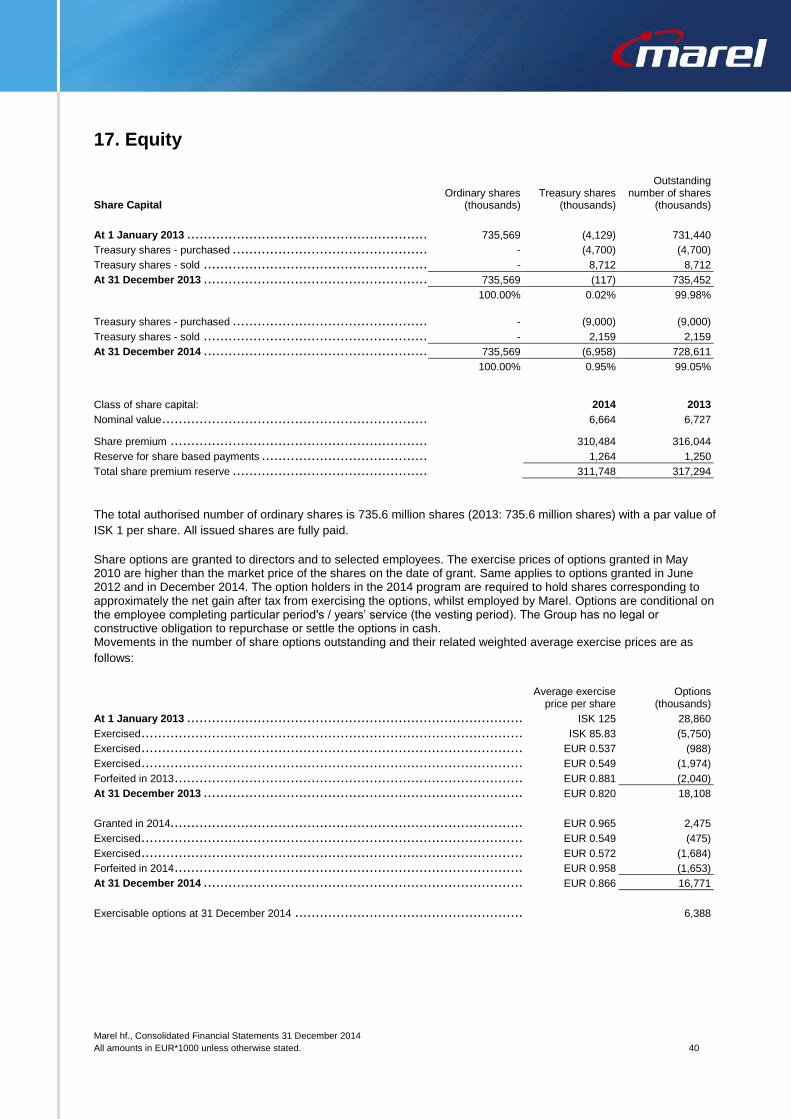
Marel hf., Consolidated Financial Statements 31 December 2014
All amounts in EUR*1000 unless otherwise stated. 40
17. Equity
Share Capital Ordinary shares
(thousands) Treasury shares
(thousands)
Outstanding number of shares
(thousands)
At 1 January 2013 ......................................................................................................................................................................... 735,569 (4,129) 731,440
Treasury shares - purchased .............................................................................................................................................................. - (4,700) (4,700)
Treasury shares - sold ..................................................................................................................................................................... - 8,712 8,712
At 31 December 2013 ..................................................................................................................................................................... 735,569 (117) 735,452
100.00% 0.02% 99.98%
Treasury shares - purchased .............................................................................................................................................................. - (9,000) (9,000)
Treasury shares - sold ..................................................................................................................................................................... - 2,159 2,159
At 31 December 2014 ..................................................................................................................................................................... 735,569 (6,958) 728,611
100.00% 0.95% 99.05%
Class of share capital: 2014 2013
Nominal value ............................................................................................................................................................................... 6,664 6,727 Share premium ............................................................................................................................................................................. 310,484 316,044
Reserve for share based payments ....................................................................................................................................................... 1,264 1,250
Total share premium reserve .............................................................................................................................................................. 311,748 317,294
The total authorised number of ordinary shares is 735.6 million shares (2013: 735.6 million shares) with a par value of
ISK 1 per share. All issued shares are fully paid.
Share options are granted to directors and to selected employees. The exercise prices of options granted in May 2010 are higher than the market price of the shares on the date of grant. Same applies to options granted in June 2012 and in December 2014. The option holders in the 2014 program are required to hold shares corresponding to approximately the net gain after tax from exercising the options, whilst employed by Marel. Options are conditional on the employee completing particular period's / years’ service (the vesting period). The Group has no legal or constructive obligation to repurchase or settle the options in cash. Movements in the number of share options outstanding and their related weighted average exercise prices are as
follows:
Average exercise
price per share Options
(thousands)
At 1 January 2013 ......................................................................................................................................................................... ISK 125 28,860
Exercised .................................................................................................................................................................................... ISK 85.83 (5,750)
Exercised .................................................................................................................................................................................... EUR 0.537 (988)
Exercised .................................................................................................................................................................................... EUR 0.549 (1,974)
Forfeited in 2013 ............................................................................................................................................................................ EUR 0.881 (2,040)
At 31 December 2013 ..................................................................................................................................................................... EUR 0.820 18,108
Granted in 2014............................................................................................................................................................................. EUR 0.965 2,475
Exercised .................................................................................................................................................................................... EUR 0.549 (475)
Exercised .................................................................................................................................................................................... EUR 0.572 (1,684)
Forfeited in 2014 ............................................................................................................................................................................ EUR 0.958 (1,653)
At 31 December 2014 ..................................................................................................................................................................... EUR 0.866 16,771
Exercisable options at 31 December 2014 ............................................................................................................................................... 6,388
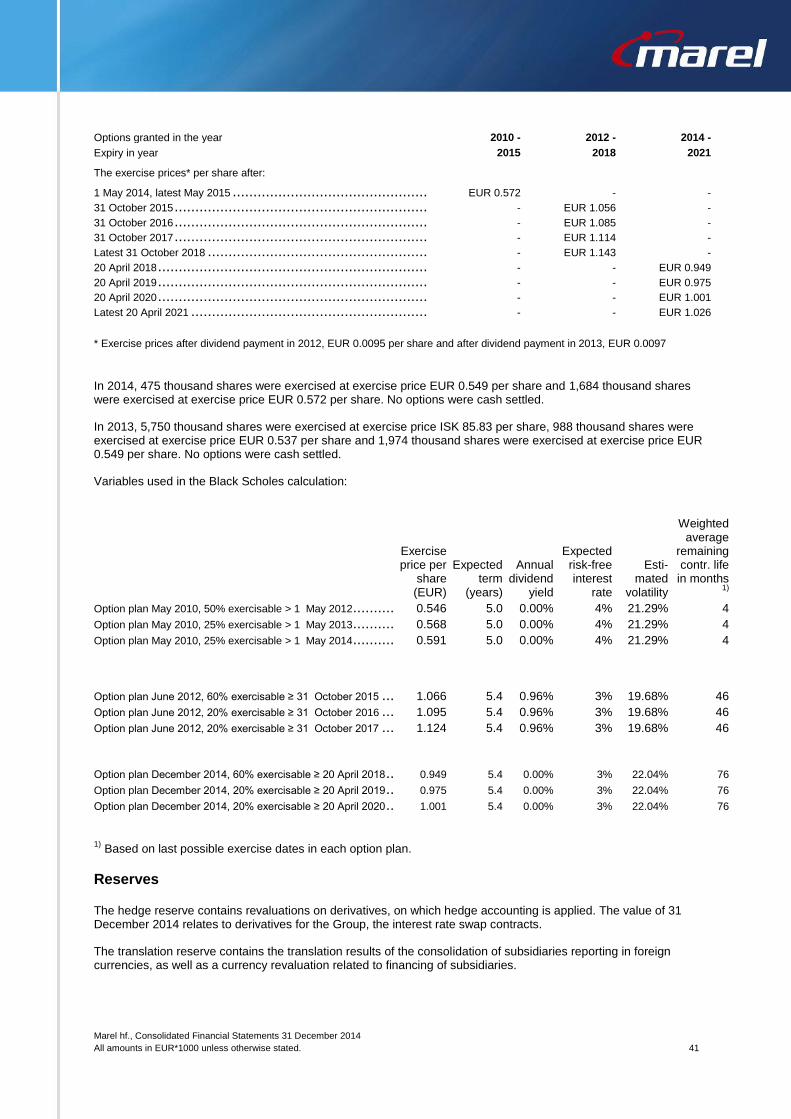
Marel hf., Consolidated Financial Statements 31 December 2014
All amounts in EUR*1000 unless otherwise stated. 41
Options granted in the year 2010 - 2012 - 2014 -
Expiry in year 2015 2018 2021
The exercise prices* per share after:
1 May 2014, latest May 2015 .............................................................................................................................................................. EUR 0.572 - -
31 October 2015 ............................................................................................................................................................................ - EUR 1.056 -
31 October 2016 ............................................................................................................................................................................ - EUR 1.085 -
31 October 2017 ............................................................................................................................................................................ - EUR 1.114 -
Latest 31 October 2018 .................................................................................................................................................................... - EUR 1.143 -
20 April 2018 ................................................................................................................................................................................ - - EUR 0.949
20 April 2019 ................................................................................................................................................................................ - - EUR 0.975
20 April 2020 ................................................................................................................................................................................ - - EUR 1.001
Latest 20 April 2021 ........................................................................................................................................................................ - - EUR 1.026
* Exercise prices after dividend payment in 2012, EUR 0.0095 per share and after dividend payment in 2013, EUR 0.0097
In 2014, 475 thousand shares were exercised at exercise price EUR 0.549 per share and 1,684 thousand shares were exercised at exercise price EUR 0.572 per share. No options were cash settled.
In 2013, 5,750 thousand shares were exercised at exercise price ISK 85.83 per share, 988 thousand shares were exercised at exercise price EUR 0.537 per share and 1,974 thousand shares were exercised at exercise price EUR 0.549 per share. No options were cash settled.
Variables used in the Black Scholes calculation:
Exercise price per
share (EUR)
Expected term
(years)
Annual dividend
yield
Expected risk-free interest
rate
Esti- mated
volatility
Weighted average
remaining contr. life
in months 1)
Option plan May 2010, 50% exercisable > 1 May 2012 ................................................................................................................................. 0.546 5.0 0.00% 4% 21.29% 4
Option plan May 2010, 25% exercisable > 1 May 2013 ................................................................................................................................. 0.568 5.0 0.00% 4% 21.29% 4
Option plan May 2010, 25% exercisable > 1 May 2014 ................................................................................................................................. 0.591 5.0 0.00% 4% 21.29% 4
Option plan June 2012, 60% exercisable ≥ 31 October 2015 .......................................................................................................................... 1.066 5.4 0.96% 3% 19.68% 46
Option plan June 2012, 20% exercisable ≥ 31 October 2016 .......................................................................................................................... 1.095 5.4 0.96% 3% 19.68% 46
Option plan June 2012, 20% exercisable ≥ 31 October 2017 .......................................................................................................................... 1.124 5.4 0.96% 3% 19.68% 46
Option plan December 2014, 60% exercisable ≥ 20 April 2018 ......................................................................................................................... 0.949 5.4 0.00% 3% 22.04% 76
Option plan December 2014, 20% exercisable ≥ 20 April 2019 ......................................................................................................................... 0.975 5.4 0.00% 3% 22.04% 76
Option plan December 2014, 20% exercisable ≥ 20 April 2020 ......................................................................................................................... 1.001 5.4 0.00% 3% 22.04% 76
1) Based on last possible exercise dates in each option plan.
Reserves
The hedge reserve contains revaluations on derivatives, on which hedge accounting is applied. The value of 31 December 2014 relates to derivatives for the Group, the interest rate swap contracts.
The translation reserve contains the translation results of the consolidation of subsidiaries reporting in foreign currencies, as well as a currency revaluation related to financing of subsidiaries.
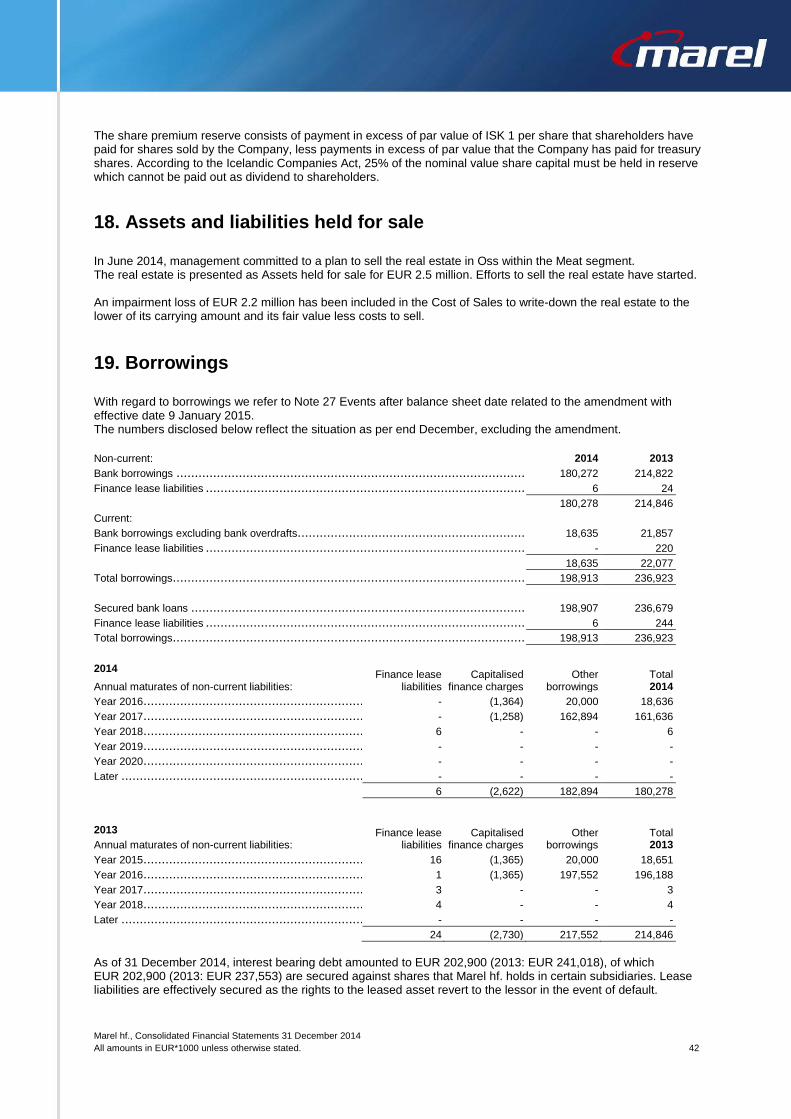
Marel hf., Consolidated Financial Statements 31 December 2014
All amounts in EUR*1000 unless otherwise stated. 42
The share premium reserve consists of payment in excess of par value of ISK 1 per share that shareholders have paid for shares sold by the Company, less payments in excess of par value that the Company has paid for treasury shares. According to the Icelandic Companies Act, 25% of the nominal value share capital must be held in reserve which cannot be paid out as dividend to shareholders.
18. Assets and liabilities held for sale In June 2014, management committed to a plan to sell the real estate in Oss within the Meat segment. The real estate is presented as Assets held for sale for EUR 2.5 million. Efforts to sell the real estate have started. An impairment loss of EUR 2.2 million has been included in the Cost of Sales to write-down the real estate to the lower of its carrying amount and its fair value less costs to sell.
19. Borrowings With regard to borrowings we refer to Note 27 Events after balance sheet date related to the amendment with effective date 9 January 2015. The numbers disclosed below reflect the situation as per end December, excluding the amendment.
Non-current: 2014 2013
Bank borrowings .................................................................................................................................................................................................. 180,272 214,822
Finance lease liabilities .......................................................................................................................................................................................... 6 24
180,278 214,846
Current: Bank borrowings excluding bank overdrafts................................................................................................................................................................. 18,635 21,857
Finance lease liabilities .......................................................................................................................................................................................... - 220
18,635 22,077
Total borrowings................................................................................................................................................................................................... 198,913 236,923
Secured bank loans .............................................................................................................................................................................................. 198,907 236,679
Finance lease liabilities .......................................................................................................................................................................................... 6 244
Total borrowings................................................................................................................................................................................................... 198,913 236,923
2014 Finance lease
liabilities Capitalised
finance charges Other
borrowings Total 2014 Annual maturates of non-current liabilities:
Year 2016 ........................................................................................................................................................................................................... - (1,364) 20,000 18,636
Year 2017 ........................................................................................................................................................................................................... - (1,258) 162,894 161,636
Year 2018 ........................................................................................................................................................................................................... 6 - - 6
Year 2019 ........................................................................................................................................................................................................... - - - -
Year 2020 ........................................................................................................................................................................................................... - - - -
Later ................................................................................................................................................................................................................. - - - -
6 (2,622) 182,894 180,278
2013 Finance lease liabilities
Capitalised finance charges
Other borrowings
Total 2013 Annual maturates of non-current liabilities:
Year 2015 ........................................................................................................................................................................................................... 16 (1,365) 20,000 18,651
Year 2016 ........................................................................................................................................................................................................... 1 (1,365) 197,552 196,188
Year 2017 ........................................................................................................................................................................................................... 3 - - 3
Year 2018 ........................................................................................................................................................................................................... 4 - - 4
Later ................................................................................................................................................................................................................. - - - -
24 (2,730) 217,552 214,846
As of 31 December 2014, interest bearing debt amounted to EUR 202,900 (2013: EUR 241,018), of which EUR 202,900 (2013: EUR 237,553) are secured against shares that Marel hf. holds in certain subsidiaries. Lease liabilities are effectively secured as the rights to the leased asset revert to the lessor in the event of default.
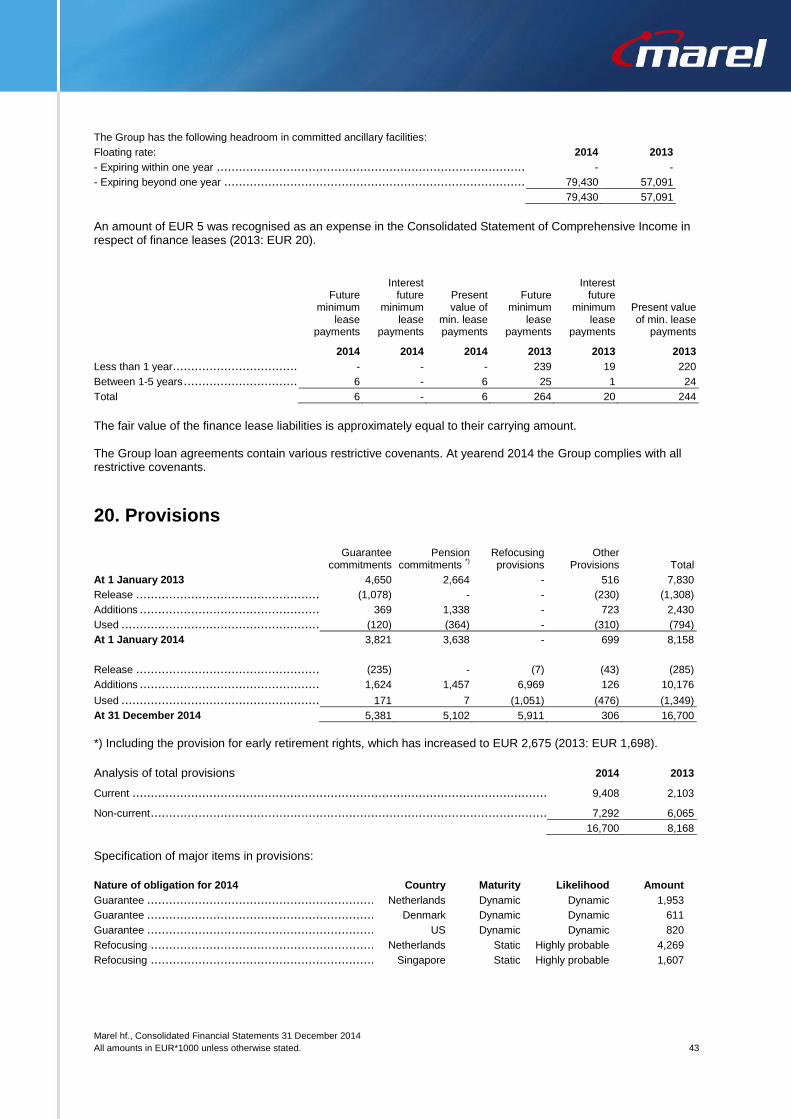
Marel hf., Consolidated Financial Statements 31 December 2014
All amounts in EUR*1000 unless otherwise stated. 43
The Group has the following headroom in committed ancillary facilities:
Floating rate: 2014 2013
- Expiring within one year ....................................................................................................................................................................................... - -
- Expiring beyond one year ..................................................................................................................................................................................... 79,430 57,091
79,430 57,091
An amount of EUR 5 was recognised as an expense in the Consolidated Statement of Comprehensive Income in respect of finance leases (2013: EUR 20).
Future minimum
lease payments
Interest future
minimum lease
payments
Present value of
min. lease payments
Future minimum
lease payments
Interest future
minimum lease
payments
Present value of min. lease
payments
2014 2014 2014 2013 2013 2013
Less than 1 year................................................................................................................................................................................................... - - - 239 19 220
Between 1-5 years ................................................................................................................................................................................................ 6 - 6 25 1 24
Total 6 - 6 264 20 244
The fair value of the finance lease liabilities is approximately equal to their carrying amount. The Group loan agreements contain various restrictive covenants. At yearend 2014 the Group complies with all restrictive covenants.
20. Provisions
Guarantee
commitments Pension
commitments *)
Refocusing provisions
Other Provisions
Total
At 1 January 2013 4,650 2,664 - 516 7,830 Release ............................................................................................................................................................................................................. (1,078) - - (230) (1,308) Additions ............................................................................................................................................................................................................ 369 1,338 - 723 2,430 Used ................................................................................................................................................................................................................. (120) (364) - (310) (794) At 1 January 2014 3,821 3,638 - 699 8,158
Release ............................................................................................................................................................................................................. (235) - (7) (43) (285) Additions ............................................................................................................................................................................................................ 1,624 1,457 6,969 126 10,176
Used ................................................................................................................................................................................................................. 171 7 (1,051) (476) (1,349)
At 31 December 2014 5,381 5,102 5,911 306 16,700
*) Including the provision for early retirement rights, which has increased to EUR 2,675 (2013: EUR 1,698).
Analysis of total provisions 2014 2013
Current .............................................................................................................................................................................................................. 9,408 2,103
Non-current ......................................................................................................................................................................................................... 7,292 6,065
16,700 8,168
Specification of major items in provisions:
Nature of obligation for 2014 Country Maturity Likelihood Amount
Guarantee .......................................................................................................................................................................................................... Netherlands Dynamic Dynamic 1,953
Guarantee .......................................................................................................................................................................................................... Denmark Dynamic Dynamic 611
Guarantee .......................................................................................................................................................................................................... US Dynamic Dynamic 820
Refocusing ......................................................................................................................................................................................................... Netherlands Static Highly probable 4,269
Refocusing ......................................................................................................................................................................................................... Singapore Static Highly probable 1,607
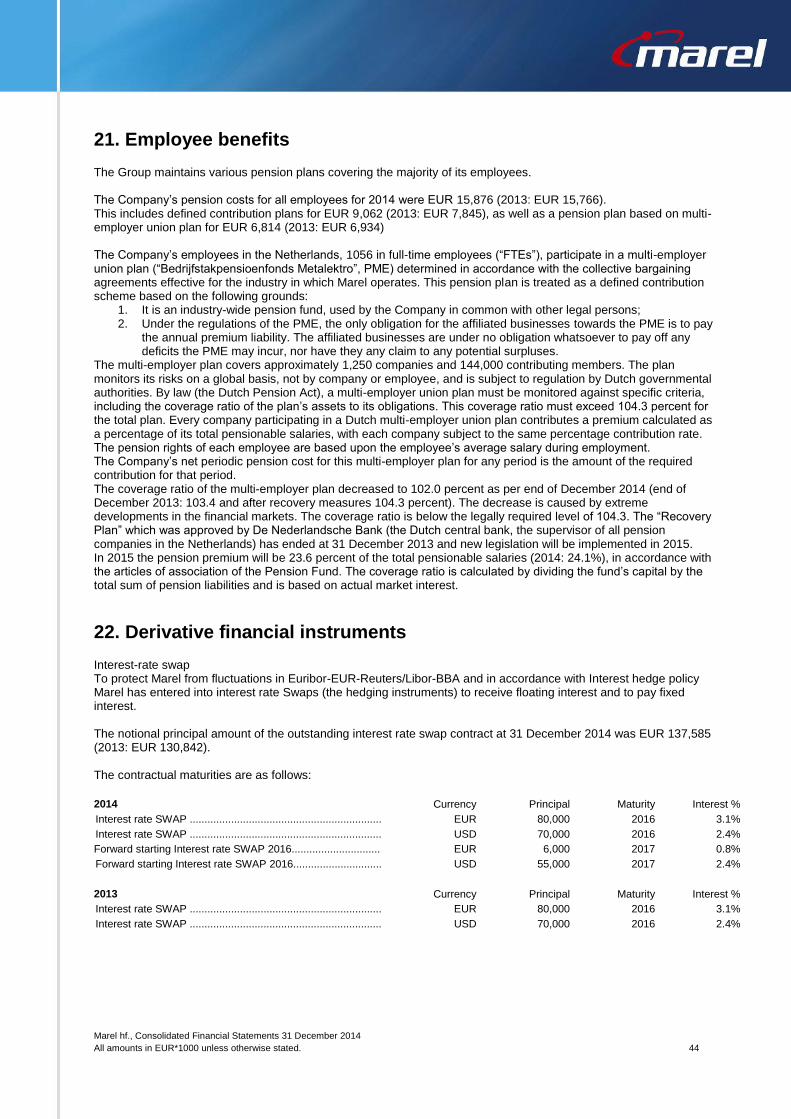
Marel hf., Consolidated Financial Statements 31 December 2014
All amounts in EUR*1000 unless otherwise stated. 44
21. Employee benefits The Group maintains various pension plans covering the majority of its employees. The Company’s pension costs for all employees for 2014 were EUR 15,876 (2013: EUR 15,766). This includes defined contribution plans for EUR 9,062 (2013: EUR 7,845), as well as a pension plan based on multi-employer union plan for EUR 6,814 (2013: EUR 6,934) The Company’s employees in the Netherlands, 1056 in full-time employees (“FTEs”), participate in a multi-employer union plan (“Bedrijfstakpensioenfonds Metalektro”, PME) determined in accordance with the collective bargaining agreements effective for the industry in which Marel operates. This pension plan is treated as a defined contribution scheme based on the following grounds:
1. It is an industry-wide pension fund, used by the Company in common with other legal persons; 2. Under the regulations of the PME, the only obligation for the affiliated businesses towards the PME is to pay
the annual premium liability. The affiliated businesses are under no obligation whatsoever to pay off any deficits the PME may incur, nor have they any claim to any potential surpluses.
The multi-employer plan covers approximately 1,250 companies and 144,000 contributing members. The plan monitors its risks on a global basis, not by company or employee, and is subject to regulation by Dutch governmental authorities. By law (the Dutch Pension Act), a multi-employer union plan must be monitored against specific criteria, including the coverage ratio of the plan’s assets to its obligations. This coverage ratio must exceed 104.3 percent for the total plan. Every company participating in a Dutch multi-employer union plan contributes a premium calculated as a percentage of its total pensionable salaries, with each company subject to the same percentage contribution rate. The pension rights of each employee are based upon the employee’s average salary during employment. The Company’s net periodic pension cost for this multi-employer plan for any period is the amount of the required contribution for that period. The coverage ratio of the multi-employer plan decreased to 102.0 percent as per end of December 2014 (end of December 2013: 103.4 and after recovery measures 104.3 percent). The decrease is caused by extreme developments in the financial markets. The coverage ratio is below the legally required level of 104.3. The “Recovery Plan” which was approved by De Nederlandsche Bank (the Dutch central bank, the supervisor of all pension companies in the Netherlands) has ended at 31 December 2013 and new legislation will be implemented in 2015. In 2015 the pension premium will be 23.6 percent of the total pensionable salaries (2014: 24.1%), in accordance with the articles of association of the Pension Fund. The coverage ratio is calculated by dividing the fund’s capital by the total sum of pension liabilities and is based on actual market interest.
22. Derivative financial instruments Interest-rate swap To protect Marel from fluctuations in Euribor-EUR-Reuters/Libor-BBA and in accordance with Interest hedge policy Marel has entered into interest rate Swaps (the hedging instruments) to receive floating interest and to pay fixed interest. The notional principal amount of the outstanding interest rate swap contract at 31 December 2014 was EUR 137,585 (2013: EUR 130,842). The contractual maturities are as follows:
2014
Currency
Principal
Maturity
Interest %
Interest rate SWAP .................................................................
EUR
80,000
2016
3.1%
Interest rate SWAP .................................................................
USD
70,000
2016
2.4%
Forward starting Interest rate SWAP 2016.............................. EUR 6,000 2017 0.8%
Forward starting Interest rate SWAP 2016..............................
USD
55,000
2017
2.4%
2013
Currency
Principal
Maturity
Interest %
Interest rate SWAP .................................................................
EUR
80,000
2016
3.1%
Interest rate SWAP .................................................................
USD
70,000
2016
2.4%
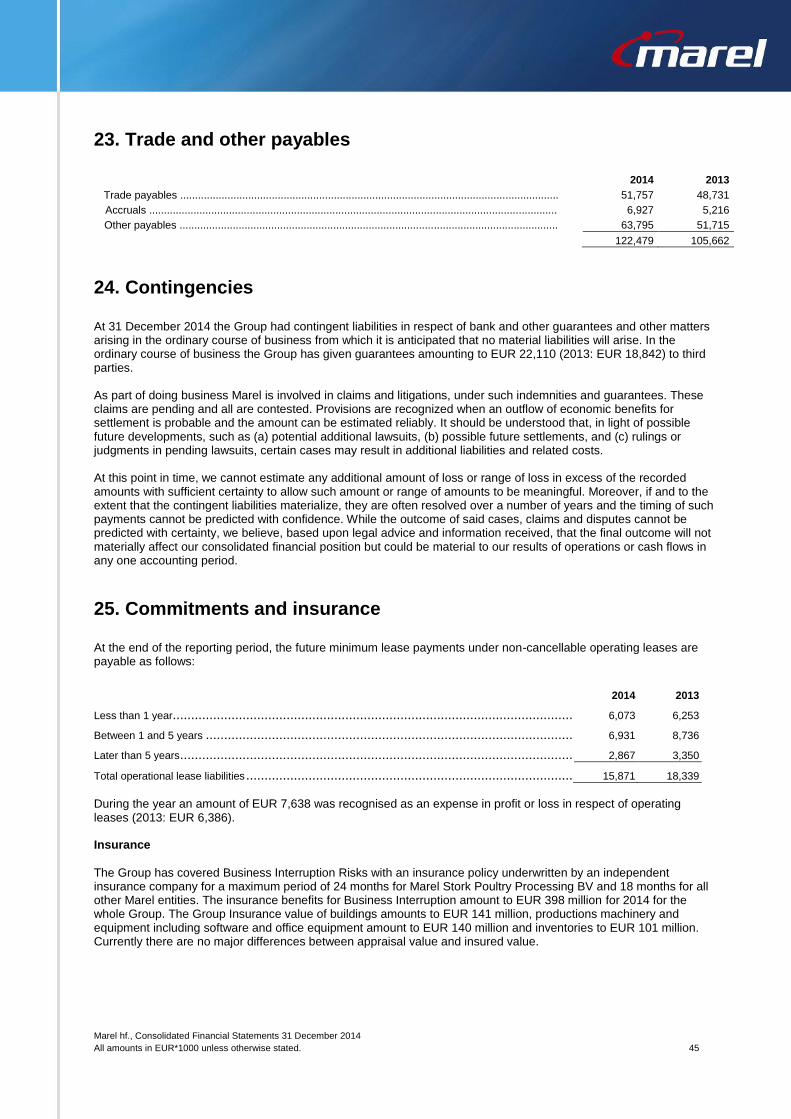
Marel hf., Consolidated Financial Statements 31 December 2014
All amounts in EUR*1000 unless otherwise stated. 45
23. Trade and other payables
2014 2013
Trade payables ................................................................................................................................
51,757 48,731
Accruals ..........................................................................................................................................
6,927 5,216
Other payables ................................................................................................................................
63,795 51,715
122,479 105,662
24. Contingencies At 31 December 2014 the Group had contingent liabilities in respect of bank and other guarantees and other matters arising in the ordinary course of business from which it is anticipated that no material liabilities will arise. In the ordinary course of business the Group has given guarantees amounting to EUR 22,110 (2013: EUR 18,842) to third parties.
As part of doing business Marel is involved in claims and litigations, under such indemnities and guarantees. These claims are pending and all are contested. Provisions are recognized when an outflow of economic benefits for settlement is probable and the amount can be estimated reliably. It should be understood that, in light of possible future developments, such as (a) potential additional lawsuits, (b) possible future settlements, and (c) rulings or judgments in pending lawsuits, certain cases may result in additional liabilities and related costs. At this point in time, we cannot estimate any additional amount of loss or range of loss in excess of the recorded amounts with sufficient certainty to allow such amount or range of amounts to be meaningful. Moreover, if and to the extent that the contingent liabilities materialize, they are often resolved over a number of years and the timing of such payments cannot be predicted with confidence. While the outcome of said cases, claims and disputes cannot be predicted with certainty, we believe, based upon legal advice and information received, that the final outcome will not materially affect our consolidated financial position but could be material to our results of operations or cash flows in any one accounting period.
25. Commitments and insurance At the end of the reporting period, the future minimum lease payments under non-cancellable operating leases are payable as follows:
2014 2013
Less than 1 year................................................................................................................................................................................................... 6,073 6,253
Between 1 and 5 years .......................................................................................................................................................................................... 6,931 8,736
Later than 5 years ................................................................................................................................................................................................. 2,867 3,350
Total operational lease liabilities ............................................................................................................................................................................... 15,871 18,339
During the year an amount of EUR 7,638 was recognised as an expense in profit or loss in respect of operating leases (2013: EUR 6,386). Insurance
The Group has covered Business Interruption Risks with an insurance policy underwritten by an independent insurance company for a maximum period of 24 months for Marel Stork Poultry Processing BV and 18 months for all other Marel entities. The insurance benefits for Business Interruption amount to EUR 398 million for 2014 for the whole Group. The Group Insurance value of buildings amounts to EUR 141 million, productions machinery and equipment including software and office equipment amount to EUR 140 million and inventories to EUR 101 million. Currently there are no major differences between appraisal value and insured value.
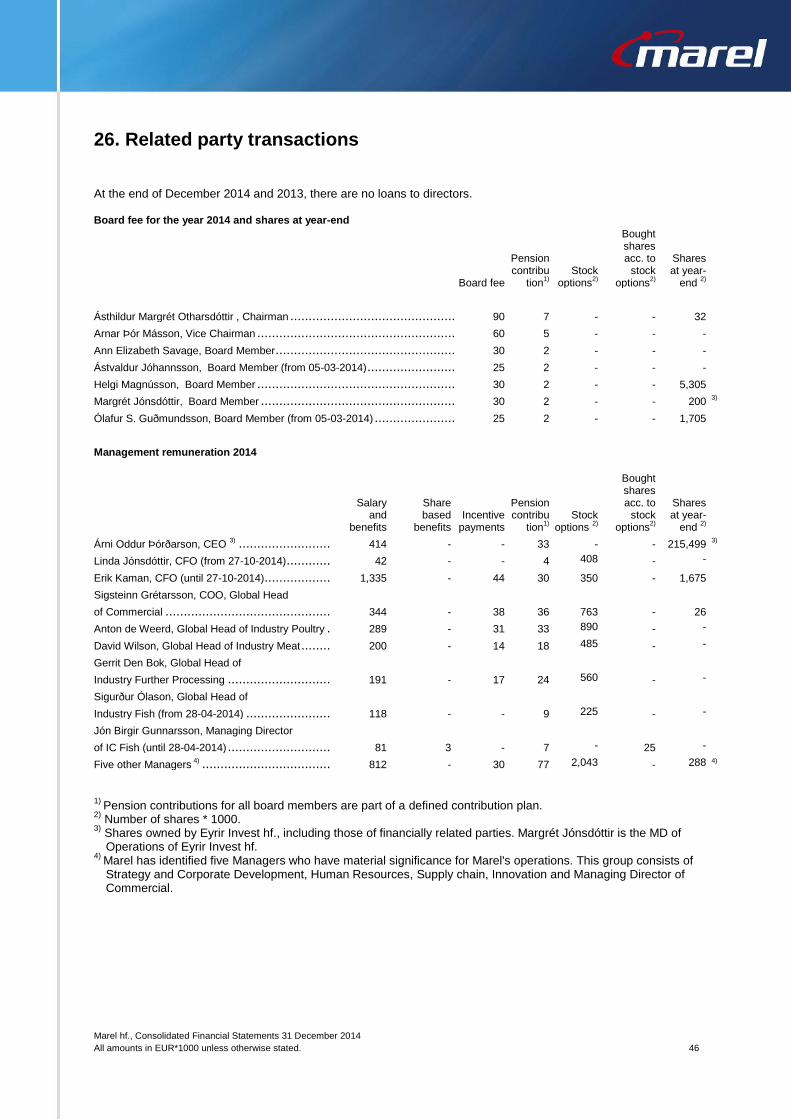
Marel hf., Consolidated Financial Statements 31 December 2014
All amounts in EUR*1000 unless otherwise stated. 46
26. Related party transactions At the end of December 2014 and 2013, there are no loans to directors. Board fee for the year 2014 and shares at year-end
Board fee
Pension contribu
tion1)
Stock options
2)
Bought shares acc. to
stock options
2)
Shares at year-
end 2)
Ásthildur Margrét Otharsdóttir , Chairman ................................................................................................................................................................... 90 7 - - 32
Arnar Þór Másson, Vice Chairman ............................................................................................................................................................................ 60 5 - - -
Ann Elizabeth Savage, Board Member ....................................................................................................................................................................... 30 2 - - -
Ástvaldur Jóhannsson, Board Member (from 05-03-2014) .............................................................................................................................................. 25 2 - - -
Helgi Magnússon, Board Member ............................................................................................................................................................................ 30 2 - - 5,305
Margrét Jónsdóttir, Board Member ........................................................................................................................................................................... 30 2 - - 200 3)
Ólafur S. Guðmundsson, Board Member (from 05-03-2014) ............................................................................................................................................ 25 2 - - 1,705
Management remuneration 2014
Salary and
benefits
Share based
benefits Incentive
payments
Pension contribu
tion1)
Stock options
2)
Bought shares acc. to
stock options
2)
Shares at year-
end 2)
Árni Oddur Þórðarson, CEO 3) ................................................................................................................................................................................. 414 - - 33 - - 215,499
3)
Linda Jónsdóttir, CFO (from 27-10-2014) .................................................................................................................................................................... 42 - - 4 408 - -
Erik Kaman, CFO (until 27-10-2014) .......................................................................................................................................................................... 1,335 - 44 30 350 - 1,675
Sigsteinn Grétarsson, COO, Global Head
of Commercial ..................................................................................................................................................................................................... 344 - 38 36 763 - 26
Anton de Weerd, Global Head of Industry Poultry ......................................................................................................................................................... 289 - 31 33 890 - -
David Wilson, Global Head of Industry Meat ................................................................................................................................................................ 200 - 14 18 485 - -
Gerrit Den Bok, Global Head of
Industry Further Processing .................................................................................................................................................................................... 191 - 17 24 560 - -
Sigurður Ólason, Global Head of
Industry Fish (from 28-04-2014) ............................................................................................................................................................................... 118 - - 9 225 - -
Jón Birgir Gunnarsson, Managing Director
of IC Fish (until 28-04-2014) .................................................................................................................................................................................... 81 3 - 7 - 25 -
Five other Managers 4) ........................................................................................................................................................................................... 812 - 30 77 2,043 - 288 4)
1)
Pension contributions for all board members are part of a defined contribution plan. 2)
Number of shares * 1000. 3)
Shares owned by Eyrir Invest hf., including those of financially related parties. Margrét Jónsdóttir is the MD of Operations of Eyrir Invest hf.
4) Marel has identified five Managers who have material significance for Marel's operations. This group consists of Strategy and Corporate Development, Human Resources, Supply chain, Innovation and Managing Director of Commercial.
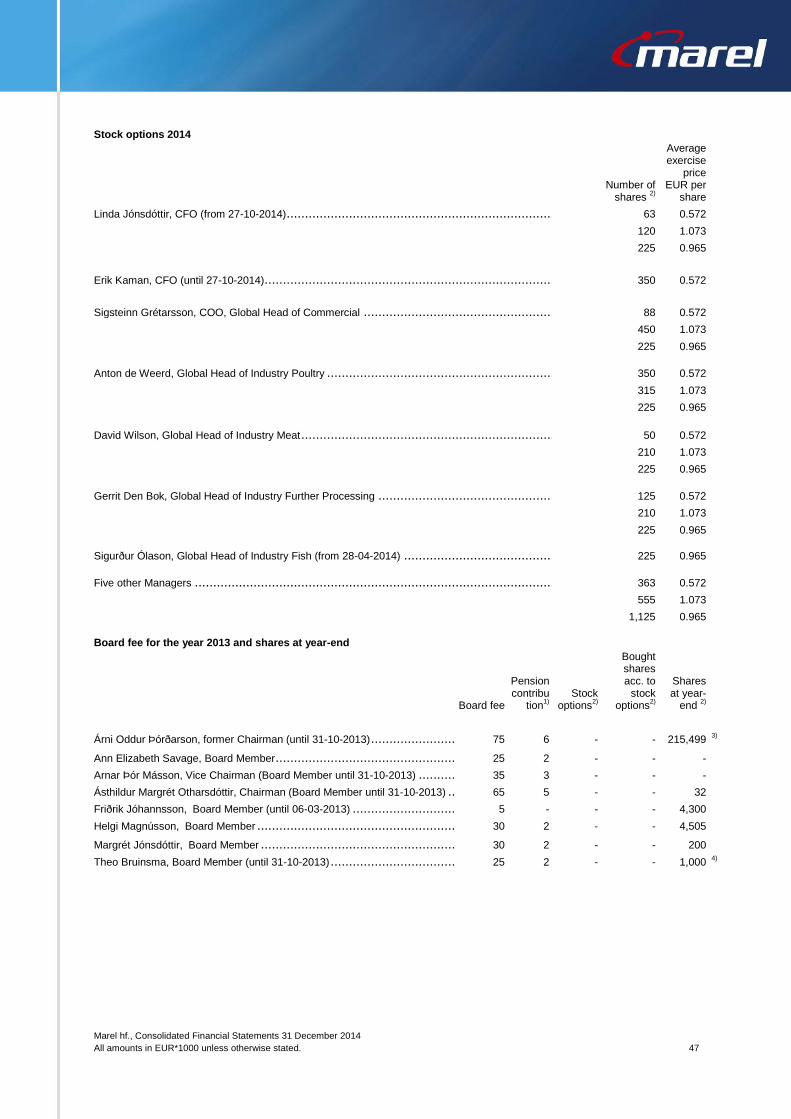
Marel hf., Consolidated Financial Statements 31 December 2014
All amounts in EUR*1000 unless otherwise stated. 47
Stock options 2014
Number of
shares 2)
Average exercise
price EUR per
share
Linda Jónsdóttir, CFO (from 27-10-2014) .................................................................................................................................................................... 63 0.572
120 1.073
225 0.965
Erik Kaman, CFO (until 27-10-2014) .......................................................................................................................................................................... 350 0.572
Sigsteinn Grétarsson, COO, Global Head of Commercial ............................................................................................................................................... 88 0.572
450 1.073
225 0.965
Anton de Weerd, Global Head of Industry Poultry ......................................................................................................................................................... 350 0.572
315 1.073
225 0.965
David Wilson, Global Head of Industry Meat ................................................................................................................................................................ 50 0.572
210 1.073
225 0.965
Gerrit Den Bok, Global Head of Industry Further Processing ........................................................................................................................................... 125 0.572
210 1.073
225 0.965
Sigurður Ólason, Global Head of Industry Fish (from 28-04-2014) .................................................................................................................................... 225 0.965
Five other Managers ............................................................................................................................................................................................. 363 0.572
555 1.073
1,125 0.965
Board fee for the year 2013 and shares at year-end
Board fee
Pension contribu
tion1)
Stock options
2)
Bought shares acc. to
stock options
2)
Shares at year-
end 2)
Árni Oddur Þórðarson, former Chairman (until 31-10-2013) ............................................................................................................................................. 75 6 - - 215,499 3)
Ann Elizabeth Savage, Board Member ....................................................................................................................................................................... 25 2 - - -
Arnar Þór Másson, Vice Chairman (Board Member until 31-10-2013) ................................................................................................................................ 35 3 - - -
Ásthildur Margrét Otharsdóttir, Chairman (Board Member until 31-10-2013) ........................................................................................................................ 65 5 - - 32
Friðrik Jóhannsson, Board Member (until 06-03-2013) .................................................................................................................................................. 5 - - - 4,300
Helgi Magnússon, Board Member ............................................................................................................................................................................ 30 2 - - 4,505
Margrét Jónsdóttir, Board Member ........................................................................................................................................................................... 30 2 - - 200
Theo Bruinsma, Board Member (until 31-10-2013) ........................................................................................................................................................ 25 2 - - 1,000 4)
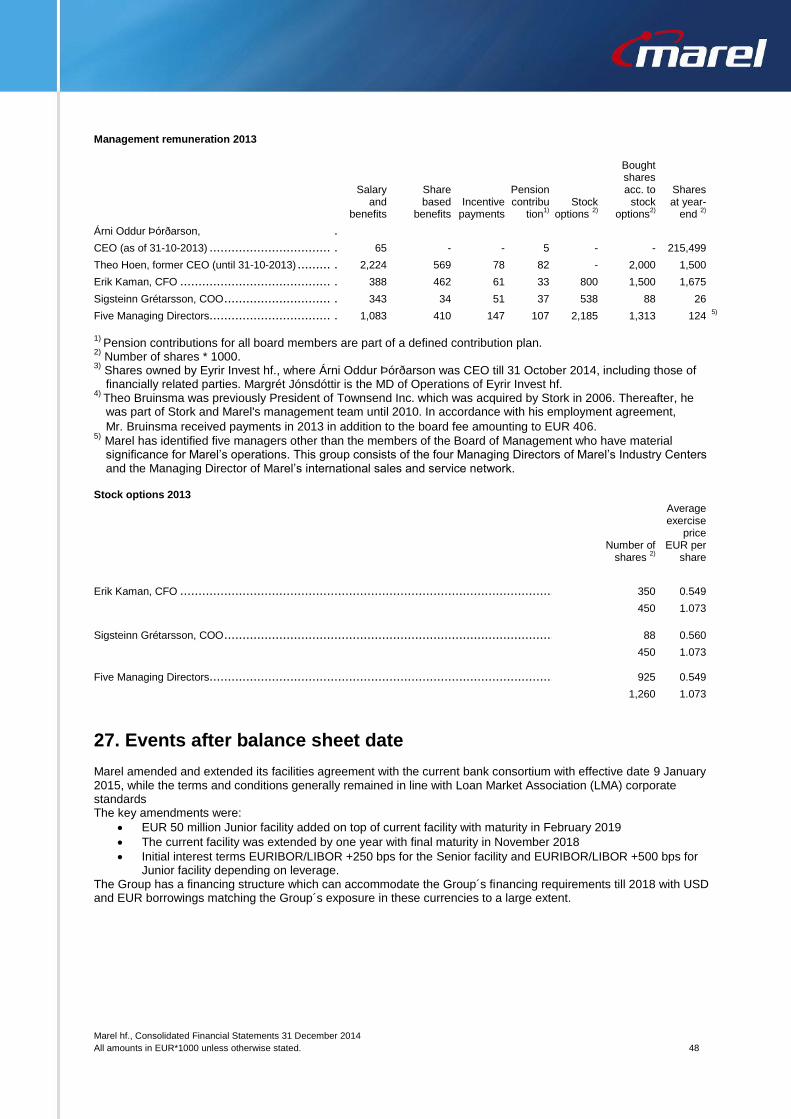
Marel hf., Consolidated Financial Statements 31 December 2014
All amounts in EUR*1000 unless otherwise stated. 48
Management remuneration 2013
Salary and
benefits
Share based
benefits Incentive
payments
Pension contribu
tion1)
Stock options
2)
Bought shares acc. to
stock options
2)
Shares at year-
end 2)
Árni Oddur Þórðarson, .........................................................................................................................................................................................................................
CEO (as of 31-10-2013) ......................................................................................................................................................................................... ......................................................................................................................................................................................................................... 65 - - 5 - - 215,499
Theo Hoen, former CEO (until 31-10-2013) ................................................................................................................................................................. ......................................................................................................................................................................................................................... 2,224 569 78 82 - 2,000 1,500
Erik Kaman, CFO ................................................................................................................................................................................................. ......................................................................................................................................................................................................................... 388 462 61 33 800 1,500 1,675
Sigsteinn Grétarsson, COO ..................................................................................................................................................................................... ......................................................................................................................................................................................................................... 343 34 51 37 538 88 26
Five Managing Directors......................................................................................................................................................................................... ......................................................................................................................................................................................................................... 1,083 410 147 107 2,185 1,313 124 5)
1)
Pension contributions for all board members are part of a defined contribution plan. 2)
Number of shares * 1000. 3)
Shares owned by Eyrir Invest hf., where Árni Oddur Þórðarson was CEO till 31 October 2014, including those of financially related parties. Margrét Jónsdóttir is the MD of Operations of Eyrir Invest hf.
4) Theo Bruinsma was previously President of Townsend Inc. which was acquired by Stork in 2006. Thereafter, he was part of Stork and Marel's management team until 2010. In accordance with his employment agreement,
Mr. Bruinsma received payments in 2013 in addition to the board fee amounting to EUR 406. 5) Marel has identified five managers other than the members of the Board of Management who have material
significance for Marel’s operations. This group consists of the four Managing Directors of Marel’s Industry Centers and the Managing Director of Marel’s international sales and service network.
Stock options 2013
Number of
shares 2)
Average exercise
price EUR per
share
Erik Kaman, CFO ................................................................................................................................................................................................. 350 0.549
450 1.073
Sigsteinn Grétarsson, COO ..................................................................................................................................................................................... 88 0.560
450 1.073
Five Managing Directors......................................................................................................................................................................................... 925 0.549
1,260 1.073
27. Events after balance sheet date
Marel amended and extended its facilities agreement with the current bank consortium with effective date 9 January 2015, while the terms and conditions generally remained in line with Loan Market Association (LMA) corporate standards The key amendments were:
EUR 50 million Junior facility added on top of current facility with maturity in February 2019
The current facility was extended by one year with final maturity in November 2018
Initial interest terms EURIBOR/LIBOR +250 bps for the Senior facility and EURIBOR/LIBOR +500 bps for Junior facility depending on leverage.
The Group has a financing structure which can accommodate the Group´s financing requirements till 2018 with USD and EUR borrowings matching the Group´s exposure in these currencies to a large extent.
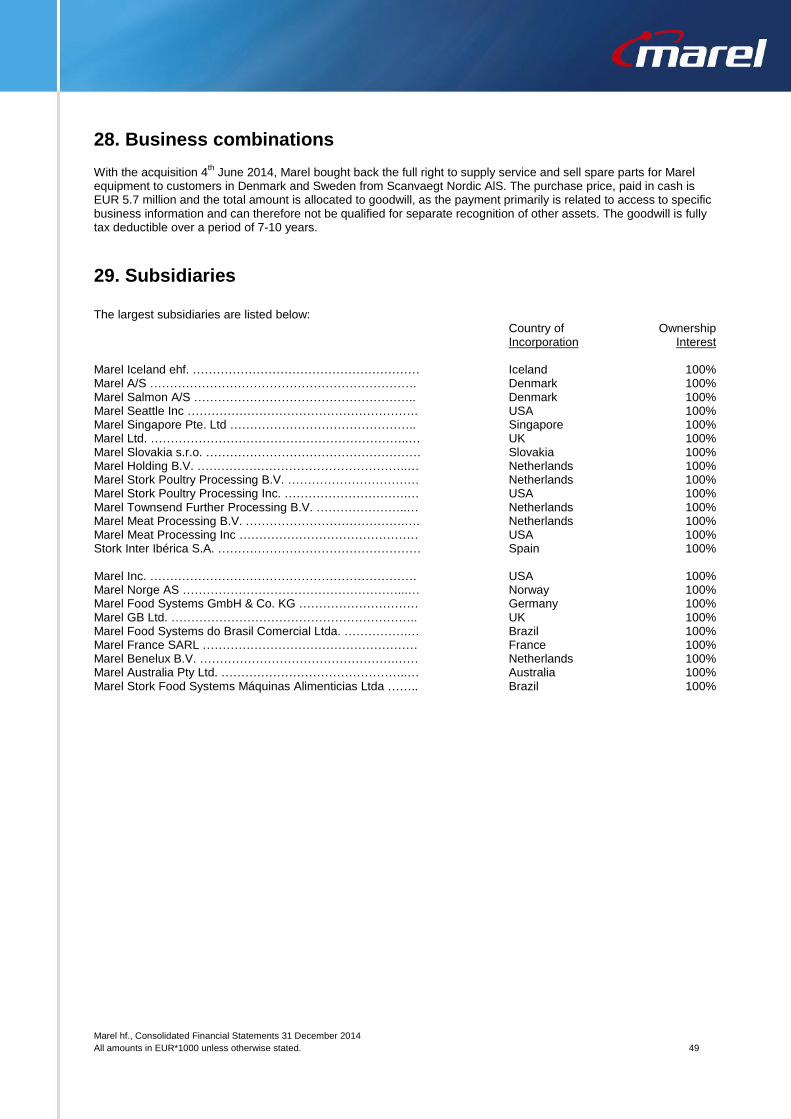
Marel hf., Consolidated Financial Statements 31 December 2014
All amounts in EUR*1000 unless otherwise stated. 49
28. Business combinations With the acquisition 4
th June 2014, Marel bought back the full right to supply service and sell spare parts for Marel
equipment to customers in Denmark and Sweden from Scanvaegt Nordic AlS. The purchase price, paid in cash is EUR 5.7 million and the total amount is allocated to goodwill, as the payment primarily is related to access to specific business information and can therefore not be qualified for separate recognition of other assets. The goodwill is fully tax deductible over a period of 7-10 years.
29. Subsidiaries The largest subsidiaries are listed below: Country of Ownership Incorporation Interest Marel Iceland ehf. ………………………………………………… Iceland 100% Marel A/S …………………………………………………………. Denmark 100% Marel Salmon A/S ……………………………………………….. Denmark 100% Marel Seattle Inc …………………………………………………. USA 100% Marel Singapore Pte. Ltd ……………………………………….. Singapore 100% Marel Ltd. ………………………………………………………..… UK 100% Marel Slovakia s.r.o. ……………………………………………… Slovakia 100% Marel Holding B.V. ……………………………………………..… Netherlands 100% Marel Stork Poultry Processing B.V. …………………………… Netherlands 100% Marel Stork Poultry Processing Inc. ………………………….… USA 100% Marel Townsend Further Processing B.V. …………………..… Netherlands 100% Marel Meat Processing B.V. ………………………………….…. Netherlands 100% Marel Meat Processing Inc ……………………………………… USA 100% Stork Inter Ibérica S.A. …………………………………………… Spain 100% Marel Inc. …………………………………………………………. USA 100% Marel Norge AS ………………………………………………...… Norway 100% Marel Food Systems GmbH & Co. KG ………………………… Germany 100% Marel GB Ltd. …………………………………………………….. UK 100% Marel Food Systems do Brasil Comercial Ltda. …………….… Brazil 100% Marel France SARL ……………………………………………… France 100% Marel Benelux B.V. ………………………………………….…… Netherlands 100% Marel Australia Pty Ltd. ………………………………………..… Australia 100% Marel Stork Food Systems Máquinas Alimenticias Ltda …….. Brazil 100%
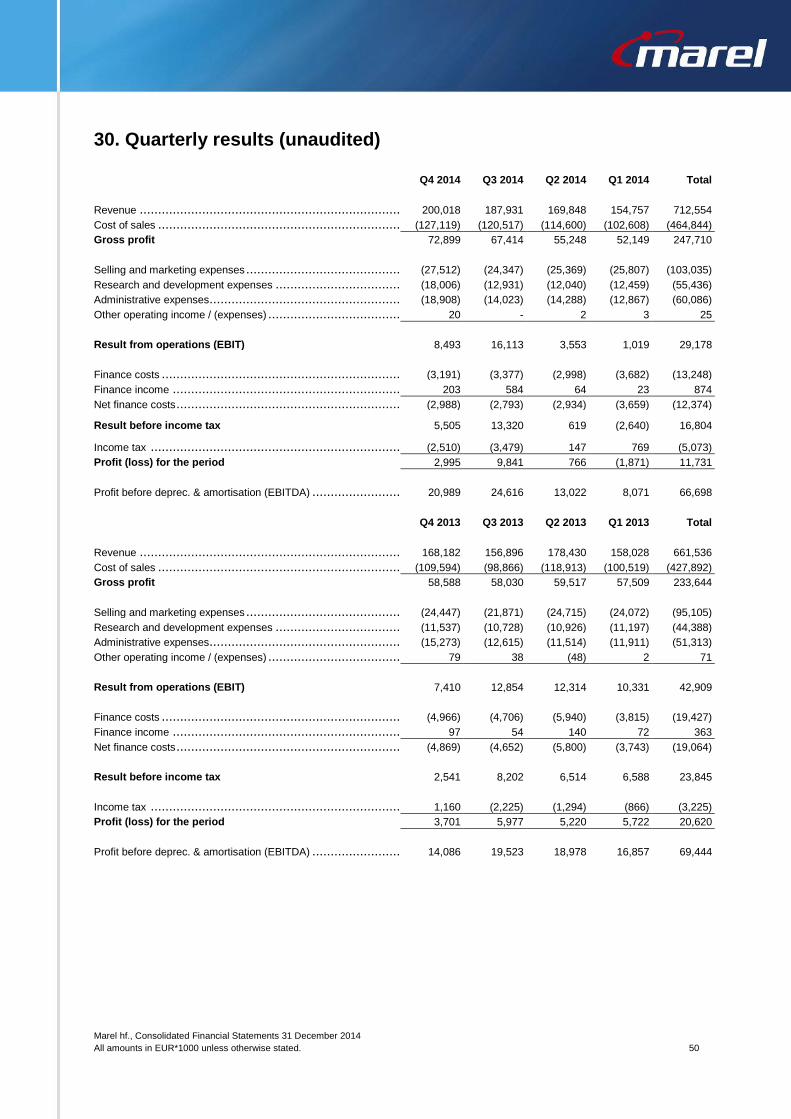
Marel hf., Consolidated Financial Statements 31 December 2014
All amounts in EUR*1000 unless otherwise stated. 50
30. Quarterly results (unaudited) Q4 2014 Q3 2014 Q2 2014 Q1 2014 Total
Revenue ............................................................................................................................................................................................................ 200,018 187,931 169,848 154,757 712,554
Cost of sales ....................................................................................................................................................................................................... (127,119) (120,517) (114,600) (102,608) (464,844)
Gross profit 72,899 67,414 55,248 52,149 247,710
Selling and marketing expenses ............................................................................................................................................................................... (27,512) (24,347) (25,369) (25,807) (103,035)
Research and development expenses ....................................................................................................................................................................... (18,006) (12,931) (12,040) (12,459) (55,436)
Administrative expenses......................................................................................................................................................................................... (18,908) (14,023) (14,288) (12,867) (60,086)
Other operating income / (expenses) ......................................................................................................................................................................... 20 - 2 3 25
Result from operations (EBIT) 8,493 16,113 3,553 1,019 29,178
Finance costs ...................................................................................................................................................................................................... (3,191) (3,377) (2,998) (3,682) (13,248)
Finance income ................................................................................................................................................................................................... 203 584 64 23 874
Net finance costs .................................................................................................................................................................................................. (2,988) (2,793) (2,934) (3,659) (12,374)
Result before income tax 5,505 13,320 619 (2,640) 16,804
Income tax ......................................................................................................................................................................................................... (2,510) (3,479) 147 769 (5,073)
Profit (loss) for the period 2,995 9,841 766 (1,871) 11,731
Profit before deprec. & amortisation (EBITDA) ............................................................................................................................................................. 20,989 24,616 13,022 8,071 66,698
Q4 2013 Q3 2013 Q2 2013 Q1 2013 Total
Revenue ............................................................................................................................................................................................................ 168,182 156,896 178,430 158,028 661,536
Cost of sales ....................................................................................................................................................................................................... (109,594) (98,866) (118,913) (100,519) (427,892)
Gross profit 58,588 58,030 59,517 57,509 233,644
Selling and marketing expenses ............................................................................................................................................................................... (24,447) (21,871) (24,715) (24,072) (95,105)
Research and development expenses ....................................................................................................................................................................... (11,537) (10,728) (10,926) (11,197) (44,388)
Administrative expenses......................................................................................................................................................................................... (15,273) (12,615) (11,514) (11,911) (51,313)
Other operating income / (expenses) ......................................................................................................................................................................... 79 38 (48) 2 71
Result from operations (EBIT) 7,410 12,854 12,314 10,331 42,909
Finance costs ...................................................................................................................................................................................................... (4,966) (4,706) (5,940) (3,815) (19,427)
Finance income ................................................................................................................................................................................................... 97 54 140 72 363
Net finance costs .................................................................................................................................................................................................. (4,869) (4,652) (5,800) (3,743) (19,064)
Result before income tax 2,541 8,202 6,514 6,588 23,845
Income tax ......................................................................................................................................................................................................... 1,160 (2,225) (1,294) (866) (3,225)
Profit (loss) for the period 3,701 5,977 5,220 5,722 20,620
Profit before deprec. & amortisation (EBITDA) ............................................................................................................................................................. 14,086 19,523 18,978 16,857 69,444