Embed Size (px)
Citation preview
GEORG JENSEN A/S, SDR. FASANVEJ 7, DK-2000 FREDERIKSBERG
COMPANY REG.NO.: 26573645
CONSOLIDATED INTERIM FINANCIAL REPORT
H1 2020
January 1 – June 30, 2020

GEORG JENSEN, CONSOLIDATED INTERIM FINANCIAL REPORT H2 2020
PAGE 2
CONTENT
Page 3 Management’s review and financial highlights
Page 5 Management’s commentary
Page 7 Management statement
Page 8 Consolidated Income and Other comprehensive income
statement
Page 9 Consolidated statement of financial position, Assets
Page 10 Consolidated statement of financial position, Liabilities
Page 11 Consolidated cash flow statement
Page 12 Statement of changes in equity
Page 13 Notes

GEORG JENSEN, CONSOLIDATED INTERIM FINANCIAL REPORT H2 2020
PAGE 3
MANAGEMENT’S REVIEW
FINANCIAL HIGHLIGHTS Q2 H1
DKK million, except for number of stores 2020 2019 Change 2020 2019 Change
Net Sales 156,9 201,6 -22% 329,1 399,2 -18%
Closed stores 0,0 -3,1 -1,2 -7,0
Net sales continuing operations 156,9 198,5 -21% 327,9 392,2 -16%
EBITDA 7,6 6,2 5,8 11,2
EBIT -37,1 -29,0 -75,6 -60,1
Profit before tax -54,8 -34,8 -87,3 -73,1
Profit for the period -54,9 -36,6 -87,4 -75,3
Cash flow from operating activities 36,3 -8,4 11,9 -14,8
Total cash flow -29,7 -10,7 -62,8 -51,0
Number of stores 94 96 94 96
• EBITDA increased in Q2 from DKK 6,2 million in
2019 to DKK 7,6 million 2020 driven by lower
operating costs.
• Net cash flow from operating activities
improved by DKK 26,7 in H1 compared to last
year, mainly due to working capital
improvements.
• Revenue from continuing operations was down
by 16% in H1 due to the effects of Covid-19.
There was some recovery towards the end of
the period and June was only down by 4%.
• Revenue in Europe was down by 14%. APAC
and the US declined by 25%, respectively, in H1.
• Sweden, UK and China experienced revenue
growth in H1 despite tough market conditions.
This is mainly due to strong wholesale
performance.
• In H1 the B2B channel has been hit by a 12%
reduction vs. 20% in the B2C channel.

GEORG JENSEN, CONSOLIDATED INTERIM FINANCIAL REPORT H2 2020
PAGE 4
• E-commerce experienced a strong H1 with a
growth of 69% compared to the same period
last year. Growth was generated across all
product categories.
• Overall, the Home category fell by 13% and the
Jewellery category by 21% for the first six
months.
• Operating costs were lowered significantly in
H1 2020. Overall, they came down by 19%.
• Net interest-bearing debt increased to DKK
512,3 million from DKK 473,4 million last year.
The main driver is an increase in lease liabilities.
Adjusted EBITDA was DKK 161,1 million with
sundry of DKK 16,9 million, hence a leverage of
3,2.
• The cash balance increased by DKK 29,0 million
vs. H1 2019 to DKK 54,4 million.

GEORG JENSEN, CONSOLIDATED INTERIM FINANCIAL REPORT H2 2020
PAGE 5
MANAGEMENT’S COMMENTARY
In 2020 we have unfortunately seen the arrival of the corona virus which has had a significant effect on our business.
Despite this, we have seen an improvement in EBITDA for Q2 2020 vs. Q2 2019 and also a significant improvement in
operating cash flow.
Total revenue was down by 18% for the first six months of 2020. The fall in turnover accelerated from February to
April with April sales coming in at 63% of last year. May and June showed improvement and June ended at only 4%
below last year. Net sales for continuing operations decreased 16% in H1.
All markets have been affected by the pandemic and we have had falling sales in all markets except in Sweden, UK and
China. Sweden increased by 6% in H1, mainly due to strong sales in the wholesale channel and significant growth in E-
commerce.
The E-commerce channel grew by 69% in the first half of the year. The Jewellery category (up 82%) and the Home
category (up 68%) are showing the strongest growth.
In total the B2C channel dropped by 20% and B2B fell by 12%. The Home category sales are reduced by 13%, whereas
Jewellery fell by 21%.
Operating costs continued the downward trend and were significantly lower than in 2019. Other external cost was
reduced by 25% and staff cost by 13%.
The reduction in operating costs did offset the lower revenue and EBITDA increased in Q2 from DKK 6,2 million in 2019
to DKK 7,6 million in 2020. Ongoing cost adjustment and efficiency measures continue to be implemented to improve
and protect the results of the company.
Net cash flow from operating activities improved by DKK 26,7 in H1 compared to last year, mainly due to working
capital improvements.
Net interest-bearing debt increased from DKK 473,4 million last year to DKK 512,3 million driven by an increase in
lease obligations.
New product launches
In addition to the product launches done in Q1, Georg Jensen in April introduced Duo. Duo is a collection of
contemporary vases and bowls designed by the Georg Jensen Design Studio in Copenhagen. The name Duo refers to
both the inventive combination of mouth-blown glass and stainless steel, and to the dazzling reflections created by
the mirror-polished steel collar adorning each of the pieces. The generous shapes of the Duo vases and bowls make
them perfect for spacious hospitality environments as well as eye catching objects in private residences.
GEORG JENSEN, CONSOLIDATED INTERIM FINANCIAL REPORT H1 2020
PAGE 6
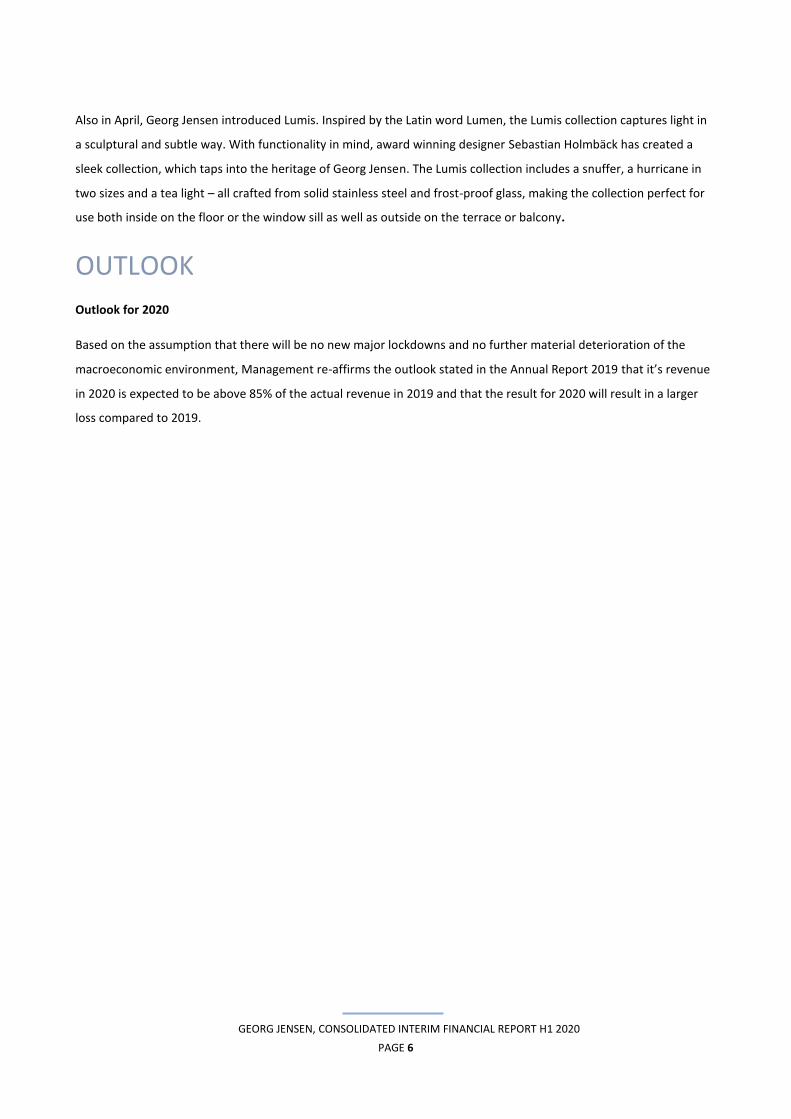
Also in April, Georg Jensen introduced Lumis. Inspired by the Latin word Lumen, the Lumis collection captures light in
a sculptural and subtle way. With functionality in mind, award winning designer Sebastian Holmbäck has created a
sleek collection, which taps into the heritage of Georg Jensen. The Lumis collection includes a snuffer, a hurricane in
two sizes and a tea light – all crafted from solid stainless steel and frost-proof glass, making the collection perfect for
use both inside on the floor or the window sill as well as outside on the terrace or balcony.
OUTLOOK
Outlook for 2020
Based on the assumption that there will be no new major lockdowns and no further material deterioration of the
macroeconomic environment, Management re-affirms the outlook stated in the Annual Report 2019 that it’s revenue
in 2020 is expected to be above 85% of the actual revenue in 2019 and that the result for 2020 will result in a larger
loss compared to 2019.
GEORG JENSEN, CONSOLIDATED INTERIM FINANCIAL REPORT H1 2020
PAGE 7
MANAGEMENT STATEMENT
The Board of Directors and Executive Management
have reviewed and approved the consolidated interim
financial report of Georg Jensen A/S for the period
January to June 2020. The consolidated interim
financial report has not been audited or reviewed by
the company’s independent auditors.
The consolidated interim financial report for the
period January to June 2020 has been prepared in
accordance with IAS 34 'Interim Financial Reporting’.
The accounting policies adopted in the preparation are
consistent with those applied in the Annual Report
2019 of Georg Jensen A/S.
Furthermore, the consolidated interim financial report
for January to June 2020 and Management’s Review
are prepared in accordance with additional Danish
disclosure requirements for interim reports of listed
companies.
In our opinion, the accounting policies used are
appropriate and the overall presentation of the
consolidated interim financial report for the period
January to June 2020 is adequate. Furthermore, in our
opinion, Management’s Review includes a true and
fair account of the development in the operations and
financial circumstances, of the results for the period
and of the consolidated interim financial position of
the Group as well as a description of the most
significant risks and elements of uncertainty facing the
Group in accordance with Danish disclosure
requirements for listed companies.
Besides what has been disclosed in the consolidated
interim financial report, no changes in the Group’s
most significant risks and uncertainties have occurred
relative to what was disclosed in the consolidated
annual report for 2019.
Copenhagen, 27th of August 2020
Executive Board
___________________
Francesco Pesci
CEO
Board of Directors
_________________ ___________________ ________________ ________________ _____________
Hazem Ben-Gacem David Ching Chi Chu Andrea Jayne Davis Francesco Pesci Duncan Zheng
Chairman
________________ ___________________ ________________ _________________
Karl Sebastian Inger Annick E. M. Desmecht Inge Andersen Ida Heiberg Bøttiger
DISCLAIMER
This company announcement contains forward looking statements, which include estimates of financial performance and
targets. These statements are not guarantees of future performance and involve certain risks and uncertainties. Therefore,
actual future results and trends may differ from what is forecast in this report due to a variety of factors.

GEORG JENSEN, CONSOLIDATED INTERIM FINANCIAL REPORT H1 2020
PAGE 8
CONSOLIDATED INCOME AND COMPREHENSIVE INCOME
STATEMENT
INCOME STATEMENT Q2 H1
DKK million 2020 2019 2020 2019
Revenue 156,9 201,6 329,1 399,2
Cost of sales -67,3 -77,9 -132,4 -153,8
Gross profit 89,6 123,7 196,7 245,4
Other external costs -32,2 -53,2 -77,5 -103,4
Staff costs -50,1 -63,9 -113,5 -130,2
Other operating income and costs 0,3 -0,5 0,1 -0,7
Operating profit before depreciation and amortization 7,6 6,2 5,8 11,2
Depreciation, amortization and impairment losses -44,7 -35,2 -81,4 -71,3
Operating profit -37,1 -29,0 -75,6 -60,1
Financial income 6,5 3,3 15,2 11,3
Financial costs -24,2 -9,1 -26,9 -24,3
Profit before tax -54,8 -34,8 -87,3 -73,1
Tax on profit for the year -0,1 -1,8 -0,2 -2,2
Profit for the year -54,9 -36,6 -87,5 -75,3
OTHER COMPREHENSIVE INCOME Q2 H1
2020 2019 2020 2019
Profit for the year -54,9 -36,6 -87,5 -75,3
OTHER COMPREHENSIVE INCOME
Items that will not be reclassified to profit or loss
Remeasurements of defined benefit pension plans 0,0 0,0 0,0 0,0
Items that will be reclassified to profit or loss
Adjustment Cash flow hedges 0,0 0,0 0,0 0,0
Exchange differences on foreign operations 12,1 0,0 -7,4 1,5
Other comprehensive income after tax 12,1 0,0 -7,4 1,5
Total comprehensive income for the year -42,8 -36,6 -94,9 -73,8
GEORG JENSEN, CONSOLIDATED INTERIM FINANCIAL REPORT H1 2020
PAGE 9
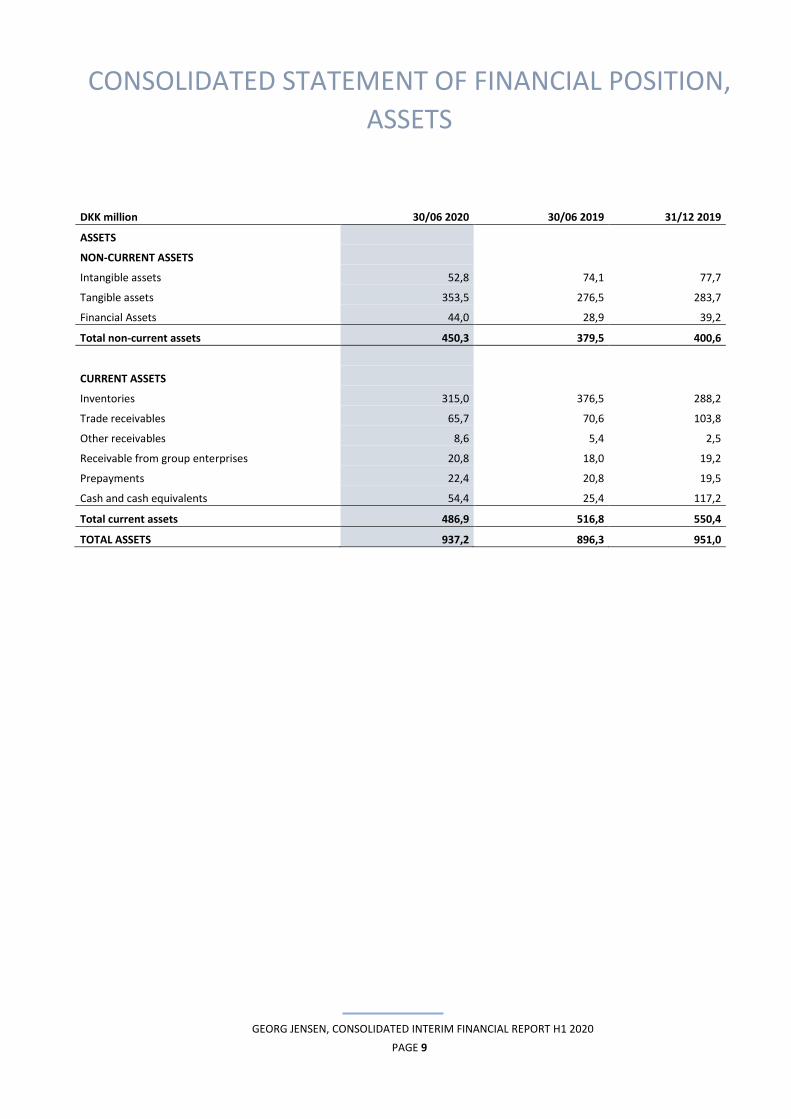
CONSOLIDATED STATEMENT OF FINANCIAL POSITION,
ASSETS
DKK million 30/06 2020 30/06 2019 31/12 2019
ASSETS
NON-CURRENT ASSETS
Intangible assets 52,8 74,1 77,7
Tangible assets 353,5 276,5 283,7
Financial Assets 44,0 28,9 39,2
Total non-current assets 450,3 379,5 400,6
CURRENT ASSETS
Inventories 315,0 376,5 288,2
Trade receivables 65,7 70,6 103,8
Other receivables 8,6 5,4 2,5
Receivable from group enterprises 20,8 18,0 19,2
Prepayments 22,4 20,8 19,5
Cash and cash equivalents 54,4 25,4 117,2
Total current assets 486,9 516,8 550,4
TOTAL ASSETS 937,2 896,3 951,0

GEORG JENSEN, CONSOLIDATED INTERIM FINANCIAL REPORT H1 2020
PAGE 10
CONSOLIDATED STATEMENT OF FINANCIAL POSITION,
LIABILITIES
DKK million 30/06 2020 30/06 2019 31/12 2019
EQUITY AND LIABILITIES
EQUITY
Share capital 139,6 139,6 139,6
Share premium 488,3 488,3 488,3
Hedging reserve 1,1 0,7 1,1
Translation reserve 11,1 -3,4 18,5
Retained earnings -503,6 -442,0 -416,1
Total equity 136,5 183,2 231,4
LIABILITIES
NON-CURRENT LIABILITIES
Bond 298,0 298,0 298,0
Credit institutions 1,4 2,8 1,4
Lease liabilities 194,4 110,6 126,1
Provisions 13,3 13,6 12,8
Deferred tax 1,9 1,9 2,0
Retirement benefit obligation 8,2 6,6 8,1
Other Payables 8,7 0,0 3,8
Total non-current liabilities 525,9 433,5 452,2
CURRENT LIABILITIES
Credit institutions 5,6 24,9 6,1
Trade Payables 83,8 77,4 64,3
Other Payables 91,1 87,3 100,9
Payable to group enterprises 6,0 6,1 6,0
Lease liabilities 83,5 77,2 85,3
Tax payables 1,8 3,7 1,8
Provisions 3,0 3,0 3,0
Total current liabilities 274,8 279,6 267,4
Total liabilities 800,7 713,1 719,6
TOTAL EQUITY AND LIABILITIES 937,2 896,3 951,0
GEORG JENSEN, CONSOLIDATED INTERIM FINANCIAL REPORT H1 2020
PAGE 11
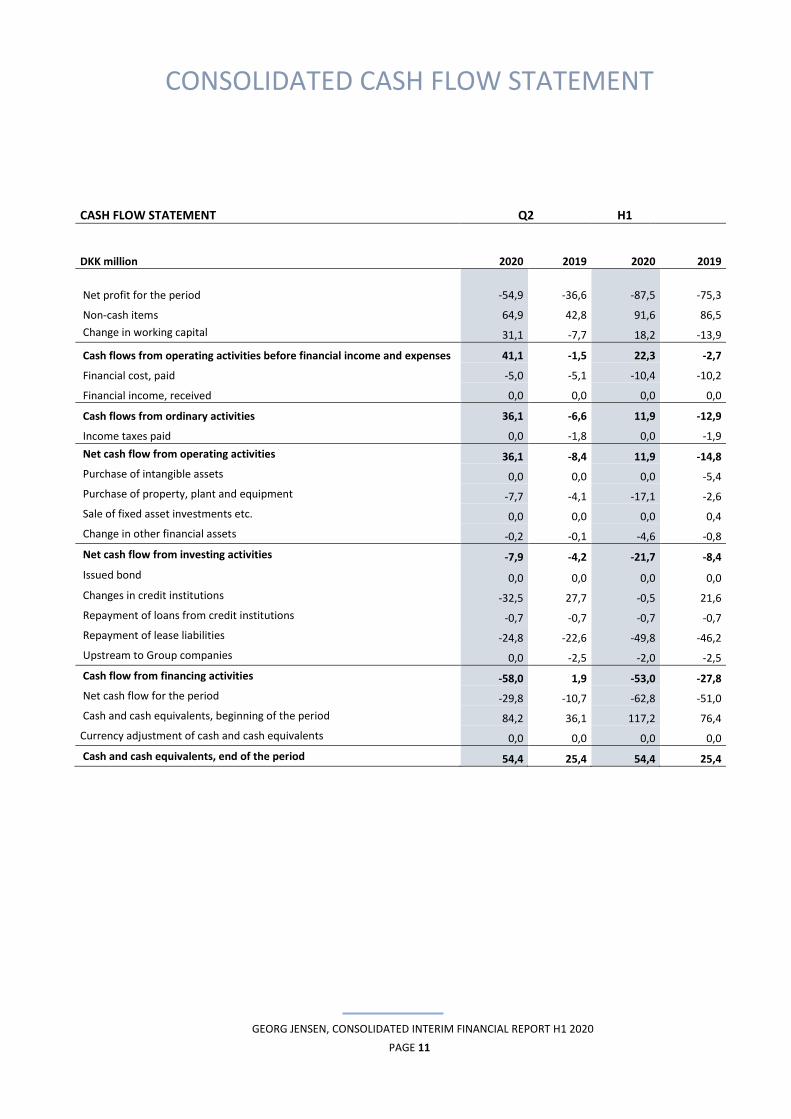
CONSOLIDATED CASH FLOW STATEMENT
CASH FLOW STATEMENT Q2 H1
DKK million 2020 2019 2020 2019
Net profit for the period -54,9 -36,6 -87,5 -75,3
Non-cash items 64,9 42,8 91,6 86,5
Change in working capital 31,1 -7,7 18,2 -13,9
Cash flows from operating activities before financial income and expenses 41,1 -1,5 22,3 -2,7
Financial cost, paid -5,0 -5,1 -10,4 -10,2
Financial income, received 0,0 0,0 0,0 0,0
Cash flows from ordinary activities 36,1 -6,6 11,9 -12,9
Income taxes paid 0,0 -1,8 0,0 -1,9
Net cash flow from operating activities 36,1 -8,4 11,9 -14,8
Purchase of intangible assets 0,0 0,0 0,0 -5,4
Purchase of property, plant and equipment -7,7 -4,1 -17,1 -2,6
Sale of fixed asset investments etc. 0,0 0,0 0,0 0,4
Change in other financial assets -0,2 -0,1 -4,6 -0,8
Net cash flow from investing activities -7,9 -4,2 -21,7 -8,4
Issued bond 0,0 0,0 0,0 0,0
Changes in credit institutions -32,5 27,7 -0,5 21,6
Repayment of loans from credit institutions -0,7 -0,7 -0,7 -0,7
Repayment of lease liabilities -24,8 -22,6 -49,8 -46,2
Upstream to Group companies 0,0 -2,5 -2,0 -2,5
Cash flow from financing activities -58,0 1,9 -53,0 -27,8
Net cash flow for the period -29,8 -10,7 -62,8 -51,0
Cash and cash equivalents, beginning of the period 84,2 36,1 117,2 76,4
Currency adjustment of cash and cash equivalents 0,0 0,0 0,0 0,0
Cash and cash equivalents, end of the period 54,4 25,4 54,4 25,4
GEORG JENSEN, CONSOLIDATED INTERIM FINANCIAL REPORT H1 2020
PAGE 12
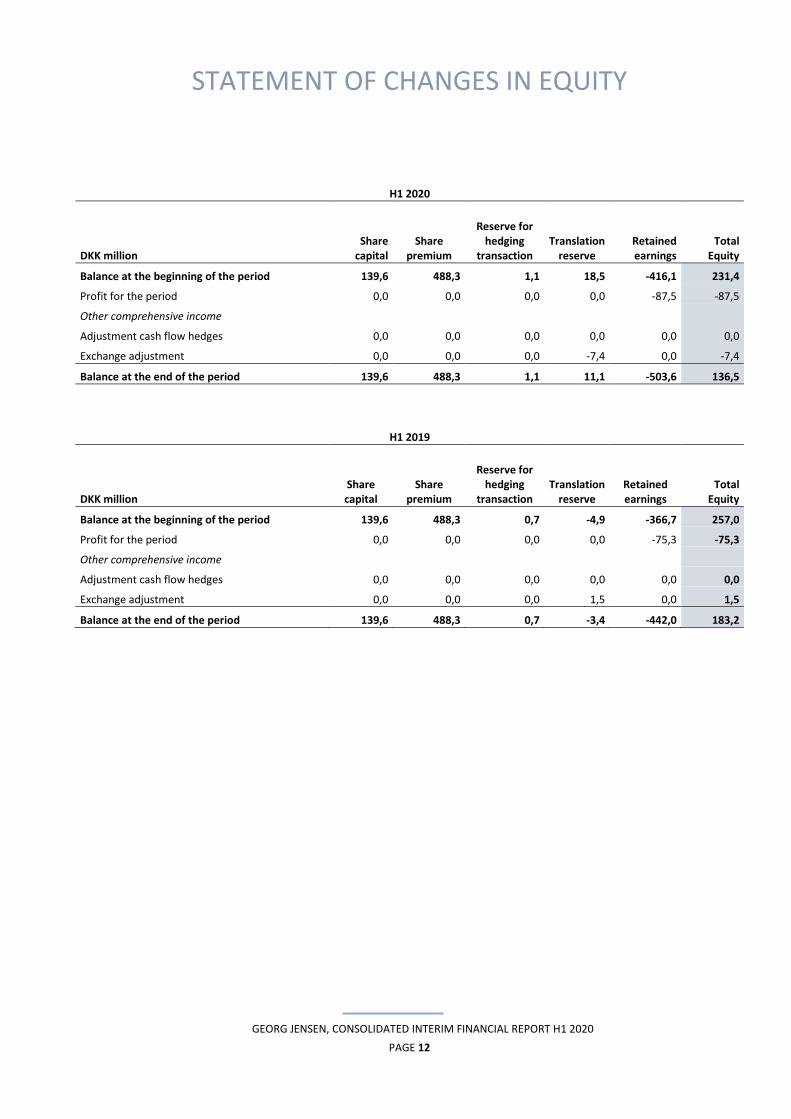
STATEMENT OF CHANGES IN EQUITY
H1 2020
Share capital
Share premium
Reserve for hedging
transaction Translation
reserve Retained earnings
Total Equity
DKK million
Balance at the beginning of the period 139,6 488,3 1,1 18,5 -416,1 231,4
Profit for the period 0,0 0,0 0,0 0,0 -87,5 -87,5
Other comprehensive income
Adjustment cash flow hedges 0,0 0,0 0,0 0,0 0,0 0,0
Exchange adjustment 0,0 0,0 0,0 -7,4 0,0 -7,4
Balance at the end of the period 139,6 488,3 1,1 11,1 -503,6 136,5
H1 2019
Share capital
Share premium
Reserve for hedging
transaction Translation
reserve Retained earnings
Total Equity
DKK million
Balance at the beginning of the period 139,6 488,3 0,7 -4,9 -366,7 257,0
Profit for the period 0,0 0,0 0,0 0,0 -75,3 -75,3
Other comprehensive income
Adjustment cash flow hedges 0,0 0,0 0,0 0,0 0,0 0,0
Exchange adjustment 0,0 0,0 0,0 1,5 0,0 1,5
Balance at the end of the period 139,6 488,3 0,7 -3,4 -442,0 183,2

GEORG JENSEN, CONSOLIDATED INTERIM FINANCIAL REPORT H1 2020
PAGE 13
NOTES
1 ACCOUNTING POLICIES
The unaudited consolidated interim financial
statements for the period January to June 2020 have
been prepared in accordance with IAS 34 ‘Interim
Financial Reporting’. The accounting policies and
significant accounting estimates adopted in the
preparation are consistent with those applied in the
Annual Report 2019 of Georg Jensen A/S.
Furthermore, the consolidated interim financial report
including the consolidated financial statements for the
period January to June of 2020 and Management’s
review have been prepared in accordance with
additional Danish disclosure requirements for interim
reports of listed companies.
2 SEGMENT INFORMATION
Q2 2020
DKK million Europe APAC North America Other Total
Total revenue 81,8 64,2 8,2 2,7 156,9
Gross Profit 25,6 36,7 3,1 24,2 89,6 OPEX -11,5 -26,8 -2,9 -40,8 -82,0
EBITDA 14,1 9,9 0,2 -16,6 7,6 Amortizations & depreciations -44,7
EBIT -37,1 Financial income 6,5 Financial expenses -24,2
Profit before tax -54,8
H1 2020
DKK million Europe APAC North America Other Total
Total revenue 171,0 134,7 19,1 4,3 329,1
Gross Profit 53,4 77,1 7,5 58,7 196,7 OPEX -35,1 -64,8 -8,0 -83,0 -190,9
EBITDA 18,3 12,3 -0,5 -24,3 5,8 Amortizations & depreciations -81,4
EBIT -75,6 Financial income 15,2 Financial expenses -26,9
Profit before tax -87,3
GEORG JENSEN, CONSOLIDATED INTERIM FINANCIAL REPORT H1 2020
PAGE 14
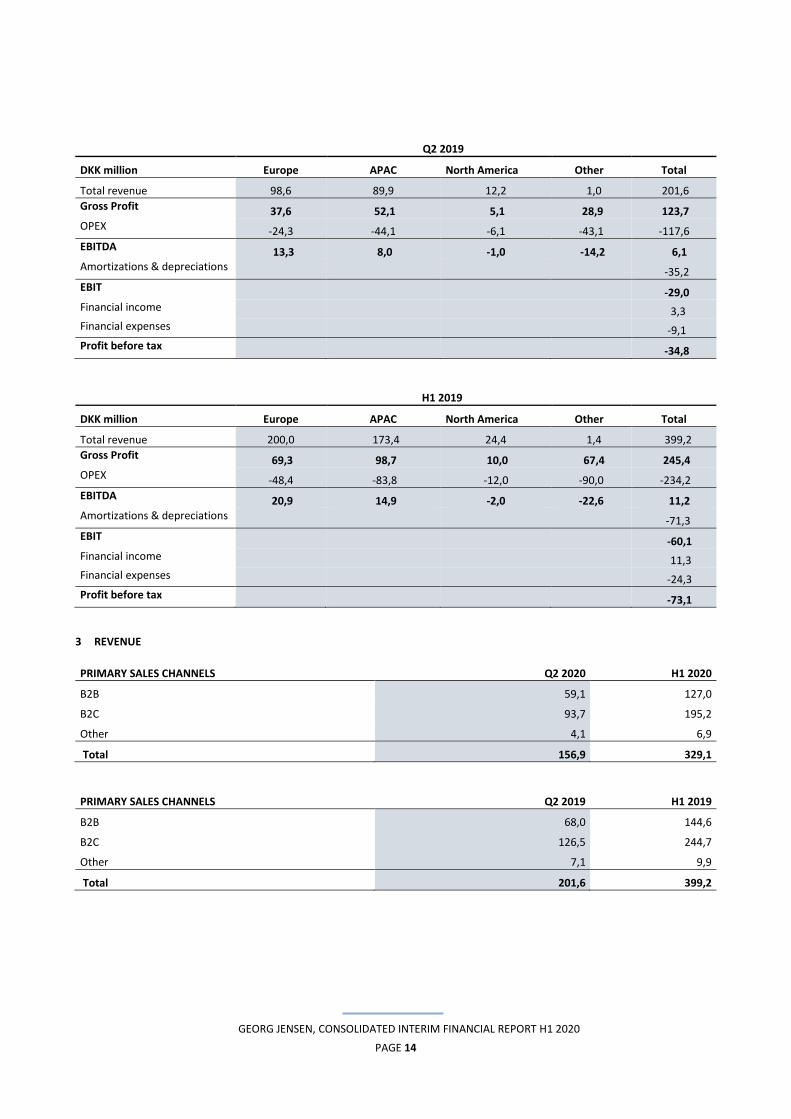
Q2 2019
DKK million Europe APAC North America Other Total
Total revenue 98,6 89,9 12,2 1,0 201,6
Gross Profit 37,6 52,1 5,1 28,9 123,7 OPEX -24,3 -44,1 -6,1 -43,1 -117,6
EBITDA 13,3 8,0 -1,0 -14,2 6,1 Amortizations & depreciations -35,2
EBIT -29,0 Financial income 3,3 Financial expenses -9,1
Profit before tax -34,8
H1 2019
DKK million Europe APAC North America Other Total
Total revenue 200,0 173,4 24,4 1,4 399,2
Gross Profit 69,3 98,7 10,0 67,4 245,4 OPEX -48,4 -83,8 -12,0 -90,0 -234,2
EBITDA 20,9 14,9 -2,0 -22,6 11,2 Amortizations & depreciations -71,3
EBIT -60,1 Financial income 11,3 Financial expenses -24,3
Profit before tax -73,1
3 REVENUE
PRIMARY SALES CHANNELS Q2 2020 H1 2020
B2B 59,1 127,0
B2C 93,7 195,2
Other 4,1 6,9
Total 156,9 329,1
PRIMARY SALES CHANNELS Q2 2019 H1 2019
B2B 68,0 144,6
B2C 126,5 244,7
Other 7,1 9,9
Total 201,6 399,2
GEORG JENSEN, CONSOLIDATED INTERIM FINANCIAL REPORT H1 2020
PAGE 15
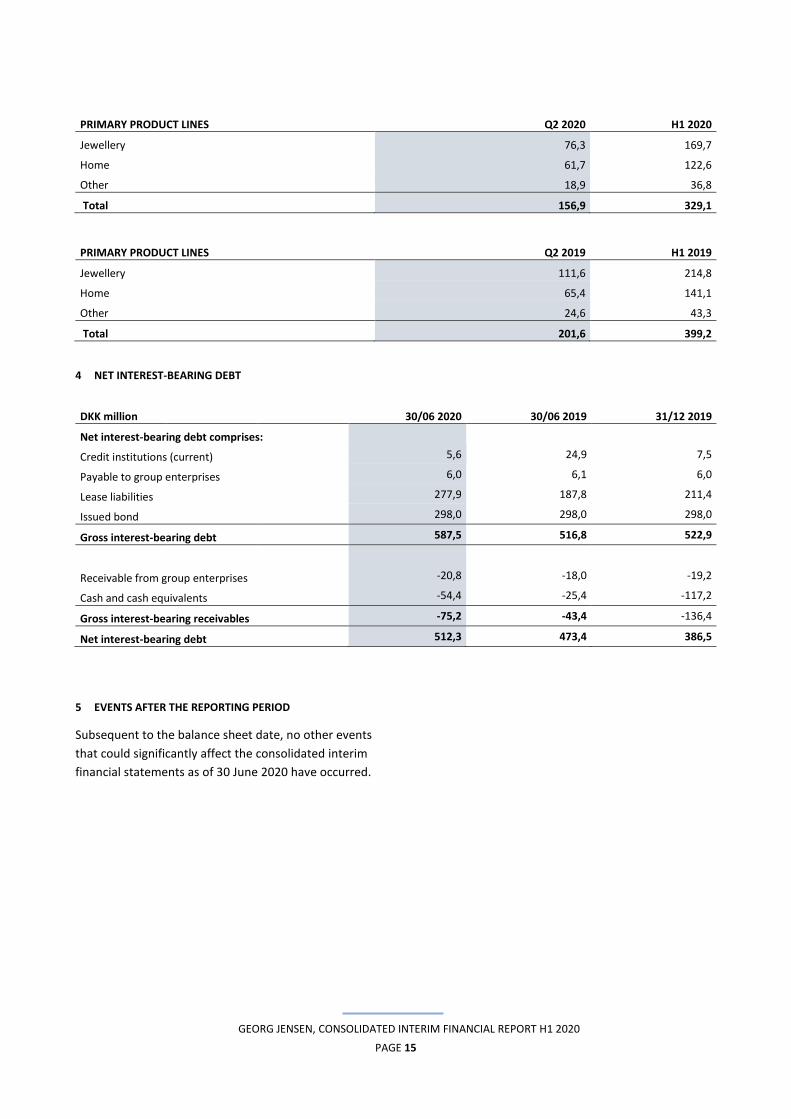
PRIMARY PRODUCT LINES Q2 2020 H1 2020
Jewellery 76,3 169,7
Home 61,7 122,6
Other 18,9 36,8
Total 156,9 329,1
PRIMARY PRODUCT LINES Q2 2019 H1 2019
Jewellery 111,6 214,8
Home 65,4 141,1
Other 24,6 43,3
Total 201,6 399,2
4 NET INTEREST-BEARING DEBT
DKK million 30/06 2020 30/06 2019
31/12 2019
Net interest-bearing debt comprises:
Credit institutions (current) 5,6 24,9 7,5
Payable to group enterprises 6,0 6,1 6,0
Lease liabilities 277,9 187,8 211,4
Issued bond 298,0 298,0 298,0
Gross interest-bearing debt 587,5 516,8 522,9
Receivable from group enterprises -20,8 -18,0 -19,2
Cash and cash equivalents -54,4 -25,4 -117,2
Gross interest-bearing receivables -75,2 -43,4 -136,4
Net interest-bearing debt 512,3 473,4 386,5
5 EVENTS AFTER THE REPORTING PERIOD
Subsequent to the balance sheet date, no other events
that could significantly affect the consolidated interim
financial statements as of 30 June 2020 have occurred.