Embed Size (px)
Citation preview
I N T E R I M R E P O R T / H 1 2 0 2 1
Interim report / 2021 first quarter / Page 2 of 27
Contents Q2 & HI 2021 Highlights .......................................................................................................................................... 3
Key figures – IFRS (unaudited) ....................................................................................................................... 4
CEO comment......................................................................................................................................................... 5
Covid-19 response .................................................................................................................................................. 6
Mintra in brief .......................................................................................................................................................... 6
Operational review .................................................................................................................................................. 7
HCM software & digital learning platform ............................................................................................................ 7
HCM software & Trainingportal – revenue & gross profit ................................................................................ 7 OCS HR .......................................................................................................................................................... 8
Trainingportal .................................................................................................................................................. 8
eLearning ............................................................................................................................................................ 9
eLearning – revenue & gross profit (proforma historical figures) ..................................................................... 9
Consultancy & other ..........................................................................................................................................12
Consultancy & other – revenue and gross profit ............................................................................................12
Organisational development ..............................................................................................................................13
The Mintra team .............................................................................................................................................13
ESG ...............................................................................................................................................................13
Data security ..................................................................................................................................................13
Financial review .....................................................................................................................................................14 Accounting principles .....................................................................................................................................14
Profit & loss – second quarter 2021 ...............................................................................................................14
Cash flow .......................................................................................................................................................16
Financial position & liquidity ...............................................................................................................................17
Assets ............................................................................................................................................................17
Equity & liabilities ...........................................................................................................................................17
Outlook ...................................................................................................................................................................18
Key targets.........................................................................................................................................................19
Contact ..............................................................................................................................................................19
Interim statements ..................................................................................................................................................20
Interim consolidated statement of profit & loss ..................................................................................................20 Interim consolidated balance sheet statement ...................................................................................................21
Interim consolidated balance sheet statement, continued .................................................................................23
Interim consolidated cash flow statement ..........................................................................................................24
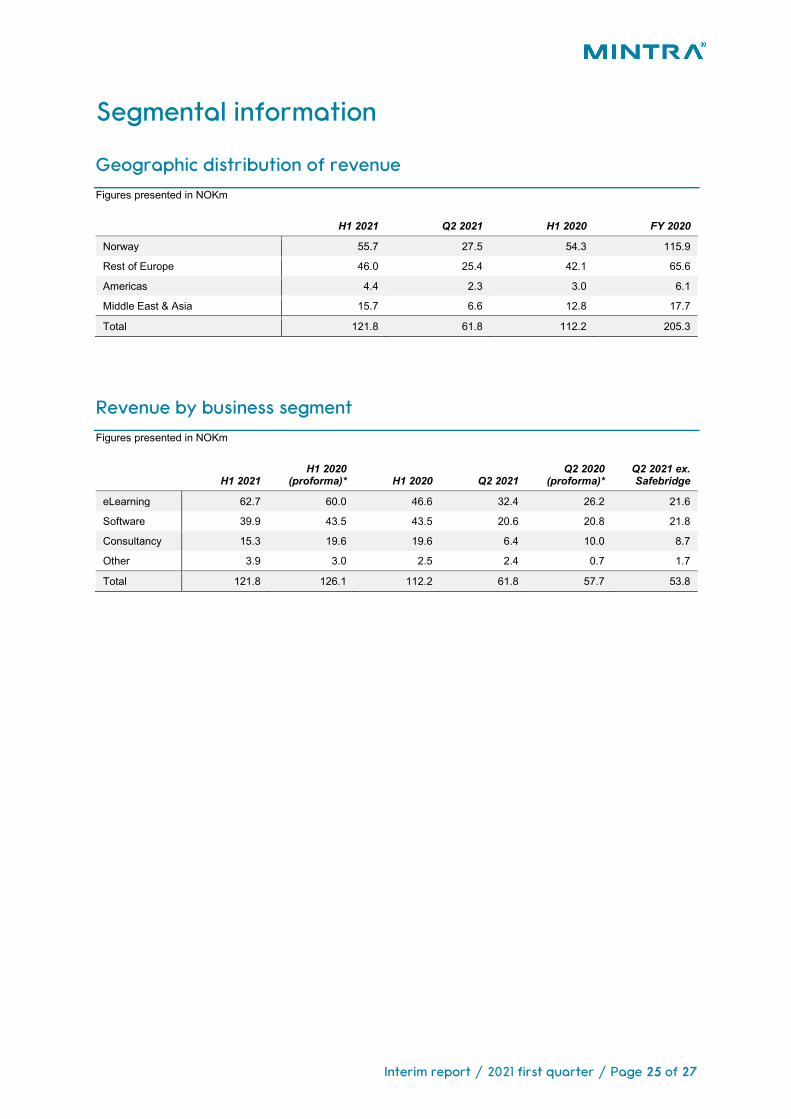
Segmental information ...........................................................................................................................................25
Geographic distribution of revenue ....................................................................................................................25
Revenue by business segment ..........................................................................................................................25
Shareholders .....................................................................................................................................................26
Interim report / 2021 first quarter / Page 3 of 27
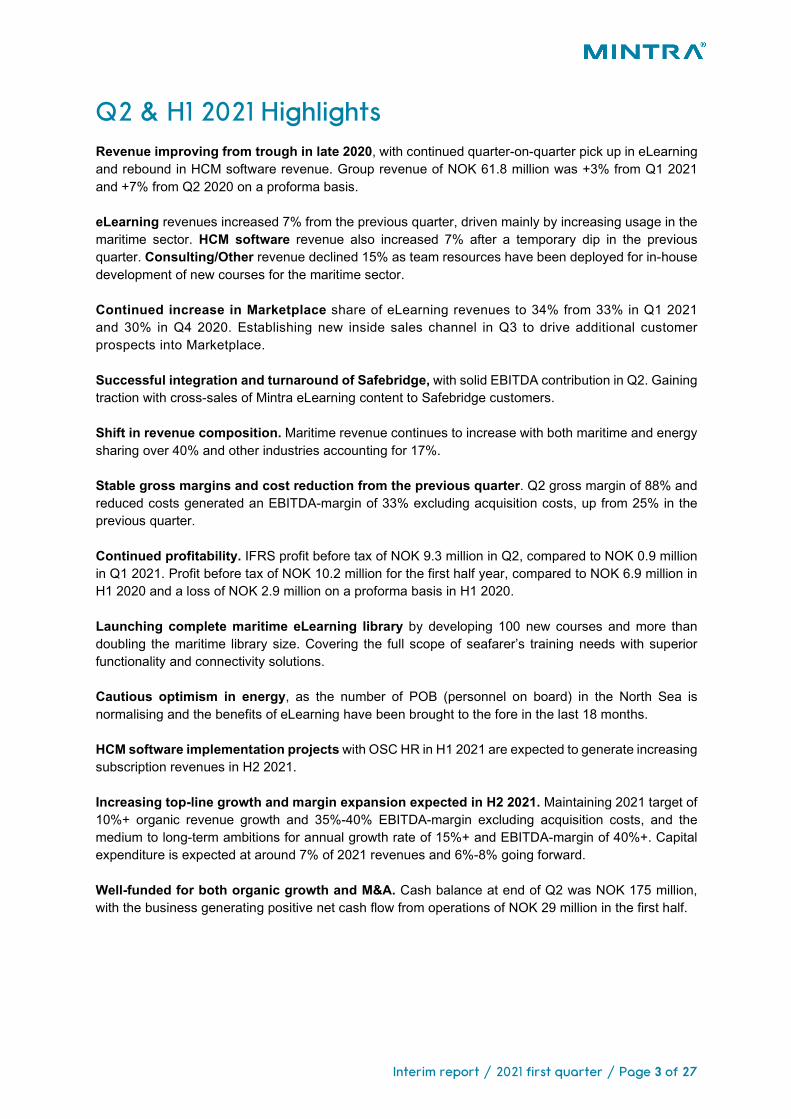
Q2 & H1 2021 Highlights Revenue improving from trough in late 2020, with continued quarter-on-quarter pick up in eLearning and rebound in HCM software revenue. Group revenue of NOK 61.8 million was +3% from Q1 2021 and +7% from Q2 2020 on a proforma basis. eLearning revenues increased 7% from the previous quarter, driven mainly by increasing usage in the maritime sector. HCM software revenue also increased 7% after a temporary dip in the previous quarter. Consulting/Other revenue declined 15% as team resources have been deployed for in-house development of new courses for the maritime sector. Continued increase in Marketplace share of eLearning revenues to 34% from 33% in Q1 2021 and 30% in Q4 2020. Establishing new inside sales channel in Q3 to drive additional customer prospects into Marketplace. Successful integration and turnaround of Safebridge, with solid EBITDA contribution in Q2. Gaining traction with cross-sales of Mintra eLearning content to Safebridge customers. Shift in revenue composition. Maritime revenue continues to increase with both maritime and energy sharing over 40% and other industries accounting for 17%. Stable gross margins and cost reduction from the previous quarter. Q2 gross margin of 88% and reduced costs generated an EBITDA-margin of 33% excluding acquisition costs, up from 25% in the previous quarter. Continued profitability. IFRS profit before tax of NOK 9.3 million in Q2, compared to NOK 0.9 million in Q1 2021. Profit before tax of NOK 10.2 million for the first half year, compared to NOK 6.9 million in H1 2020 and a loss of NOK 2.9 million on a proforma basis in H1 2020. Launching complete maritime eLearning library by developing 100 new courses and more than doubling the maritime library size. Covering the full scope of seafarer’s training needs with superior functionality and connectivity solutions. Cautious optimism in energy, as the number of POB (personnel on board) in the North Sea is normalising and the benefits of eLearning have been brought to the fore in the last 18 months. HCM software implementation projects with OSC HR in H1 2021 are expected to generate increasing subscription revenues in H2 2021. Increasing top-line growth and margin expansion expected in H2 2021. Maintaining 2021 target of 10%+ organic revenue growth and 35%-40% EBITDA-margin excluding acquisition costs, and the medium to long-term ambitions for annual growth rate of 15%+ and EBITDA-margin of 40%+. Capital expenditure is expected at around 7% of 2021 revenues and 6%-8% going forward. Well-funded for both organic growth and M&A. Cash balance at end of Q2 was NOK 175 million, with the business generating positive net cash flow from operations of NOK 29 million in the first half.
Interim report / 2021 first quarter / Page 4 of 27
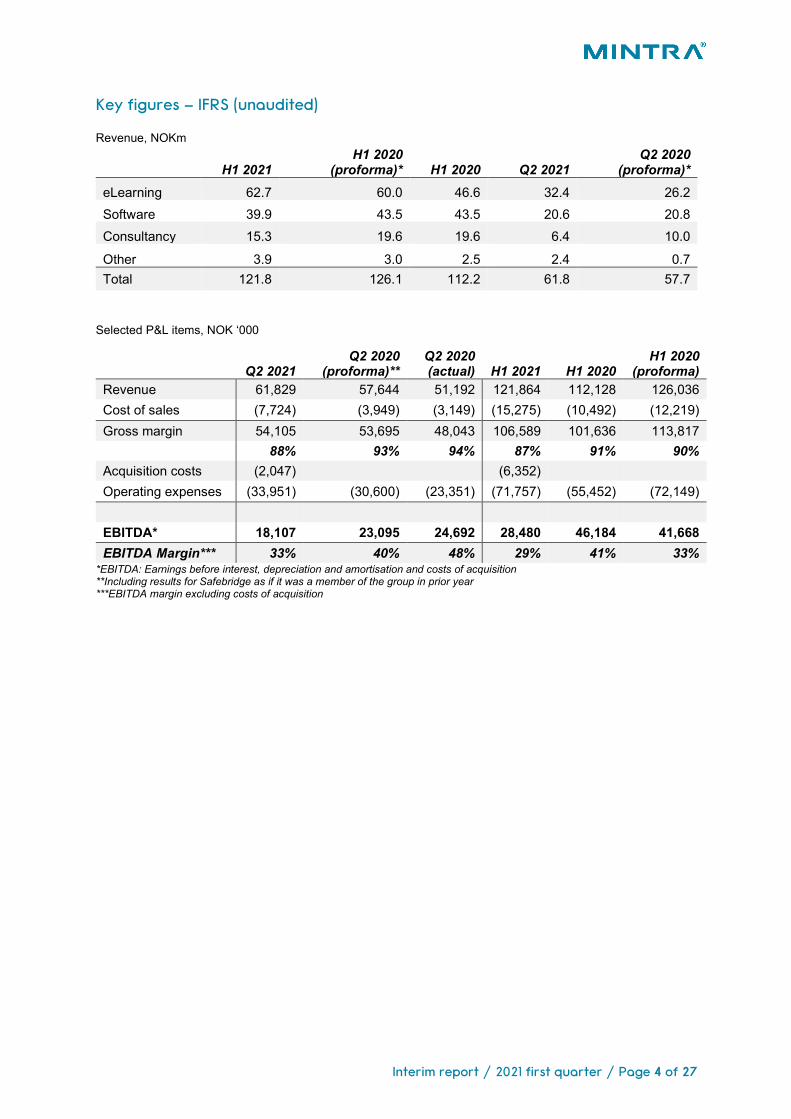
Key figures – IFRS (unaudited) Revenue, NOKm
H1 2021 H1 2020
(proforma)* H1 2020 Q2 2021 Q2 2020
(proforma)* eLearning 62.7 60.0 46.6 32.4 26.2 Software 39.9 43.5 43.5 20.6 20.8 Consultancy 15.3 19.6 19.6 6.4 10.0
Other 3.9 3.0 2.5 2.4 0.7 Total 121.8 126.1 112.2 61.8 57.7
Selected P&L items, NOK ‘000
Q2 2021 Q2 2020
(proforma)** Q2 2020 (actual) H1 2021 H1 2020
H1 2020 (proforma)
Revenue 61,829 57,644 51,192 121,864 112,128 126,036 Cost of sales (7,724) (3,949) (3,149) (15,275) (10,492) (12,219) Gross margin 54,105 53,695 48,043 106,589 101,636 113,817 88% 93% 94% 87% 91% 90% Acquisition costs (2,047) (6,352)
Operating expenses (33,951) (30,600) (23,351) (71,757) (55,452) (72,149)
EBITDA* 18,107 23,095 24,692 28,480 46,184 41,668 EBITDA Margin*** 33% 40% 48% 29% 41% 33%
*EBITDA: Earnings before interest, depreciation and amortisation and costs of acquisition **Including results for Safebridge as if it was a member of the group in prior year ***EBITDA margin excluding costs of acquisition
Interim report / 2021 first quarter / Page 5 of 27
CEO comment The pandemic continued to have an impact on our customers in the second quarter, particularly those in our emerging geographic markets in Asia Pacific. However, signs of ‘normality’ arose as the summer closed in. Consequently, we witnessed an increase in course usage across all sectors and countries in line with the positive development. In the North Sea, movement has been severely restricted through the pandemic, so for many employees eLearning has been their only option. As the number of personnel on board installations returns to pre-pandemic levels, we expect an even better market for energy going forward. The maritime sector has always been a core customer base for Mintra. In the past 12 months we have seen a significant uptick in revenues from this sector. Following the acquisition in the first quarter of the German maritime specialist company, Safebridge, we have expanded our maritime eLearning business, and for the first time in Mintra’s history overall revenues from the maritime sector surpassed the income from energy customers. We have created a dedicated maritime sales team and going forward the team will pursue a substantial market for online technical and compliance training. After more than doubling the size of our library from 107 to 238 titles in Q2, Mintra is now offering a complete maritime eLearning library covering the full scope of seafarer’s training needs. This, together with superior functionality and connectivity solutions, allows Mintra to lead the digital transformation of the maritime sector. We will continue to be a trusted partner to our maritime clients as they adapt, evolve and rise to the challenge of digitalisation: the industry recognises Mintra as supplier of an accessible, low carbon and cost-efficient learning alternative. We experienced impressive additions in the share of eLearning revenues attributed to Marketplace – our digital trading space for the selling and buying of training courses. In particular, we are proud of the exclusive addition of 60 STCW-accredited courses from the Northeast Maritime Institute in Massachusetts. This partnership is particularly important as the courses include the world’s first fully online training to gain STCW accreditation – all other courses to date involve an element of onboard assessment. Going forward we are forecasting increased revenue growth and margin expansion in the second half of 2021. We maintain our organic revenue growth expectations of +10 per cent and an EBITDA-margin of 35-40 per cent. Our medium to long-term ambitions also remain unchanged. With an operational cash flow of NOK 29 million in the first half and a cash balance of NOK 175 million, we are well funded for our planned growth journey. We see a strong outlook for digitalisation in general and eLearning in particular, and with our offering to safety-critical industries we will grasp some of the many market opportunities going forward.
Kevin Short / Mintra CEO
Interim report / 2021 first quarter / Page 6 of 27
Covid-19 response Mintra has continued to support all staff during the Covid-19 pandemic. We have introduced a remote working policy that allows staff to choose where they want to work – at home, in the office (when local restrictions allow) or a hybrid model. The office remained closed in the UK throughout the first half of 2021, while in other locations local government guidance has allowed for some return to office working. Mintra’s focus is to ensure the best possible health outcomes for its staff, and we continue to communicate the available options in each of our locations and to allow staff to make their own choices. We continue to monitor staffing levels and regulatory requirements so that we have adequate cover to support our locations. Other ongoing Covid-19 response measures include:
• Communication from management and team leads • HR wellbeing checks • Financial support for homeworking, whether equipment or environmental needs continues • A flexible working policy is in place to allow for days/hours to be taken as appropriate • Reminders about mental health and wellbeing resources online are in place and refreshed
regularly • Social catch-ups online to connect people outside operational activity • Online yoga and stretching classes • Gifts delivered to staff to celebrate significant events, such as milestones, holidays etc
Mintra in brief Mintra is a leading provider of on-demand digital learning and enterprise Human Capital Management solutions for compliance-driven and safety-critical industries worldwide. Mintra Holding AS is the Norwegian registered parent of operating companies located in Norway, United Kingdom, Germany, Cyprus, United Arab Emirates and Singapore. Mintra provides services to approximately 4,000 companies. For over 30 years, our products have helped customers with HR, planning, payroll, crew rotation and eLearning across safety-critical industries such as energy, maritime, construction, wind energy, and fishing.
Interim report / 2021 first quarter / Page 7 of 27
Operational review Mintra is divided into three segments: subscription based HCM software and Trainingportal, eLearning, Consultancy and other. The majority of our customers operate within the energy and maritime sectors. We have a geographical centre of gravity in Norway and the UK and a growing presence in the Middle East and Asia. Both the energy and maritime sectors were significantly impacted by the travel and work restrictions put in place to curb the Covid-19 pandemic through 2020 and in the first half of 2021, however the relaxation of restrictions and the vaccine roll out are having a positive impact, particularly on eLearning usage. We anticipate further growth for the remainder of 2021.
HCM software & digital learning platform
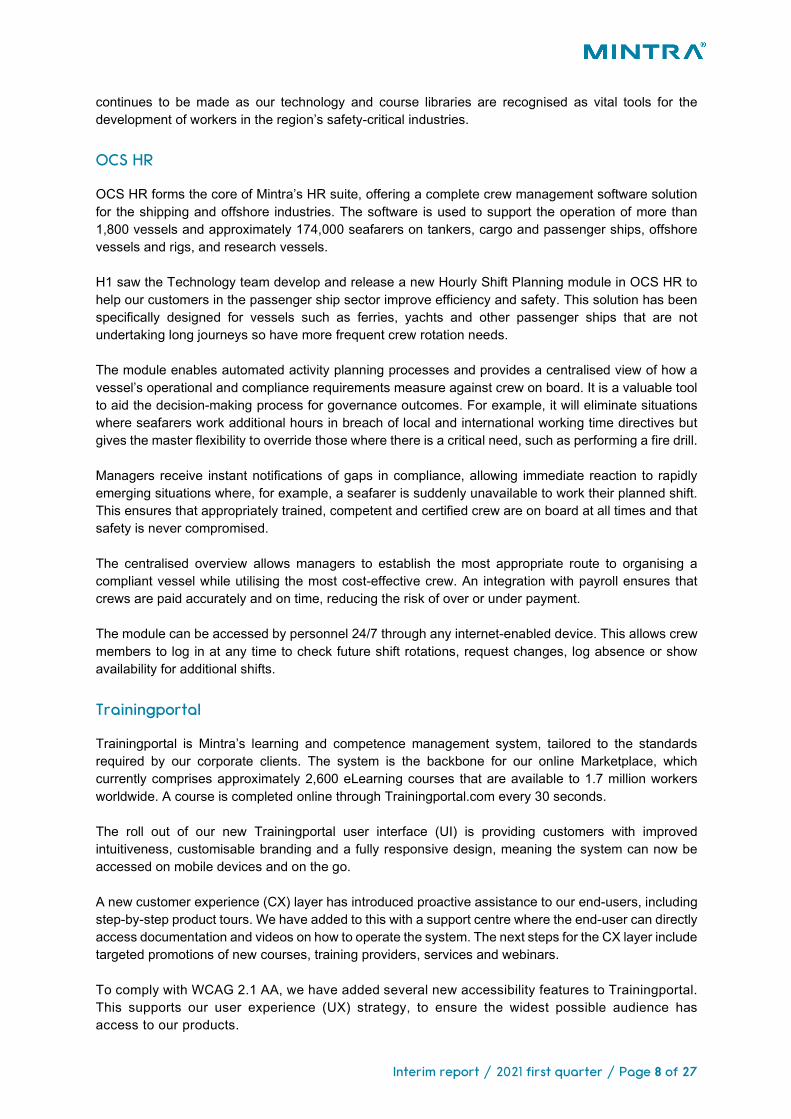
Mintra is a leading provider of HCM software, with its OCS HR crew management and Trainingportal solutions. These subscription-based solutions enable customers to develop and deploy their workforce in an efficient and compliant manner and offer Mintra a strong and growing base of high-margin recurring revenue. OCS and Trainingportal fall under the remit of our Technology team, which saw a busy first half of 2021. The team implemented a range of new system features and functionality that are focussed on improving accessibility and user experience. Sixty-eight system updates and releases were successfully rolled out with a total of 643 improvements made. Following the Safebridge acquisition we have successfully migrated the main products to the Azure Cloud Platform to benefit from scalability and resilience of a cloud infrastructure. HCM software & Trainingportal – revenue & gross profit
HCM revenues recovered in Q2 2021 back to NOK 21 million (Q1 2021: NOK19 million) and in line with the Q2 2020 revenue number. The market for HCM systems is fragmented, with many small and mid-sized regional players. The Asia-Pacific region is expected to show the strongest growth due an expanding workforce and increased regulatory requirement. We supported our growth momentum in Asia by adding more salespeople in the fourth quarter of 2020. Our focus on the Asia Pacific region and in particular India has been affected by the new wave of Covid-19 restrictions in these geographies and the slow pace of the vaccine roll out, however solid progress
21 19 2121 19 20
99% 98% 99%
Q2 2020 Q1 2021 Q2 2021
Revenue Gross profit Gross margin
80 8478 82
98% 98%
LTM FY 2020
Revenue Gross Profit Gross-margin
Interim report / 2021 first quarter / Page 8 of 27
continues to be made as our technology and course libraries are recognised as vital tools for the development of workers in the region’s safety-critical industries.
OCS HR OCS HR forms the core of Mintra’s HR suite, offering a complete crew management software solution for the shipping and offshore industries. The software is used to support the operation of more than 1,800 vessels and approximately 174,000 seafarers on tankers, cargo and passenger ships, offshore vessels and rigs, and research vessels. H1 saw the Technology team develop and release a new Hourly Shift Planning module in OCS HR to help our customers in the passenger ship sector improve efficiency and safety. This solution has been specifically designed for vessels such as ferries, yachts and other passenger ships that are not undertaking long journeys so have more frequent crew rotation needs. The module enables automated activity planning processes and provides a centralised view of how a vessel’s operational and compliance requirements measure against crew on board. It is a valuable tool to aid the decision-making process for governance outcomes. For example, it will eliminate situations where seafarers work additional hours in breach of local and international working time directives but gives the master flexibility to override those where there is a critical need, such as performing a fire drill. Managers receive instant notifications of gaps in compliance, allowing immediate reaction to rapidly emerging situations where, for example, a seafarer is suddenly unavailable to work their planned shift. This ensures that appropriately trained, competent and certified crew are on board at all times and that safety is never compromised. The centralised overview allows managers to establish the most appropriate route to organising a compliant vessel while utilising the most cost-effective crew. An integration with payroll ensures that crews are paid accurately and on time, reducing the risk of over or under payment. The module can be accessed by personnel 24/7 through any internet-enabled device. This allows crew members to log in at any time to check future shift rotations, request changes, log absence or show availability for additional shifts.
Trainingportal Trainingportal is Mintra’s learning and competence management system, tailored to the standards required by our corporate clients. The system is the backbone for our online Marketplace, which currently comprises approximately 2,600 eLearning courses that are available to 1.7 million workers worldwide. A course is completed online through Trainingportal.com every 30 seconds. The roll out of our new Trainingportal user interface (UI) is providing customers with improved intuitiveness, customisable branding and a fully responsive design, meaning the system can now be accessed on mobile devices and on the go. A new customer experience (CX) layer has introduced proactive assistance to our end-users, including step-by-step product tours. We have added to this with a support centre where the end-user can directly access documentation and videos on how to operate the system. The next steps for the CX layer include targeted promotions of new courses, training providers, services and webinars. To comply with WCAG 2.1 AA, we have added several new accessibility features to Trainingportal. This supports our user experience (UX) strategy, to ensure the widest possible audience has access to our products.
Interim report / 2021 first quarter / Page 9 of 27
We have introduced Intercom, a leading business messenger, into Trainingportal. Available throughout Trainingportal, the end-user can now chat with our service centre without leaving the system. Within the last month we have introduced automation to the process - a chatbot that is automatically answering 40% of our more common questions, giving instant answers without human intervention. Trainingportal has several login pages, however the majority of users access via Trainingportal.com with over 2,500 daily visitors. Within this login page we are adding our full Marketplace course listing alongside eCommerce functionality. The Marketplace offering is currently only available for existing customers within Trainingportal. This development will allow us to make the offering publicly visible and give Marketplace a greater online presence. To address the growing demand for remote invigilation we are developing eProctoring within Trainingportal, allowing our online courses to be completed securely, anywhere and anytime. This an automated process that can be attached to any eLearning course within the system. The solution will include identity verification and continuous monitoring using webcam and microphone to detect any cheating.
eLearning
Mintra’s on-demand digital eLearning offering focuses on safety-critical and compliance-driven industries, where companies and workers are facing ever increasing requirements with regards to competence, accreditation, and certification. Our eLearning platform offers the combination of low cost, high convenience, and accessibility. It has a strong customer base in the energy and maritime sector with a high volume of repeat purchases. We are expanding our eLearning offering for other compliance-driven industries such as construction and renewables.
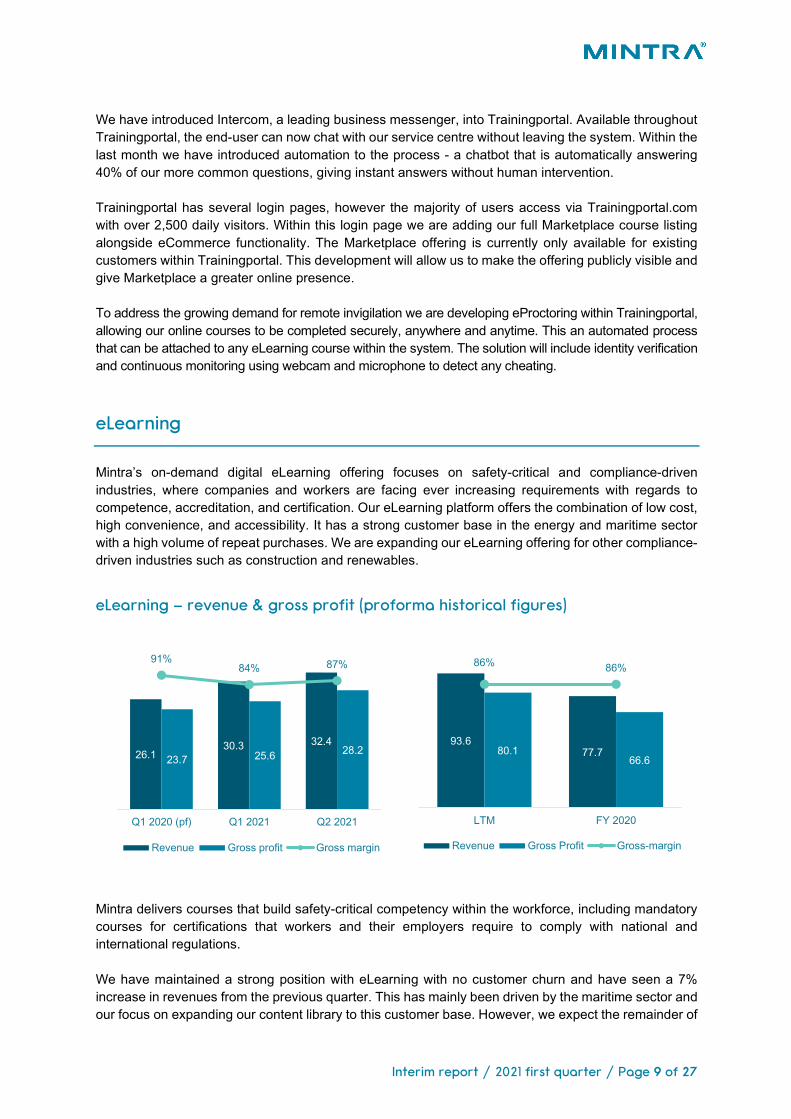
eLearning – revenue & gross profit (proforma historical figures)
Mintra delivers courses that build safety-critical competency within the workforce, including mandatory courses for certifications that workers and their employers require to comply with national and international regulations. We have maintained a strong position with eLearning with no customer churn and have seen a 7% increase in revenues from the previous quarter. This has mainly been driven by the maritime sector and our focus on expanding our content library to this customer base. However, we expect the remainder of
26.130.3 32.4
23.7 25.6 28.2
91%84% 87%
Q1 2020 (pf) Q1 2021 Q2 2021
Revenue Gross profit Gross margin
93.677.780.1
66.6
86% 86%
LTM FY 2020
Revenue Gross Profit Gross-margin
Interim report / 2021 first quarter / Page 10 of 27
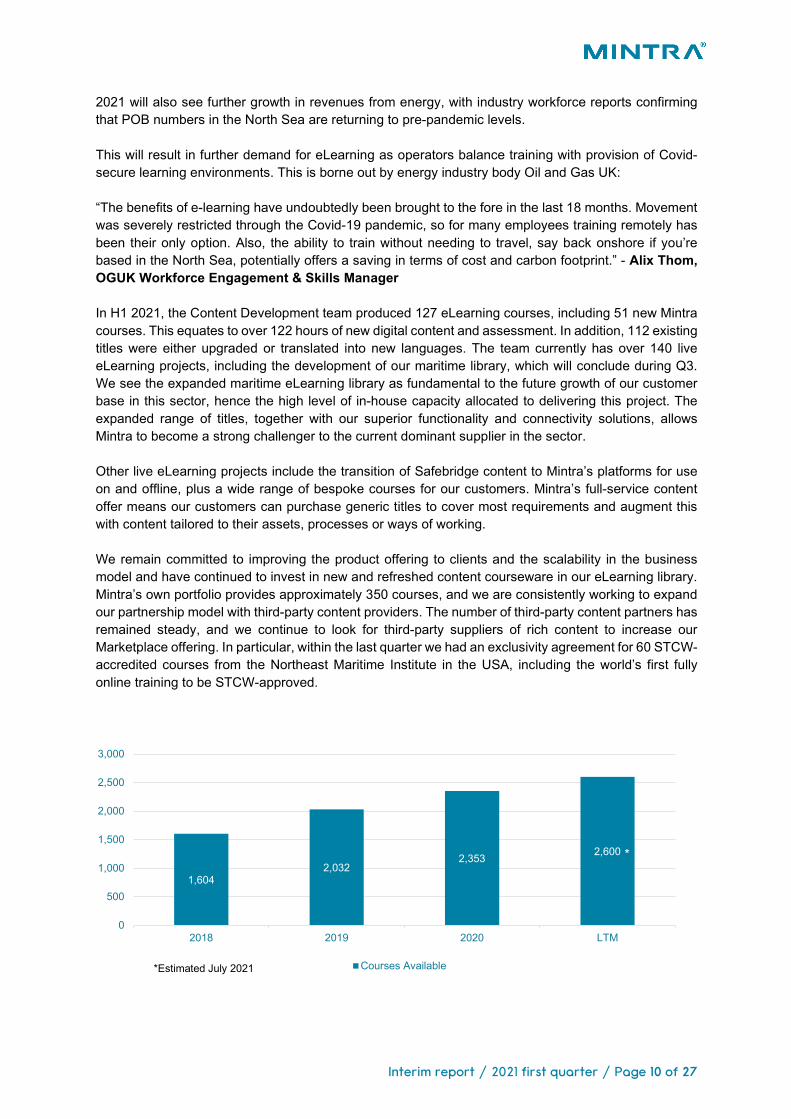
2021 will also see further growth in revenues from energy, with industry workforce reports confirming that POB numbers in the North Sea are returning to pre-pandemic levels. This will result in further demand for eLearning as operators balance training with provision of Covid-secure learning environments. This is borne out by energy industry body Oil and Gas UK: “The benefits of e-learning have undoubtedly been brought to the fore in the last 18 months. Movement was severely restricted through the Covid-19 pandemic, so for many employees training remotely has been their only option. Also, the ability to train without needing to travel, say back onshore if you’re based in the North Sea, potentially offers a saving in terms of cost and carbon footprint.” - Alix Thom, OGUK Workforce Engagement & Skills Manager In H1 2021, the Content Development team produced 127 eLearning courses, including 51 new Mintra courses. This equates to over 122 hours of new digital content and assessment. In addition, 112 existing titles were either upgraded or translated into new languages. The team currently has over 140 live eLearning projects, including the development of our maritime library, which will conclude during Q3. We see the expanded maritime eLearning library as fundamental to the future growth of our customer base in this sector, hence the high level of in-house capacity allocated to delivering this project. The expanded range of titles, together with our superior functionality and connectivity solutions, allows Mintra to become a strong challenger to the current dominant supplier in the sector. Other live eLearning projects include the transition of Safebridge content to Mintra’s platforms for use on and offline, plus a wide range of bespoke courses for our customers. Mintra’s full-service content offer means our customers can purchase generic titles to cover most requirements and augment this with content tailored to their assets, processes or ways of working. We remain committed to improving the product offering to clients and the scalability in the business model and have continued to invest in new and refreshed content courseware in our eLearning library. Mintra’s own portfolio provides approximately 350 courses, and we are consistently working to expand our partnership model with third-party content providers. The number of third-party content partners has remained steady, and we continue to look for third-party suppliers of rich content to increase our Marketplace offering. In particular, within the last quarter we had an exclusivity agreement for 60 STCW-accredited courses from the Northeast Maritime Institute in the USA, including the world’s first fully online training to be STCW-approved.
1,6042,032
2,353 2,600
0
500
1,000
1,500
2,000
2,500
3,000
2018 2019 2020 LTM
Courses Available
*
*Estimated July 2021
Interim report / 2021 first quarter / Page 11 of 27
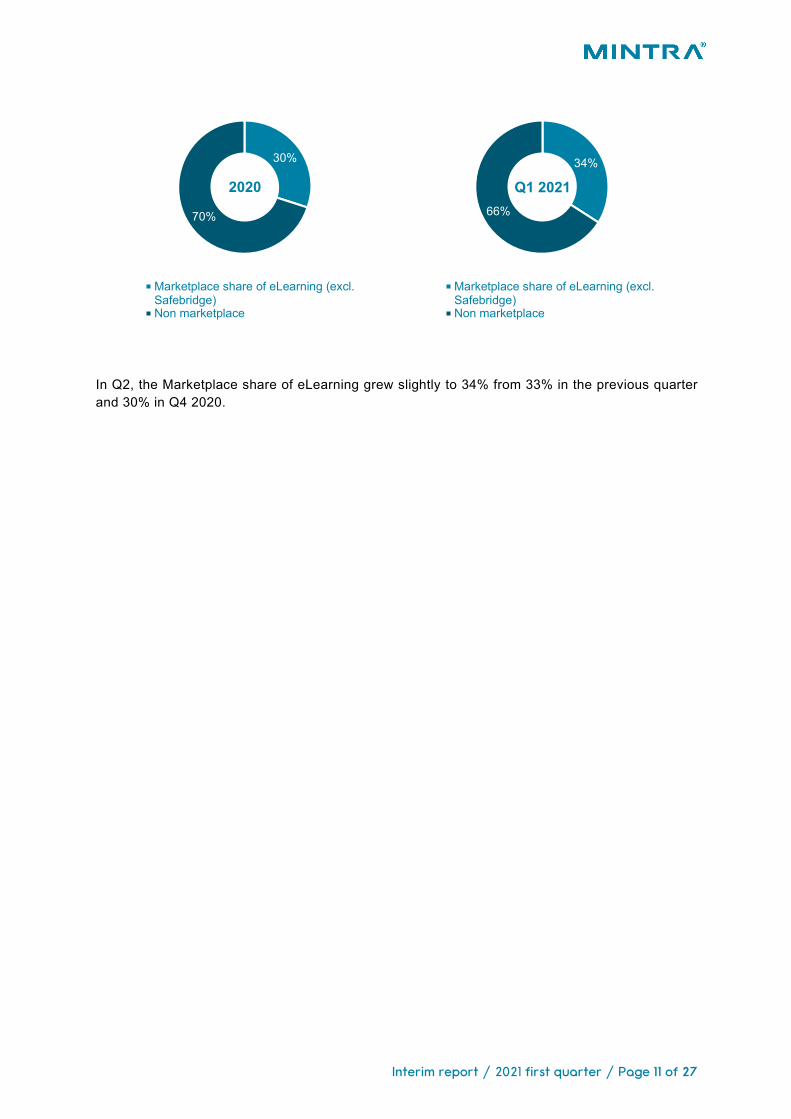
In Q2, the Marketplace share of eLearning grew slightly to 34% from 33% in the previous quarter and 30% in Q4 2020.
30%
70%
Marketplace share of eLearning (excl.Safebridge)Non marketplace
34%
66%
Marketplace share of eLearning (excl.Safebridge)Non marketplace
Q1 20212020
Interim report / 2021 first quarter / Page 12 of 27
Consultancy & other
Mintra’s consultancy segment serves three main functions:
• External consultancy services • Bespoke content development for external customers • In-house content development, enhancing our eLearning offering
The Other segment includes low-margin classroom training, which is available on Marketplace and managed by third party providers.
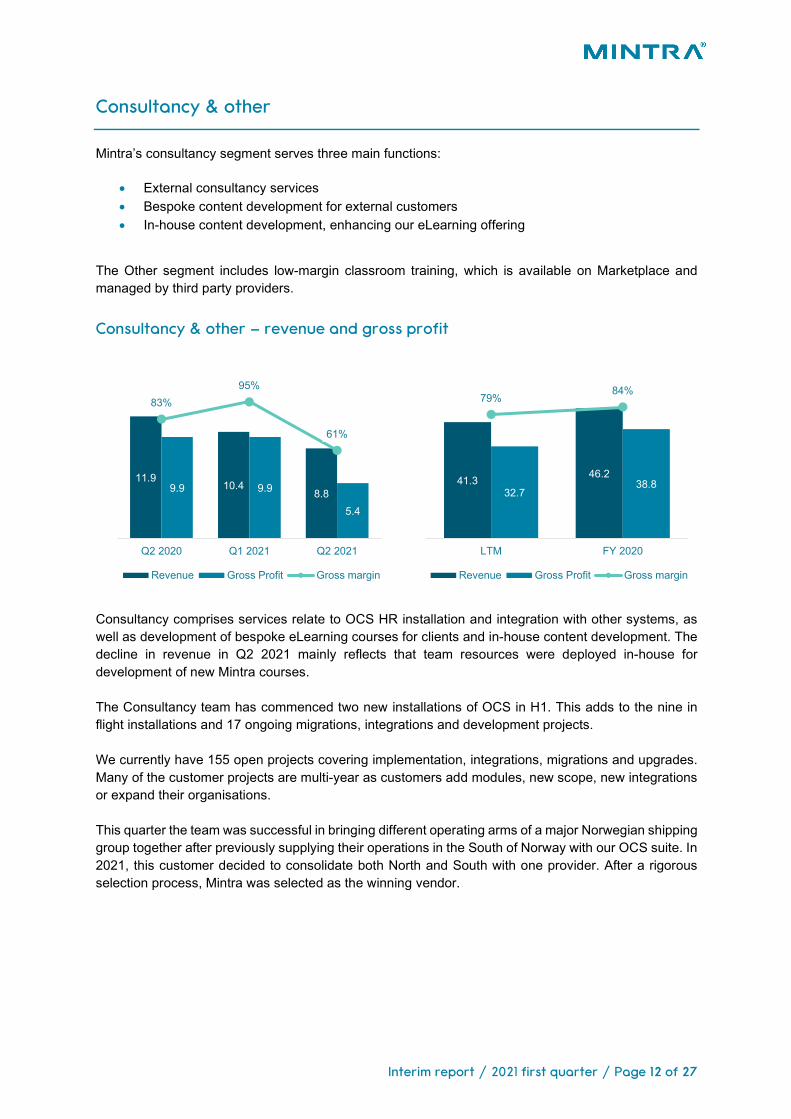
Consultancy & other – revenue and gross profit
Consultancy comprises services relate to OCS HR installation and integration with other systems, as well as development of bespoke eLearning courses for clients and in-house content development. The decline in revenue in Q2 2021 mainly reflects that team resources were deployed in-house for development of new Mintra courses. The Consultancy team has commenced two new installations of OCS in H1. This adds to the nine in flight installations and 17 ongoing migrations, integrations and development projects. We currently have 155 open projects covering implementation, integrations, migrations and upgrades. Many of the customer projects are multi-year as customers add modules, new scope, new integrations or expand their organisations. This quarter the team was successful in bringing different operating arms of a major Norwegian shipping group together after previously supplying their operations in the South of Norway with our OCS suite. In 2021, this customer decided to consolidate both North and South with one provider. After a rigorous selection process, Mintra was selected as the winning vendor.
11.910.4
8.89.9 9.9
5.4
83%95%
61%
Q2 2020 Q1 2021 Q2 2021
Revenue Gross Profit Gross margin
41.3 46.2
32.738.8
79%84%
LTM FY 2020
Revenue Gross Profit Gross margin
Interim report / 2021 first quarter / Page 13 of 27
Organisational development
The Mintra team Mintra employed 146 people at the end of June 2021. The majority of employees are based at the offices in Bergen, Stavanger, Oslo, Limassol and Aberdeen, and the company also has representation in Amsterdam, Cyprus, Dubai, Hyderabad and Singapore. Mintra is an equal opportunity employer celebrating diversity and acknowledges that differences make the organisation stronger. We strive to create a workplace that is fair and inclusive. As of the AGM on 26 May, COO Kevin Short assumed the position as CEO of Mintra ASA, replacing Scott Kerr who was elected as a new Board member of the company. In the first half of 2021, we took the first steps towards rolling out a competency framework across the entire organisation to support career pathways and ongoing professional development. The framework consists of role-specific functional competencies along with competencies relating to the overall business that are applicable to all roles in Mintra. Implementing the competency framework has been a major exercise and was initiated following requests from our people for greater support with career planning.
ESG Mintra recognises that it must operate in a way that is sustainable and responsible. We want to deliver financial value but understand we must also measure the value we add to communities locally and globally through positive societal and environmental impact. While we believe our digital learning business model facilities environmental benefits and a drive towards a carbon-neutral society, we recognise this does not go far enough in terms of our responsibilities to all our stakeholders. We want to examine how we embed responsible business practices across all our operations and commenced preparations for an exploratory audit in Q2 2021. When complete, we will use this information to examine how we measure against reporting performance standards and to set out a roadmap for how we ensure a consistently high level of ESG response. Mintra recognises the important role of the community in which it operates. The company regularly undertakes charitable activities in both Norway and the UK and has built up strong relationships with several local organisations and good causes. We continue to maintain close links with research and development organisations and support pupils with work experience placements and sponsorship of educational awards, most recently The Robert Gordon University BSc (Hons) Computer Sciences Student of the Year 2021.
Data security Data security is an important part of Mintra’s commercial offering. The software systems have been reviewed against General Data Protection Regime (GDPR) requirements and provide customers with the necessary protection and control needed for GDPR compliance. All software solutions are designed with data security as a key component. We have a robust testing programme for all solutions, with extensive integrity testing. There were no critical findings in 2020 or in H1 2021.
Interim report / 2021 first quarter / Page 14 of 27
Financial review
Accounting principles The financial statements have been prepared in accordance with the International Financial Reporting Standards (IFRS). The information contained in this statement has not been audited and may be subject to change (although any reference to ‘2020’ outturn reflect the audited financial statements of 2020, which were signed by the auditors on 29 April 2021). The interim financial statements are presented in NOK.
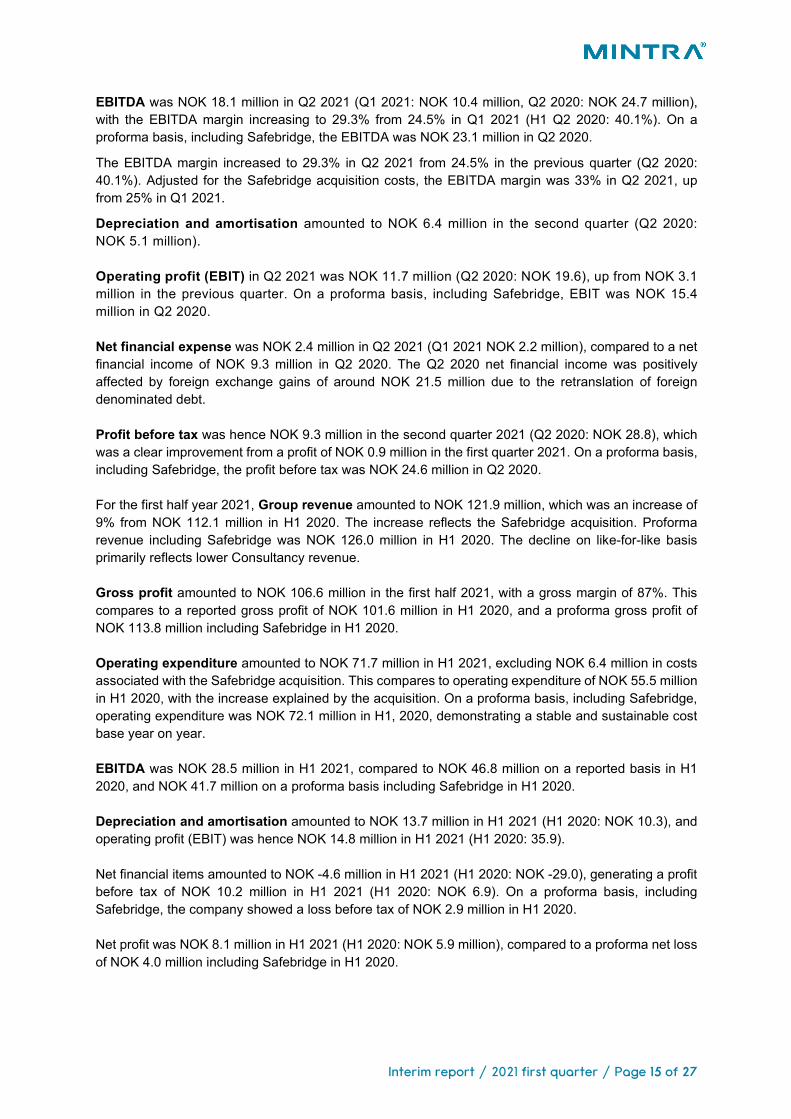
Profit & loss – second quarter 2021
Note: IFRS figures, unaudited (pro-forma basis) Group revenue in the second quarter amounted to NOK 61.8 million, showing growth on Q1 2021 revenues of NOK 1.8 million. Revenues from the Safebridge business totalled 12.3 million (Q1 2021: 12.2 million). This compares with reported revenue of NOK 51.2 million in Q2 2020, and NOK 57.6 on a proforma basis including Safebridge. Revenues from eLearning increased NOK 2.1 million from Q1 2021 to NOK 32.4 million, continuing the turnaround in course usage from the trough in Q4 2020. HCM revenues rebounded in Q2 2021, showing an increase of NOK 1.3 million from Q1 2021 to NOK 20.6 million in Q2 2021. Consultancy activity declined by NOK 1.6 million from Q1 2021 to NOK 8.8 million in Q2 2021, as more team resources were deployed on developing eLearning content for the Mintra maritime library. Gross profit was NOK 54.1 million in the second quarter (Q1 2021: NOK 52.5 million, Q2 2020: NOK 48.0 million). The gross margin remains strong at 88% (Q1 2021: 87%, Q2 2020: 94%). Operating expenditure totalled NOK 34.0 million in the second quarter, excluding costs associated with the Safebridge acquisition of NOK 2.0 million. This was an increase of NOK 3.4 million on a like for like, proforma basis on Q2 2020. However, costs declined from Q1 2021, when operating expenditure amounted to NOK 37.8 million.
51.260.0 61.8
48.0 52.5 54.1
24.714.7 20.2
48%
25%
33%
Q2 2020 Q1 2021 Q2 2021
Revenue Gross profit EBITDA EBITDA margin (ex M&A costs)
Interim report / 2021 first quarter / Page 15 of 27
EBITDA was NOK 18.1 million in Q2 2021 (Q1 2021: NOK 10.4 million, Q2 2020: NOK 24.7 million), with the EBITDA margin increasing to 29.3% from 24.5% in Q1 2021 (H1 Q2 2020: 40.1%). On a proforma basis, including Safebridge, the EBITDA was NOK 23.1 million in Q2 2020.
The EBITDA margin increased to 29.3% in Q2 2021 from 24.5% in the previous quarter (Q2 2020: 40.1%). Adjusted for the Safebridge acquisition costs, the EBITDA margin was 33% in Q2 2021, up from 25% in Q1 2021.
Depreciation and amortisation amounted to NOK 6.4 million in the second quarter (Q2 2020: NOK 5.1 million). Operating profit (EBIT) in Q2 2021 was NOK 11.7 million (Q2 2020: NOK 19.6), up from NOK 3.1 million in the previous quarter. On a proforma basis, including Safebridge, EBIT was NOK 15.4 million in Q2 2020. Net financial expense was NOK 2.4 million in Q2 2021 (Q1 2021 NOK 2.2 million), compared to a net financial income of NOK 9.3 million in Q2 2020. The Q2 2020 net financial income was positively affected by foreign exchange gains of around NOK 21.5 million due to the retranslation of foreign denominated debt. Profit before tax was hence NOK 9.3 million in the second quarter 2021 (Q2 2020: NOK 28.8), which was a clear improvement from a profit of NOK 0.9 million in the first quarter 2021. On a proforma basis, including Safebridge, the profit before tax was NOK 24.6 million in Q2 2020. For the first half year 2021, Group revenue amounted to NOK 121.9 million, which was an increase of 9% from NOK 112.1 million in H1 2020. The increase reflects the Safebridge acquisition. Proforma revenue including Safebridge was NOK 126.0 million in H1 2020. The decline on like-for-like basis primarily reflects lower Consultancy revenue. Gross profit amounted to NOK 106.6 million in the first half 2021, with a gross margin of 87%. This compares to a reported gross profit of NOK 101.6 million in H1 2020, and a proforma gross profit of NOK 113.8 million including Safebridge in H1 2020. Operating expenditure amounted to NOK 71.7 million in H1 2021, excluding NOK 6.4 million in costs associated with the Safebridge acquisition. This compares to operating expenditure of NOK 55.5 million in H1 2020, with the increase explained by the acquisition. On a proforma basis, including Safebridge, operating expenditure was NOK 72.1 million in H1, 2020, demonstrating a stable and sustainable cost base year on year. EBITDA was NOK 28.5 million in H1 2021, compared to NOK 46.8 million on a reported basis in H1 2020, and NOK 41.7 million on a proforma basis including Safebridge in H1 2020. Depreciation and amortisation amounted to NOK 13.7 million in H1 2021 (H1 2020: NOK 10.3), and operating profit (EBIT) was hence NOK 14.8 million in H1 2021 (H1 2020: 35.9). Net financial items amounted to NOK -4.6 million in H1 2021 (H1 2020: NOK -29.0), generating a profit before tax of NOK 10.2 million in H1 2021 (H1 2020: NOK 6.9). On a proforma basis, including Safebridge, the company showed a loss before tax of NOK 2.9 million in H1 2020. Net profit was NOK 8.1 million in H1 2021 (H1 2020: NOK 5.9 million), compared to a proforma net loss of NOK 4.0 million including Safebridge in H1 2020.
Interim report / 2021 first quarter / Page 16 of 27
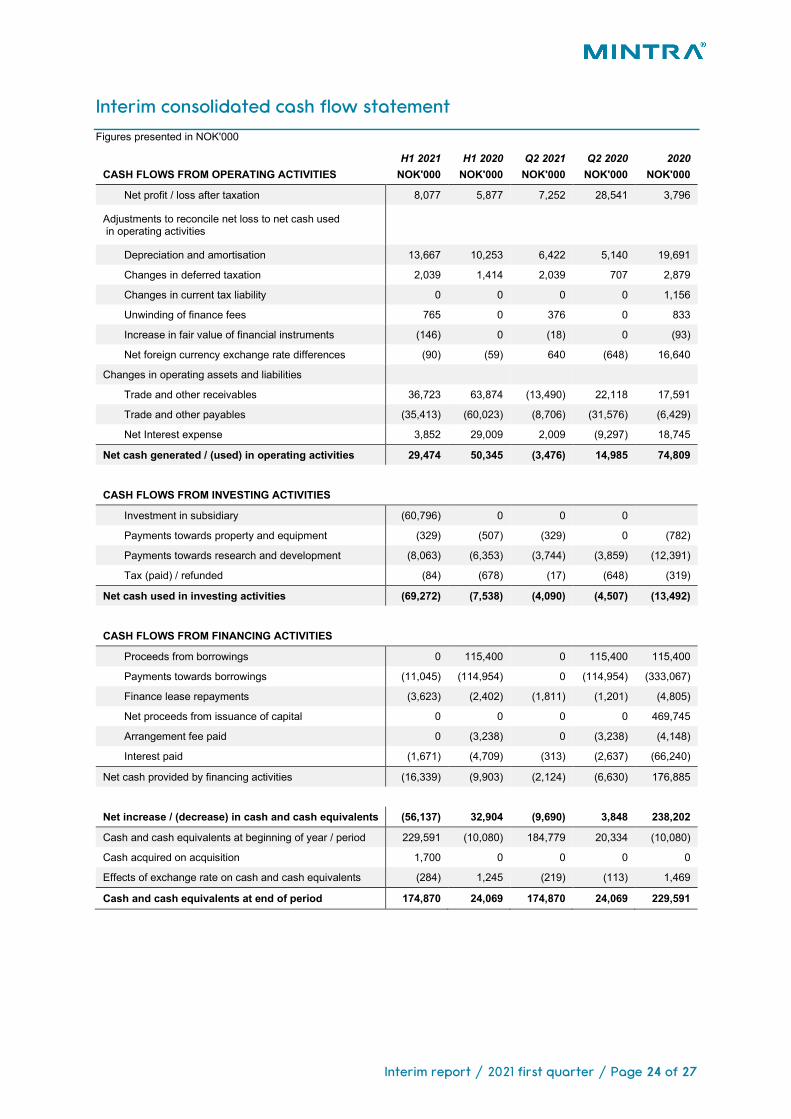
Cash flow Cash flow generated from operating activities was an outflow of NOK 3.5 million in the second quarter, driven by lower customer collections and increase in other debtors, amounting to NOK 13.5 million. The H1 2021 cash flow generated from operations stood at NOK 29.5 million, compared to NOK 50.3 million in H1 2020. Net cash flow from investing activities was negative NOK 7.5 million in the second quarter 2021 and negative NOK 69.2 million in H1 2021. Q1 2021 included the cash payment for Safebridge of NOK 60.8 million. This included NOK 35.9 million of debt in the business at the time of acquisition, which was settled as part of the cash payment. Capitalised R&D totalled NOK 8.4 million in H1 2021 (or 7% of revenues), which mainly reflects eLearning and HCM software development. Net cash flow from financing activities was an outflow of NOK 2.1 million in the second quarter 2021, following an outflow of 4.2 million in the first quarter 2021. This includes a repayment of Nordea debt of NOK 11.0 million and interest paid of NOK 1.7 million. Finance lease repayments relating to Right of use assets amounted to NOK 3.6 million. Cash and cash equivalents stood at NOK 174.9 million at the end of Q2, a reduction of NOK 9.7 million from NOK 184.8 million at the end of Q1 2021.
Interim report / 2021 first quarter / Page 17 of 27
Financial position & liquidity
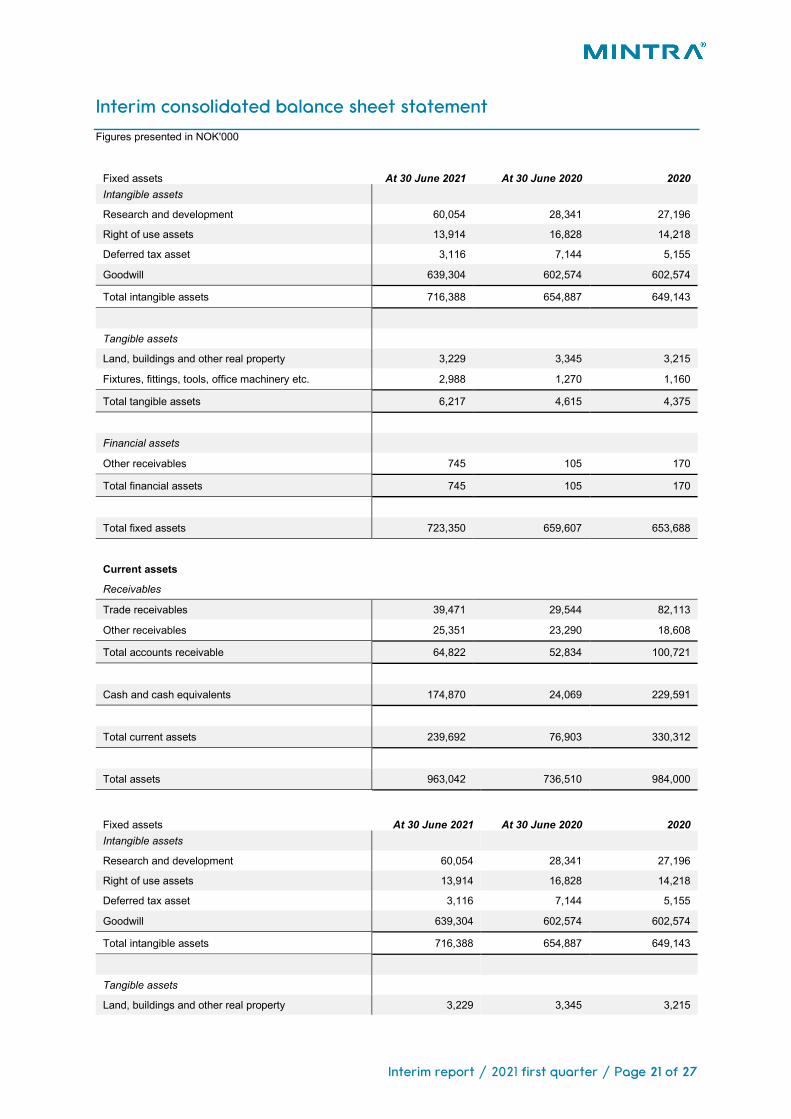
Assets Total intangible assets amounted to NOK 699.4 million at the end of Q2 2021 (Q1 2021: NOK 688.9 million), including NOK 639.3. million in goodwill, with the increase of 36.7 million in Q1 2021, which relates to the initial goodwill valuation of the Safebridge acquisition. R&D assets were NOK 60.1 million at the end of Q2, some NOK 32.9 million higher than FY 2020, with NOK 29.2 million of Maritime intellectual property recognised as part of the Safebridge acquisition, and a further NOK 3.3 million of assets under construction. The remaining net increase of NOK 0.4 million comprises NOK 9.8 million amortisation expense (being NOK 4.9 million in each of Q1 2021 and Q2 2021). NOK 1.8 million (being NOK 0.4 million in Q1 2021 and NOK 1.4 million in Q2 2021) of capitalised development expenditure and NOK 8.4 million (NOK 4.6 million in Q2 2021 and NOK 3.8 million in Q1 2021) of assets under construction. The movement in right of use assets – a reduction of NOK 0.8 million is related solely to amortisation expense in Q2 2021. Total tangible assets amounted to NOK 6.2 million (Q1 2021: NOK 5.5 million), including UK-based property and office fixtures, fittings, and equipment. The increase is due primarily to tangible assets acquired of NOK 0.3m, with the balance relating to retranslation of non-NOK denominated assets at the resultant exchange rates at end of Q2 2021, less depreciation charge expensed in Q2 2021 of NOK 0.1 million. Total accounts receivables amounted to NOK 39.5 million at the end of Q2, an increase of NOK 6.3 million from Q4 2020, resulting from accelerated quarter-end customer invoicing and a marginal increase in average customer collection period.
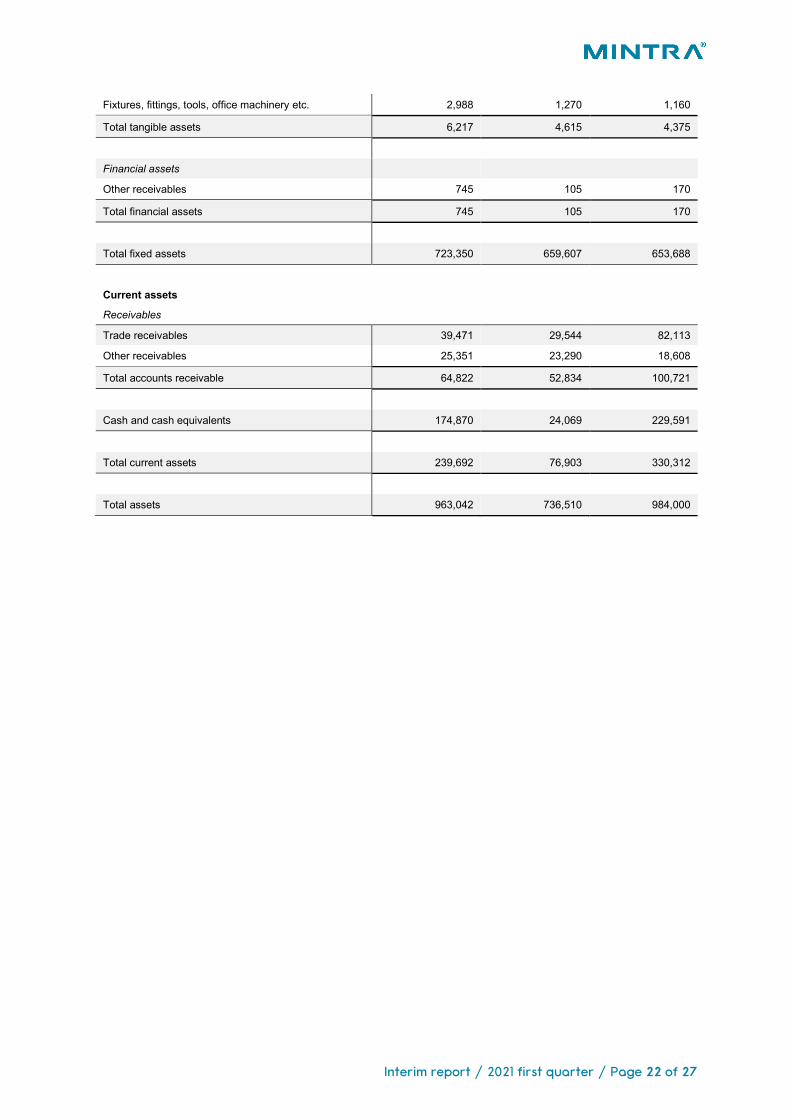
Equity & liabilities Mintra had total equity of NOK 728.4 million at the end of Q2, an increase of NOK 8.8 million, being retained profit for Q2 of NOK 7.3 million and a gain on translation of non – NOK denominated balances totalling NOK 1.5 million. Total long-term liabilities amounted to NOK 103.0 million (Q1 2021: NOK 136.1 million), comprises the long-term part of debt to Nordea of NOK 90.9 million (Q1 2021: NOK 90.2 million) and the long-term portion of finance lease liabilities relating to Right of use assets amounting to NOK 12.1 million (Q1 2021: NOK 13.4 million). Total current liabilities were NOK 126.3 million (Q1 2021: NOK 136.1 million), a reduction of NOK 9.8 million. All key components of current liabilities remain at Q1 levels, with only other short-term payables accounting for all of the overall reduction, principally relating to unwinding of deferred HCM subscription revenue.
Interim report / 2021 first quarter / Page 18 of 27
Outlook Mintra continues to be well positioned for profitable growth in an eLearning market set for expansion after the Covid-19 pandemic, and with strong crew management software and digital training platform solutions. The company has a loyal customer base with 98% repeat and recurring revenue, high gross margins, and high operational leverage on a sustainably low-cost base. The company is pursuing a growth strategy combining organic growth and acquisitions and believes scale effects will generate margin improvements in a strengthening market environment. Mintra made significant operational and financial progress in Q2 2021, with continued quarter-on-quarter pick-up in eLearning revenue and a rebound in HCM software revenue after a temporary dip in Q1 2021. Consulting revenue declined as the company has deployed team resources to in-house development of new courses, which has enabled the company to launch a new and complete maritime library in Q3 2021. The integration and turnaround of Safebridge continued at full speed in the second quarter, with Safebridge contributing positively to EBITDA in the quarter. Including Safebridge, the maritime revenue continues to increase with both maritime and energy sharing over 40% and other industries accounting for 17%. The company sees continued strong potential in the maritime sector and believes the launch of a larger maritime eLearning library to a broader customer base will drive growth going forward. The company is cautiously optimistic for a rebound in eLearning usage in the energy sector, as the number of POB (personnel on board) is gradually normalising in the North Sea and the benefits of eLearning – cost and time efficiencies along with a contribution to the industry’s net zero targets - has been brought to the fore in the last 18 months. Mintra is moving forward with sales initiatives towards trade schools in India, although progress continues to be hampered by Covid-19 and low vaccination rates. Mintra’s technologies and course libraries are being recognised as vital tools for worker development in safety-critical industries, and the company sees a real opportunity to increase the eLearning customer base in the region as the Covid-19 situation improves. In H2 2021, the company will specifically target one state with more than 400 trade schools. As communicated in the previous interim report, Mintra expected growth to be back-end loaded in 2021 due to the persisting effects of Covid-19. The company expects increasing top-line and margin expansion in the second half of the year and maintains its 2021 target of 10%+ organic revenue growth and 35%-40% margin excluding acquisition costs. The company also reiterates its medium to long-term targets for organic growth above 15% and EBITDA-margins above 40%.
Interim report / 2021 first quarter / Page 19 of 27
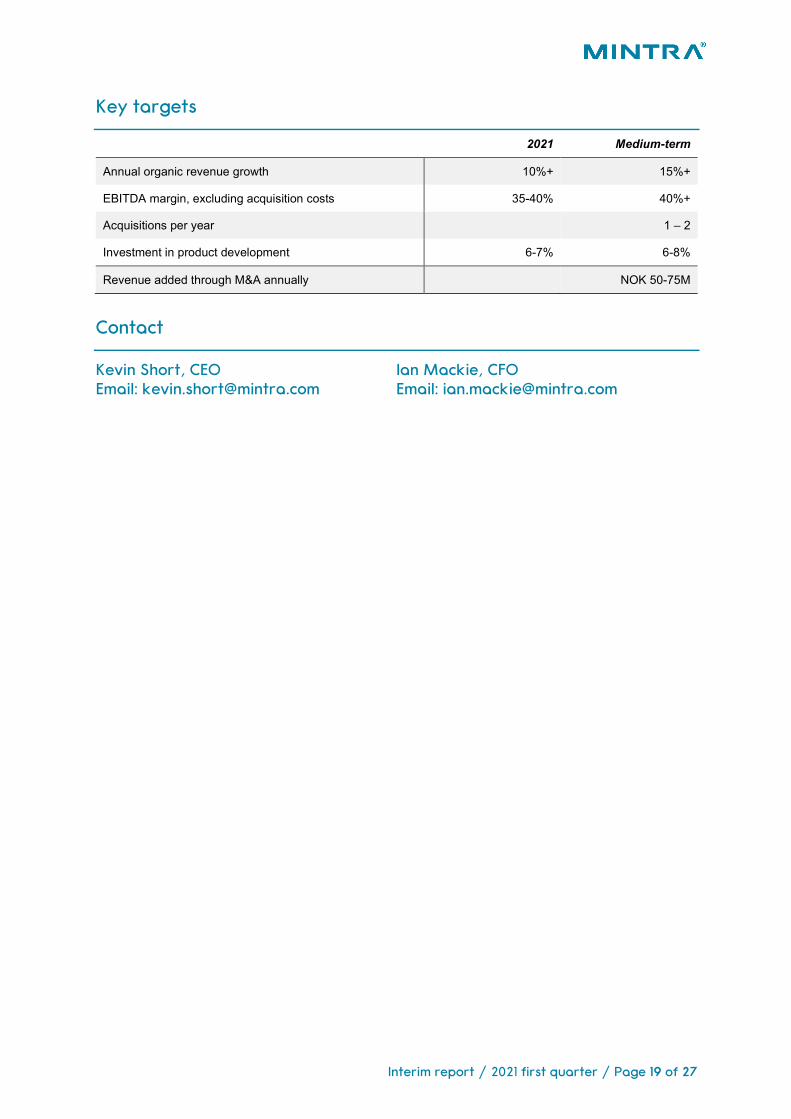
Key targets
2021 Medium-term
Annual organic revenue growth 10%+ 15%+
EBITDA margin, excluding acquisition costs 35-40% 40%+
Acquisitions per year 1 – 2
Investment in product development 6-7% 6-8%
Revenue added through M&A annually NOK 50-75M
Contact Kevin Short, CEO Email: [email protected]
Ian Mackie, CFO Email: [email protected]
Interim report / 2021 first quarter / Page 20 of 27
Interim statements
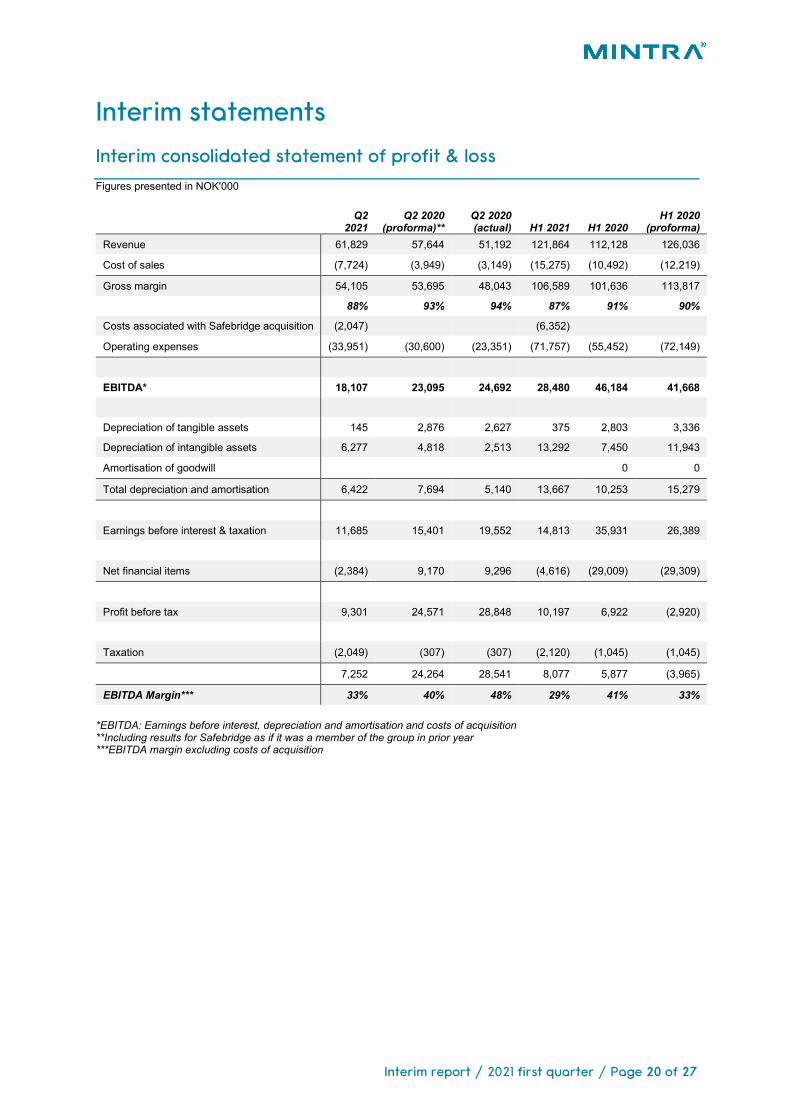
Interim consolidated statement of profit & loss Figures presented in NOK'000
Q2
2021 Q2 2020
(proforma)** Q2 2020 (actual) H1 2021 H1 2020
H1 2020 (proforma)
Revenue 61,829 57,644 51,192 121,864 112,128 126,036
Cost of sales (7,724) (3,949) (3,149) (15,275) (10,492) (12,219)
Gross margin 54,105 53,695 48,043 106,589 101,636 113,817 88% 93% 94% 87% 91% 90%
Costs associated with Safebridge acquisition (2,047) (6,352)
Operating expenses (33,951) (30,600) (23,351) (71,757) (55,452) (72,149)
EBITDA* 18,107 23,095 24,692 28,480 46,184 41,668
Depreciation of tangible assets 145 2,876 2,627 375 2,803 3,336
Depreciation of intangible assets 6,277 4,818 2,513 13,292 7,450 11,943
Amortisation of goodwill 0 0
Total depreciation and amortisation 6,422 7,694 5,140 13,667 10,253 15,279
Earnings before interest & taxation 11,685 15,401 19,552 14,813 35,931 26,389
Net financial items (2,384) 9,170 9,296 (4,616) (29,009) (29,309)
Profit before tax 9,301 24,571 28,848 10,197 6,922 (2,920)
Taxation (2,049) (307) (307) (2,120) (1,045) (1,045) 7,252 24,264 28,541 8,077 5,877 (3,965)
EBITDA Margin*** 33% 40% 48% 29% 41% 33% *EBITDA: Earnings before interest, depreciation and amortisation and costs of acquisition **Including results for Safebridge as if it was a member of the group in prior year ***EBITDA margin excluding costs of acquisition
Interim report / 2021 first quarter / Page 21 of 27
Interim consolidated balance sheet statement Figures presented in NOK'000
Fixed assets At 30 June 2021 At 30 June 2020 2020 Intangible assets
Research and development 60,054 28,341 27,196
Right of use assets 13,914 16,828 14,218
Deferred tax asset 3,116 7,144 5,155
Goodwill 639,304 602,574 602,574
Total intangible assets 716,388 654,887 649,143
Tangible assets
Land, buildings and other real property 3,229 3,345 3,215
Fixtures, fittings, tools, office machinery etc. 2,988 1,270 1,160
Total tangible assets 6,217 4,615 4,375
Financial assets
Other receivables 745 105 170
Total financial assets 745 105 170
Total fixed assets 723,350 659,607 653,688
Current assets
Receivables
Trade receivables 39,471 29,544 82,113
Other receivables 25,351 23,290 18,608
Total accounts receivable 64,822 52,834 100,721
Cash and cash equivalents 174,870 24,069 229,591
Total current assets 239,692 76,903 330,312
Total assets 963,042 736,510 984,000
Fixed assets At 30 June 2021 At 30 June 2020 2020 Intangible assets
Research and development 60,054 28,341 27,196
Right of use assets 13,914 16,828 14,218
Deferred tax asset 3,116 7,144 5,155
Goodwill 639,304 602,574 602,574
Total intangible assets 716,388 654,887 649,143
Tangible assets
Land, buildings and other real property 3,229 3,345 3,215
Interim report / 2021 first quarter / Page 22 of 27
Fixtures, fittings, tools, office machinery etc. 2,988 1,270 1,160
Total tangible assets 6,217 4,615 4,375
Financial assets
Other receivables 745 105 170
Total financial assets 745 105 170
Total fixed assets 723,350 659,607 653,688
Current assets
Receivables
Trade receivables 39,471 29,544 82,113
Other receivables 25,351 23,290 18,608
Total accounts receivable 64,822 52,834 100,721
Cash and cash equivalents 174,870 24,069 229,591
Total current assets 239,692 76,903 330,312
Total assets 963,042 736,510 984,000
Interim report / 2021 first quarter / Page 23 of 27
Interim consolidated balance sheet statement, continued Figures presented in NOK'000
Equity At 30 June
2021 At 30 June
2020 2020 Paid-in capital
Share capital 5,578 4,032 5,578
Share premium reserve 826,222 356,374 826,222
Total paid-in capital 831,800 360,406 831,800
Retained earnings
Other equity (103,439) (109,986) (113,474)
Total retained earnings (103,439) (109,986) (113,474)
Total equity 728,361 250,420 718,326
Liabilities
Provisions
Deferred tax liability 5,425 3,702 3,399
Total provisions 5,425 3,702 3,399
Other long-term liabilities
Liabilities to financial institutions 90,859 115,217 100,882
Other long-term liabilities 12,146 15,766 13,342
Total other long-term liabilities 103,005 130,983 114,224
Current liabilities
Liabilities to financial institutions 9,987 226,691 9,815
Trade creditors 7,616 6,457 6,606
Tax payable 891 (116) 1,156
Public duties payable 7,630 10,316 19,836
Other short-term liabilities 100,127 108,057 110,638
Total current liabilities 126,251 351,405 148,051
Total liabilities 234,681 486,090 265,674
Total equity and liabilities 963,042 736,510 984,000
Interim report / 2021 first quarter / Page 24 of 27
Interim consolidated cash flow statement Figures presented in NOK'000
H1 2021 H1 2020 Q2 2021 Q2 2020 2020 CASH FLOWS FROM OPERATING ACTIVITIES NOK'000 NOK'000 NOK'000 NOK'000 NOK'000
Net profit / loss after taxation 8,077 5,877 7,252 28,541 3,796
Adjustments to reconcile net loss to net cash used in operating activities
Depreciation and amortisation 13,667 10,253 6,422 5,140 19,691
Changes in deferred taxation 2,039 1,414 2,039 707 2,879
Changes in current tax liability 0 0 0 0 1,156
Unwinding of finance fees 765 0 376 0 833
Increase in fair value of financial instruments (146) 0 (18) 0 (93)
Net foreign currency exchange rate differences (90) (59) 640 (648) 16,640
Changes in operating assets and liabilities
Trade and other receivables 36,723 63,874 (13,490) 22,118 17,591
Trade and other payables (35,413) (60,023) (8,706) (31,576) (6,429)
Net Interest expense 3,852 29,009 2,009 (9,297) 18,745
Net cash generated / (used) in operating activities 29,474 50,345 (3,476) 14,985 74,809
CASH FLOWS FROM INVESTING ACTIVITIES
Investment in subsidiary (60,796) 0 0 0
Payments towards property and equipment (329) (507) (329) 0 (782)
Payments towards research and development (8,063) (6,353) (3,744) (3,859) (12,391)
Tax (paid) / refunded (84) (678) (17) (648) (319)
Net cash used in investing activities (69,272) (7,538) (4,090) (4,507) (13,492)
CASH FLOWS FROM FINANCING ACTIVITIES
Proceeds from borrowings 0 115,400 0 115,400 115,400
Payments towards borrowings (11,045) (114,954) 0 (114,954) (333,067)
Finance lease repayments (3,623) (2,402) (1,811) (1,201) (4,805)
Net proceeds from issuance of capital 0 0 0 0 469,745
Arrangement fee paid 0 (3,238) 0 (3,238) (4,148)
Interest paid (1,671) (4,709) (313) (2,637) (66,240)
Net cash provided by financing activities (16,339) (9,903) (2,124) (6,630) 176,885
Net increase / (decrease) in cash and cash equivalents (56,137) 32,904 (9,690) 3,848 238,202
Cash and cash equivalents at beginning of year / period 229,591 (10,080) 184,779 20,334 (10,080)
Cash acquired on acquisition 1,700 0 0 0 0
Effects of exchange rate on cash and cash equivalents (284) 1,245 (219) (113) 1,469
Cash and cash equivalents at end of period 174,870 24,069 174,870 24,069 229,591
Interim report / 2021 first quarter / Page 25 of 27
Segmental information
Geographic distribution of revenue Figures presented in NOKm
H1 2021 Q2 2021 H1 2020 FY 2020
Norway 55.7 27.5 54.3 115.9
Rest of Europe 46.0 25.4 42.1 65.6
Americas 4.4 2.3 3.0 6.1
Middle East & Asia 15.7 6.6 12.8 17.7
Total 121.8 61.8 112.2 205.3
Revenue by business segment Figures presented in NOKm
H1 2021
H1 2020 (proforma)* H1 2020 Q2 2021
Q2 2020 (proforma)*
Q2 2021 ex. Safebridge
eLearning 62.7 60.0 46.6 32.4 26.2 21.6
Software 39.9 43.5 43.5 20.6 20.8 21.8
Consultancy 15.3 19.6 19.6 6.4 10.0 8.7
Other 3.9 3.0 2.5 2.4 0.7 1.7
Total 121.8 126.1 112.2 61.8 57.7 53.8
Interim report / 2021 first quarter / Page 26 of 27
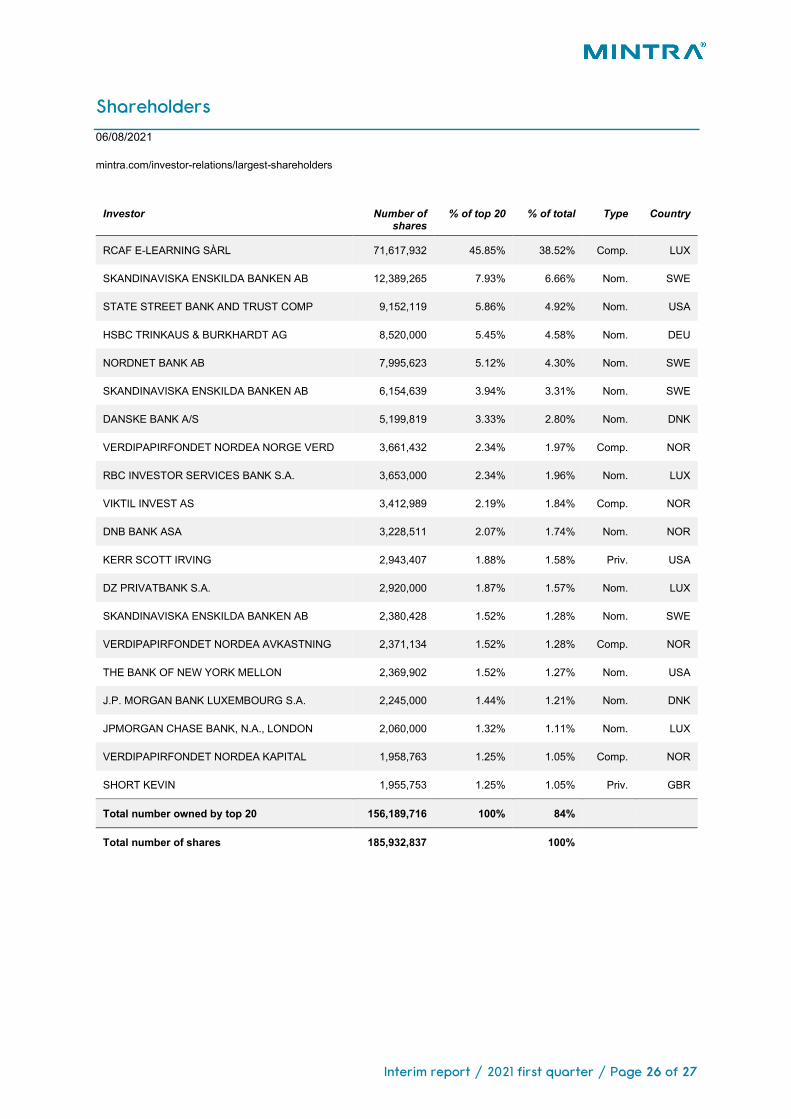
Shareholders 06/08/2021
mintra.com/investor-relations/largest-shareholders
Investor Number of
shares % of top 20 % of total Type Country
RCAF E-LEARNING SÀRL 71,617,932 45.85% 38.52% Comp. LUX
SKANDINAVISKA ENSKILDA BANKEN AB 12,389,265 7.93% 6.66% Nom. SWE
STATE STREET BANK AND TRUST COMP 9,152,119 5.86% 4.92% Nom. USA
HSBC TRINKAUS & BURKHARDT AG 8,520,000 5.45% 4.58% Nom. DEU
NORDNET BANK AB 7,995,623 5.12% 4.30% Nom. SWE
SKANDINAVISKA ENSKILDA BANKEN AB 6,154,639 3.94% 3.31% Nom. SWE
DANSKE BANK A/S 5,199,819 3.33% 2.80% Nom. DNK
VERDIPAPIRFONDET NORDEA NORGE VERD 3,661,432 2.34% 1.97% Comp. NOR
RBC INVESTOR SERVICES BANK S.A. 3,653,000 2.34% 1.96% Nom. LUX
VIKTIL INVEST AS 3,412,989 2.19% 1.84% Comp. NOR
DNB BANK ASA 3,228,511 2.07% 1.74% Nom. NOR
KERR SCOTT IRVING 2,943,407 1.88% 1.58% Priv. USA
DZ PRIVATBANK S.A. 2,920,000 1.87% 1.57% Nom. LUX
SKANDINAVISKA ENSKILDA BANKEN AB 2,380,428 1.52% 1.28% Nom. SWE
VERDIPAPIRFONDET NORDEA AVKASTNING 2,371,134 1.52% 1.28% Comp. NOR
THE BANK OF NEW YORK MELLON 2,369,902 1.52% 1.27% Nom. USA
J.P. MORGAN BANK LUXEMBOURG S.A. 2,245,000 1.44% 1.21% Nom. DNK
JPMORGAN CHASE BANK, N.A., LONDON 2,060,000 1.32% 1.11% Nom. LUX
VERDIPAPIRFONDET NORDEA KAPITAL 1,958,763 1.25% 1.05% Comp. NOR
SHORT KEVIN 1,955,753 1.25% 1.05% Priv. GBR
Total number owned by top 20 156,189,716 100% 84%
Total number of shares 185,932,837 100%
Offshore House, Claymore Drive, Aberdeen, UK AB23 8GD +44 (0)1224 651340 Strawinskylaan 4117, Amsterdam Netherlands 1077 ZX Fjøsangerveien 50D, NO-5059 Bergen, Norway +47 24 15 55 00 Office 5417 / Floor 54, Almas Tower, Jumeriah Lake Towers, Dubai +971 (4) 383 5548 11 Agias Zonis Street, Limassol 3027, Cyprus +357 25 001490 Storgata 3, NO-0155 Oslo, Norway +47 24 15 55 00 78 Shenton Way #16-02, Singapore 079120 +65 6904 4416 iPark, Prof. Olav Hanssensvei 7A, NO-4068 Stavanger, Norway +47 24 15 55 00
[email protected] mintra.com


![Playtech interim results for H1 2013[1]](https://img.pdfslide.net/doc/110x75/62064f918c2f7b17300682f5/playtech-interim-results-for-h1-20131.jpg)