Embed Size (px)
Citation preview
1
ZON OPTIMUS, SGPS, SA
CONSOLIDATED MANAGEMENT REPORT
1Q14
2
CONSOLIDATED MANAGEMENT REPORT 1Q14
TABLE OF CONTENTS
1. KEY PERFORMANCE INDICATORS 3
2. 1Q14 HIGHLIGHTS 7
3. CORPORATE BODIES 9
4. MANAGEMENT REPORT 12
Business Review 13
Consolidated Financial Review 22
5. CONSOLIDATED FINANCIAL STATEMENTS 29
3
ZON OPTIMUS, SGPS, SA
1.
KPIs
4
CONSOLIDATED MANAGEMENT REPORT 1Q14
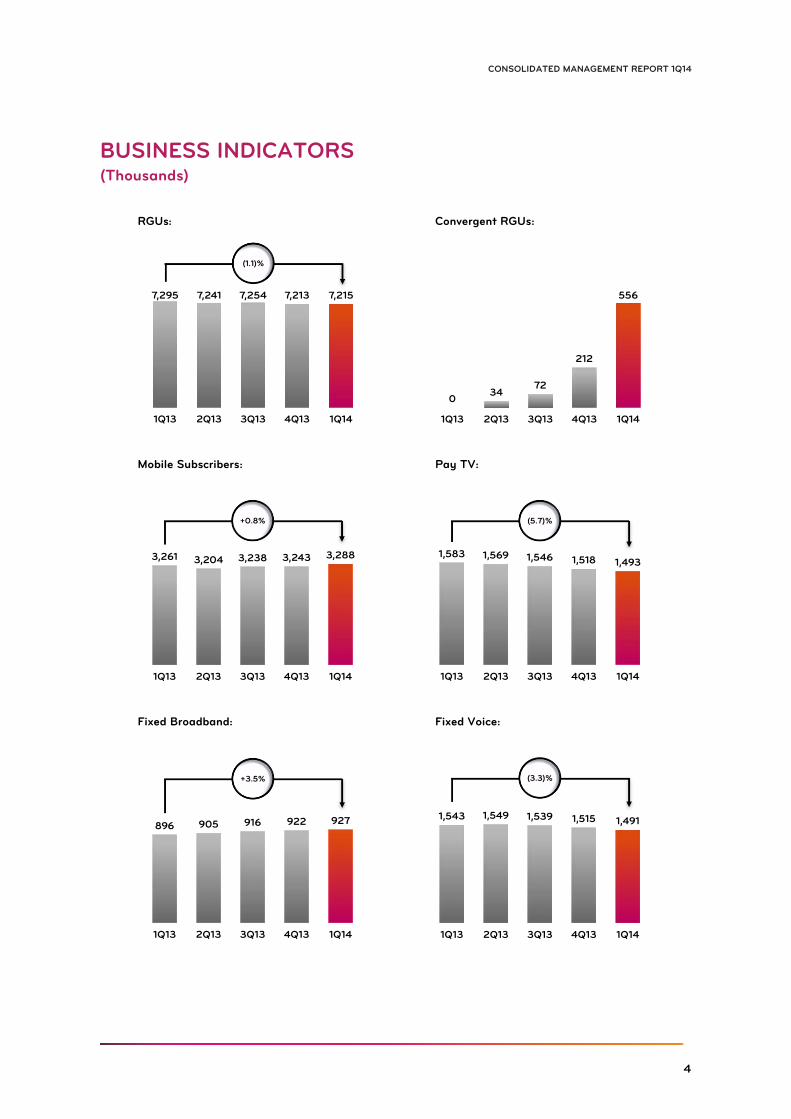
BUSINESS INDICATORS (Thousands)
RGUs: Convergent RGUs:
Mobile Subscribers: Pay TV:
Fixed Broadband: Fixed Voice:
7,295 7,241 7,254 7,213 7,215
1Q13 2Q13 3Q13 4Q13 1Q14
(1.1)%
034
72
212
556
1Q13 2Q13 3Q13 4Q13 1Q14
3,261 3,204 3,238 3,243 3,288
1Q13 2Q13 3Q13 4Q13 1Q14
+0.8%
1,583 1,569 1,546 1,518 1,493
1Q13 2Q13 3Q13 4Q13 1Q14
(5.7)%
896 905 916 922 927
1Q13 2Q13 3Q13 4Q13 1Q14
+3.5%
1,543 1,549 1,539 1,515 1,491
1Q13 2Q13 3Q13 4Q13 1Q14
(3.3)%
5
ZON OPTIMUS, SGPS, SA
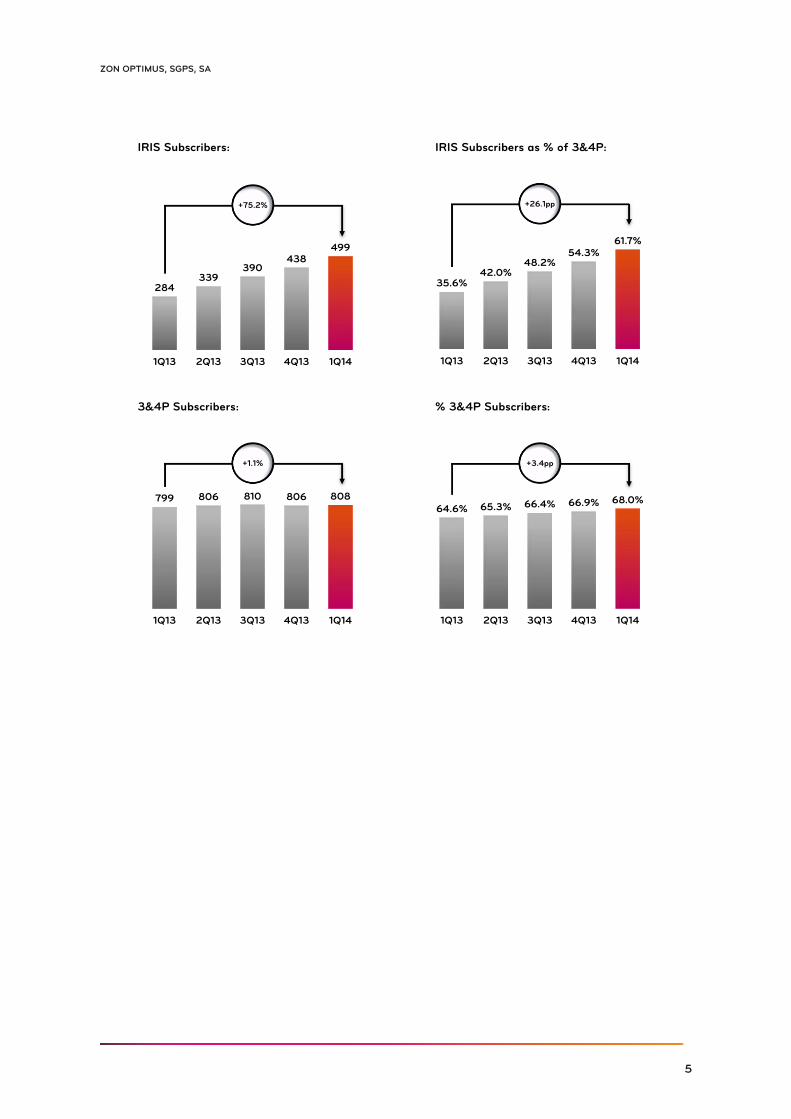
IRIS Subscribers: IRIS Subscribers as % of 3&4P:
3&4P Subscribers: % 3&4P Subscribers:
284339
390438
499
1Q13 2Q13 3Q13 4Q13 1Q14
+75.2%
35.6%42.0%
48.2%54.3%
61.7%
1Q13 2Q13 3Q13 4Q13 1Q14
+26.1pp
799 806 810 806 808
1Q13 2Q13 3Q13 4Q13 1Q14
+1.1%
64.6% 65.3% 66.4% 66.9% 68.0%
1Q13 2Q13 3Q13 4Q13 1Q14
+3.4pp
6
CONSOLIDATED MANAGEMENT REPORT 1Q14
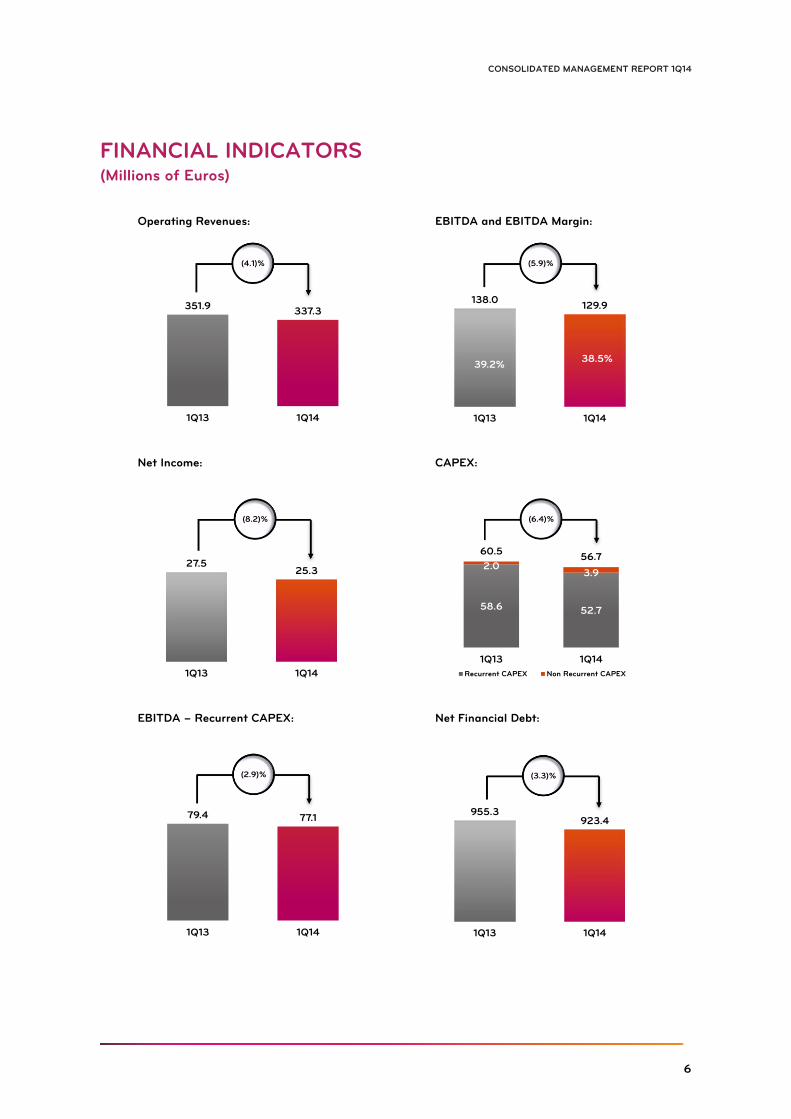
FINANCIAL INDICATORS (Millions of Euros)
Operating Revenues: EBITDA and EBITDA Margin:
Net Income: CAPEX:
EBITDA – Recurrent CAPEX: Net Financial Debt:
351.9337.3
1Q13 1Q14
(4.1)%
138.0129.9
39.2%38.5%
0%
10%
20%
30%
40%
50%
60%
70%
80%
90%
100 %
0
20
40
60
80
100
120
140
160
1Q13 1Q14
(5.9)%
27.525.3
1Q13 1Q14
(8.2)%
58.6 52.7
2.03.9
60.556.7
1Q13 1Q14
Recurrent CAPEX Non Recurrent CAPEX
(6.4)%
79.4 77.1
1Q13 1Q14
(2.9)%
955.3923.4
600 .00
650 .00
700 .00
750 .00
800 .00
850 .00
900 .00
950 .00
100 0.00
1Q13 1Q14
(3.3)%
7
ZON OPTIMUS, SGPS, SA
2.
1Q14 HIGHLIGHTS
8
CONSOLIDATED MANAGEMENT REPORT 1Q14
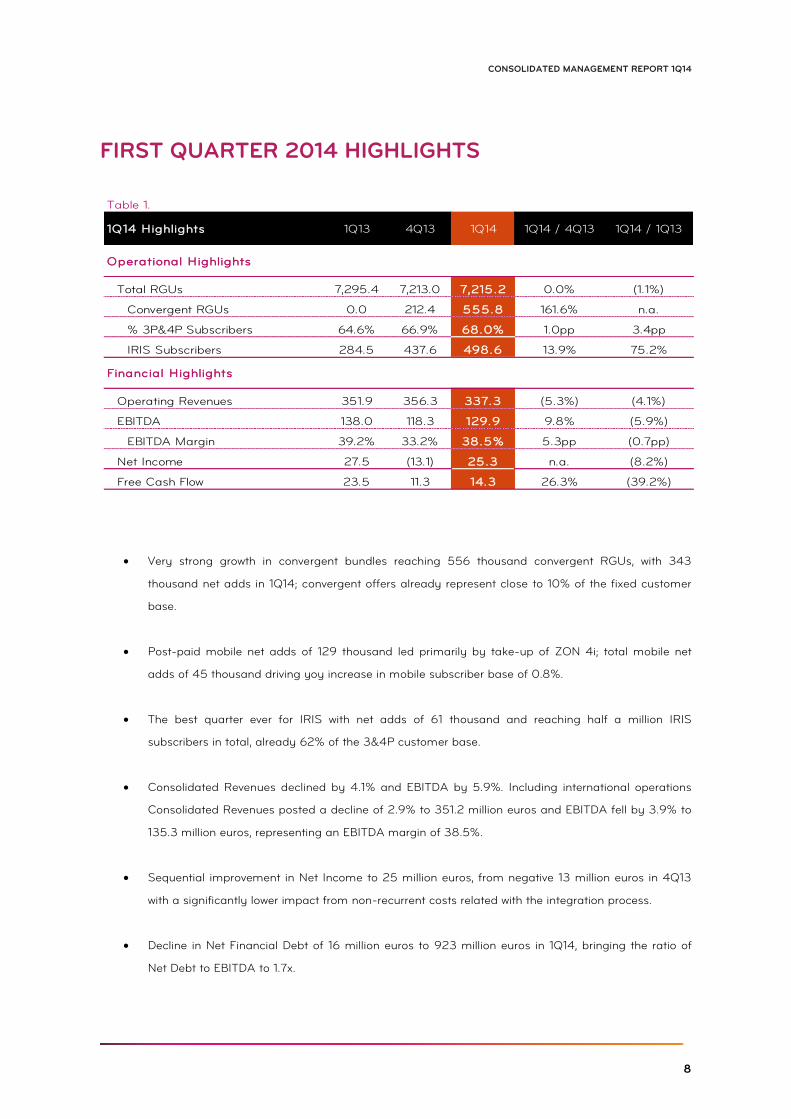
FIRST QUARTER 2014 HIGHLIGHTS
Very strong growth in convergent bundles reaching 556 thousand convergent RGUs, with 343
thousand net adds in 1Q14; convergent offers already represent close to 10% of the fixed customer
base.
Post-paid mobile net adds of 129 thousand led primarily by take-up of ZON 4i; total mobile net
adds of 45 thousand driving yoy increase in mobile subscriber base of 0.8%.
The best quarter ever for IRIS with net adds of 61 thousand and reaching half a million IRIS
subscribers in total, already 62% of the 3&4P customer base.
Consolidated Revenues declined by 4.1% and EBITDA by 5.9%. Including international operations
Consolidated Revenues posted a decline of 2.9% to 351.2 million euros and EBITDA fell by 3.9% to
135.3 million euros, representing an EBITDA margin of 38.5%.
Sequential improvement in Net Income to 25 million euros, from negative 13 million euros in 4Q13
with a significantly lower impact from non-recurrent costs related with the integration process.
Decline in Net Financial Debt of 16 million euros to 923 million euros in 1Q14, bringing the ratio of
Net Debt to EBITDA to 1.7x.
Table 1.
Operational Highlights
Total RGUs 7,295.4 7,213.0 7,215.2 0.0% (1.1%)
Convergent RGUs 0.0 212.4 555.8 161.6% n.a.
% 3P&4P Subscribers 64.6% 66.9% 68.0% 1.0pp 3.4pp
IRIS Subscribers 284.5 437.6 498.6 13.9% 75.2%
Financial Highlights
Operating Revenues 351.9 356.3 337.3 (5.3%) (4.1%)
EBITDA 138.0 118.3 129.9 9.8% (5.9%)
EBITDA Margin 39.2% 33.2% 38.5% 5.3pp (0.7pp)
Net Income 27.5 (13.1) 25.3 n.a. (8.2%)
Free Cash Flow 23.5 11.3 14.3 26.3% (39.2%)
1Q14 / 1Q131Q14 Highlights 1Q13 1Q144Q13 1Q14 / 4Q13
9
ZON OPTIMUS, SGPS, SA
3.
CORPORATE BODIES

10
CONSOLIDATED MANAGEMENT REPORT 1Q14
CORPORATE BODIES
As at the date of this report, 7 May 2014, the Governing Bodies of ZON had the following composition:
Board of Directors
Chairman of the Board of Directors Jorge de Brito Pereira
Chairman of the Executive Committee
Members of the Executive Committee
Miguel Almeida
José Pedro Pereira da Costa, Vice-Presidente, CFO
Miguel Veiga Martins, Vice-Presidente, CTO
Ana Paula Marques
André Almeida
Manuel Ramalho Eanes
Members Ângelo Paupério
António Lobo Xavier
António Domingues
Catarina Tavira
Cláudia Azevedo
Fernando Martorell
Isabel dos Santos
Joaquim de Oliveira
Lorena Fernandes
Mário Leite da Silva
Rodrigo Costa
Chairman of the Fiscal Board
Members
Alternate
Paulo Cardoso Correira da Mota Pinto
Eugénio Ferreira
Nuno Sousa Pereira
Luís Filipe da Silva Ferreira
11
ZON OPTIMUS, SGPS, SA
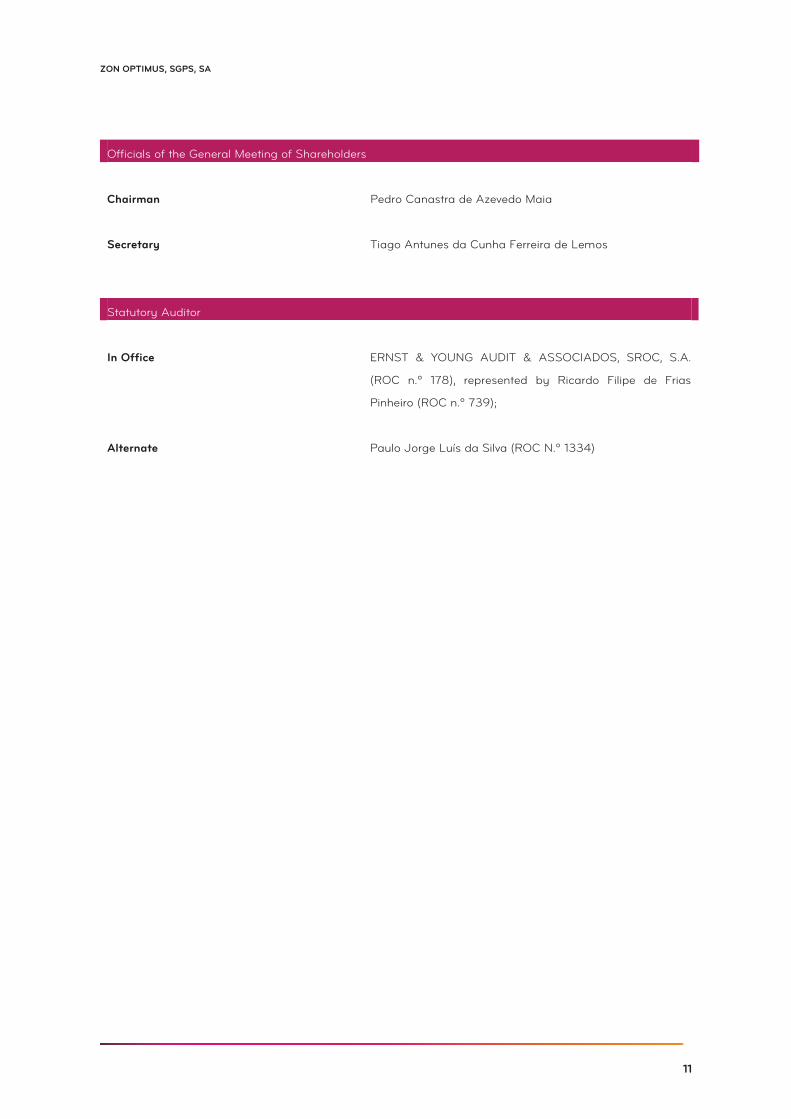
Officials of the General Meeting of Shareholders
Chairman Pedro Canastra de Azevedo Maia
Secretary Tiago Antunes da Cunha Ferreira de Lemos
Statutory Auditor
In Office ERNST & YOUNG AUDIT & ASSOCIADOS, SROC, S.A.
(ROC n.º 178), represented by Ricardo Filipe de Frias
Pinheiro (ROC n.º 739);
Alternate Paulo Jorge Luís da Silva (ROC N.º 1334)
12
CONSOLIDATED MANAGEMENT REPORT 1Q14
4.
MANAGEMENT REPORT
13
ZON OPTIMUS, SGPS, SA
MANAGEMENT REPORT BUSINESS REVIEW
1Q14 Consolidated Results
The integration process is now well underway, with teams focused on ramping up commercial deployment
and restructuring operations in the new, merged entity. We are still in the early months of our strategy
execution and the full benefit of many of the projects underway should only be expected in the medium term,
as detailed in our strategy disclosure to the market last February.
Very strong take up of convergent bundles
The core priority of ZON OPTIMUS’ strategy is to reinforce competitive position through domestic market
share growth with convergence being a strong driver of market dynamics over coming years. ZON OPTIMUS’
unique set of assets provides a strong platform to leverage growth in market share across both the consumer
and enterprise markets.
Consumer appetite for convergent mobile and fixed bundles is clearly very strong. Since launch in mid 4Q13
of ZON4i, ZON OPTIMUS has been witnessing consistently stronger month on month growth in convergent
subscribers.
By the end of 1Q14, ZON OPTIMUS had 556 thousand RGUs within convergent bundles, representing an
average pace of growth of over 20 thousand new households per month, and subscribing to an average of 5
RGUs per account. Of the convergent mobile RGUs, just 12% were previous ZON OPTIMUS customers and
the balance are coming either from other operators or are new mobile numbers, therefore driving relevant net
growth in the total mobile subscriber base. The main anchor of convergent offers is Pay TV, with 90% of
ZON4i customers upgrading from existing ZON offers and with just 54% being previous IRIS customers. The
promotion of ZON 4i is therefore driving not only an increase in penetration of new mobile RGUs but also a
strong take-up of the more sophisticated, premium IRIS interface. As such, ZON OPTIMUS’ strong position in
the Pay TV market, with 48% market share at the end of 2013, is an extremely strong platform to grow in
mobile RGUs.
As a percentage of the fixed customer base, only 5 months after launch of ZON4i, convergent bundles
represent close to 10%. Enthusiasm for these fixed mobile bundles is justified by their very attractive value
proposition. ZON4i combines more and better television programming with 116 channels; fixed Internet which
gives the highest speeds and most extensive coverage with 100 Mbps to all 3.3 million households covered by
ZON OPTIMUS’ next generation HFC network; an unlimited national and international fixed voice service
14
CONSOLIDATED MANAGEMENT REPORT 1Q14
which also includes free use of the ZON Phone app enabling use of a landline number on mobile devices,
benefiting from normal landline tariffs and integrated billing; free access to the largest network of WiFi
hotspots giving instant access to 600 thousand hotspots in Portugal and over 12 million worldwide; unlimited
mobile phone use, offering the best 4G solutions available, for up to four users, mobile Internet with free 200
MB per SIM card which accommodates a flexible top-up facility for those who occasionally go over their data
limit; priority access to the largest network of cinemas in Portugal, through myZONcard, that also gives one
free ticket for every cinema ticket purchased. ZON4i is priced at €79.99 with two mobile users, and can be
adjusted to suit usage profile and requirements.
Already a result of the reinforced competitive strengths created by the merger, at the beginning of 2Q14,
ZON OPTIMUS launched a convergent offer for DTH coverage geographies based on 4G solutions for
broadband and voice, thus mirroring the bundled value proposition provided over the HFC footprint. For the
same prices as HFC based offers, customers can subscribe to 3 and 4 Play bundles including 81 TV
channels, up to 40 Mbps of Internet, unlimited fixed and mobile voice including 2 mobile SIM cards.
Another record quarter for IRIS reaching half a million subscribers
A key lever to reinforce our leadership in Pay TV is our next generation, multi-screen TV offer, IRIS, which is
the default TV offer for all new triple and quad play packages. This was another record quarter for IRIS with
net adds of 61 thousand taking the total number of IRIS subscribers to half a million and already representing
62% of the 3&4P customer base, up from 36% in 1Q13.
Levels of satisfaction and customer experience with IRIS are extremely high, with usage of the leading edge,
cloud based functionalities completely transforming the way people watch TV. 99% of IRIS customers have
used Timewarp and Restart TV and over 75% use them every day, at least twice.
IRIS is the centrepiece of our product strategy, with continuous releases and upgrades always exceeding user
expectations. The focus for 2014 is on extension and interconnection of the TV experience with the mobile
ecosystem, redoubling efforts in research and development in order to continue to respond to the challenges
of the Pay TV market and exploiting the opportunity presented by ZON OPTIMUS’ strong position as a fixed
and mobile player. The importance and success of our TV interface is core to our strategy to lead the market
in convergence given that choice of operator is anchored on the Pay TV provider.
At the beginning of 2014 the IRIS set-top box software underwent a major update, which brought about
significant improvements in performance and usage, as well as a new HTML5 browser that will allow the
development of a new generation of TV applications, including YouTube Leanback. The improvements include
adjustment of the Fast Forward and Rewind speeds in video streaming, which is particularly relevant for the
Restart and Timewarp functions.
15
ZON OPTIMUS, SGPS, SA
We recently launched our Network-DVR which enables customers to record, pause live TV and rewind live
content, fully replicating the experience of a local recorder with the additional advantage of allowing for
unlimited simultaneous recording of programmes and sharing of recorded content over all STBs in the
household. With this development ZON OPTIMUS has become the first Pay TV operator to initiate the
commercial fade-out of DVR centric STBs, generating in the process a much superior user experience.
IRIS has accumulated a number of awards as the best TV interface with widespread recognition from
customers and industry peers. IRIS was voted “Product of the Year” in Portugal for the second consecutive
year and IRIS’ OTT apps were also recognized internationally having won the “Best TV on the Move Service”
award at London’s TV Connect conference.
Strong pick-up in mobile net-adds driving yoy growth in subscriber base
The growth of convergent bundles is driving an important structural shift in mobile customers with more and
more users subscribing to post-paid mobile SIM cards within 4P bundled offers. This trend has been
accelerating for ZON OPTIMUS every month since launch of ZON4i at the end of 2013.
In 1Q14, post-paid mobile subscribers grew by 129 thousand, one of the strongest quarters of the past years.
The growth recorded in post-paid voice subscribers was even more significant with net adds of 147 thousand
however this was somewhat offset by a net decline in post-paid mobile broadband cards of 18 thousand. In
terms of the pre-paid mobile base, net-adds were negative by 84 thousand, impacted by the growing shift
towards convergent offers, however the balance is clearly very positive for ZON OPTIMUS with total net adds
in mobile of 45 thousand.
In the stand-alone mobile segment, marketing efforts remain focused on driving all-net tariffs that provide
easy and unlimited plans without any kind of network restrictions. The two main families of all-net tariffs are
SMART and LIGA, both launched during 2013. SMART is directed at the high-end segment of the market as
a post-paid plan that enables customers to communicate to all networks with an almost unlimited monthly
allowance and without the hassle of having to remember to top-up. All SMART tariffs include at least 1 Gb of
data, providing an excellent 3G and 4G experience. LIGA addresses the need to provide more affordable all-
net access to more segments of the market at a very appealing 9.99 euros / month price point. This offer
has led to a significant increase in the proportion of pre-paid customers with a fixed monthly recharge.
Another lever for growth in personal mobile communication is the push for increased smartphone penetration,
which is currently well below European average at around 25% nationwide. OPTIMUS has a relevant lead
versus its main competitors in terms of 4G network coverage and in order to exploit this advantage and
stimulate mobile data usage, has launched a number of very attractive smartphones incorporated in
competitive post-paid mobile tariff plans. We are actively exploring opportunities to reduce the cost and
16
CONSOLIDATED MANAGEMENT REPORT 1Q14
consequent retail prices for equipment and recently launched a 4G enabled own branded smartphone for
€99.90, “OPTIMUS ZILO”. Importantly, OPTIMUS already posts a significantly higher share of mobile data
traffic when compared to its total share of mobile traffic, 42% of mobile data traffic versus 13% in total.
Over 1 million RGUs in the Enterprise segment
By the end of 1Q14, ZON OPTIMUS had over 1 million RGUs in the business segment reflecting a relevant
pick-up in quarterly net adds to 23.2 thousand. The majority of the growth was in mobile, with net adds of
18.6 thousand in the quarter, driven by convergence. In the SME and SoHo segments in particular, ramp up
of sales channels is now underway, enabling further deployment of cross-sales within the existing footprint of
ZON and OPTIMUS’ customer bases. In the small business segment, timing of revenue growth is still set to
lag volume growth given that the market-wide trend towards convergent offers, initiated at the beginning of
2013, is leading to some repricing of the base. Although representing near term pressure on revenues,
increased RGU volume of convergent SME and SOHO customers will help offset that loss in the medium term
given that ZON OPTIMUS’ net growth will come primarily from new RGUs to the company.
On the Corporate front, the team has been very successful in addressing important new accounts with a
number of important contracts coming to the market for tender in the coming months. ZON OPTIMUS has
already won a number of relevant flagship accounts across many sectors of the market however set-up and
migration of new corporate accounts is a time demanding process and therefore revenues will take at least a
couple of quarters to start showing a material impact. ZON OPTIMUS now stands stronger as a
technologically superior and fully integrated fixed and mobile operator, capable of offering relevant and
competitive integrated and convergent telecommunications and data services for the enterprise segments in
Portugal. The deep coverage, capillarity and high capacity of ZON OPTIMUS’ network are core differentiating
factors for this segment. ZON OPTIMUS is already addressing the market as a single entity, capable of
providing tailor made solutions for the largest corporate and public sector customers, and reaching out to
SME and SoHo companies with specific solutions adapted to usage profile and geographic spread, leveraging
the best national NGN Fixed and Mobile footprint.
17
ZON OPTIMUS, SGPS, SA
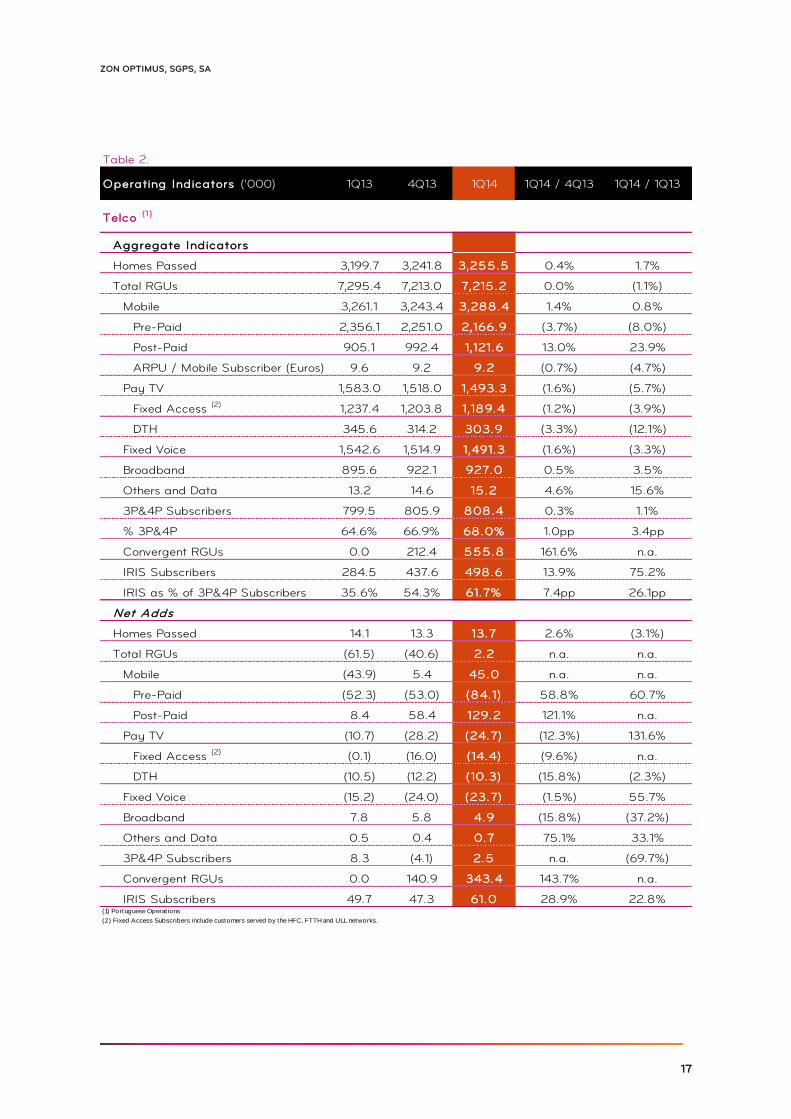
Table 2.
Telco (1 )
Aggregate Indicators
Homes Passed 3,199.7 3,241.8 3,255.5 0.4% 1.7%
Total RGUs 7,295.4 7,213.0 7,215.2 0.0% (1.1%)
Mobile 3,261.1 3,243.4 3,288.4 1.4% 0.8%
Pre-Paid 2,356.1 2,251.0 2,166.9 (3.7%) (8.0%)
Post-Paid 905.1 992.4 1,121.6 13.0% 23.9%
ARPU / Mobile Subscriber (Euros) 9.6 9.2 9.2 (0.7%) (4.7%)
Pay TV 1,583.0 1,518.0 1,493.3 (1.6%) (5.7%)
Fixed Access (2) 1,237.4 1,203.8 1,189.4 (1.2%) (3.9%)
DTH 345.6 314.2 303.9 (3.3%) (12.1%)
Fixed Voice 1,542.6 1,514.9 1,491.3 (1.6%) (3.3%)
Broadband 895.6 922.1 927.0 0.5% 3.5%
Others and Data 13.2 14.6 15.2 4.6% 15.6%
3P&4P Subscribers 799.5 805.9 808.4 0.3% 1.1%
% 3P&4P 64.6% 66.9% 68.0% 1.0pp 3.4pp
Convergent RGUs 0.0 212.4 555.8 161.6% n.a.
IRIS Subscribers 284.5 437.6 498.6 13.9% 75.2%
IRIS as % of 3P&4P Subscribers 35.6% 54.3% 61.7% 7.4pp 26.1pp
Net Adds
Homes Passed 14.1 13.3 13.7 2.6% (3.1%)
Total RGUs (61.5) (40.6) 2.2 n.a. n.a.
Mobile (43.9) 5.4 45.0 n.a. n.a.
Pre-Paid (52.3) (53.0) (84.1) 58.8% 60.7%
Post-Paid 8.4 58.4 129.2 121.1% n.a.
Pay TV (10.7) (28.2) (24.7) (12.3%) 131.6%
Fixed Access (2) (0.1) (16.0) (14.4) (9.6%) n.a.
DTH (10.5) (12.2) (10.3) (15.8%) (2.3%)
Fixed Voice (15.2) (24.0) (23.7) (1.5%) 55.7%
Broadband 7.8 5.8 4.9 (15.8%) (37.2%)
Others and Data 0.5 0.4 0.7 75.1% 33.1%
3P&4P Subscribers 8.3 (4.1) 2.5 n.a. (69.7%)
Convergent RGUs 0.0 140.9 343.4 143.7% n.a.
IRIS Subscribers 49.7 47.3 61.0 28.9% 22.8%(1) Portuguese Operat ions
1Q14 / 4Q131Q13
(2) Fixed Access Subscribers include customers served by the HFC, FTTH and ULL networks.
1Q14 1Q14 / 1Q13Operating Indicators ('000) 4Q13
18
CONSOLIDATED MANAGEMENT REPORT 1Q14
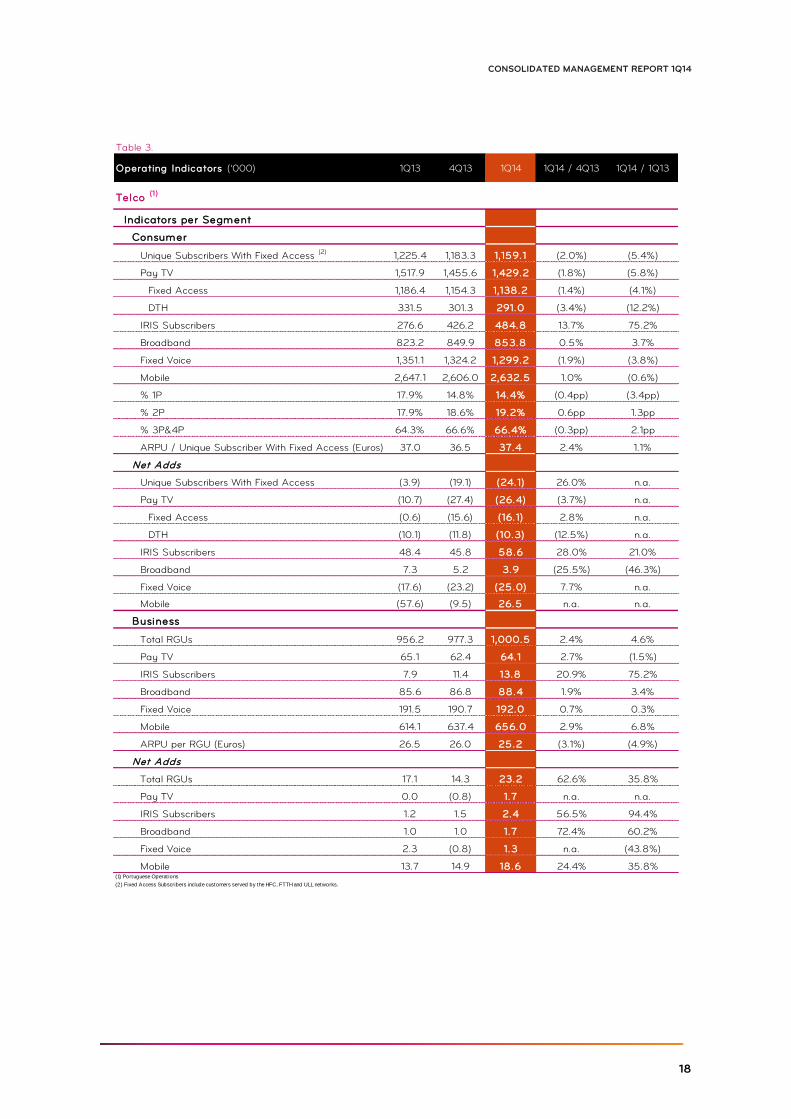
Table 3.
Telco (1)
Indicators per Segment
Consumer
Unique Subscribers With Fixed Access (2) 1,225.4 1,183.3 1,159.1 (2.0%) (5.4%)
Pay TV 1,517.9 1,455.6 1,429.2 (1.8%) (5.8%)
Fixed Access 1,186.4 1,154.3 1,138.2 (1.4%) (4.1%)
DTH 331.5 301.3 291.0 (3.4%) (12.2%)
IRIS Subscribers 276.6 426.2 484.8 13.7% 75.2%
Broadband 823.2 849.9 853.8 0.5% 3.7%
Fixed Voice 1,351.1 1,324.2 1,299.2 (1.9%) (3.8%)
Mobile 2,647.1 2,606.0 2,632.5 1.0% (0.6%)
% 1P 17.9% 14.8% 14.4% (0.4pp) (3.4pp)
% 2P 17.9% 18.6% 19.2% 0.6pp 1.3pp
% 3P&4P 64.3% 66.6% 66.4% (0.3pp) 2.1pp
ARPU / Unique Subscriber With Fixed Access (Euros) 37.0 36.5 37.4 2.4% 1.1%
Net Adds
Unique Subscribers With Fixed Access (3.9) (19.1) (24.1) 26.0% n.a.
Pay TV (10.7) (27.4) (26.4) (3.7%) n.a.
Fixed Access (0.6) (15.6) (16.1) 2.8% n.a.
DTH (10.1) (11.8) (10.3) (12.5%) n.a.
IRIS Subscribers 48.4 45.8 58.6 28.0% 21.0%
Broadband 7.3 5.2 3.9 (25.5%) (46.3%)
Fixed Voice (17.6) (23.2) (25.0) 7.7% n.a.
Mobile (57.6) (9.5) 26.5 n.a. n.a.
Business
Total RGUs 956.2 977.3 1,000.5 2.4% 4.6%
Pay TV 65.1 62.4 64.1 2.7% (1.5%)
IRIS Subscribers 7.9 11.4 13.8 20.9% 75.2%
Broadband 85.6 86.8 88.4 1.9% 3.4%
Fixed Voice 191.5 190.7 192.0 0.7% 0.3%
Mobile 614.1 637.4 656.0 2.9% 6.8%
ARPU per RGU (Euros) 26.5 26.0 25.2 (3.1%) (4.9%)
Net Adds
Total RGUs 17.1 14.3 23.2 62.6% 35.8%
Pay TV 0.0 (0.8) 1.7 n.a. n.a.
IRIS Subscribers 1.2 1.5 2.4 56.5% 94.4%
Broadband 1.0 1.0 1.7 72.4% 60.2%
Fixed Voice 2.3 (0.8) 1.3 n.a. (43.8%)
Mobile 13.7 14.9 18.6 24.4% 35.8%(1) Portuguese Operat ions
(2) Fixed Access Subscribers include customers served by the HFC, FTTH and ULL networks.
Operating Indicators ('000) 1Q13 1Q14 1Q14 / 1Q134Q13 1Q14 / 4Q13
19
ZON OPTIMUS, SGPS, SA
Continued impact of remedies on fixed access base
Fixed access Pay TV customers posted a decline of 14 thousand in 1Q14, still suffering the impact of
remedies imposed by the Competition Authority whereby, upon approval of the merger, ZON OPTIMUS was
forced to release OPTIMUS FTTH subscribers of their loyalty contracts and restricted from addressing them
with commercial offers, providing a relevant opportunity for competitors to target these customers. As a result
of these regulatory constraints, of the 38 thousand OPTIMUS FTTH customers that existed before the
merger, a significant number churned to competitors. ULL fixed access customers are progressively being
migrated onto own HFC infrastructure however, in some situations, they are outside current network footprint
and therefore churn levels in this customer base are higher than normal. Fixed Voice and Broadband
customers were equally impacted by the above mentioned one-off effects.
The DTH Pay TV base fell by 10.3 thousand subscribers in 1Q14, along the same levels as in the previous
quarters. The launch of 3P and 4P offers for the DTH market as from 2Q14 should help to reduce the relative
network disadvantage that ZON OPTIMUS has in areas where it competes against a fixed infrastructure.
Support in Fixed residential ARPU led by increase of convergent penetration
ARPU per unique subscriber with fixed access posted a marginal increase of 1.1% with increased penetration
of convergent offers that generated higher average revenues and the continued upsell of IRIS bundles
offsetting some of the market driven pricing pressure.
Mobile ARPU recorded a 4.7% yoy decline to 9.2 euros however remained flat in comparison with 4Q13,
showing that the substantial growth in convergent post paid contract customers is helping to mitigate the
underlying revenue pressure felt in stand-alone mobile consumption.
On the business front, ARPU per RGU also posted a decline in 1Q14 of 4.9% to 25.2 euros, a reflection
primarily of the repricing of the SME and SOHO customer base due to the increased shift to convergent
solutions, as explained above.
20
CONSOLIDATED MANAGEMENT REPORT 1Q14
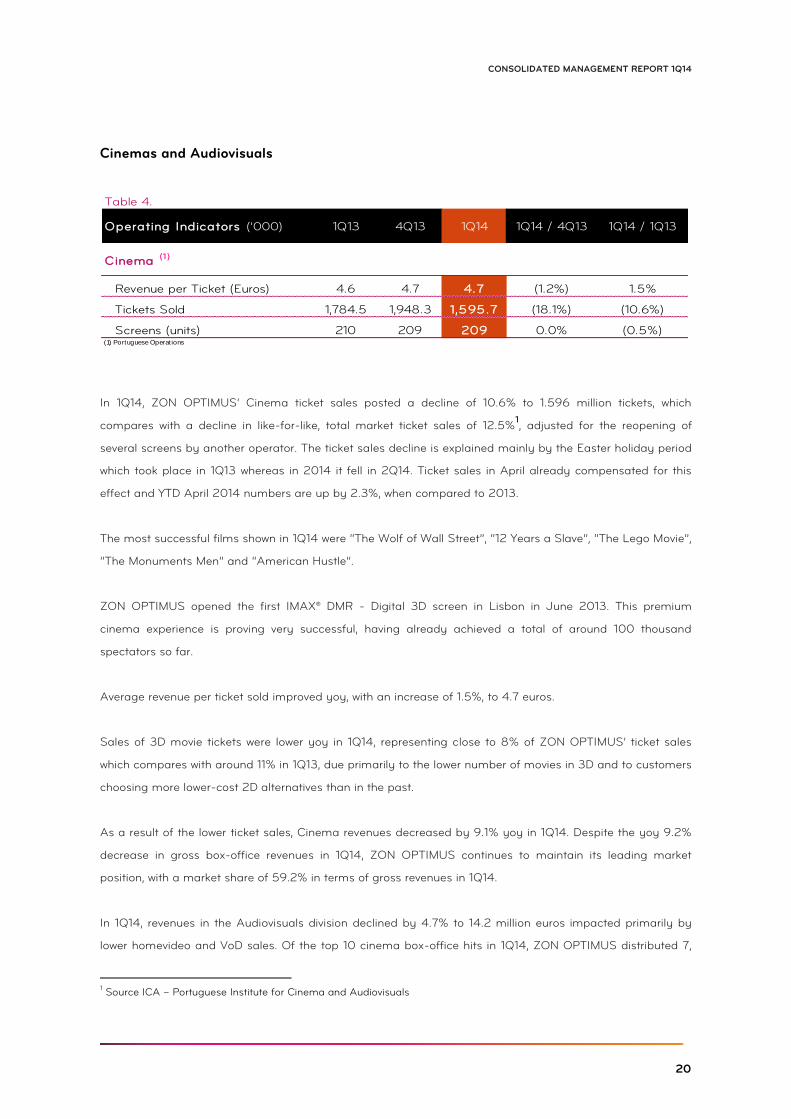
Cinemas and Audiovisuals
In 1Q14, ZON OPTIMUS’ Cinema ticket sales posted a decline of 10.6% to 1.596 million tickets, which
compares with a decline in like-for-like, total market ticket sales of 12.5%1, adjusted for the reopening of
several screens by another operator. The ticket sales decline is explained mainly by the Easter holiday period
which took place in 1Q13 whereas in 2014 it fell in 2Q14. Ticket sales in April already compensated for this
effect and YTD April 2014 numbers are up by 2.3%, when compared to 2013.
The most successful films shown in 1Q14 were “The Wolf of Wall Street”, “12 Years a Slave”, “The Lego Movie”,
“The Monuments Men” and “American Hustle”.
ZON OPTIMUS opened the first IMAX® DMR - Digital 3D screen in Lisbon in June 2013. This premium
cinema experience is proving very successful, having already achieved a total of around 100 thousand
spectators so far.
Average revenue per ticket sold improved yoy, with an increase of 1.5%, to 4.7 euros.
Sales of 3D movie tickets were lower yoy in 1Q14, representing close to 8% of ZON OPTIMUS’ ticket sales
which compares with around 11% in 1Q13, due primarily to the lower number of movies in 3D and to customers
choosing more lower-cost 2D alternatives than in the past.
As a result of the lower ticket sales, Cinema revenues decreased by 9.1% yoy in 1Q14. Despite the yoy 9.2%
decrease in gross box-office revenues in 1Q14, ZON OPTIMUS continues to maintain its leading market
position, with a market share of 59.2% in terms of gross revenues in 1Q14.
In 1Q14, revenues in the Audiovisuals division declined by 4.7% to 14.2 million euros impacted primarily by
lower homevideo and VoD sales. Of the top 10 cinema box-office hits in 1Q14, ZON OPTIMUS distributed 7,
1 Source ICA – Portuguese Institute for Cinema and Audiovisuals
Table 4.
Cinema (1 )
Revenue per Ticket (Euros) 4.6 4.7 4.7 (1.2%) 1.5%
Tickets Sold 1,784.5 1,948.3 1,595.7 (18.1%) (10.6%)
Screens (units) 210 209 209 0.0% (0.5%)(1) Portuguese Operat ions
Operating Indicators ('000) 1Q13 1Q14 1Q14 / 1Q134Q13 1Q14 / 4Q13
21
ZON OPTIMUS, SGPS, SA
“The Wolf of Wall Street”, “12 Years a Slave”, “American Hustle”, “Frozen”, “Robocop”, “47 Ronin” and
“August: Osage County”, maintaining its strong leading position with a 68.2% market share in terms of gross
revenues, having outperformed the market with yoy growth of 16.1%, which compares with a decline of 5.2%
of the market as a whole.
Already in 2014, the Audiovisuals division signed a contract for theatrical distribution of the Warner catalogue
for Portugal, with effect on 1 April, 2014, from which some relevant contribution is therefore expected for the
remainder of 2014.
ZAP
ZAP continues its success story in the Angolan and Mozambican Pay-TV markets and it is today a reference
operator in these countries, in Africa and in the industry. As a local operator, ZAP is focused on increasing its
presence in these territories and it is, therefore, still expanding its sales channels, namely its own stores that
are now 28 in Angola and 7 in Mozambique. Last additions were Soyo (Zaire province) and Dundo (Lunda
Norte) in Angola and Beira and Nampula in Mozambique. Other sales channels are also still expanding and
becoming more effective.
ZAP continues to improve its products and services in order to meet the highest expectations from its
customers and differentiate from competition in these countries. During this quarter ZAP added two new
channels to its packages, STV Notícias (a Mozambican news channel produced by STV, one of the free-to-air
broadcasters in Mozambique) and Cubavision.
22
CONSOLIDATED MANAGEMENT REPORT 1Q14
CONSOLIDATED FINANCIAL REVIEW
The following Consolidated Financial Statements have been subject to limited review. As standard practice,
only the annual accounts are audited; the quarterly results are not audited separately.
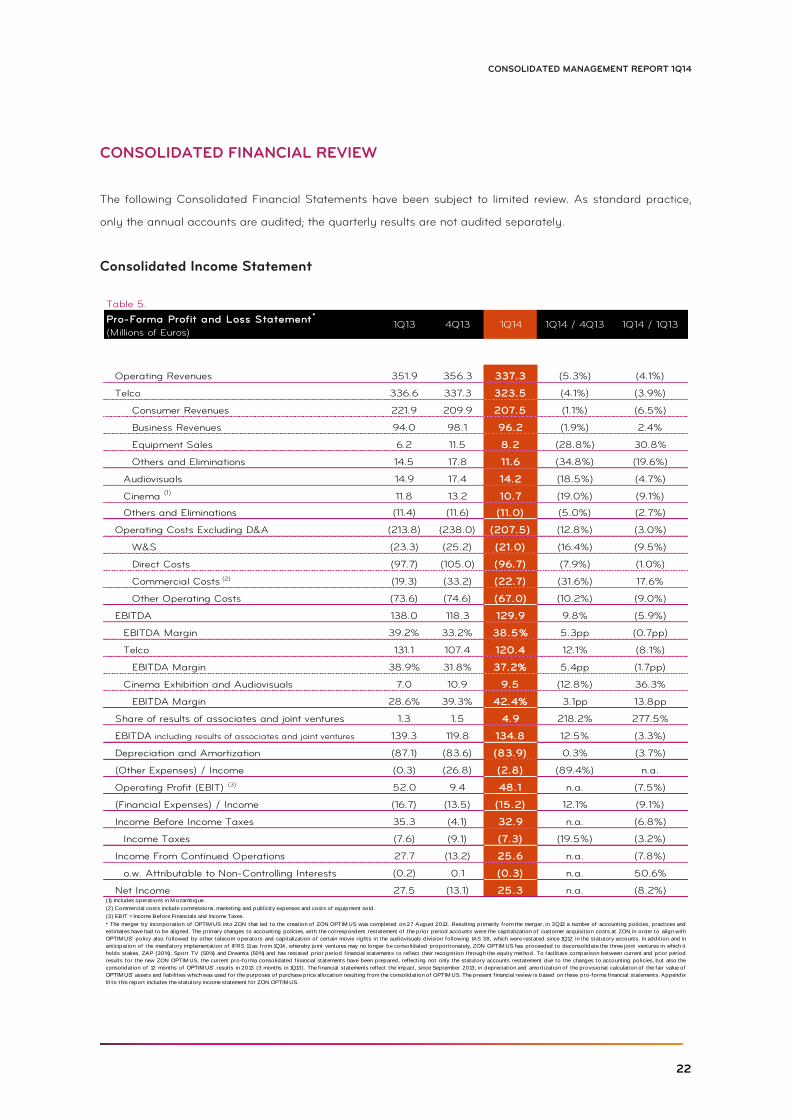
Consolidated Income Statement
Table 5.
Operating Revenues 351.9 356.3 337.3 (5.3%) (4.1%)
Telco 336.6 337.3 323.5 (4.1%) (3.9%)
Consumer Revenues 221.9 209.9 207.5 (1.1%) (6.5%)
Business Revenues 94.0 98.1 96.2 (1.9%) 2.4%
Equipment Sales 6.2 11.5 8.2 (28.8%) 30.8%
Others and Eliminations 14.5 17.8 11.6 (34.8%) (19.6%)
Audiovisuals 14.9 17.4 14.2 (18.5%) (4.7%)
Cinema (1) 11.8 13.2 10.7 (19.0%) (9.1%)
Others and Eliminations (11.4) (11.6) (11.0) (5.0%) (2.7%)
Operating Costs Excluding D&A (213.8) (238.0) (207.5) (12.8%) (3.0%)
W&S (23.3) (25.2) (21.0) (16.4%) (9.5%)
Direct Costs (97.7) (105.0) (96.7) (7.9%) (1.0%)
Commercial Costs (2) (19.3) (33.2) (22.7) (31.6%) 17.6%
Other Operating Costs (73.6) (74.6) (67.0) (10.2%) (9.0%)
EBITDA 138.0 118.3 129.9 9.8% (5.9%)
EBITDA Margin 39.2% 33.2% 38.5% 5.3pp (0.7pp)
Telco 131.1 107.4 120.4 12.1% (8.1%)
EBITDA Margin 38.9% 31.8% 37.2% 5.4pp (1.7pp)
Cinema Exhibition and Audiovisuals 7.0 10.9 9.5 (12.8%) 36.3%
EBITDA Margin 28.6% 39.3% 42.4% 3.1pp 13.8pp
Share of results of associates and joint ventures 1.3 1.5 4.9 218.2% 277.5%
EBITDA including results of associates and joint ventures 139.3 119.8 134.8 12.5% (3.3%)
Depreciation and Amortization (87.1) (83.6) (83.9) 0.3% (3.7%)
(Other Expenses) / Income (0.3) (26.8) (2.8) (89.4%) n.a.
Operating Profit (EBIT) (3) 52.0 9.4 48.1 n.a. (7.5%)
(Financial Expenses) / Income (16.7) (13.5) (15.2) 12.1% (9.1%)
Income Before Income Taxes 35.3 (4.1) 32.9 n.a. (6.8%)
Income Taxes (7.6) (9.1) (7.3) (19.5%) (3.2%)
Income From Continued Operations 27.7 (13.2) 25.6 n.a. (7.8%)
o.w. Attributable to Non-Controlling Interests (0.2) 0.1 (0.3) n.a. 50.6%
Net Income 27.5 (13.1) 25.3 n.a. (8.2%)(1) Includes operat ions in M ozambique.
(2) Commercial costs include commissions, market ing and publicity expenses and costs of equipment sold.
(3) EBIT = Income Before Financials and Income Taxes.
4Q13 1Q14 / 4Q13
* The merger by incorporat ion of OPTIM US into ZON that led to the creat ion of ZON OPTIM US was completed on 27 August 2013. Result ing primarily from the merger, in 3Q13 a number of account ing policies, pract ices and
est imates have had to be aligned. The primary changes to account ing policies, with the correspondent restatement of the prior period accounts were the capitalizat ion of customer acquisit ion costs at ZON in order to align with
OPTIMUS’ policy also followed by other telecom operators and capitalizat ion of certain movie rights in the audiovisuals division following IAS 38, which were restated since 1Q12 in the statutory accounts. In addit ion and in
ant icipat ion of the mandatory implementat ion of IFRS 11as from 1Q14, whereby joint ventures may no longer be consolidated proport ionately, ZON OPTIM US has proceeded to deconsolidate the three joint ventures in which it
holds stakes, ZAP (30%), Sport TV (50%) and Dreamia (50%) and has restated prior period f inancial statements to ref lect their recognit ion through the equity method. To facilitate comparison between current and prior period
results for the new ZON OPTIM US, the current pro-forma consolidated f inancial statements have been prepared, ref lect ing not only the statutory accounts restatement due to the changes to account ing policies, but also the
consolidat ion of 12 months of OPTIMUS’ results in 2013 (3 months in 1Q13). The f inancial statements ref lect the impact, since September 2013, in depreciat ion and amort izat ion of the provisional calculat ion of the fair value of
OPTIMUS’ assets and liabilit ies which was used for the purposes of purchase price allocat ion result ing from the consolidat ion of OPTIM US. The present f inancial review is based on these pro-forma financial statements. Appendix
III to this report includes the statutory income statement for ZON OPTIM US.
1Q14 / 1Q13Pro-Forma Profit and Loss Statement *
(Millions of Euros)1Q13 1Q14

23
ZON OPTIMUS, SGPS, SA
Operating Revenues
Consolidated Operating Revenues were 337.3 million euros in 1Q14, representing a decline of 4.1% in
comparison with 1Q13. Adding back the contribution from the 30% stake in ZAP, Consolidated Revenues
posted a decline of 2.9% to 351.2 million euros.
Combined Revenues for the Telco business declined by 3.9% to 323.5 million euros, albeit posting a
marginal sequential recovery in yoy growth in comparison with 4Q13.
Consumer Revenues, down by 6.5% yoy, were primarily impacted by negative yoy growth in personal mobile
revenues due to lower average subscriber numbers yoy, led by the market wide trend towards convergent
offers and a reduction in mobile ARPU and by continued decline in revenues from the DTH business. The
trend in fixed residential revenues was significantly more positive benefitting from the above mentioned
growth in convergent RGUs and cross-selling initiatives together with the positive incremental ARPU achieved,
which are more than offsetting the temporarily higher churn due to merger remedies imposed on the FTTH
base.
The growth recorded in Business revenues to 96.2 million euros was the result of good yoy trends in RGUs,
which surpassed the 1 million milestone in 1Q14, and by the positive performance in wholesale revenues, which
together helped to offset a yoy decline in ARPU per business RGU of 5%.
Revenues from the Audiovisuals business fell by 4.7% yoy to 14.2 million euros and Cinema Exhibition
revenues fell by 9.1% to 10.7 million euros. In the case of the Cinema Exhibition Business, the negative yoy
performance in revenues is a direct result of a poor quarter for cinema sales due to the previously mentioned
Easter holiday impact, while the decline in the Audiovisuals business was mostly due to lower homevideo and
VoD revenues yoy.
ZAP continued to post strong operational and financial momentum with contribution to revenues of ZON
OPTIMUS’ 30% stake increasing by 38.9% to 13.9 million euros in 1Q14.
EBITDA
Consolidated EBITDA fell by 5.9% in 1Q14 to 129.9 million euros generating a margin of 38.5%. Including the
contribution from ZON OPTIMUS’ 30% stake in ZAP, Consolidated EBITDA would have posted a lower
decline of 3.9% to 135.3 million euros. Telco EBITDA fell by 8.1% in 1Q14 to 120.4 million euros and EBITDA
from the Audiovisuals and Cinema operations increased by 36.3% yoy to 9.5 million euros.

24
CONSOLIDATED MANAGEMENT REPORT 1Q14
Consolidated Operating Costs Excluding D&A
Consolidated Operating Costs fell by 3% yoy to 207.5 million euros and posted a decline of 12.8% in
comparison with 4Q13.
Wages and Salaries fell by 9.5% to 21.0 million euros in 1Q14 as a result mainly of a lower average level of
headcount at the telco division in comparison with 1Q13, down by 11%. The majority of the projected
headcount optimization resulting from the merger process has already occurred and this will continue to be
reflected in yoy savings in this cost line.
Direct Costs recorded a 1% decline to 96.7 million euros, which reflects a combination of significantly lower
yoy programming and capacity related costs of 8% and 18% respectively due to savings already achieved
with the merger, namely the integration of previous OPTIMUS Pay TV and fixed customers onto the ZON
OPTIMUS fixed network and an increase in traffic costs of 16% due to the greater level of mass calling
services and increased payments related with advertising revenue sharing models in place.
Commercial Costs increased by 17.6% in 1Q14 to 22.7 million euros although they were 31.6% lower than in
4Q13 which is always a period of strong commercial activity in the build-up to Christmas. The yoy increase
was mainly driven by a higher level of handset sales and commissions due to the increased commercial push.
Other Operating Costs fell by 9% yoy to 67 million euros due to a combination of effects with the most
relevant impacts due to a decline in Supplies and External Services and a reduction in the level of provisions.
License related costs, included in this aggregate, increased by 22.5% in 1Q14 to 5.7 million euros which is
mostly explained by a 0.75 million euros increase in spectrum fee and a 0.6 million euros quarterly charge
related with the cinema tax imposed on television operators.
Net Income
Net Income reached 25.3 million euros in 1Q14, compared with 27.5 million euros in 1Q13 and increased from
negative 13.1 million euros in the previous quarter due to significantly lower non-recurrent expenses in the
period.
Equity in affiliate companies posted another very positive increase in contribution growing to 4.9 million euros
in 1Q14 compared with 1.3 million in 1Q13, on the back of the very strong financial contribution of the
international JV, ZAP, and also of the contribution of SportTV which recovered from a negative Net Income in
1Q13.
Depreciation and Amortization posted a yoy decline of 3.7% to 83.9 million euros, with no material change
25
ZON OPTIMUS, SGPS, SA
compared with previous periods.
Other Expenses* of 2.8 million euros were significantly lower in 1Q14 than in 4Q13 and a significant part
relates to non-recurrent merger related costs.
Net Financial Expenses fell by 9.1% to 15.2 million euros in 1Q14 compared with 16.7 million euros in 1Q13 as a
result of the lower average level of gross debt and the lower average cost of the new debt contracted in 4Q13.
Income Tax provision amounted to 7.3 million euros in 1Q14, representing a 3.2% decline in comparison with
1Q13.
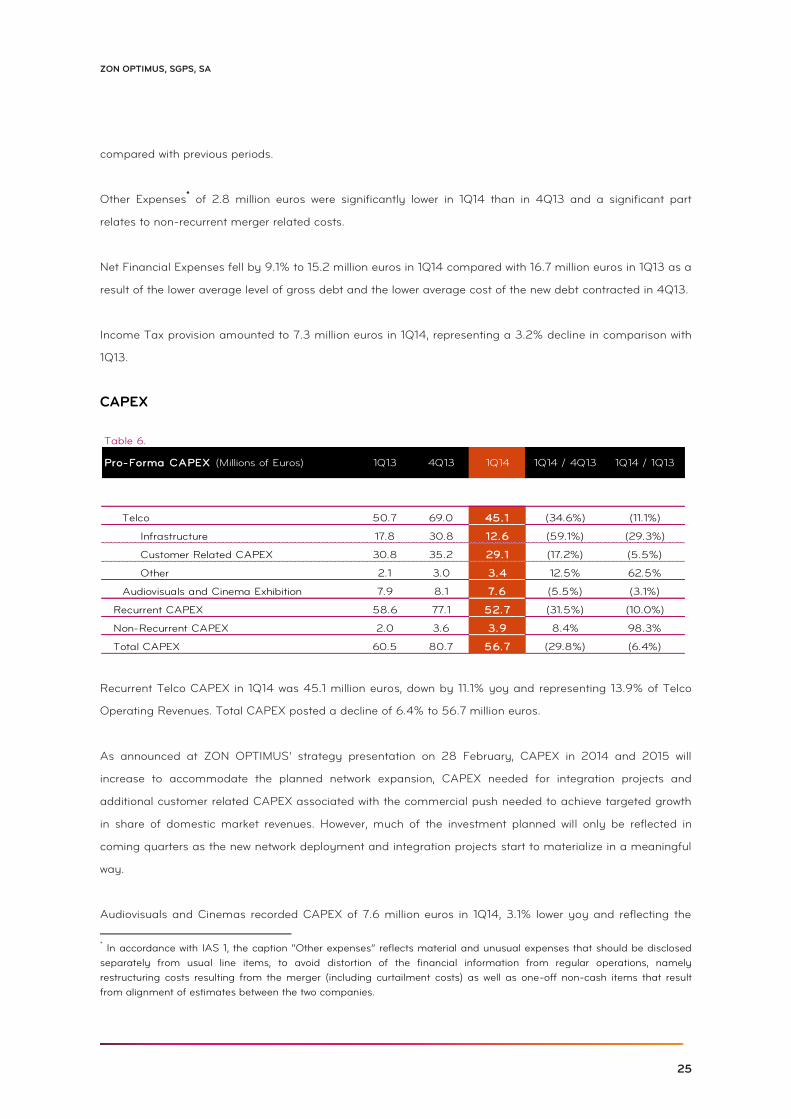
CAPEX
Recurrent Telco CAPEX in 1Q14 was 45.1 million euros, down by 11.1% yoy and representing 13.9% of Telco
Operating Revenues. Total CAPEX posted a decline of 6.4% to 56.7 million euros.
As announced at ZON OPTIMUS’ strategy presentation on 28 February, CAPEX in 2014 and 2015 will
increase to accommodate the planned network expansion, CAPEX needed for integration projects and
additional customer related CAPEX associated with the commercial push needed to achieve targeted growth
in share of domestic market revenues. However, much of the investment planned will only be reflected in
coming quarters as the new network deployment and integration projects start to materialize in a meaningful
way.
Audiovisuals and Cinemas recorded CAPEX of 7.6 million euros in 1Q14, 3.1% lower yoy and reflecting the
* In accordance with IAS 1, the caption “Other expenses” reflects material and unusual expenses that should be disclosed
separately from usual line items, to avoid distortion of the financial information from regular operations, namely
restructuring costs resulting from the merger (including curtailment costs) as well as one-off non-cash items that result
from alignment of estimates between the two companies.
Table 6.
Telco 50.7 69.0 45.1 (34.6%) (11.1%)
Infrastructure 17.8 30.8 12.6 (59.1%) (29.3%)
Customer Related CAPEX 30.8 35.2 29.1 (17.2%) (5.5%)
Other 2.1 3.0 3.4 12.5% 62.5%
Audiovisuals and Cinema Exhibition 7.9 8.1 7.6 (5.5%) (3.1%)
Recurrent CAPEX 58.6 77.1 52.7 (31.5%) (10.0%)
Non-Recurrent CAPEX 2.0 3.6 3.9 8.4% 98.3%
Total CAPEX 60.5 80.7 56.7 (29.8%) (6.4%)
Pro-Forma CAPEX (Millions of Euros) 1Q13 1Q14 1Q14 / 1Q134Q13 1Q14 / 4Q13
26
CONSOLIDATED MANAGEMENT REPORT 1Q14
capitalization of certain movie rights in the Audiovisuals division.
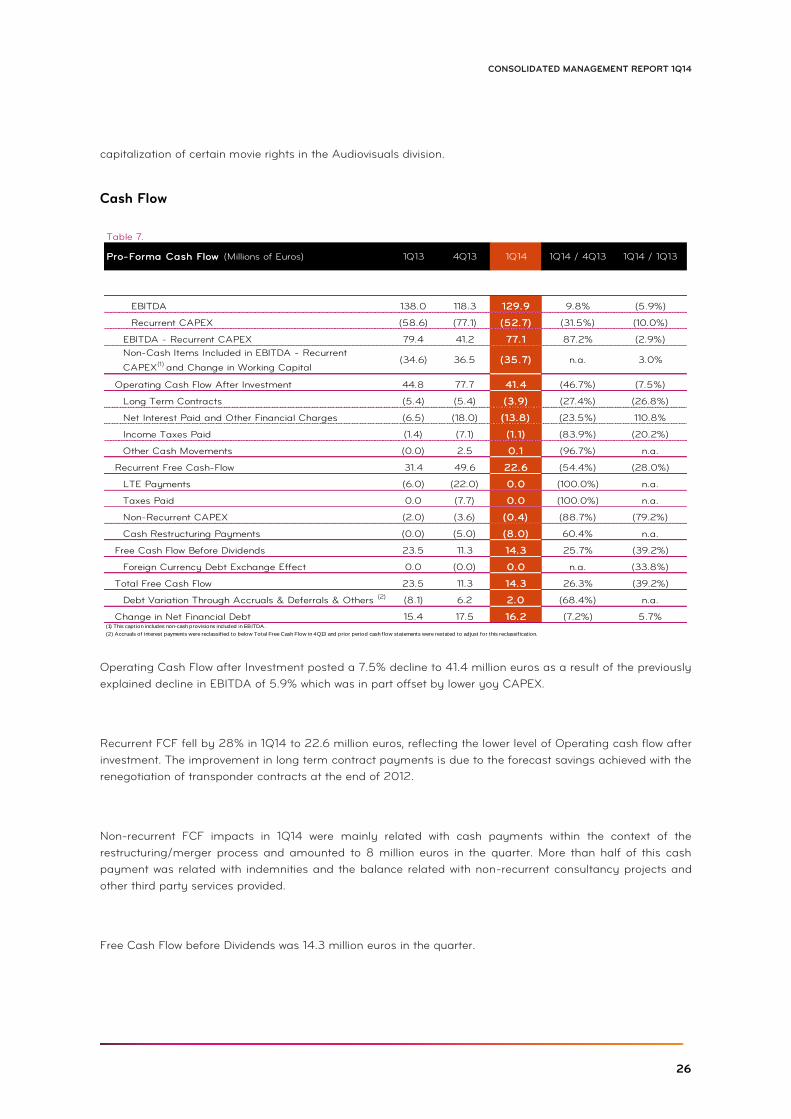
Cash Flow
Operating Cash Flow after Investment posted a 7.5% decline to 41.4 million euros as a result of the previously
explained decline in EBITDA of 5.9% which was in part offset by lower yoy CAPEX.
Recurrent FCF fell by 28% in 1Q14 to 22.6 million euros, reflecting the lower level of Operating cash flow after
investment. The improvement in long term contract payments is due to the forecast savings achieved with the
renegotiation of transponder contracts at the end of 2012.
Non-recurrent FCF impacts in 1Q14 were mainly related with cash payments within the context of the
restructuring/merger process and amounted to 8 million euros in the quarter. More than half of this cash
payment was related with indemnities and the balance related with non-recurrent consultancy projects and
other third party services provided.
Free Cash Flow before Dividends was 14.3 million euros in the quarter.
Table 7.
EBITDA 138.0 118.3 129.9 9.8% (5.9%)
Recurrent CAPEX (58.6) (77.1) (52.7) (31.5%) (10.0%)
EBITDA - Recurrent CAPEX 79.4 41.2 77.1 87.2% (2.9%)
Non-Cash Items Included in EBITDA - Recurrent
CAPEX(1) and Change in Working Capital (34.6) 36.5 (35.7) n.a. 3.0%
Operating Cash Flow After Investment 44.8 77.7 41.4 (46.7%) (7.5%)
Long Term Contracts (5.4) (5.4) (3.9) (27.4%) (26.8%)
Net Interest Paid and Other Financial Charges (6.5) (18.0) (13.8) (23.5%) 110.8%
Income Taxes Paid (1.4) (7.1) (1. 1) (83.9%) (20.2%)
Other Cash Movements (0.0) 2.5 0.1 (96.7%) n.a.
Recurrent Free Cash-Flow 31.4 49.6 22.6 (54.4%) (28.0%)
LTE Payments (6.0) (22.0) 0.0 (100.0%) n.a.
Taxes Paid 0.0 (7.7) 0.0 (100.0%) n.a.
Non-Recurrent CAPEX (2.0) (3.6) (0.4) (88.7%) (79.2%)
Cash Restructuring Payments (0.0) (5.0) (8.0) 60.4% n.a.
Free Cash Flow Before Dividends 23.5 11.3 14.3 25.7% (39.2%)
Foreign Currency Debt Exchange Effect 0.0 (0.0) 0.0 n.a. (33.8%)
Total Free Cash Flow 23.5 11.3 14.3 26.3% (39.2%)
Debt Variation Through Accruals & Deferrals & Others (2) (8.1) 6.2 2.0 (68.4%) n.a.
Change in Net Financial Debt 15.4 17.5 16.2 (7.2%) 5.7%
(2) Accruals of interest payments were reclassif ied to below Total Free Cash Flow in 4Q13 and prior period cash f low statements were restated to adjust for this reclassif icat ion.
4Q13 1Q14 / 4Q13
(1) This capt ion includes non-cash provisions included in EBITDA.
Pro-Forma Cash Flow (Millions of Euros) 1Q13 1Q14 1Q14 / 1Q13
27
ZON OPTIMUS, SGPS, SA
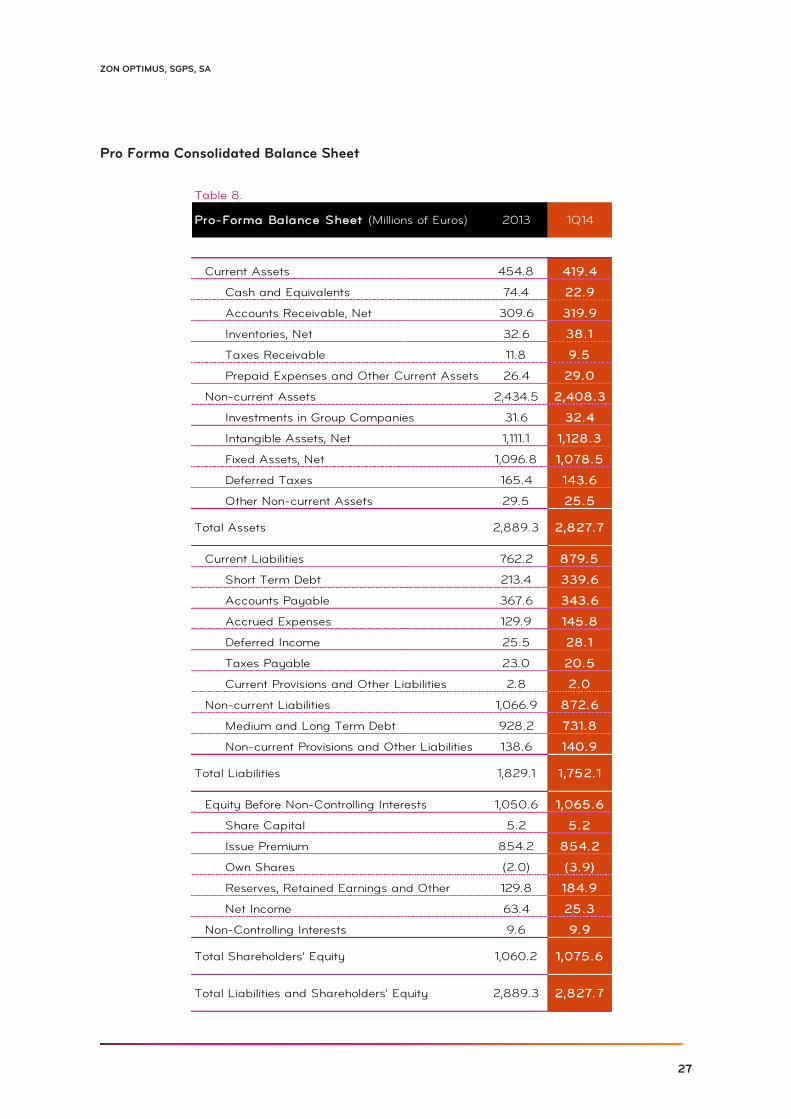
Pro Forma Consolidated Balance Sheet
Table 8.
Current Assets 454.8 419.4
Cash and Equivalents 74.4 22.9
Accounts Receivable, Net 309.6 319.9
Inventories, Net 32.6 38.1
Taxes Receivable 11.8 9.5
Prepaid Expenses and Other Current Assets 26.4 29.0
Non-current Assets 2,434.5 2,408.3
Investments in Group Companies 31.6 32.4
Intangible Assets, Net 1,111.1 1,128.3
Fixed Assets, Net 1,096.8 1,078.5
Deferred Taxes 165.4 143.6
Other Non-current Assets 29.5 25.5
Total Assets 2,889.3 2,827.7
Current Liabilities 762.2 879.5
Short Term Debt 213.4 339.6
Accounts Payable 367.6 343.6
Accrued Expenses 129.9 145.8
Deferred Income 25.5 28.1
Taxes Payable 23.0 20.5
Current Provisions and Other Liabilities 2.8 2.0
Non-current Liabilities 1,066.9 872.6
Medium and Long Term Debt 928.2 731.8
Non-current Provisions and Other Liabilities 138.6 140.9
Total Liabilities 1,829.1 1,752.1
Equity Before Non-Controlling Interests 1,050.6 1,065.6
Share Capital 5.2 5.2
Issue Premium 854.2 854.2
Own Shares (2.0) (3.9)
Reserves, Retained Earnings and Other 129.8 184.9
Net Income 63.4 25.3
Non-Controlling Interests 9.6 9.9
Total Shareholders' Equity 1,060.2 1,075.6
Total Liabilities and Shareholders' Equity 2,889.3 2,827.7
Pro-Forma Balance Sheet (Millions of Euros) 2013 1Q14
28
CONSOLIDATED MANAGEMENT REPORT 1Q14
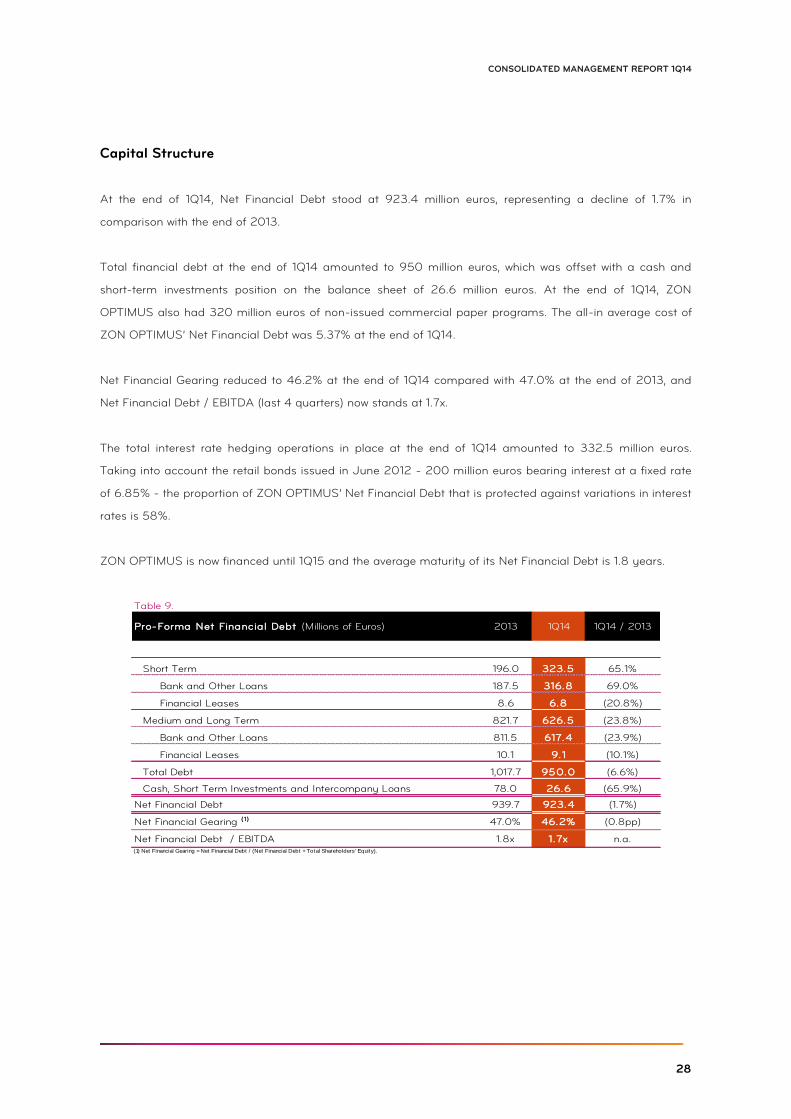
Capital Structure
At the end of 1Q14, Net Financial Debt stood at 923.4 million euros, representing a decline of 1.7% in
comparison with the end of 2013.
Total financial debt at the end of 1Q14 amounted to 950 million euros, which was offset with a cash and
short-term investments position on the balance sheet of 26.6 million euros. At the end of 1Q14, ZON
OPTIMUS also had 320 million euros of non-issued commercial paper programs. The all-in average cost of
ZON OPTIMUS’ Net Financial Debt was 5.37% at the end of 1Q14.
Net Financial Gearing reduced to 46.2% at the end of 1Q14 compared with 47.0% at the end of 2013, and
Net Financial Debt / EBITDA (last 4 quarters) now stands at 1.7x.
The total interest rate hedging operations in place at the end of 1Q14 amounted to 332.5 million euros.
Taking into account the retail bonds issued in June 2012 - 200 million euros bearing interest at a fixed rate
of 6.85% - the proportion of ZON OPTIMUS’ Net Financial Debt that is protected against variations in interest
rates is 58%.
ZON OPTIMUS is now financed until 1Q15 and the average maturity of its Net Financial Debt is 1.8 years.
Table 9.
Short Term 196.0 323.5 65.1%
Bank and Other Loans 187.5 316.8 69.0%
Financial Leases 8.6 6.8 (20.8%)
Medium and Long Term 821.7 626.5 (23.8%)
Bank and Other Loans 811.5 617.4 (23.9%)
Financial Leases 10.1 9.1 (10.1%)
Total Debt 1,017.7 950.0 (6.6%)
Cash, Short Term Investments and Intercompany Loans 78.0 26.6 (65.9%)
Net Financial Debt 939.7 923.4 (1.7%)
Net Financial Gearing ( 1) 47.0% 46.2% (0.8pp)
Net Financial Debt / EBITDA 1.8x 1.7x n.a.(1) Net Financial Gearing = Net Financial Debt / (Net Financial Debt + Total Shareholders' Equity).
Pro-Forma Net Financial Debt (Millions of Euros) 2013 1Q14 / 20131Q14

29
ZON OPTIMUS, SGPS, SA
5.
CONSOLIDATED FINANCIAL STATEMENTS
30
CONSOLIDATED MANAGEMENT REPORT 1Q14
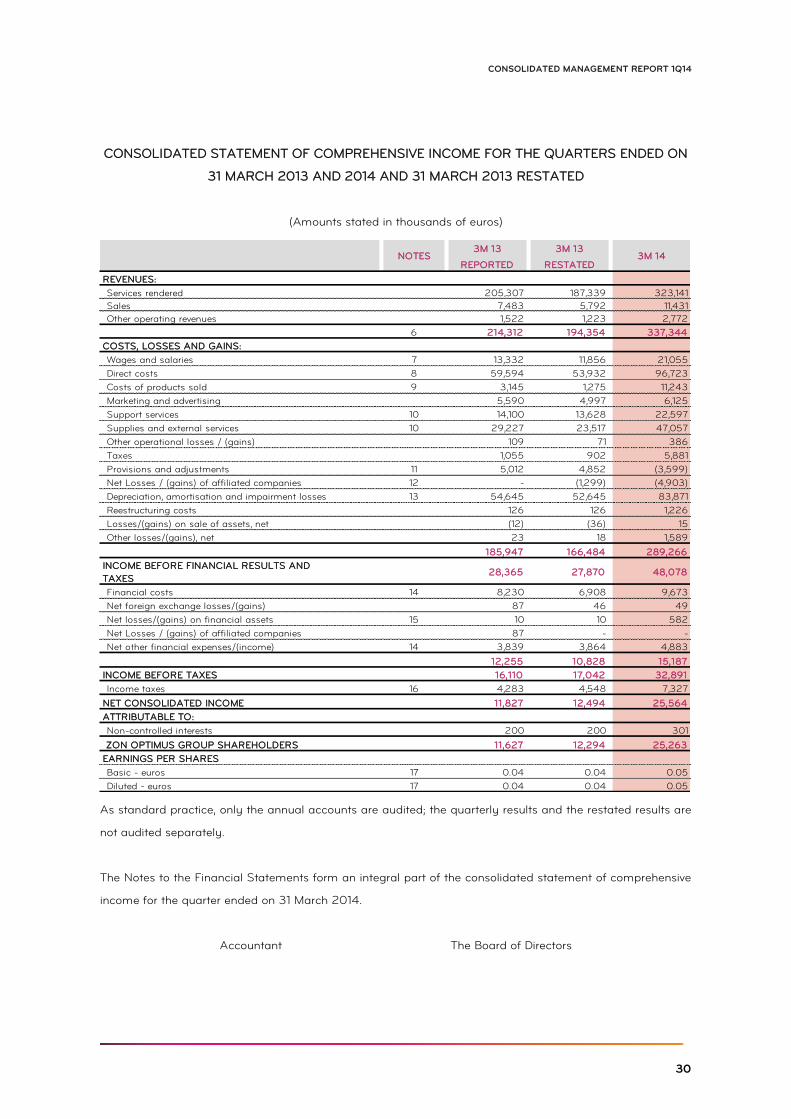
CONSOLIDATED STATEMENT OF COMPREHENSIVE INCOME FOR THE QUARTERS ENDED ON
31 MARCH 2013 AND 2014 AND 31 MARCH 2013 RESTATED
(Amounts stated in thousands of euros)
As standard practice, only the annual accounts are audited; the quarterly results and the restated results are
not audited separately.
The Notes to the Financial Statements form an integral part of the consolidated statement of comprehensive
income for the quarter ended on 31 March 2014.
Accountant The Board of Directors
3M 13 3M 13
REPORTED RESTATED
REVENUES:
Services rendered 205,307 187,339 323,141
Sales 7,483 5,792 11,431
Other operating revenues 1,522 1,223 2,772
6 214,312 194,354 337,344
COSTS, LOSSES AND GAINS:
Wages and salaries 7 13,332 11,856 21,055
Direct costs 8 59,594 53,932 96,723
Costs of products sold 9 3,145 1,275 11,243
Marketing and advertising 5,590 4,997 6,125
Support services 10 14,100 13,628 22,597
Supplies and external services 10 29,227 23,517 47,057
Other operational losses / (gains) 109 71 386
Taxes 1,055 902 5,881
Provisions and adjustments 11 5,012 4,852 (3,599)
Net Losses / (gains) of affiliated companies 12 - (1,299) (4,903)
Depreciation, amortisation and impairment losses 13 54,645 52,645 83,871
Reestructuring costs 126 126 1,226
Losses/(gains) on sale of assets, net (12) (36) 15
Other losses/(gains), net 23 18 1,589
185,947 166,484 289,266
28,365 27,870 48,078
Financial costs 14 8,230 6,908 9,673
Net foreign exchange losses/(gains) 87 46 49
Net losses/(gains) on financial assets 15 10 10 582
Net Losses / (gains) of affiliated companies 87 - -
Net other financial expenses/(income) 14 3,839 3,864 4,883
12,255 10,828 15,187
INCOME BEFORE TAXES 16,110 17,042 32,891
Income taxes 16 4,283 4,548 7,327
NET CONSOLIDATED INCOME 11,827 12,494 25,564
ATTRIBUTABLE TO:
Non-controlled interests 200 200 301
ZON OPTIMUS GROUP SHAREHOLDERS 11,627 12,294 25,263
EARNINGS PER SHARES
Basic - euros 17 0.04 0.04 0.05
Diluted - euros 17 0.04 0.04 0.05
NOTES 3M 14
INCOME BEFORE FINANCIAL RESULTS AND
TAXES
31
ZON OPTIMUS, SGPS, SA
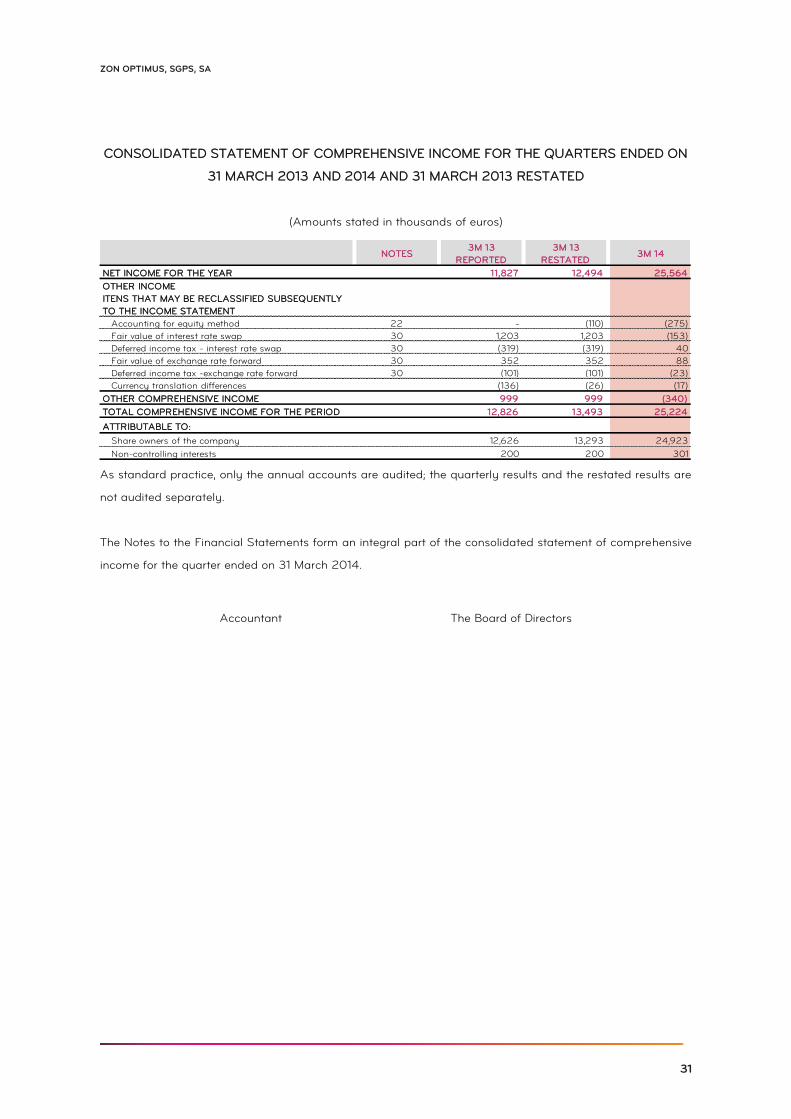
CONSOLIDATED STATEMENT OF COMPREHENSIVE INCOME FOR THE QUARTERS ENDED ON
31 MARCH 2013 AND 2014 AND 31 MARCH 2013 RESTATED
(Amounts stated in thousands of euros)
As standard practice, only the annual accounts are audited; the quarterly results and the restated results are
not audited separately.
The Notes to the Financial Statements form an integral part of the consolidated statement of comprehensive
income for the quarter ended on 31 March 2014.
Accountant The Board of Directors
3M 13 3M 13
REPORTED RESTATED
NET INCOME FOR THE YEAR 11,827 12,494 25,564
OTHER INCOME
ITENS THAT MAY BE RECLASSIFIED SUBSEQUENTLY
TO THE INCOME STATEMENT
Accounting for equity method 22 - (110) (275)
Fair value of interest rate swap 30 1,203 1,203 (153)
Deferred income tax - interest rate swap 30 (319) (319) 40
Fair value of exchange rate forward 30 352 352 88
Deferred income tax -exchange rate forward 30 (101) (101) (23)
Currency translation differences (136) (26) (17)
OTHER COMPREHENSIVE INCOME 999 999 (340)
TOTAL COMPREHENSIVE INCOME FOR THE PERIOD 12,826 13,493 25,224
ATTRIBUTABLE TO:
Share owners of the company 12,626 13,293 24,923
Non-controlling interests 200 200 301
NOTES 3M 14
32
CONSOLIDATED MANAGEMENT REPORT 1Q14
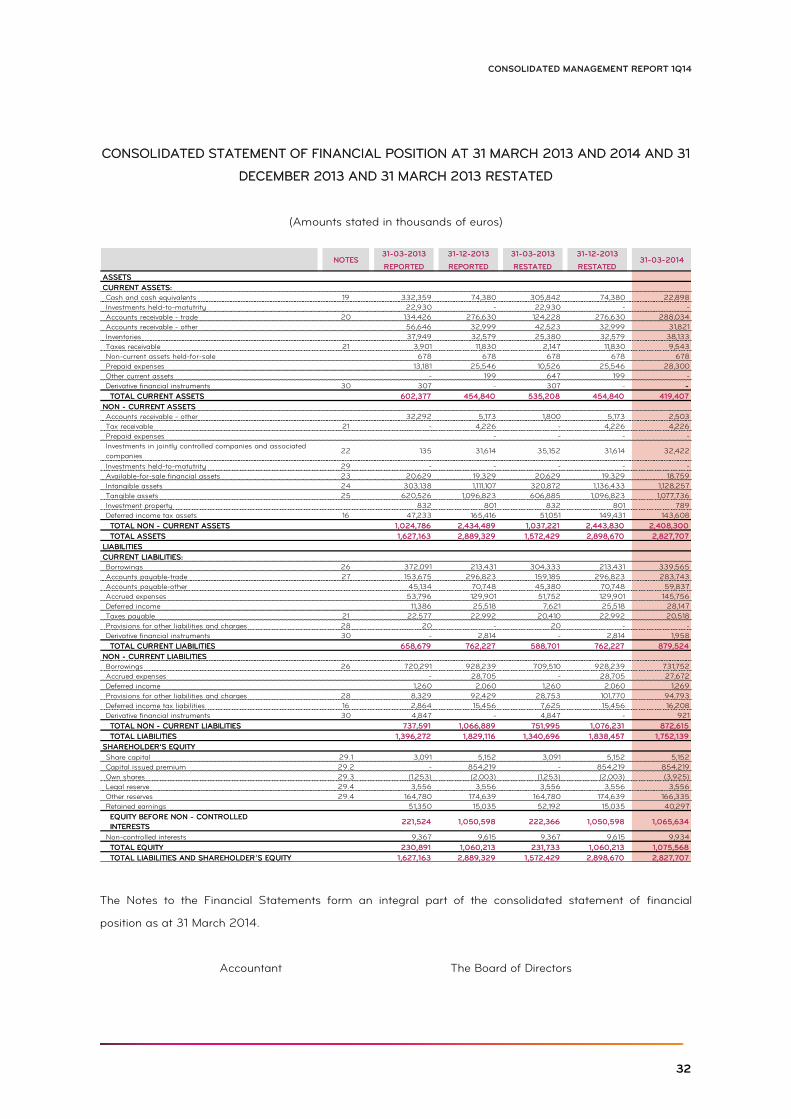
CONSOLIDATED STATEMENT OF FINANCIAL POSITION AT 31 MARCH 2013 AND 2014 AND 31
DECEMBER 2013 AND 31 MARCH 2013 RESTATED
(Amounts stated in thousands of euros)
The Notes to the Financial Statements form an integral part of the consolidated statement of financial
position as at 31 March 2014.
Accountant The Board of Directors
31-03-2013 31-12-2013 31-03-2013 31-12-2013
REPORTED REPORTED RESTATED RESTATED
ASSETS
CURRENT ASSETS:
Cash and cash equivalents 19 332,359 74,380 305,842 74,380 22,898
Investments held-to-matutrity 22,930 - 22,930 - -
Accounts receivable - trade 20 134,426 276,630 124,228 276,630 288,034
Accounts receivable - other 56,646 32,999 42,523 32,999 31,821
Inventories 37,949 32,579 25,380 32,579 38,133
Taxes receivable 21 3,901 11,830 2,147 11,830 9,543
Non-current assets held-for-sale 678 678 678 678 678
Prepaid expenses 13,181 25,546 10,526 25,546 28,300
Other current assets - 199 647 199 -
Derivative financial instruments 30 307 - 307 - -
TOTAL CURRENT ASSETS 602,377 454,840 535,208 454,840 419,407
NON - CURRENT ASSETS
Accounts receivable - other 32,292 5,173 1,800 5,173 2,503
Tax receivable 21 - 4,226 - 4,226 4,226
Prepaid expenses - - - -
22 135 31,614 35,152 31,614 32,422
Investments held-to-matutrity 29 - - - - -
Available-for-sale financial assets 23 20,629 19,329 20,629 19,329 18,759
Intangible assets 24 303,138 1,111,107 320,872 1,136,433 1,128,257
Tangible assets 25 620,526 1,096,823 606,885 1,096,823 1,077,736
Investment property 832 801 832 801 789
Deferred income tax assets 16 47,233 165,416 51,051 149,431 143,608
TOTAL NON - CURRENT ASSETS 1,024,786 2,434,489 1,037,221 2,443,830 2,408,300
TOTAL ASSETS 1,627,163 2,889,329 1,572,429 2,898,670 2,827,707
LIABILITIES
CURRENT LIABILITIES:
Borrowings 26 372,091 213,431 304,333 213,431 339,565
Accounts payable-trade 27 153,675 296,823 159,185 296,823 283,743
Accounts payable-other 45,134 70,748 45,380 70,748 59,837
Accrued expenses 53,796 129,901 51,752 129,901 145,756
Deferred income 11,386 25,518 7,621 25,518 28,147
Taxes payable 21 22,577 22,992 20,410 22,992 20,518
Provisions for other liabilities and charges 28 20 - 20 - -
Derivative financial instruments 30 - 2,814 - 2,814 1,958
TOTAL CURRENT LIABILITIES 658,679 762,227 588,701 762,227 879,524
NON - CURRENT LIABILITIES
Borrowings 26 720,291 928,239 709,510 928,239 731,752
Accrued expenses - 28,705 - 28,705 27,672
Deferred income 1,260 2,060 1,260 2,060 1,269
Provisions for other liabilities and charges 28 8,329 92,429 28,753 101,770 94,793
Deferred income tax liabilities 16 2,864 15,456 7,625 15,456 16,208
Derivative financial instruments 30 4,847 - 4,847 - 921
TOTAL NON - CURRENT LIABILITIES 737,591 1,066,889 751,995 1,076,231 872,615
TOTAL LIABILITIES 1,396,272 1,829,116 1,340,696 1,838,457 1,752,139
SHAREHOLDER'S EQUITY
Share capital 29.1 3,091 5,152 3,091 5,152 5,152
Capital issued premium 29.2 - 854,219 - 854,219 854,219
Own shares 29.3 (1,253) (2,003) (1,253) (2,003) (3,925)
Legal reserve 29.4 3,556 3,556 3,556 3,556 3,556
Other reserves 29.4 164,780 174,639 164,780 174,639 166,335
Retained earnings 51,350 15,035 52,192 15,035 40,297
EQUITY BEFORE NON - CONTROLLED
INTERESTS221,524 1,050,598 222,366 1,050,598 1,065,634
Non-controlled interests 9,367 9,615 9,367 9,615 9,934
TOTAL EQUITY 230,891 1,060,213 231,733 1,060,213 1,075,568
TOTAL LIABILITIES AND SHAREHOLDER´S EQUITY 1,627,163 2,889,329 1,572,429 2,898,670 2,827,707
31-03-2014NOTES
Investments in jointly controlled companies and associated
companies
33
ZON OPTIMUS, SGPS, SA
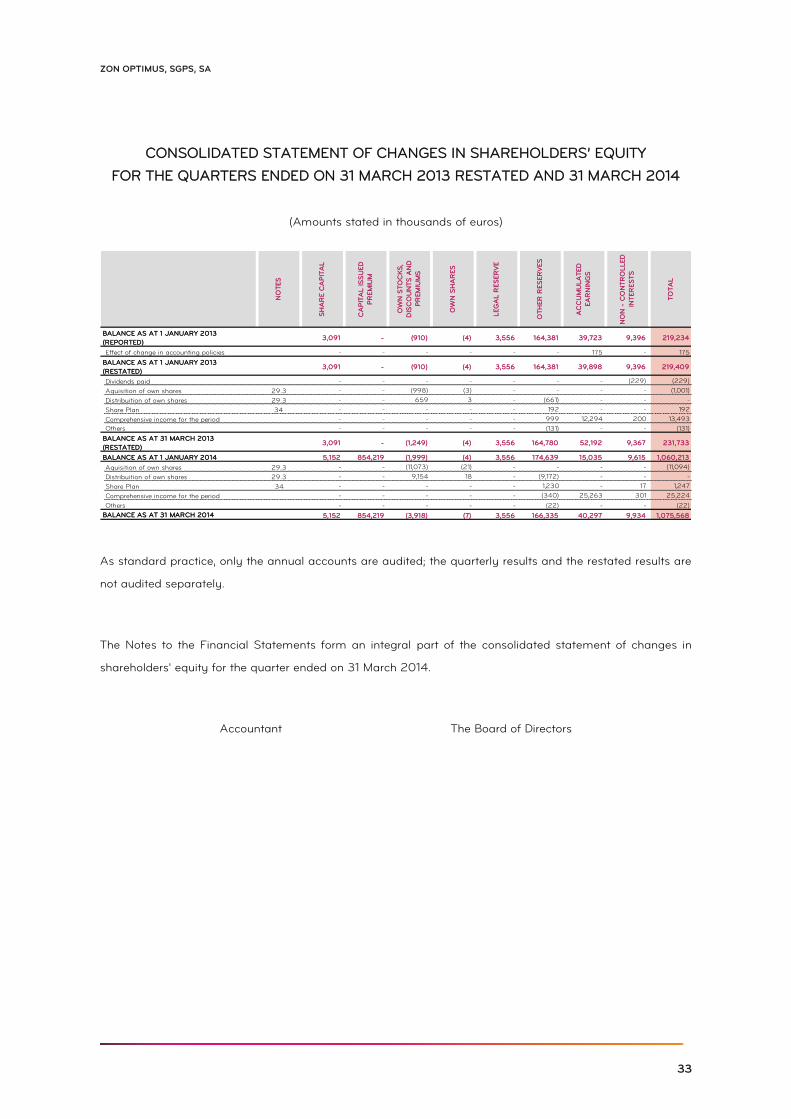
CONSOLIDATED STATEMENT OF CHANGES IN SHAREHOLDERS’ EQUITY
FOR THE QUARTERS ENDED ON 31 MARCH 2013 RESTATED AND 31 MARCH 2014
(Amounts stated in thousands of euros)
As standard practice, only the annual accounts are audited; the quarterly results and the restated results are
not audited separately.
The Notes to the Financial Statements form an integral part of the consolidated statement of changes in
shareholders' equity for the quarter ended on 31 March 2014.
Accountant The Board of Directors
NO
TES
SH
AR
E C
AP
ITA
L
CA
PIT
AL IS
SU
ED
PR
EM
IUM
OW
N S
TO
CK
S,
DIS
CO
UN
TS
AN
D
PR
EM
IUM
S
OW
N S
HA
RES
LEG
AL R
ES
ER
VE
OTH
ER
RES
ER
VES
AC
CU
MU
LA
TED
EA
RN
ING
S
NO
N -
CO
NTR
OLLED
INTER
ES
TS
TO
TA
L
3,091 - (910) (4) 3,556 164,381 39,723 9,396 219,234
Effect of change in accounting policies - - - - - - 175 - 175
3,091 - (910) (4) 3,556 164,381 39,898 9,396 219,409
Dividends paid - - - - - - - (229) (229)
Aquisition of own shares 29.3 - - (998) (3) - - - - (1,001)
Distribuition of own shares 29.3 - - 659 3 - (661) - - -
Share Plan 34 - - - - - 192 - - 192
Comprehensive income for the period - - - - - 999 12,294 200 13,493
Others - - - - - (131) - - (131)
3,091 - (1,249) (4) 3,556 164,780 52,192 9,367 231,733
5,152 854,219 (1,999) (4) 3,556 174,639 15,035 9,615 1,060,213
Aquisition of own shares 29.3 - - (11,073) (21) - - - - (11,094)
Distribuition of own shares 29.3 - - 9,154 18 - (9,172) - - -
Share Plan 34 - - - - - 1,230 - 17 1,247
Comprehensive income for the period - - - - - (340) 25,263 301 25,224
Others - - - - - (22) - - (22)
5,152 854,219 (3,918) (7) 3,556 166,335 40,297 9,934 1,075,568
BALANCE AS AT 1 JANUARY 2013
(REPORTED)
BALANCE AS AT 1 JANUARY 2013
(RESTATED)
BALANCE AS AT 31 MARCH 2013
(RESTATED)
BALANCE AS AT 1 JANUARY 2014
BALANCE AS AT 31 MARCH 2014
34
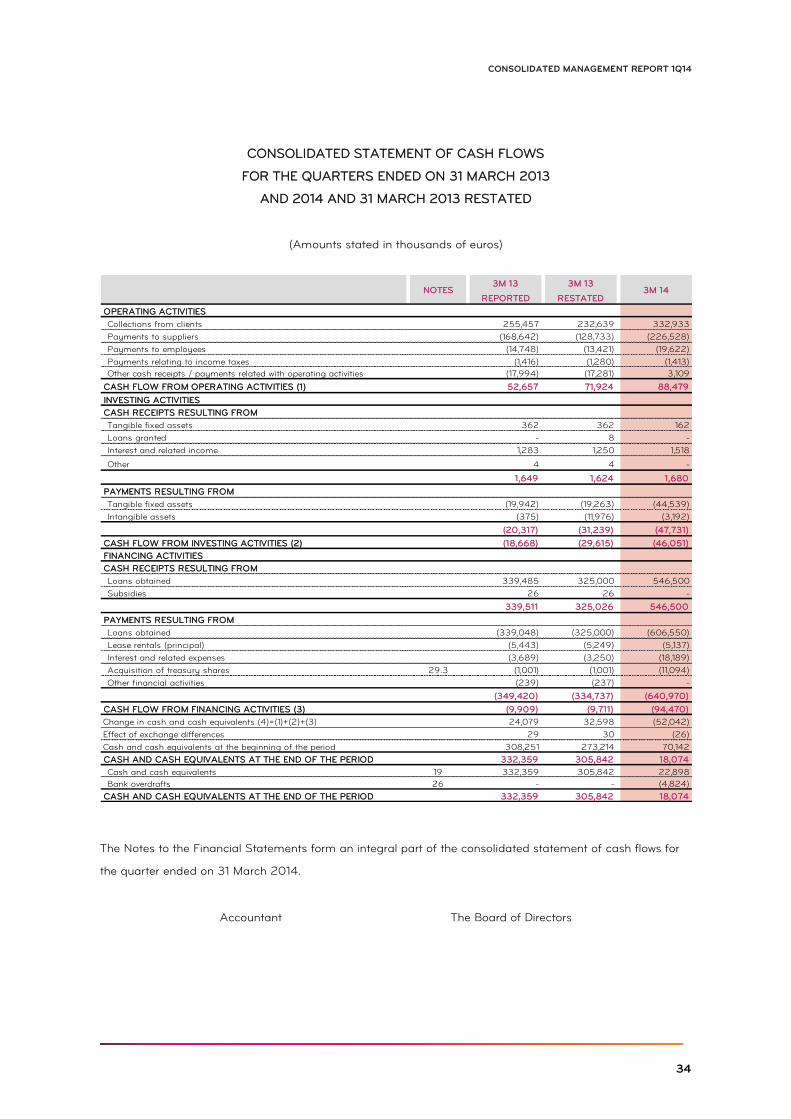
CONSOLIDATED MANAGEMENT REPORT 1Q14
CONSOLIDATED STATEMENT OF CASH FLOWS
FOR THE QUARTERS ENDED ON 31 MARCH 2013
AND 2014 AND 31 MARCH 2013 RESTATED
(Amounts stated in thousands of euros)
The Notes to the Financial Statements form an integral part of the consolidated statement of cash flows for
the quarter ended on 31 March 2014.
Accountant The Board of Directors
3M 13 3M 13
REPORTED RESTATED
OPERATING ACTIVITIES
Collections from clients 255,457 232,639 332,933
Payments to suppliers (168,642) (128,733) (226,528)
Payments to employees (14,748) (13,421) (19,622)
Payments relating to income taxes (1,416) (1,280) (1,413)
Other cash receipts / payments related with operating activities (17,994) (17,281) 3,109
CASH FLOW FROM OPERATING ACTIVITIES (1) 52,657 71,924 88,479
INVESTING ACTIVITIES
CASH RECEIPTS RESULTING FROM
Tangible fixed assets 362 362 162
Loans granted - 8 -
Interest and related income 1,283 1,250 1,518
Other 4 4 -
1,649 1,624 1,680
PAYMENTS RESULTING FROM
Tangible fixed assets (19,942) (19,263) (44,539)
Intangible assets (375) (11,976) (3,192)
(20,317) (31,239) (47,731)
CASH FLOW FROM INVESTING ACTIVITIES (2) (18,668) (29,615) (46,051)
FINANCING ACTIVITIES
CASH RECEIPTS RESULTING FROM
Loans obtained 339,485 325,000 546,500
Subsidies 26 26 -
339,511 325,026 546,500
PAYMENTS RESULTING FROM
Loans obtained (339,048) (325,000) (606,550)
Lease rentals (principal) (5,443) (5,249) (5,137)
Interest and related expenses (3,689) (3,250) (18,189)
Acquisition of treasury shares 29.3 (1,001) (1,001) (11,094)
Other financial activities (239) (237) -
(349,420) (334,737) (640,970)
CASH FLOW FROM FINANCING ACTIVITIES (3) (9,909) (9,711) (94,470)
Change in cash and cash equivalents (4)=(1)+(2)+(3) 24,079 32,598 (52,042)
Effect of exchange differences 29 30 (26)
Cash and cash equivalents at the beginning of the period 308,251 273,214 70,142
CASH AND CASH EQUIVALENTS AT THE END OF THE PERIOD 332,359 305,842 18,074
Cash and cash equivalents 19 332,359 305,842 22,898
Bank overdrafts 26 - - (4,824)
CASH AND CASH EQUIVALENTS AT THE END OF THE PERIOD 332,359 305,842 18,074
3M 14NOTES
35
ZON OPTIMUS, SGPS, SA
INTRODUCTORY NOTE 1.
NOTES TO THE CONSOLIDATED FINANCIAL STATEMENTS AS AT 31 MARCH
2014
ZON Optimus, SGPS, SA ("Zon Optimus" or "Company"), formerly named ZON Multimédia – Serviços de
Telecomunicações e Multimédia, SGPS, S.A., with Company headquarters registered at Rua Actor Antonio
Silva, 9, Campo Grande, was established by Portugal Telecom, SGPS, SA ("Portugal Telecom") on July 15,
1999 for the purpose of implementing its multimedia business strategy.
During the 2007 financial year, Portugal Telecom proceeded with the spin-off of ZON through the attribution
of its participation in the company to their shareholders, which become fully independent from Portugal
Telecom.
During the 2013 financial year, ZON Multimédia – Serviços de Telecomunicações e Multimédia, SGPS, S.A.,
("ZON") and Optimus, SGPS, S.A. ("Optimus SGPS") have merged through the incorporation of Optimus
SGPS into ZON. Thereafter, the Company adopted the current designation of ZON Optimus, SGPS, S.A..
The businesses operated by ZON Optimus and its associated companies, form the "ZON Optimus Group" or
"Group", which includes cable and satellite television services, voice and Internet access services, video
production and sale, advertising on Pay TV channels, cinema exhibition and distribution, and the production
of channels for Pay TV.
ZON Optimus shares are listed on the Euronext Lisbon market. The Group’s shareholder’s structure as at 31
March 2014 is shown in Note 29.
Cable and satellite television in Portugal is mainly provided by ZON TV Cabo Portugal , S.A. ("ZON TV Cabo")
and its subsidiaries, ZON TV Cabo Açoreana, S.A. ("ZON TV Cabo Açoreana") and ZON TV Cabo
Madeirense, S.A. ("ZON TV Cabo Madeira") . These companies carry out: a) cable and satellite television
distribution; b) the operation of electronic communications services, including data and multimedia
communication services in general; c) IP voice services ("VOIP" - Voice over IP); d) Mobile Virtual Network
Operator (“MVNO”), and e) the provision of consultancy and similar services directly or indirectly related to
the above mentioned activities and services. The business of ZON TV Cabo, ZON TV Cabo Açoreana and
ZON TV Cabo Madeira is regulated by Law no . 5/2004 (Electronic Communications Law), which establishes
the legal regime governing electronic communications networks and services.
36
CONSOLIDATED MANAGEMENT REPORT 1Q14
ZON Conteúdos – Atividade de Televisão e de Produção de Conteúdos, S.A. (“ZON Conteúdos”) and ZON
Lusomundo TV, Lda. (“ZON Lusomundo TV”) operate in the television and content production business, and
currently produce films and series channels, which are distributed, among other operators, by ZON TV Cabo
and its affiliates. ZON Conteúdos also manages the advertising space on Pay TV channels and in the
cinemas of ZON Lusomundo Cinemas, S.A. (“ZON LM Cinemas”).
ZON Lusomundo Audiovisuais, S.A. (“ZON LM Audiovisuais”) and ZON LM Cinemas together with their
associated companies operate in the audiovisual sector, which includes video production and sale, cinema
exhibition and distribution, and the acquisition/negotiation of Pay TV and VOD (video-on-demand) rights.
On 27 August 2013, the Company completed a merger operation by incorporation of Optimus SGPS into
ZON. Optimus SGPS was a parent company of a group of companies which includes Optimus -
Comunicações S.A. which operates the latest generation mobile communication network, GSM/UMTS/LTE,
with extensive coverage in the national territory , as well as latest next generation wireline network, which
includes a transmission component, a backbone component and local access fiber components. As a result
of the merger, all Optimus SGPS subsidiaries were included in the consolidation scope: Be Artis – Concepção,
Construção e Gestão de Redes de Comunicação, S.A. (“Be Artis”), which operates in the design, construction,
management and exploitation of electronic communications networks and their equipment and infrastructure,
management of technologic assets and rendering of related services; Be Towering – Gestão de Torres de
Telecomunicações, S.A. (“Be Towering”), which operates in the implementation, installation and exploitation of
towers and other sites for the installation of telecommunications equipment; Optimus - Communications , SA
("Optimus") , which operates in the implementation, operation, exploitation and offer of networks and
rendering services of electronic communications and related resources; offer and commercialization of
products and equipments of electronic communications; Per-mar – Sociedade de Construções, S.A. (“Per-
mar”), which operates in the purchase, sale, renting and operation of property and commercial
establishments, and Sontária – Empreendimentos Imobiliários, S.A. (“Sontária”), which operates in the
undertaking of urbanization and building construction, planning, urban management, studies, construction
and property management, purchase and sale of properties and resale of properties purchased for that
purpose.
These Notes to the Consolidated Financial Statements follow the order in which the items are shown in the
consolidated financial statements.
The consolidated financial statements for the period ended on 31 March 2014 were approved by the Board of
Directors and their issue authorised on 7 May 2014.
The Board of Directors believes that the financial statements give a true and fair view of the Company’s
operations, financial performance and cash flows.
37
ZON OPTIMUS, SGPS, SA
ACCOUNTING POLICIES 2.
The principal accounting policies adopted in the preparation of the financial statements are described below.
These policies were consistently applied to all the financial years presented, unless otherwise indicated.
2.1. PRINCIPLES OF PRESENTATION
The consolidated financial statements are presented in euros as this is the main currency of the Group's
operations. The financial statements of subsidiaries located abroad were converted into euros in accordance
with the accounting policies described in Note 2.20.
The consolidated financial statements of ZON Optimus were prepared in accordance with the International
Financial Reporting Standards (“IFRS”) issued by the International Accounting Standards Board (“IASB”), and
Interpretations issued by the International Financial Reporting Committee (“IFRIC”) or the previous Standing
Interpretations Committee (“SIC”), adopted by the European Union, in force as at 1 January 2014.
These consolidated finantial statements are presented in accordance with IAS 34 — Interim Financial
Reporting (“IAS 34”). Therefore, these financial statements do not include all the information required by the
IFRS and so they should be analysed together with the consolidated financial statements of the period ended
at 31 December 2013.
The consolidated financial statements were prepared on a going concern basis from the ledgers and
accounting records of the companies included in the consolidation (Annex A), using the historical cost
convention, adjusted where applicable for the valuation of financial assets and liabilities (including derivatives)
at their fair value.
In preparing the consolidated financial statements in accordance with IFRS, the Board used estimates,
assumptions and critical judgements with impact on the value of assets and liabilities and the recognition of
income and costs in each reporting period. Although these estimates were based on the best information
available at the date of preparation of the consolidated financial statements, current and future results may
differ from these estimates. The areas involving a higher element of judgment and estimates are described in
Note 3.
38
CONSOLIDATED MANAGEMENT REPORT 1Q14
CHANGES IN ACCOUNTING POLICIES AND DISCLOSURES
The standards and interpretations that became effective as of 1 January 2014 are as follows:
IFRS 10 (new), “Consolidated financial statements”. IFRS 10 replaces all the guidance on control and
consolidation included in IAS 27 and SIC 12, amending the definition of control and the criteria for
determining control. The basic principle that the consolidated financial statements present the parent
company and subsidiaries as a single entity remains unchanged. This standard did not have any
significant impact on the Group’s financial statements. The Group has early adopted this standard in
the year ended at 31 December 2013.
IFRS 11 (new), “Joint Agreements”. IFRS 11 focuses on the rights and obligations associated with the joint
arrangements, rather than its legal form. Joint arrangements may be either joint operations (rights over
assets and obligations) or joint ventures (rights to the net assets of the arrangement as measured by
the equity method). Proportionate consolidation is no longer allowed when assessing jointly controlled
Entities. The Group has early adopted this standard in the year ended at 31 December 2013, resulting in
changing the accounting of jointly controlled entities, previously proportionately consolidated, being
recorded according to the equity method. Jointly controlled entities are disclosed in the attached maps.
IFRS 12 (new) – “Disclosure of interests in other entities”. This reporting standard establishes disclosure
requirements for all types of interests in other entities, including joint ventures, associates and special
purpose entities, in order to assess the nature, risk and financial impacts associated with the entity’s
interest. This standard resulted in additional disclosures about interests in other entities (Map attached).
IAS 27 (2011 revision), “Separate financial statements”. IAS 27 was revised after the issue of IFRS 10
and contains the accounting and disclosure requirements for investments in subsidiaries, joint ventures
and associates where an entity prepares separate financial statements. This standard did not have any
impact on the Group’s financial statements.
IFRS 28 (2011 revision), “Investments in associates and joint ventures”. IAS 28 was revised after the
issue of IFRS 11 and prescribes the accounting treatment of investments in associates and joint ventures,
establishing the requirements for applying the equity method. Early adoption of this standard resulted in
changing the accounting of jointly controlled entities, previously proportionately consolidated, being
recorded according to the equity method. Jointly controlled entities are disclosed in the attached maps.
Amendment to IFRS 10, IFRS 12 and IFRS 27 – “Bodies Managing Financial Contributions”. This
amendment includes the definition of an Entity managing financial contributions and introduces the
regime of exception to the obligation for Entities managing financial partnerships that qualify to provide
39
ZON OPTIMUS, SGPS, SA
funding, once all investments are measured against fair value. Specific disclosures are required for IFRS
12. This standard does not apply to the Group.
IAS 32 (amendment), “Disclosures – offsetting financial assets and financial liabilities”. This amendment
is part of the IASB’s “assets and liabilities offsetting” project and clarifies the meaning of “currently has
a legally enforceable right of set-off” and clarifies that some gross settlement systems (clearing houses)
may be considered equivalent to net settlement. This amendment does not have any impact on the
Group’s consolidated financial statements.
IAS 36 (amendment), “Recoverable Amount Disclosures for Non-Financial Assets”. This amendment
eliminates the disclosure requirements of the recoverable amount of a cash-generating unit like goodwill
or intangible assets with indefinite useful lives allocated to periods where it was not recorded any
impairment loss or reversal of impairment. Introduces additional disclosure requirements for assets for
which it was recorded an impairment loss or reversal of impairment and the recoverable amount of these
has been determined based on fair value less costs to sell. This amendment does not have any impact
on the Group’s consolidated financial statements.
IAS 39 (amendment), “Financial Instruments: Recognition and Measurement (Novation of Derivatives
and Continuation of Hedge Accounting)”. This amendment permits, the continuation of hedge
accounting when a derivative designated as a hedging instrument is legally imposed, subject to the
contract counterparty novation to a clearing house. This amendment does not have any impact on the
Group’s consolidated financial statements.
The following standards, interpretations, amendments and revisions, with mandatory application in future
financial years, have not yet been approved (endorsed) by the European Union, at the date of approval of
these financial statements:
IFRS 9 (new), “Financial instruments – classification and measurement” (effective date to be
designated). The initial phase of IFRS 9 forecasts two types of measurement: amortised cost and fair
value. All equity instruments are measured at fair value. A financial instrument is measured at
amortised cost only if the company has it to collect contractual cash flows and the cash flows represent
principal and interest. Otherwise, financial instruments are measured at fair value through profit and
loss.
IFRS 7 and 9 (Amendment), "Financial Instruments" (effective date to be designated). The amendment
to IFRS 9 is part of the draft revision of IAS 39 and establishes the requirements for the application of
hedge accounting. IFRS 7 was also revised as a result of this amendment.
40
CONSOLIDATED MANAGEMENT REPORT 1Q14
IFRS 14 (new), “Regulatory Deferral Accounts” (effective for annual periods beginning on or after 1
January 2016). This standard’s main purpose is to improve comparability of financial reports for
companies in regulated markets, allowing the companies that currently record assets and liabilities in
result of the regulation form the markets where they operate, in accordance with the adopted
accounting principles, do not have the need to eliminate those assets and liabilities in the first time
adoption of the IFRS. This standard will have no impact on the Group’s consolidated financial
statements.
IAS 19 (Amendment), “Employee benefits” (effective for annual periods beginning on or after 1 July
2014). This amendment clarifies the circumstances in which employee contribution plans for post-
employment benefits are a reduction in the cost of short-term benefits. This standard is not applicable
to the Group.
Improvements to Financial Reporting Standards (2010-2012 cycle and 2011-2013 cycle) (effective for
annual periods beginning on or after 1 July 2014). These improvements involve the review of several
standards.
IFRIC 21 (new), “Levies” (effective for annual periods beginning on or after 1 January 2014). This
amendment establishes the conditions regarding the timing of recognition of a liability related to pay a
levy by an entity as a result of a particular event (eg, participation in a particular market), without having
goods and specified services associated.
The Group is calculating the impact of this alteration and will apply this standard as soon as it becomes
effective.
VOLUNTARY CHANGES IN ACCOUNTING POLICIES
During the third quarter of the year ended at 31 December 2013, the Group, in addition to the early adoption
of IFRS 10, IFRS 11, IFRS 12, and the amendments of IAS 27 and IAS 28, in line with in the sector and,
particularly, considering the necessary standardization of policies with Optimus SGPS subsidiaries, changed
its accounting criteria for costs related to customers’ loyalty contracts. To date, these were recorded as an
expense in the year they occurred.
From 1 January 2013, the costs incurred for customers’ loyalty contracts, which include compensation
clauses in the event of early termination, are capitalized as "Intangible assets" and amortized over the period
of their contracts, since it is possible to apply a reliable cost allocation to the respective contracts, as well as
the revenue generated by each contract, thus fulfilling the criteria for capitalization required by IAS 38 -
Intangible Assets . When a contract is terminated, the net value of intangible assets associated with that
41
ZON OPTIMUS, SGPS, SA
contract is immediately recognized as an expense in the consolidated statement of comprehensive income.
This accounting policy allows a more true, fair and reliable presentation of the financial position and the
financial performance of the Group, as it allows the alignment between costs incurred with customer’s loyalty
contracts and the revenue generated.
Additionally, at the date of each statement of financial position and whenever an event or change of
circumstances indicates that the recorded amount of an asset may not be recoverable, impairment tests are
carried out to ensure that the current value of the estimated revenues associated with each contract is greater
than the amount that is capitalized.
Also, during the year ended 31 December 2013, the Group changed the accounting policy regarding the
future rights of use of movies and series. To date, these were recorded as an expense in the year they
occurred. The costs are capitalized as "Intangible assets" once it is possible to measure, reliably, the costs
incurred with each contract as well as the revenue generated, meeting the criteria for capitalization as
required by IAS 38 - Intangible assets. Additionally, the model of amortization and impairment of those
rights has been adjusted, reflecting the business and how the rights are used more reliably.
Additionally, at the date of each statement of financial position and whenever an event or change of
circumstances indicates that the recorded amount of an asset may not be recoverable, impairment tests are
carried out to ensure that the current value of the estimated revenues associated with each right is greater
than the amount that is capitalized.
Also, during the quarter ended 31 March 2014, “Net Losses / (gains) of affiliated companies” started to be
presented in “Income before financial results and taxes” (“Operational Results”), reflecting the operational
nature of investments accounted for using the equity method.
As provided under IAS 8 - Accounting Policies, Changes in Accounting Estimates and Errors , these policy
changes were applied retrospectively. Therefore changes were made to the consolidated statement of
financial position of 1 January 2013 and 31 March 2013, to the consolidated statements of comprehensive
income for the quarter ended 31 March 2013 and to the consolidated statement of cash flows for the quarter
ended 31 March 2013.
The effects of early adoption of new standards and amendments, and changes in accounting policies in the
consolidated statements of comprehensive income are presented in the tables below.
42
CONSOLIDATED MANAGEMENT REPORT 1Q14
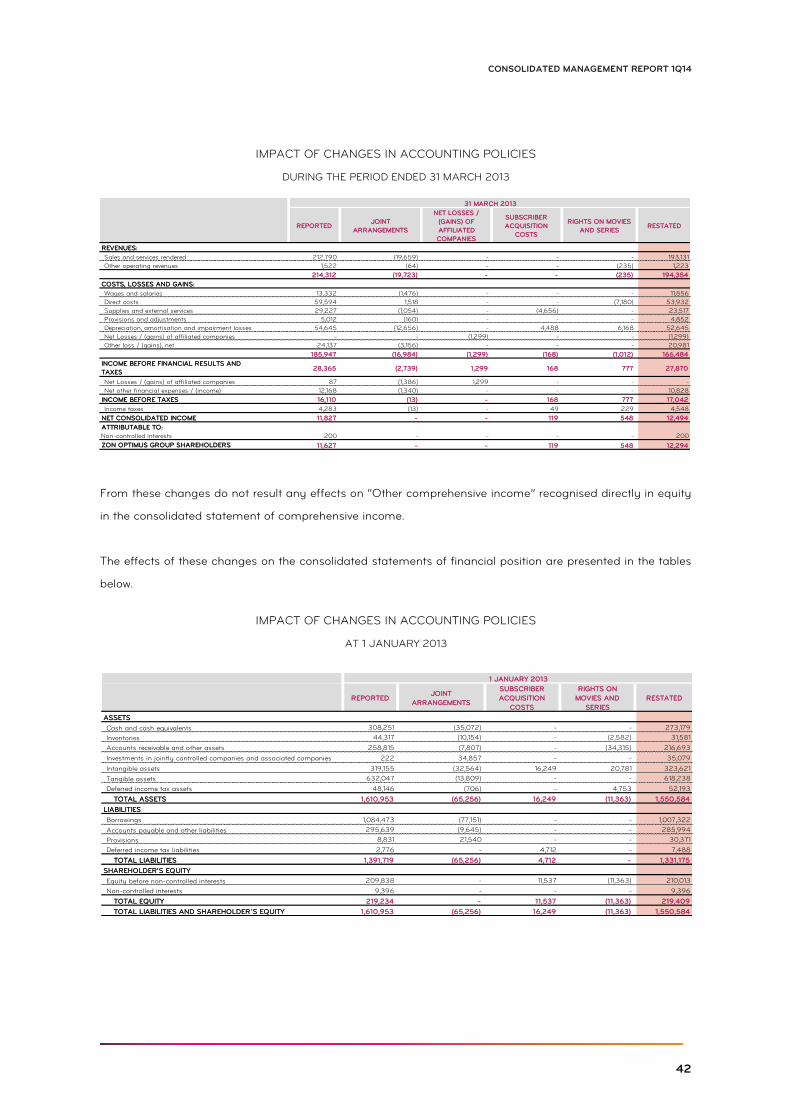
IMPACT OF CHANGES IN ACCOUNTING POLICIES
DURING THE PERIOD ENDED 31 MARCH 2013
From these changes do not result any effects on “Other comprehensive income” recognised directly in equity
in the consolidated statement of comprehensive income.
The effects of these changes on the consolidated statements of financial position are presented in the tables
below.
IMPACT OF CHANGES IN ACCOUNTING POLICIES
AT 1 JANUARY 2013
REPORTEDJOINT
ARRANGEMENTS
NET LOSSES /
(GAINS) OF
AFFILIATED
COMPANIES
SUBSCRIBER
ACQUISITION
COSTS
RIGHTS ON MOVIES
AND SERIESRESTATED
REVENUES:
Sales and services rendered 212,790 (19,659) - - - 193,131
Other operating revenues 1,522 (64) - - (235) 1,223
214,312 (19,723) - - (235) 194,354
COSTS, LOSSES AND GAINS:
Wages and salaries 13,332 (1,476) - - - 11,856
Direct costs 59,594 1,518 - - (7,180) 53,932
Supplies and external services 29,227 (1,054) - (4,656) - 23,517
Provisions and adjustments 5,012 (160) - - - 4,852
Depreciation, amortisation and impairment losses 54,645 (12,656) - 4,488 6,168 52,645
Net Losses / (gains) of affiliated companies - - (1,299) - - (1,299)
Other loss / (gains), net 24,137 (3,156) - - - 20,981
185,947 (16,984) (1,299) (168) (1,012) 166,484
28,365 (2,739) 1,299 168 777 27,870
Net Losses / (gains) of affiliated companies 87 (1,386) 1,299 - - -
Net other financial expenses / (income) 12,168 (1,340) - - - 10,828
INCOME BEFORE TAXES 16,110 (13) - 168 777 17,042
Income taxes 4,283 (13) - 49 229 4,548
NET CONSOLIDATED INCOME 11,827 - - 119 548 12,494
ATTRIBUTABLE TO:
Non-controlled interests 200 - - - - 200
11,627 - - 119 548 12,294
INCOME BEFORE FINANCIAL RESULTS AND
TAXES
ZON OPTIMUS GROUP SHAREHOLDERS
31 MARCH 2013
REPORTEDJOINT
ARRANGEMENTS
SUBSCRIBER
ACQUISITION
COSTS
RIGHTS ON
MOVIES AND
SERIES
RESTATED
ASSETS
Cash and cash equivalents 308,251 (35,072) - - 273,179
Inventories 44,317 (10,154) - (2,582) 31,581
Accounts receivable and other assets 258,815 (7,807) - (34,315) 216,693
Investments in jointly controlled companies and associated companies 222 34,857 - - 35,079
Intangible assets 319,155 (32,564) 16,249 20,781 323,621
Tangible assets 632,047 (13,809) - - 618,238
Deferred income tax assets 48,146 (706) - 4,753 52,193
TOTAL ASSETS 1,610,953 (65,256) 16,249 (11,363) 1,550,584
LIABILITIES
Borrowings 1,084,473 (77,151) - - 1,007,322
Accounts payable and other liabilities 295,639 (9,645) - - 285,994
Provisions 8,831 21,540 - - 30,371
Deferred income tax liabilities 2,776 - 4,712 - 7,488
TOTAL LIABILITIES 1,391,719 (65,256) 4,712 - 1,331,175
SHAREHOLDER'S EQUITY
Equity before non-controlled interests 209,838 - 11,537 (11,363) 210,013
Non-controlled interests 9,396 - - - 9,396
TOTAL EQUITY 219,234 - 11,537 (11,363) 219,409
TOTAL LIABILITIES AND SHAREHOLDER´S EQUITY 1,610,953 (65,256) 16,249 (11,363) 1,550,584
1 JANUARY 2013
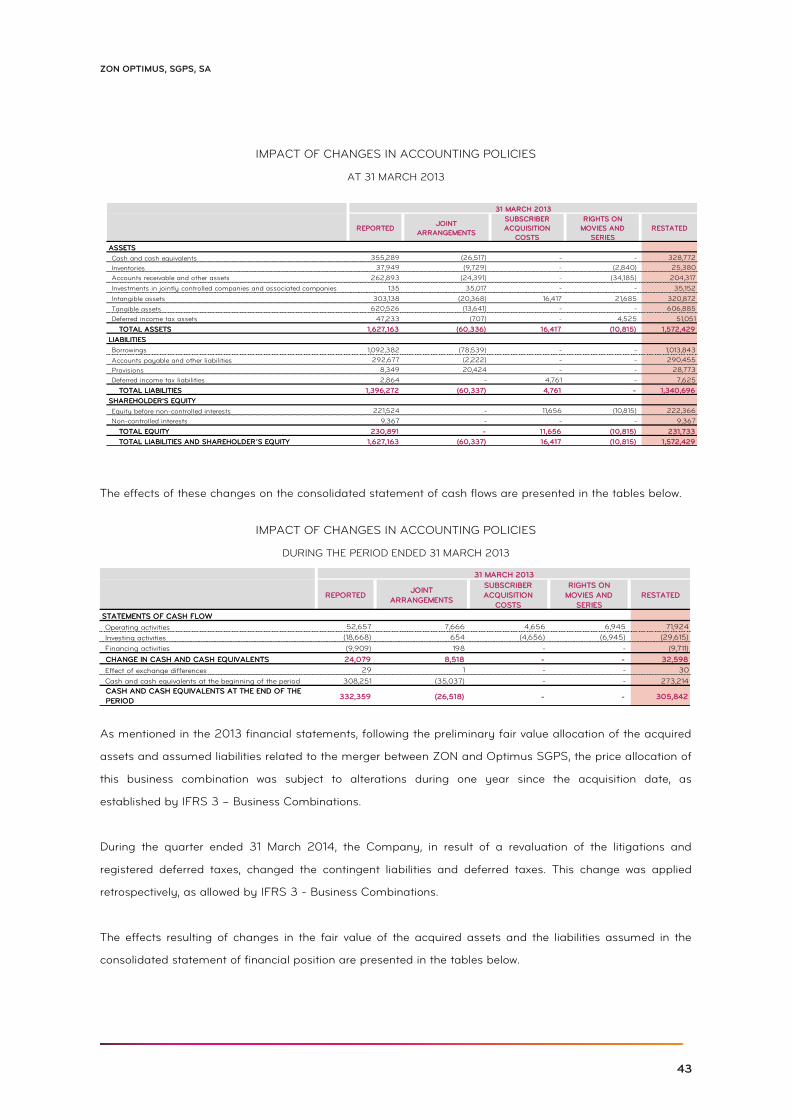
43
ZON OPTIMUS, SGPS, SA
IMPACT OF CHANGES IN ACCOUNTING POLICIES
AT 31 MARCH 2013
The effects of these changes on the consolidated statement of cash flows are presented in the tables below.
IMPACT OF CHANGES IN ACCOUNTING POLICIES
DURING THE PERIOD ENDED 31 MARCH 2013
As mentioned in the 2013 financial statements, following the preliminary fair value allocation of the acquired
assets and assumed liabilities related to the merger between ZON and Optimus SGPS, the price allocation of
this business combination was subject to alterations during one year since the acquisition date, as
established by IFRS 3 – Business Combinations.
During the quarter ended 31 March 2014, the Company, in result of a revaluation of the litigations and
registered deferred taxes, changed the contingent liabilities and deferred taxes. This change was applied
retrospectively, as allowed by IFRS 3 - Business Combinations.
The effects resulting of changes in the fair value of the acquired assets and the liabilities assumed in the
consolidated statement of financial position are presented in the tables below.
REPORTEDJOINT
ARRANGEMENTS
SUBSCRIBER
ACQUISITION
COSTS
RIGHTS ON
MOVIES AND
SERIES
RESTATED
ASSETS
Cash and cash equivalents 355,289 (26,517) - - 328,772
Inventories 37,949 (9,729) - (2,840) 25,380
Accounts receivable and other assets 262,893 (24,391) - (34,185) 204,317
Investments in jointly controlled companies and associated companies 135 35,017 - - 35,152
Intangible assets 303,138 (20,368) 16,417 21,685 320,872
Tangible assets 620,526 (13,641) - - 606,885
Deferred income tax assets 47,233 (707) - 4,525 51,051
TOTAL ASSETS 1,627,163 (60,336) 16,417 (10,815) 1,572,429
LIABILITIES
Borrowings 1,092,382 (78,539) - - 1,013,843
Accounts payable and other liabilities 292,677 (2,222) - - 290,455
Provisions 8,349 20,424 - - 28,773
Deferred income tax liabilities 2,864 - 4,761 - 7,625
TOTAL LIABILITIES 1,396,272 (60,337) 4,761 - 1,340,696
SHAREHOLDER'S EQUITY
Equity before non-controlled interests 221,524 - 11,656 (10,815) 222,366
Non-controlled interests 9,367 - - - 9,367
TOTAL EQUITY 230,891 - 11,656 (10,815) 231,733
TOTAL LIABILITIES AND SHAREHOLDER´S EQUITY 1,627,163 (60,337) 16,417 (10,815) 1,572,429
31 MARCH 2013
REPORTEDJOINT
ARRANGEMENTS
SUBSCRIBER
ACQUISITION
COSTS
RIGHTS ON
MOVIES AND
SERIES
RESTATED
STATEMENTS OF CASH FLOW
Operating activities 52,657 7,666 4,656 6,945 71,924
Investing activities (18,668) 654 (4,656) (6,945) (29,615)
Financing activities (9,909) 198 - - (9,711)
CHANGE IN CASH AND CASH EQUIVALENTS 24,079 8,518 - - 32,598
Effect of exchange differences 29 1 - - 30
Cash and cash equivalents at the beginning of the period 308,251 (35,037) - - 273,214
CASH AND CASH EQUIVALENTS AT THE END OF THE
PERIOD332,359 (26,518) - - 305,842
31 MARCH 2013
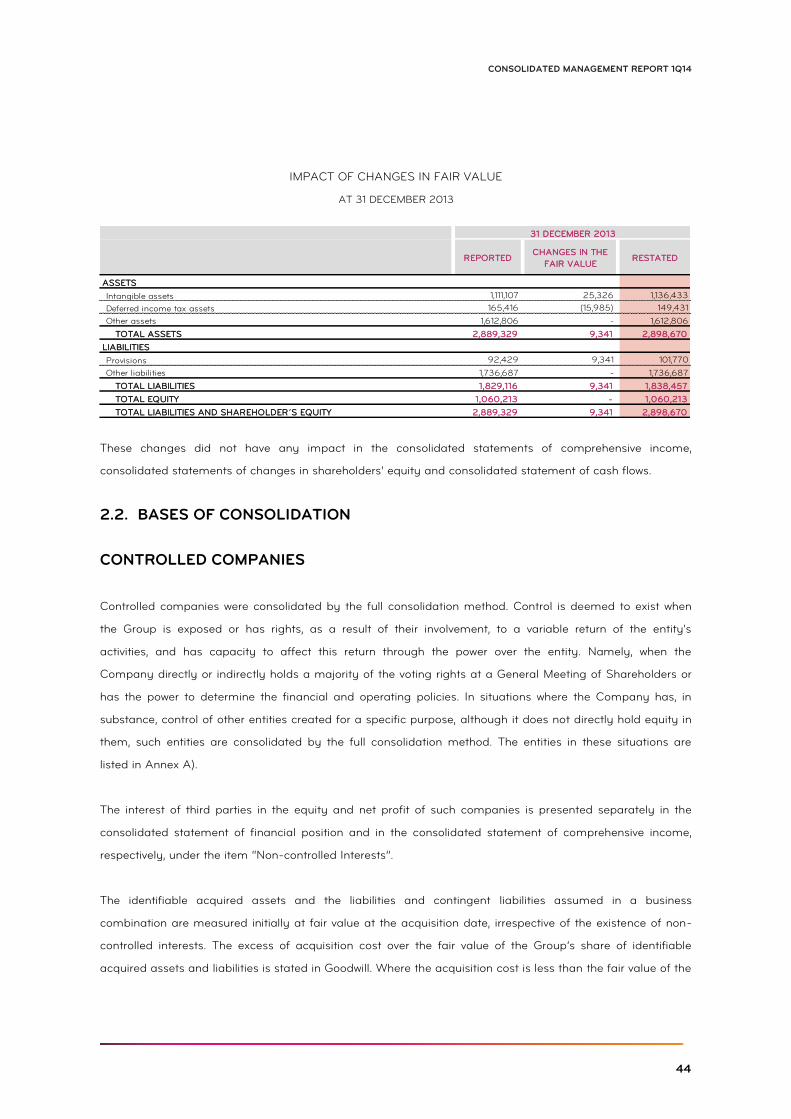
44
CONSOLIDATED MANAGEMENT REPORT 1Q14
IMPACT OF CHANGES IN FAIR VALUE
AT 31 DECEMBER 2013
These changes did not have any impact in the consolidated statements of comprehensive income,
consolidated statements of changes in shareholders’ equity and consolidated statement of cash flows.
2.2. BASES OF CONSOLIDATION
CONTROLLED COMPANIES
Controlled companies were consolidated by the full consolidation method. Control is deemed to exist when
the Group is exposed or has rights, as a result of their involvement, to a variable return of the entity's
activities, and has capacity to affect this return through the power over the entity. Namely, when the
Company directly or indirectly holds a majority of the voting rights at a General Meeting of Shareholders or
has the power to determine the financial and operating policies. In situations where the Company has, in
substance, control of other entities created for a specific purpose, although it does not directly hold equity in
them, such entities are consolidated by the full consolidation method. The entities in these situations are
listed in Annex A).
The interest of third parties in the equity and net profit of such companies is presented separately in the
consolidated statement of financial position and in the consolidated statement of comprehensive income,
respectively, under the item “Non-controlled Interests”.
The identifiable acquired assets and the liabilities and contingent liabilities assumed in a business
combination are measured initially at fair value at the acquisition date, irrespective of the existence of non-
controlled interests. The excess of acquisition cost over the fair value of the Group’s share of identifiable
acquired assets and liabilities is stated in Goodwill. Where the acquisition cost is less than the fair value of the
REPORTEDCHANGES IN THE
FAIR VALUERESTATED
ASSETS
Intangible assets 1,111,107 25,326 1,136,433
Deferred income tax assets 165,416 (15,985) 149,431
Other assets 1,612,806 - 1,612,806
TOTAL ASSETS 2,889,329 9,341 2,898,670
LIABILITIES
Provisions 92,429 9,341 101,770
Other liabilities 1,736,687 - 1,736,687
TOTAL LIABILITIES 1,829,116 9,341 1,838,457
TOTAL EQUITY 1,060,213 - 1,060,213
TOTAL LIABILITIES AND SHAREHOLDER´S EQUITY 2,889,329 9,341 2,898,670
31 DECEMBER 2013
45
ZON OPTIMUS, SGPS, SA
identified net assets, the difference is recorded as a gain in the statement of comprehensive income in the
period in which the acquisition occurs.
The interests of minority shareholders are initially recognised as their proportion of the fair value of the
identifiable assets and liabilities.
On the acquisition of additional equity shares in companies already controlled by the Group, the difference
between the share of capital acquired and the corresponding acquisition value is recognised directly in equity.
Where an increase in position in the capital of an associated company results in the acquisition of control,
with the latter being included in the consolidated financial statements by the full consolidation method, the
share of the fair values assigned to the assets and liabilities, corresponding to the percentages previously
held, is stated in the income statement.
The directly attributable transaction costs are recognised immediately in profit or loss.
The results of companies acquired or sold during the year are included in the income statements as from the
date of acquisition or until the date of their disposal, respectively.
Intercompany transactions, balances, unrealised gains on transactions and dividends distributed between
Group companies are eliminated. Unrealised losses are also eliminated unless the transaction shows evidence
of impairment of the transferred asset.
Where necessary, adjustments are made to the financial statements of controlled companies in order to align
their accounting policies with those of the Group.
JOINTLY CONTROLLED COMPANIES
The classification of investments as jointly controlled companies is determined based on the existence of
shareholder agreements which show and regulate the joint control. Financial investments of jointly controlled
companies (Annex C)) are stated by the equity method. Under this method, financial investments are
adjusted periodically by an amount corresponding to the share in the net profits of jointly controlled
companies, as a contra entry in “Net Losses / (gains) of affiliated companies” in the statement of
comprehensive income. Direct changes in the post-acquisition equity of associated companies are
recognised as the value of the shareholding as a contra entry in reserves, in equity.
Additionally, financial investments may also be adjusted for recognition of impairment losses.
46
CONSOLIDATED MANAGEMENT REPORT 1Q14
Any excess of acquisition cost over the fair value of identifiable net assets and liabilities (goodwill) is recorded
as part of the financial investment of jointly controlled companies and subject to impairment testing when
there are indicators of loss of value. Where the acquisition cost is less than the fair value of the identified net
assets, the difference is recorded as a gain in the statement of comprehensive income in the period in which
the acquisition occurs.
Losses in jointly controlled companies which exceed the investment made in them are not recognised, except
where the Group has entered into undertakings with that company.
Dividends received from these companies are recorded as a reduction in the value of the financial
investments.
ASSOCIATED COMPANIES
An associated company is a company in which the Group exercises significant influence through participation
in decisions about its financial and operating policies, but in which does not have control or joint control.
Any excess of the acquisition cost of a financial investment over the fair value of the identifiable net assets is
recorded as goodwill and is added to the value of the financial investment and its recovery is reviewed
annually or whenever there are indications of possible loss of value. Where the acquisition cost is less than the
fair value of the identified net assets, the difference is recorded as a gain in the statement of comprehensive
income in the period in which the acquisition occurs.
Financial investments in the majority of associated companies (Annex B)) are stated by the equity method.
Under this method, financial investments are adjusted periodically by an amount corresponding to the share
in the net profits of associated companies, as a contra entry in “Net Losses / (gains) of affiliated companies”
in the statement of comprehensive income. Direct changes in the post-acquisition equity of associated
companies are recognised as the value of the shareholding as a contra entry in reserves, in equity.
Additionally, financial investments may also be adjusted for recognition of impairment losses.
Losses in associated companies which exceed the investment made in them are not recognised, except where
the Group has entered into undertakings with that associated company.
Dividends received from these companies are recorded as a reduction in the value of the financial
investments.
47
ZON OPTIMUS, SGPS, SA
CONVERSION TO EUROS OF FINANCIAL STATEMENTS EXPRESSED IN
FOREIGN CURRENCIES
See accounting policy 2.20.
BALANCES AND TRANSACTIONS BETWEEN GROUP COMPANIES
Balances and transactions and unrealised gains between Group companies, and between them and the
parent company, are eliminated in the consolidation. The part of unrealised gains arising from transactions
with associated companies or jointly controlled companies attributable to the Group are eliminated in the
consolidation. Unrealised losses are similarly eliminated except where they show evidence of impairment of
the transferred asset.
2.3. SEGMENT REPORTING
As stipulated in IFRS 8, the Group presents operating segments based on internally produced management
information.
Operating segments are reported consistently with the internal management information model provided to
the chief operating decision maker of the Group, who is responsible for allocating resources to the segment
and for assessing its performance, and for taking strategic decisions.
2.4. CLASSIFICATION OF THE STATEMENT OF FINANCIAL POSITION
Realisable assets and liabilities due in less than one year from the date of the statement of financial position
are classified as current in assets and liabilities, respectively.
In accordance with IAS 1, "Restructuring costs", "Losses / (gains) on disposal of assets " and "Other losses /
(gains) " reflect unusual expenses that should be disclosed separately from the usual lines items, to avoid
distortion of the financial information from regular operations.
2.5. TANGIBLE ASSETS
Tangible assets are stated at acquisition cost, less accumulated depreciation and eventual impairment losses
and subsidies, where applicable. Acquisition cost includes, in addition to the purchase price of the asset: (i)
costs directly attributable to the purchase; and (ii) the estimated costs of decommissioning and removal of
the assets and restoration of the site, which in Group applies to the cinema operation business ,
telecommunication towers and offices (Notes 2.14 and 28).
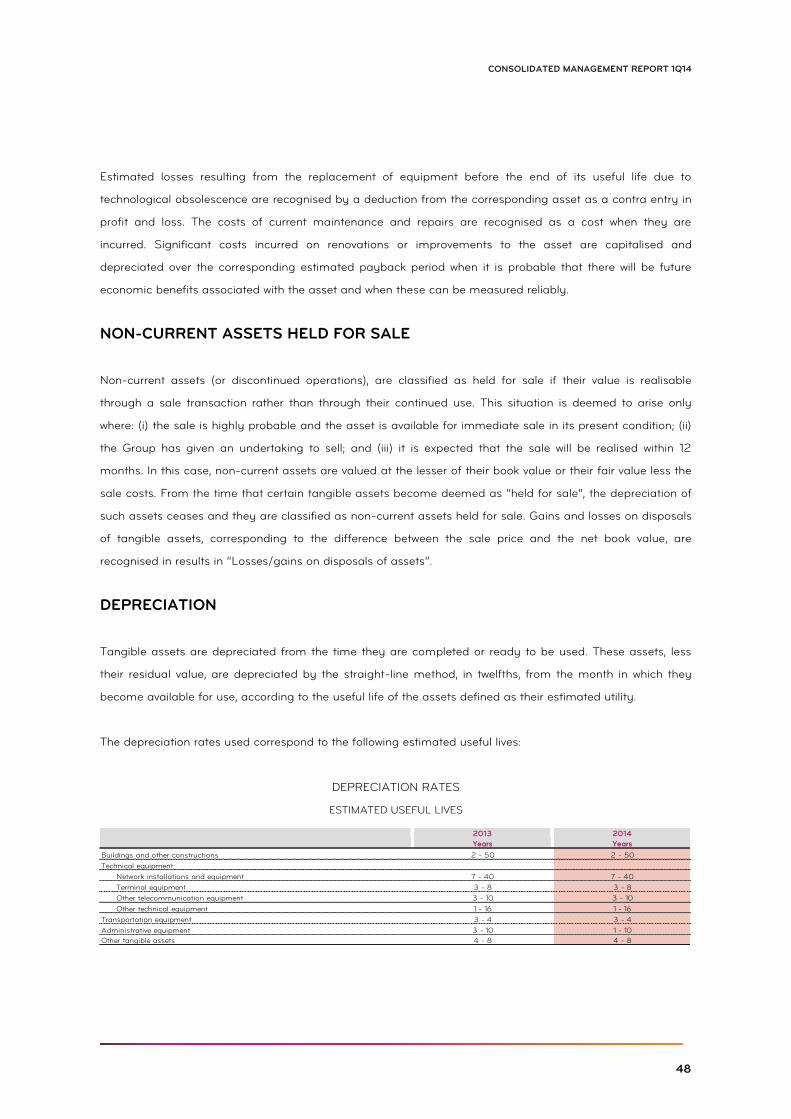
48
CONSOLIDATED MANAGEMENT REPORT 1Q14
Estimated losses resulting from the replacement of equipment before the end of its useful life due to
technological obsolescence are recognised by a deduction from the corresponding asset as a contra entry in
profit and loss. The costs of current maintenance and repairs are recognised as a cost when they are
incurred. Significant costs incurred on renovations or improvements to the asset are capitalised and
depreciated over the corresponding estimated payback period when it is probable that there will be future
economic benefits associated with the asset and when these can be measured reliably.
NON-CURRENT ASSETS HELD FOR SALE
Non-current assets (or discontinued operations), are classified as held for sale if their value is realisable
through a sale transaction rather than through their continued use. This situation is deemed to arise only
where: (i) the sale is highly probable and the asset is available for immediate sale in its present condition; (ii)
the Group has given an undertaking to sell; and (iii) it is expected that the sale will be realised within 12
months. In this case, non-current assets are valued at the lesser of their book value or their fair value less the
sale costs. From the time that certain tangible assets become deemed as “held for sale”, the depreciation of
such assets ceases and they are classified as non-current assets held for sale. Gains and losses on disposals
of tangible assets, corresponding to the difference between the sale price and the net book value, are
recognised in results in “Losses/gains on disposals of assets”.
DEPRECIATION
Tangible assets are depreciated from the time they are completed or ready to be used. These assets, less
their residual value, are depreciated by the straight-line method, in twelfths, from the month in which they
become available for use, according to the useful life of the assets defined as their estimated utility.
The depreciation rates used correspond to the following estimated useful lives:
DEPRECIATION RATES
ESTIMATED USEFUL LIVES
2013 2014
Years Years
Buildings and other constructions 2 - 50 2 - 50
Technical equipment:
Network installations and equipment 7 - 40 7 - 40
Terminal equipment 3 - 8 3 - 8
Other telecommunication equipment 3 - 10 3 - 10
Other technical equipment 1 - 16 1 - 16
Transportation equipment 3 - 4 3 - 4
Administrative equipment 3 - 10 1 - 10
Other tangible assets 4 - 8 4 - 8
49
ZON OPTIMUS, SGPS, SA
2.6. INTANGIBLE ASSETS
Intangible assets are stated at acquisition cost, less accumulated amortisation and impairment losses, where
applicable. Intangible assets are recognised only where they generate future economic benefits for the Group
and where they can be measured reliably.
Intangible assets consist mainly of goodwill, satellite and distribution network capacity utilisation rights,
customer portfolios, costs incurred in raising customers loyalty contracts, telecom and software licenses,
content utilisation rights and other contractual rights.
GOODWILL
Goodwill represents the excess of acquisition cost over the net fair value of the assets, liabilities and
contingent liabilities of a subsidiary, jointly controlled company or associated company at the acquisition
date, in accordance with IFRS 3.
Goodwill is recorded as an asset and included in “Intangible Assets” (Note 24) in the case of a controlled
company, and in “Investments in jointly controlled companies and associated companies” (Note 22) in the
case of jointly controlled company or an associated company. Goodwill is not amortised and is subject to
impairment tests at least once a year, on a specified date, and whenever there are changes in the test’s
underlying assumptions at the date of the statement of financial position which may result in a possible loss
of value. Any impairment loss is recorded immediately in the statement of comprehensive income for the
year in “Impairment losses” and is not liable to subsequent reversal.
For the purposes of impairment tests, goodwill is attributed to the cash-generating units to which it is related
(Note 24), which may correspond to the business segments in which the Group operates, or a lower level.
INTERNALLY GENERATED INTANGIBLE ASSETS
Internally generated intangible assets, including expenditure on research, are expensed when they are
incurred. Research and development costs are only recognised as assets where the technical capability to
complete the intangible asset is demonstrated and where it is available for use or sale.
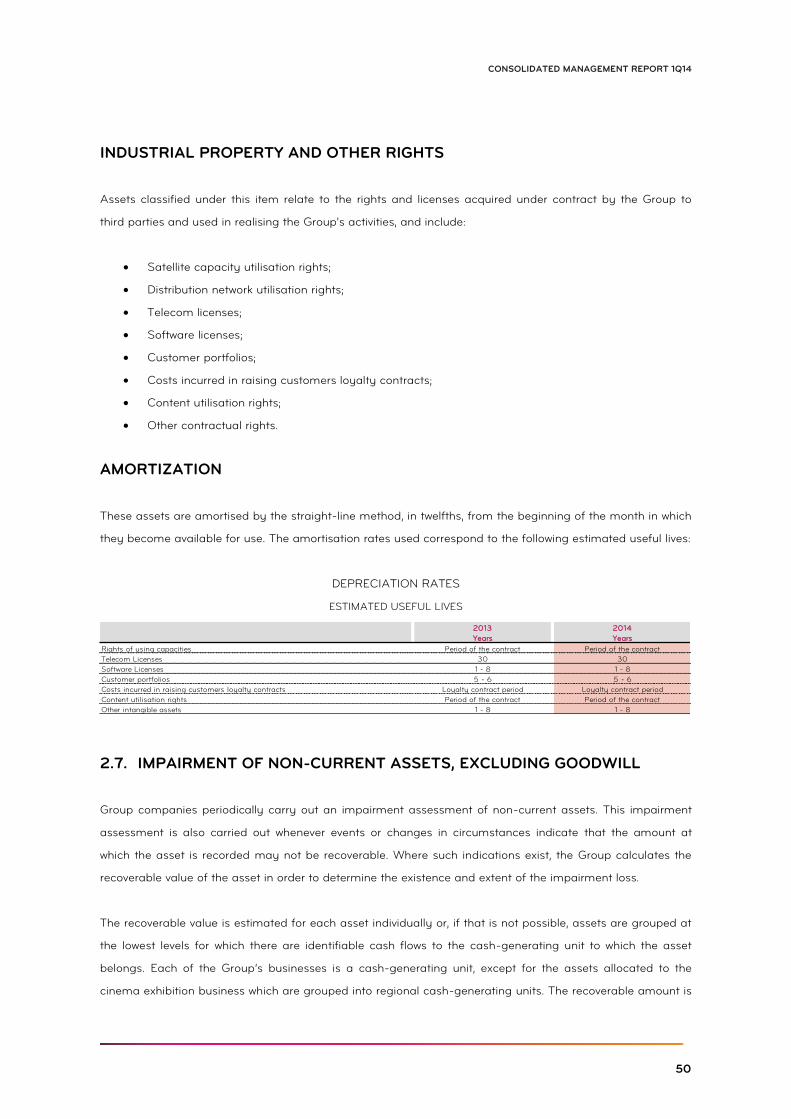
50
CONSOLIDATED MANAGEMENT REPORT 1Q14
INDUSTRIAL PROPERTY AND OTHER RIGHTS
Assets classified under this item relate to the rights and licenses acquired under contract by the Group to
third parties and used in realising the Group's activities, and include:
Satellite capacity utilisation rights;
Distribution network utilisation rights;
Telecom licenses;
Software licenses;
Customer portfolios;
Costs incurred in raising customers loyalty contracts;
Content utilisation rights;
Other contractual rights.
AMORTIZATION
These assets are amortised by the straight-line method, in twelfths, from the beginning of the month in which
they become available for use. The amortisation rates used correspond to the following estimated useful lives:
DEPRECIATION RATES
ESTIMATED USEFUL LIVES
2.7. IMPAIRMENT OF NON-CURRENT ASSETS, EXCLUDING GOODWILL
Group companies periodically carry out an impairment assessment of non-current assets. This impairment
assessment is also carried out whenever events or changes in circumstances indicate that the amount at
which the asset is recorded may not be recoverable. Where such indications exist, the Group calculates the
recoverable value of the asset in order to determine the existence and extent of the impairment loss.
The recoverable value is estimated for each asset individually or, if that is not possible, assets are grouped at
the lowest levels for which there are identifiable cash flows to the cash-generating unit to which the asset
belongs. Each of the Group’s businesses is a cash-generating unit, except for the assets allocated to the
cinema exhibition business which are grouped into regional cash-generating units. The recoverable amount is
2013 2014
Years Years
Rights of using capacities Period of the contract Period of the contract
Telecom Licenses 30 30
Software Licenses 1 - 8 1 - 8
Customer portfolios 5 - 6 5 - 6
Costs incurred in raising customers loyalty contracts Loyalty contract period Loyalty contract period
Content utilisation rights Period of the contract Period of the contract
Other intangible assets 1 - 8 1 - 8
51
ZON OPTIMUS, SGPS, SA
calculated as the higher of the net sale price and the current use value. The net sale price is the amount that
would be obtained from the sale of the asset in a transaction between independent and knowledgeable
entities, less the costs directly attributable to the sale. The current use value is the current value of the
estimated future cash flows resulting from continued use of the asset or of the cash-generating unit. Where
the amount at which the asset is recorded exceeds its recoverable value, it is recognised as an impairment
loss.
The reversal of impairment losses recognised in previous years is recorded when there are indications that
these losses no longer exist or have decreased. The reversal of impairment losses is recognised in the
statement of comprehensive income in the year in which it occurs. However, an impairment loss can only be
reversed up to the amount that would be recognised (net of amortisation or depreciation) if no impairment
loss had been recorded in previous years.
2.8. FINANCIAL ASSETS
Financial assets are recognised in the statement of financial position of the Group on the trade or contract
date, which is the date on which the Group undertakes to purchase or sell the asset. Initially, financial assets
are recognised at their fair value plus directly attributable transaction costs, except for assets at fair value
through profit or loss where transaction costs are recognised immediately in profit or loss. These assets are
derecognised when: (i) the Group’s contractual rights to receive their cash flows expire; (ii) the Group has
substantially transferred all the risks and benefits associated with their ownership; or (iii) although it retains
part but not substantially all of the risks and benefits associated with their ownership, the Group has
transferred control of the assets.
Financial assets and liabilities are offset and shown as a net value when, and only when, the Group has the
right to offset the recognised amounts and intends to settle for the net value.
The Group classifies its financial assets into the following categories: financial investments at fair value
through profit or loss, financial assets available for sale, investments held to maturity and borrowings and
receivables. The classification depends on management’s intention at the time of their acquisition.
FINANCIAL ASSETS AT FAIR VALUE THROUGH PROFIT AND LOSS
This category includes non-derivative financial assets acquired with the intention of selling them in the short
term. This category also includes derivatives that do not qualify for hedge accounting purposes. Gains and
losses resulting from changes in the fair value of assets measured at fair value through profit or loss are
recognised in results in the year in which they occur under “Losses/gains on financial assets”, including the
income from interest and dividends.
52
CONSOLIDATED MANAGEMENT REPORT 1Q14
FINANCIAL ASSETS AVAILABLE FOR SALE
Financial assets available for sale are non-derivative financial assets which: (i) are designated as available for
sale at the time of their initial recognition; or (ii) do not fit into the other categories of financial assets above.
They are recognised as non-current assets except where there is an intention to sell them within 12 months
following the date of the statement of financial position.
Shareholdings other than shares in Group companies, jointly controlled companies or associated companies
are classified as financial investments available for sale and are recognised in the statement of financial
position as non-current assets.
Investments are initially recognised at their acquisition cost. After initial recognition, investments available for
sale are revalued at their fair value by reference to their market value at the date of the statement of financial
position, without any deduction for transaction costs that may occur until their sale. In situations where
investments are equity instruments not listed on regulated markets and for which it is not possible to reliably
estimate their fair value, they are maintained at acquisition cost less any impairment losses.
The potential resulting capital gains and losses are recognised directly in reserves until the financial
investment is sold, received or otherwise disposed of, at which time the accumulated gain or loss previously
recognised in equity is included in the statement of comprehensive income for the year. Dividends on equity
instruments classified as available for sale are recognised in results for the year under “Losses/(gains) on
financial assets”, where the right to receive the payment is established.
INVESTMENTS HELD TO MATURITY
Investments held to maturity are classified as non-current investments except where they mature in less than
12 months from the date of the statement of financial position. This item includes investments with defined
maturities which the Group has the intention and ability to keep until that date. Investments held to maturity
are valued at amortised cost, less any impairment losses.
BORROWING AND RECEIVABLES
The assets classified in this category are non-derivative financial assets with fixed or determinable payments
not listed on an active market.
Accounts receivable are initially recognised at fair value and subsequently valued at amortised cost, less
adjustments for impairment, where applicable. Impairment losses on customers and accounts receivable are
53
ZON OPTIMUS, SGPS, SA
recorded where there is objective evidence that they are not recoverable under the initial terms of the
transaction. The identified impairment losses are recorded in the statement of comprehensive income under
“Provisions and adjustments”, and subsequently reversed by results, when the impairment indicators reduce
or cease to exist.
CASH AND CASH EQUIVALENT
The amounts included in “Cash and cash equivalents” correspond to the amounts of cash, bank deposits,
term deposits and other investments with maturities of less than three months which may be immediately
realisable and with a negligible risk of change of value.
For the purposes of the statement of cash flows, “Cash and cash equivalents” also includes bank overdrafts
included in the statement of financial position under “Borrowings” (where applicable).
2.9. FINANCIAL LIABILITIES AND EQUITY INSTRUMENTS
Financial liabilities and equity instruments are classified according to their contractual substance irrespective
of their legal form. Equity instruments are contracts that show a residual interest in the Group’s assets after
deducting the liabilities. The equity instruments issued by Group companies are recorded at the amount
received, net of the costs incurred in their issue.
BORROWINGS
Loans are stated as liabilities at their nominal value, net of the issuance costs of the loans. Financial charges,
calculated in accordance with the effective rate of interest, including premiums payable, are recognised in
accordance with the accruals principle.
ACCOUNTS PAYABLE
Accounts payable are recognised initially at their fair value and subsequently at amortised cost in
accordance with the effective interest rate method. Accounts payable are recognised as current liabilities
unless they are expected to be settled within 12 months from the date of the statement of financial position.
DERIVATIVE FINANCIAL INSTRUMENTS
See accounting policy 2.11.

54
CONSOLIDATED MANAGEMENT REPORT 1Q14
2.10. IMPAIRMENT OF FINANCIAL ASSETS
At the date of each statement of financial position, the Group examines whether there is objective evidence
that a financial asset or group of financial assets is impaired.
FINANCIAL ASSETS AVAILABLE FOR SALE
In the case of financial assets classified as available for sale, a significant or prolonged decline in the fair
value of the instrument below its cost is considered as an indicator that the instrument is impaired. If any
similar evidence exists for financial assets classified as available for sale, the accumulated loss – measured
as the difference between the acquisition cost and the current fair value, less any impairment of the financial
asset that has already been recognised in results – is removed from equity and recognised in the income
statement.
Impairment losses on equity instruments recognised in results are not reversed through the income
statement.
CUSTOMERS, OTHER DEBTORS AND OTHER FINANCIAL ASSETS
Adjustments are made for impairment losses when there are objective indications that the Group will not
receive all the amounts to which it is entitled under the original terms of the contracts. Various indicators are
used to identify impairment situations, such as:
a) default analysis;
b) default for more than 6 months;
c) financial difficulties of the debtor;
d) probability of insolvency of the debtor.
The adjustment for impairment losses is calculated as the difference between the recoverable value of the
financial asset and its value in the statement of financial position and is stated in profit and loss for the year.
The value of these assets in the statement of financial position is reduced to the recoverable amount by
means of an adjustments account. When an amount receivable from customers and other debtors is
considered irrecoverable, it is written off using the adjustments account for impairment losses. The
subsequent recovery of amounts that have been written off is recognised in profit and loss.
When there are receivables from customers or other debtors that are overdue, and these are subject to
renegotiation of their terms, these are no longer regarded as overdue and become treated as new loans.
55
ZON OPTIMUS, SGPS, SA
2.11. DERIVATIVE FINANCIAL INSTRUMENTS
The Group has a policy of contracting derivative financial instruments with the objective of hedging the
financial risks to which it is exposed, resulting from variations in exchange rates and interest rates. The Group
does not contract derivative financial instruments for speculative purposes, and the use of this type of
financial instruments complies with the internal policies determined by the Board.
In relation to financial derivative instruments which, although contracted in order to provide hedging in line
with the Group’s risk management policies, do not meet all the requirements of IAS 39 – Financial
Instruments: recognition and measurement in terms of their classification as hedge accounting or which have
not been specifically assigned to a hedge relationship, the related changes in fair value are stated in the
income statement for the period in which they occur.
Derivative financial instruments are recognised on the respective trade date at their fair value. Subsequently,
the fair value of the derivative financial instruments is revalued on a regular basis, and the gains or losses
resulting from this revaluation are recorded directly in profit and loss for the period, except in the case of
hedge derivatives. Recognition of the changes in fair value of hedge derivatives depends on the nature of the
risk hedged and the type of hedge used.
HEDGE ACCOUNTING
The possibility of designating a derivative financial instrument as a hedging instrument meets the
requirements of IAS 39 - Financial instruments: recognition and measurement.
Derivative financial instruments used for hedging purposes can be classified as hedges for accounting
purposes where they cumulatively meet the following conditions:
a) At the start date of the transaction, the hedge relationship is identified and formally documented,
including the identification of the hedged item, the hedging instrument and the evaluation of
effectiveness of the hedge;
b) There is the expectation that the hedge relationship is highly effective at the start date of the
transaction and throughout the life of the operation;
c) The effectiveness of the hedge can be reliably measured at the start date of the transaction and
throughout the life of the operation;
d) For cash flow hedge operations, it must be highly probable that they will occur.
56
CONSOLIDATED MANAGEMENT REPORT 1Q14
EXCHANGE RATE AND INTEREST RATE RISK
Where expectations of changes in exchange rates and interest rates so warrant, the Group aims to anticipate
any adverse impact through the use of derivatives. Operations that qualify as cashflow hedging instruments
are stated in the statement of financial position at their fair value and, where they are considered to be
effective hedges, the changes in the fair value of the instruments are initially stated as a contra entry in
equity and subsequently reclassified as financial costs.
Where hedge transactions are ineffective, they are stated directly in profit and loss. Accordingly, in net terms
the cash flows associated with the hedged operations are accrued at the rate applying to the contracted
hedge operation.
When a hedge instrument expires or is sold, or when the hedge ceases to fulfil the criteria required for hedge
accounting, the accumulated variations in the fair value of the derivative in reserves are shown in profit and
loss when the operation hedged also affects profit and loss.
2.12. INVENTORIES
Inventories, which mainly include mobile phones, customer terminal equipment, DVDs and rights, are valued
at the lower of their cost or net realisable value.
The acquisition cost includes the invoice price, freight and insurance costs, using the weighted average cost
as the method of costing goods sold.
Inventories are adjusted for technological obsolescence, as well as for the difference between the purchase
cost and the net realisable value, whichever is the lower, and this reduction is recognised directly in the
statement of comprehensive income for the year.
The net realisable value corresponds to the normal sale price less restocking costs and selling costs.
The differences between the cost and the corresponding net realisable value of inventories, where this is less
than the cost, are recorded as operating costs in “Cost of goods sold”.
Inventories in transit, since they are not available for consumption or sale, are separated out from other
inventories and are valued at their specific acquisition cost.
57
ZON OPTIMUS, SGPS, SA
2.13. SUBSIDIES
Subsidies are recognised at their fair value where there is a reasonable assurance that they will be received
and Group companies will meet the requirements for their award.
Operating subsidies, mainly for employee training, are recognised in the statement of comprehensive income
by deduction from the corresponding costs incurred.
Investment subsidies are recognised in the statement of financial position as deferred income.
If the subsidy is considered as deferred income, it is recognized as income on a systematic and rational basis
during the useful life of the asset.
2.14. PROVISIONS AND CONTINGENT LIABILITIES
Provisions are recognised where: (i) there is a present obligation arising from past events and it is likely that in
settling that obligation the expenditure of internal resources will be necessary; and (ii) the amount or value of
such obligation can be reasonably estimated. Where one of the above conditions is not met, the Group
discloses the events as a contingent liability unless the likelihood of an outflow of funds resulting from this
contingency is remote, in which case they are not disclosed.
Provisions for legal procedures taking place against the Group are made in accordance with the risk
assessments carried out by the Group and by their legal advisers, based on success rates.
Provisions for restructuring are only recognised where the Group has a detailed, formal plan identifying the
main features of the restructuring programme and after these facts have been reported to the entities
involved.
Provisions for decommissioning costs, removal of assets and restoration of the site are recognised when the
assets are installed, in line with the best estimates available at that date (Note 28).
The amount of the provisioned liability reflects the effects of the passage of time and the corresponding
financial indexing is recognised in results as a financial cost.
Obligations that result from onerous contracts are registered and measured as provisions. There is an
onerous contract when the Company is an integral part of the provisions of an agreement contract, which
entail costs that cannot be avoided and which exceed the economic benefits derived from the agreement.
58
CONSOLIDATED MANAGEMENT REPORT 1Q14
Provisions for potential future operating losses are not covered.
Contingent liabilities are not recognised in the financial statements, unless the exception provided under IFRS
3 business combination, and are disclosed whenever there is a good chance to shed resources including
economic benefits. Contingent assets are not recognised in the financial statements, being disclosed when
there is a likelihood of a future influx of financial resources.
Provisions are reviewed and brought up to date at the date of the statement of financial position to reflect the
best estimate at that time of the obligation concerned.
2.15. LEASES
Leasing contracts are classified as: (i) finance leases, if substantially all the risks and benefits incident to
ownership of the corresponding assets concerned have been transferred; or (ii) operating leases, if
substantially all risks and rewards incident to ownership of those assets have not been transferred.
The classification of leases as finance or operating leases is made on the basis of substance rather than
contractual form.
The assets acquired under finance leases and the corresponding liabilities are recorded using the financial
method, and the assets, related accumulated depreciation and pending debts are recorded in accordance
with the contractual finance plan. In addition, the interest included in the rentals and the depreciation of the
tangible and intangible fixed assets are recognised in the statement of comprehensive income for the period
to which they relate.
In the case of operating leases, the rentals due are recognised as costs in the statement of comprehensive
income over the period of the leasing contract.
2.16. INCOME TAX
ZON Optimus is covered by the special tax regime for groups of companies, which covers all the companies
in which it directly or indirectly owns at least 75% of the share capital and which simultaneously are resident
in Portugal and subject to Corporate Income Tax (IRC).
The remaining subsidiaries not covered by the special tax regime for groups of companies are taxed
individually on the basis of their respective taxable incomes and the applicable tax rates.
59
ZON OPTIMUS, SGPS, SA
Income tax is stated in accordance with the IAS 12 criteria. In calculating the cost relating to income tax for
the period, in addition to current tax, allowance is also made for the effect of deferred tax calculated in
accordance with the liability method, taking into account the temporary differences resulting from the
difference between the tax basis of assets and liabilities and their values as stated in the consolidated
financial statements, and the tax losses carried forward at the date of the statement of financial position. The
deferred income tax assets and liabilities were calculated on the basis of the tax legislation currently in force
or of legislation already published for future application.
As stipulated in the above standard, deferred income tax assets are recognised only where there is
reasonable assurance that these may be used to reduce future taxable profit, or where there are deferred
income tax liabilities whose reversal is expected to occur in the same period in which the deferred income tax
assets are reversed. At the end of each period an assessment is made of deferred income tax assets, and
these are adjusted in line with the likelihood of their future use.
The amount of tax to be included either in current tax or in deferred tax resulting from transactions or events
recognised in equity accounts is recorded directly under those items and does not affect the results for the
period.
2.17. SHARE-BASED PAYMENTS
The benefits granted to employees under share purchase or share option incentive plans are recorded in
accordance with the requirements of IFRS 2 – Share-based payments.
In accordance with IFRS 2, the benefits granted to be paid on the basis of own shares (equity instruments),
are recognised at fair value at the date of allocation.
Since it is not possible to estimate reliably the fair value of the services received from employees, their value
is measured by reference to the fair value of equity instruments in accordance with their share price at the
grant date.
The fair value determined at the date of allocation of the benefit is recognised as a linear cost over the period
in which it is acquired by the beneficiaries as a result of their services, with the corresponding increase in
equity.
In turn, benefits granted on the basis of shares but paid in cash lead to the recognition of a liability valued at
fair value at the date of the statement of financial position.
60
CONSOLIDATED MANAGEMENT REPORT 1Q14
2.18. REVENUE
The main types of revenue of ZON Optimus’s subsidiaries are as follows:
i) Revenues of Telecommunications Services:
Cable Television, fixed broadband and fixed voice: The revenues from services provided using the
fibre optic cable network result from: (a) basic channel subscription packages that can be sold in a
bundle with fixed broadband/fixed voice services; (b) premium channel subscription packages and S-
VOD; (c) terminal equipment rental; (d) consumption of content (VOD); (e) traffic and voice
termination; (f) service activation; (g) sale of equipment; and (h) other additional services (ex: firewall,
antivirus).
Satellite Television: Revenues from the satellite television service mainly result from: (a) basic and
premium channel subscription packages; (b) equipment rental; (c) consumption of content (VOD); (d)
service activation; and (e) sale of equipment.
Mobile broadband and voice services: Revenues from mobile broadband Internet access services and
mobile voice services result mainly from monthly subscriptions and/or usage of the Internet and
voice service, as well as the traffic associated with the type chosen by the client.
Revenue from telecommunications services is counted from the time at which those services are
provided. Amounts that have not been invoiced for are included based on estimates. The differences
between the estimated amounts and the actual amounts, which are normally small, are recorded in
the next financial year.
Profits made from selling equipment are included when the buyer takes on the risks and advantages
of taking possession of goods and the value of the benefits are reasonably quantified.
Revenue from penalties, due to the inherent uncertainties, only counts from when it is received, and
the amount is disclosed as a contingent asset (Note 33).
ii) Advertising Revenue: Advertising revenues mainly derive from the attraction of advertising for Pay TV
channels to which the Group has publicity rights and in cinemas. These revenues are recognised
from when they are received, taken off any discounts given.
iii) Film Showings and Distribution: Distribution revenue pertains to the distribution of films to film
exhibitors not distributed by the Group, that are included in the film showings, whilst income from
61
ZON OPTIMUS, SGPS, SA
film showings mostly derive from cinema ticket sales and the product sales in the bars; the film
showings revenue includes the revenue from ticket sales and bar sales respectively.
iv) Revenue from Producing and Distributing Channel Content: Revenue from production and
distribution essentially includes the sale of DVDs, the sale of content and the distribution of television
channels subscriptions to third parties and count from the time at which they are sold, shown and
made available for distribution to telecommunications operators, respectively.
2.19. ACCRUALS
Group’s revenues and costs are recognised in accordance with the accruals principle, under which they are
recognised as they are generated or incurred, irrespective of when they are received or paid.
2.20. ASSETS, LIABILITIES AND TRANSACTIONS IN FOREIGN CURRENCIES
Transactions in foreign currencies are converted into the functional currency at the exchange rate on the
transactions dates. On each accounting date, outstanding balances (monetary items) are updated by
applying the exchange rate prevailing on that date. The exchange rate differences in this update are
recognised in the statement of comprehensive income for the year in which they were calculated. Exchange
rate variations generated on monetary items which constitute enlargement of the investment denominated in
the functional currency of the Group or of the subsidiary in question are recognised in equity. Exchange rate
differences on non-monetary items are classified in “Other reserves” in equity.
The financial statements of subsidiaries denominated in foreign currencies are converted at the following
exchange rates:
The exchange rate obtaining on the date of the statement of financial position for the conversion of
assets and liabilities;
The average exchange rate in the period for the conversion of items in the statement of
comprehensive income;
The average exchange rate in the period, for the conversion of cash flows (in cases where the
exchange rate approximates to the real rate, and for the remaining cash flows the rate of exchange
at the date of the operations is used);
The historical exchange rate for the conversion of equity accounts.
Exchange differences arising from the conversion into euros of the financial statements of subsidiaries
denominated in foreign currencies are included in equity under “Other reserves”.
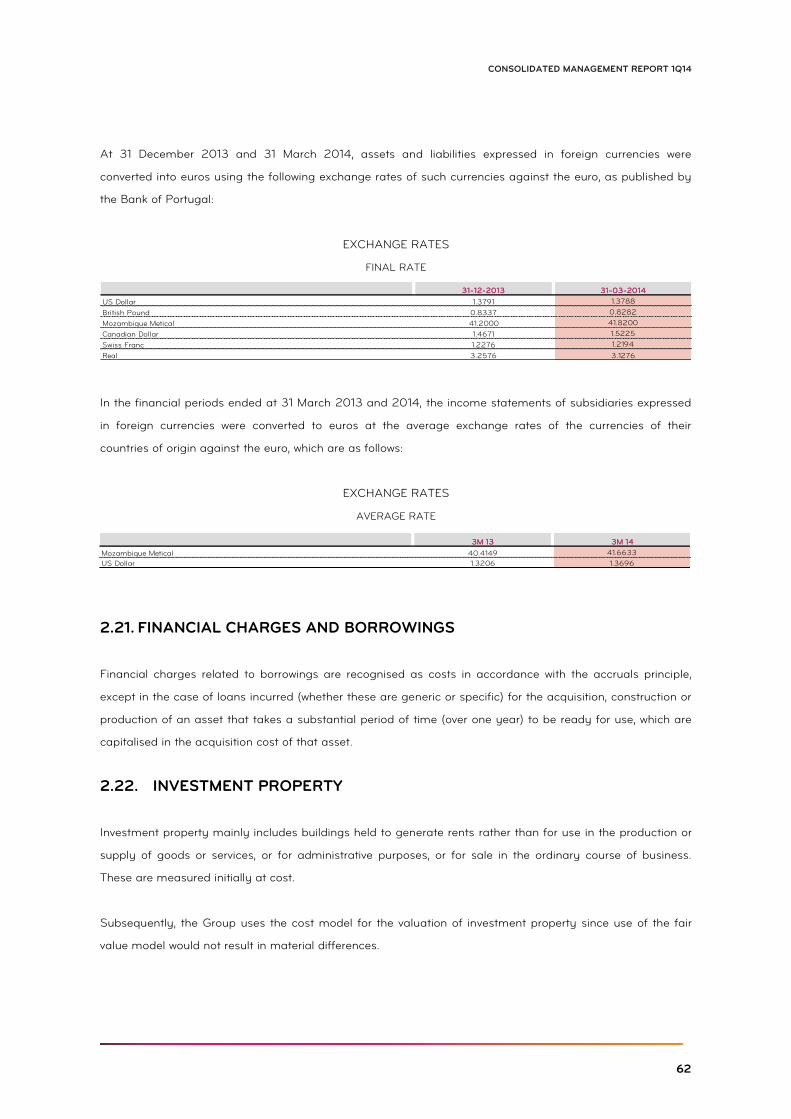
62
CONSOLIDATED MANAGEMENT REPORT 1Q14
At 31 December 2013 and 31 March 2014, assets and liabilities expressed in foreign currencies were
converted into euros using the following exchange rates of such currencies against the euro, as published by
the Bank of Portugal:
EXCHANGE RATES
FINAL RATE
In the financial periods ended at 31 March 2013 and 2014, the income statements of subsidiaries expressed
in foreign currencies were converted to euros at the average exchange rates of the currencies of their
countries of origin against the euro, which are as follows:
EXCHANGE RATES
AVERAGE RATE
2.21. FINANCIAL CHARGES AND BORROWINGS
Financial charges related to borrowings are recognised as costs in accordance with the accruals principle,
except in the case of loans incurred (whether these are generic or specific) for the acquisition, construction or
production of an asset that takes a substantial period of time (over one year) to be ready for use, which are
capitalised in the acquisition cost of that asset.
2.22. INVESTMENT PROPERTY
Investment property mainly includes buildings held to generate rents rather than for use in the production or
supply of goods or services, or for administrative purposes, or for sale in the ordinary course of business.
These are measured initially at cost.
Subsequently, the Group uses the cost model for the valuation of investment property since use of the fair
value model would not result in material differences.
31-12-2013 31-03-2014
US Dollar 1.3791 1.3788
British Pound 0.8337 0.8282
Mozambique Metical 41.2000 41.8200
Canadian Dollar 1.4671 1.5225
Swiss Franc 1.2276 1.2194
Real 3.2576 3.1276
3M 13 3M 14
Mozambique Metical 40.4149 41.6633
US Dollar 1.3206 1.3696
63
ZON OPTIMUS, SGPS, SA
An investment property is eliminated from the statement of financial position on disposal or when the
investment property is taken permanently out of use and no financial benefit is expected from its disposal.
2.23. STATEMENT OF CASH FLOWS
The statement of cash flows is prepared in accordance with the direct method. The Group classifies under
“Cash and cash equivalents” the assets with maturities of less than three months and for which the risk of
change in value is negligible. For purposes of the statement of cash flows, the balance of cash and cash
equivalents also include bank overdrafts included in the statement of financial position under "Borrowings".
The statement of cash flows is divided into operating, investment and financing activities.
Operating activities include cash received from customers and payments to suppliers, staff and others related
to operating activities.
The cash flows included in investment activities include acquisitions and disposals of investments in
subsidiaries and cash received and payments arising from the purchase and sale of tangible and intangible
assets, amongst others.
Financing activities include cash received and payments relating to borrowings, the payment of interest and
similar costs, finance leases, the purchase and sale of own shares and the payment of dividends.
2.24. SUBSEQUENT EVENTS
Events occurring after the date of the statement of financial position which provide additional information
about conditions that existed at that date are taken into account in the preparation of financial statements
for the period.
Events occurring after the date of the statement of financial position which provide information on conditions
that occur after that date are disclosed in the notes to the financial statements, when they are materially
relevant.
64
CONSOLIDATED MANAGEMENT REPORT 1Q14
JUDGEMENTS AND ESTIMATES 3.
3.1. RELEVANT ACCOUNTING ESTIMATES
The preparation of consolidated financial statements requires the Group’s management to make judgments
and estimates that affect the statement of financial position and the reported results. These estimates are
based on the best information and knowledge about past and/or present events, and on the operations that
the Company considers may it may implement in the future. However, at the date of completion of such
operations, their results may differ from these estimates.
Changes to these estimates, that occur after the date of approval of the consolidated financial statements,
will be corrected in the income statement in a prospective manner, in accordance with IAS 8 - "Accounting
Policies, Changes in Accounting Estimates and Errors".
The estimates and assumptions that imply a greater risk of giving rise to a material adjustment in assets and
liabilities are described below:
IMPAIRMENT OF NON-CURRENT ASSETS, EXCLUDING GOODWILL
The determination of a possible impairment loss can be triggered by the occurrence of various events, such
as the availability of future financing, the cost of capital or other market, economic and legal changes or
changes with an adverse effect on the technological environment, many of which are beyond the Group’s
control.
The identification and assessment of impairment indicators, the estimation of future cash flows and the
calculation of the recoverable value of assets involve a high degree of judgment by the Board.
IMPAIRMENT OF GOODWILL
Goodwill is subjected to impairment tests annually or whenever there are indications of a possible loss of
value, in accordance with the criteria described in Note 24. The recoverable values of the cash-generating
units to which goodwill is allocated are determined on the basis of the calculation of current use values. These
calculations require the use of estimates by management.
INTANGIBLE AND TANGIBLE ASSETS
The life of an asset is the period during which the Company expects that an asset will be available for use
and this should be reviewed at least at the end of each financial year.
65
ZON OPTIMUS, SGPS, SA
The determination of the useful lives of assets, the amortisation/depreciation method to be applied and the
estimated losses resulting from the replacement of equipment before the end of its useful life due to
technological obsolescence is crucial in determining the amount of amortisation/depreciation to be
recognised in the consolidated statement of comprehensive income for each year.
These three parameters are defined using management’s best estimates for the assets and businesses
concerned, and taking account of the practices adopted by companies in the sectors in which the Group
operates.
The capitalised costs with the audiovisual content distribution rights acquired for commercialisation in the
various windows of exhibition are amortised over the period of exploration of the respective contracts.
Additionally, these assets are subject to impairment tests whenever there are indications of changes in the
pattern generation of future revenue underlying each contract.
PROVISIONS
The Group periodically reviews any obligations arising from past events which should be recognised or
disclosed. The subjectivity involved in determining the probability and amount of internal resources required
to meet obligations may give rise to significant adjustments, either due to changes in the assumptions made,
or due to the future recognition of provisions previously disclosed as contingent liabilities.
DEFERRED INCOME TAX ASSETS
Deferred income tax assets are recognised only where there is strong assurance that there will be future
taxable income available to use the temporary differences or where there are deferred tax liabilities whose
reversal is expected in the same period in which the deferred tax assets are reversed. The assessment of
deferred income tax assets is undertaken by management at the end of each period taking account of the
expected future performance of the Company.
IMPAIRMENT OF ACCOUNT RECEIVABLES
The credit risk on the balances of accounts receivable is assessed at each reporting date, taking account of
the customer’s history and their risk profile. Accounts receivable are adjusted for the assessment made by
management and the estimated collection risks at the date of the statement of financial position, which may
differ from the effective risk incurred.
66
CONSOLIDATED MANAGEMENT REPORT 1Q14
FAIR VALUE OF FINANCIAL ASSETS AND LIABILITIES
When the fair value of an asset or liabilities is calculated, on an active market, the respective market price is
used. Where there is no active market, which is the case with some of the Group’s financial assets and
liabilities, valuation techniques generally accepted in the market, based on market assumptions, are used.
The Group uses evaluation techniques for unlisted financial instruments such as derivatives, financial
instruments at fair value through profit and loss, and assets available for sale. The valuation models that are
used most frequently are discounted cash flow models and options models, incorporating, for example,
interest rate and market volatility curves.
For certain types of more complex derivatives, more advanced valuation models are used containing
assumptions and data that are not directly observable in the market, for which the Group uses internal
estimates and assumptions.
3.2. ERRORS, ESTIMATES AND CHANGES TO ACCOUNTING POLICIES
During the quarters ended on 31 March 2013 and 31 March 2014, no material errors relating to previous
years were recognised. During the year ended 31 December 2013 occurred changes of accounting policies,
whose impacts have resulted in a restatement of the financial statements for the quarter ended 31 March
2013. These changes are described in Note 2.1..
CHANGES IN THE CONSOLIDATION PERIMETER 4.
There were no changes in the consolidation perimeter during the quarter ended at 31 March 2014.
On 27 August 2013, the merger operation by incorporation of Optimus SGPS into ZON occurred, through the
transfer of all assets of the company Optimus SGPS to ZON, under the terms of the subparagraph a) of
paragraph 4 of the Article 97 of the CSC, with effect from the date of the merger.
Following the merger, the Company performed a preliminary assessment of the fair value of assets acquired
and assumed liabilities through this operation, updated during the quarter ended 31 March 2014. The
allocation of the acquisition price is still subject to changes until the conclusion of a period of one year from
the date of acquisition, in accordance with IFRS 3 - Business Combinations. Nevertheless, the Company does
not expect significant changes in its financial position as a result from any changes to the allocation made.
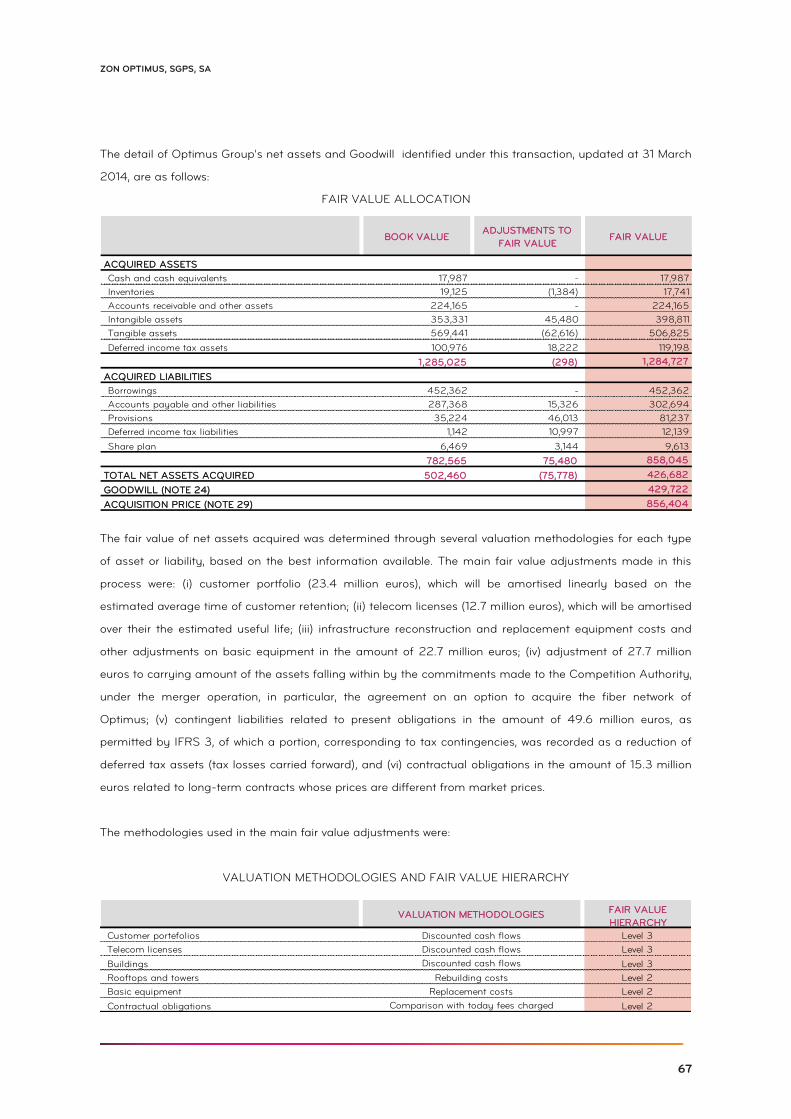
67
ZON OPTIMUS, SGPS, SA
The detail of Optimus Group's net assets and Goodwill identified under this transaction, updated at 31 March
2014, are as follows:
FAIR VALUE ALLOCATION
The fair value of net assets acquired was determined through several valuation methodologies for each type
of asset or liability, based on the best information available. The main fair value adjustments made in this
process were: (i) customer portfolio (23.4 million euros), which will be amortised linearly based on the
estimated average time of customer retention; (ii) telecom licenses (12.7 million euros), which will be amortised
over their the estimated useful life; (iii) infrastructure reconstruction and replacement equipment costs and
other adjustments on basic equipment in the amount of 22.7 million euros; (iv) adjustment of 27.7 million
euros to carrying amount of the assets falling within by the commitments made to the Competition Authority,
under the merger operation, in particular, the agreement on an option to acquire the fiber network of
Optimus; (v) contingent liabilities related to present obligations in the amount of 49.6 million euros, as
permitted by IFRS 3, of which a portion, corresponding to tax contingencies, was recorded as a reduction of
deferred tax assets (tax losses carried forward), and (vi) contractual obligations in the amount of 15.3 million
euros related to long-term contracts whose prices are different from market prices.
The methodologies used in the main fair value adjustments were:
VALUATION METHODOLOGIES AND FAIR VALUE HIERARCHY
Customer portefolios Level 3
Telecom licenses Level 3
Buildings Level 3
Rooftops and towers Level 2
Basic equipment Level 2
Contractual obligations Level 2
Discounted cash flows
Rebuilding costs
Replacement costs
Comparison with today fees charged
FAIR VALUE
HIERARCHYVALUATION METHODOLOGIES
Discounted cash flows
Discounted cash flows
BOOK VALUEADJUSTMENTS TO
FAIR VALUEFAIR VALUE
ACQUIRED ASSETS
Cash and cash equivalents 17,987 - 17,987
Inventories 19,125 (1,384) 17,741
Accounts receivable and other assets 224,165 - 224,165
Intangible assets 353,331 45,480 398,811
Tangible assets 569,441 (62,616) 506,825
Deferred income tax assets 100,976 18,222 119,198
1,285,025 (298) 1,284,727
ACQUIRED LIABILITIES
Borrowings 452,362 - 452,362
Accounts payable and other liabilities 287,368 15,326 302,694
Provisions 35,224 46,013 81,237
Deferred income tax liabilities 1,142 10,997 12,139
Share plan 6,469 3,144 9,613
782,565 75,480 858,045
TOTAL NET ASSETS ACQUIRED 502,460 (75,778) 426,682
GOODWILL (NOTE 24) 429,722
ACQUISITION PRICE (NOTE 29) 856,404
68
CONSOLIDATED MANAGEMENT REPORT 1Q14
When identifying the fair value of acquired assets and liabilities the Group’s management made estimates,
assumptions and judgments such as: (i) the average period of retention of Optimus’ customers used in the
valuation of the customer portfolio; (ii) the average time of use of existing 2G/3G and LTE technologies and
revenue growth as a result of the emergence of other new technologies, used in the valuation of the telecom
licenses, among others. Although these estimates were based on the best information available at the date of
preparation of the consolidated financial statements, current and future results may differ from these
estimates.
Several scenarios have been considered in the valuations and the sensitivity analyzes performed have not led
to significant changes in the allocation of the fair value of assets and liabilities.
For the remaining assets and liabilities were not identified significant differences between the fair value and
their book value.
As usual on mergers and acquisitions, also in this operation, there was a part of the acquisition price which
was not possible to allocate to the fair value of some identified assets and liabilities, that was considered as
Goodwill and recorded in “Intangible Assets”. This Goodwill is related to a number of different elements, which
cannot be individually quantified and isolated in a viable way and include, for example, synergies, qualified
workforce and technical skills.
If the merged companies had been consolidated from 1 January 2013, the amounts of consolidated
operating revenues and net income before non-controlling interests, after elimination of the transactions with
parties related to ZON Optimus group, for the period ended 31 March 2013, would be as follows:
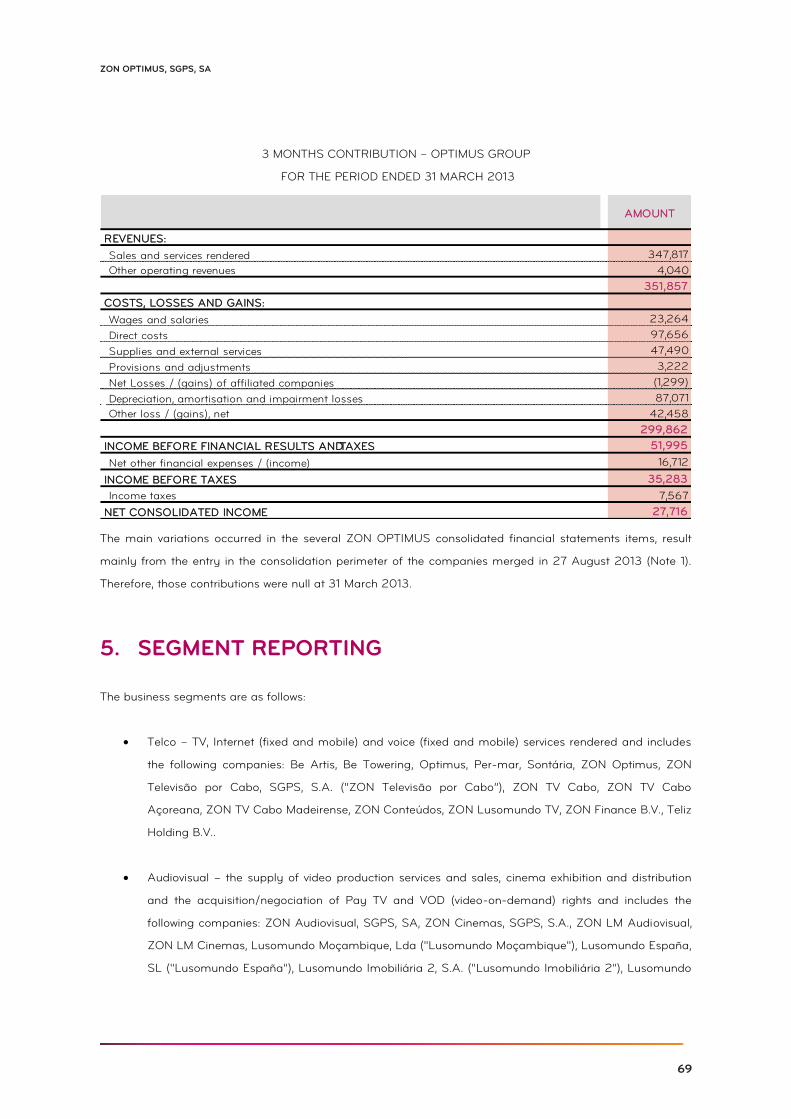
69
ZON OPTIMUS, SGPS, SA
3 MONTHS CONTRIBUTION – OPTIMUS GROUP
FOR THE PERIOD ENDED 31 MARCH 2013
The main variations occurred in the several ZON OPTIMUS consolidated financial statements items, result
mainly from the entry in the consolidation perimeter of the companies merged in 27 August 2013 (Note 1).
Therefore, those contributions were null at 31 March 2013.
SEGMENT REPORTING 5.
The business segments are as follows:
Telco – TV, Internet (fixed and mobile) and voice (fixed and mobile) services rendered and includes
the following companies: Be Artis, Be Towering, Optimus, Per-mar, Sontária, ZON Optimus, ZON
Televisão por Cabo, SGPS, S.A. (“ZON Televisão por Cabo”), ZON TV Cabo, ZON TV Cabo
Açoreana, ZON TV Cabo Madeirense, ZON Conteúdos, ZON Lusomundo TV, ZON Finance B.V., Teliz
Holding B.V..
Audiovisual – the supply of video production services and sales, cinema exhibition and distribution
and the acquisition/negociation of Pay TV and VOD (video-on-demand) rights and includes the
following companies: ZON Audiovisual, SGPS, SA, ZON Cinemas, SGPS, S.A., ZON LM Audiovisual,
ZON LM Cinemas, Lusomundo Moçambique, Lda ("Lusomundo Moçambique"), Lusomundo España,
SL ("Lusomundo España"), Lusomundo Imobiliária 2, S.A. ("Lusomundo Imobiliária 2"), Lusomundo
REVENUES:
Sales and services rendered 347,817
Other operating revenues 4,040
351,857
COSTS, LOSSES AND GAINS:
Wages and salaries 23,264
Direct costs 97,656
Supplies and external services 47,490
Provisions and adjustments 3,222
Net Losses / (gains) of affiliated companies (1,299)
Depreciation, amortisation and impairment losses 87,071
Other loss / (gains), net 42,458
299,862
INCOME BEFORE FINANCIAL RESULTS AND TAXES 51,995
Net other financial expenses / (income) 16,712
INCOME BEFORE TAXES 35,283
Income taxes 7,567
NET CONSOLIDATED INCOME 27,716
AMOUNT
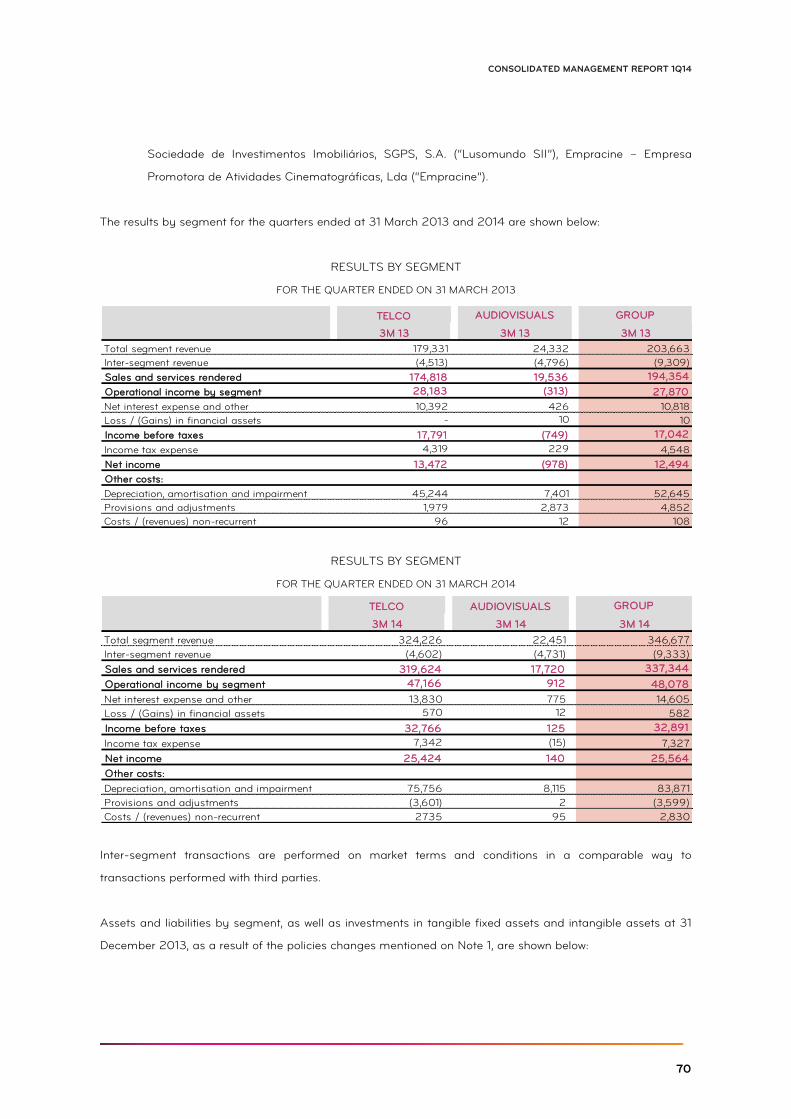
70
CONSOLIDATED MANAGEMENT REPORT 1Q14
Sociedade de Investimentos Imobiliários, SGPS, S.A. (“Lusomundo SII”), Empracine – Empresa
Promotora de Atividades Cinematográficas, Lda (“Empracine”).
The results by segment for the quarters ended at 31 March 2013 and 2014 are shown below:
RESULTS BY SEGMENT
FOR THE QUARTER ENDED ON 31 MARCH 2013
RESULTS BY SEGMENT
FOR THE QUARTER ENDED ON 31 MARCH 2014
Inter-segment transactions are performed on market terms and conditions in a comparable way to
transactions performed with third parties.
Assets and liabilities by segment, as well as investments in tangible fixed assets and intangible assets at 31
December 2013, as a result of the policies changes mentioned on Note 1, are shown below:
TELCO AUDIOVISUALS
3M 14 3M 14 3M 14
Total segment revenue 324,226 22,451 346,677
Inter-segment revenue (4,602) (4,731) (9,333)
Sales and services rendered 319,624 17,720 337,344
Operational income by segment 47,166 912 48,078
Net interest expense and other 13,830 775 14,605
Loss / (Gains) in financial assets 570 12 582
Income before taxes 32,766 125 32,891
Income tax expense 7,342 (15) 7,327
Net income 25,424 140 25,564
Other costs:
Depreciation, amortisation and impairment 75,756 8,115 83,871
Provisions and adjustments (3,601) 2 (3,599)
Costs / (revenues) non-recurrent 2735 95 2,830
GROUP
TELCO
3M 13 3M 13 3M 13
Total segment revenue 179,331 24,332 203,663
Inter-segment revenue (4,513) (4,796) (9,309)
Sales and services rendered 174,818 19,536 194,354
Operational income by segment 28,183 (313) 27,870
Net interest expense and other 10,392 426 10,818
Loss / (Gains) in financial assets - 10 10
Income before taxes 17,791 (749) 17,042
Income tax expense 4,319 229 4,548
Net income 13,472 (978) 12,494
Other costs:
Depreciation, amortisation and impairment 45,244 7,401 52,645
Provisions and adjustments 1,979 2,873 4,852
Costs / (revenues) non-recurrent 96 12 108
GROUPAUDIOVISUALS
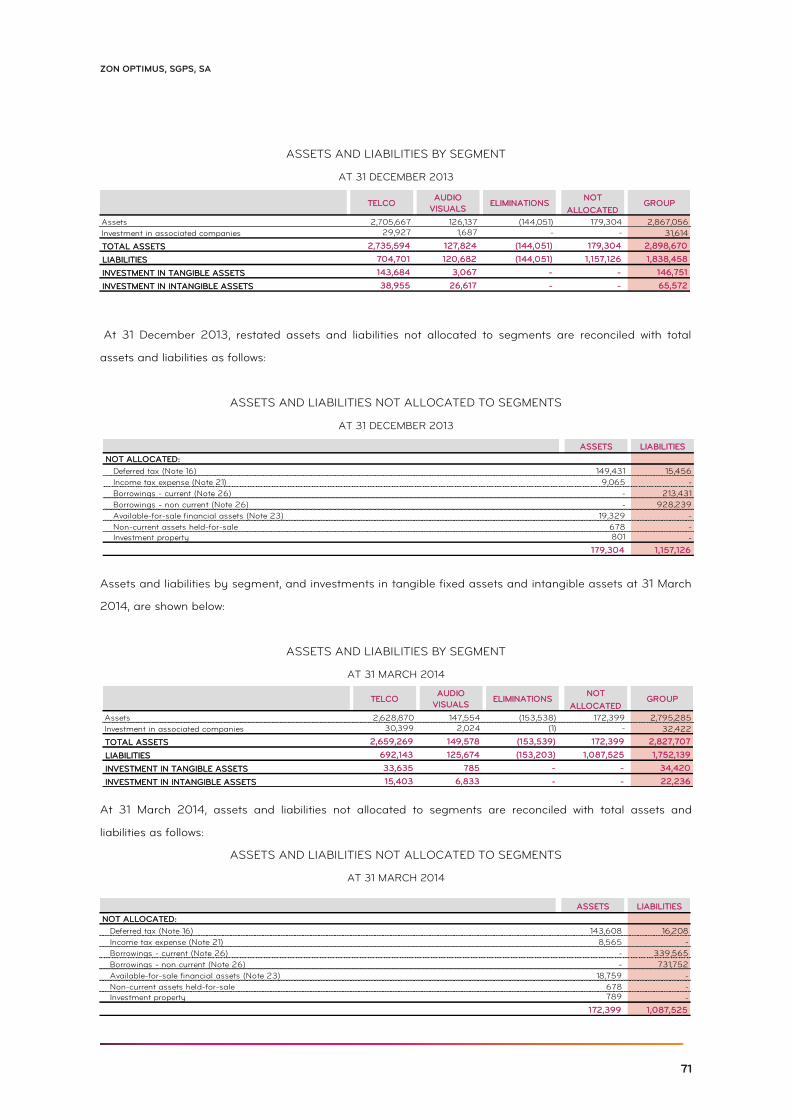
71
ZON OPTIMUS, SGPS, SA
ASSETS AND LIABILITIES BY SEGMENT
AT 31 DECEMBER 2013
At 31 December 2013, restated assets and liabilities not allocated to segments are reconciled with total
assets and liabilities as follows:
ASSETS AND LIABILITIES NOT ALLOCATED TO SEGMENTS
AT 31 DECEMBER 2013
Assets and liabilities by segment, and investments in tangible fixed assets and intangible assets at 31 March
2014, are shown below:
ASSETS AND LIABILITIES BY SEGMENT
AT 31 MARCH 2014
At 31 March 2014, assets and liabilities not allocated to segments are reconciled with total assets and
liabilities as follows:
ASSETS AND LIABILITIES NOT ALLOCATED TO SEGMENTS
AT 31 MARCH 2014
NOT
ALLOCATED
Assets 2,705,667 126,137 (144,051) 179,304 2,867,056
Investment in associated companies 29,927 1,687 - - 31,614
TOTAL ASSETS 2,735,594 127,824 (144,051) 179,304 2,898,670
LIABILITIES 704,701 120,682 (144,051) 1,157,126 1,838,458
INVESTMENT IN TANGIBLE ASSETS 143,684 3,067 - - 146,751
INVESTMENT IN INTANGIBLE ASSETS 38,955 26,617 - - 65,572
TELCOAUDIO
VISUALSELIMINATIONS GROUP
ASSETS LIABILITIES
NOT ALLOCATED:
Deferred tax (Note 16) 149,431 15,456
Income tax expense (Note 21) 9,065 -
Borrowings - current (Note 26) - 213,431
Borrowings - non current (Note 26) - 928,239
Available-for-sale financial assets (Note 23) 19,329 -
Non-current assets held-for-sale 678 -
Investment property 801 -
179,304 1,157,126
NOT
ALLOCATED
Assets 2,628,870 147,554 (153,538) 172,399 2,795,285
Investment in associated companies 30,399 2,024 (1) - 32,422
TOTAL ASSETS 2,659,269 149,578 (153,539) 172,399 2,827,707
LIABILITIES 692,143 125,674 (153,203) 1,087,525 1,752,139
INVESTMENT IN TANGIBLE ASSETS 33,635 785 - - 34,420
INVESTMENT IN INTANGIBLE ASSETS 15,403 6,833 - - 22,236
TELCOAUDIO
VISUALSELIMINATIONS GROUP
ASSETS LIABILITIES
NOT ALLOCATED:
Deferred tax (Note 16) 143,608 16,208
Income tax expense (Note 21) 8,565 -
Borrowings - current (Note 26) - 339,565
Borrowings - non current (Note 26) - 731,752
Available-for-sale financial assets (Note 23) 18,759 -
Non-current assets held-for-sale 678 -
Investment property 789 -
172,399 1,087,525
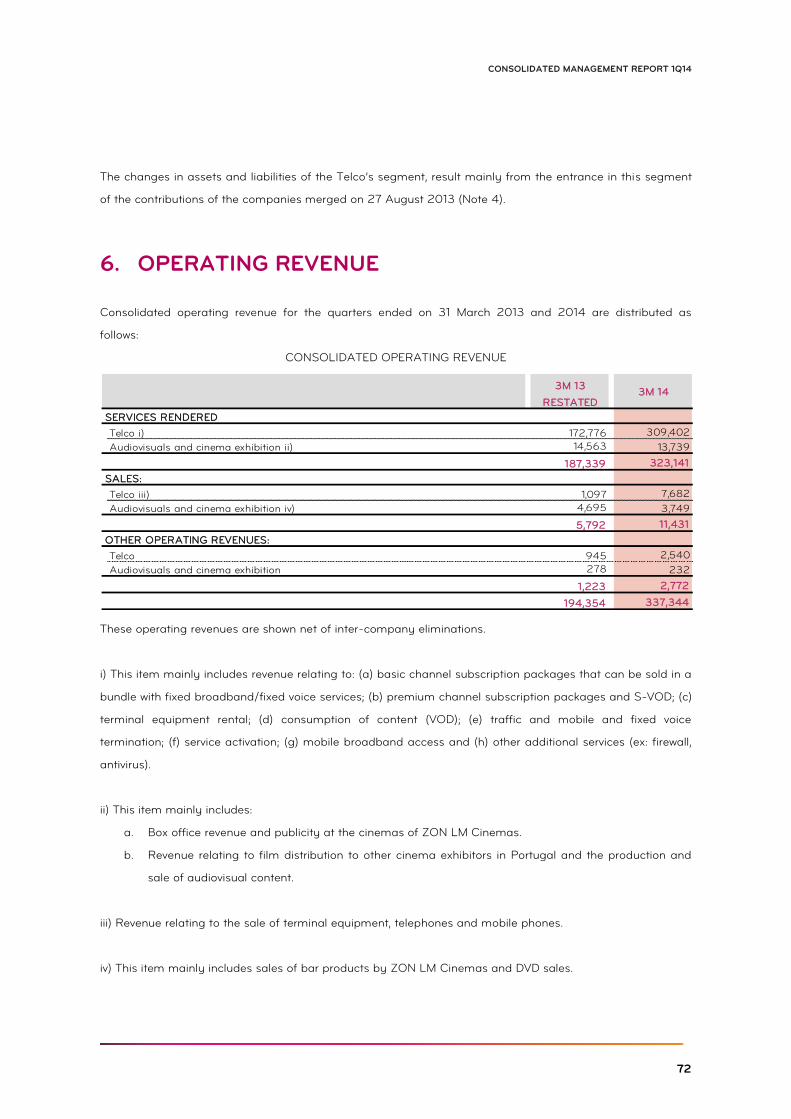
72
CONSOLIDATED MANAGEMENT REPORT 1Q14
The changes in assets and liabilities of the Telco’s segment, result mainly from the entrance in this segment
of the contributions of the companies merged on 27 August 2013 (Note 4).
OPERATING REVENUE 6.
Consolidated operating revenue for the quarters ended on 31 March 2013 and 2014 are distributed as
follows:
CONSOLIDATED OPERATING REVENUE
These operating revenues are shown net of inter-company eliminations.
i) This item mainly includes revenue relating to: (a) basic channel subscription packages that can be sold in a
bundle with fixed broadband/fixed voice services; (b) premium channel subscription packages and S-VOD; (c)
terminal equipment rental; (d) consumption of content (VOD); (e) traffic and mobile and fixed voice
termination; (f) service activation; (g) mobile broadband access and (h) other additional services (ex: firewall,
antivirus).
ii) This item mainly includes:
a. Box office revenue and publicity at the cinemas of ZON LM Cinemas.
b. Revenue relating to film distribution to other cinema exhibitors in Portugal and the production and
sale of audiovisual content.
iii) Revenue relating to the sale of terminal equipment, telephones and mobile phones.
iv) This item mainly includes sales of bar products by ZON LM Cinemas and DVD sales.
3M 13
RESTATED
SERVICES RENDERED
Telco i) 172,776 309,402
Audiovisuals and cinema exhibition ii) 14,563 13,739
187,339 323,141
SALES:
Telco iii) 1,097 7,682
Audiovisuals and cinema exhibition iv) 4,695 3,749
5,792 11,431
OTHER OPERATING REVENUES:
Telco 945 2,540
Audiovisuals and cinema exhibition 278 232
1,223 2,772
194,354 337,344
3M 14
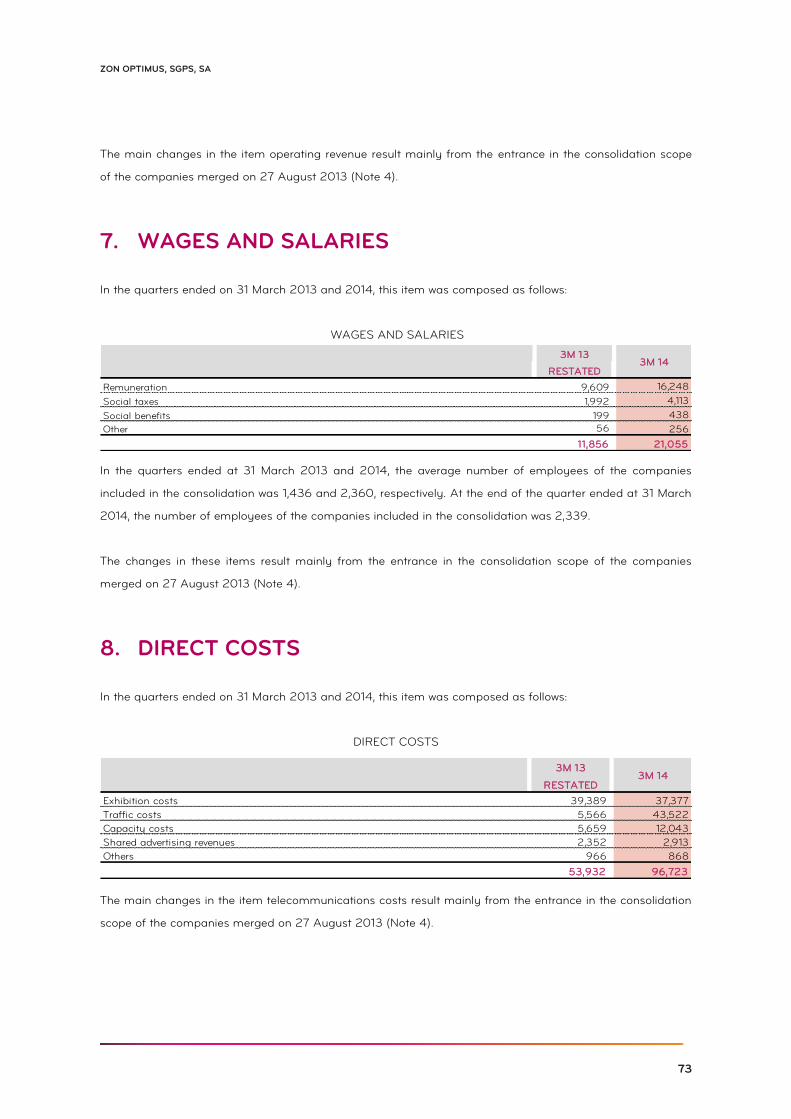
73
ZON OPTIMUS, SGPS, SA
The main changes in the item operating revenue result mainly from the entrance in the consolidation scope
of the companies merged on 27 August 2013 (Note 4).
WAGES AND SALARIES 7.
In the quarters ended on 31 March 2013 and 2014, this item was composed as follows:
WAGES AND SALARIES
In the quarters ended at 31 March 2013 and 2014, the average number of employees of the companies
included in the consolidation was 1,436 and 2,360, respectively. At the end of the quarter ended at 31 March
2014, the number of employees of the companies included in the consolidation was 2,339.
The changes in these items result mainly from the entrance in the consolidation scope of the companies
merged on 27 August 2013 (Note 4).
DIRECT COSTS 8.
In the quarters ended on 31 March 2013 and 2014, this item was composed as follows:
DIRECT COSTS
The main changes in the item telecommunications costs result mainly from the entrance in the consolidation
scope of the companies merged on 27 August 2013 (Note 4).
3M 13
RESTATED
Remuneration 9,609 16,248
Social taxes 1,992 4,113
Social benefits 199 438
Other 56 256
11,856 21,055
3M 14
3M 13
RESTATED
Exhibition costs 39,389 37,377
Traffic costs 5,566 43,522
Capacity costs 5,659 12,043
Shared advertising revenues 2,352 2,913
Others 966 868
53,932 96,723
3M 14
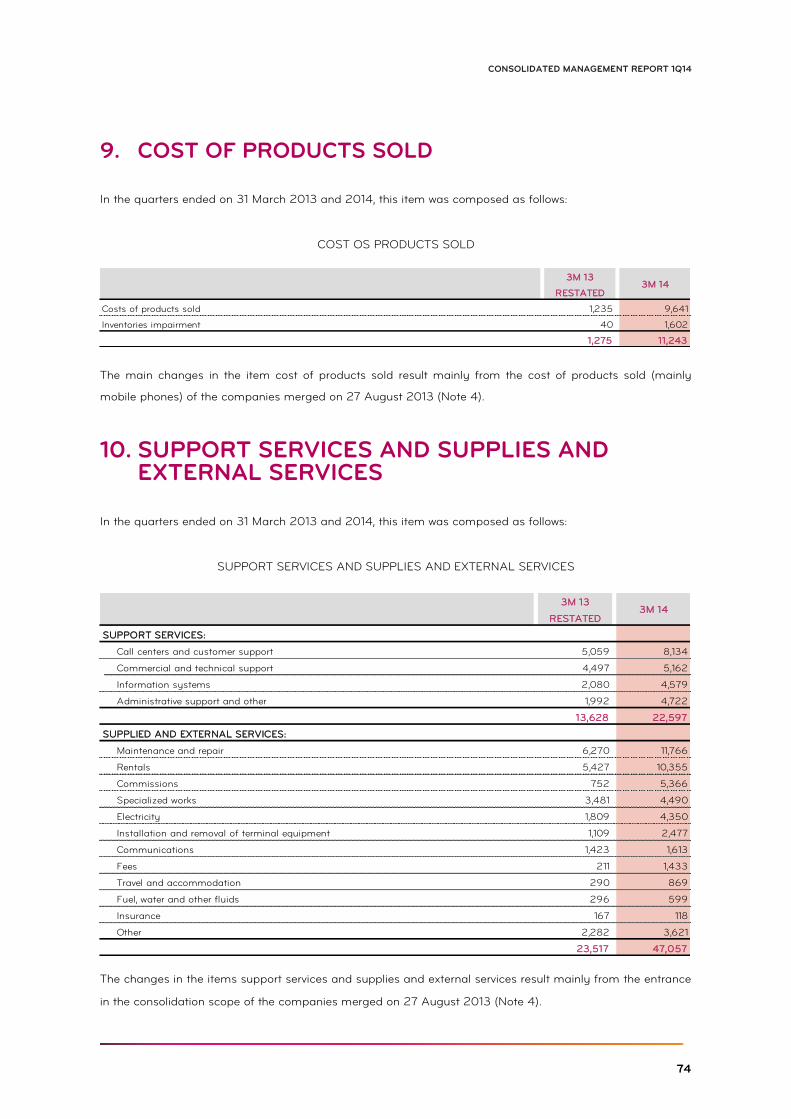
74
CONSOLIDATED MANAGEMENT REPORT 1Q14
COST OF PRODUCTS SOLD 9.
In the quarters ended on 31 March 2013 and 2014, this item was composed as follows:
COST OS PRODUCTS SOLD
The main changes in the item cost of products sold result mainly from the cost of products sold (mainly
mobile phones) of the companies merged on 27 August 2013 (Note 4).
SUPPORT SERVICES AND SUPPLIES AND 10.EXTERNAL SERVICES
In the quarters ended on 31 March 2013 and 2014, this item was composed as follows:
SUPPORT SERVICES AND SUPPLIES AND EXTERNAL SERVICES
The changes in the items support services and supplies and external services result mainly from the entrance
in the consolidation scope of the companies merged on 27 August 2013 (Note 4).
3M 13
RESTATED
Costs of products sold 1,235 9,641
Inventories impairment 40 1,602
1,275 11,243
3M 14
3M 13
RESTATED
SUPPORT SERVICES:
Call centers and customer support 5,059 8,134
Commercial and technical support 4,497 5,162
Information systems 2,080 4,579
Administrative support and other 1,992 4,722
13,628 22,597
SUPPLIED AND EXTERNAL SERVICES:
Maintenance and repair 6,270 11,766
Rentals 5,427 10,355
Commissions 752 5,366
Specialized works 3,481 4,490
Electricity 1,809 4,350
Installation and removal of terminal equipment 1,109 2,477
Communications 1,423 1,613
Fees 211 1,433
Travel and accommodation 290 869
Fuel, water and other fluids 296 599
Insurance 167 118
Other 2,282 3,621
23,517 47,057
3M 14
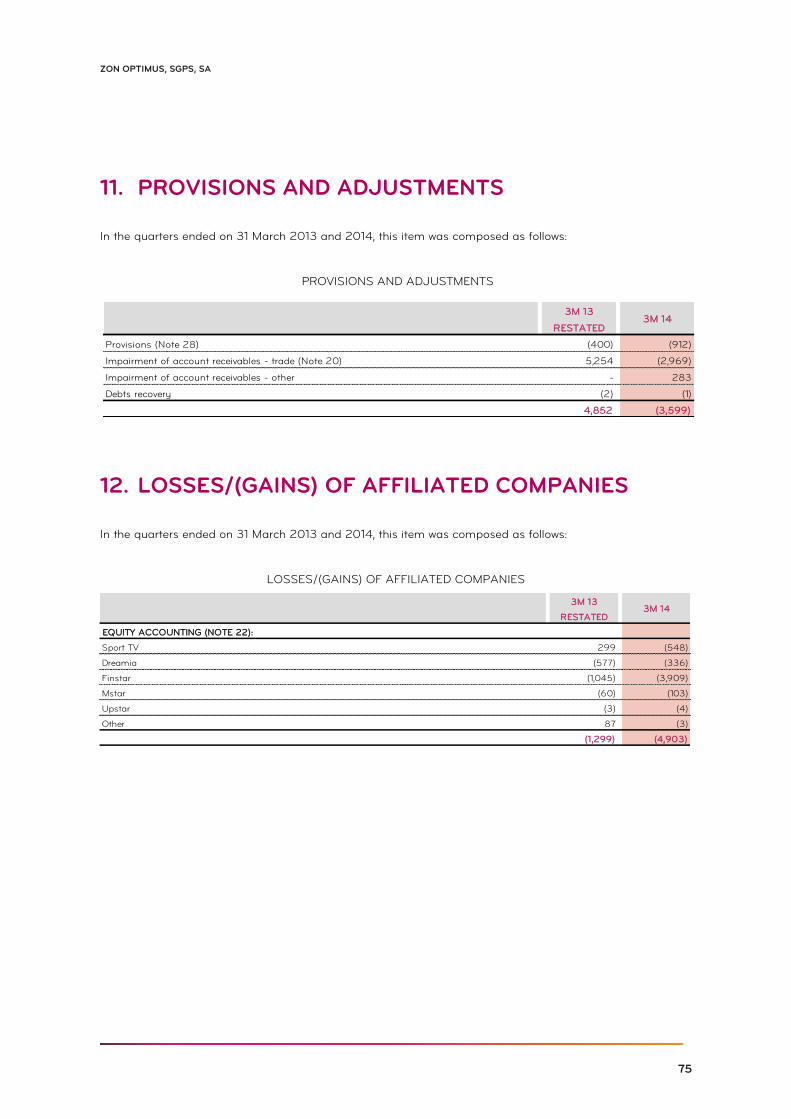
75
ZON OPTIMUS, SGPS, SA
PROVISIONS AND ADJUSTMENTS 11.
In the quarters ended on 31 March 2013 and 2014, this item was composed as follows:
PROVISIONS AND ADJUSTMENTS
LOSSES/(GAINS) OF AFFILIATED COMPANIES 12.
In the quarters ended on 31 March 2013 and 2014, this item was composed as follows:
LOSSES/(GAINS) OF AFFILIATED COMPANIES
3M 13
RESTATED
Provisions (Note 28) (400) (912)
Impairment of account receivables - trade (Note 20) 5,254 (2,969)
Impairment of account receivables - other - 283
Debts recovery (2) (1)
4,852 (3,599)
3M 14
3M 13
RESTATED
EQUITY ACCOUNTING (NOTE 22):
Sport TV 299 (548)
Dreamia (577) (336)
Finstar (1,045) (3,909)
Mstar (60) (103)
Upstar (3) (4)
Other 87 (3)
(1,299) (4,903)
3M 14
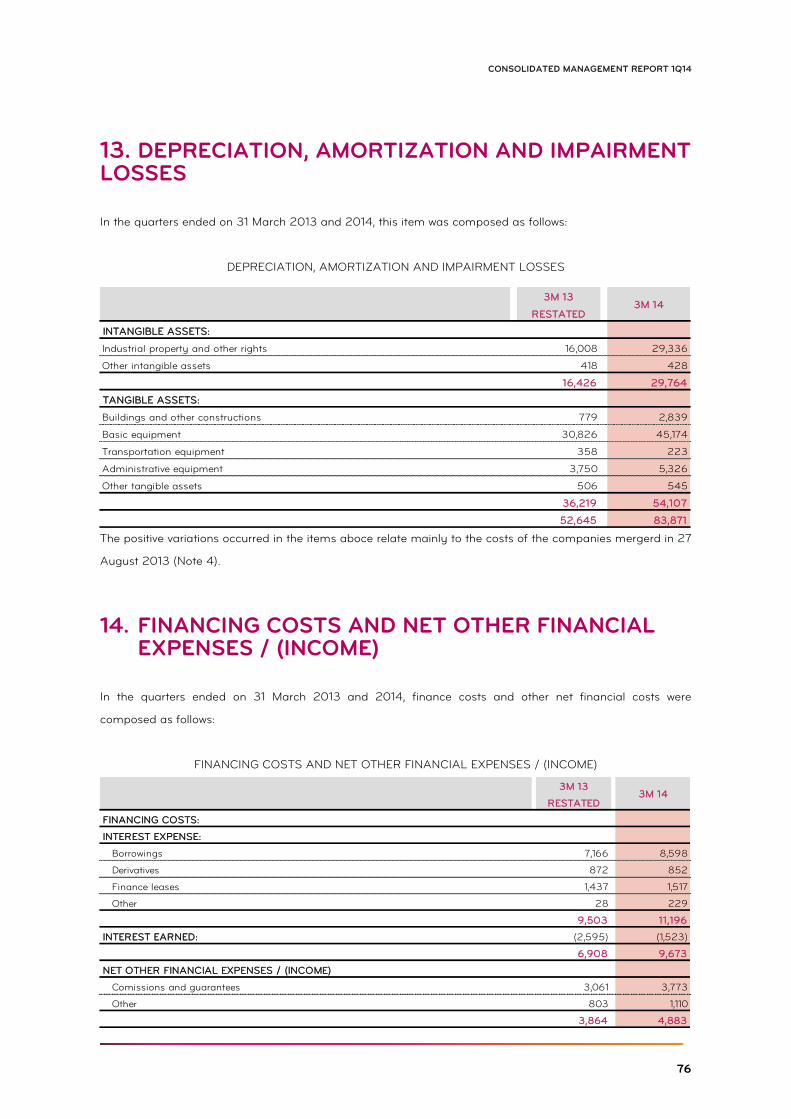
76
CONSOLIDATED MANAGEMENT REPORT 1Q14
DEPRECIATION, AMORTIZATION AND IMPAIRMENT 13.LOSSES
In the quarters ended on 31 March 2013 and 2014, this item was composed as follows:
DEPRECIATION, AMORTIZATION AND IMPAIRMENT LOSSES
The positive variations occurred in the items aboce relate mainly to the costs of the companies mergerd in 27
August 2013 (Note 4).
FINANCING COSTS AND NET OTHER FINANCIAL 14.EXPENSES / (INCOME)
In the quarters ended on 31 March 2013 and 2014, finance costs and other net financial costs were
composed as follows:
FINANCING COSTS AND NET OTHER FINANCIAL EXPENSES / (INCOME)
3M 13
RESTATED
INTANGIBLE ASSETS:
Industrial property and other rights 16,008 29,336
Other intangible assets 418 428
16,426 29,764
TANGIBLE ASSETS:
Buildings and other constructions 779 2,839
Basic equipment 30,826 45,174
Transportation equipment 358 223
Administrative equipment 3,750 5,326
Other tangible assets 506 545
36,219 54,107
52,645 83,871
3M 14
3M 13
RESTATED
FINANCING COSTS:
INTEREST EXPENSE:
Borrowings 7,166 8,598
Derivatives 872 852
Finance leases 1,437 1,517
Other 28 229
9,503 11,196
INTEREST EARNED: (2,595) (1,523)
6,908 9,673
NET OTHER FINANCIAL EXPENSES / (INCOME)
Comissions and guarantees 3,061 3,773
Other 803 1,110
3,864 4,883
3M 14
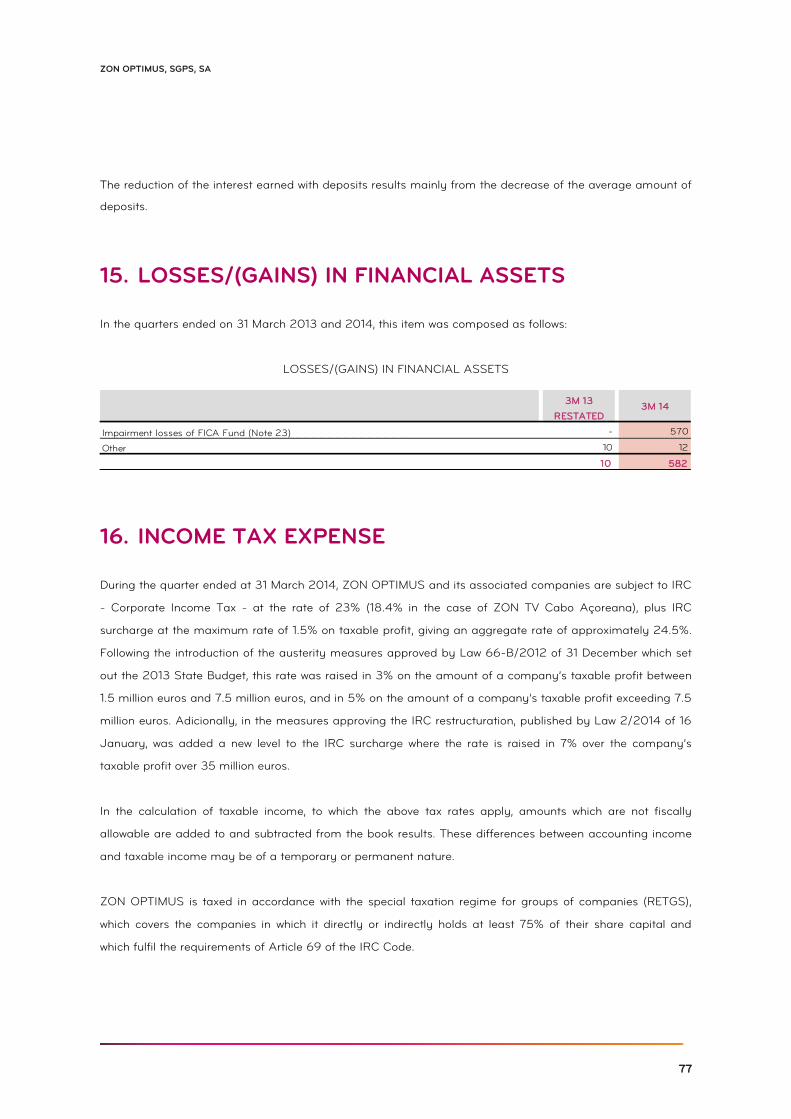
77
ZON OPTIMUS, SGPS, SA
The reduction of the interest earned with deposits results mainly from the decrease of the average amount of
deposits.
LOSSES/(GAINS) IN FINANCIAL ASSETS 15.
In the quarters ended on 31 March 2013 and 2014, this item was composed as follows:
LOSSES/(GAINS) IN FINANCIAL ASSETS
INCOME TAX EXPENSE 16.
During the quarter ended at 31 March 2014, ZON OPTIMUS and its associated companies are subject to IRC
- Corporate Income Tax - at the rate of 23% (18.4% in the case of ZON TV Cabo Açoreana), plus IRC
surcharge at the maximum rate of 1.5% on taxable profit, giving an aggregate rate of approximately 24.5%.
Following the introduction of the austerity measures approved by Law 66-B/2012 of 31 December which set
out the 2013 State Budget, this rate was raised in 3% on the amount of a company’s taxable profit between
1.5 million euros and 7.5 million euros, and in 5% on the amount of a company’s taxable profit exceeding 7.5
million euros. Adicionally, in the measures approving the IRC restructuration, published by Law 2/2014 of 16
January, was added a new level to the IRC surcharge where the rate is raised in 7% over the company’s
taxable profit over 35 million euros.
In the calculation of taxable income, to which the above tax rates apply, amounts which are not fiscally
allowable are added to and subtracted from the book results. These differences between accounting income
and taxable income may be of a temporary or permanent nature.
ZON OPTIMUS is taxed in accordance with the special taxation regime for groups of companies (RETGS),
which covers the companies in which it directly or indirectly holds at least 75% of their share capital and
which fulfil the requirements of Article 69 of the IRC Code.
3M 13
RESTATED
Impairment losses of FICA Fund (Note 23) - 570
Other 10 12
10 582
3M 14
78
CONSOLIDATED MANAGEMENT REPORT 1Q14
The companies covered by the RETGS in 2014 are:
• Be Artis (included in the RETGS during 2014)
• Be Toweing (included in the RETGS during 2014)
• Empracine
• Optimus (included in the RETGS during 2014)
• Per-mar (included in the RETGS during 2014)
• Sontária (included in the RETGS during 2014)
• ZON OPTIMUS
• ZON Lusomundo TV
• Lusomundo SII
• ZON Cinemas SGPS
• ZON Audiovisuais SGPS
• ZON TV Cabo
• ZON TV Cabo Madeirense (included in the RETGS during 2014)
• ZON Televisão por Cabo SGPS
• Lusomundo Imobiliária 2
• ZON LM Audiovisuais
• ZON LM Cinemas
• ZON Conteúdos
Under current legislation, tax declarations are subject to review and correction by the tax authorities for a
period of four years (five years in the case of Social Security), except where tax losses have occurred (where
the period is five or six years) or tax benefits have been obtained or inspections, appeals or disputes are in
progress, in which case, depending on the circumstances, the periods are extended or suspended.
The Board of Directors of ZON OPTIMUS, based on information from its tax advisers, believes that these and
any other revisions and corrections to these tax declarations, as well as other contingencies of a fiscal nature,
will not have a significant effect on the consolidated financial statements as at 31 March 2014.
A) DEFERRED TAX
ZON Optimus and its associated companies have reported deferred tax relating to temporary differences
between the taxable basis and the book amounts of assets and liabilities, and tax losses carried forward at
the date of the statement of financial position.
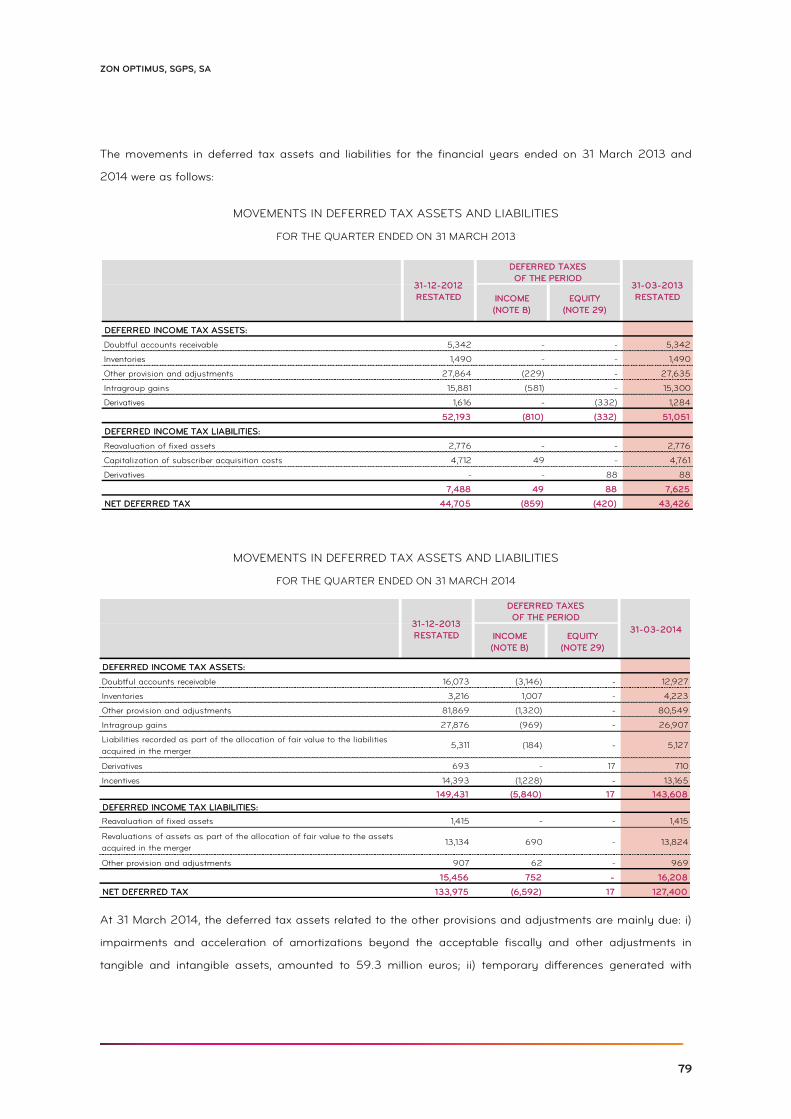
79
ZON OPTIMUS, SGPS, SA
The movements in deferred tax assets and liabilities for the financial years ended on 31 March 2013 and
2014 were as follows:
MOVEMENTS IN DEFERRED TAX ASSETS AND LIABILITIES
FOR THE QUARTER ENDED ON 31 MARCH 2013
MOVEMENTS IN DEFERRED TAX ASSETS AND LIABILITIES
FOR THE QUARTER ENDED ON 31 MARCH 2014
At 31 March 2014, the deferred tax assets related to the other provisions and adjustments are mainly due: i)
impairments and acceleration of amortizations beyond the acceptable fiscally and other adjustments in
tangible and intangible assets, amounted to 59.3 million euros; ii) temporary differences generated with
INCOME
(NOTE B)
EQUITY
(NOTE 29)
DEFERRED INCOME TAX ASSETS:
Doubtful accounts receivable 5,342 - - 5,342
Inventories 1,490 - - 1,490
Other provision and adjustments 27,864 (229) - 27,635
Intragroup gains 15,881 (581) - 15,300
Derivatives 1,616 - (332) 1,284
52,193 (810) (332) 51,051
DEFERRED INCOME TAX LIABILITIES:
Reavaluation of fixed assets 2,776 - - 2,776
Capitalization of subscriber acquisition costs 4,712 49 - 4,761
Derivatives - - 88 88
7,488 49 88 7,625
NET DEFERRED TAX 44,705 (859) (420) 43,426
31-12-2012
RESTATED
DEFERRED TAXES
OF THE PERIOD31-03-2013
RESTATED
INCOME
(NOTE B)
EQUITY
(NOTE 29)
DEFERRED INCOME TAX ASSETS:
Doubtful accounts receivable 16,073 (3,146) - 12,927
Inventories 3,216 1,007 - 4,223
Other provision and adjustments 81,869 (1,320) - 80,549
Intragroup gains 27,876 (969) - 26,907
Liabilities recorded as part of the allocation of fair value to the liabilities
acquired in the merger5,311 (184) - 5,127
Derivatives 693 - 17 710
Incentives 14,393 (1,228) - 13,165
149,431 (5,840) 17 143,608
DEFERRED INCOME TAX LIABILITIES:
Reavaluation of fixed assets 1,415 - - 1,415
Revaluations of assets as part of the allocation of fair value to the assets
acquired in the merger13,134 690 - 13,824
Other provision and adjustments 907 62 - 969
15,456 752 - 16,208
NET DEFERRED TAX 133,975 (6,592) 17 127,400
31-03-201431-12-2013
RESTATED
DEFERRED TAXES
OF THE PERIOD
80
CONSOLIDATED MANAGEMENT REPORT 1Q14
adjustments of conversion to IAS/IFRS at 31 December 2009, amounted to 5.3 million euros; and iii) other
provisions amounted to 15.9 million euros.
At 31 March 2014, the deferred tax liability related to the revaluation of assets related to the allocation of fair
value of the assets acquired in the merger is related to the appreciation of customers portfolio,
telecommunications licenses and other assets of Optimus Group companies.
At 31 March 2014 were not recognized deferred tax assets in the amount of 12,813 thousand euros related to:
i) tax losses, mainly in the year 2009 and 2013, ii) tax incentives amounting to 3,723 thousand euros, and iii)
temporary differences in the amount of 319 thousand euros.
Deferred tax assets were recognised where it is probable that taxable profits will occur in future that may be
used to absorb tax losses or deductible tax differences. This assessment was based on the business plans of
the Group’s companies, which are regularly revised and updated.
At 31 March 2014, the tax rate used to calculate the deferred tax assets relating to tax losses carried forward
was 23%. In the case of temporary differences, the rate used was 24.5% increased to a maximum of 3.8% of
state surcharge when understood as likely the taxation of temporary differences in the estimated period of
application of the state surcharge. Tax benefits, related to deductions from taxable income, are considered
100%, and in some cases, their full acceptance is conditional upon the approval of the authorities that grants
such tax benefits.
Under the terms of current legislation in Portugal, tax losses generated up to 2009, or in 2010 and 2011, and
from 2012 onwards may be carried forward for a period of six years, four years and five years, respectively,
after their occurrence and may be deducted from taxable profits generated during that period, up to a limit
of 75% of the taxable profit in 2013 and 70% of taxable profit in the following years.
B) EFFECTIVE TAX RATE RECONCILIATION
In the quarters ended on 31 March 2013 and 2014, the reconciliation between the nominal and effective rates
of tax was as follows:
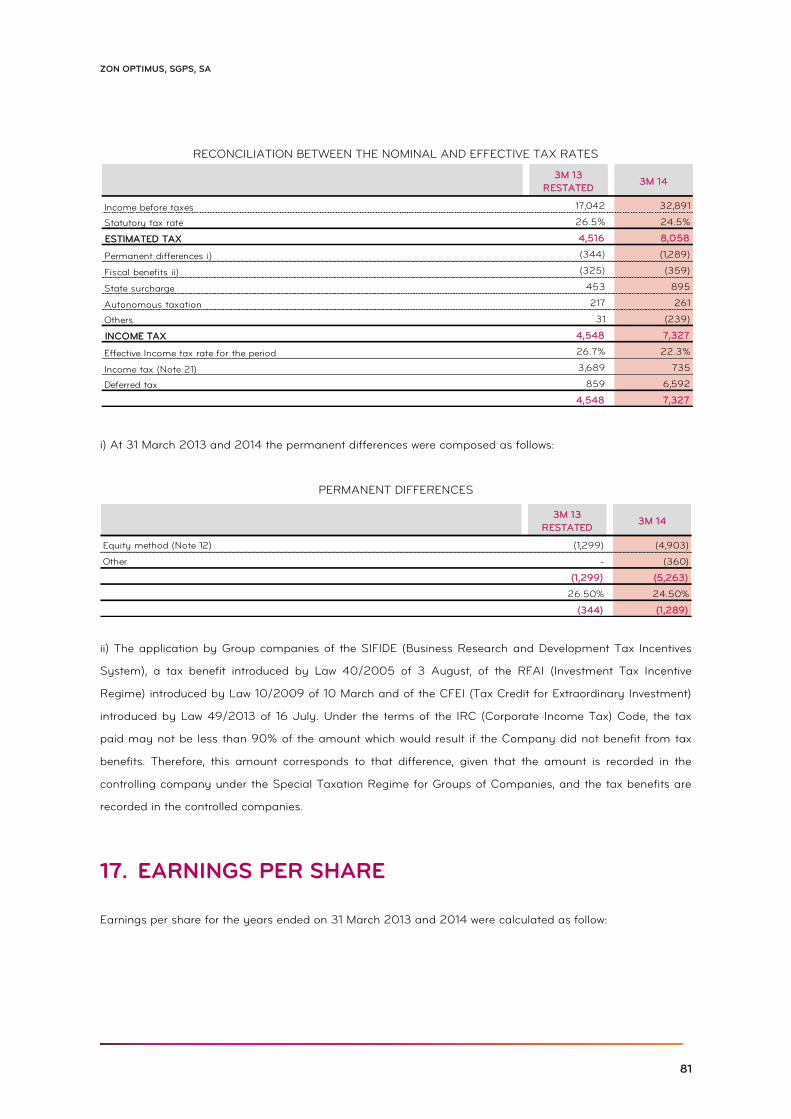
81
ZON OPTIMUS, SGPS, SA
RECONCILIATION BETWEEN THE NOMINAL AND EFFECTIVE TAX RATES
i) At 31 March 2013 and 2014 the permanent differences were composed as follows:
PERMANENT DIFFERENCES
ii) The application by Group companies of the SIFIDE (Business Research and Development Tax Incentives
System), a tax benefit introduced by Law 40/2005 of 3 August, of the RFAI (Investment Tax Incentive
Regime) introduced by Law 10/2009 of 10 March and of the CFEI (Tax Credit for Extraordinary Investment)
introduced by Law 49/2013 of 16 July. Under the terms of the IRC (Corporate Income Tax) Code, the tax
paid may not be less than 90% of the amount which would result if the Company did not benefit from tax
benefits. Therefore, this amount corresponds to that difference, given that the amount is recorded in the
controlling company under the Special Taxation Regime for Groups of Companies, and the tax benefits are
recorded in the controlled companies.
EARNINGS PER SHARE 17.
Earnings per share for the years ended on 31 March 2013 and 2014 were calculated as follow:
3M 13
RESTATED3M 14
Income before taxes 17,042 32,891
Statutory tax rate 26.5% 24.5%
ESTIMATED TAX 4,516 8,058
Permanent differences i) (344) (1,289)
Fiscal benefits ii) (325) (359)
State surcharge 453 895
Autonomous taxation 217 261
Others 31 (239)
INCOME TAX 4,548 7,327
Effective Income tax rate for the period 26.7% 22.3%
Income tax (Note 21) 3,689 735
Deferred tax 859 6,592
4,548 7,327
3M 13
RESTATED3M 14
Equity method (Note 12) (1,299) (4,903)
Other - (360)
(1,299) (5,263)
26.50% 24.50%
(344) (1,289)
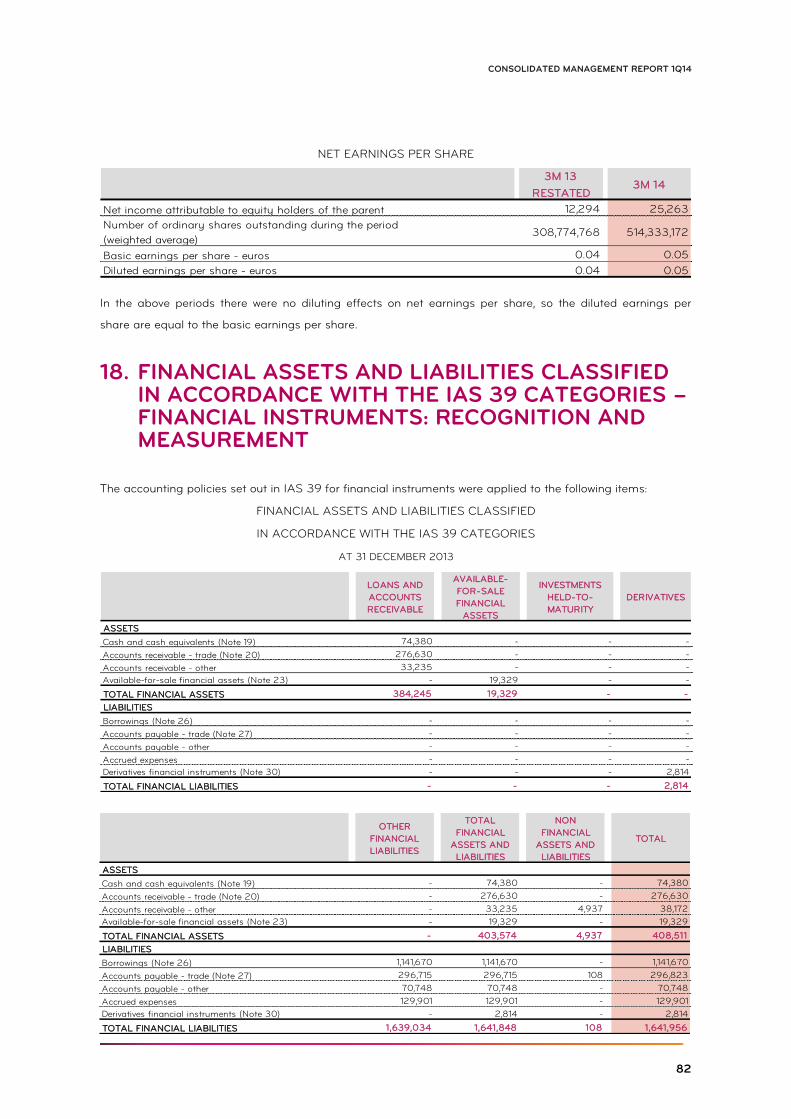
82
CONSOLIDATED MANAGEMENT REPORT 1Q14
NET EARNINGS PER SHARE
In the above periods there were no diluting effects on net earnings per share, so the diluted earnings per
share are equal to the basic earnings per share.
FINANCIAL ASSETS AND LIABILITIES CLASSIFIED 18.IN ACCORDANCE WITH THE IAS 39 CATEGORIES – FINANCIAL INSTRUMENTS: RECOGNITION AND MEASUREMENT
The accounting policies set out in IAS 39 for financial instruments were applied to the following items:
FINANCIAL ASSETS AND LIABILITIES CLASSIFIED
IN ACCORDANCE WITH THE IAS 39 CATEGORIES
AT 31 DECEMBER 2013
3M 13
RESTATED
Net income attributable to equity holders of the parent 12,294 25,263
Number of ordinary shares outstanding during the period
(weighted average)308,774,768 514,333,172
Basic earnings per share - euros 0.04 0.05
Diluted earnings per share - euros 0.04 0.05
3M 14
LOANS AND
ACCOUNTS
RECEIVABLE
AVAILABLE-
FOR-SALE
FINANCIAL
ASSETS
INVESTMENTS
HELD-TO-
MATURITY
DERIVATIVES
ASSETS
Cash and cash equivalents (Note 19) 74,380 - - -
Accounts receivable - trade (Note 20) 276,630 - - -
Accounts receivable - other 33,235 - - -
Available-for-sale financial assets (Note 23) - 19,329 - -
TOTAL FINANCIAL ASSETS 384,245 19,329 - -
LIABILITIES
Borrowings (Note 26) - - - -
Accounts payable - trade (Note 27) - - - -
Accounts payable - other - - - -
Accrued expenses - - - -
Derivatives financial instruments (Note 30) - - - 2,814
TOTAL FINANCIAL LIABILITIES - - - 2,814
OTHER
FINANCIAL
LIABILITIES
TOTAL
FINANCIAL
ASSETS AND
LIABILITIES
NON
FINANCIAL
ASSETS AND
LIABILITIES
TOTAL
ASSETS
Cash and cash equivalents (Note 19) - 74,380 - 74,380
Accounts receivable - trade (Note 20) - 276,630 - 276,630
Accounts receivable - other - 33,235 4,937 38,172
Available-for-sale financial assets (Note 23) - 19,329 - 19,329
TOTAL FINANCIAL ASSETS - 403,574 4,937 408,511
LIABILITIES
Borrowings (Note 26) 1,141,670 1,141,670 - 1,141,670
Accounts payable - trade (Note 27) 296,715 296,715 108 296,823
Accounts payable - other 70,748 70,748 - 70,748
Accrued expenses 129,901 129,901 - 129,901
Derivatives financial instruments (Note 30) - 2,814 - 2,814
TOTAL FINANCIAL LIABILITIES 1,639,034 1,641,848 108 1,641,956
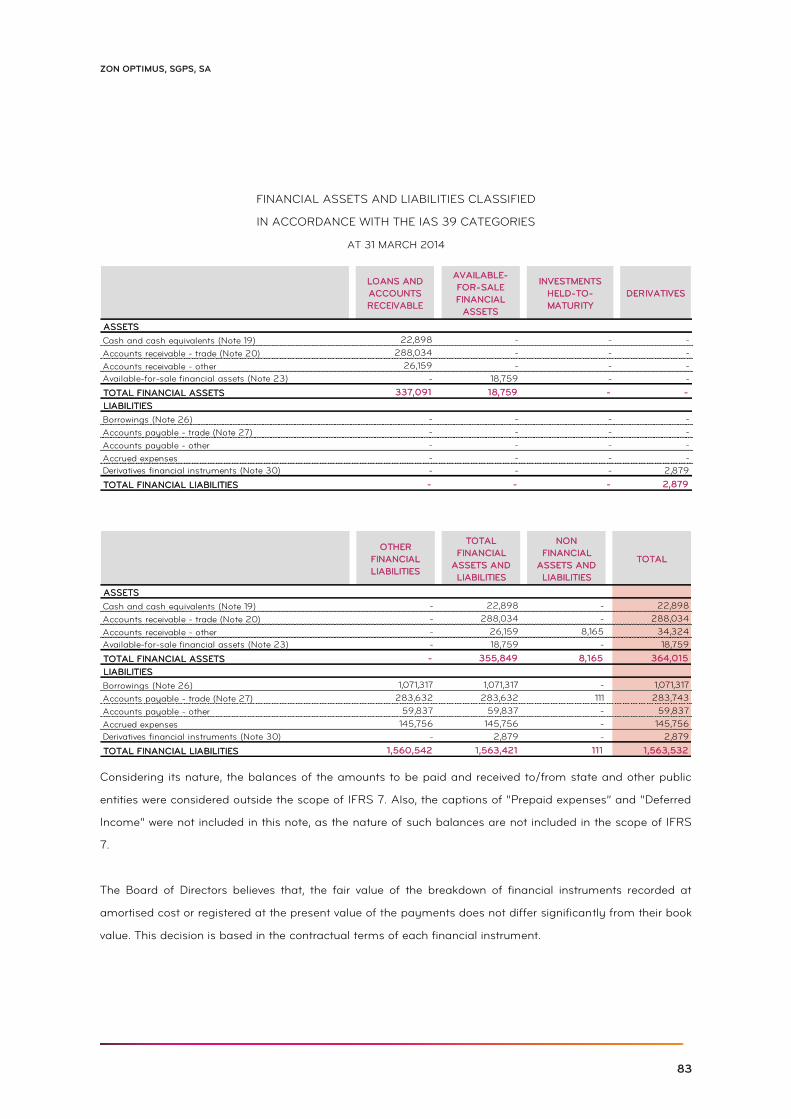
83
ZON OPTIMUS, SGPS, SA
FINANCIAL ASSETS AND LIABILITIES CLASSIFIED
IN ACCORDANCE WITH THE IAS 39 CATEGORIES
AT 31 MARCH 2014
Considering its nature, the balances of the amounts to be paid and received to/from state and other public
entities were considered outside the scope of IFRS 7. Also, the captions of “Prepaid expenses” and “Deferred
Income” were not included in this note, as the nature of such balances are not included in the scope of IFRS
7.
The Board of Directors believes that, the fair value of the breakdown of financial instruments recorded at
amortised cost or registered at the present value of the payments does not differ significantly from their book
value. This decision is based in the contractual terms of each financial instrument.
LOANS AND
ACCOUNTS
RECEIVABLE
AVAILABLE-
FOR-SALE
FINANCIAL
ASSETS
INVESTMENTS
HELD-TO-
MATURITY
DERIVATIVES
ASSETS
Cash and cash equivalents (Note 19) 22,898 - - -
Accounts receivable - trade (Note 20) 288,034 - - -
Accounts receivable - other 26,159 - - -
Available-for-sale financial assets (Note 23) - 18,759 - -
TOTAL FINANCIAL ASSETS 337,091 18,759 - -
LIABILITIES
Borrowings (Note 26) - - - -
Accounts payable - trade (Note 27) - - - -
Accounts payable - other - - - -
Accrued expenses - - - -
Derivatives financial instruments (Note 30) - - - 2,879
TOTAL FINANCIAL LIABILITIES - - - 2,879
OTHER
FINANCIAL
LIABILITIES
TOTAL
FINANCIAL
ASSETS AND
LIABILITIES
NON
FINANCIAL
ASSETS AND
LIABILITIES
TOTAL
ASSETS
Cash and cash equivalents (Note 19) - 22,898 - 22,898
Accounts receivable - trade (Note 20) - 288,034 - 288,034
Accounts receivable - other - 26,159 8,165 34,324
Available-for-sale financial assets (Note 23) - 18,759 - 18,759
TOTAL FINANCIAL ASSETS - 355,849 8,165 364,015
LIABILITIES
Borrowings (Note 26) 1,071,317 1,071,317 - 1,071,317
Accounts payable - trade (Note 27) 283,632 283,632 111 283,743
Accounts payable - other 59,837 59,837 - 59,837
Accrued expenses 145,756 145,756 - 145,756
Derivatives financial instruments (Note 30) - 2,879 - 2,879
TOTAL FINANCIAL LIABILITIES 1,560,542 1,563,421 111 1,563,532
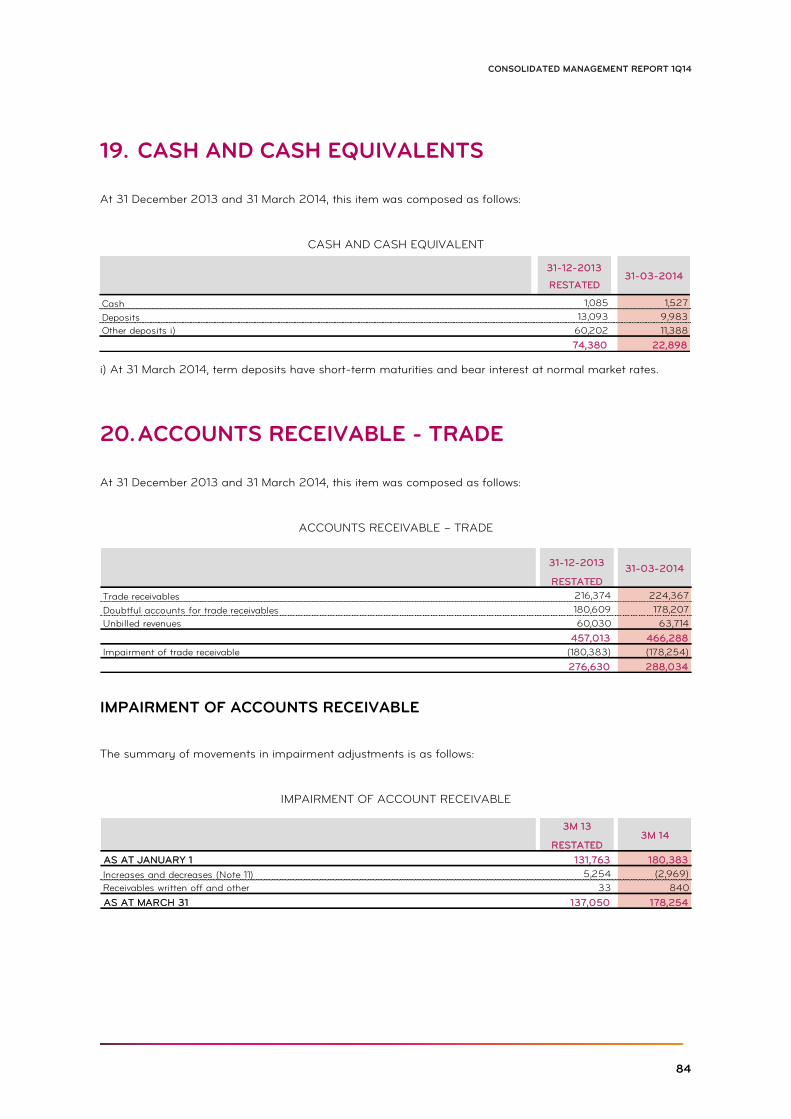
84
CONSOLIDATED MANAGEMENT REPORT 1Q14
CASH AND CASH EQUIVALENTS 19.
At 31 December 2013 and 31 March 2014, this item was composed as follows:
CASH AND CASH EQUIVALENT
i) At 31 March 2014, term deposits have short-term maturities and bear interest at normal market rates.
ACCOUNTS RECEIVABLE - TRADE 20.
At 31 December 2013 and 31 March 2014, this item was composed as follows:
ACCOUNTS RECEIVABLE – TRADE
IMPAIRMENT OF ACCOUNTS RECEIVABLE
The summary of movements in impairment adjustments is as follows:
IMPAIRMENT OF ACCOUNT RECEIVABLE
31-12-2013
RESTATED
Cash 1,085 1,527
Deposits 13,093 9,983
Other deposits i) 60,202 11,388
74,380 22,898
31-03-2014
31-12-2013
RESTATED
Trade receivables 216,374 224,367
Doubtful accounts for trade receivables 180,609 178,207
Unbilled revenues 60,030 63,714
457,013 466,288
Impairment of trade receivable (180,383) (178,254)
276,630 288,034
31-03-2014
3M 13
RESTATED
AS AT JANUARY 1 131,763 180,383
Increases and decreases (Note 11) 5,254 (2,969)
Receivables written off and other 33 840
AS AT MARCH 31 137,050 178,254
3M 14
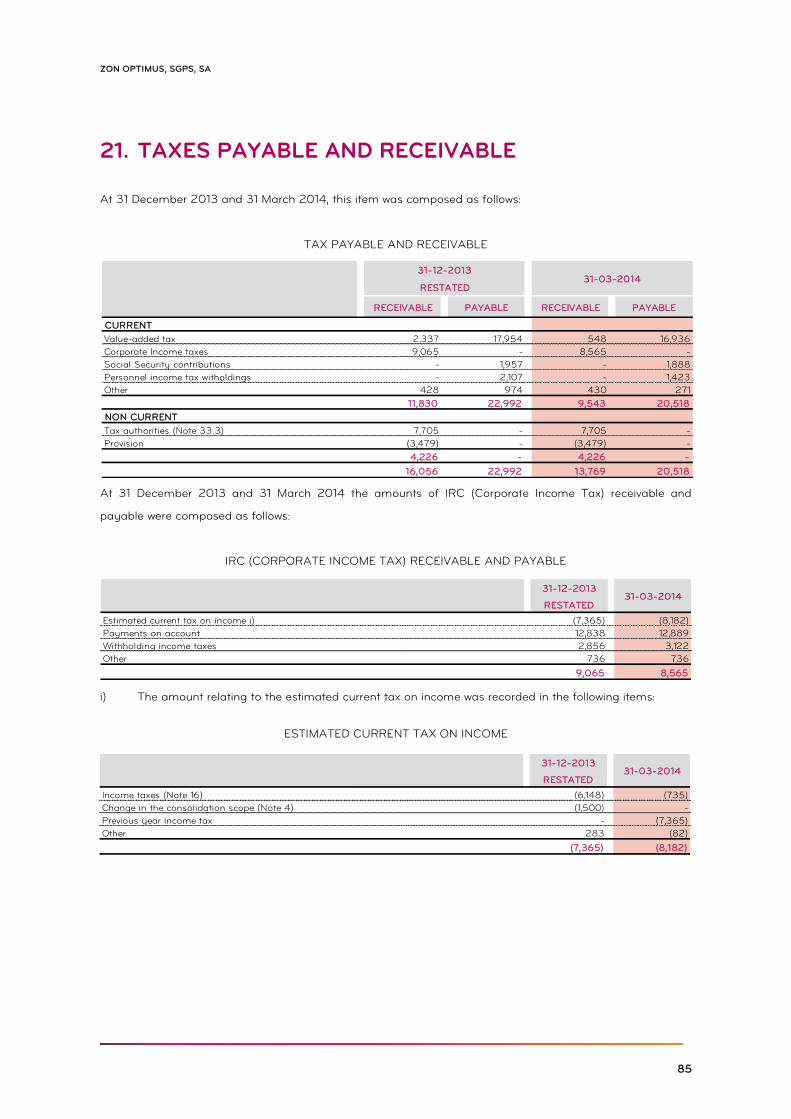
85
ZON OPTIMUS, SGPS, SA
TAXES PAYABLE AND RECEIVABLE 21.
At 31 December 2013 and 31 March 2014, this item was composed as follows:
TAX PAYABLE AND RECEIVABLE
At 31 December 2013 and 31 March 2014 the amounts of IRC (Corporate Income Tax) receivable and
payable were composed as follows:
IRC (CORPORATE INCOME TAX) RECEIVABLE AND PAYABLE
i) The amount relating to the estimated current tax on income was recorded in the following items:
ESTIMATED CURRENT TAX ON INCOME
31-12-2013
RESTATED
Estimated current tax on income i) (7,365) (8,182)
Payments on account 12,838 12,889
Withholding income taxes 2,856 3,122
Other 736 736
9,065 8,565
31-03-2014
31-12-2013
RESTATED
Income taxes (Note 16) (6,148) (735)
Change in the consolidation scope (Note 4) (1,500) -
Previous year income tax - (7,365)
Other 283 (82)
(7,365) (8,182)
31-03-2014
RESTATED
RECEIVABLE PAYABLE RECEIVABLE PAYABLE
CURRENT
Value-added tax 2,337 17,954 548 16,936
Corporate Income taxes 9,065 - 8,565 -
Social Security contributions - 1,957 - 1,888
Personnel income tax witholdings - 2,107 - 1,423
Other 428 974 430 271
11,830 22,992 9,543 20,518
NON CURRENT
Tax authorities (Note 33.3) 7,705 - 7,705 -
Provision (3,479) - (3,479) -
4,226 - 4,226 -
16,056 22,992 13,769 20,518
31-12-201331-03-2014
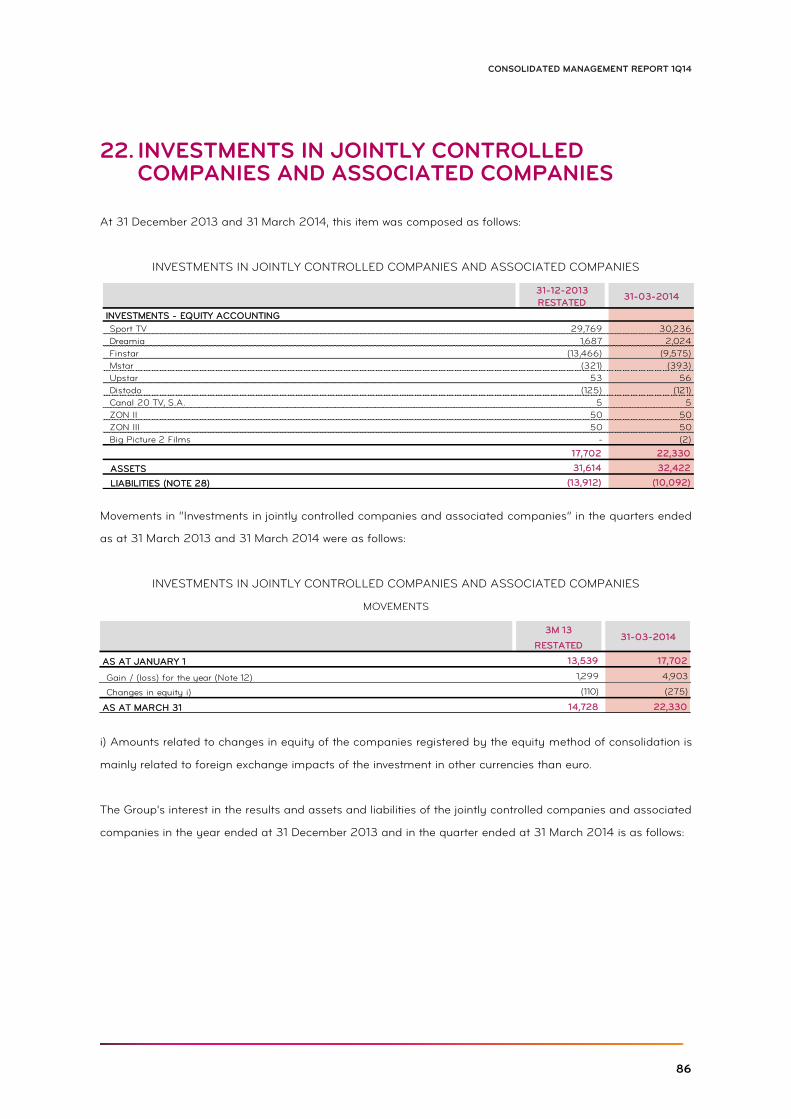
86
CONSOLIDATED MANAGEMENT REPORT 1Q14
INVESTMENTS IN JOINTLY CONTROLLED 22.COMPANIES AND ASSOCIATED COMPANIES
At 31 December 2013 and 31 March 2014, this item was composed as follows:
INVESTMENTS IN JOINTLY CONTROLLED COMPANIES AND ASSOCIATED COMPANIES
Movements in “Investments in jointly controlled companies and associated companies” in the quarters ended
as at 31 March 2013 and 31 March 2014 were as follows:
INVESTMENTS IN JOINTLY CONTROLLED COMPANIES AND ASSOCIATED COMPANIES
MOVEMENTS
i) Amounts related to changes in equity of the companies registered by the equity method of consolidation is
mainly related to foreign exchange impacts of the investment in other currencies than euro.
The Group's interest in the results and assets and liabilities of the jointly controlled companies and associated
companies in the year ended at 31 December 2013 and in the quarter ended at 31 March 2014 is as follows:
31-12-2013
RESTATED
INVESTMENTS - EQUITY ACCOUNTING
Sport TV 29,769 30,236
Dreamia 1,687 2,024
Finstar (13,466) (9,575)
Mstar (321) (393)
Upstar 53 56
Distodo (125) (121)
Canal 20 TV, S.A. 5 5
ZON II 50 50
ZON III 50 50
Big Picture 2 Films - (2)
17,702 22,330
ASSETS 31,614 32,422
LIABILITIES (NOTE 28) (13,912) (10,092)
31-03-2014
3M 13
RESTATED
AS AT JANUARY 1 13,539 17,702
Gain / (loss) for the year (Note 12) 1,299 4,903
Changes in equity i) (110) (275)
AS AT MARCH 31 14,728 22,330
31-03-2014
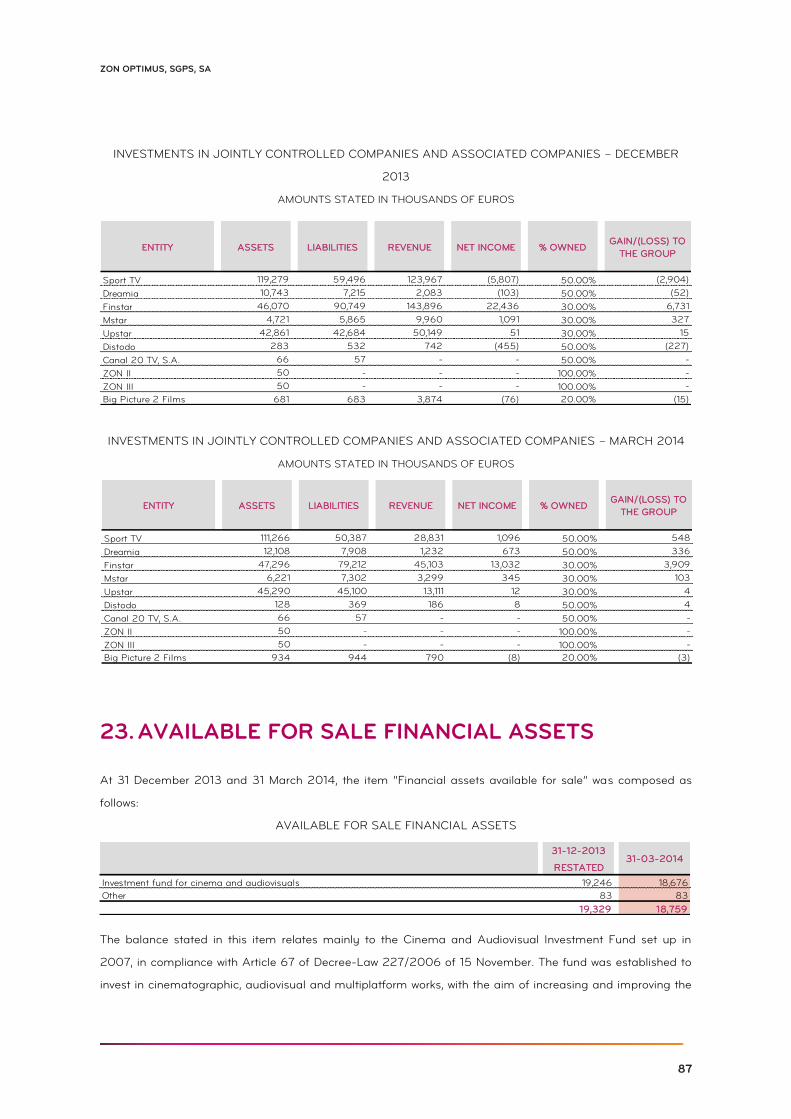
87
ZON OPTIMUS, SGPS, SA
INVESTMENTS IN JOINTLY CONTROLLED COMPANIES AND ASSOCIATED COMPANIES – DECEMBER
2013
AMOUNTS STATED IN THOUSANDS OF EUROS
INVESTMENTS IN JOINTLY CONTROLLED COMPANIES AND ASSOCIATED COMPANIES – MARCH 2014
AMOUNTS STATED IN THOUSANDS OF EUROS
AVAILABLE FOR SALE FINANCIAL ASSETS 23.
At 31 December 2013 and 31 March 2014, the item “Financial assets available for sale” was composed as
follows:
AVAILABLE FOR SALE FINANCIAL ASSETS
The balance stated in this item relates mainly to the Cinema and Audiovisual Investment Fund set up in
2007, in compliance with Article 67 of Decree-Law 227/2006 of 15 November. The fund was established to
invest in cinematographic, audiovisual and multiplatform works, with the aim of increasing and improving the
ENTITY ASSETS LIABILITIES REVENUE NET INCOME % OWNEDGAIN/(LOSS) TO
THE GROUP
Sport TV 119,279 59,496 123,967 (5,807) 50.00% (2,904)
Dreamia 10,743 7,215 2,083 (103) 50.00% (52)
Finstar 46,070 90,749 143,896 22,436 30.00% 6,731
Mstar 4,721 5,865 9,960 1,091 30.00% 327
Upstar 42,861 42,684 50,149 51 30.00% 15
Distodo 283 532 742 (455) 50.00% (227)
Canal 20 TV, S.A. 66 57 - - 50.00% -
ZON II 50 - - - 100.00% -
ZON III 50 - - - 100.00% -
Big Picture 2 Films 681 683 3,874 (76) 20.00% (15)
ENTITY ASSETS LIABILITIES REVENUE NET INCOME % OWNEDGAIN/(LOSS) TO
THE GROUP
Sport TV 111,266 50,387 28,831 1,096 50.00% 548
Dreamia 12,108 7,908 1,232 673 50.00% 336
Finstar 47,296 79,212 45,103 13,032 30.00% 3,909
Mstar 6,221 7,302 3,299 345 30.00% 103
Upstar 45,290 45,100 13,111 12 30.00% 4
Distodo 128 369 186 8 50.00% 4
Canal 20 TV, S.A. 66 57 - - 50.00% -
ZON II 50 - - - 100.00% -
ZON III 50 - - - 100.00% -
Big Picture 2 Films 934 944 790 (8) 20.00% (3)
31-12-2013
RESTATED
Investment fund for cinema and audiovisuals 19,246 18,676
Other 83 83
19,329 18,759
31-03-2014
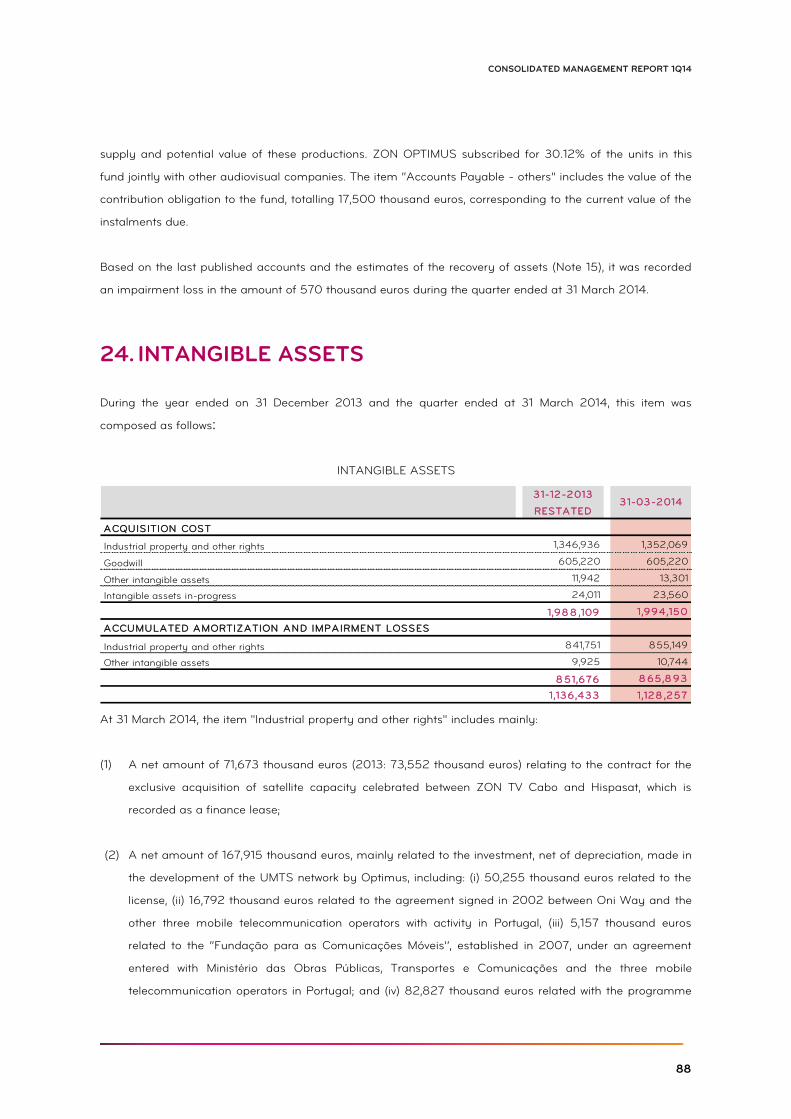
88
CONSOLIDATED MANAGEMENT REPORT 1Q14
supply and potential value of these productions. ZON OPTIMUS subscribed for 30.12% of the units in this
fund jointly with other audiovisual companies. The item “Accounts Payable - others” includes the value of the
contribution obligation to the fund, totalling 17,500 thousand euros, corresponding to the current value of the
instalments due.
Based on the last published accounts and the estimates of the recovery of assets (Note 15), it was recorded
an impairment loss in the amount of 570 thousand euros during the quarter ended at 31 March 2014.
INTANGIBLE ASSETS 24.
During the year ended on 31 December 2013 and the quarter ended at 31 March 2014, this item was
composed as follows:
INTANGIBLE ASSETS
At 31 March 2014, the item "Industrial property and other rights" includes mainly:
(1) A net amount of 71,673 thousand euros (2013: 73,552 thousand euros) relating to the contract for the
exclusive acquisition of satellite capacity celebrated between ZON TV Cabo and Hispasat, which is
recorded as a finance lease;
(2) A net amount of 167,915 thousand euros, mainly related to the investment, net of depreciation, made in
the development of the UMTS network by Optimus, including: (i) 50,255 thousand euros related to the
license, (ii) 16,792 thousand euros related to the agreement signed in 2002 between Oni Way and the
other three mobile telecommunication operators with activity in Portugal, (iii) 5,157 thousand euros
related to the “Fundação para as Comunicações Móveis’’, established in 2007, under an agreement
entered with Ministério das Obras Públicas, Transportes e Comunicações and the three mobile
telecommunication operators in Portugal; and (iv) 82,827 thousand euros related with the programme
31-12-2013
RESTATED
ACQUISITION COST
Industrial property and other rights 1,346,936 1,352,069
Goodwill 605,220 605,220
Other intangible assets 11,942 13,301
Intangible assets in-progress 24,011 23,560
1,98 8 ,109 1,994,150
ACCUMULATED AMORTIZATION AND IMPAIRMENT LOSSES
Industrial property and other rights 841,751 855,149
Other intangible assets 9,925 10,744
8 51,676 8 65,8 93
1,136 ,433 1,128 ,257
31-03-2014
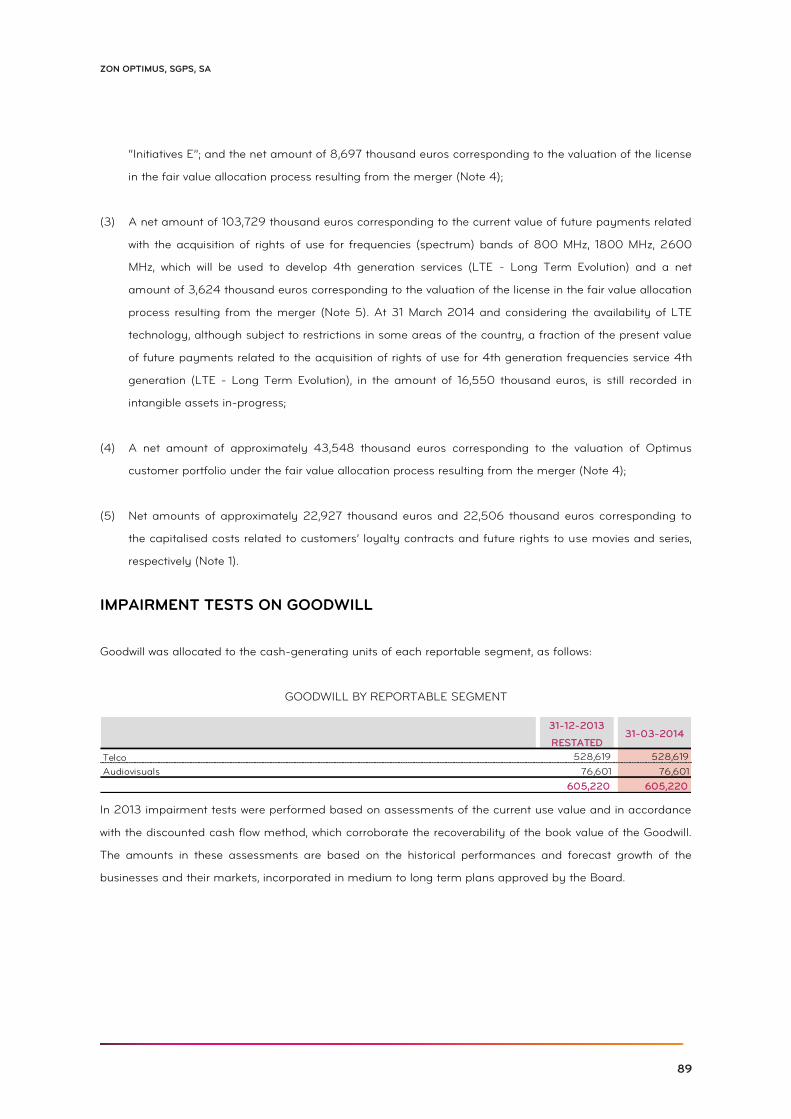
89
ZON OPTIMUS, SGPS, SA
“Initiatives E”; and the net amount of 8,697 thousand euros corresponding to the valuation of the license
in the fair value allocation process resulting from the merger (Note 4);
(3) A net amount of 103,729 thousand euros corresponding to the current value of future payments related
with the acquisition of rights of use for frequencies (spectrum) bands of 800 MHz, 1800 MHz, 2600
MHz, which will be used to develop 4th generation services (LTE - Long Term Evolution) and a net
amount of 3,624 thousand euros corresponding to the valuation of the license in the fair value allocation
process resulting from the merger (Note 5). At 31 March 2014 and considering the availability of LTE
technology, although subject to restrictions in some areas of the country, a fraction of the present value
of future payments related to the acquisition of rights of use for 4th generation frequencies service 4th
generation (LTE - Long Term Evolution), in the amount of 16,550 thousand euros, is still recorded in
intangible assets in-progress;
(4) A net amount of approximately 43,548 thousand euros corresponding to the valuation of Optimus
customer portfolio under the fair value allocation process resulting from the merger (Note 4);
(5) Net amounts of approximately 22,927 thousand euros and 22,506 thousand euros corresponding to
the capitalised costs related to customers’ loyalty contracts and future rights to use movies and series,
respectively (Note 1).
IMPAIRMENT TESTS ON GOODWILL
Goodwill was allocated to the cash-generating units of each reportable segment, as follows:
GOODWILL BY REPORTABLE SEGMENT
In 2013 impairment tests were performed based on assessments of the current use value and in accordance
with the discounted cash flow method, which corroborate the recoverability of the book value of the Goodwill.
The amounts in these assessments are based on the historical performances and forecast growth of the
businesses and their markets, incorporated in medium to long term plans approved by the Board.
31-12-2013
RESTATED
Telco 528,619 528,619
Audiovisuals 76,601 76,601
605,220 605,220
31-03-2014
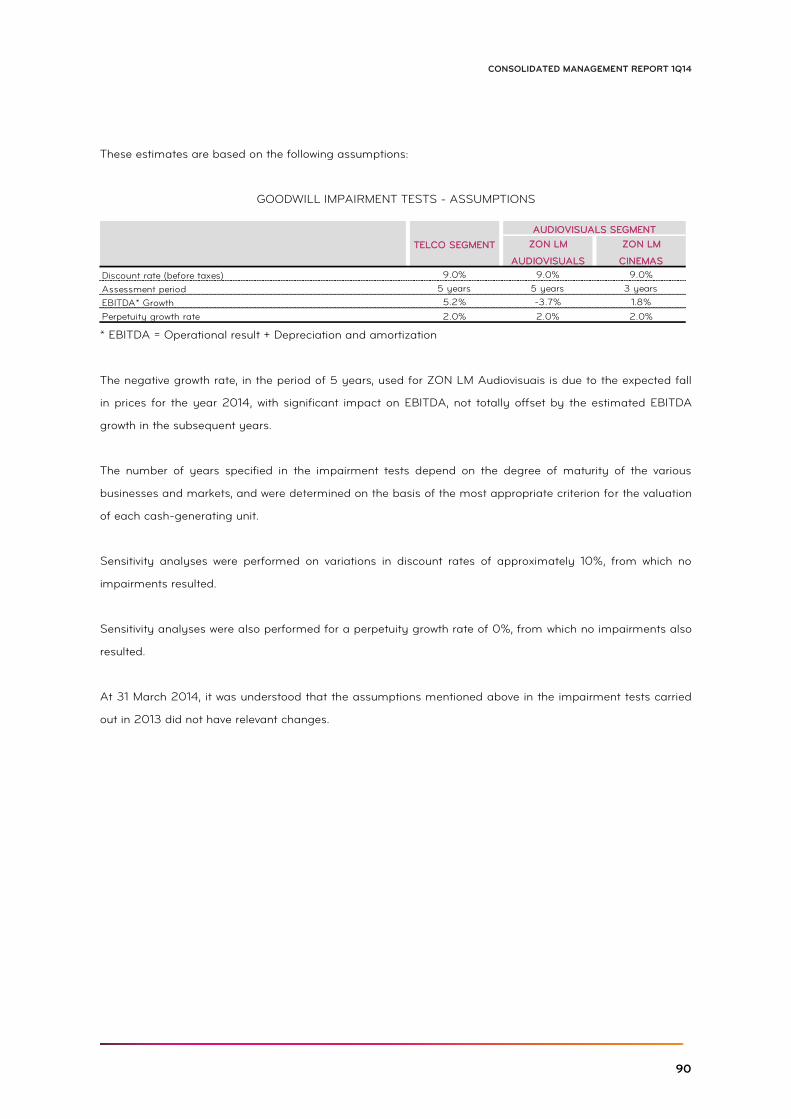
90
CONSOLIDATED MANAGEMENT REPORT 1Q14
These estimates are based on the following assumptions:
GOODWILL IMPAIRMENT TESTS - ASSUMPTIONS
* EBITDA = Operational result + Depreciation and amortization
The negative growth rate, in the period of 5 years, used for ZON LM Audiovisuais is due to the expected fall
in prices for the year 2014, with significant impact on EBITDA, not totally offset by the estimated EBITDA
growth in the subsequent years.
The number of years specified in the impairment tests depend on the degree of maturity of the various
businesses and markets, and were determined on the basis of the most appropriate criterion for the valuation
of each cash-generating unit.
Sensitivity analyses were performed on variations in discount rates of approximately 10%, from which no
impairments resulted.
Sensitivity analyses were also performed for a perpetuity growth rate of 0%, from which no impairments also
resulted.
At 31 March 2014, it was understood that the assumptions mentioned above in the impairment tests carried
out in 2013 did not have relevant changes.
ZON LM ZON LM
AUDIOVISUALS CINEMAS
Discount rate (before taxes) 9.0% 9.0% 9.0%
Assessment period 5 years 5 years 3 years
EBITDA* Growth 5.2% -3.7% 1.8%
Perpetuity growth rate 2.0% 2.0% 2.0%
TELCO SEGMENT
AUDIOVISUALS SEGMENT
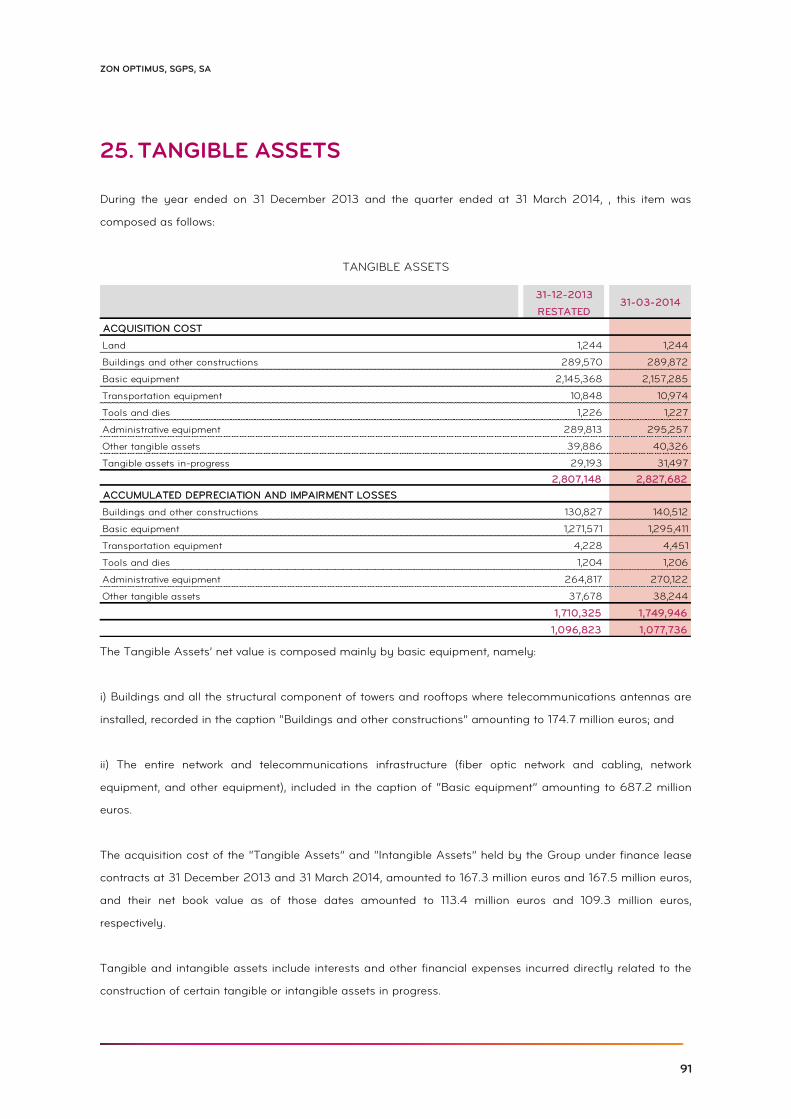
91
ZON OPTIMUS, SGPS, SA
TANGIBLE ASSETS 25.
During the year ended on 31 December 2013 and the quarter ended at 31 March 2014, , this item was
composed as follows:
TANGIBLE ASSETS
The Tangible Assets’ net value is composed mainly by basic equipment, namely:
i) Buildings and all the structural component of towers and rooftops where telecommunications antennas are
installed, recorded in the caption “Buildings and other constructions” amounting to 174.7 million euros; and
ii) The entire network and telecommunications infrastructure (fiber optic network and cabling, network
equipment, and other equipment), included in the caption of “Basic equipment” amounting to 687.2 million
euros.
The acquisition cost of the “Tangible Assets” and “Intangible Assets” held by the Group under finance lease
contracts at 31 December 2013 and 31 March 2014, amounted to 167.3 million euros and 167.5 million euros,
and their net book value as of those dates amounted to 113.4 million euros and 109.3 million euros,
respectively.
Tangible and intangible assets include interests and other financial expenses incurred directly related to the
construction of certain tangible or intangible assets in progress.
31-12-2013
RESTATED
ACQUISITION COST
Land 1,244 1,244
Buildings and other constructions 289,570 289,872
Basic equipment 2,145,368 2,157,285
Transportation equipment 10,848 10,974
Tools and dies 1,226 1,227
Administrative equipment 289,813 295,257
Other tangible assets 39,886 40,326
Tangible assets in-progress 29,193 31,497
2,807,148 2,827,682
ACCUMULATED DEPRECIATION AND IMPAIRMENT LOSSES
Buildings and other constructions 130,827 140,512
Basic equipment 1,271,571 1,295,411
Transportation equipment 4,228 4,451
Tools and dies 1,204 1,206
Administrative equipment 264,817 270,122
Other tangible assets 37,678 38,244
1,710,325 1,749,946
1,096,823 1,077,736
31-03-2014
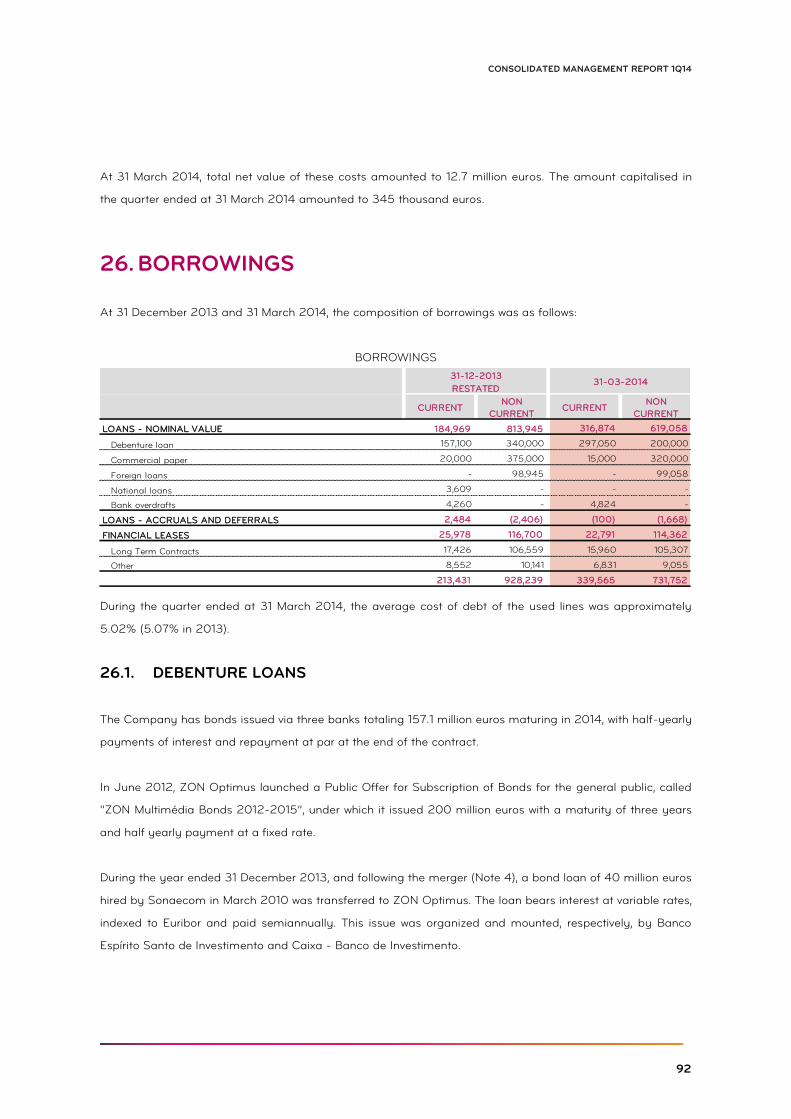
92
CONSOLIDATED MANAGEMENT REPORT 1Q14
At 31 March 2014, total net value of these costs amounted to 12.7 million euros. The amount capitalised in
the quarter ended at 31 March 2014 amounted to 345 thousand euros.
BORROWINGS 26.
At 31 December 2013 and 31 March 2014, the composition of borrowings was as follows:
BORROWINGS
During the quarter ended at 31 March 2014, the average cost of debt of the used lines was approximately
5.02% (5.07% in 2013).
26.1. DEBENTURE LOANS
The Company has bonds issued via three banks totaling 157.1 million euros maturing in 2014, with half-yearly
payments of interest and repayment at par at the end of the contract.
In June 2012, ZON Optimus launched a Public Offer for Subscription of Bonds for the general public, called
"ZON Multimédia Bonds 2012-2015”, under which it issued 200 million euros with a maturity of three years
and half yearly payment at a fixed rate.
During the year ended 31 December 2013, and following the merger (Note 4), a bond loan of 40 million euros
hired by Sonaecom in March 2010 was transferred to ZON Optimus. The loan bears interest at variable rates,
indexed to Euribor and paid semiannually. This issue was organized and mounted, respectively, by Banco
Espírito Santo de Investimento and Caixa - Banco de Investimento.
RESTATED
CURRENTNON
CURRENTCURRENT
NON
CURRENT
LOANS - NOMINAL VALUE 184,969 813,945 316,874 619,058
Debenture loan 157,100 340,000 297,050 200,000
Commercial paper 20,000 375,000 15,000 320,000
Foreign loans - 98,945 - 99,058
National loans 3,609 - - -
Bank overdrafts 4,260 - 4,824 -
LOANS - ACCRUALS AND DEFERRALS 2,484 (2,406) (100) (1,668)
FINANCIAL LEASES 25,978 116,700 22,791 114,362
Long Term Contracts 17,426 106,559 15,960 105,307
Other 8,552 10,141 6,831 9,055
213,431 928,239 339,565 731,752
31-12-201331-03-2014
93
ZON OPTIMUS, SGPS, SA
After the merger a bond loan of 100 million euros hired by Sonaecom in September 2011 was also
transferred to ZON OPTIMUS. The loan bears interest at variable rates, indexed to Euribor and paid
semiannually. This issue was organized and mounted by BNP Paribas, ING Belgium SA/NV and Portigon AG
(formerly known as WestLB AG). During the year ended 31 December 2013, Portigon AG transferred its entire
stake of 33.3 million euros in bonds to Erste Abwicklungsanstalt ("EAA"), a German state entity.
The amount of 5,540 thousand euros, corresponding to interest and commissions, was deducted from this
amount and recorded in the item ‘Loans - accruals and deferrals’.
26.2. COMMERCIAL PAPER
The Company has borrowings of 335 million euros, in the form of commercial paper contracted with six
banks, corresponding to five programs, earning interest at market rates. Grouped commercial paper
programmes with maturities over 1 year totaling 320 million euros are classified as non-current, since the
Company has the ability to unilaterally renew the current issues on or before the programmes’ maturity dates
and because they are underwritten by the organizer. This amount, although it has current maturity, was
classified as non-current for purposes of presentation in the statement of financial position. The remaining
programmes, given the schedule settlement dates, are classified as current.
An amount of 7,413 thousand euros, corresponding to interest and commissions, was deducted from this
amount.
26.3. FOREIGN LOANS
In September 2009, ZON Optimus and ZON TV Cabo signed a Next Generation Network Project Finance
Contract with the European Investment Bank in the amount of 100 million euros. This contract matures in
September 2015 and is intended for investments relating to the implementation of the next generation
network. An amount of 942 thousand euros was deducted from this amount, corresponding to the benefit
associated with the fact that the loan is at a subsidized rate.
Additionally, in November 2013, ZON Optimus signed a Finance Contract with the European Investment Bank
in the amount of 110 million euros to support the development of the mobile broadband network in Portugal.
This contract matures in a maximum period of 8 years from the use of the funds, that did not happen as at
31 March 2014.
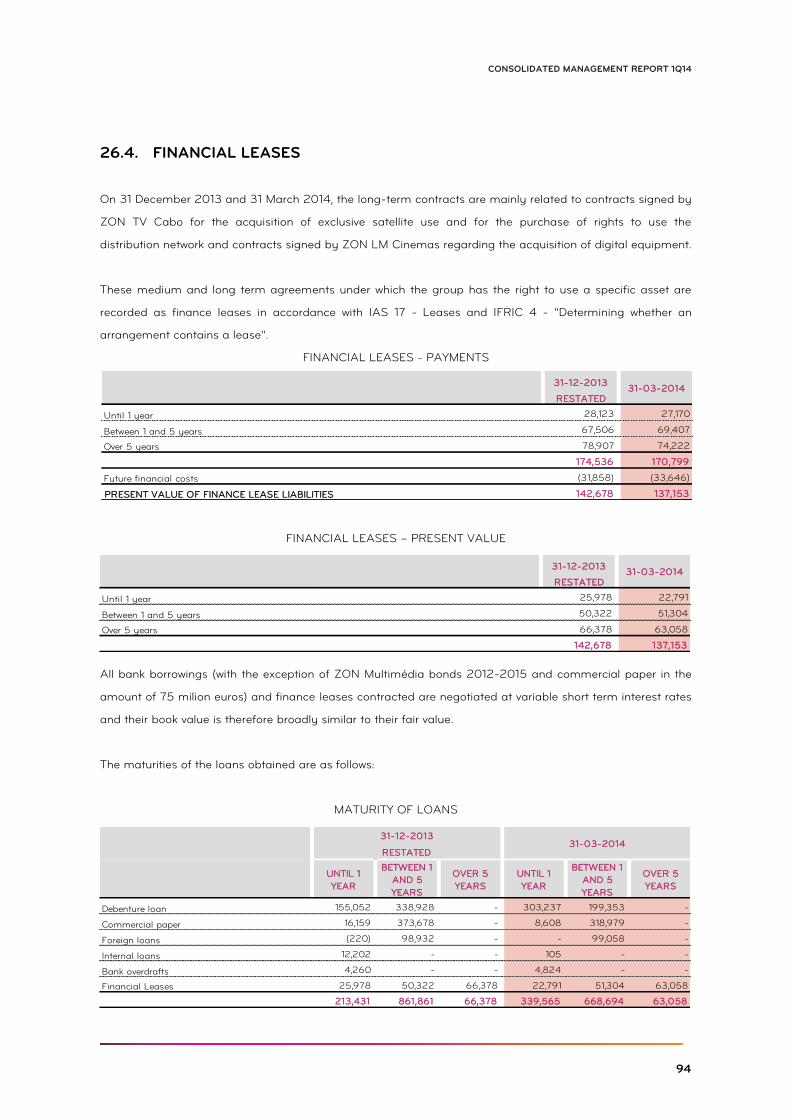
94
CONSOLIDATED MANAGEMENT REPORT 1Q14
26.4. FINANCIAL LEASES
On 31 December 2013 and 31 March 2014, the long-term contracts are mainly related to contracts signed by
ZON TV Cabo for the acquisition of exclusive satellite use and for the purchase of rights to use the
distribution network and contracts signed by ZON LM Cinemas regarding the acquisition of digital equipment.
These medium and long term agreements under which the group has the right to use a specific asset are
recorded as finance leases in accordance with IAS 17 - Leases and IFRIC 4 - "Determining whether an
arrangement contains a lease".
FINANCIAL LEASES - PAYMENTS
FINANCIAL LEASES – PRESENT VALUE
All bank borrowings (with the exception of ZON Multimédia bonds 2012-2015 and commercial paper in the
amount of 75 milion euros) and finance leases contracted are negotiated at variable short term interest rates
and their book value is therefore broadly similar to their fair value.
The maturities of the loans obtained are as follows:
MATURITY OF LOANS
31-12-2013
RESTATED
Until 1 year 28,123 27,170
Between 1 and 5 years 67,506 69,407
Over 5 years 78,907 74,222
174,536 170,799
Future financial costs (31,858) (33,646)
PRESENT VALUE OF FINANCE LEASE LIABILITIES 142,678 137,153
31-03-2014
31-12-2013
RESTATED
Until 1 year 25,978 22,791
Between 1 and 5 years 50,322 51,304
Over 5 years 66,378 63,058
142,678 137,153
31-03-2014
RESTATED
UNTIL 1
YEAR
BETWEEN 1
AND 5
YEARS
OVER 5
YEARS
UNTIL 1
YEAR
BETWEEN 1
AND 5
YEARS
OVER 5
YEARS
Debenture loan 155,052 338,928 - 303,237 199,353 -
Commercial paper 16,159 373,678 - 8,608 318,979 -
Foreign loans (220) 98,932 - - 99,058 -
Internal loans 12,202 - - 105 - -
Bank overdrafts 4,260 - - 4,824 - -
Financial Leases 25,978 50,322 66,378 22,791 51,304 63,058
213,431 861,861 66,378 339,565 668,694 63,058
31-12-201331-03-2014
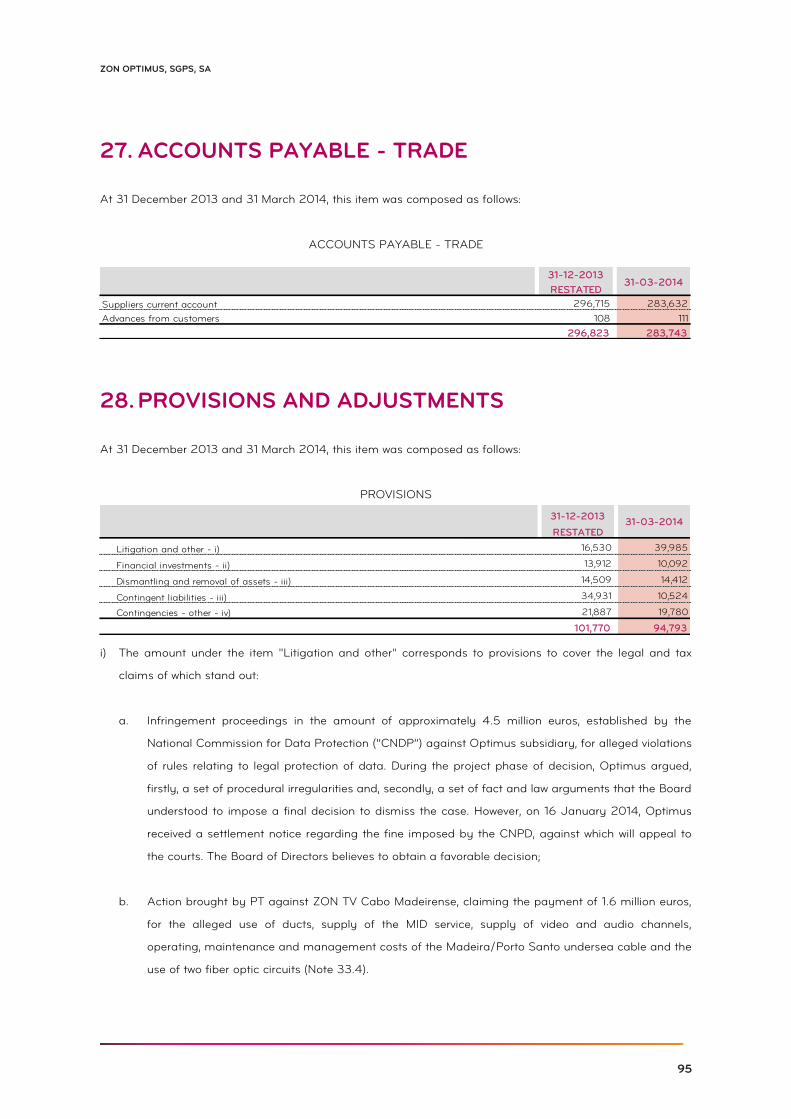
95
ZON OPTIMUS, SGPS, SA
ACCOUNTS PAYABLE - TRADE 27.
At 31 December 2013 and 31 March 2014, this item was composed as follows:
ACCOUNTS PAYABLE - TRADE
PROVISIONS AND ADJUSTMENTS 28.
At 31 December 2013 and 31 March 2014, this item was composed as follows:
PROVISIONS
i) The amount under the item "Litigation and other" corresponds to provisions to cover the legal and tax
claims of which stand out:
a. Infringement proceedings in the amount of approximately 4.5 million euros, established by the
National Commission for Data Protection (“CNDP”) against Optimus subsidiary, for alleged violations
of rules relating to legal protection of data. During the project phase of decision, Optimus argued,
firstly, a set of procedural irregularities and, secondly, a set of fact and law arguments that the Board
understood to impose a final decision to dismiss the case. However, on 16 January 2014, Optimus
received a settlement notice regarding the fine imposed by the CNPD, against which will appeal to
the courts. The Board of Directors believes to obtain a favorable decision;
b. Action brought by PT against ZON TV Cabo Madeirense, claiming the payment of 1.6 million euros,
for the alleged use of ducts, supply of the MID service, supply of video and audio channels,
operating, maintenance and management costs of the Madeira/Porto Santo undersea cable and the
use of two fiber optic circuits (Note 33.4).
31-12-2013
RESTATED
Suppliers current account 296,715 283,632
Advances from customers 108 111
296,823 283,743
31-03-2014
31-12-2013
RESTATED
Litigation and other - i) 16,530 39,985
Financial investments - ii) 13,912 10,092
Dismantling and removal of assets - iii) 14,509 14,412
Contingent liabilities - iii) 34,931 10,524
Contingencies - other - iv) 21,887 19,780
101,770 94,793
31-03-2014
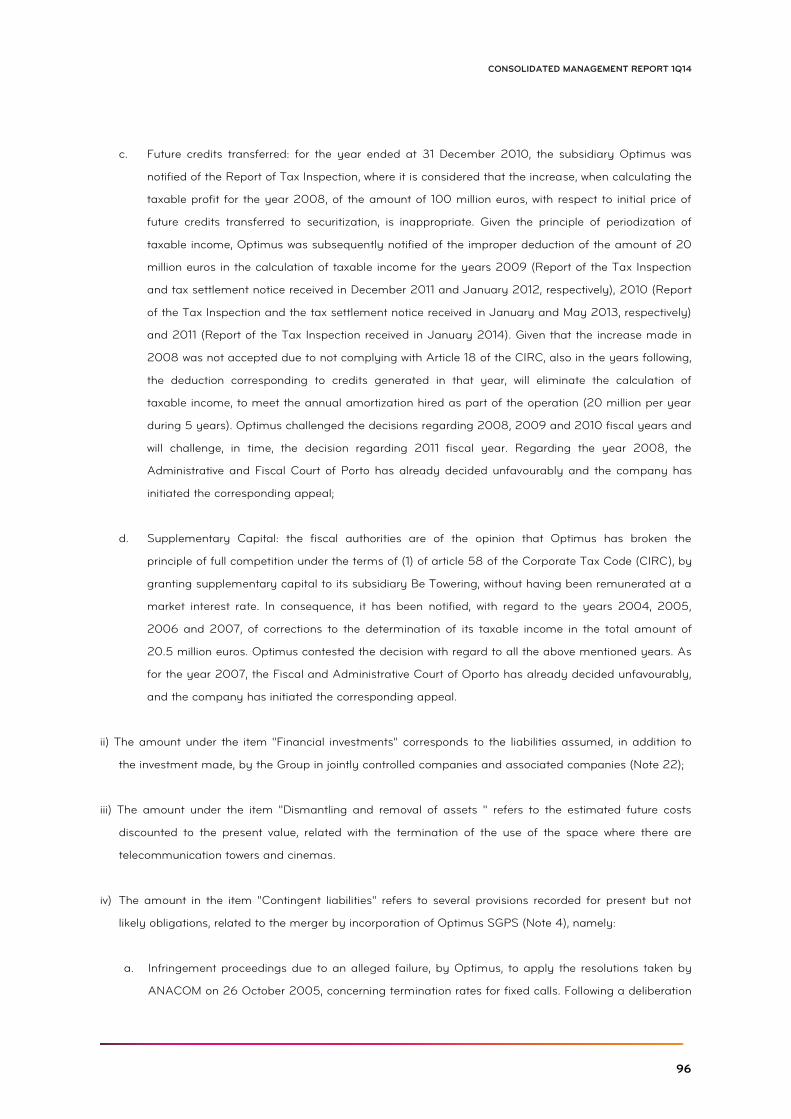
96
CONSOLIDATED MANAGEMENT REPORT 1Q14
c. Future credits transferred: for the year ended at 31 December 2010, the subsidiary Optimus was
notified of the Report of Tax Inspection, where it is considered that the increase, when calculating the
taxable profit for the year 2008, of the amount of 100 million euros, with respect to initial price of
future credits transferred to securitization, is inappropriate. Given the principle of periodization of
taxable income, Optimus was subsequently notified of the improper deduction of the amount of 20
million euros in the calculation of taxable income for the years 2009 (Report of the Tax Inspection
and tax settlement notice received in December 2011 and January 2012, respectively), 2010 (Report
of the Tax Inspection and the tax settlement notice received in January and May 2013, respectively)
and 2011 (Report of the Tax Inspection received in January 2014). Given that the increase made in
2008 was not accepted due to not complying with Article 18 of the CIRC, also in the years following,
the deduction corresponding to credits generated in that year, will eliminate the calculation of
taxable income, to meet the annual amortization hired as part of the operation (20 million per year
during 5 years). Optimus challenged the decisions regarding 2008, 2009 and 2010 fiscal years and
will challenge, in time, the decision regarding 2011 fiscal year. Regarding the year 2008, the
Administrative and Fiscal Court of Porto has already decided unfavourably and the company has
initiated the corresponding appeal;
d. Supplementary Capital: the fiscal authorities are of the opinion that Optimus has broken the
principle of full competition under the terms of (1) of article 58 of the Corporate Tax Code (CIRC), by
granting supplementary capital to its subsidiary Be Towering, without having been remunerated at a
market interest rate. In consequence, it has been notified, with regard to the years 2004, 2005,
2006 and 2007, of corrections to the determination of its taxable income in the total amount of
20.5 million euros. Optimus contested the decision with regard to all the above mentioned years. As
for the year 2007, the Fiscal and Administrative Court of Oporto has already decided unfavourably,
and the company has initiated the corresponding appeal.
ii) The amount under the item "Financial investments" corresponds to the liabilities assumed, in addition to
the investment made, by the Group in jointly controlled companies and associated companies (Note 22);
iii) The amount under the item "Dismantling and removal of assets " refers to the estimated future costs
discounted to the present value, related with the termination of the use of the space where there are
telecommunication towers and cinemas.
iv) The amount in the item "Contingent liabilities" refers to several provisions recorded for present but not
likely obligations, related to the merger by incorporation of Optimus SGPS (Note 4), namely:
a. Infringement proceedings due to an alleged failure, by Optimus, to apply the resolutions taken by
ANACOM on 26 October 2005, concerning termination rates for fixed calls. Following a deliberation
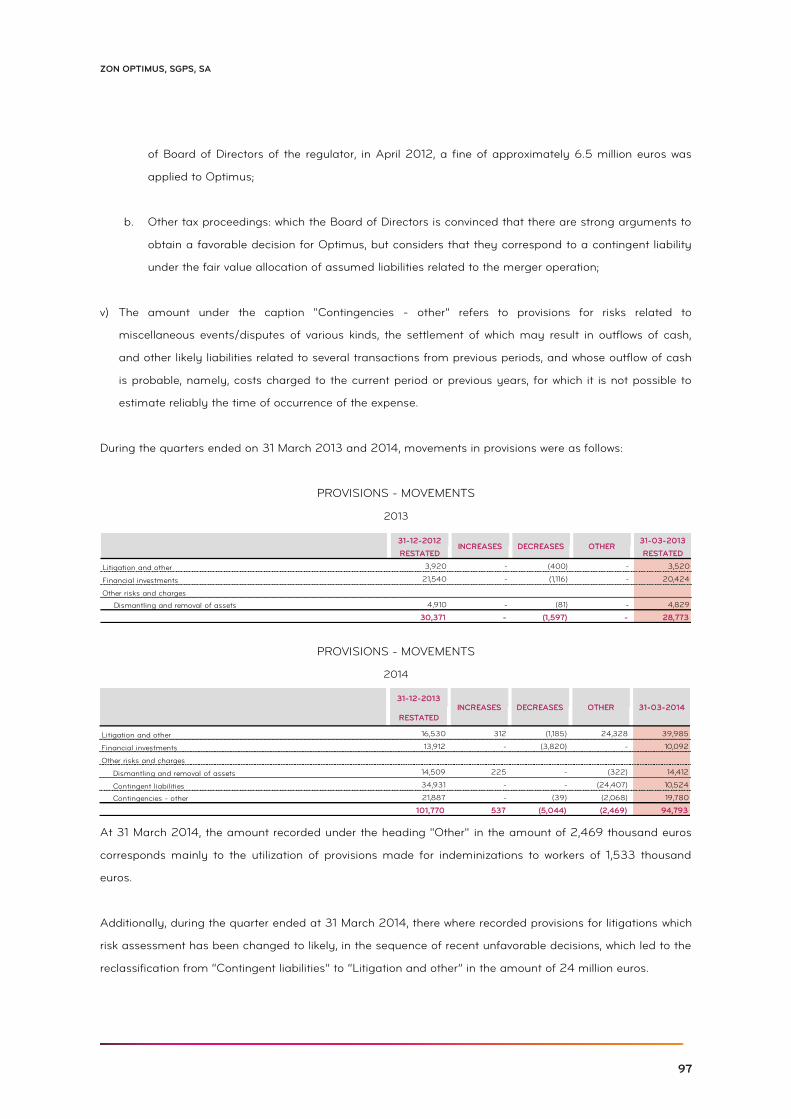
97
ZON OPTIMUS, SGPS, SA
of Board of Directors of the regulator, in April 2012, a fine of approximately 6.5 million euros was
applied to Optimus;
b. Other tax proceedings: which the Board of Directors is convinced that there are strong arguments to
obtain a favorable decision for Optimus, but considers that they correspond to a contingent liability
under the fair value allocation of assumed liabilities related to the merger operation;
v) The amount under the caption "Contingencies - other" refers to provisions for risks related to
miscellaneous events/disputes of various kinds, the settlement of which may result in outflows of cash,
and other likely liabilities related to several transactions from previous periods, and whose outflow of cash
is probable, namely, costs charged to the current period or previous years, for which it is not possible to
estimate reliably the time of occurrence of the expense.
During the quarters ended on 31 March 2013 and 2014, movements in provisions were as follows:
PROVISIONS - MOVEMENTS
2013
PROVISIONS - MOVEMENTS
2014
At 31 March 2014, the amount recorded under the heading "Other" in the amount of 2,469 thousand euros
corresponds mainly to the utilization of provisions made for indeminizations to workers of 1,533 thousand
euros.
Additionally, during the quarter ended at 31 March 2014, there where recorded provisions for litigations which
risk assessment has been changed to likely, in the sequence of recent unfavorable decisions, which led to the
reclassification from “Contingent liabilities” to “Litigation and other” in the amount of 24 million euros.
31-12-2012 31-03-2013
RESTATED RESTATED
Litigation and other 3,920 - (400) - 3,520
Financial investments 21,540 - (1,116) - 20,424
Other risks and charges
Dismantling and removal of assets 4,910 - (81) - 4,829
30,371 - (1,597) - 28,773
INCREASES DECREASES OTHER
31-12-2013
RESTATED
Litigation and other 16,530 312 (1,185) 24,328 39,985
Financial investments 13,912 - (3,820) - 10,092
Other risks and charges
Dismantling and removal of assets 14,509 225 - (322) 14,412
Contingent liabilities 34,931 - - (24,407) 10,524
Contingencies - other 21,887 - (39) (2,068) 19,780
101,770 537 (5,044) (2,469) 94,793
31-03-2014INCREASES DECREASES OTHER
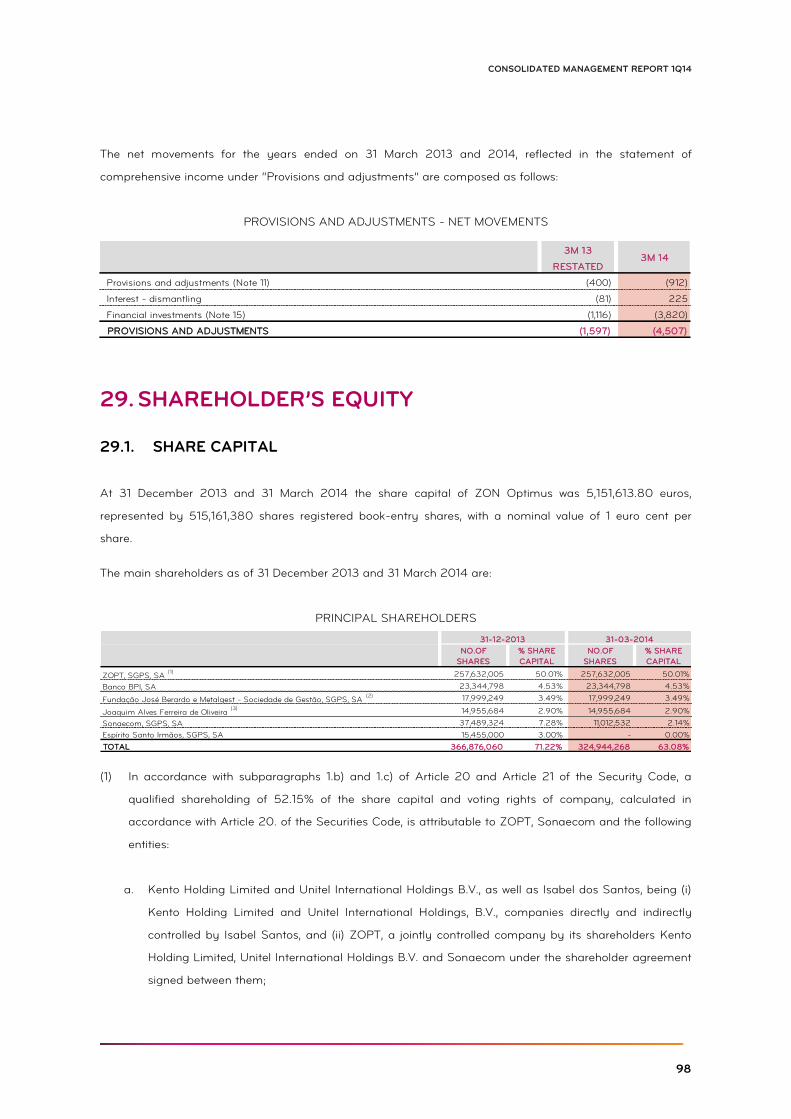
98
CONSOLIDATED MANAGEMENT REPORT 1Q14
The net movements for the years ended on 31 March 2013 and 2014, reflected in the statement of
comprehensive income under “Provisions and adjustments” are composed as follows:
PROVISIONS AND ADJUSTMENTS - NET MOVEMENTS
SHAREHOLDER’S EQUITY 29.
29.1. SHARE CAPITAL
At 31 December 2013 and 31 March 2014 the share capital of ZON Optimus was 5,151,613.80 euros,
represented by 515,161,380 shares registered book-entry shares, with a nominal value of 1 euro cent per
share.
The main shareholders as of 31 December 2013 and 31 March 2014 are:
PRINCIPAL SHAREHOLDERS
(1) In accordance with subparagraphs 1.b) and 1.c) of Article 20 and Article 21 of the Security Code, a
qualified shareholding of 52.15% of the share capital and voting rights of company, calculated in
accordance with Article 20. of the Securities Code, is attributable to ZOPT, Sonaecom and the following
entities:
a. Kento Holding Limited and Unitel International Holdings B.V., as well as Isabel dos Santos, being (i)
Kento Holding Limited and Unitel International Holdings, B.V., companies directly and indirectly
controlled by Isabel Santos, and (ii) ZOPT, a jointly controlled company by its shareholders Kento
Holding Limited, Unitel International Holdings B.V. and Sonaecom under the shareholder agreement
signed between them;
3M 13
RESTATED
Provisions and adjustments (Note 11) (400) (912)
Interest - dismantling (81) 225
Financial investments (Note 15) (1,116) (3,820)
PROVISIONS AND ADJUSTMENTS (1,597) (4,507)
3M 14
NO.OF
SHARES
% SHARE
CAPITAL
NO.OF
SHARES
% SHARE
CAPITAL
ZOPT, SGPS, SA (1) 257,632,005 50.01% 257,632,005 50.01%
Banco BPI, SA 23,344,798 4.53% 23,344,798 4.53%
Fundação José Berardo e Metalgest - Sociedade de Gestão, SGPS, SA (2) 17,999,249 3.49% 17,999,249 3.49%
Joaquim Alves Ferreira de Oliveira (3) 14,955,684 2.90% 14,955,684 2.90%
Sonaecom, SGPS, SA 37,489,324 7.28% 11,012,532 2.14%
Espírito Santo Irmãos, SGPS, SA 15,455,000 3.00% - 0.00%
TOTAL 366,876,060 71.22% 324,944,268 63.08%
31-03-201431-12-2013
99
ZON OPTIMUS, SGPS, SA
b. Entities in a control relationship with Sonaecom, namely, Sontel B.V., Sonae Investments B.V., Sonae,
SGPS, S.A., Efanor Investimentos, SGPS, S.A. and Belmiro Mendes de Azevedo, also due of such
control and of the shareholder agreement mentioned in a.
(2) The “Fundação José Berardo” holds 14,013,761 shares representing 2.72% of the share capital of the
Company. In turn, the Metalgest - Sociedade de Gestão, SGPS, S.A. holds 3,985,488 shares
representing 0.774% of the share capital of the Company. The position of the “Fundação José Berardo”
is reciprocally attributed to Metalgest - Sociedade de Gestão, SGPS, S.A..
(3) The voting rights corresponding to 2.90% of the share capital are attributed to Joaquim Francisco Alves
Ferreira de Oliveira, as he controls GRIPCOM, SGPS, SA, and Controlinveste International S.à.rl, which
holds, respectively, 1.36% and 1.55% of the share capital of ZON OPTIMUS.
29.2. CAPITAL ISSUED PREMIUM
On 27 August 2013, and following the completion of the merger between ZON and Optimus SGPS, the
Company's share capital was increased by 856,404,278 euros, corresponding to the total number of issued
shares, based on the closing market price of August 27. The capital increase is detailed as follows:
i) share capital in the amount of 2,060,646 euros;
ii) premium for issue of shares in the amount of 854,343,632 euros.
Additionally, the premium for issue of shares was deducted in the amount of 125 thousand euros related to
costs with the respective capital increase.
The capital issued premium is subject to the same rules as for legal reserves and can only be used:
a) To cover part of the losses on the balance of the year that cannot be covered by other reserves;
b) To cover part of the losses carried forward from the previous year that cannot be covered by the net
income of the year or by other reserves;
c) To increase the share capital.
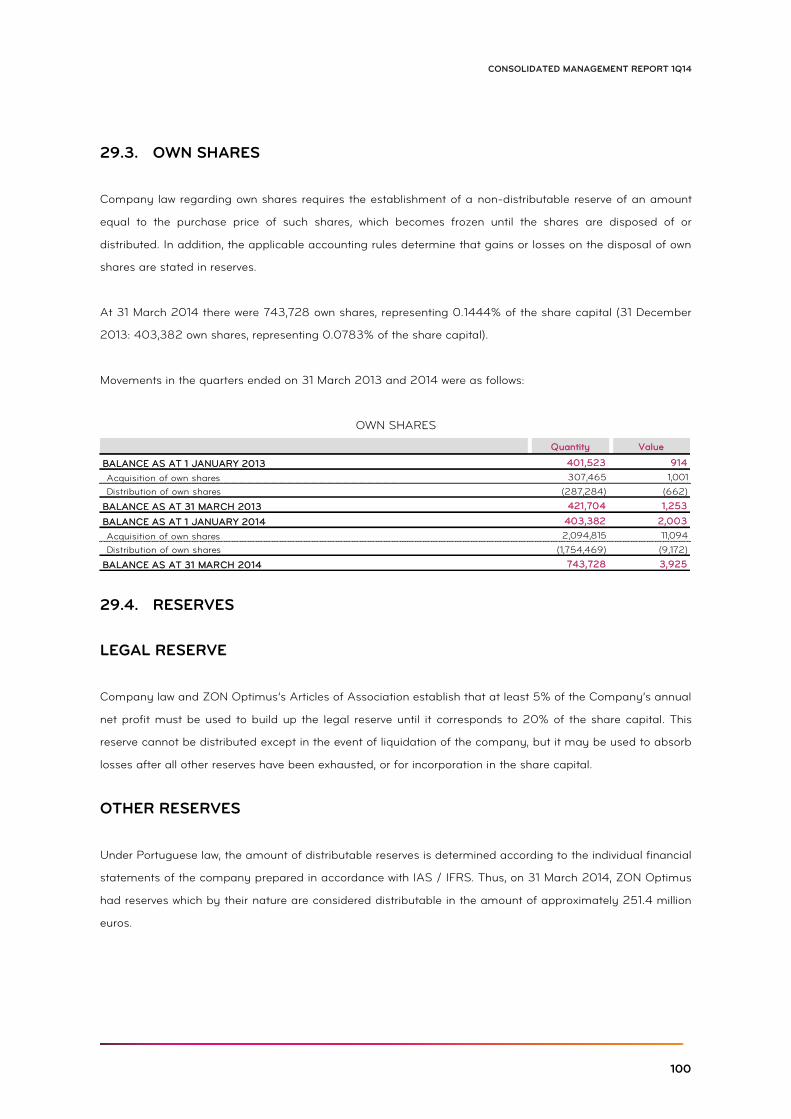
100
CONSOLIDATED MANAGEMENT REPORT 1Q14
29.3. OWN SHARES
Company law regarding own shares requires the establishment of a non-distributable reserve of an amount
equal to the purchase price of such shares, which becomes frozen until the shares are disposed of or
distributed. In addition, the applicable accounting rules determine that gains or losses on the disposal of own
shares are stated in reserves.
At 31 March 2014 there were 743,728 own shares, representing 0.1444% of the share capital (31 December
2013: 403,382 own shares, representing 0.0783% of the share capital).
Movements in the quarters ended on 31 March 2013 and 2014 were as follows:
OWN SHARES
29.4. RESERVES
LEGAL RESERVE
Company law and ZON Optimus’s Articles of Association establish that at least 5% of the Company’s annual
net profit must be used to build up the legal reserve until it corresponds to 20% of the share capital. This
reserve cannot be distributed except in the event of liquidation of the company, but it may be used to absorb
losses after all other reserves have been exhausted, or for incorporation in the share capital.
OTHER RESERVES
Under Portuguese law, the amount of distributable reserves is determined according to the individual financial
statements of the company prepared in accordance with IAS / IFRS. Thus, on 31 March 2014, ZON Optimus
had reserves which by their nature are considered distributable in the amount of approximately 251.4 million
euros.
Quantity Value
BALANCE AS AT 1 JANUARY 2013 401,523 914
Acquisition of own shares 307,465 1,001
Distribution of own shares (287,284) (662)
BALANCE AS AT 31 MARCH 2013 421,704 1,253
BALANCE AS AT 1 JANUARY 2014 403,382 2,003
Acquisition of own shares 2,094,815 11,094
Distribution of own shares (1,754,469) (9,172)
BALANCE AS AT 31 MARCH 2014 743,728 3,925
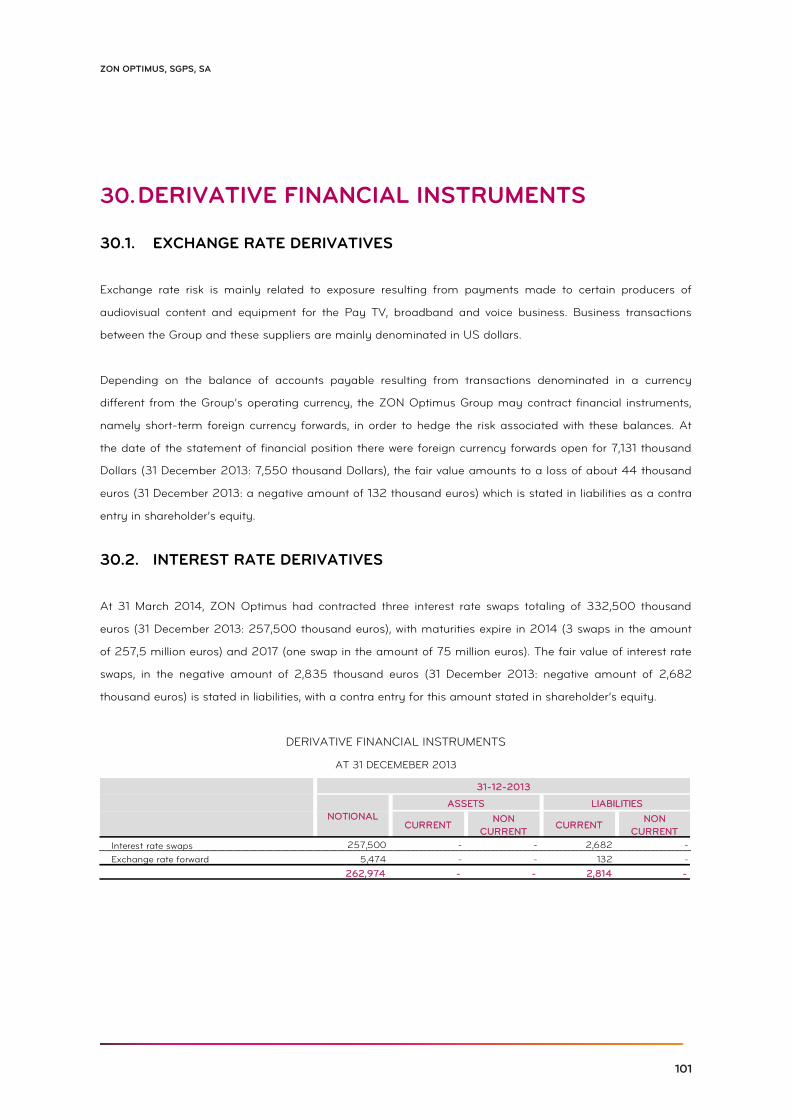
101
ZON OPTIMUS, SGPS, SA
DERIVATIVE FINANCIAL INSTRUMENTS 30.
30.1. EXCHANGE RATE DERIVATIVES
Exchange rate risk is mainly related to exposure resulting from payments made to certain producers of
audiovisual content and equipment for the Pay TV, broadband and voice business. Business transactions
between the Group and these suppliers are mainly denominated in US dollars.
Depending on the balance of accounts payable resulting from transactions denominated in a currency
different from the Group’s operating currency, the ZON Optimus Group may contract financial instruments,
namely short-term foreign currency forwards, in order to hedge the risk associated with these balances. At
the date of the statement of financial position there were foreign currency forwards open for 7,131 thousand
Dollars (31 December 2013: 7,550 thousand Dollars), the fair value amounts to a loss of about 44 thousand
euros (31 December 2013: a negative amount of 132 thousand euros) which is stated in liabilities as a contra
entry in shareholder’s equity.
30.2. INTEREST RATE DERIVATIVES
At 31 March 2014, ZON Optimus had contracted three interest rate swaps totaling of 332,500 thousand
euros (31 December 2013: 257,500 thousand euros), with maturities expire in 2014 (3 swaps in the amount
of 257,5 million euros) and 2017 (one swap in the amount of 75 million euros). The fair value of interest rate
swaps, in the negative amount of 2,835 thousand euros (31 December 2013: negative amount of 2,682
thousand euros) is stated in liabilities, with a contra entry for this amount stated in shareholder’s equity.
DERIVATIVE FINANCIAL INSTRUMENTS
AT 31 DECEMEBER 2013
CURRENTNON
CURRENTCURRENT
NON
CURRENT
Interest rate swaps 257,500 - - 2,682 -
Exchange rate forward 5,474 - - 132 -
262,974 - - 2,814 -
31-12-2013
LIABILITIES
NOTIONAL
ASSETS
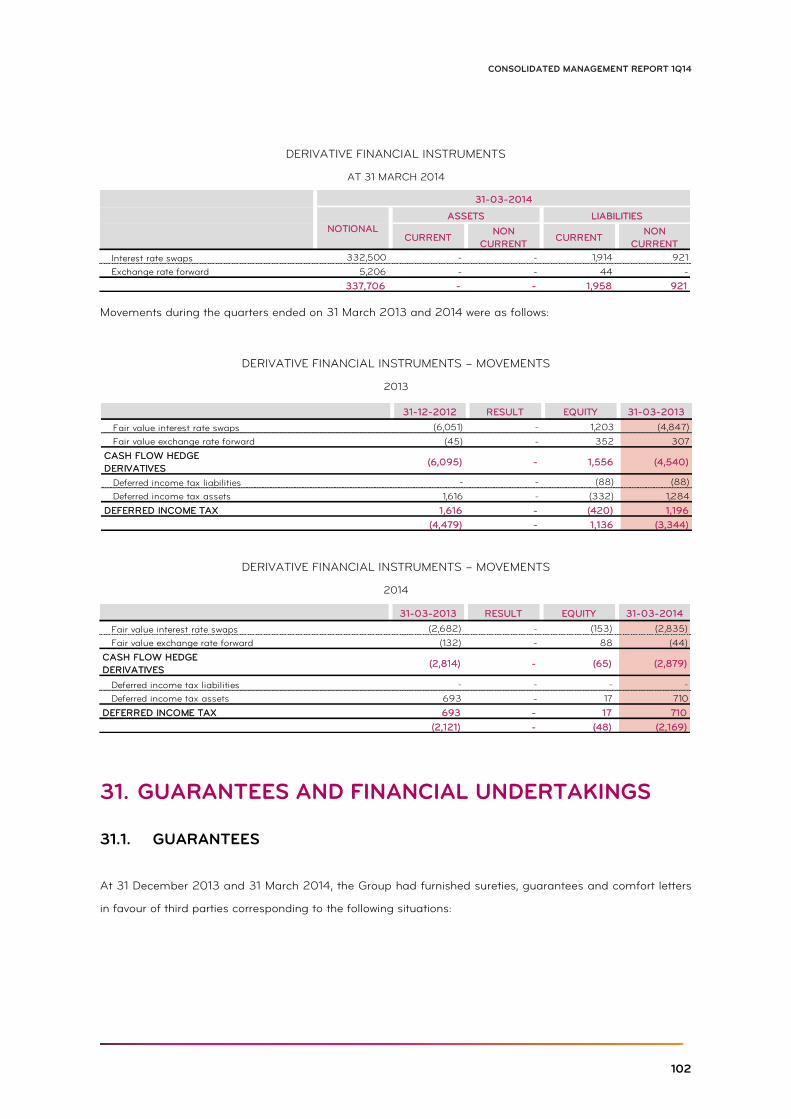
102
CONSOLIDATED MANAGEMENT REPORT 1Q14
DERIVATIVE FINANCIAL INSTRUMENTS
AT 31 MARCH 2014
Movements during the quarters ended on 31 March 2013 and 2014 were as follows:
DERIVATIVE FINANCIAL INSTRUMENTS – MOVEMENTS
2013
DERIVATIVE FINANCIAL INSTRUMENTS – MOVEMENTS
2014
GUARANTEES AND FINANCIAL UNDERTAKINGS 31.
31.1. GUARANTEES
At 31 December 2013 and 31 March 2014, the Group had furnished sureties, guarantees and comfort letters
in favour of third parties corresponding to the following situations:
CURRENTNON
CURRENTCURRENT
NON
CURRENT
Interest rate swaps 332,500 - - 1,914 921
Exchange rate forward 5,206 - - 44 -
337,706 - - 1,958 921
31-03-2014
LIABILITIES
NOTIONAL
ASSETS
31-12-2012 RESULT EQUITY 31-03-2013
Fair value interest rate swaps (6,051) - 1,203 (4,847)
Fair value exchange rate forward (45) - 352 307
(6,095) - 1,556 (4,540)
Deferred income tax liabilities - - (88) (88)
Deferred income tax assets 1,616 - (332) 1,284
1,616 - (420) 1,196
(4,479) - 1,136 (3,344)
CASH FLOW HEDGE
DERIVATIVES
DEFERRED INCOME TAX
31-03-2013 RESULT EQUITY 31-03-2014
Fair value interest rate swaps (2,682) - (153) (2,835)
Fair value exchange rate forward (132) - 88 (44)
(2,814) - (65) (2,879)
Deferred income tax liabilities - - - -
Deferred income tax assets 693 - 17 710
693 - 17 710
(2,121) - (48) (2,169)
CASH FLOW HEDGE
DERIVATIVES
DEFERRED INCOME TAX
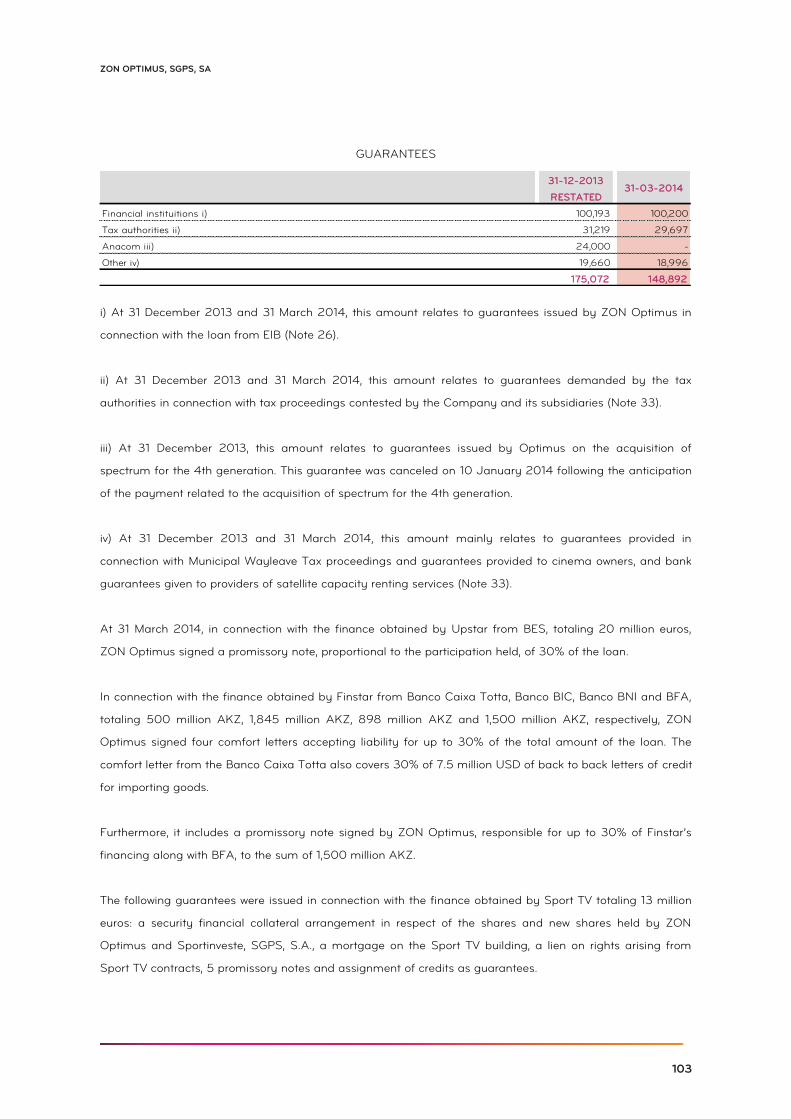
103
ZON OPTIMUS, SGPS, SA
GUARANTEES
i) At 31 December 2013 and 31 March 2014, this amount relates to guarantees issued by ZON Optimus in
connection with the loan from EIB (Note 26).
ii) At 31 December 2013 and 31 March 2014, this amount relates to guarantees demanded by the tax
authorities in connection with tax proceedings contested by the Company and its subsidiaries (Note 33).
iii) At 31 December 2013, this amount relates to guarantees issued by Optimus on the acquisition of
spectrum for the 4th generation. This guarantee was canceled on 10 January 2014 following the anticipation
of the payment related to the acquisition of spectrum for the 4th generation.
iv) At 31 December 2013 and 31 March 2014, this amount mainly relates to guarantees provided in
connection with Municipal Wayleave Tax proceedings and guarantees provided to cinema owners, and bank
guarantees given to providers of satellite capacity renting services (Note 33).
At 31 March 2014, in connection with the finance obtained by Upstar from BES, totaling 20 million euros,
ZON Optimus signed a promissory note, proportional to the participation held, of 30% of the loan.
In connection with the finance obtained by Finstar from Banco Caixa Totta, Banco BIC, Banco BNI and BFA,
totaling 500 million AKZ, 1,845 million AKZ, 898 million AKZ and 1,500 million AKZ, respectively, ZON
Optimus signed four comfort letters accepting liability for up to 30% of the total amount of the loan. The
comfort letter from the Banco Caixa Totta also covers 30% of 7.5 million USD of back to back letters of credit
for importing goods.
Furthermore, it includes a promissory note signed by ZON Optimus, responsible for up to 30% of Finstar’s
financing along with BFA, to the sum of 1,500 million AKZ.
The following guarantees were issued in connection with the finance obtained by Sport TV totaling 13 million
euros: a security financial collateral arrangement in respect of the shares and new shares held by ZON
Optimus and Sportinveste, SGPS, S.A., a mortgage on the Sport TV building, a lien on rights arising from
Sport TV contracts, 5 promissory notes and assignment of credits as guarantees.
31-12-2013
RESTATED
Financial instituitions i) 100,193 100,200
Tax authorities ii) 31,219 29,697
Anacom iii) 24,000 -
Other iv) 19,660 18,996
175,072 148,892
31-03-2014
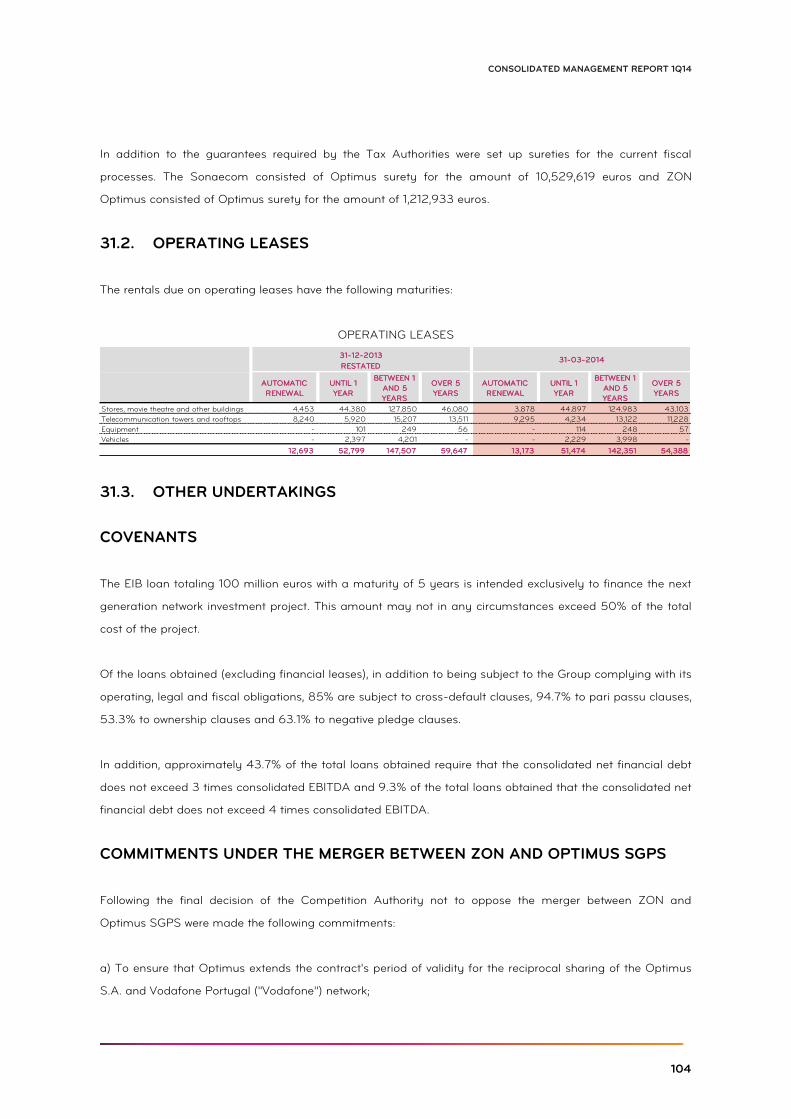
104
CONSOLIDATED MANAGEMENT REPORT 1Q14
In addition to the guarantees required by the Tax Authorities were set up sureties for the current fiscal
processes. The Sonaecom consisted of Optimus surety for the amount of 10,529,619 euros and ZON
Optimus consisted of Optimus surety for the amount of 1,212,933 euros.
31.2. OPERATING LEASES
The rentals due on operating leases have the following maturities:
OPERATING LEASES
31.3. OTHER UNDERTAKINGS
COVENANTS
The EIB loan totaling 100 million euros with a maturity of 5 years is intended exclusively to finance the next
generation network investment project. This amount may not in any circumstances exceed 50% of the total
cost of the project.
Of the loans obtained (excluding financial leases), in addition to being subject to the Group complying with its
operating, legal and fiscal obligations, 85% are subject to cross-default clauses, 94.7% to pari passu clauses,
53.3% to ownership clauses and 63.1% to negative pledge clauses.
In addition, approximately 43.7% of the total loans obtained require that the consolidated net financial debt
does not exceed 3 times consolidated EBITDA and 9.3% of the total loans obtained that the consolidated net
financial debt does not exceed 4 times consolidated EBITDA.
COMMITMENTS UNDER THE MERGER BETWEEN ZON AND OPTIMUS SGPS
Following the final decision of the Competition Authority not to oppose the merger between ZON and
Optimus SGPS were made the following commitments:
a) To ensure that Optimus extends the contract's period of validity for the reciprocal sharing of the Optimus
S.A. and Vodafone Portugal ("Vodafone") network;
AUTOMATIC
RENEWAL
UNTIL 1
YEAR
BETWEEN 1
AND 5
YEARS
OVER 5
YEARS
AUTOMATIC
RENEWAL
UNTIL 1
YEAR
BETWEEN 1
AND 5
YEARS
OVER 5
YEARS
Stores, movie theatre and other buildings 4,453 44,380 127,850 46,080 3,878 44,897 124,983 43,103
Telecommunication towers and rooftops 8,240 5,920 15,207 13,511 9,295 4,234 13,122 11,228
Equipment - 101 249 56 - 114 248 57
Vehicles - 2,397 4,201 - - 2,229 3,998 -
12,693 52,799 147,507 59,647 13,173 51,474 142,351 54,388
31-12-201331-03-2014
RESTATED
105
ZON OPTIMUS, SGPS, SA
b) To ensure that Optimus modifies the reciprocal sharing contract for the Optimus and Vodafone network so
that the limitation of liability in the event that the resolution is unjustified or justified for a reason attributable
to Optimus, does not apply;
c) To ensure that Optimus, for a determined period of time, will not charge its fiber optic triple play service
clients the payment due because of loyalty clauses in place, in the event of a disconnection request;
d) To ensure that Optimus will be open to negotiate, for a determined period of time, with a requested third
party, a contract which allows wholesale access to its fiber network;
e) To ensure that Optimus will present to and negotiate with Vodafone, for a determined period of time, a
contract that gives the option of buying its fiber network.
OTHER
In July 2010, ZON TV Cabo Portugal signed a contract with the Portuguese Professional Football League as
co-sponsor with the brewing company Sociedade Central de Cervejas, covering four football seasons
(2010/2011 to 2013/2014) of the first and second division competitions, to be known henceforth as the “LIGA
ZON SAGRES” (formerly the “LIGA SAGRES”) and the “Segunda LIGA” (formerly the “LIGA VITALIS”).
106
CONSOLIDATED MANAGEMENT REPORT 1Q14
RELATED PARTIES 32. 32.1. SUMMARY LIST OF RELATED PARTIES
Detailed summary of related parties as at 31 March 2014:
RELATED PARTIES
RELATED PARTIES
3DO Holding GmbH Caixa Geral de Depósitos, SA
3shoppings – Holding,SGPS, S.A. Caixanet – Telecomunicações e Telemática, SA
8ª Avenida Centro Comercial, SA Canal 20 TV
ADD Avaliações Engenharia de Avaliações e Perícias Ltda Canasta – Empreendimentos Imobiliários, S.A.
Adlands B.V. Cape Technologies Limited
Aegean Park, S.A. Carvemagere-Manut.e Energias Renov., Lda
Agepan Eiweiler Management GmbH Casa Agrícola de Ambrães, S.A.
Agepan Flooring Products, S.A.RL Casa da Ribeira – Hotelaria e Turismo, S.A.
Agloma Investimentos, Sgps, S.A. Cascaishopping – Centro Comercial, S.A.
Águas Furtadas Sociedade Agrícola, SA Cascaishopping Holding I, SGPS, S.A.
Airone – Shopping Center, Srl CCCB Caldas da Rainha - Centro Comercial,SA
ALBCC Albufeirashopping C.Comercial SA Centro Colombo – Centro Comercial, S.A.
ALEXA Administration GmbH Centro Residencial da Maia,Urban., S.A.
ALEXA Asset GmbH & Co KG Centro Vasco da Gama – Centro Comercial, S.A.
ALEXA Holding GmbH Change, SGPS, S.A.
ALEXA Shopping Centre GmbH Chão Verde – Soc.Gestora Imobiliária, S.A.
Algarveshopping – Centro Comercial, S.A. Cinclus Imobiliária, S.A.
Alpêssego – Soc. Agrícola, S.A Cinveste, SGPS, SA
Andar – Sociedade Imobiliária, S.A. Citorres – Sociedade Imobiliária, S.A.
Apor - Agência para a Modernização do Porto Coimbrashopping – Centro Comercial, S.A.
Aqualuz – Turismo e Lazer, Lda Colombo Towers Holding, BV
Arat inmebles, S.A. Companhia de Pesca e Comércio de Angola (Cosal), SARL
ARP Alverca Retail Park,SA Companhia Térmica Hectare, ACE
Arrábidashopping – Centro Comercial, S.A. Companhia Térmica Tagol, Lda.
Aserraderos de Cuellar, S.A. Contacto Concessões, SGPS, S.A.
Atelgen-Produção Energia, ACE Contibomba – Comérc.Distr.Combustiveis, S.A.
Atlantic Ferries – Tráf.Loc,Flu.e Marít, S.A. Contimobe – Imobil.Castelo Paiva, S.A.
Avenida M – 40 B.V. Continente Hipermercados, S.A.
Avenida M – 40, S.A. Contry Club da Maia-Imobiliaria, S.A.
Azulino Imobiliária, S.A. Cooper Gay Swett & Crawford Lt
BA Business Angels, SGPS, SA Craiova Mall BV
BA Capital, SGPS, SA Cronosaúde – Gestão Hospitalar, S.A.
Banco BPI, SA CTE-Central Termoeléct. do Estuário, Lda
Banco Espírito Santo, SA Cumulativa – Sociedade Imobiliária, S.A.
BB Food Service, S.A. Darbo S.A.S
Beralands BV Deutsche Industrieholz GmbH
Bertimóvel – Sociedade Imobiliária, S.A. Digitmarket – Sistemas de Informação, S.A.
BES Vida - Companhia de Seguros, S. A. Discovery Sports, SA
BHW Beeskow Holzwerkstoffe Distodo - Distribuição e Logística, Lda.
Big Picture 2 Films, SA Dortmund Tower GmbH
Blackrock, Inc. Dos Mares – Shopping Centre B.V.
Bloco Q – Sociedade Imobiliária, S.A. Dos Mares – Shopping Centre, S.A.
Bloco W – Sociedade Imobiliária, S.A. Dreamia - Serviços de Televisão, S.A.
Boavista Shopping Centre BV Dreamia Holding B.V.
BOM MOMENTO – Comércio Retalhista, SA East Star Ltd
107
ZON OPTIMUS, SGPS, SA
RELATED PARTIES
Ecociclo – Energia e Ambiente, S.A. Imodivor – Sociedade Imobiliária, S.A.
Ecociclo II Imoestrutura – Soc.Imobiliária, S.A.
Efanor Investimentos, SGPS, S.A. Imoferro – Soc.Imobiliária, S.A.
Efanor Serviços de Apoio à Gestão, S.A. Imohotel – Emp.Turist.Imobiliários, S.A.
El Rosal Shopping, S.A. Imomuro – Sociedade Imobiliária, S.A.
Emfísico Boavista Imopenínsula – Sociedade Imobiliária, S.A.
Empreend.Imob.Quinta da Azenha, S.A. Imoplamac Gestão de Imóveis, S.A.
Enerlousado-Recursos Energéticos, Lda. Imoponte – Soc.Imobiliaria, S.A.
Equador & Mendes, Lda Imoresort – Sociedade Imobiliária, S.A.
ESAF - Espírito Santo Fundos de Investimento Mobiliário, SA Imoresultado – Soc.Imobiliaria, S.A.
Espimaia – Sociedade Imobiliária, S.A. Imosedas – Imobiliária e Seviços, S.A.
Espírito Santo Irmãos, SGPS, SA Imosistema – Sociedade Imobiliária, S.A.
Estação Viana – Centro Comercial, S.A. Imosonae II
Estêvão Neves - SGPS, SA Impaper Europe GmbH & Co. KG
Euroresinas – Indústrias Quimicas, S.A. Implantação – Imobiliária, S.A.
Farmácia Selecção, S.A. Infofield – Informática, S.A.
Fashion Division Canárias, SL Infosystems-Sociedade de Sistemas de Informação,S.A.
Fashion Division, S.A. Infratroia, EM
Filmes Mundáfrica, SARL Inparsa – Gestão Galeria Comercial, S.A.
FINSTAR - Sociedade de Investimentos e Participações, SA Inparvi SGPS, S.A.
Fozimo – Sociedade Imobiliária, S.A. Integrum - Energia, SA
Freccia Rossa – Shopping Centre S.r.l. Integrum ACE, SA
Frieengineering International Ltda Integrum Colombo Energia, S.A.
Fundação José Berardo Integrum Martim Longo - Energia, S.A.
Fundo de Invest. Imobiliário Imosede Interlog – SGPS, S.A.
Fundo I.I. Parque Dom Pedro Shop.Center Invesaude - Gestão Hospitalar S.A.
Fundo Invest.Imob.Shopp. Parque D.Pedro Ioannina Development of Shopping Centres, SA
Fundo Investimento para Cinema e Audiovisual Isoroy SAS
Gaiashopping I – Centro Comercial, S.A. Joaquim Alves Ferreira de Oliveira
Gaiashopping II – Centro Comercial, S.A. Kento Holding Limited
Gesgráfica - Projectos Gráficos, Lda La Farga – Shopping Center, SL
GHP Gmbh Laminate Park GmbH Co. KG
Gli Orsi Shopping Centre 1 Srl Land Retail B.V.
Glunz AG Larim Corretora de Resseguros Ltda
Glunz Service GmbH Larissa Develop. Of Shopping Centers, S.A.
Glunz UK Holdings Ltd Lazam – MDS Corretora e Administradora de Seguros, S.A.
Glunz Uka Gmbh LCC LeiriaShopping Centro Comercial SA
GMET, ACE Le Terrazze - Shopping Centre 1 Srl
Golf Time – Golfe e Invest. Turísticos, S.A. Libra Serviços, Lda.
Grafilme - Sociedade Impressora de Legendas, Lda. Lidergraf – Artes Gráficas, Lda.
Grupo Visabeira, SGPS, SA Loop5 Shopping Centre GmbH
Guimarãeshopping – Centro Comercial, S.A. Loureshopping – Centro Comercial, S.A.
Harvey Dos Iberica, S.L. Lusitânia - Companhia de Seguros, SA
Herco Consultoria de Riscos e Corretora de Seguros Ltda Lusitânia Vida - Companhia de Seguros, SA
HighDome PCC Limited Luz del Tajo – Centro Comercial S.A.
Iberian Assets, S.A. Luz del Tajo B.V.
Igimo – Sociedade Imobiliária, S.A. Madeirashopping – Centro Comercial, S.A.
Iginha – Sociedade Imobiliária, S.A. Maiashopping – Centro Comercial, S.A.
Imoareia – Invest. Turísticos, SGPS, S.A. Maiequipa – Gestão Florestal, S.A.
Imobiliária da Cacela, S.A. Mainroad – Serviços em Tecnologias de Informação, S.A.
Imoclub – Serviços Imobilários, S.A. Marcas do Mundo – Viag. e Turismo Unip, Lda
Imoconti – Soc.Imobiliária, S.A. Marcas MC, ZRT
108
CONSOLIDATED MANAGEMENT REPORT 1Q14
RELATED PARTIES
Marina de Tróia S.A. Pátio São Bernardo Shopping Ltda
Marinamagic – Expl.Cent.Lúdicos Marít, Lda Pátio Sertório Shopping Ltda
Marmagno – Expl.Hoteleira Imob., S.A. Pátio Uberlândia Shopping Ltda
Martimope – Sociedade Imobiliária, S.A. PCJ - Público, Comunicação e Jornalismo, S.A.
Marvero – Expl.Hoteleira Imob., S.A. Pharmaconcept – Actividades em Saúde, S.A.
MDS Affinity - Sociedade de Mediação, Lda PHARMACONTINENTE – Saúde e Higiene, S.A.
MDS Africa SGPS, S.A. PJP – Equipamento de Refrigeração, Lda
MDS Consultores, S.A. Plaza Éboli B.V.
MDS Corretor de Seguros, S.A. Plaza Éboli – Centro Comercial S.A.
MDS Malta Holding Limited Plaza Mayor Holding, SGPS, SA
MDS SGPS, SA Plaza Mayor Parque de Ócio BV
MDSAUTO - Mediação de Seguros, SA Plaza Mayor Parque de Ocio, SA
Megantic BV Plaza Mayor Shopping BV
Metalgest - Sociedade de Gestão, SGPS, SA Plaza Mayor Shopping, SA
Miauger – Organização e Gestão de Leilões Electrónicos., S.A. Ploi Mall BV
MJLF – Empreendimentos Imobiliários, S.A. Plysorol, BV
Mlearning - Mds Knowledge Centre, Unip, Lda Poliface North America
Modalfa – Comércio e Serviços, S.A. PORTCC - Portimãoshopping Centro Comercial, SA
MODALLOOP – Vestuário e Calçado, S.A. Porturbe – Edificios e Urbanizações, S.A.
Modelo – Dist.de Mat. de Construção, S.A. Praedium – Serviços, S.A.
Modelo Continente Hipermercados, S.A. Praedium II – Imobiliária, S.A.
Modelo Continente Intenational Trade, SA Praedium SGPS, S.A.
Modelo Hiper Imobiliária, S.A. Praesidium Services Limited
Modelo.com – Vendas p/Correspond., S.A. Predicomercial – Promoção Imobiliária, S.A.
Movelpartes – Comp.para Ind.Mobiliária, S.A. Predilugar - Sociedade Imobiliária, SA
Movimento Viagens – Viag. e Turismo U.Lda Prédios Privados Imobiliária, S.A.
Mstar, SA Predisedas – Predial das Sedas, S.A.
Mundo Vip – Operadores Turisticos, S.A. Pridelease Investments, Ltd
Munster Arkaden, BV Proj. Sierra Germany 4 (four) – Sh.C.GmbH
Norges Bank Proj.Sierra Germany 2 (two) – Sh.C.GmbH
Norscut – Concessionária de Scut Interior Norte, S.A. Proj.Sierra Italy 1 – Shop.Centre Srl
Norteshopping – Centro Comercial, S.A. Proj.Sierra Italy 3 – Shop. Centre Srl
Norteshopping Retail and Leisure Centre, BV Proj.Sierra Italy 5 – Dev. Of Sh.C.Srl
Nova Equador Internacional,Ag.Viag.T, Ld Project SC 1 BV
Nova Equador P.C.O. e Eventos Project SC 2 BV
Ongoing Strategy Investments, SGPS, SA Project Sierra 2 B.V.
Operscut – Operação e Manutenção de Auto-estradas, S.A. Project Sierra 6 BV
OSB Deustchland Gmbh Project Sierra 7 BV
PantheonPlaza BV Project Sierra 8 BV
Paracentro – Gest.de Galerias Com., S.A. Project Sierra 9 BV
Pareuro, BV Project Sierra Brazil 1 B.V.
Park Avenue Develop. of Shop. Centers S.A. Project Sierra Charagionis 1 S.A.
Parque Atlântico Shopping – C.C., S.A. Project Sierra Four, SA
Parque D. Pedro 1 B.V. Project Sierra Germany Shop. Center 1 BV
Parque D. Pedro 2 B.V. Project Sierra Germany Shop. Center 2 BV
Parque de Famalicão – Empr. Imob., S.A. Project Sierra Spain 1 B.V.
Parque Principado SL Project Sierra Spain 2 – Centro Comer. S.A.
Pátio Boavista Shopping Ltda. Project Sierra Spain 2 B.V.
Pátio Campinas Shopping Ltda Project Sierra Spain 3 – Centro Comer. S.A.
Pátio Goiânia Shopping Ltda Project Sierra Spain 3 B.V.
Pátio Londrina Empreend. e Particip. Ltda Project Sierra Spain 6 B.V.
Pátio Penha Shopping Ltda. Project Sierra Spain 7 B.V.
109
ZON OPTIMUS, SGPS, SA
RELATED PARTIES
Project Sierra Three Srl Sierra Developments Italy S.r.l.
Project Sierra Two Srl Sierra Developments Romania, Srl
Promessa Sociedade Imobiliária, S.A. Sierra Developments Spain – Prom.C.Com.SL
Prosa – Produtos e serviços agrícolas, S.A. Sierra Developments, SGPS, S.A.
Público – Comunicação Social, S.A. Sierra Enplanta Ltda
Puravida – Viagens e Turismo, S.A. Sierra European R.R.E. Assets Hold. B.V.
Racionaliz. y Manufact.Florestales, S.A. Sierra GP Limited
RASO - Viagens e Turismo, S.A. Sierra Investimentos Brasil Ltda
RASO, SGPS, S.A. Sierra Investments (Holland) 1 B.V.
Rio Sul – Centro Comercial, S.A. Sierra Investments (Holland) 2 B.V.
River Plaza Mall, Srl Sierra Investments Holding B.V.
River Plaza, BV Sierra Investments SGPS, S.A.
Rochester Real Estate, Limited Sierra Management Germany GmbH
Ronfegen-Recursos Energéticos, Lda. Sierra Management Italy S.r.l.
RSI Corretora de Seguros Ltda Sierra Management Romania, Srl
S.C. Microcom Doi Srl Sierra Management Spain – Gestión C.Com.S.A.
Saphety – Transacciones Electronicas SAS Sierra Management, SGPS, S.A.
Saphety Brasil Transações Eletrônicas Ltda. Sierra Portugal, S.A.
Saphety Level – Trusted Services, S.A. SII – Soberana Invest. Imobiliários, S.A.
Saúde Atlântica – Gestão Hospitalar, S.A. SIRS – Sociedade Independente de Radiodifusão Sonora, S.A.
SC – Consultadoria, S.A. SISTAVAC, S.A.
SC – Eng. e promoção imobiliária,SGPS, S.A. SKK – Central de Distr., S.A.
SC Aegean B.V. SKK SRL
SC Assets SGPS, S.A. SKKFOR – Ser. For. e Desen. de Recursos
SC Finance BV Sociedade de Construções do Chile, S.A.
SC Mediterraneum Cosmos B.V. Société de Tranchage Isoroy S.A.S.
SC, SGPS, SA Socijofra – Sociedade Imobiliária, S.A.
SCS Beheer, BV Sociloures – Soc.Imobiliária, S.A.
SDSR - Sports Division 2, S.A. Soconstrução BV
Selfrio,SGPS, S.A. Sodesa, S.A.
Selifa – Empreendimentos Imobiliários, S.A. Soflorin, BV
Sempre à Mão – Sociedade Imobiliária, S.A. Soira – Soc.Imobiliária de Ramalde, S.A.
Sempre a Postos – Produtos Alimentares e Utilidades, Lda Solinca - Eventos e Catering, SA
Serra Shopping – Centro Comercial, S.A. Solinca - Health and Fitness, SA
Sesagest – Proj.Gestão Imobiliária, S.A. Solinca – Investimentos Turísticos, S.A.
Sete e Meio – Invest. Consultadoria, S.A. Solinfitness – Club Malaga, S.L.
Sete e Meio Herdades – Inv. Agr. e Tur., S.A. Solingen Shopping Center GmbH
SGC, SGPS, SA SOLSWIM-Gestão e Expl.Equip.Aquáticos,SA
Shopping Centre Parque Principado B.V. Soltroia – Imob.de Urb.Turismo de Tróia, S.A.
Shopping Penha B.V. Somit Imobiliária
Siaf – Soc.Iniciat.Aprov.Florestais - Energia, S.A. SONAE - Specialized Retail, SGPS, SA
SIAL Participações Ltda Sonae Capital Brasil, Lda
Sierra Asia Limited Sonae Capital,SGPS, S.A.
Sierra Asset Management – Gest. Activos, S.A. Sonae Center II S.A.
Sierra Berlin Holding BV Sonae Center Serviços, S.A.
Sierra Central S.A.S Sonae com – Sistemas Informação, SGPS, S.A.
Sierra Charagionis Develop.Sh. Centre S.A. Sonae Ind., Prod. e Com.Deriv.Madeira, S.A.
Sierra Charagionis Propert.Management S.A. Sonae Indústria – SGPS, S.A.
Sierra Corporate Services Holland, BV Sonae Industria de Revestimentos, S.A.
Sierra Development Greece, S.A. Sonae Indústria Manag. Serv, SA
Sierra Developments Germany GmbH Sonae Investimentos, SGPS, SA
Sierra Developments Holding B.V. Sonae Novobord (PTY) Ltd
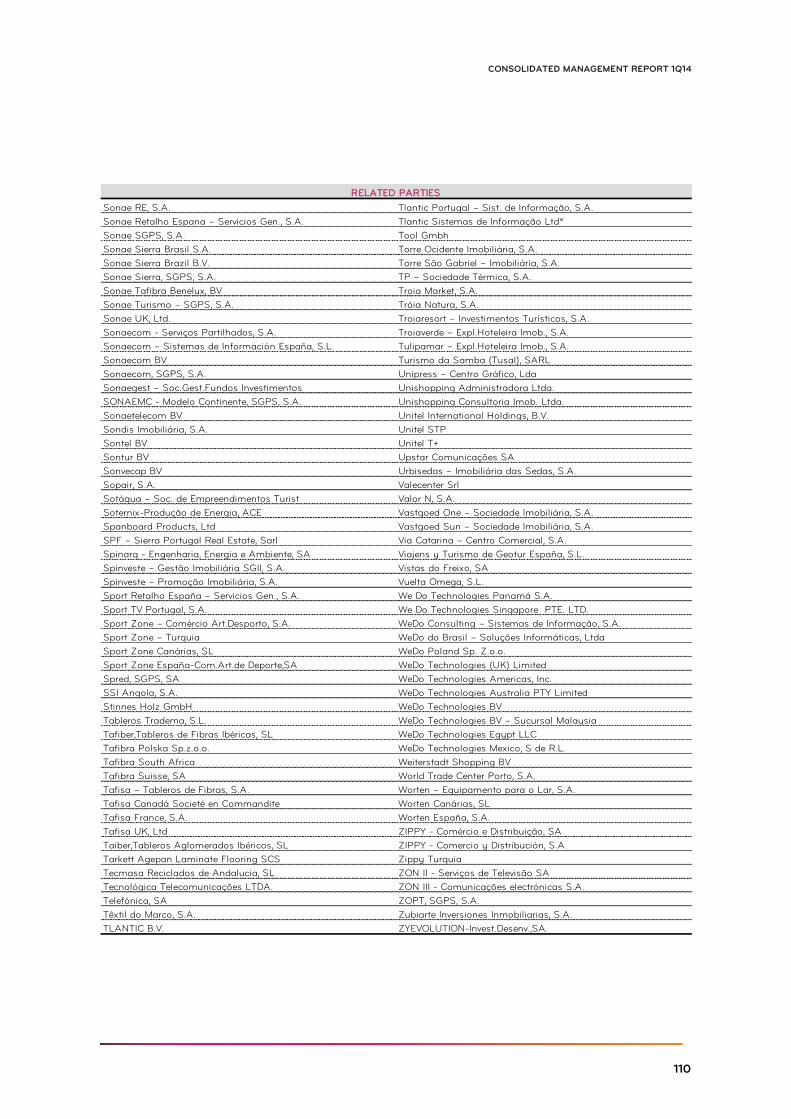
110
CONSOLIDATED MANAGEMENT REPORT 1Q14
RELATED PARTIES
Sonae RE, S.A. Tlantic Portugal – Sist. de Informação, S.A.
Sonae Retalho Espana – Servicios Gen., S.A. Tlantic Sistemas de Informação Ltdª
Sonae SGPS, S.A. Tool Gmbh
Sonae Sierra Brasil S.A. Torre Ocidente Imobiliária, S.A.
Sonae Sierra Brazil B.V. Torre São Gabriel – Imobiliária, S.A.
Sonae Sierra, SGPS, S.A. TP – Sociedade Térmica, S.A.
Sonae Tafibra Benelux, BV Troia Market, S.A.
Sonae Turismo – SGPS, S.A. Tróia Natura, S.A.
Sonae UK, Ltd. Troiaresort – Investimentos Turísticos, S.A.
Sonaecom - Serviços Partilhados, S.A. Troiaverde – Expl.Hoteleira Imob., S.A.
Sonaecom – Sistemas de Información España, S.L. Tulipamar – Expl.Hoteleira Imob., S.A.
Sonaecom BV Turismo da Samba (Tusal), SARL
Sonaecom, SGPS, S.A. Unipress – Centro Gráfico, Lda
Sonaegest – Soc.Gest.Fundos Investimentos Unishopping Administradora Ltda.
SONAEMC - Modelo Continente, SGPS, S.A. Unishopping Consultoria Imob. Ltda.
Sonaetelecom BV Unitel International Holdings, B.V.
Sondis Imobiliária, S.A. Unitel STP
Sontel BV Unitel T+
Sontur BV Upstar Comunicações SA
Sonvecap BV Urbisedas – Imobiliária das Sedas, S.A.
Sopair, S.A. Valecenter Srl
Sotáqua – Soc. de Empreendimentos Turist Valor N, S.A.
Soternix-Produção de Energia, ACE Vastgoed One – Sociedade Imobiliária, S.A.
Spanboard Products, Ltd Vastgoed Sun – Sociedade Imobiliária, S.A.
SPF – Sierra Portugal Real Estate, Sarl Via Catarina – Centro Comercial, S.A.
Spinarq - Engenharia, Energia e Ambiente, SA Viajens y Turismo de Geotur España, S.L.
Spinveste – Gestão Imobiliária SGII, S.A. Vistas do Freixo, SA
Spinveste – Promoção Imobiliária, S.A. Vuelta Omega, S.L.
Sport Retalho España – Servicios Gen., S.A. We Do Technologies Panamá S.A.
Sport TV Portugal, S.A. We Do Technologies Singapore PTE. LTD.
Sport Zone – Comércio Art.Desporto, S.A. WeDo Consulting – Sistemas de Informação, S.A.
Sport Zone – Turquia WeDo do Brasil – Soluções Informáticas, Ltda
Sport Zone Canárias, SL WeDo Poland Sp. Z.o.o.
Sport Zone España-Com.Art.de Deporte,SA WeDo Technologies (UK) Limited
Spred, SGPS, SA WeDo Technologies Americas, Inc.
SSI Angola, S.A. WeDo Technologies Australia PTY Limited
Stinnes Holz GmbH WeDo Technologies BV
Tableros Tradema, S.L. WeDo Technologies BV – Sucursal Malaysia
Tafiber,Tableros de Fibras Ibéricas, SL WeDo Technologies Egypt LLC
Tafibra Polska Sp.z.o.o. WeDo Technologies Mexico, S de R.L.
Tafibra South Africa Weiterstadt Shopping BV
Tafibra Suisse, SA World Trade Center Porto, S.A.
Tafisa – Tableros de Fibras, S.A. Worten – Equipamento para o Lar, S.A.
Tafisa Canadá Societé en Commandite Worten Canárias, SL
Tafisa France, S.A. Worten España, S.A.
Tafisa UK, Ltd ZIPPY - Comércio e Distribuição, SA
Taiber,Tableros Aglomerados Ibéricos, SL ZIPPY - Comercio y Distribución, S.A.
Tarkett Agepan Laminate Flooring SCS Zippy Turquia
Tecmasa Reciclados de Andalucia, SL ZON II - Serviços de Televisão SA
Tecnológica Telecomunicações LTDA. ZON III - Comunicações electrónicas S.A.
Telefónica, SA ZOPT, SGPS, S.A.
Têxtil do Marco, S.A. Zubiarte Inversiones Inmobiliarias, S.A.
TLANTIC B.V. ZYEVOLUTION-Invest.Desenv.,SA.
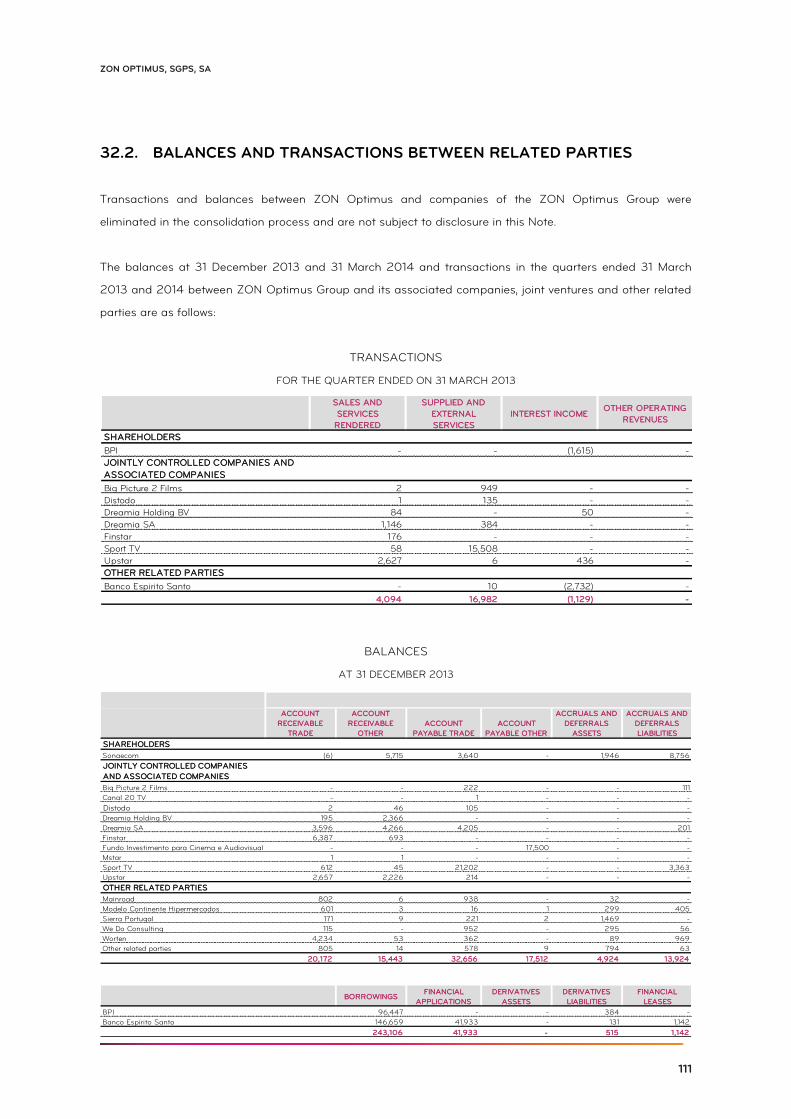
111
ZON OPTIMUS, SGPS, SA
32.2. BALANCES AND TRANSACTIONS BETWEEN RELATED PARTIES
Transactions and balances between ZON Optimus and companies of the ZON Optimus Group were
eliminated in the consolidation process and are not subject to disclosure in this Note.
The balances at 31 December 2013 and 31 March 2014 and transactions in the quarters ended 31 March
2013 and 2014 between ZON Optimus Group and its associated companies, joint ventures and other related
parties are as follows:
TRANSACTIONS
FOR THE QUARTER ENDED ON 31 MARCH 2013
BALANCES
AT 31 DECEMBER 2013
SALES AND
SERVICES
RENDERED
SUPPLIED AND
EXTERNAL
SERVICES
INTEREST INCOMEOTHER OPERATING
REVENUES
SHAREHOLDERS
BPI - - (1,615) -
JOINTLY CONTROLLED COMPANIES AND
ASSOCIATED COMPANIES
Big Picture 2 Films 2 949 - -
Distodo 1 135 - -
Dreamia Holding BV 84 - 50 -
Dreamia SA 1,146 384 - -
Finstar 176 - - -
Sport TV 58 15,508 - -
Upstar 2,627 6 436 -
OTHER RELATED PARTIES
Banco Espirito Santo - 10 (2,732) -
4,094 16,982 (1,129) -
ACCOUNT
RECEIVABLE
TRADE
ACCOUNT
RECEIVABLE
OTHER
ACCOUNT
PAYABLE TRADE
ACCOUNT
PAYABLE OTHER
ACCRUALS AND
DEFERRALS
ASSETS
ACCRUALS AND
DEFERRALS
LIABILITIES
SHAREHOLDERS
Sonaecom (6) 5,715 3,640 - 1,946 8,756
JOINTLY CONTROLLED COMPANIES
AND ASSOCIATED COMPANIES
Big Picture 2 Films - - 222 - - 111
Canal 20 TV - - 1 - - -
Distodo 2 46 105 - - -
Dreamia Holding BV 195 2,366 - - - -
Dreamia SA 3,596 4,266 4,205 - - 201
Finstar 6,387 693 - - - -
Fundo Investimento para Cinema e Audiovisual - - - 17,500 - -
Mstar 1 1 - - - -
Sport TV 612 45 21,202 - - 3,363
Upstar 2,657 2,226 214 - - -
OTHER RELATED PARTIES
Mainroad 802 6 938 - 32 -
Modelo Continente Hipermercados 601 3 16 1 299 405
Sierra Portugal 171 9 221 2 1,469 -
We Do Consulting 115 - 952 - 295 56
Worten 4,234 53 362 - 89 969
Other related parties 805 14 578 9 794 63
20,172 15,443 32,656 17,512 4,924 13,924
BORROWINGSFINANCIAL
APPLICATIONS
DERIVATIVES
ASSETS
DERIVATIVES
LIABILITIES
FINANCIAL
LEASES
BPI 96,447 - - 384 -
Banco Espírito Santo 146,659 41,933 - 131 1,142
243,106 41,933 - 515 1,142
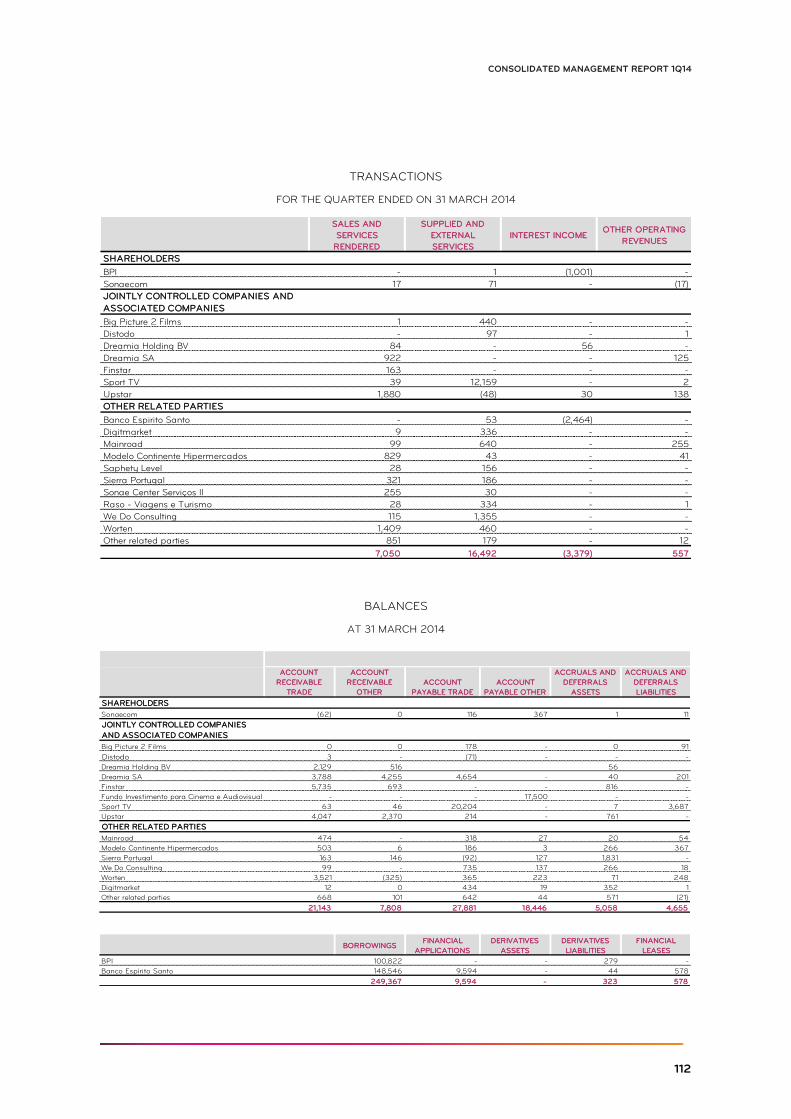
112
CONSOLIDATED MANAGEMENT REPORT 1Q14
TRANSACTIONS
FOR THE QUARTER ENDED ON 31 MARCH 2014
BALANCES
AT 31 MARCH 2014
SALES AND
SERVICES
RENDERED
SUPPLIED AND
EXTERNAL
SERVICES
INTEREST INCOMEOTHER OPERATING
REVENUES
SHAREHOLDERS
BPI - 1 (1,001) -
Sonaecom 17 71 - (17)
JOINTLY CONTROLLED COMPANIES AND
ASSOCIATED COMPANIES
Big Picture 2 Films 1 440 - -
Distodo - 97 - 1
Dreamia Holding BV 84 - 56 -
Dreamia SA 922 - - 125
Finstar 163 - - -
Sport TV 39 12,159 - 2
Upstar 1,880 (48) 30 138
OTHER RELATED PARTIES
Banco Espirito Santo - 53 (2,464) -
Digitmarket 9 336 - -
Mainroad 99 640 - 255
Modelo Continente Hipermercados 829 43 - 41
Saphety Level 28 156 - -
Sierra Portugal 321 186 - -
Sonae Center Serviços II 255 30 - -
Raso - Viagens e Turismo 28 334 - 1
We Do Consulting 115 1,355 - -
Worten 1,409 460 - -
Other related parties 851 179 - 12
7,050 16,492 (3,379) 557
ACCOUNT
RECEIVABLE
TRADE
ACCOUNT
RECEIVABLE
OTHER
ACCOUNT
PAYABLE TRADE
ACCOUNT
PAYABLE OTHER
ACCRUALS AND
DEFERRALS
ASSETS
ACCRUALS AND
DEFERRALS
LIABILITIES
SHAREHOLDERS
Sonaecom (62) 0 116 367 1 11
JOINTLY CONTROLLED COMPANIES
AND ASSOCIATED COMPANIES
Big Picture 2 Films 0 0 178 - 0 91
Distodo 3 - (71) - - -
Dreamia Holding BV 2,129 516 56
Dreamia SA 3,788 4,255 4,654 - 40 201
Finstar 5,735 693 - - 816 -
Fundo Investimento para Cinema e Audiovisual - - - 17,500 - -
Sport TV 63 46 20,204 - 7 3,687
Upstar 4,047 2,370 214 - 761 -
OTHER RELATED PARTIES
Mainroad 474 - 318 27 20 54
Modelo Continente Hipermercados 503 6 186 3 266 367
Sierra Portugal 163 146 (92) 127 1,831 -
We Do Consulting 99 - 735 137 266 18
Worten 3,521 (325) 365 223 71 248
Digitmarket 12 0 434 19 352 1
Other related parties 668 101 642 44 571 (21)
21,143 7,808 27,881 18,446 5,058 4,655
BORROWINGSFINANCIAL
APPLICATIONS
DERIVATIVES
ASSETS
DERIVATIVES
LIABILITIES
FINANCIAL
LEASES
BPI 100,822 - - 279 -
Banco Espírito Santo 148,546 9,594 - 44 578
249,367 9,594 - 323 578
113
ZON OPTIMUS, SGPS, SA
The Company regularly performs transactions and signs contracts with several parties within the ZON
Optimus Group. Such transactions were performed on normal market terms for similar transactions, as part
of the contracting companies' current activity.
The Company also regularly performs transactions and enters into financial contracts with various credit
institutions which hold qualifying shareholdings in the Company. However, these are performed on normal
market terms for similar transactions, as part of the contracting companies' current activity.
Due to the large number of low value related parties balances and transactions, it was grouped in the heading
"Other related parties" the balances and transactions with entities whose amounts are less than 100
thousand euros.
LEGAL ACTIONS AND CONTINGENT ASSETS AND 33.LIABILITIES
33.1. MUNICIPAL WAYLEAVE TAX (TMDP) PROCEEDINGS
In February 2004, pursuant to Article 13 of the Authorisation Directive (Directive 2002/20/EC of 7 June),
Law 5/2004 of 10 February (Electronic Communications Law) established in its Article 106 the Municipal
Wayleave Tax (TMDP) as consideration for the “rights and costs of the installation, passage and crossing, in a
determined area, of the public and private municipal domain" by the systems, equipment and other
resources of companies offering public electronic communications networks and services.
The TMDP charge is levied on “each invoice issued by the companies offering public electronic
communications networks and services at a fixed location to all end customers within the respective
municipality", and is calculated as a maximum percentage of 0.25% of the amount of each invoice. Some
municipalities, despite approving the TMDP, have continued to collect Occupancy Taxes, while others have
opted to maintain the latter taxes rather than approving the TMDP.
In the light of legal advice on the matter, the Group believes that the TMDP is the only tax that should be
collected as consideration for the above mentioned rights, namely the right of installation, for which reason it
has challenged the public highway Occupancy Taxes charged to it by municipalities, since it deems such
taxes illegal. It must also be highlighted that under the scope of an administrative complaint, a decision has
been made by some municipalities, which have either subscribed to the Group's interpretation or decided that
they may only opt for one rate or the other, as it is not possible for the TMDP and public road Occupancy
Rates to overlap.
114
CONSOLIDATED MANAGEMENT REPORT 1Q14
Meanwhile, various judicial judgments have been issued on the substantive issue, including by the Supreme
Administrative Court (two appeals are pending to the Constitutional Court presented in two proceedings by
the C.M Lisboa) that uphold the position and understanding of ZON TV Cabo, with the result that there are
good prospects that this dispute will be definitively resolved in favour of ZON TV Cabo by the majority of
municipalities. Two appeals have been entered on the constitutional court related to two proceedings of
Lisbon City Hall, which have not been decided.
With the entry into force of Decree-Law 123/2009, this matter has been definitively resolved for the future.
This law clearly states (in line with Group’s interpretation of the previous legislation) that the TMDP is payable
for the use and usufruct of property in the public or private municipal domain which involves the construction
or installation, by companies that offer public electronic communications networks and services, of
infrastructures for housing electronic communications in accordance with the terms of the Electronic
Communications Law, and that no other taxes, official fees or consideration are due.
33.2. LEGAL ACTIONS WITH REGULATORS
On 8 July 2009, ZON TV Cabo was notified by the Competition Authority (AdC) in connection with
infringement proceeding relating to the ZON triple-play offer, requesting ZON TV Cabo to comment
on the content of the notification, which it did in good time. The case is currently at the fact-finding
stage in AdC and various information has been requested, to which ZON has responded. If it is
concluded that an infringement has occurred, the AdC may levy a fine not exceeding 10% of the
company’s turnover in last year of infringement.
ICP-ANACOM instituted regulatory infringement proceedings against the Group companies, as it did
against the majority of Portuguese electronic communications operators, for infringement of the
portability regulations. ZON TV Cabo, ZON TV Cabo Açoreana and ZON TV Cabo Madeirense
brought actions for judicial review of decisions by Anacom ordering them to pay a fine. In 2014 court
decisions confirmed sanctions to ZON TV Cabo, ZON TV Cabo Açoreana and ZON TV Cabo
Madeira amounting to 36 thousand euros, 7.5 thousand euros and 8.5 thousand euros, respectively.
Are still three processes of 2013 pending decision.
ZON TV Cabo Portugal, ZON TV Cabo Açoreana ZON TV Cabo Madeirense brought actions for
judicial review of ICP-ANACOM’s decisions in respect of the payment of the Annual Fee (for 2009,
2010, 2011 and 2012) for carrying on the business of Electronic Communications Services Networks
Supplier in the amounts, respectively, of (i) 1,087 thousand euros, 2,325 thousand euros, 3,580
thousand euros and 3,447 thousand euros; (ii) 42 thousand euros, 79 thousand euros, 123 thousand
euros and 113 thousand euros; (iii) 55 thousand euros, 109 thousand euros, 169 thousand euros and
156 thousand euros, and seeking reimbursement of the amounts meanwhile paid in connection with
115
ZON OPTIMUS, SGPS, SA
the enforcement proceedings. This fee is a percentage decided annually by ANACOM (in 2009 it
was 0.5826%) of operators’ electronic communications revenues. The scheme is being introduced
gradually: ⅓ in the first year, ⅔ in the second year and 100% in the third year. ZON TV Cabo, ZON
TV Cabo Açoreana and ZON TV Cabo Madeirense claim, in addition to defects of unconstitutionality
and illegality, that only revenues from the electronic communications business per se, subject to
regulation by ANACOM, should be considered for the purposes of the application of the percentage
and the calculation of the fee payable, and that revenues from television content should be
excluded.
On 18 December 2012 a ruling was passed on the proceedings instigated by ZON TV Cabo Portugal
for 2009, for which the appeal was upheld, with no prior hearing, condemning ICP-ANACOM to pay
the costs. ICP-ANACOM appealed and by decision of July 2013 was not upheld.
The remaining proceedings are awaiting trial and decision.
ZON Optimus tendered in an auction for licences for a nationwide freeview generalist programme
service, to be broadcast via terrestrial television. The Regulator of Social Communication decided on
23 March 2009 to disqualify ZON Optimus’s bid, along with that of another bidder. ZON Optimus
has applied for judicial review of the decision. Meanwhile, in 2014, ZON Optimus gave up for the
appeal and ended the action.
33.3. TAX AUTHORITIES
During the course of the 2003 to 2013 financial years, certain companies of the ZON Optimus Group were
the subject of tax inspections for the 2001 to 2011 financial years. Following these inspections, ZON Optimus,
as the controlling company of the Tax Group, and companies not covered by Tax Group, were notified of the
corrections made to the Group's tax losses, to VAT and stamp tax and to make the payments related to the
corrections made to the above exercises. The total amount of the notifications is about 29.9 million euros.
Note that the Group considered that the corrections were unfounded, and contested the amounts mentioned.
The Group provided the bank guarantees demanded by the Tax Authorities in connection with these
proceedings, as stated in Note 31.
At end of year 2013 and taking advantage of the extraordinary settlement scheme of tax debts, the Group
settled 7.7 million euros (corresponding to notifications in the amount of 17.3 million euros less accrued
interests). This amount was recorded as "taxes receivable" non current net of the provision recorded in the
amount of 3.5 million euros (Note 21).
116
CONSOLIDATED MANAGEMENT REPORT 1Q14
As belief of the Board of Directors of the group, supported by our lawyers and tax advisors, the risk of loss of
these proceedings is not likely and the outcome thereof will not affect materially the consolidated position.
33.4. ACTIONS BY PORTUGAL TELECOM AGAINST ZON TV CABO
MADEIRENSE AND ZON TV CABO AÇOREANA
PT brought an action in Funchal Judicial Court against ZON TV Cabo Madeirense, claiming
payment of 1,608 thousand euros, plus accrued interest until the date of full settlement, for the
alleged use of ducts, supply of the MID service, supply of video and audio channels, operating,
maintenance and management costs of the Madeira/Porto Santo undersea cable and the use of
two fiber optic circuits.
The company contested the action, in particular the prices concerned, the services and PT's legal
capacity in respect of the ducts.
At the end of July 2013, a favorable decision was given to ZON TV Cabo Madeira, which, however,
PT appealed. The case is pending normal development.
In April 2012, following the decision made on 19 July 2011 in which ZON TV Cabo Açoreana was
acquitted, PT brought two new actions against ZON TV Cabo Açoreana, one relating to the MID
service and the other to the supply of video and audio channels, claiming payment of 222 thousand
euros and 316 thousand euros respectively, plus interest. They are awaiting decision. A sentence,
without impacting interests, reduced the amount payable by ZON TV Cabo Açoreana to about 97
thousand euro.
33.5. ACTION AGAINST ZON TV CABO
Already in 2014, a ZON TV Cabo provider’s of marketing services has brought a civil lawsuit seeking a
payment of about 1.243 thousand euros, by the alleged early termination of contract and for compensation.
It is belief of the Board that the arguments used are not correct, so the outcome of the proceeding will not
result in significant impact on the financial statements of the group. This action awaits for trial.
33.6. ACTIONS AGAINST SPORT TV
SPORT TV Portugal, S.A. was fined by the Competition Authority to the value of 3,730 thousand euros for the
alleged abuse of its dominant position in the domestic market of subscription channels with premium sport
content.
117
ZON OPTIMUS, SGPS, SA
SPORT TV is not in agreement with the decision and has therefore decided to appeal against the same to the
competent judicial authorities.
33.7. CONTRACTUAL PENALTIES
The general conditions that affect the agreement and termination of this contract between ZON Optimus and
its clients, establish that if the products and services provided by the client can no longer be used prior to the
end of the binding period, the client is obliged to immediately pay damages. At March 2014, damages
charged but not received by ZON TV Cabo and Optimus amount to a total of 21,403 thousand euros and
82,986 thousand euros, respectively. In the quarter ended 31 March 2014 were received and recorded in the
income statement 119 thousand euros and 1.415 thousand euros, respectively.
33.8. INTERCONNECTION TARIFFS
At 31 March 2014, accounts receivable and accounts payable include 37,139,253 euros and 29,913,608
euros, respectively, resulting from a dispute between the subsidiary Optimus – Comunicações, S.A. and,
essentially, the operator TMN – Telecomunicações Móveis, S.A., in relation to the indefinition of
interconnection tariffs, recorded in the year ended at 31 December 2001. In the lower court, the decision was
favorable to Optimus. The “Tribunal da Relação” (Court of Appeal), on appeal, rejected the intentions of TMN.
However, TMN again appealed to the “Supremo Tribunal de Justiça” (Supreme Court), for final and
permanent decision, who upheld the decision of the “Tribunal da Relação” (Court of Appeal), thus concluding
that the interconnection prices for 2001 were not defined. The settlement of outstanding amounts will depend
on the price that will be established.
SHARE INCENTIVE SCHEME 34.
The Share Incentive Schemes approved by the General Meetings of Shareholders on 27 April 2008 and 19
April 2010 with the aim of promoting employee loyalty, aligning their interests with the Company’s objectives
and creating more favorable conditions for the recruitment of staff of high strategic value, have been
implemented in accordance with the principles agreed at those meetings.
These incentive plans comprise a Standard Plan and a Senior Executive Plan. The Standard Plan is aimed at
eligible members selected by the responsible bodies, regardless of the roles they perform. In this plan the
vesting period for the assigned shares is five years, starting twelve months after the period to which the
respective assignment relates, at a rate of 20% a year. The Senior Executive Plan is aimed at eligible
members classed as Senior Executives, also selected by the responsible bodies. The Senior Executive Plan,
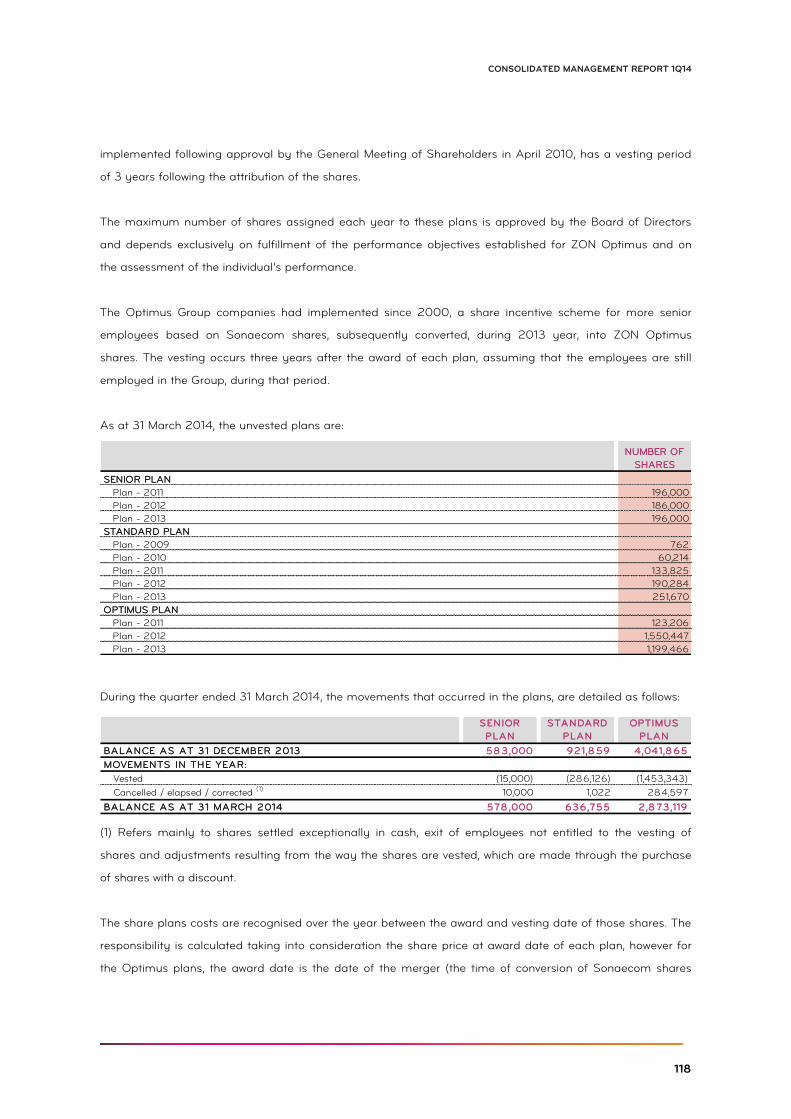
118
CONSOLIDATED MANAGEMENT REPORT 1Q14
implemented following approval by the General Meeting of Shareholders in April 2010, has a vesting period
of 3 years following the attribution of the shares.
The maximum number of shares assigned each year to these plans is approved by the Board of Directors
and depends exclusively on fulfillment of the performance objectives established for ZON Optimus and on
the assessment of the individual’s performance.
The Optimus Group companies had implemented since 2000, a share incentive scheme for more senior
employees based on Sonaecom shares, subsequently converted, during 2013 year, into ZON Optimus
shares. The vesting occurs three years after the award of each plan, assuming that the employees are still
employed in the Group, during that period.
As at 31 March 2014, the unvested plans are:
During the quarter ended 31 March 2014, the movements that occurred in the plans, are detailed as follows:
(1) Refers mainly to shares settled exceptionally in cash, exit of employees not entitled to the vesting of
shares and adjustments resulting from the way the shares are vested, which are made through the purchase
of shares with a discount.
The share plans costs are recognised over the year between the award and vesting date of those shares. The
responsibility is calculated taking into consideration the share price at award date of each plan, however for
the Optimus plans, the award date is the date of the merger (the time of conversion of Sonaecom shares
NUMBER OF
SHARES
SENIOR PLAN
Plan - 2011 196,000
Plan - 2012 186,000
Plan - 2013 196,000
STANDARD PLAN
Plan - 2009 762
Plan - 2010 60,214
Plan - 2011 133,825
Plan - 2012 190,284
Plan - 2013 251,670
OPTIMUS PLAN
Plan - 2011 123,206
Plan - 2012 1,550,447
Plan - 2013 1,199,466
SENIOR
PLAN
STANDARD
PLAN
OPTIMUS
PLAN
BALANCE AS AT 31 DECEMBER 2013 58 3,000 921,8 59 4,041,8 65
MOVEMENTS IN THE YEAR:
Vested (15,000) (286,126) (1,453,343)
Cancelled / elapsed / corrected (1) 10,000 1,022 284,597
BALANCE AS AT 31 MARCH 2014 578 ,000 636,755 2,8 73,119
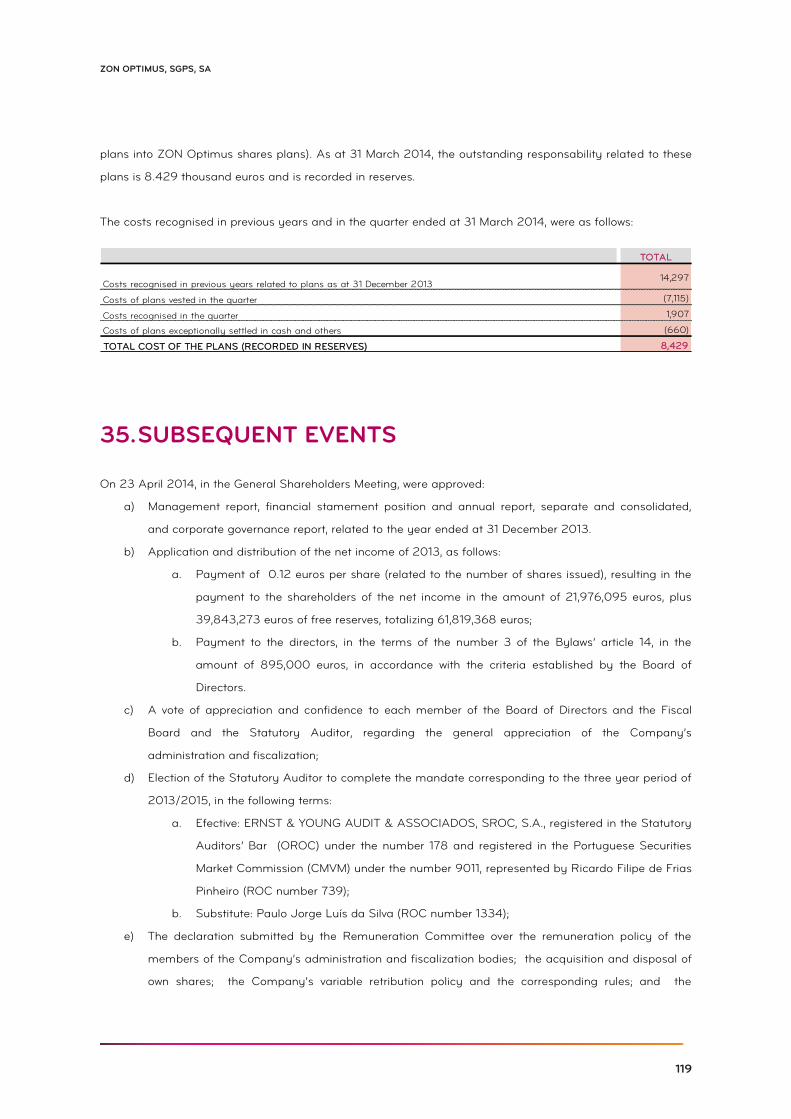
119
ZON OPTIMUS, SGPS, SA
plans into ZON Optimus shares plans). As at 31 March 2014, the outstanding responsability related to these
plans is 8.429 thousand euros and is recorded in reserves.
The costs recognised in previous years and in the quarter ended at 31 March 2014, were as follows:
SUBSEQUENT EVENTS 35.
On 23 April 2014, in the General Shareholders Meeting, were approved:
a) Management report, financial stamement position and annual report, separate and consolidated,
and corporate governance report, related to the year ended at 31 December 2013.
b) Application and distribution of the net income of 2013, as follows:
a. Payment of 0.12 euros per share (related to the number of shares issued), resulting in the
payment to the shareholders of the net income in the amount of 21,976,095 euros, plus
39,843,273 euros of free reserves, totalizing 61,819,368 euros;
b. Payment to the directors, in the terms of the number 3 of the Bylaws’ article 14, in the
amount of 895,000 euros, in accordance with the criteria established by the Board of
Directors.
c) A vote of appreciation and confidence to each member of the Board of Directors and the Fiscal
Board and the Statutory Auditor, regarding the general appreciation of the Company’s
administration and fiscalization;
d) Election of the Statutory Auditor to complete the mandate corresponding to the three year period of
2013/2015, in the following terms:
a. Efective: ERNST & YOUNG AUDIT & ASSOCIADOS, SROC, S.A., registered in the Statutory
Auditors’ Bar (OROC) under the number 178 and registered in the Portuguese Securities
Market Commission (CMVM) under the number 9011, represented by Ricardo Filipe de Frias
Pinheiro (ROC number 739);
b. Substitute: Paulo Jorge Luís da Silva (ROC number 1334);
e) The declaration submitted by the Remuneration Committee over the remuneration policy of the
members of the Company’s administration and fiscalization bodies; the acquisition and disposal of
own shares; the Company’s variable retribution policy and the corresponding rules; and the
TOTAL
Costs recognised in previous years related to plans as at 31 December 201314,297
Costs of plans vested in the quarter (7,115)
Costs recognised in the quarter 1,907
Costs of plans exceptionally settled in cash and others (660)
TOTAL COST OF THE PLANS (RECORDED IN RESERVES) 8,429
120
CONSOLIDATED MANAGEMENT REPORT 1Q14
following modification of the Company’s Bylaws: change (i) of the number 3 of the article 7, and (ii)
of the number 1 of the article 24 and renumeration of the paragraphs of this number.
In 5 May 2014, in accordance with the defined in Article 17 of the Securities Code, ZON OPTIMUS, SGPS, SA
(“ZON OPTIMUS” or “Company”) informed that it had received a qualified shareholding communication by
Lancaster Investment Management LLP.
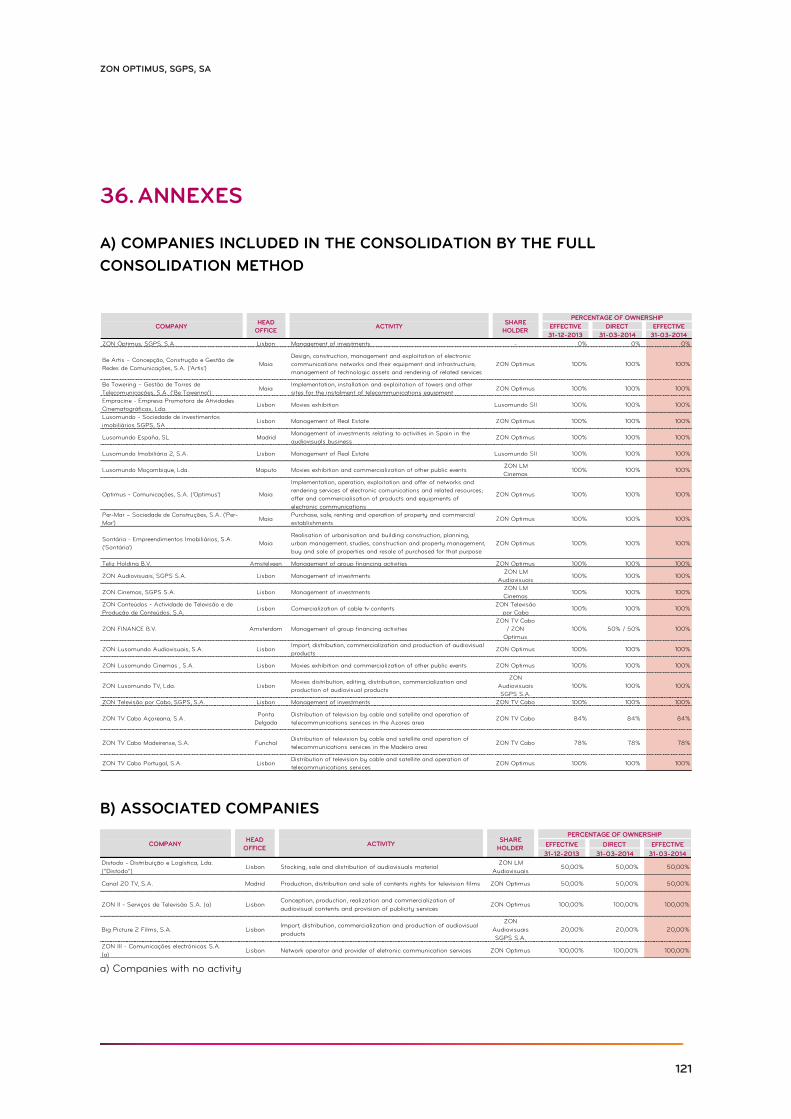
121
ZON OPTIMUS, SGPS, SA
ANNEXES 36.
A) COMPANIES INCLUDED IN THE CONSOLIDATION BY THE FULL
CONSOLIDATION METHOD
B) ASSOCIATED COMPANIES
a) Companies with no activity
EFFECTIVE DIRECT EFFECTIVE
31-12-2013 31-03-2014 31-03-2014
ZON Optimus, SGPS, S.A. Lisbon Management of investments - 0% 0% 0%
Be Artis – Concepção, Construção e Gestão de
Redes de Comunicações, S.A. ('Artis')Maia
Design, construction, management and exploitation of electronic
communications networks and their equipment and infrastructure,
management of technologic assets and rendering of related services
ZON Optimus 100% 100% 100%
Be Towering – Gestão de Torres de
Telecomunicações, S.A. (‘Be Towering’)Maia
Implementation, installation and exploitation of towers and other
sites for the instalment of telecommunications equipmentZON Optimus 100% 100% 100%
Empracine - Empresa Promotora de Atividades
Cinematográficas, Lda.Lisbon Movies exhibition Lusomundo SII 100% 100% 100%
Lusomundo - Sociedade de investimentos
imobiliários SGPS, SALisbon Management of Real Estate ZON Optimus 100% 100% 100%
Lusomundo España, SL MadridManagement of investments relating to activities in Spain in the
audiovisuals businessZON Optimus 100% 100% 100%
Lusomundo Imobiliária 2, S.A. Lisbon Management of Real Estate Lusomundo SII 100% 100% 100%
Lusomundo Moçambique, Lda. Maputo Movies exhibition and commercialization of other public eventsZON LM
Cinemas100% 100% 100%
Optimus - Comunicações, S.A. ('Optimus') Maia
Implementation, operation, exploitation and offer of networks and
rendering services of electronic comunications and related resources;
offer and commercialisation of products and equipments of
electronic communications
ZON Optimus 100% 100% 100%
Per-Mar – Sociedade de Construções, S.A. ('Per-
Mar')Maia
Purchase, sale, renting and operation of property and commercial
establishmentsZON Optimus 100% 100% 100%
Sontária - Empreendimentos Imobiliários, S.A.
('Sontária')Maia
Realisation of urbanisation and building construction, planning,
urban management, studies, construction and property management,
buy and sale of properties and resale of purchased for that purpose
ZON Optimus 100% 100% 100%
Teliz Holding B.V. Amstelveen Management of group financing activities ZON Optimus 100% 100% 100%
ZON Audiovisuais, SGPS S.A. Lisbon Management of investmentsZON LM
Audiovisuais100% 100% 100%
ZON Cinemas, SGPS S.A. Lisbon Management of investmentsZON LM
Cinemas100% 100% 100%
ZON Conteúdos - Actividade de Televisão e de
Produção de Conteúdos, S.A.Lisbon Comercialization of cable tv contents
ZON Televisão
por Cabo100% 100% 100%
ZON FINANCE B.V. Amsterdam Management of group financing activities
ZON TV Cabo
/ ZON
Optimus
100% 50% / 50% 100%
ZON Lusomundo Audiovisuais, S.A. LisbonImport, distribution, commercialization and production of audiovisual
productsZON Optimus 100% 100% 100%
ZON Lusomundo Cinemas , S.A. Lisbon Movies exhibition and commercialization of other public events ZON Optimus 100% 100% 100%
ZON Lusomundo TV, Lda. LisbonMovies distribution, editing, distribution, commercialization and
production of audiovisual products
ZON
Audiovisuais
SGPS S.A.
100% 100% 100%
ZON Televisão por Cabo, SGPS, S.A. Lisbon Management of investments ZON TV Cabo 100% 100% 100%
ZON TV Cabo Açoreana, S.A.Ponta
Delgada
Distribution of television by cable and satellite and operation of
telecommunications services in the Azores areaZON TV Cabo 84% 84% 84%
ZON TV Cabo Madeirense, S.A. FunchalDistribution of television by cable and satellite and operation of
telecommunications services in the Madeira areaZON TV Cabo 78% 78% 78%
ZON TV Cabo Portugal, S.A. LisbonDistribution of television by cable and satellite and operation of
telecommunications servicesZON Optimus 100% 100% 100%
HEAD
OFFICEACTIVITY
SHARE
HOLDER
PERCENTAGE OF OWNERSHIP
COMPANY
EFFECTIVE DIRECT EFFECTIVE
31-12-2013 31-03-2014 31-03-2014
Distodo - Distribuição e Logística, Lda.
("Distodo") Lisbon Stocking, sale and distribution of audiovisuals material
ZON LM
Audiovisuais50,00% 50,00% 50,00%
Canal 20 TV, S.A. Madrid Production, distribution and sale of contents rights for television films ZON Optimus 50,00% 50,00% 50,00%
ZON II - Serviços de Televisão S.A. (a) LisbonConception, production, realization and commercialization of
audiovisual contents and provision of publicity servicesZON Optimus 100,00% 100,00% 100,00%
Big Picture 2 Films, S.A. LisbonImport, distribution, commercialization and production of audiovisual
products
ZON
Audiovisuais
SGPS S.A.
20,00% 20,00% 20,00%
ZON III - Comunicações electrónicas S.A.
(a)Lisbon Network operator and provider of eletronic communication services ZON Optimus 100,00% 100,00% 100,00%
HEAD
OFFICEACTIVITY
SHARE
HOLDER
PERCENTAGE OF OWNERSHIP
COMPANY
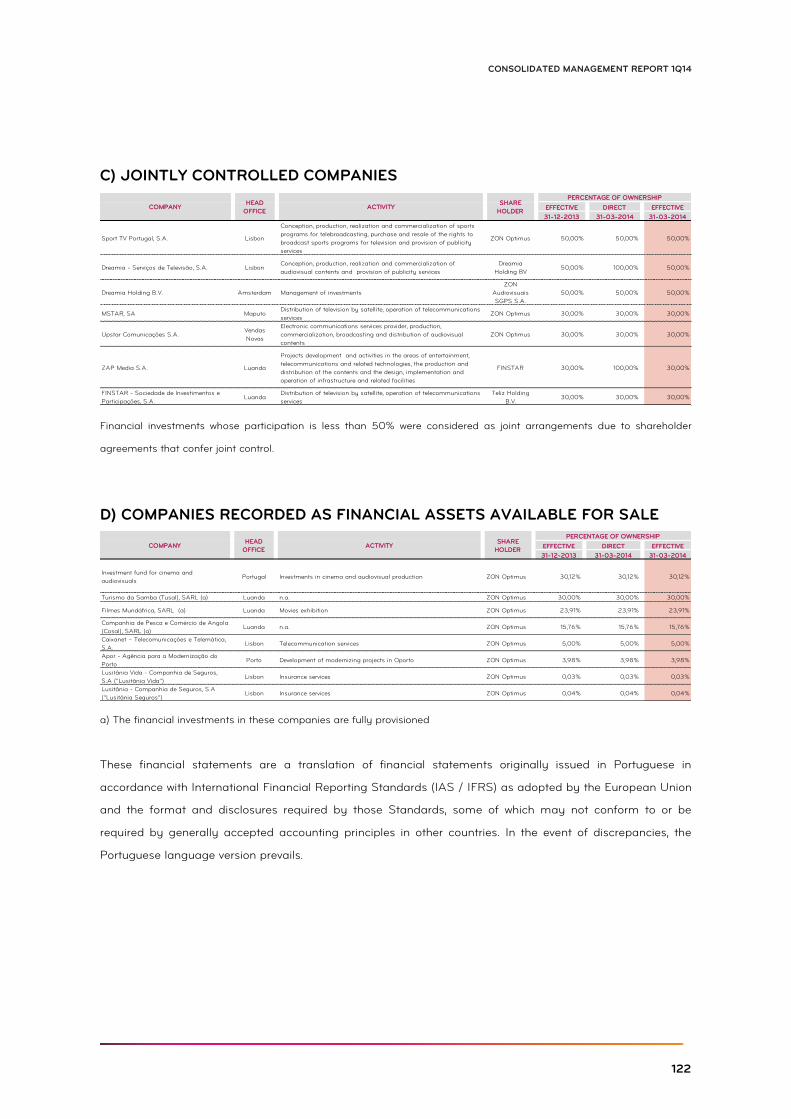
122
CONSOLIDATED MANAGEMENT REPORT 1Q14
C) JOINTLY CONTROLLED COMPANIES
Financial investments whose participation is less than 50% were considered as joint arrangements due to shareholder
agreements that confer joint control.
D) COMPANIES RECORDED AS FINANCIAL ASSETS AVAILABLE FOR SALE
a) The financial investments in these companies are fully provisioned
These financial statements are a translation of financial statements originally issued in Portuguese in
accordance with International Financial Reporting Standards (IAS / IFRS) as adopted by the European Union
and the format and disclosures required by those Standards, some of which may not conform to or be
required by generally accepted accounting principles in other countries. In the event of discrepancies, the
Portuguese language version prevails.
EFFECTIVE DIRECT EFFECTIVE
31-12-2013 31-03-2014 31-03-2014
Sport TV Portugal, S.A. Lisbon
Conception, production, realization and commercialization of sports
programs for telebroadcasting, purchase and resale of the rights to
broadcast sports programs for television and provision of publicity
services
ZON Optimus 50,00% 50,00% 50,00%
Dreamia - Serviços de Televisão, S.A. LisbonConception, production, realization and commercialization of
audiovisual contents and provision of publicity services
Dreamia
Holding BV50,00% 100,00% 50,00%
Dreamia Holding B.V. Amsterdam Management of investments
ZON
Audiovisuais
SGPS S.A.
50,00% 50,00% 50,00%
MSTAR, SA MaputoDistribution of television by satellite, operation of telecommunications
servicesZON Optimus 30,00% 30,00% 30,00%
Upstar Comunicações S.A.Vendas
Novas
Electronic communications services provider, production,
commercialization, broadcasting and distribution of audiovisual
contents
ZON Optimus 30,00% 30,00% 30,00%
ZAP Media S.A. Luanda
Projects development and activities in the areas of entertainment,
telecommunications and related technologies, the production and
distribution of the contents and the design, implementation and
operation of infrastructure and related facilities
FINSTAR 30,00% 100,00% 30,00%
FINSTAR - Sociedade de Investimentos e
Participações, S.A.Luanda
Distribution of television by satellite, operation of telecommunications
services
Teliz Holding
B.V.30,00% 30,00% 30,00%
HEAD
OFFICEACTIVITY
SHARE
HOLDER
PERCENTAGE OF OWNERSHIP
COMPANY
EFFECTIVE DIRECT EFFECTIVE
31-12-2013 31-03-2014 31-03-2014
Investment fund for cinema and
audiovisualsPortugal Investments in cinema and audiovisual production ZON Optimus 30,12% 30,12% 30,12%
Turismo da Samba (Tusal), SARL (a) Luanda n.a. ZON Optimus 30,00% 30,00% 30,00%
Filmes Mundáfrica, SARL (a) Luanda Movies exhibition ZON Optimus 23,91% 23,91% 23,91%
Companhia de Pesca e Comércio de Angola
(Cosal), SARL (a)Luanda n.a. ZON Optimus 15,76% 15,76% 15,76%
Caixanet – Telecomunicações e Telemática,
S.A.Lisbon Telecommunication services ZON Optimus 5,00% 5,00% 5,00%
Apor - Agência para a Modernização do
PortoPorto Development of modernizing projects in Oporto ZON Optimus 3,98% 3,98% 3,98%
Lusitânia Vida - Companhia de Seguros,
S.A ("Lusitânia Vida")Lisbon Insurance services ZON Optimus 0,03% 0,03% 0,03%
Lusitânia - Companhia de Seguros, S.A
("Lusitânia Seguros")Lisbon Insurance services ZON Optimus 0,04% 0,04% 0,04%
HEAD
OFFICEACTIVITY
SHARE
HOLDER
PERCENTAGE OF OWNERSHIP
COMPANY

123
ZON OPTIMUS, SGPS, SA