Embed Size (px)
Citation preview
1
2
CONSOLIDATED NET REVENUE OF R$ 7.8 BILLION (+8.1%) IN 1S18 CONSOLIDATED EBITDA OF R$ 1.1 BILLION, EBITDA MARGIN OF 14.1% (%NR)
Rio de Janeiro, August 9th of 2018 – Lojas Americanas S.A. [B3: LAME3 (common) and LAME4 (preferred)], one of the leading retail chains in
Brazil,with 1,329 stores in 06/30/2018 and present in all Brazilian states, announces today its results for the 2nd quarter of 2018 (2Q18) and the 1st semester of 2018 (1S18).The accounting information that serves as the basis for the comments that follow are presented in accordance with the international financial reporting standards (IFRS), and the rules issued by the Brazilian Securities Exchange Commission (CVM) and in Reais (R$). The comparisons refer to the 2nd quarter of 2017 (2Q17) and the 1st semester of 2017 (1S17).
*Reflects the CPC 47/IFRS 15 e CPC 48/ IFRS 9 adjustments, as indicated in page 3 (accounting changes).
Easter Effect Due to the Easter mismatch, which in 2018 took place on April 1
st, the analysis of the results will be directed
towards the accumulated result for the semester.
Net Revenue In the 1S18, the parent company’s net revenue was R$ 4.9 billion, a growth of 13.0% in relation to the 1S17. For the consolidated result, the net revenue was of R$ 7.8 billion, a growth of 8.1% in relation to the 1S17.
“Same Stores” Net Revenue The growth in “same stores” net revenue was of 9.4% in the 1S18, the highest growth in the past 4 years.
Gross Margin The parent company’s gross margin was of 39.0% of the net revenue in the 1S18, a variation of -1.2 p.p. For the consolidated result, the gross margin reached 33.6% of the net revenue, an increase of 2.1 p.p.
Adjusted EBITDA and EBITDA Margin The parent company’s Adjusted EBITDA reached R$ 953.5 million in the 1S18 and the EBITDA margin (%NR) was of 19.3%. The consolidated Adjusted EBITDA totaled R$ 1.1 billion in the 1S18 and the EBITDA margin (%NR) was of 14.1%, a growth of 0.3 p.p..
Net Income The consolidated net income was of R$ 46.3 million in the 1S18.
Expansion: “85 anos em 5 – Somos Mais Brasil” In the 1S18, we opened 27 new stores and until the moment we have 165 stores with signed contracts. For 2018 we have the objective to open 200 new stores, in accordance with our expansion plan.
+AQUI In the 1S18 we reached 1.7 million credit cards issued, besides starting the sale of Spotify cards.
Convenience store: local The official launch of the local brand and the slogan "Bem pertinho de você" is accompanied by the change of the visual identity of the existing stores and an advertising campaign that emphasizes the convenience of the stores.
Digital Lab We completed the first phase of the project for the implementation of a laboratory store on the PUC-RJ campus.
Lojas Americanas in the B2W Marketplace We expanded the operation by providing 10 thousand Lojas Americanas items in the B2W Marketplace.
B2W Digital B2W Digital announces a growth of 25.0% in the 2Q18 GMV result and positive cash generation on the last 12 months. In addition, B2W’s Marketplace continues to grow rapidly reaching a R$ 1.5 bilion (+85.3%) GMV in the 2Q18, with a stake of 47.2% in the Total GMV.
1S18 1S17 Var. (%) Financial Highlights (R$ MM)* 1S18 1S17 Var. (%)
4,935.2 4,366.7 13.0% Net Revenue 7,837.2 7,246.8 8.1%
1,923.0 1,754.4 9.6% Gross Profit 2,632.2 2,285.8 15.2%
39.0% 40.2% -1.2 p.p. Gross Margin (%NR) 33.6% 31.5% +2.1 p.p.
953.5 877.2 8.7% Adjusted EBITDA 1,101.4 997.4 10.4%
19.3% 20.1% -0.8 p.p. Adjusted EBITDA Margin (%NR) 14.1% 13.8% +0.3 p.p.
46.3 -70.2 - Net Income 46.3 -70.2 -
0.9% -1.6% +2.5 p.p. Net Margin (%NR) 0.6% -1.0% +1.6 p.p.
Parent Company Consolidated
3
ACCOUNTING CHANGES
From 2018 onwards, the CPC 47/IFRS 15 – Revenues from Customer Contracts – and CPC 48/IFRS 9 – Financial Instruments – came into effect. In order to facilitate the analysis of the results presented in this report, as well as to guarantee transparency, the Company opted to restate the results for the same period of 2017 (Appendix III - 1S17 new criteria vs. 2Q17 old criteria), following the CPCs/IFRS orientations. The main impacts in the 2Q18 results are described below:
Services: Previously, sales revenue, taxes and cost of sales were registered, currently, only commission on sales and taxes are recorded.
Intercompany operations: Previously, sales revenue, taxes and cost of sales were recorded and currently only the comission on sales and taxes are registered.
Commercial Agreements with Suppliers (related parties): Previously were recorded as a deduction from selling expenses and currently recorded as a deduction from cost of sales.
Conditional Discounts: Previously registered as financial expenses and, currently, registered as a deduction from gross revenue.
The 2Q18 and 2Q17 data are presented over the press release in accordance with the new accounting standards. COMMENTS ON OPERATIONAL PERFORMANCE EASTER EFFECT
In 2018, Easter happened on April 1
st, when in 2017 it occurred on April 16
th, causing a mismatch of the results of
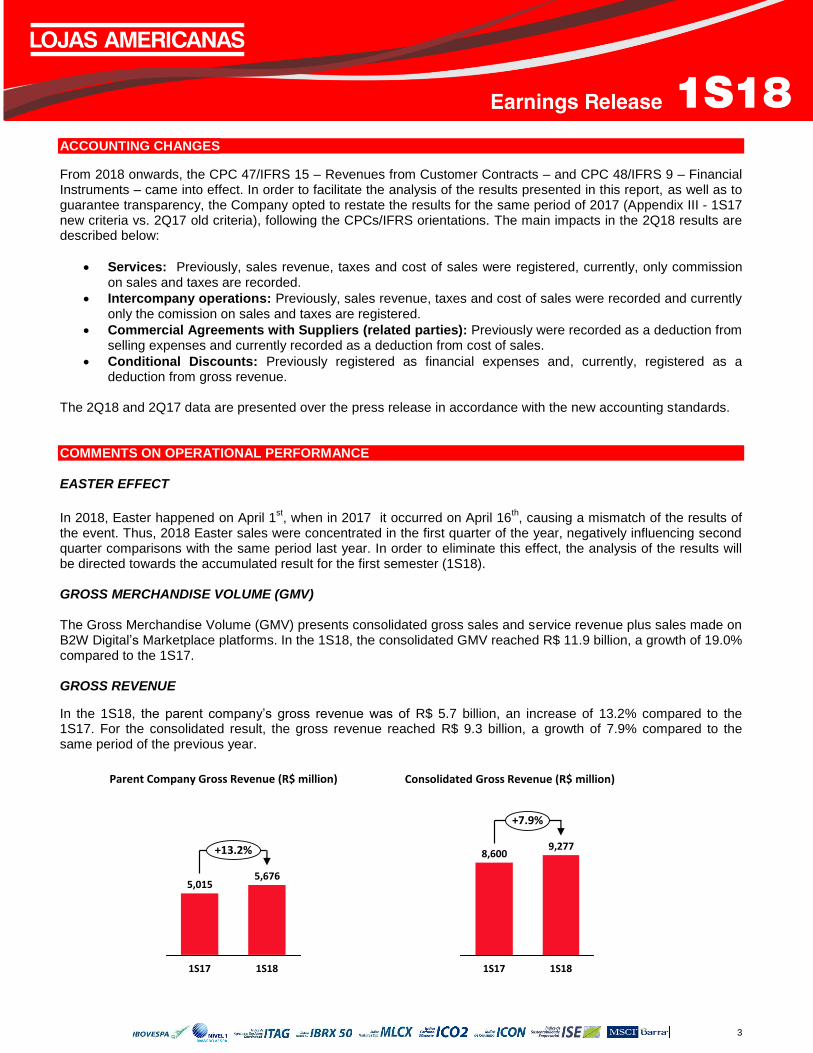
the event. Thus, 2018 Easter sales were concentrated in the first quarter of the year, negatively influencing second quarter comparisons with the same period last year. In order to eliminate this effect, the analysis of the results will be directed towards the accumulated result for the first semester (1S18). GROSS MERCHANDISE VOLUME (GMV) The Gross Merchandise Volume (GMV) presents consolidated gross sales and service revenue plus sales made on B2W Digital’s Marketplace platforms. In the 1S18, the consolidated GMV reached R$ 11.9 billion, a growth of 19.0% compared to the 1S17. GROSS REVENUE
In the 1S18, the parent company’s gross revenue was of R$ 5.7 billion, an increase of 13.2% compared to the 1S17. For the consolidated result, the gross revenue reached R$ 9.3 billion, a growth of 7.9% compared to the same period of the previous year.
1S18
5,676
1S17
5,015
+13.2%
Parent Company Gross Revenue (R$ million)
1S18
9,277
1S17
8,600
+7.9%
Consolidated Gross Revenue (R$ million)
4
NET REVENUE
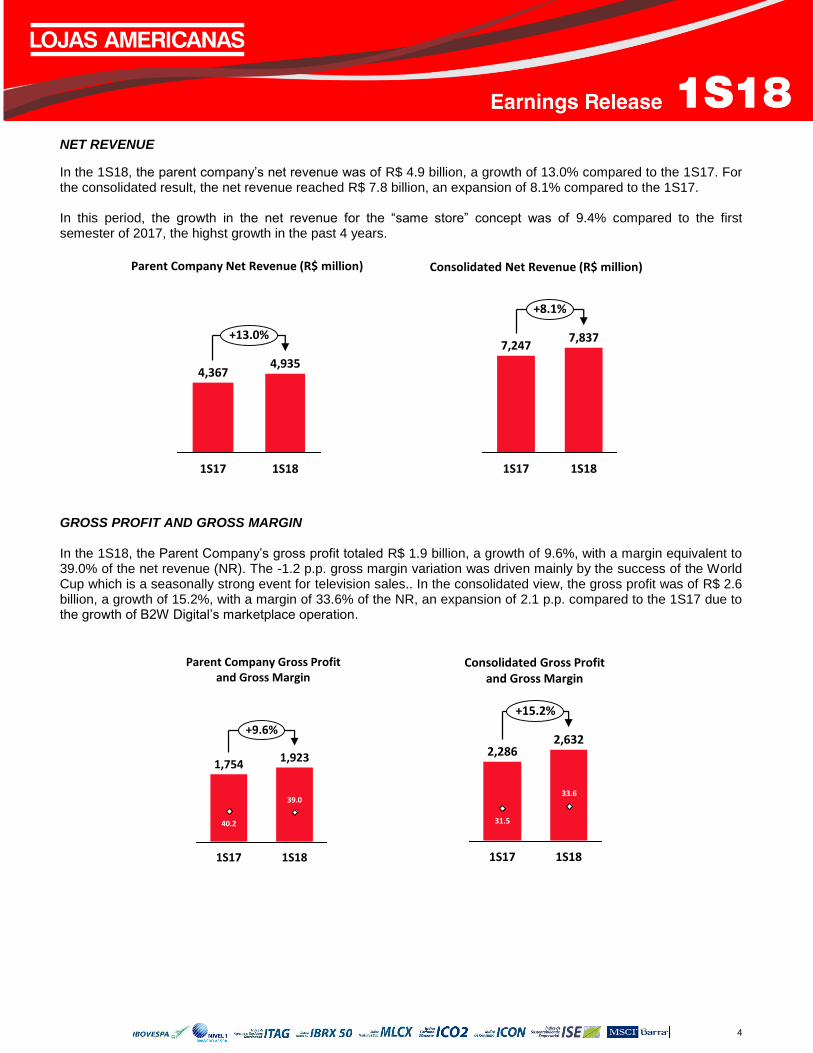
In the 1S18, the parent company’s net revenue was of R$ 4.9 billion, a growth of 13.0% compared to the 1S17. For the consolidated result, the net revenue reached R$ 7.8 billion, an expansion of 8.1% compared to the 1S17. In this period, the growth in the net revenue for the “same store” concept was of 9.4% compared to the first semester of 2017, the highst growth in the past 4 years.
GROSS PROFIT AND GROSS MARGIN In the 1S18, the Parent Company’s gross profit totaled R$ 1.9 billion, a growth of 9.6%, with a margin equivalent to 39.0% of the net revenue (NR). The -1.2 p.p. gross margin variation was driven mainly by the success of the World Cup which is a seasonally strong event for television sales.. In the consolidated view, the gross profit was of R$ 2.6 billion, a growth of 15.2%, with a margin of 33.6% of the NR, an expansion of 2.1 p.p. compared to the 1S17 due to the growth of B2W Digital’s marketplace operation.
+13.0%
1S18
4,935
1S17
4,367
Parent Company Net Revenue (R$ million)
+8.1%
1S18
7,837
1S17
7,247
Consolidated Net Revenue (R$ million)
1,923
1S18
40.2
1S17
39.0
1,754
+9.6%
Parent Company Gross Profit and Gross Margin
1S18
2,632
33.6
1S17
2,286
31.5
+15.2%
Consolidated Gross Profit and Gross Margin
5
SALES, GENERAL AND ADMINISTRATIVE EXPENSES
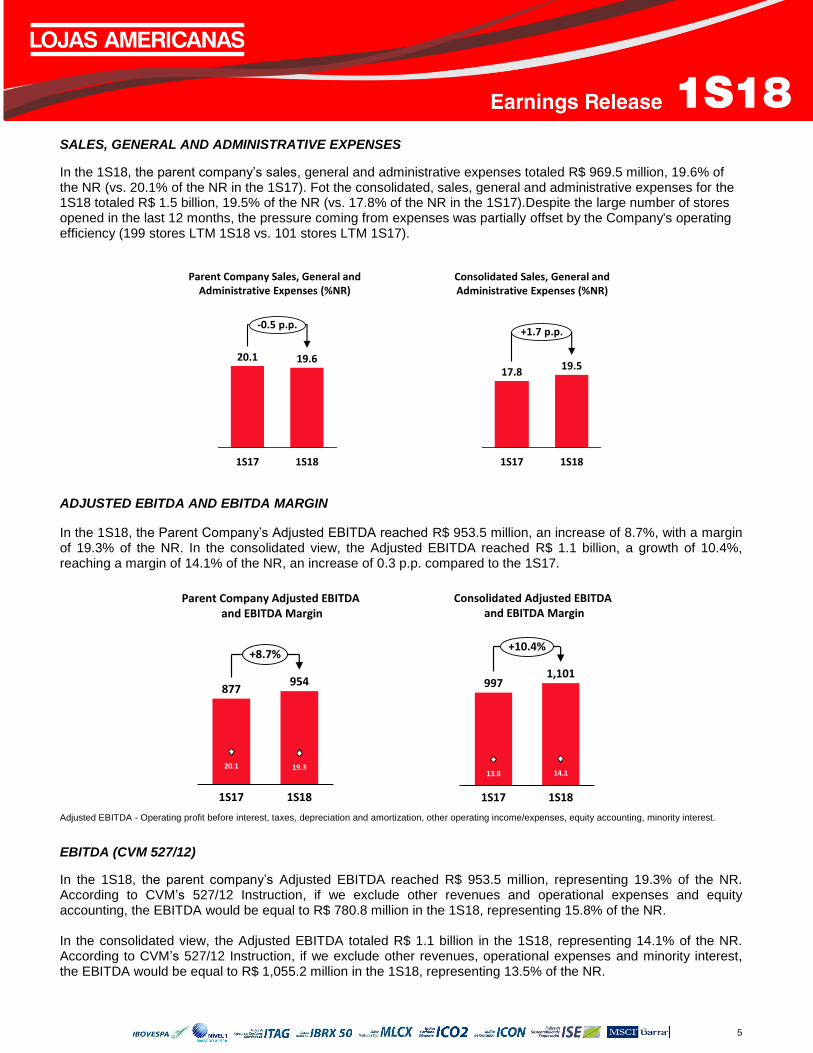
In the 1S18, the parent company’s sales, general and administrative expenses totaled R$ 969.5 million, 19.6% of the NR (vs. 20.1% of the NR in the 1S17). Fot the consolidated, sales, general and administrative expenses for the 1S18 totaled R$ 1.5 billion, 19.5% of the NR (vs. 17.8% of the NR in the 1S17).Despite the large number of stores opened in the last 12 months, the pressure coming from expenses was partially offset by the Company's operating efficiency (199 stores LTM 1S18 vs. 101 stores LTM 1S17).
ADJUSTED EBITDA AND EBITDA MARGIN
In the 1S18, the Parent Company’s Adjusted EBITDA reached R$ 953.5 million, an increase of 8.7%, with a margin of 19.3% of the NR. In the consolidated view, the Adjusted EBITDA reached R$ 1.1 billion, a growth of 10.4%, reaching a margin of 14.1% of the NR, an increase of 0.3 p.p. compared to the 1S17.
Adjusted EBITDA - Operating profit before interest, taxes, depreciation and amortization, other operating income/expenses, equity accounting, minority interest.
EBITDA (CVM 527/12)
In the 1S18, the parent company’s Adjusted EBITDA reached R$ 953.5 million, representing 19.3% of the NR. According to CVM’s 527/12 Instruction, if we exclude other revenues and operational expenses and equity accounting, the EBITDA would be equal to R$ 780.8 million in the 1S18, representing 15.8% of the NR. In the consolidated view, the Adjusted EBITDA totaled R$ 1.1 billion in the 1S18, representing 14.1% of the NR. According to CVM’s 527/12 Instruction, if we exclude other revenues, operational expenses and minority interest, the EBITDA would be equal to R$ 1,055.2 million in the 1S18, representing 13.5% of the NR.
-0.5 p.p.
1S18
19.6
1S17
20.1
Parent Company Sales, General andAdministrative Expenses (%NR)
+1.7 p.p.
1S18
19.5
1S17
17.8
Consolidated Sales, General andAdministrative Expenses (%NR)
877954
19.320.1
1S17 1S18
+8.7%
Parent Company Adjusted EBITDAand EBITDA Margin
997
13.8
1S17 1S18
14.1
1,101
+10.4%
Consolidated Adjusted EBITDAand EBITDA Margin
6
VARIATION IN THE WORKING CAPITAL
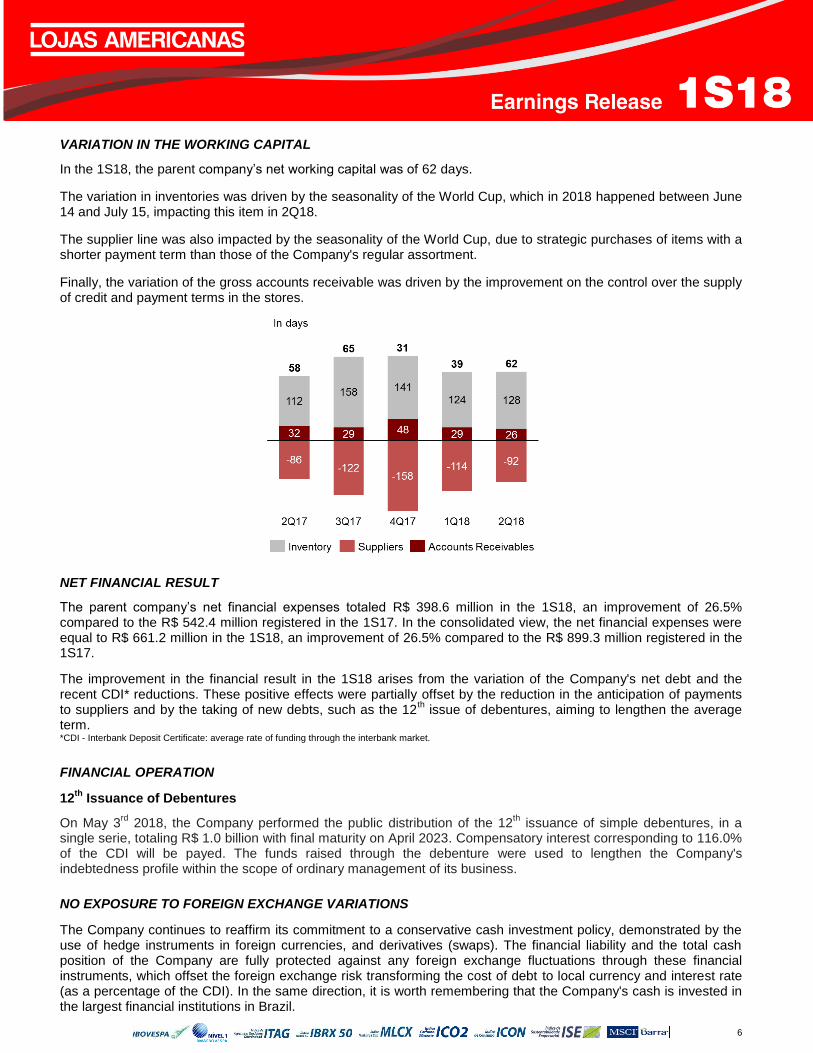
In the 1S18, the parent company’s net working capital was of 62 days.
The variation in inventories was driven by the seasonality of the World Cup, which in 2018 happened between June 14 and July 15, impacting this item in 2Q18.
The supplier line was also impacted by the seasonality of the World Cup, due to strategic purchases of items with a shorter payment term than those of the Company's regular assortment.
Finally, the variation of the gross accounts receivable was driven by the improvement on the control over the supply of credit and payment terms in the stores.
NET FINANCIAL RESULT
The parent company’s net financial expenses totaled R$ 398.6 million in the 1S18, an improvement of 26.5% compared to the R$ 542.4 million registered in the 1S17. In the consolidated view, the net financial expenses were equal to R$ 661.2 million in the 1S18, an improvement of 26.5% compared to the R$ 899.3 million registered in the 1S17.
The improvement in the financial result in the 1S18 arises from the variation of the Company's net debt and the recent CDI* reductions. These positive effects were partially offset by the reduction in the anticipation of payments to suppliers and by the taking of new debts, such as the 12
th issue of debentures, aiming to lengthen the average
term. *CDI - Interbank Deposit Certificate: average rate of funding through the interbank market.
FINANCIAL OPERATION
12th
Issuance of Debentures
On May 3rd
2018, the Company performed the public distribution of the 12th issuance of simple debentures, in a
single serie, totaling R$ 1.0 billion with final maturity on April 2023. Compensatory interest corresponding to 116.0% of the CDI will be payed. The funds raised through the debenture were used to lengthen the Company's indebtedness profile within the scope of ordinary management of its business.
NO EXPOSURE TO FOREIGN EXCHANGE VARIATIONS
The Company continues to reaffirm its commitment to a conservative cash investment policy, demonstrated by the use of hedge instruments in foreign currencies, and derivatives (swaps). The financial liability and the total cash position of the Company are fully protected against any foreign exchange fluctuations through these financial instruments, which offset the foreign exchange risk transforming the cost of debt to local currency and interest rate (as a percentage of the CDI). In the same direction, it is worth remembering that the Company's cash is invested in the largest financial institutions in Brazil.
7
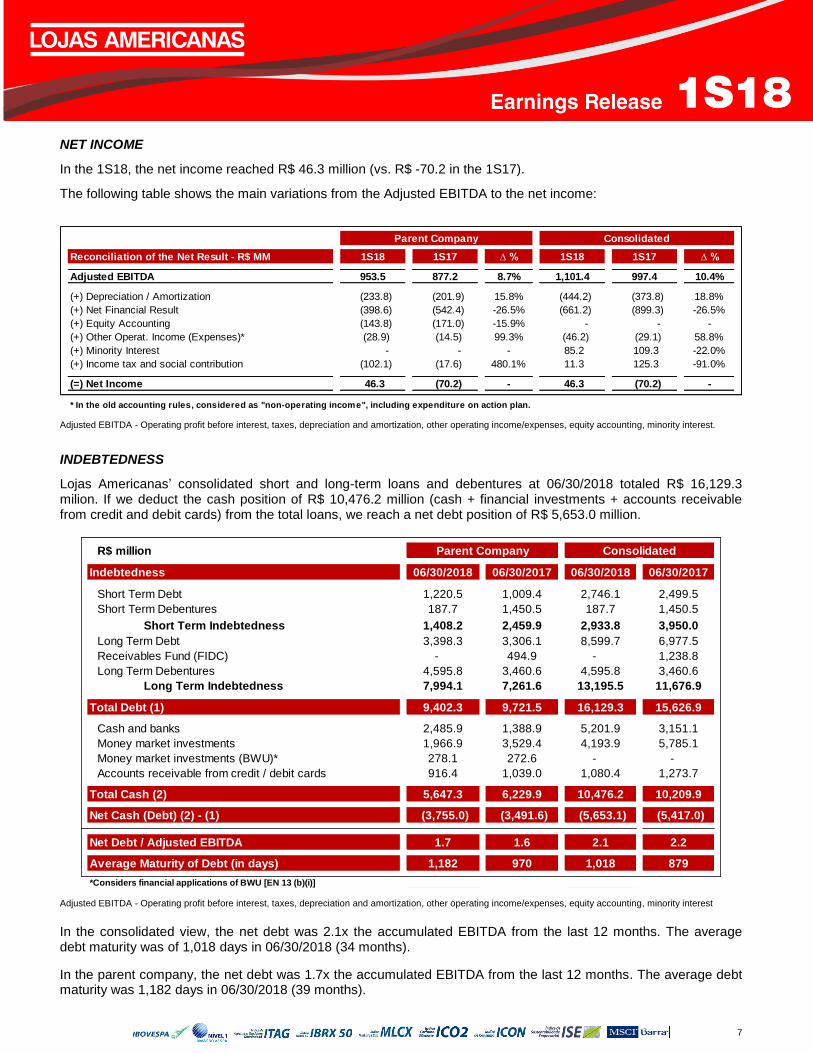
NET INCOME
In the 1S18, the net income reached R$ 46.3 million (vs. R$ -70.2 in the 1S17).
The following table shows the main variations from the Adjusted EBITDA to the net income:
Adjusted EBITDA - Operating profit before interest, taxes, depreciation and amortization, other operating income/expenses, equity accounting, minority interest.
INDEBTEDNESS
Lojas Americanas’ consolidated short and long-term loans and debentures at 06/30/2018 totaled R$ 16,129.3 milion. If we deduct the cash position of R$ 10,476.2 million (cash + financial investments + accounts receivable from credit and debit cards) from the total loans, we reach a net debt position of R$ 5,653.0 million.
Adjusted EBITDA - Operating profit before interest, taxes, depreciation and amortization, other operating income/expenses, equity accounting, minority interest In the consolidated view, the net debt was 2.1x the accumulated EBITDA from the last 12 months. The average debt maturity was of 1,018 days in 06/30/2018 (34 months).
In the parent company, the net debt was 1.7x the accumulated EBITDA from the last 12 months. The average debt maturity was 1,182 days in 06/30/2018 (39 months).
Reconciliation of the Net Result - R$ MM 1S18 1S17 ∆ % 1S18 1S17 ∆ %
Adjusted EBITDA 953.5 877.2 8.7% 1,101.4 997.4 10.4%
(+) Depreciation / Amortization (233.8) (201.9) 15.8% (444.2) (373.8) 18.8%
(+) Net Financial Result (398.6) (542.4) -26.5% (661.2) (899.3) -26.5%
(+) Equity Accounting (143.8) (171.0) -15.9% - - -
(+) Other Operat. Income (Expenses)* (28.9) (14.5) 99.3% (46.2) (29.1) 58.8%
(+) Minority Interest - - - 85.2 109.3 -22.0%
(+) Income tax and social contribution (102.1) (17.6) 480.1% 11.3 125.3 -91.0%
(=) Net Income 46.3 (70.2) - 46.3 (70.2) -
* In the old accounting rules, considered as "non-operating income", including expenditure on action plan.
ConsolidatedParent Company
R$ million
Indebtedness 06/30/2018 06/30/2017 06/30/2018 06/30/2017
Short Term Debt 1,220.5 1,009.4 2,746.1 2,499.5
Short Term Debentures 187.7 1,450.5 187.7 1,450.5
Short Term Indebtedness 1,408.2 2,459.9 2,933.8 3,950.0
Long Term Debt 3,398.3 3,306.1 8,599.7 6,977.5
Receivables Fund (FIDC) - 494.9 - 1,238.8
Long Term Debentures 4,595.8 3,460.6 4,595.8 3,460.6
Long Term Indebtedness 7,994.1 7,261.6 13,195.5 11,676.9
Total Debt (1) 9,402.3 9,721.5 16,129.3 15,626.9
Cash and banks 2,485.9 1,388.9 5,201.9 3,151.1
Money market investments 1,966.9 3,529.4 4,193.9 5,785.1
Money market investments (BWU)* 278.1 272.6 - -
916.4 1,039.0 1,080.4 1,273.7
Total Cash (2) 5,647.3 6,229.9 10,476.2 10,209.9
Net Cash (Debt) (2) - (1) (3,755.0) (3,491.6) (5,653.1) (5,417.0)
Net Debt / Adjusted EBITDA 1.7 1.6 2.1 2.2
Average Maturity of Debt (in days) 1,182 970 1,018 879
*Considers financial applications of BWU [EN 13 (b)(i)]
Consolidated
Accounts receivable from credit / debit cards
Parent Company
8
To face the uncertainties and the volatility of the financial market, Lojas Americanas has the orientation of
preserving cash and prolonging the debt profile. Throughout the last few years, several measures have been taken
to this end, which let us consolidate our plan of long-term growth for the Company.
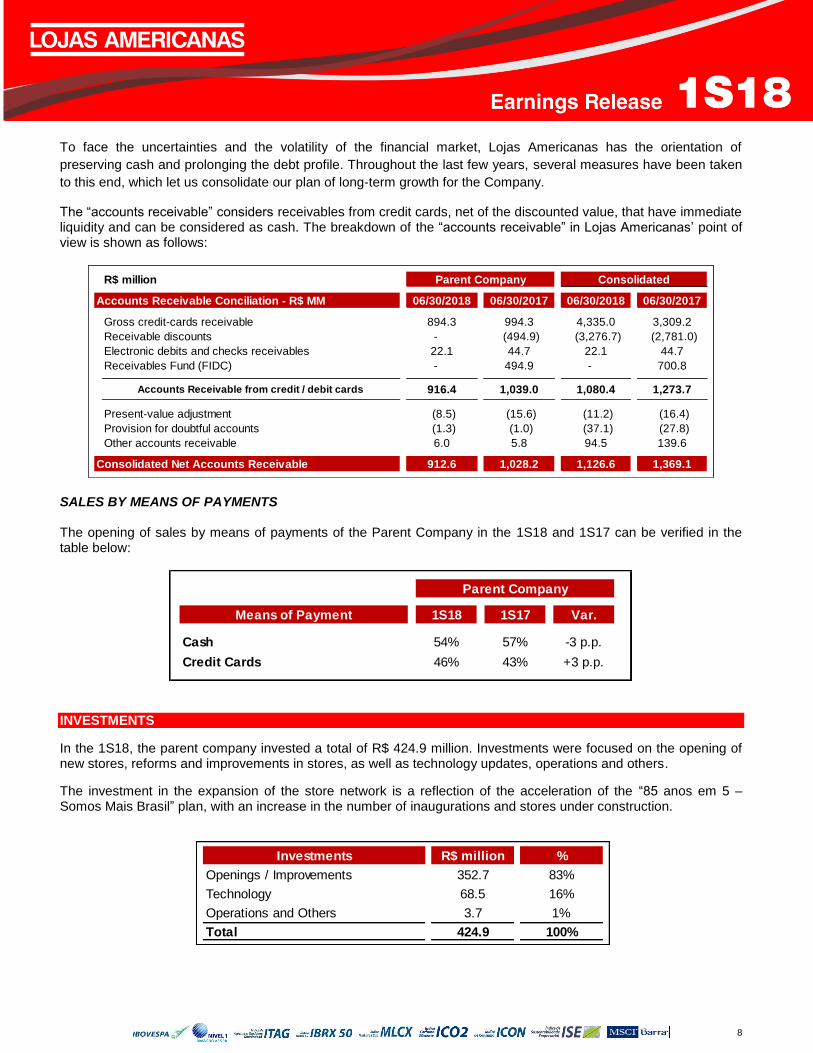
The “accounts receivable” considers receivables from credit cards, net of the discounted value, that have immediate liquidity and can be considered as cash. The breakdown of the “accounts receivable” in Lojas Americanas’ point of view is shown as follows:
SALES BY MEANS OF PAYMENTS The opening of sales by means of payments of the Parent Company in the 1S18 and 1S17 can be verified in the table below:
INVESTMENTS
In the 1S18, the parent company invested a total of R$ 424.9 million. Investments were focused on the opening of new stores, reforms and improvements in stores, as well as technology updates, operations and others.
The investment in the expansion of the store network is a reflection of the acceleration of the “85 anos em 5 – Somos Mais Brasil” plan, with an increase in the number of inaugurations and stores under construction.
R$ million
Accounts Receivable Conciliation - R$ MM 06/30/2018 06/30/2017 06/30/2018 06/30/2017
Gross credit-cards receivable 894.3 994.3 4,335.0 3,309.2
Receivable discounts - (494.9) (3,276.7) (2,781.0)
Electronic debits and checks receivables 22.1 44.7 22.1 44.7
Receivables Fund (FIDC) - 494.9 - 700.8
916.4 1,039.0 1,080.4 1,273.7
Present-value adjustment (8.5) (15.6) (11.2) (16.4)
Provision for doubtful accounts (1.3) (1.0) (37.1) (27.8)
Other accounts receivable 6.0 5.8 94.5 139.6
Consolidated Net Accounts Receivable 912.6 1,028.2 1,126.6 1,369.1
Accounts Receivable from credit / debit cards
Parent Company Consolidated
Means of Payment 1S18 1S17 Var.
Cash 54% 57% -3 p.p.
Credit Cards 46% 43% +3 p.p.
Parent Company
Investments R$ million %
Openings / Improvements 352.7 83%
Technology 68.5 16%
Operations and Others 3.7 1%
Total 424.9 100%
9
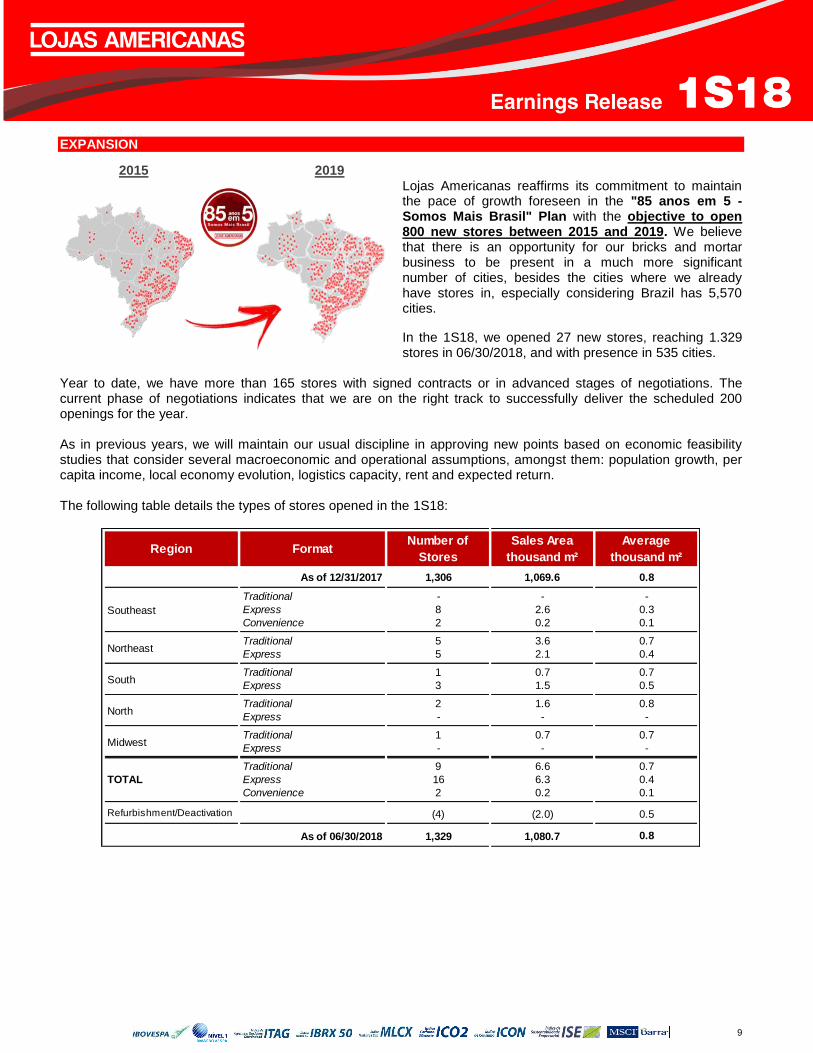
EXPANSION
2015 2019 Lojas Americanas reaffirms its commitment to maintain the pace of growth foreseen in the "85 anos em 5 - Somos Mais Brasil" Plan with the objective to open 800 new stores between 2015 and 2019. We believe that there is an opportunity for our bricks and mortar business to be present in a much more significant number of cities, besides the cities where we already have stores in, especially considering Brazil has 5,570 cities.
In the 1S18, we opened 27 new stores, reaching 1.329 stores in 06/30/2018, and with presence in 535 cities.
Year to date, we have more than 165 stores with signed contracts or in advanced stages of negotiations. The current phase of negotiations indicates that we are on the right track to successfully deliver the scheduled 200 openings for the year. As in previous years, we will maintain our usual discipline in approving new points based on economic feasibility studies that consider several macroeconomic and operational assumptions, amongst them: population growth, per capita income, local economy evolution, logistics capacity, rent and expected return. The following table details the types of stores opened in the 1S18:
Region FormatNumber of
Stores
Sales Area
thousand m²
Average
thousand m²
1,306 1,069.6 0.8,
Traditional - - -
Express 8 2.6 0.3
Convenience 2 0.2 0.1
Traditional 5 3.6 0.7
Express 5 2.1 0.4
Traditional 1 0.7 0.7
Express 3 1.5 0.5
Traditional 2 1.6 0.8
Express - - -
Traditional 1 0.7 0.7
Express - - -
Traditional 9 6.6 0.7
Express 16 6.3 0.4
Convenience 2 0.2 0.1
Refurbishment/Deactivation (4) (2.0) 0.5
1,329 1,080.7 0.8
South
North
Midwest
TOTAL
As of 06/30/2018
As of 12/31/2017
Southeast
Northeast
10
DIGITAL PLATFORM
B2W DIGITAL ANNOUNCES GMV GROWTH OF 25% IN 2Q18 AND POSITIVE CASH GENERATION IN THE LAST 12 MONTHS
B2W Digital is the leader in Latin America and its purpose is to CONNECT PEOPLE, BUSINESS, PRODUCTS AND SERVICES IN A DIGITAL PLATFORM.
Lojas Americanas is the controlling shareholder of B2W DIGITAL with a participation of 61.99%. The shares of the Company are negotiated through the ticker BTOW3 on B3, in the Novo Mercado segment, which has the highest Corporate Governance index in Brazil. B2W DIGITAL HIGHLIGHTS (2Q18):
B2W Digital reduced cash consumption by 91% in 2Q18. Cash consumption in 2Q18 totaled R$ 33.9 MM, down R$ 328.4 MM from R$ 362.3 MM in 2Q17.
B2W Digital reported positive cash generation of R$ 41.7 MM in the last twelve months (LTM). This is a significant evolution compared to a cash consumption of R$ 1,656.4 MM recorded in the same period of the previous year.
B2W Marketplace connected more than 3.3 thousand new Sellers in 2Q18, exiting from a base of 12.1 thousand Sellers in March / 2018 to more than 15.4 thousand Sellers in June / 2018. The Seller base increased by 2.6x from 2Q17 to 2Q18 (from 6.0 thousand to 15.4 thousand Sellers).
B2W Entrega connected more than 3.6 thousand Sellers in 2Q18, totaling a base of 11.3 thousand Sellers and representing 73.4% of Sellers connected to the Marketplace.
LET’S launched Fast Delivery program, which will reduce delivery times by 50% (on average) for 1P items and 3P items (for sellers connected to B2W Entrega). The Fast Delivery establishes a new format for the Freight Menu: 1. “Click & Collect NOW”: product is picked and available for in-store pickup within 1 hour (Brazil
Nationwide) 2. “Click & Collect”: product is picked and available for in-store pickup within 48 hours (Main Capitals) 3. “2 Hours”: delivery in up to 2 hours (Capitals: SP and RJ) 4. “Same Day”: delivery in up to 8 hours (Capitals: SP and RJ) 5. “Next Day”: delivery in up to 24 hours (Capitals: SP and RJ) 6. “2 Days”: delivery in up to 48 hours (Capitals: SP, RJ, MG, PR, SC, RS, and PE) 7. “Standard”: delivery within 7 days (Brazil Nationwide)
LET’S launched Direct Collect, the largest first mile start-up in the country. Direct Collect will retrieve products sold by Marketplace Sellers (Medium and Small). The new service will allow more sellers to be connected to B2W Entrega, reducing delivery times, improving the shopping experience, and increasing sales.
IF – “Innovation and Future” officially launched AME Digital, the B2W digital payment account. The Ame Digital app has registered 5 thousand downloads / day, and in the last 60 days, more than 300 thousand accounts have been opened. Throughout 2018, this new business unit of the Company will continue to gain representation, with a fantastic roadmap of new services and functionalities to be launched.
B2W Digital was elected the most innovative Company in Brazil in the "Commerce" category. The Marvin technology (open source system of artificial intelligence) won the Valor Inovação Brasil award in the “Commerce” category. The award is promoted by Valor Econômico newspaper and PwC Strategy consultancy. Marvin is instrumental in enhancing B2W's Last Mile, Buy Box, Pricing, Product Search (SEO) systems, among others.
For more information about B2W Digital, click here.
11
SERVICE PLATFORM: +AQUI
+AQUI is responsible for the management and promotion of services at Lojas Americanas and has been presenting fast growth and significant evolution in its strategic plan.
Aiming to "realize dreams” and meet people’s consumption needs, +AQUI has the premise of providing credit, protecting assets and surpassing client’s expectations providing excellent service. Currently, +AQUI is present in 337 Lojas Americanas spread throughout 166 cities in 16 states of the country, in addition to the Federal District.
+AQUI seeks partnerships with specialized companies that are outstanding in their sectors of activity with the objective of further expanding its portfolio of services, guaranteeing solutions for the diverse demands of its clients and by acting in two strategic verticals: i) Assisted sales and ii) Self-service. In the 1S18, +AQUI reached 1.7 million Lojas Americanas cards issued, in addition to having generated a 42% increase in transactions compared to the 1S17. Also during the 1S18, personal loan sales increased by 308% compared to the same period last year. Lojas Americanas remains enthusiastic about the opportunities presented by the evolution of +AQUI, which this year is focusing on the increase of store productivity and the expansion and diversification of its service portfolio. 1S18 HIGHLIGHTS +AQUI positively influenced Lojas Americanas' result, having offered, over the course of the 1S18, services to more than 1.3 million people. With the objective of unifying the offer of services within the stores, the operation of the Americanas.com kiosk became a part of +AQUI’s scope. The assisted sale in this important instrument allows us to leverage the result and the offer of services, offering a complete assortment to the customer, with personalized sales and access to the more than 6 million items offered at the Americanas.com website. New Service:
i. Spotify: Expanding its portfolio, now comprised of more than 25 digital content, +AQUI started selling Spotify cards, offering the options of one, three and six months of access to the app’s Premium plan. This is another payment option for users of this service. ii. Plano Controle: +AQUI offers the Claro Control Plan, which aims to meet needs of those who do not want surprises in their mobile account. iii. Serasa Consultation: CPFs (own and third party) and CNPJs (National Register of Legal Entities) monitoring is a new service offered by +AQUI. iv. Personal Loan Portocred: In order to increase credit options, +AQUI has started a new partnership to offer personal loans.
12
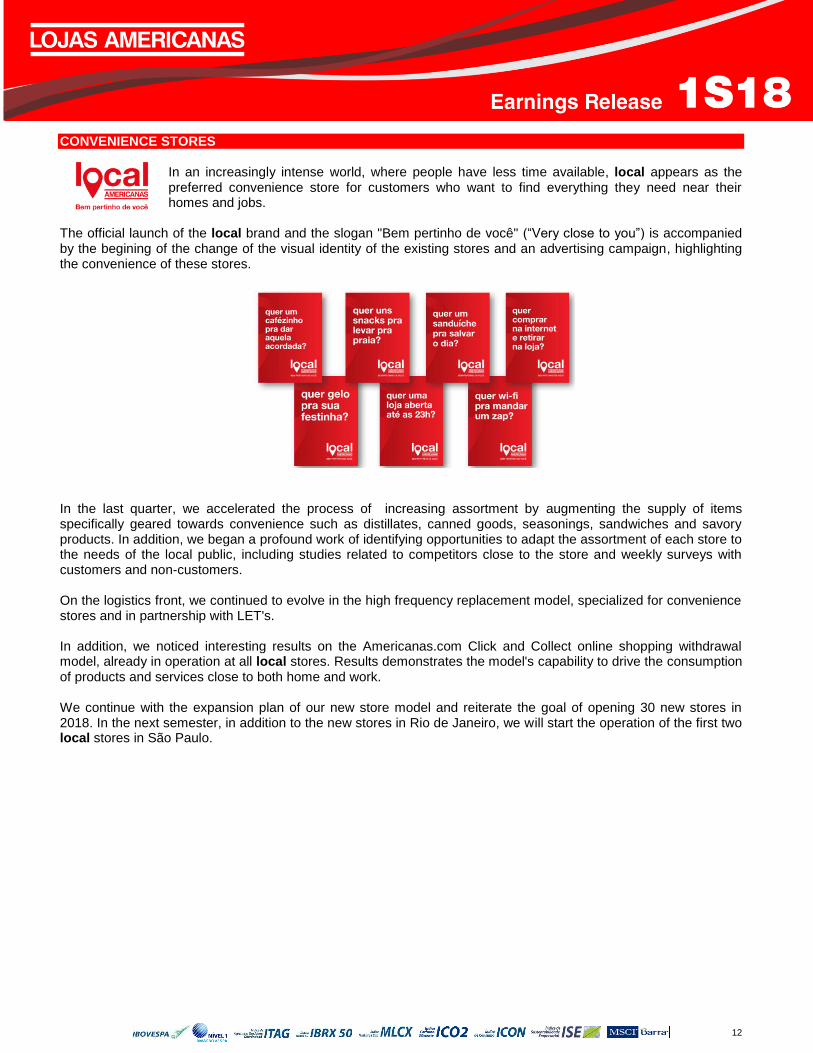
CONVENIENCE STORES In an increasingly intense world, where people have less time available, local appears as the preferred convenience store for customers who want to find everything they need near their homes and jobs.
The official launch of the local brand and the slogan "Bem pertinho de você" (“Very close to you”) is accompanied by the begining of the change of the visual identity of the existing stores and an advertising campaign, highlighting the convenience of these stores. In the last quarter, we accelerated the process of increasing assortment by augmenting the supply of items specifically geared towards convenience such as distillates, canned goods, seasonings, sandwiches and savory products. In addition, we began a profound work of identifying opportunities to adapt the assortment of each store to the needs of the local public, including studies related to competitors close to the store and weekly surveys with customers and non-customers. On the logistics front, we continued to evolve in the high frequency replacement model, specialized for convenience stores and in partnership with LET's. In addition, we noticed interesting results on the Americanas.com Click and Collect online shopping withdrawal model, already in operation at all local stores. Results demonstrates the model's capability to drive the consumption of products and services close to both home and work. We continue with the expansion plan of our new store model and reiterate the goal of opening 30 new stores in 2018. In the next semester, in addition to the new stores in Rio de Janeiro, we will start the operation of the first two local stores in São Paulo.
13
PRIVATE LABEL
Lojas Americanas has 15 private labels, offering quality products at fair prices in various categories such as food, sweets and candies, household goods, clothing, stationery, toys, among others. In the first half of 2018, we continued with the strategy of expanding our private labels and increasing product portfolio. For the D'elicce label, in addition to the success seen during Easter’s when we offered a great diversity of chocolate eggs, mini chocolate eggs and Easter cakes, we had several chocolate gift options for Mother's Day and Valentine's Day. For the Basic+ label, in the 1S18, we launched the already successful line of underwear. In addition, to take advantage of the World Cup event, the label developed caps, t-shirts, coats and children's clothing in order for customers to cheer for Brazil. Also, to protect ourselves from winter, we have developed a complete line with options such as coats, jackets, blouses, scarves, spandex pantyhose and slippers. For the Leven label, we launched mini granola cookies, multigrain integral snacks, fruit bars, fruit juices in both 200ml and 1L bottles and the big bet of the semester, our water bottle, available in the 510ml version (with and without gas) and version 1L (without gas).
LET’S – LOGISTICS AND DISTRIBUTION
The shared management platform for the logistics and distribution assets of Lojas Americanas and B2W. LET'S is building a flexible fulfillment model (Flexible Fulfillment Platform) to maximize each company's competencies to capture every opportunity of cross-platform operation. In this sense, several initiatives are already underway, including the acceleration of
the important O2O fronts (Online to Offline): Lojas Americanas in B2W Digital’s Marketplace: Lojas Americanas intensified its operation as a seller in B2W's Marketplace, making new categories available for sale. As a consequence, the supply of products increased by 67%, reaching 10 thousand items (vs. 6 thousand in the 1Q18). Furthermore, with the evolution of LET's logistics, we have further increased our capillarity, taking Lojas Americanas products to almost 1,000 different cities in the states of SP, RJ and MG. By the end of the year, the operation will cover all of Brazil.
Click and Collect: Currently available at 580 Lojas Americanas (vs. 400 stores in the 1Q18), including the assortment of sellers connected to B2W Entrega. A survey directed at clients, showed that the Lojas Americanas Click and Collect service has more than 95% of approval. In addition, half of the customers who withdrew products bought an item at the store, (mainly from the food and bombonière departments). The operation will be present in 800 stores by the end of the year, becoming the only model of Click and Collect with presence in all of the states of Brazil. Click and Collect Now: The initiative enables any physical store to be a seller in the B2W Marketplace, with product withdrawal (store inventory) within 1 hour after its online purchase. Throughout 2018, all Lojas Americanas will be connected to the program.
B2W Entrega - Drop off: By the end of 2018, B2W Entrega will make available a new order picking template for Marketplace sellers who can post their products at Lojas Americanas.
14
DIGITAL LAB
With the objective to encourage research, to execute experiments and to search for solutions for the Company’s current and future challenges, as well as to develop new talents, we created a laboratory at the Pontifical Catholic University of Rio de Janeiro (PUC-RJ).
Pricing In order to intermediate the cooperation program between PUC-RJ and the Lojas Americanas’ commercial department, the Company has created a new business department, with the objective of transforming theoretical solutions into practices that bring measurable results. After the analysis drawn from the first line studied, sweets and candies, pricing models that establish sales behavior of the items in the stores were defined. Thus, we identified the competitive prices to maximize the result and obtained volume and margin increases in the line. During the planning phase for the World Cup event, we established a pricing model for the audio and video category and we achieved positive results. The Pricing project has been expanded to hair coloring lines within the Department of Hygiene and Beauty. This way, we intend to maintain the scope of the initial project, analyzing the profile and behavior of customers, which will help in combining the results of the studies, with commercial actions in the practice of competitive prices, bringing profitability to the Company. In addition, studies will be extended seeking a better understanding of the effects of cross-demand and the performance and positioning of prices by region between Lojas Americanas and competitors. The project is part of a continuous improvement process being used as a support to the Company's commercial decisions. Store Laboratory
Still under the scope of PUC-RJ’s research laboratory we created a project to implement a store laboratory on PUC-RJ’s campus, developed through the technical cooperation between Lojas Americanas and PUC-RJ, involving research, education and practice. After the end of classes, and as a result of a series of discussions and workshops, the first cycle of the project was completed in July with the delivery of an architectural project for the store laboratory, as well as a scope of projects to be developed during the next cycle: building the actual store.
In addition, through the deconstruction exercise of a conventional store, that is, from the rupture of concepts and models already used by Lojas Americanas and by other traditional retailers, and with the objective of meeting the principles of economic and socio-environmental sustainability, mobility, flexibility and adaptability of the physical space, the second cycle of the project will be the construction of a store. The main objective behind the store is to serve as a laboratory for new processes and technologies.
We also highlight the fact that all initiatives and other projects related to the store laboratory aim to improve customer experience, in an ongoing process of experimentation of new technologies, evaluation and redefinition of solutions as global retail trends converge to an increasingly digital and efficient operation in the physical world.
15
APP AMERICANAS.COM GET THE APP GET A DISCOUNT The Lojas Americanas discount area on the Americanas.com app showed a strong expansion of use by customers in our more than 1,320 stores. After 10 months of operation, offered discounts have been accessed more than 10 million times, meeting a variety of in-store consumption needs. In the discount area, there has been a development in browsing experience and clients can now filter through the discounted product by category.
SOCIAL MEDIA Lojas Americanas continues to grow its presence in the digital world. We have recently reached the significant number of 2.5 million followers on Instagram, and on Facebook we have reached the mark of 11 million followers. We continue among the 50 biggest pages of Brazil on Facebook, being the best placed retailer. Globally, we are among the top 5 physical retailers and Top 100 brands.
With a lower cost than traditional media, social networks have become a great opportunity to advertise products to customers. Through them we get a return on promotions, we are able to listen to the suggestions and feedback given by clients, providing our commercial team with relevant and strategic information. We also use these tools to promote new private label products and financial products and services, giving visibility to new items and services available at our stores.
AWARDS AND RECOGNITIONS Lojas Americanas invests in actions that improve its management processes such as improvements in customer service, quality control of products and services, supplier audits, operation of distribution centers and optimization of internal processes. As a consequence of this effort, the Company has received several awards and recognitions that reinforce the brand's value, its reputation and its commitment to customers. Among the awards and recognitions received in the 2Q18, the highlights were:
Marcas Mais – Estadão Lojas Americanas reached the 1
st place in the "Appliances and Furniture Stores" category. The survey published by
O Estado S. Paulo, in partnership with the TroianoBranding consultancy, is in its 4th edition and measures the
relationship of consumer engagement with brands, going beyond other surveys, that only measure how much the brand is remembered. The interviews were conducted with about 11,500 consumers.
O Melhor de SP Serviços - Folha de São Paulo Lojas Americanas won the 1
st place in the "Department Store" category in the study published by Folha de SP, in
partnership with Datafolha. The survey is in its 3rd
edition and makes an x-ray of the best services in São Paulo, through online interviews with consumers (over 1,000 respondents), analyzing more than 30 categories. Marcas Mais Valiosas do Brasil – IstoÉ Dinheiro Lojas Americanas ranked as the most valuable retailer in Brazil in the IstoÉ Dinheiro rank. The rank of the Most Valuable Trademarks in Brazil is the result of a partnership between IstoÉ Dinheiro, Kantar Consulting and the WPP Group. In 2018, more than 300 Brazilian brands were evaluated, reaching the 60 most valuable in the country, through financial analysis and brand performance.
16
SUSTAINABILITY In line with best practices in the market, for the fifth consecutive year, we released Lojas Americanas 2017 Annual Report by following the guidelines of the Global Reporting Initiative (GRI). Also, for the first time, the Report followed the integrated reporting format and was audited by a third party. These advances reinforce our commitment to the consistency and transparency of socio-environmental and economic information.
Lojas Americanas is part of the portfolio of companies of the Business Sustainability Index (ISE) 2018 of B3 - Brasil, Bolsa, Balcão. ISE takes into account corporate sustainability, that is, the company's level of commitment to sustainable development in the social, economic, financial, environmental and climate change areas.
In the social segment, Lojas Americanas invited the Amazonas Sustainable Foundation (FAS) to integrate its team of partners. The institution will receive social investments from the Company and will focus on the development of complementary education and income generation projects in riverside communities. In addition, we renewed our partnership with Projeto Grael, which will develop a new front, a course in retail operations aimed at young adults that are already part of the institution; the “Galpão Aplauso” Project, in Rio de Janeiro, expanding the offer of the logistics operator course; and “Livros nas Praças”, which carries more than two thousand copies of books for communities in Rio de Janeiro. Finally, we reaffirm our partnership with B3 - Brasil, Bolsa e Balcão and, between 2018 and 2019, we will contribute to 11 projects listed on the BVSA platform.
17
GENERAL CONSIDERATIONS
ABOUT LOJAS AMERICANAS S.A.
Lojas Americanas, one of the main retail chains in Brazil, is present all over the national territory through its multichannel chain, which comprises bricks-and-mortar stores, e-commerce, kiosks, telesales, TV channel and catalogues operations. The Company operates with two store formats: Traditional and Express. The first one has an average sales area of 1,000 square meters, an automated replenishment model and an assortment of 60,000 items while the second format has an average sales area of 400 square meters, just-in-time logistics and an assortment of 15,000 items, selected according to each location’s needs. Additionally, the Company is developing the new convenience store model with a mix of products directed to food convenience. Lojas Americanas’ assortment is in continuous evolution, always aiming to exceed clients’ expectations when meeting their needs.
In 06/30/2018, the 1,329 stores – 824 in the Traditional format, 496 in the Express format and 9 Convenience stores – have a sales area equivalent to 1,080.4 thousand square meter. In addition, they are present in 535 cities on all Brazilian states and are served by four distribution centers, located in Minas Gerais, Pernambuco, São Paulo and Rio de Janeiro. Our stores aredistributed as follows: 53.0% in Southeast region, 19.4% in the South/Midwest and 27.5% in the North/Northeast.
Lojas Americanas’ shares are listed on the B3 through ticker symbols LAME3 (common) and LAME4 (preferred).
For more information of the multiple and complementary platform of the Company, click here.
CORPORATE GOVERNANCE
Lojas Americanas S.A. has been listed on the Brazilian Stock Exchange (B3) since 1940. The Company has a shareholder base composed of common shares (LAME3) and preferred shares (LAME4). In addition, the Company approved in an Extraordinary General Meeting held on August 17
th, 2017 the proposal to migrate to the special
listing segment of the Level 1 of Corporate Governance. The Company has a Board of Directors composed by eight members – five appointed by the controllers and three appointed by the Board of Directors. Lojas Americanas also has a Fiscal Council formed by three members, one indicated by the controllers and two indicated by the minority shareholders.
“We Always Want More”
18
APPENDIX I – INCOME STATEMENT - CONSOLIDATED
Adjusted EBITDA - Operating profit before interest, taxes, depreciation and amortization, other operating income/expenses and minority Interest.
Lojas Americanas S.A.
Income Statement
(in million of Brazilian reais)2Q18 2Q17 Variation 1S18 1S17 Variation
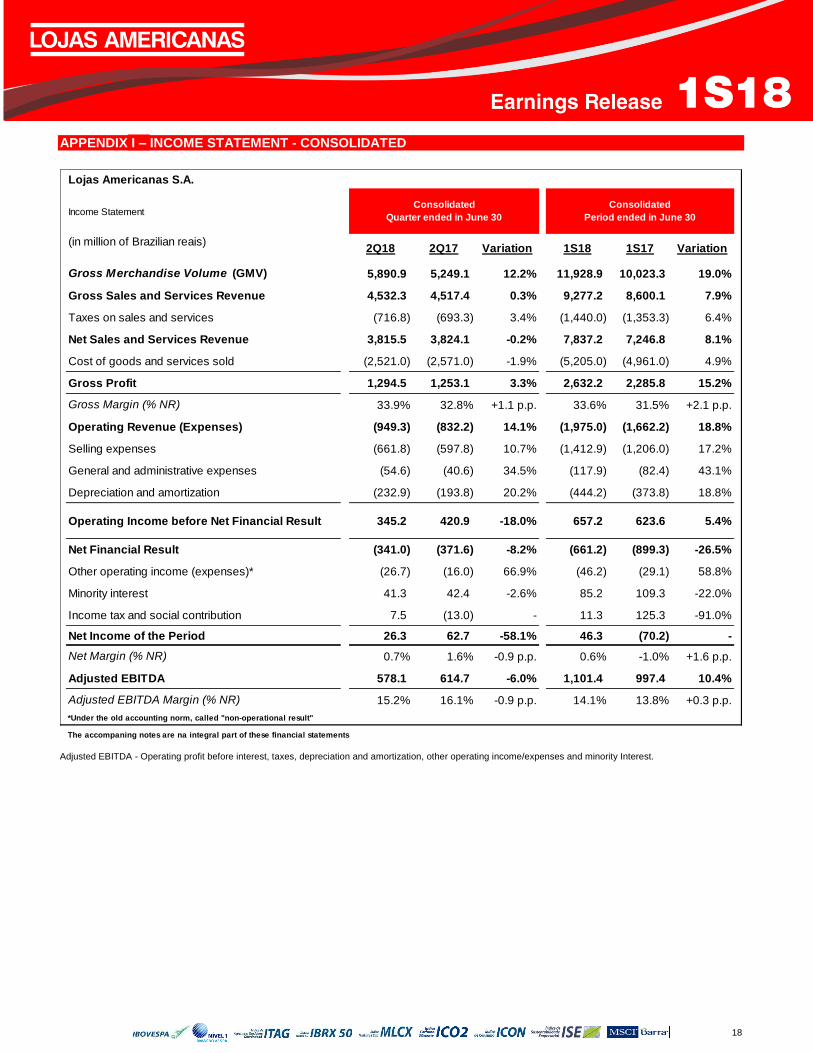
Gross Merchandise Volume (GMV) 5,890.9 5,249.1 12.2% 11,928.9 10,023.3 19.0%
Gross Sales and Services Revenue 4,532.3 4,517.4 0.3% 9,277.2 8,600.1 7.9%
Taxes on sales and services (716.8) (693.3) 3.4% (1,440.0) (1,353.3) 6.4%
Net Sales and Services Revenue 3,815.5 3,824.1 -0.2% 7,837.2 7,246.8 8.1%
Cost of goods and services sold (2,521.0) (2,571.0) -1.9% (5,205.0) (4,961.0) 4.9%
Gross Profit 1,294.5 1,253.1 3.3% 2,632.2 2,285.8 15.2%
Gross Margin (% NR) 33.9% 32.8% +1.1 p.p. 33.6% 31.5% +2.1 p.p.
Operating Revenue (Expenses) (949.3) (832.2) 14.1% (1,975.0) (1,662.2) 18.8%
Selling expenses (661.8) (597.8) 10.7% (1,412.9) (1,206.0) 17.2%
General and administrative expenses (54.6) (40.6) 34.5% (117.9) (82.4) 43.1%
Depreciation and amortization (232.9) (193.8) 20.2% (444.2) (373.8) 18.8%
Operating Income before Net Financial Result 345.2 420.9 -18.0% 657.2 623.6 5.4%
Net Financial Result (341.0) (371.6) -8.2% (661.2) (899.3) -26.5%
Other operating income (expenses)* (26.7) (16.0) 66.9% (46.2) (29.1) 58.8%
Minority interest 41.3 42.4 -2.6% 85.2 109.3 -22.0%
Income tax and social contribution 7.5 (13.0) - 11.3 125.3 -91.0%
Net Income of the Period 26.3 62.7 -58.1% 46.3 (70.2) -
Net Margin (% NR) 0.7% 1.6% -0.9 p.p. 0.6% -1.0% +1.6 p.p.
Adjusted EBITDA 578.1 614.7 -6.0% 1,101.4 997.4 10.4%
Adjusted EBITDA Margin (% NR) 15.2% 16.1% -0.9 p.p. 14.1% 13.8% +0.3 p.p.
*Under the old accounting norm, called "non-operational result"
The accompaning notes are na integral part of these financial statements
Consolidated
Period ended in June 30
Consolidated
Quarter ended in June 30
19
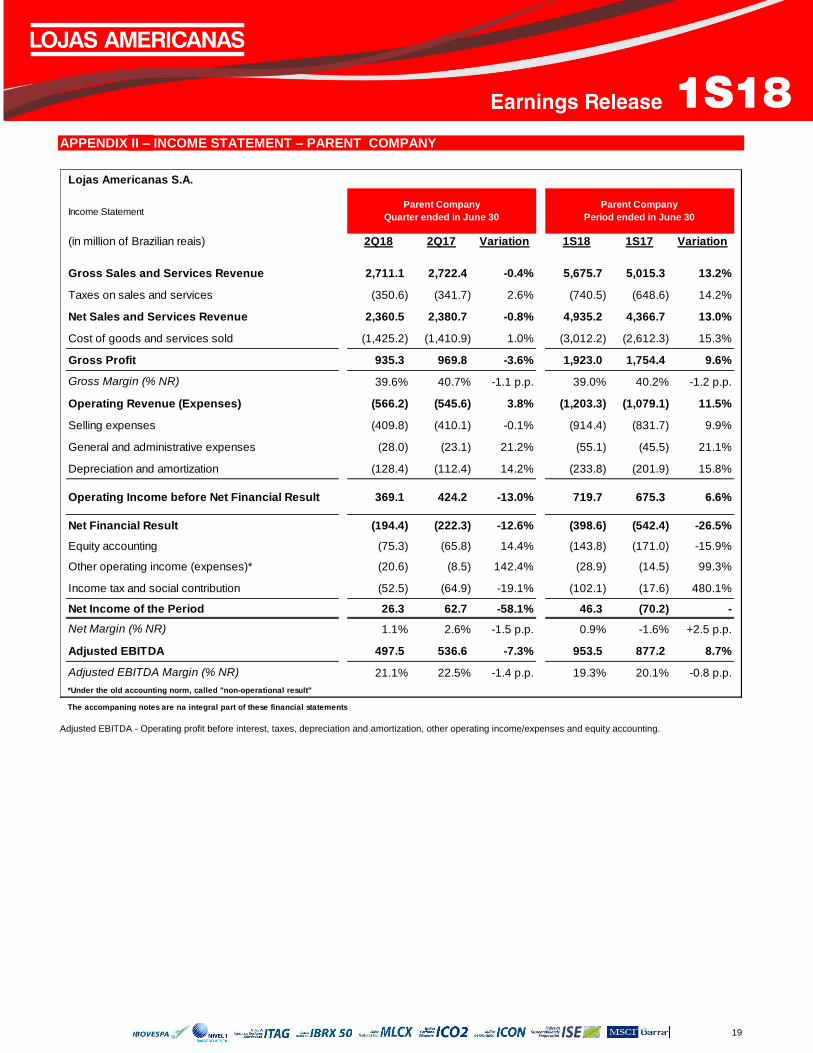
APPENDIX II – INCOME STATEMENT – PARENT COMPANY
Adjusted EBITDA - Operating profit before interest, taxes, depreciation and amortization, other operating income/expenses and equity accounting.
Lojas Americanas S.A.
Income Statement
(in million of Brazilian reais) 2Q18 2Q17 Variation 1S18 1S17 Variation
Gross Sales and Services Revenue 2,711.1 2,722.4 -0.4% 5,675.7 5,015.3 13.2%
Taxes on sales and services (350.6) (341.7) 2.6% (740.5) (648.6) 14.2%
Net Sales and Services Revenue 2,360.5 2,380.7 -0.8% 4,935.2 4,366.7 13.0%
Cost of goods and services sold (1,425.2) (1,410.9) 1.0% (3,012.2) (2,612.3) 15.3%
Gross Profit 935.3 969.8 -3.6% 1,923.0 1,754.4 9.6%
Gross Margin (% NR) 39.6% 40.7% -1.1 p.p. 39.0% 40.2% -1.2 p.p.
Operating Revenue (Expenses) (566.2) (545.6) 3.8% (1,203.3) (1,079.1) 11.5%
Selling expenses (409.8) (410.1) -0.1% (914.4) (831.7) 9.9%
General and administrative expenses (28.0) (23.1) 21.2% (55.1) (45.5) 21.1%
Depreciation and amortization (128.4) (112.4) 14.2% (233.8) (201.9) 15.8%
Operating Income before Net Financial Result 369.1 424.2 -13.0% 719.7 675.3 6.6%
Net Financial Result (194.4) (222.3) -12.6% (398.6) (542.4) -26.5%
Equity accounting (75.3) (65.8) 14.4% (143.8) (171.0) -15.9%
Other operating income (expenses)* (20.6) (8.5) 142.4% (28.9) (14.5) 99.3%
Income tax and social contribution (52.5) (64.9) -19.1% (102.1) (17.6) 480.1%
Net Income of the Period 26.3 62.7 -58.1% 46.3 (70.2) -
Net Margin (% NR) 1.1% 2.6% -1.5 p.p. 0.9% -1.6% +2.5 p.p.
Adjusted EBITDA 497.5 536.6 -7.3% 953.5 877.2 8.7%
Adjusted EBITDA Margin (% NR) 21.1% 22.5% -1.4 p.p. 19.3% 20.1% -0.8 p.p.
*Under the old accounting norm, called "non-operational result"
The accompaning notes are na integral part of these financial statements
Parent Company
Quarter ended in June 30
Parent Company
Period ended in June 30
20
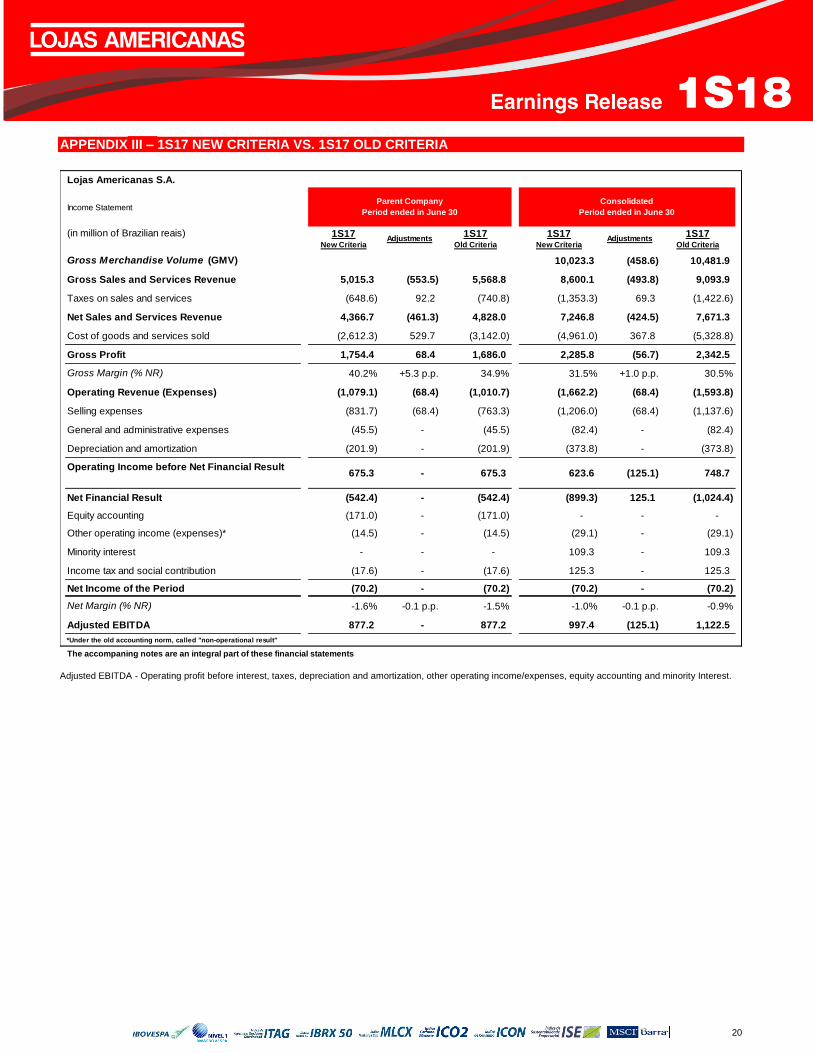
APPENDIX III – 1S17 NEW CRITERIA VS. 1S17 OLD CRITERIA
Adjusted EBITDA - Operating profit before interest, taxes, depreciation and amortization, other operating income/expenses, equity accounting and minority Interest.
Lojas Americanas S.A.
Income Statement
(in million of Brazilian reais) 1S17New Criteria
Adjustments1S17
Old Criteria
1S17New Criteria
Adjustments1S17
Old Criteria
Gross Merchandise Volume (GMV) 10,023.3 (458.6) 10,481.9
Gross Sales and Services Revenue 5,015.3 (553.5) 5,568.8 8,600.1 (493.8) 9,093.9
Taxes on sales and services (648.6) 92.2 (740.8) (1,353.3) 69.3 (1,422.6)
Net Sales and Services Revenue 4,366.7 (461.3) 4,828.0 7,246.8 (424.5) 7,671.3
Cost of goods and services sold (2,612.3) 529.7 (3,142.0) (4,961.0) 367.8 (5,328.8)
Gross Profit 1,754.4 68.4 1,686.0 2,285.8 (56.7) 2,342.5
Gross Margin (% NR) 40.2% +5.3 p.p. 34.9% 31.5% +1.0 p.p. 30.5%
Operating Revenue (Expenses) (1,079.1) (68.4) (1,010.7) (1,662.2) (68.4) (1,593.8)
Selling expenses (831.7) (68.4) (763.3) (1,206.0) (68.4) (1,137.6)
General and administrative expenses (45.5) - (45.5) (82.4) - (82.4)
Depreciation and amortization (201.9) - (201.9) (373.8) - (373.8)
Operating Income before Net Financial Result675.3 - 675.3 623.6 (125.1) 748.7
Net Financial Result (542.4) - (542.4) (899.3) 125.1 (1,024.4)
Equity accounting (171.0) - (171.0) - - -
Other operating income (expenses)* (14.5) - (14.5) (29.1) - (29.1)
Minority interest - - - 109.3 - 109.3
Income tax and social contribution (17.6) - (17.6) 125.3 - 125.3
Net Income of the Period (70.2) - (70.2) (70.2) - (70.2)
Net Margin (% NR) -1.6% -0.1 p.p. -1.5% -1.0% -0.1 p.p. -0.9%
Adjusted EBITDA 877.2 - 877.2 997.4 (125.1) 1,122.5
*Under the old accounting norm, called "non-operational result"
The accompaning notes are an integral part of these financial statements
Parent Company
Period ended in June 30
Consolidated
Period ended in June 30
21
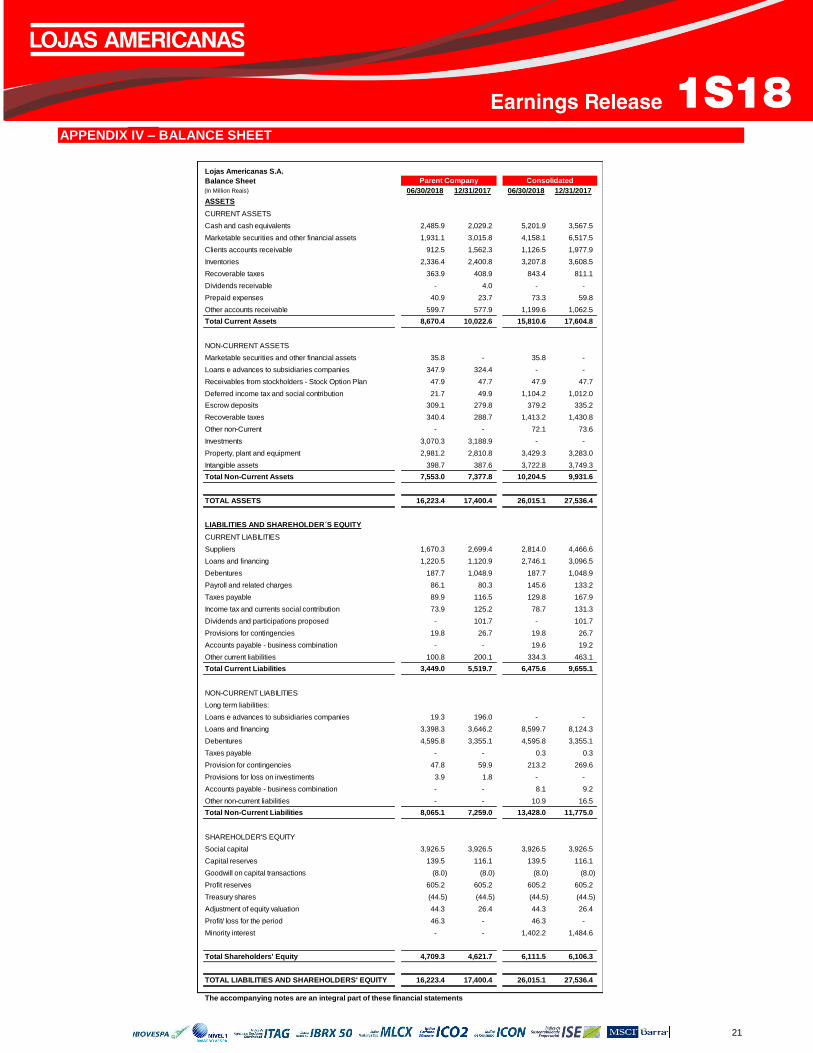
APPENDIX IV – BALANCE SHEET
Lojas Americanas S.A.
Balance Sheet
(In Million Reais) 06/30/2018 12/31/2017 06/30/2018 12/31/2017
ASSETS
CURRENT ASSETS
Cash and cash equivalents 2,485.9 2,029.2 5,201.9 3,567.5
Marketable securities and other financial assets 1,931.1 3,015.8 4,158.1 6,517.5
Clients accounts receivable 912.5 1,562.3 1,126.5 1,977.9
Inventories 2,336.4 2,400.8 3,207.8 3,608.5
Recoverable taxes 363.9 408.9 843.4 811.1
Dividends receivable - 4.0 - -
Prepaid expenses 40.9 23.7 73.3 59.8
Other accounts receivable 599.7 577.9 1,199.6 1,062.5
Total Current Assets 8,670.4 10,022.6 15,810.6 17,604.8
NON-CURRENT ASSETS
Marketable securities and other financial assets 35.8 - 35.8 -
Loans e advances to subsidiaries companies 347.9 324.4 - -
Receivables from stockholders - Stock Option Plan 47.9 47.7 47.9 47.7
Deferred income tax and social contribution 21.7 49.9 1,104.2 1,012.0
Escrow deposits 309.1 279.8 379.2 335.2
Recoverable taxes 340.4 288.7 1,413.2 1,430.8
Other non-Current - - 72.1 73.6
Investments 3,070.3 3,188.9 - -
Property, plant and equipment 2,981.2 2,810.8 3,429.3 3,283.0
Intangible assets 398.7 387.6 3,722.8 3,749.3
Total Non-Current Assets 7,553.0 7,377.8 10,204.5 9,931.6
TOTAL ASSETS 16,223.4 17,400.4 26,015.1 27,536.4
LIABILITIES AND SHAREHOLDER´S EQUITY
CURRENT LIABILITIES
Suppliers 1,670.3 2,699.4 2,814.0 4,466.6
Loans and financing 1,220.5 1,120.9 2,746.1 3,096.5
Debentures 187.7 1,048.9 187.7 1,048.9
Payroll and related charges 86.1 80.3 145.6 133.2
Taxes payable 89.9 116.5 129.8 167.9
Income tax and currents social contribution 73.9 125.2 78.7 131.3
Dividends and participations proposed - 101.7 - 101.7
Provisions for contingencies 19.8 26.7 19.8 26.7
Accounts payable - business combination - - 19.6 19.2
Other current liabilities 100.8 200.1 334.3 463.1
Total Current Liabilities 3,449.0 5,519.7 6,475.6 9,655.1
NON-CURRENT LIABILITIES
Long term liabilities:
Loans e advances to subsidiaries companies 19.3 196.0 - -
Loans and financing 3,398.3 3,646.2 8,599.7 8,124.3
Debentures 4,595.8 3,355.1 4,595.8 3,355.1
Taxes payable - - 0.3 0.3
Provision for contingencies 47.8 59.9 213.2 269.6
Provisions for loss on investiments 3.9 1.8 - -
Accounts payable - business combination - - 8.1 9.2
Other non-current liabilities - - 10.9 16.5
Total Non-Current Liabilities 8,065.1 7,259.0 13,428.0 11,775.0
SHAREHOLDER'S EQUITY
Social capital 3,926.5 3,926.5 3,926.5 3,926.5
Capital reserves 139.5 116.1 139.5 116.1
Goodwill on capital transactions (8.0) (8.0) (8.0) (8.0)
Profit reserves 605.2 605.2 605.2 605.2
Treasury shares (44.5) (44.5) (44.5) (44.5)
Adjustment of equity valuation 44.3 26.4 44.3 26.4
Profit/ loss for the period 46.3 - 46.3 -
Minority interest - - 1,402.2 1,484.6
Total Shareholders' Equity 4,709.3 4,621.7 6,111.5 6,106.3
TOTAL LIABILITIES AND SHAREHOLDERS' EQUITY 16,223.4 17,400.4 26,015.1 27,536.4
The accompanying notes are an integral part of these financial statements
Parent Company Consolidated
22
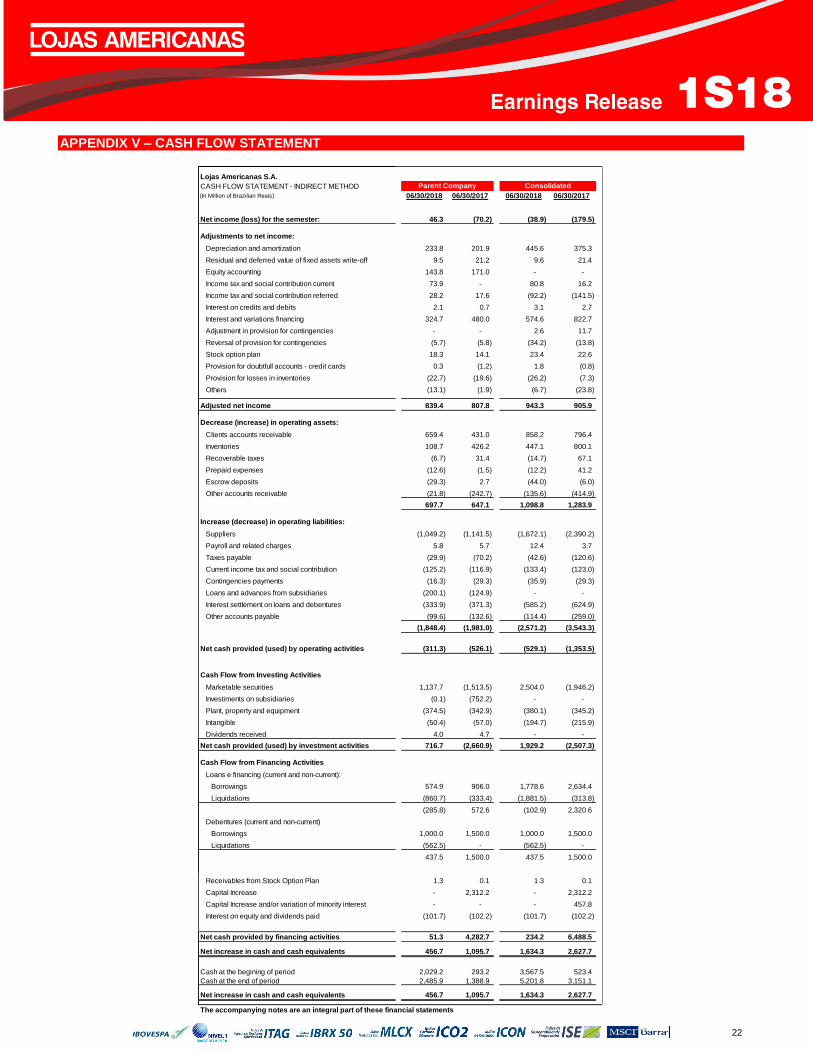
APPENDIX V – CASH FLOW STATEMENT
Lojas Americanas S.A.
CASH FLOW STATEMENT - INDIRECT METHOD
(In Million of Brazilian Reais) 06/30/2018 06/30/2017 06/30/2018 06/30/2017Cash Flow from Operating Activities
Net income (loss) for the semester: 46.3 (70.2) (38.9) (179.5)
Adjustments to net income:
Depreciation and amortization 233.8 201.9 445.6 375.3
Residual and deferred value of fixed assets write-off 9.5 21.2 9.6 21.4
Equity accounting 143.8 171.0 - -
Income tax and social contribution current 73.9 - 80.8 16.2
Income tax and social contribution referred 28.2 17.6 (92.2) (141.5)
Interest on credits and debits 2.1 0.7 3.1 2.7
Interest and variations financing 324.7 480.0 574.6 822.7
Adjustment in provision for contingencies - - 2.6 11.7
Reversal of provision for contingencies (5.7) (5.8) (34.2) (13.8)
Stock option plan 18.3 14.1 23.4 22.6
Provision for doubtfull accounts - credit cards 0.3 (1.2) 1.8 (0.8)
Provision for losses in inventories (22.7) (19.6) (26.2) (7.3)
Others (13.1) (1.9) (6.7) (23.8)
Adjusted net income 839.4 807.8 943.3 905.9
Decrease (increase) in operating assets:
Clients accounts receivable 659.4 431.0 858.2 796.4
Inventories 108.7 426.2 447.1 800.1
Recoverable taxes (6.7) 31.4 (14.7) 67.1
Prepaid expenses (12.6) (1.5) (12.2) 41.2
Escrow deposits (29.3) 2.7 (44.0) (6.0)
Other accounts receivable (21.8) (242.7) (135.6) (414.9)
697.7 647.1 1,098.8 1,283.9
Increase (decrease) in operating liabilities:
Suppliers (1,049.2) (1,141.5) (1,672.1) (2,390.2)
Payroll and related charges 5.8 5.7 12.4 3.7
Taxes payable (29.9) (70.2) (42.6) (120.6)
Current income tax and social contribution (125.2) (116.9) (133.4) (123.0)
Contingencies payments (16.3) (29.3) (35.9) (29.3)
Loans and advances from subsidiaries (200.1) (124.9) - -
Interest settlement on loans and debentures (333.9) (371.3) (585.2) (624.9)
Other accounts payable (99.6) (132.6) (114.4) (259.0)
(1,848.4) (1,981.0) (2,571.2) (3,543.3)
Net cash provided (used) by operating activities (311.3) (526.1) (529.1) (1,353.5)
Cash Flow from Investing Activities
Marketable securities 1,137.7 (1,513.5) 2,504.0 (1,946.2)
Investiments on subsidiaries (0.1) (752.2) - -
Plant, property and equipment (374.5) (342.9) (380.1) (345.2)
Intangible (50.4) (57.0) (194.7) (215.9)
Dividends received 4.0 4.7 - -
Net cash provided (used) by investment activities 716.7 (2,660.9) 1,929.2 (2,507.3)
Cash Flow from Financing Activities
Loans e financing (current and non-current):
Borrowings 574.9 906.0 1,778.6 2,634.4
Liquidations (860.7) (333.4) (1,881.5) (313.8)
(285.8) 572.6 (102.9) 2,320.6
Debentures (current and non-current)
Borrowings 1,000.0 1,500.0 1,000.0 1,500.0
Liquidations (562.5) - (562.5) -
437.5 1,500.0 437.5 1,500.0
Receivables from Stock Option Plan 1.3 0.1 1.3 0.1
Capital Increase - 2,312.2 - 2,312.2
Capital Increase and/or variation of minority interest - - - 457.8
Interest on equity and dividends paid (101.7) (102.2) (101.7) (102.2)
Net cash provided by financing activities 51.3 4,282.7 234.2 6,488.5
Net increase in cash and cash equivalents 456.7 1,095.7 1,634.3 2,627.7
Cash at the begining of period 2,029.2 293.2 3,567.5 523.4
Cash at the end of period 2,485.9 1,388.9 5,201.8 3,151.1
Net increase in cash and cash equivalents 456.7 1,095.7 1,634.3 2,627.7
The accompanying notes are an integral part of these financial statements
Parent Company Consolidated
23
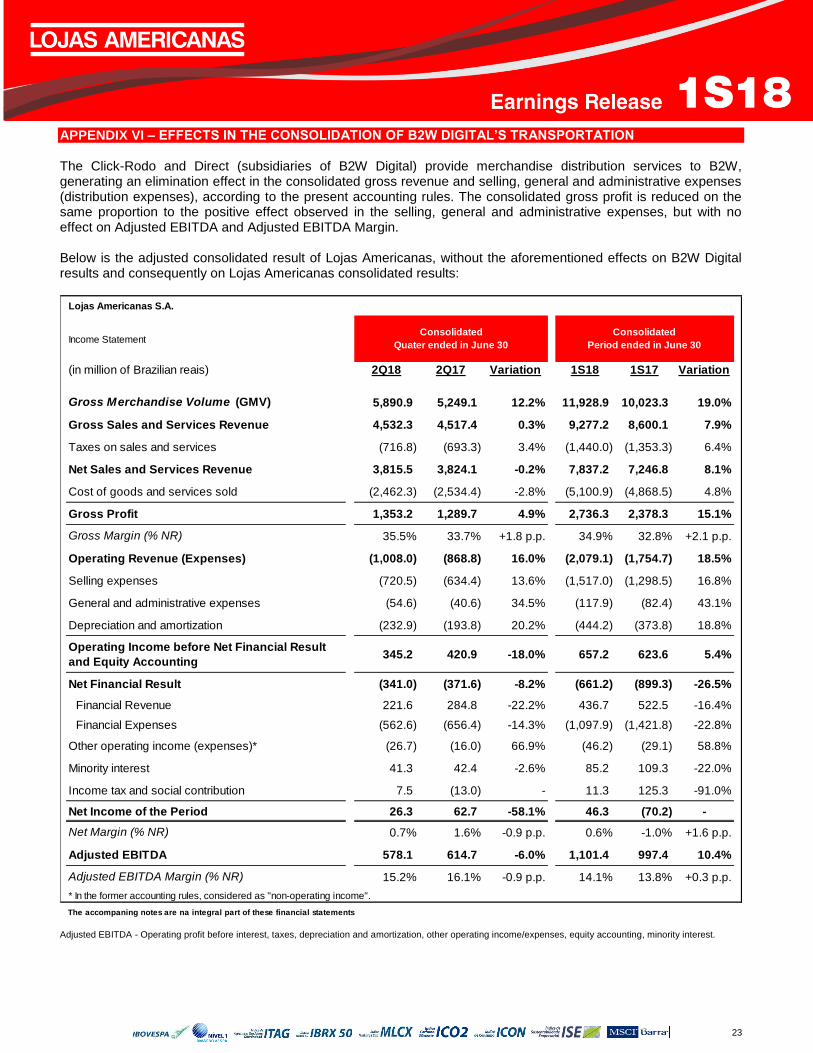
APPENDIX VI – EFFECTS IN THE CONSOLIDATION OF B2W DIGITAL’S TRANSPORTATION The Click-Rodo and Direct (subsidiaries of B2W Digital) provide merchandise distribution services to B2W, generating an elimination effect in the consolidated gross revenue and selling, general and administrative expenses (distribution expenses), according to the present accounting rules. The consolidated gross profit is reduced on the same proportion to the positive effect observed in the selling, general and administrative expenses, but with no effect on Adjusted EBITDA and Adjusted EBITDA Margin. Below is the adjusted consolidated result of Lojas Americanas, without the aforementioned effects on B2W Digital results and consequently on Lojas Americanas consolidated results:
Adjusted EBITDA - Operating profit before interest, taxes, depreciation and amortization, other operating income/expenses, equity accounting, minority interest.
Lojas Americanas S.A.
Income Statement
(in million of Brazilian reais) 2Q18 2Q17 Variation 1S18 1S17 Variation
Gross Merchandise Volume (GMV) 5,890.9 5,249.1 12.2% 11,928.9 10,023.3 19.0%
Gross Sales and Services Revenue 4,532.3 4,517.4 0.3% 9,277.2 8,600.1 7.9%
Taxes on sales and services (716.8) (693.3) 3.4% (1,440.0) (1,353.3) 6.4%
Net Sales and Services Revenue 3,815.5 3,824.1 -0.2% 7,837.2 7,246.8 8.1%
Cost of goods and services sold (2,462.3) (2,534.4) -2.8% (5,100.9) (4,868.5) 4.8%
Gross Profit 1,353.2 1,289.7 4.9% 2,736.3 2,378.3 15.1%
Gross Margin (% NR) 35.5% 33.7% +1.8 p.p. 34.9% 32.8% +2.1 p.p.
Operating Revenue (Expenses) (1,008.0) (868.8) 16.0% (2,079.1) (1,754.7) 18.5%
Selling expenses (720.5) (634.4) 13.6% (1,517.0) (1,298.5) 16.8%
General and administrative expenses (54.6) (40.6) 34.5% (117.9) (82.4) 43.1%
Depreciation and amortization (232.9) (193.8) 20.2% (444.2) (373.8) 18.8%
Operating Income before Net Financial Result
and Equity Accounting345.2 420.9 -18.0% 657.2 623.6 5.4%
Net Financial Result (341.0) (371.6) -8.2% (661.2) (899.3) -26.5%
Financial Revenue 221.6 284.8 -22.2% 436.7 522.5 -16.4%
Financial Expenses (562.6) (656.4) -14.3% (1,097.9) (1,421.8) -22.8%
Other operating income (expenses)* (26.7) (16.0) 66.9% (46.2) (29.1) 58.8%
Minority interest 41.3 42.4 -2.6% 85.2 109.3 -22.0%
Income tax and social contribution 7.5 (13.0) - 11.3 125.3 -91.0%
Net Income of the Period 26.3 62.7 -58.1% 46.3 (70.2) -
Net Margin (% NR) 0.7% 1.6% -0.9 p.p. 0.6% -1.0% +1.6 p.p.
Adjusted EBITDA 578.1 614.7 -6.0% 1,101.4 997.4 10.4%
Adjusted EBITDA Margin (% NR) 15.2% 16.1% -0.9 p.p. 14.1% 13.8% +0.3 p.p.
* In the former accounting rules, considered as "non-operating income".
The accompaning notes are na integral part of these financial statements
Consolidated
Quater ended in June 30
Consolidated
Period ended in June 30
24
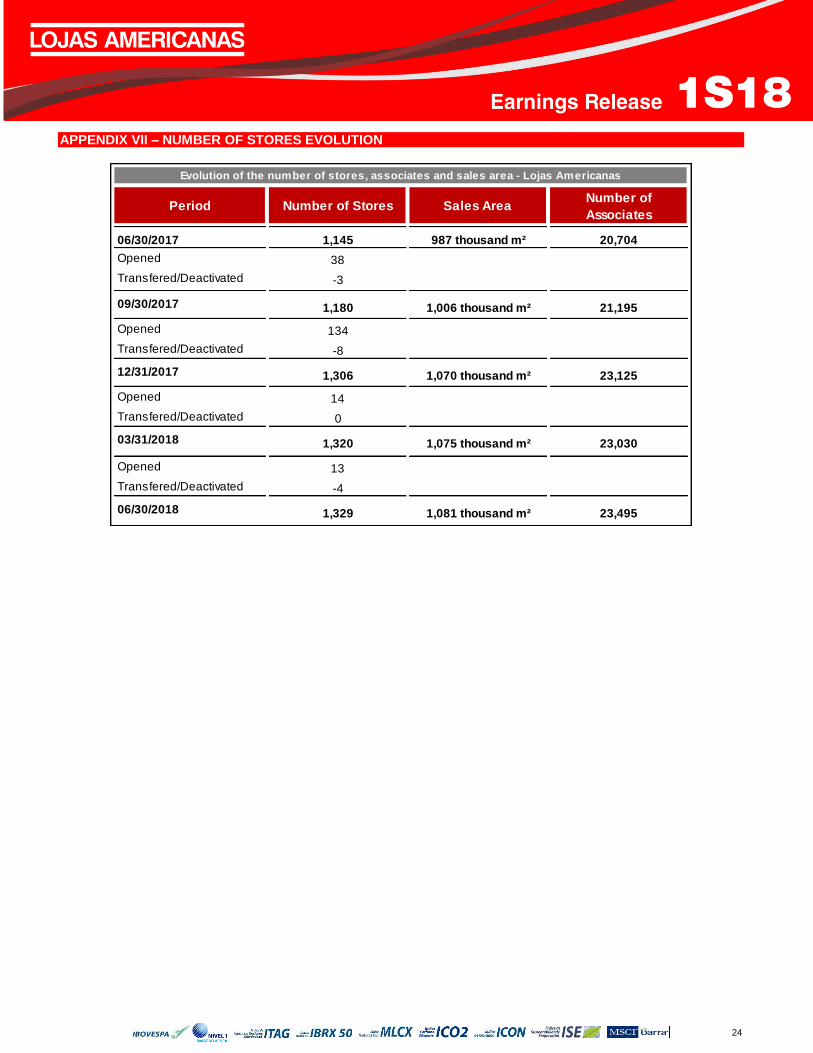
APPENDIX VII – NUMBER OF STORES EVOLUTION
Period Number of Stores Sales AreaNumber of
Associates
06/30/2017 1,145 987 thousand m² 20,704
Opened 38
Transfered/Deactivated -3
09/30/2017 1,180 1,006 thousand m² 21,195
Opened 134
Transfered/Deactivated -8
12/31/2017 1,306 1,070 thousand m² 23,125
Opened 14
Transfered/Deactivated 0
03/31/2018 1,320 1,075 thousand m² 23,030
Opened 13
Transfered/Deactivated -4
06/30/2018 1,329 1,081 thousand m² 23,495
Evolution of the number of stores, associates and sales area - Lojas Americanas
25
EARNINGS RESULTS CONFERENCE CALL
EBITDA (CVM 527/12) – Net income of the period plus income taxes, net financial expenses of financial revenues and depreciation, amortization and depletion. Adjusted EBITDA (Operating profit before interest, taxes, depreciation and amortization, other operating income/expenses, equity accounting, minority participation, statutory participation and discontinued operations) is presented as additional information because we believe it represents an important indicator of our operating performance, besides being useful for keeping the comparability with previous reported results. Statements relating to the prospects of the business, estimates for operating and financial results, and those related to growth prospects of Lojas Americanas, eventually expressed in this report are merely projections and, as such, are based exclusively on the expectations of Lojas Americanas’ management concerning the future of the business and its continued access to capital to fund the Company’s business plan. Such statements depend, substantially, on changes in market conditions, government regulations, competitive pressures, the performance of the Brazilian economy and the industry, among other factors and are, therefore, subject to change without prior notice
MSCI Brand logo: The use of Morgan Stanley Capital International Inc. registered trademarks and indices ("MSCI") does not constitute any type of sponsorship, endorsement or promotion on the part of MSCI, its affiliates, its suppliers or other parties involved or related in the compilation, computation or creation of any MSCI index. MSCI’s indices are registered trademarks of MSCI or its affiliates and Lojas Americanas S.A. has been granted a license to use these trademarks for given purposes.