Embed Size (px)
Citation preview
TRADE
INVESTMENTENERGYRISK MANAGEMENT
INFRASTRUCTURE
GREEN GROWTH
CREDITINDUSTRIALISATION
COMMODITIESPOPULATION GROWTH
SKILLS
MIDDLE CLASS
PRODUCTIVITY
INNOVATIONREGULATIONS
BUSINESS INSIGHTSON EMERGINGMARKETS2017
LATINAMERICAASIAAFRICA GREEN
INVESTMENT

Cite this study as: OECD (2017), “Business Insights on Emerging Markets 2017”, OECD Development Centre, Paris, http://www.oecd.org/dev/oecdemnet.htm.
BUSINESS INSIGHTS ON EMERGING MARKETS 2017
2 BUSINESS INSIGHTS ON EMERGING MARKETS 2017 © OECD 2017
OECD DEVELOPMENT CENTRE The Development Centre of the Organisation for Economic Co-operation and Development
was established in 1962 and comprises 27 member countries of the OECD and 25 non-OECD countries. The European Union also takes part in the work of the Centre.
The Development Centre occupies a unique place within the OECD and in the international community. It provides a platform where developing and emerging economies interact on an equal footing with OECD members to promote knowledge sharing and peer learning on sustainable and inclusive development. The Centre combines multidisciplinary analysis with policy dialogue activities to help governments formulate innovative policy solutions to the global challenges of development. Hence, the Centre plays a key role in the OECD’s engagement efforts with non-member countries.
To increase the impact and legitimacy of its work, the Centre adopts an inclusive approach and engages with a variety of governmental and non-governmental stakeholders. It works closely with experts and institutions from its member countries, has established partnerships with key international and regional organisations and hosts networks of private-sector enterprises, think tanks and foundations working for development. The results of its work are discussed in experts’ meetings as well as in policy dialogues and high-level meetings, and are published in a range of high-quality publications and papers for the research and policy communities.
For more information on the Centre, please see www.oecd.org/dev.
OECD EMERGING MARKETS NETWORK The Emerging Markets Network (EMnet) is an OECD-sponsored initiative dedicated to the
private sector. Managed by the OECD Development Centre, the Network fosters dialogue and analysis on emerging economies and their impact on global economic, social and environmental issues.
EMnet gathers top executives (chief executive officers, vice presidents, managing directors, chief financial officers, heads of strategy, chief economists) of multinational companies from diverse sectors, willing to engage in debates with high-level policy makers, including heads of state and ministers, and OECD experts.
EMnet events are closed to the public and media and operate under Chatham House rule to encourage open and dynamic discussions on doing business in Africa, Asia and Latin America.
To learn more about EMnet, please see www.oecd.org/dev/oecdemnet.htm.
BUSINESS INSIGHTS ON EMERGING MARKETS 2017 © OECD 2017 3
FOREWORD Economic growth in emerging markets remains weak. In 2016, Latin America recorded its second
consecutive year of negative GDP growth (between -0.5% and -1.0%). In Africa, the moderate growth of 2015 at 3.6% is expected to slow down. GDP growth in Emerging Asia is positive at 6.5%, although trends vary across the region and remain still lower than the recent past. Notably, growth in China slowed to 6.7% in 2016 and is expected to set at an annual average of 6% over the medium term.
What explains this challenging economic environment? Several factors are at play: low trade and investment volumes, weak global demand, volatile commodity prices, political uncertainties and the rise of protectionism. For example, the OECD Economic Outlook estimated a 0.8 ratio of global trade-to-GDP growth for 2016 that is much less than the multiple of 2 enjoyed over the last few decades. Simultaneously, the number of trade restrictive measures in G20 countries has reached a peak since the outbreak of the financial crisis in 2008.
These mounting protectionist tendencies represent a radical change after the striking achievements of 2015 to advance international co-operation and dialogue. Highlights included the Paris Agreement at COP21 to fight the consequences of climate change as well as the adoption of the Addis Ababa Action Agenda and the Sustainable Development Goals to promote a sustainable and more inclusive world.
This 2017 edition of Business Insights on Emerging Markets captures what multinational companies engaged in emerging markets say is necessary to revive growth, trade and investment in a challenging economic context. The analysis builds on discussions held during events organised by the OECD Emerging Markets Network (EMnet), the Development Centre’s business platform promoting policy dialogue between top executives, high-level government officials and senior OECD experts on doing business in Africa, Asia and Latin America. Informed dialogue between policy makers and businesses is essential to unlocking the benefits of private sector action, particularly in order to create new job opportunities for young people, build quality infrastructure and promote innovation and new technologies.
EMnet meetings in 2016 discussed urbanisation in Africa, regional integration in Asia, trade and investment in Latin America and the Paris Agreement at COP21. These built on recent OECD analysis and studies such as the Development Centre’s Regional Economic Outlooks.
I congratulate EMnet members and the Development Centre for sharing and capturing these valuable insights. The EMnet membership helps us identify pathways to promote economic and social development in emerging markets. I also would like to thank EMnet’s partners, notably the Emerging Markets Institute at Cornell University for writing a chapter on the rise of Chinese multinationals as global investors and the INSEAD Emerging Markets Institute for co-organising the EMnet Asia meeting on regional integration.
I trust that this contribution will inspire further policy discussions on the role of the private sector as a key development actor to stimulate growth and improve living conditions in emerging and developing economies.
Mario Pezzini Director, OECD Development Centre, and
Special Advisor to the OECD Secretary-General on Development
4 BUSINESS INSIGHTS ON EMERGING MARKETS 2017 © OECD 2017
ACKNOWLEGEMENTS The OECD Development Centre’s Emerging Markets Network (EMnet) prepared this
publication with a contribution from the Emerging Markets Institute of the Cornell College of Business, Cornell University. Bathylle Missika, Head of the Partnerships and Networks Unit, Senior Counsellor to the Director (a.i) guided the project. The publication was managed by Lorenzo Pavone, Deputy Head, Partnerships and Networks Unit and EMnet Co-ordinator, and Kate Eklin, EMnet Policy Analyst. Insights from Federico Bonaglia, Acting Deputy Director of the OECD Development Centre, helped to refine the publication.
Chapter 1 “The rise of the global Chinese company” was written by Lourdes Casanova (Senior Lecturer, Director, Emerging Markets Institute, Cornell College of Business, Cornell University) and Anne Miroux (Faculty Fellow, Emerging Markets Institute, Cornell College of Business, Cornell University). The chapter builds on a previous report by the authors. The help of Devesh Verma, Principal Research Assistant at the Emerging Markets Institute, as well as of Eudes Lopes, PhD student, and Kunal Garg is gratefully acknowledged. The Emerging Markets Institute thanks EMnet and the OECD Development Centre for their insightful comments.
Chapter 2 “Expanding business through regional integration” was drafted by Young Sun Lee, Sarah MacDonald and Kate Eklin of the EMnet team. The content of the chapter was enriched by constructive feedback from Federico Bonaglia (Acting Deputy Director of the OECD Development Centre) and Kensuke Tanaka and Ryan Jacildo of the OECD Development Centre’s Asia Desk. Useful comments were also received from Florian Kitt (International Energy Agency), Shahrukh Khan (Oracle Coalfields PLC), Anne Miroux (Emerging Markets Institute, Cornell College of Business, Cornell University) and Jurei Yada (International Partnership for Energy Efficiency Cooperation [IPEEC])
Chapter 3 “Reviving investment in Latin America” was written by Kate Eklin, Sarah MacDonald and Young Sun Lee from the EMnet team. Insights from Sebastián Nieto-Parra and René Orozco of the OECD Development Centre’s Latin America and Caribbean Unit helped to refine this note. The report also benefitted from comments from Lourdes Casanova and Anne Miroux (Emerging Markets Institute, Cornell College of Business, Cornell University), Carlos Gascó (Iberdrola) and Hermance de la Bastide and Laurent Scheer (Pernod Ricard).
Chapter 4 “Investing in growing African cities” was prepared by Jonathan Rejaud, Sarah MacDonald, Kate Eklin and Hannah Rothschild of the EMnet team. The team thanks Arthur Minsat and Thang Nguyen of the OECD Development Centre’s Europe, Middle East & Africa Desk for their useful comments. The report also benefitted from comments from Carrie Pottinger (International Energy Agency).
Chapter 5 “COP21 Paris Agreement: Business perspectives on energy markets and green investments” was prepared by Jonathan Rejaud and Kate Eklin from the EMnet team. The EMnet “Greening of the Economy” Working Group” is a product of collaboration between the OECD Development Centre, Environment Directorate, Directorate for Financial and Enterprise Affairs, and the International Energy Agency (IEA). Particular thanks go to Laura Cozzi (IEA) as well as Jane Ellis, Géraldine Ang and Dirk Röttgers (OECD) for their contributions to the Working Group meeting held on 7 March 2016 at the OECD headquarters in Paris.
BUSINESS INSIGHTS ON EMERGING MARKETS 2017 © OECD 2017 5
The chapter also benefitted from comments and contributions from Utku Bayramoğlu (Investment Support and Promotion Agency of Turkey in France), Laura Cozzi (IEA), Robert Youngman (OECD), Géraldine Ang (OECD), Dirk Röttgers (OECD), Ailin Huang (International Partnership for Energy Efficiency Cooperation), Matthieu Maurin (BNP Paribas) and from representatives from Enel Spa.
The team is grateful to Marina Urquidi for editing assistance and to the OECD Development Centre’s Communications and Publications Unit, especially Delphine Grandrieux, Aida Buendia and Vanda Legrandgérard, for their support in producing the note. The authors thank Linda Smiroldo Herda from the Director’s Office of the Development Centre for her contributions to improve the style and messages. Finally, special thanks go to Grace Dunphy, Sonja Marki and Hannah Rothschild (OECD Development Centre) for their valuable assistance throughout the drafting and publishing process.
The opinions expressed and arguments employed here are the sole responsibility of the authors and do not necessarily reflect the official
views of the member countries of the OECD or its Development Centre, or of EMnet members.
© OECD 2017
This document, as well as any data and map included herein, are
without prejudice to the status of or sovereignty over any territory, to the delimitation of international frontiers and boundaries and to the name of
any territory, city or area. The statistical data for Israel are supplied by and under the
responsibility of the relevant Israeli authorities. The use of such data by the OECD is without prejudice to the status of the Golan Heights, East Jerusalem and Israeli settlements in the West Bank under the terms of
international law.

BUSINESS INSIGHTS ON EMERGING MARKETS 2017 © OECD 2017 7
Table of contents
Abbreviations and acronyms .......................................................................................................... 8 Executive summary ......................................................................................................................... 9 The rise of the global Chinese company ..................................................................................... 13
China becomes the third largest investor in the world ................................................................... 14 Changes in government policies help Chinese outward investment to expand ............................. 16 China emerges as a global acquirer .............................................................................................. 18 Looking at the future: Will Chinese companies continue their surge? ........................................... 26
Expanding business through regional integration ..................................................................... 31 Asia’s economic and business overview ....................................................................................... 32 Regional integration initiatives in Asia ........................................................................................... 36 Public policy to promote business through regional integration ..................................................... 41 Private sector insights on expanding business through regional integration ................................. 46 Conclusion ..................................................................................................................................... 56
Reviving investment in Latin America: New opportunities, new players ................................. 61 Growth, trade and investment trends ............................................................................................. 62 New players and opportunities to encourage investments in the region ........................................ 70 Towards better public policies to promote effective investment for development .......................... 73 Private-sector insights on reviving investment ............................................................................... 75 Conclusion ..................................................................................................................................... 86
Investing in growing African cities .............................................................................................. 93 Africa’s business and economic overview ..................................................................................... 94 Growing African cities: challenges and opportunities for the private sector ................................... 98 Public policies to support Africa’s urbanisation growth ................................................................ 101 Private sector insights on urbanisation challenges in Africa ........................................................ 103 Conclusion ................................................................................................................................... 109
COP21 Paris Agreement: Business perspectives on energy markets and green investments.......115 COP21: a new opportunity to address climate change ................................................................ 116 Promoting private green investment ............................................................................................ 127 Private sector insights and recommendations ............................................................................. 130 Conclusion ................................................................................................................................... 136
8 BUSINESS INSIGHTS ON EMERGING MARKETS 2017 © OECD 2017
ABBREVIATIONS AND ACRONYMS
ASEAN Association of Southeast Asian Nations
COP21 21st Session of the Conference of the Parties to the United Nations Framework
Convention on Climate Change
ECOWAS Economic Community of West African States
EMnet Emerging Markets Network
FDI Foreign direct investment
FTA Free trade agreement
GDP Gross domestic product
GHG Greenhouse gas
GVCs Global value chains
GW Gigawatt
MW Megawatt
ICTs Information and communications technologies
IEA International Energy Agency
IoT Internet of things
IT Information technology
OECD Organisation for Economic Co-operation and Development
OFDI Outward foreign direct investment
PPP Public-private partnership
R&D Research and development
SDGs Sustainable Development Goals
SMEs Small and medium-sized enterprises
SOE State-owned enterprise
TPP Trans-Pacific Partnership
VET Vocational education and training
WTO World Trade Organization
BUSINESS INSIGHTS ON EMERGING MARKETS 2017 © OECD 2017 9
EXECUTIVE SUMMARY Business Insights on Emerging Markets 2017 provides a private sector perspective on
investment opportunities and challenges in Asia, Africa and Latin America. This report compiles analysis and insights from meetings of the OECD Development Centre’s Emerging Markets Network (EMnet) on doing business in Africa, Asia and Latin America as well as on green investment in emerging markets. A report by the Emerging Markets Institute at Cornell College of Business complements this analysis with a study of the rise of Chinese firms as global investors and acquirers.
The rise of the global Chinese company
The surge of China as a global investor is well-documented and has been particularly impressive over the past ten years, with the country becoming one of the major sources of outward foreign direct investment (FDI) from emerging economies. Favourable policies and administrative, financial and commercial support from the government have played a key role in the overseas expansion of Chinese multinational corporations. Chinese multinationals have increasingly taken the mergers and acquisitions (M&A) route for their overseas expansion, particularly after the global financial crisis of 2008-09. Europe and Latin America have been the main targets; the percentage of deals in these regions in China’s portfolio of global M&As almost doubled from that of the pre-crisis period. Chinese multinationals have not only made significant inroads into the global corporate world, they have made it to the very top, becoming world leaders (in terms of revenues) in major industries such as banking, engineering and construction, mining and crude oil production, petroleum refining, metals and telecommunications. They still have a way to go, however, in terms of profitability, market capitalisation and global presence.
Expanding business through regional integration in Emerging Asia
Emerging Asia remains the most dynamic region in the world. Still, the strengthening of regional ties can play a key role in sustaining growth and building new opportunities for trade, investment and development in Southeast Asia, China and India. Today the region is facing an “interim period” in which regional trade agreements are being negotiated or are awaiting ratification, creating some uncertainty for the private sector. In the meantime, companies are using bilateral trade agreements between countries to conduct their business. Yet firms see wide development gaps amongst countries, persistent non-tariff barriers and restrictive policies in the services sector as key challenges to further integration and development. Despite some progress, firms from the region should be doing more to capture higher parts of global value chains (GVCs) through the production of more value-added products and use acquisitions to upgrade brand names and technology. Financially viable projects are crucial to channelling capital into infrastructure investments, while the integration of financial markets need to be further developed to support this aim. On the energy front, the region is expected to shift further to renewables as their competitiveness improves and favourable government policies are implemented. The Chinese slowdown provides both opportunities and challenges for the region, including for the private sector. In particular, low commodity prices, resulting from reduced Chinese demand,
10 BUSINESS INSIGHTS ON EMERGING MARKETS 2017 © OECD 2017
provide an opportunity for Asian economies to procure low-cost inputs and further support domestic-led growth.
Reviving investment in Latin America and the Caribbean: New opportunities, new players
Latin America is facing a challenging economic outlook. Overall growth has slowed, and countries are facing fiscal deficits and growing debt. The external scenario also is challenging, with persistent low commodity prices and slow global growth. Growth in China, an increasingly significant partner for trade and investment, has moderated. Enhanced trade relations and new investment partnerships within the region and beyond can support a transition to higher-value goods and services. Investors are impressed with the progress of the Pacific Alliance regional initiative, view developments of the EU-Mercosur trade agreement as encouraging and are optimistic regarding the momentum for collaboration between the Pacific Alliance and Mercosur. However, growing signs of global protectionism are heightening uncertainty for future trade relations in the region. In addition, regional transport and logistics costs remain too high. Infrastructure investment is needed to support further regional integration. Public policies that encourage private investment in research and development (R&D) and innovation can support productivity improvements and the development of high-value products and services. Firms also see new opportunities in resource and commodity sectors, specifically in sub-sectors with greater value-added such as lithium mining or organic food products. Skills improvements are needed to support the necessary upgrading and diversification of industries; improvements in education-industry linkages and greater vocational training can be particularly relevant and supportive.
Investing in growing African cities
Urbanisation in Africa is rapidly occurring at an unforeseen pace - the population of cities has doubled in 20 years to reach 472 million in 2015. With such unprecedented growth, coupled with an expanding population in the middle-income range, African cities are an important and growing market for the private sector to build infrastructure and provide goods and services. To build more efficient and sustainable cities, reduce environmental risk factors and create more value-added jobs, investments in infrastructure such as roads, sewage, water systems and in information technologies, are needed. Public-private partnerships (PPPs) could facilitate the implementation of large infrastructure projects and further reduce the cost of such investments. However, if adequate institutional and human capacities are not in place, PPPs could instead drive the cost of such investments up. Financing African cities will come from various sources. The private sector is playing an increasingly important role in financing infrastructure development, although public investment accounts for two-thirds of the total in developing countries. Increasingly, new and innovative business solutions, such as digital technologies for mobile payment systems, can offer opportunities to address the growing issue of the urban informal economy. By joining forces with local partners, firms have been successful in investing in African urban markets. A thorough understanding of local specificities and a multi-stage approach have been indicated as key success factors of foreign direct investments.
BUSINESS INSIGHTS ON EMERGING MARKETS 2017 © OECD 2017 11
COP21 Paris Agreement: Business perspectives on energy markets and green investments
Strong commitments from the private sector ahead of the 2015 United Nations 21st Climate Change Conference (COP21) contributed to the positive outcome of the Paris Agreement on climate change. While the share of renewable energy will increase the global energy mix in the future, fossil fuels (i.e. coal, natural gas and oil) will still play an important role, particularly in emerging markets. Given the changes needed in the future energy mix to achieve the Paris Agreement and reduce carbon emissions, policy makers need to focus on supporting the development of renewable energy, promoting energy efficiency and reducing fossil-fuel subsidies in ways that are adapted to the national contexts and needs of developing countries. In addition to promoting core climate policies, governments must also tackle policy misalignments that can hinder green investment. Conflicting incentives in competition, trade, tax and innovation policies, for example, can inadvertently discourage cleaner and more efficient investment. Strong public-policy commitments, economic and political stability, and a favourable investment climate are critical elements that can drive further green investment in emerging markets. Corporate strategies will need to be adjusted to reflect the post-COP21 scenario. Governments need to choose the right incentives carefully to accompany this energy transition and encourage the private sector to adopt new and innovative low-carbon technologies. In emerging economies, tenders and competitive auctions have been chosen increasingly over feed-in tariffs to support early deployment of renewable-based electricity.

The rise of the global Chinese company
Lourdes Casanova, Senior Lecturer and Director Emerging Markets Institute Anne Miroux, Faculty Fellow Emerging Markets Institute Cornell College of Business, Cornell University
The surge of China as a global investor has been particularly impressive over the past ten years, with the country becoming one of the major players on the world stage of outward foreign direct investment from emerging economies. This note analyses China’s journey as a global investor and acquirer, and provides a closer look at Chinese multinational corporations, highlighting their dominance through rapid growth and ability to execute large mergers and acquisitions (M&A) and potential areas of weaknesses such as lower profit margins and higher acquisition premiums.
Key messages include:
• In less than a decade, China has become one of the top global investors with investments mainly in Asian neighbouring countries, but also in other developing regions and in developed markets.
• Favourable policies and administrative, financial and commercial support from the government have played a key role in the overseas expansion of Chinese multinationals. Though there seems to have been a rollback in government policy and support since the end of 2016, due to tightening regulations on capital outflows and closer monitoring of large transactions, the policy has shown positive results.
• Chinese multinationals have increasingly taken the M&A route for their overseas expansion, particularly after the global financial crisis of 2008. Europe and Latin America have been the main targets; the percentage of deals in these regions in China’s portfolio of global M&As almost doubled from that of the pre-crisis period.
• Chinese multinationals have not only made significant inroads into the global corporate world, they have made it to the very top, becoming world leaders (in terms of revenues) in major industries such as banking, engineering and construction, mining and oil production, metals and telecommunications.
• They still have a way to go, however, in terms of profitability, market capitalisation and global presence.
THE RISE OF THE GLOBAL CHINESE COMPANY
14 BUSINESS INSIGHTS ON EMERGING MARKETS 2017 © OECD 2017
CHINA BECOMES THE THIRD LARGEST INVESTOR IN THE WORLD
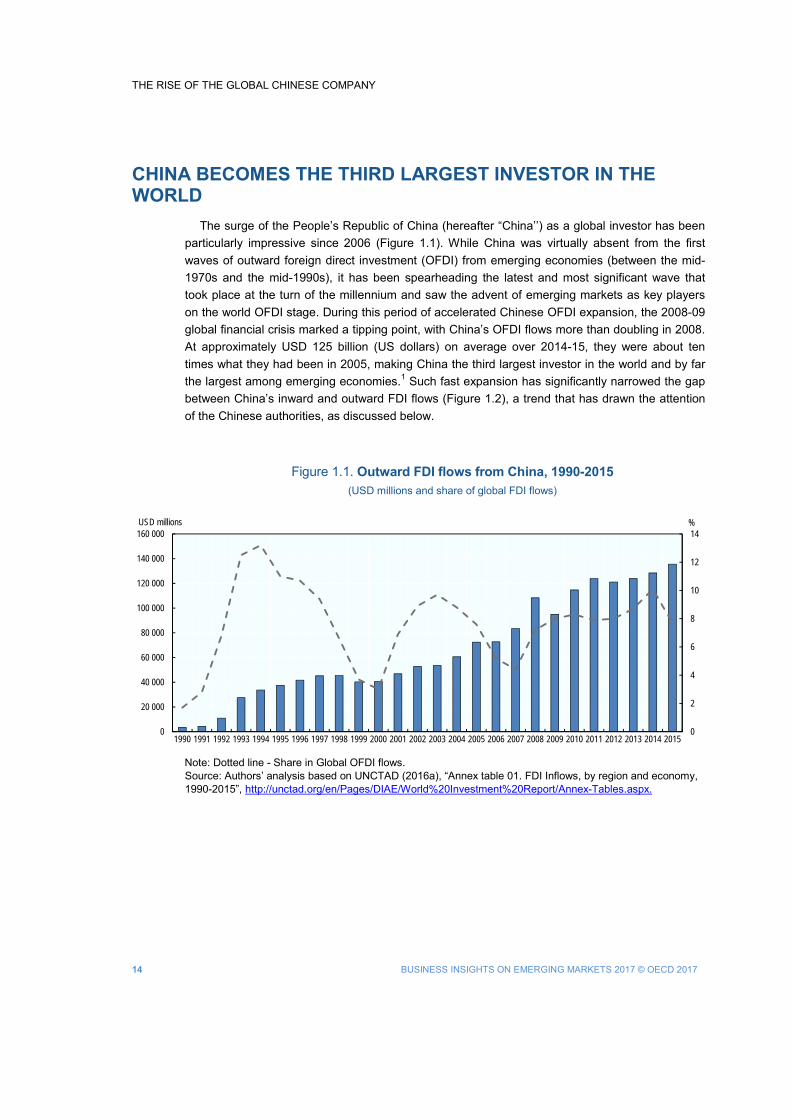
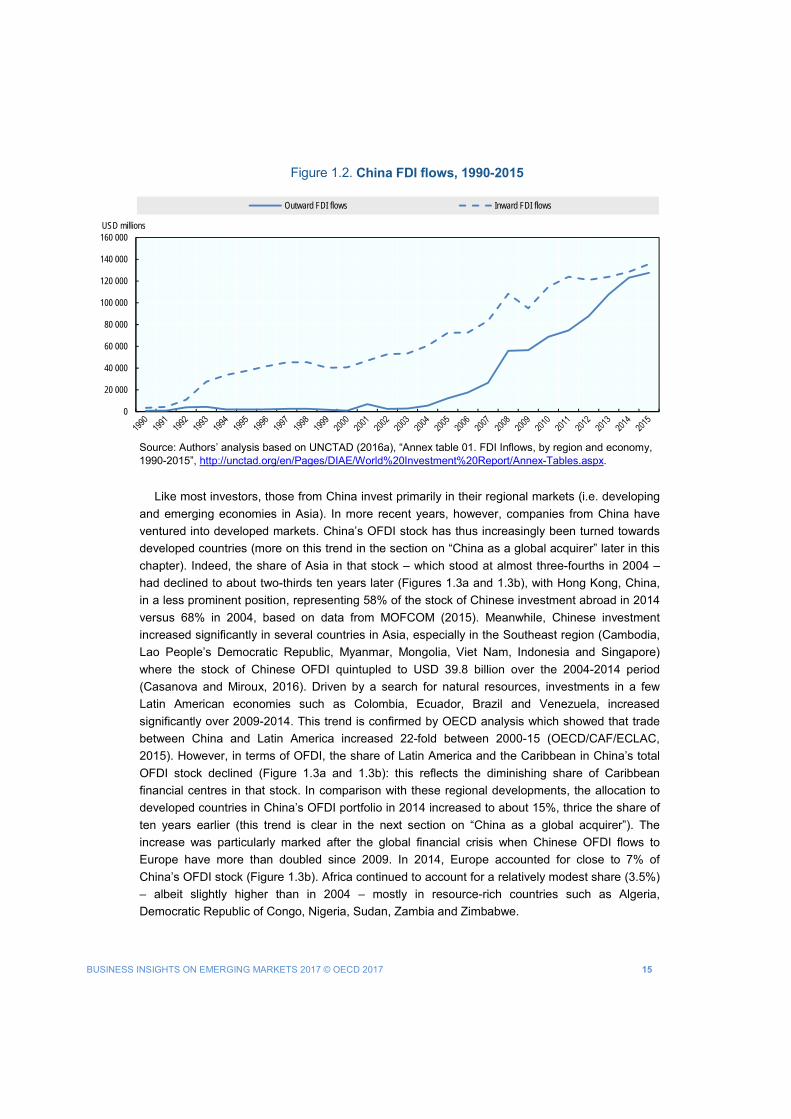
The surge of the People’s Republic of China (hereafter “China’’) as a global investor has been particularly impressive since 2006 (Figure 1.1). While China was virtually absent from the first waves of outward foreign direct investment (OFDI) from emerging economies (between the mid-1970s and the mid-1990s), it has been spearheading the latest and most significant wave that took place at the turn of the millennium and saw the advent of emerging markets as key players on the world OFDI stage. During this period of accelerated Chinese OFDI expansion, the 2008-09 global financial crisis marked a tipping point, with China’s OFDI flows more than doubling in 2008. At approximately USD 125 billion (US dollars) on average over 2014-15, they were about ten times what they had been in 2005, making China the third largest investor in the world and by far the largest among emerging economies.1 Such fast expansion has significantly narrowed the gap between China’s inward and outward FDI flows (Figure 1.2), a trend that has drawn the attention of the Chinese authorities, as discussed below.
Figure 1.1. Outward FDI flows from China, 1990-2015 (USD millions and share of global FDI flows)
Note: Dotted line - Share in Global OFDI flows. Source: Authors’ analysis based on UNCTAD (2016a), “Annex table 01. FDI Inflows, by region and economy, 1990-2015”, http://unctad.org/en/Pages/DIAE/World%20Investment%20Report/Annex-Tables.aspx.
0
2
4
6
8
10
12
14
0
20 000
40 000
60 000
80 000
100 000
120 000
140 000
160 000
1990 1991 1992 1993 1994 1995 1996 1997 1998 1999 2000 2001 2002 2003 2004 2005 2006 2007 2008 2009 2010 2011 2012 2013 2014 2015
%USD millions
BUSINESS INSIGHTS ON EMERGING MARKETS 2017 © OECD 2017 15
Figure 1.2. China FDI flows, 1990-2015
Source: Authors’ analysis based on UNCTAD (2016a), “Annex table 01. FDI Inflows, by region and economy, 1990-2015”, http://unctad.org/en/Pages/DIAE/World%20Investment%20Report/Annex-Tables.aspx.
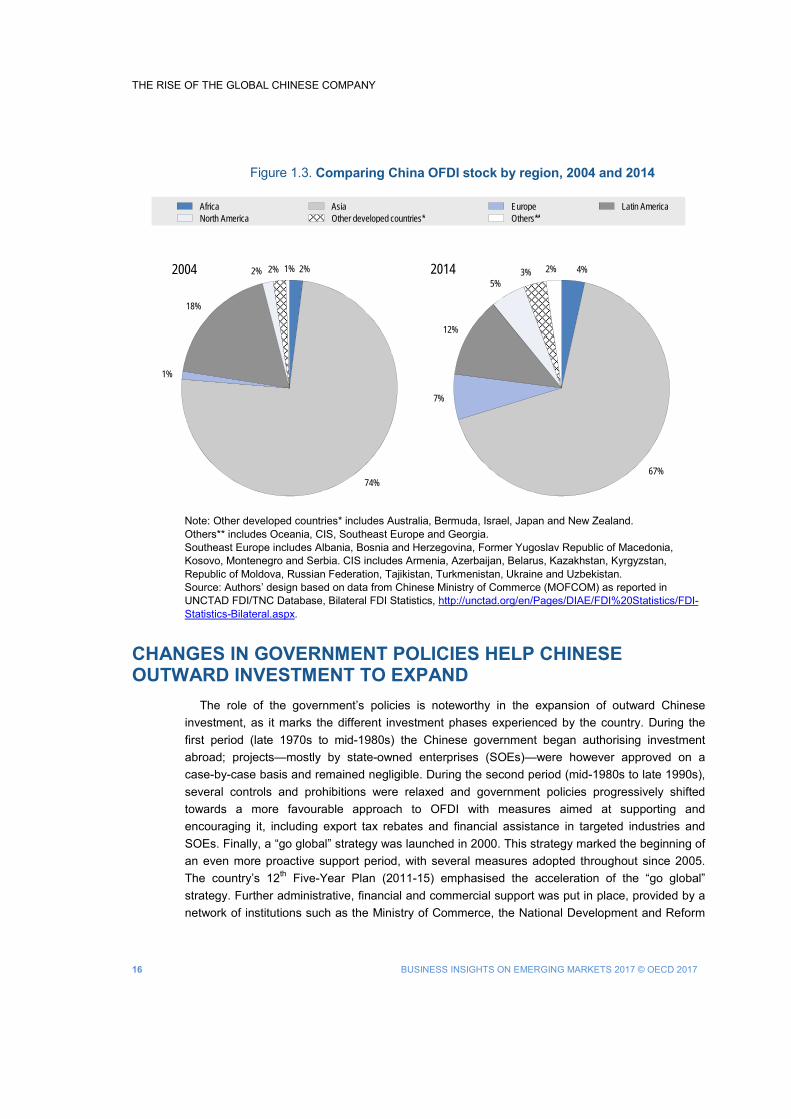
Like most investors, those from China invest primarily in their regional markets (i.e. developing and emerging economies in Asia). In more recent years, however, companies from China have ventured into developed markets. China’s OFDI stock has thus increasingly been turned towards developed countries (more on this trend in the section on “China as a global acquirer” later in this chapter). Indeed, the share of Asia in that stock – which stood at almost three-fourths in 2004 – had declined to about two-thirds ten years later (Figures 1.3a and 1.3b), with Hong Kong, China, in a less prominent position, representing 58% of the stock of Chinese investment abroad in 2014 versus 68% in 2004, based on data from MOFCOM (2015). Meanwhile, Chinese investment increased significantly in several countries in Asia, especially in the Southeast region (Cambodia, Lao People’s Democratic Republic, Myanmar, Mongolia, Viet Nam, Indonesia and Singapore) where the stock of Chinese OFDI quintupled to USD 39.8 billion over the 2004-2014 period (Casanova and Miroux, 2016). Driven by a search for natural resources, investments in a few Latin American economies such as Colombia, Ecuador, Brazil and Venezuela, increased significantly over 2009-2014. This trend is confirmed by OECD analysis which showed that trade between China and Latin America increased 22-fold between 2000-15 (OECD/CAF/ECLAC, 2015). However, in terms of OFDI, the share of Latin America and the Caribbean in China’s total OFDI stock declined (Figure 1.3a and 1.3b): this reflects the diminishing share of Caribbean financial centres in that stock. In comparison with these regional developments, the allocation to developed countries in China’s OFDI portfolio in 2014 increased to about 15%, thrice the share of ten years earlier (this trend is clear in the next section on “China as a global acquirer”). The increase was particularly marked after the global financial crisis when Chinese OFDI flows to Europe have more than doubled since 2009. In 2014, Europe accounted for close to 7% of China’s OFDI stock (Figure 1.3b). Africa continued to account for a relatively modest share (3.5%) – albeit slightly higher than in 2004 – mostly in resource-rich countries such as Algeria, Democratic Republic of Congo, Nigeria, Sudan, Zambia and Zimbabwe.
0
20 000
40 000
60 000
80 000
100 000
120 000
140 000
160 000USD millions
Outward FDI flows Inward FDI flows
THE RISE OF THE GLOBAL CHINESE COMPANY
16 BUSINESS INSIGHTS ON EMERGING MARKETS 2017 © OECD 2017
Figure 1.3. Comparing China OFDI stock by region, 2004 and 2014
Note: Other developed countries* includes Australia, Bermuda, Israel, Japan and New Zealand. Others** includes Oceania, CIS, Southeast Europe and Georgia. Southeast Europe includes Albania, Bosnia and Herzegovina, Former Yugoslav Republic of Macedonia, Kosovo, Montenegro and Serbia. CIS includes Armenia, Azerbaijan, Belarus, Kazakhstan, Kyrgyzstan, Republic of Moldova, Russian Federation, Tajikistan, Turkmenistan, Ukraine and Uzbekistan. Source: Authors’ design based on data from Chinese Ministry of Commerce (MOFCOM) as reported in UNCTAD FDI/TNC Database, Bilateral FDI Statistics, http://unctad.org/en/Pages/DIAE/FDI%20Statistics/FDI-Statistics-Bilateral.aspx.
CHANGES IN GOVERNMENT POLICIES HELP CHINESE OUTWARD INVESTMENT TO EXPAND
The role of the government’s policies is noteworthy in the expansion of outward Chinese investment, as it marks the different investment phases experienced by the country. During the first period (late 1970s to mid-1980s) the Chinese government began authorising investment abroad; projects—mostly by state-owned enterprises (SOEs)—were however approved on a case-by-case basis and remained negligible. During the second period (mid-1980s to late 1990s), several controls and prohibitions were relaxed and government policies progressively shifted towards a more favourable approach to OFDI with measures aimed at supporting and encouraging it, including export tax rebates and financial assistance in targeted industries and SOEs. Finally, a “go global” strategy was launched in 2000. This strategy marked the beginning of an even more proactive support period, with several measures adopted throughout since 2005. The country’s 12th Five-Year Plan (2011-15) emphasised the acceleration of the “go global” strategy. Further administrative, financial and commercial support was put in place, provided by a network of institutions such as the Ministry of Commerce, the National Development and Reform
2%
74%
1%
18%
2% 2% 1% 4%
67%
7%
12%
5%3% 2%
Africa Asia Europe Latin AmericaNorth America Other developed countries* Others**
2004 2014
BUSINESS INSIGHTS ON EMERGING MARKETS 2017 © OECD 2017 17
Commission, the Export-Import Bank of China, the China Development Bank and China Export and Credit Insurance Corporation. Such support includes: 1) easier access to finance and subsidised loans for investment in priority sectors or industries; 2) subsidies in the context of aid programmes; and 3) tax incentives.
On the political side, after the 2008-09 global financial crisis, China also engaged in active investment diplomacy to promote its “go global” strategy, as illustrated by tours of the Chinese Premier in Latin America (two visits in 2014-15) and in Africa (two visits in 2013-14). In addition, major initiatives – such as the One Belt, One Road (OBOR) initiative2, in which the Chinese government is playing a leading role, and the institution of the Asian Infrastructure Investment Bank (AIIB) – are also likely to support Chinese OFDI expansion.
Since late 2016, however, Chinese government support to OFDI policy has shifted to tightening regulations on capital outflows, including closer monitoring of Chinese firms’ M&As overseas. At the end of November 2016, as the Chinese government became increasingly concerned with large-sized acquisitions, stricter approval requirements were considered for deals worth more than USD 10 billion, or more than USD 1 billion if the acquisitions were outside the investor’s core business area. Moreover, real estate purchases abroad by SOEs for more than USD 1 billion would no longer be allowed. While new rules have yet to be formally announced, Chinese authorities have indicated via the State Administration of Foreign Exchange that they would crack down on “fake” transactions.
Beyond motivations related to the ongoing anti-corruption campaign, the main reason for this shift is the downward pressure on the Yuan Renminbi and the risk of destabilisation resulting from the significant capital outflows registered in 2015 and 2016. While foreign direct investment (FDI) is not the most significant component of these outflows (but rather cross-border bank lending, including trade credit, and portfolio investments), outbound investments have increased significantly since 2006 (as seen above). Due largely to capital outflows, the Yuan Renminbi fell by 6.3% in relation to the US dollar in 2016.3 Overseas M&As by Chinese firms have been particularly visible since 2015, some for amounts exceeding several billion US dollars (see following section).
With these restrictions, the government is seeking to curb capital flight disguised as foreign investment. Some recent acquisitions, especially by private companies, have been thought to be motivated mainly by the desire to transfer money abroad. Recent reactions of the governments of countries in which firms were acquired may also have played a role. Australia, for instance, has blocked several asset sales to Chinese-based companies on national interest grounds; Germany, traditionally a popular destination for Chinese investment, withdrew its approval for the sale of a German chip maker, Aixtron, while the US Administration blocked the purchase of the American portion of Aixtron’s business because of national security concerns (Mozur, 2016; Wilkes, 2016).
The impact of China’s policy shift on capital outflows remains to be seen, depending on how the government’s attitude about net FDI flows evolves in 2017 and on whether new rules and more precise restrictions will be put in place. It will also depend on several developments in the world economy (e.g. trends in global demand and the evolution of exchange rates, of the Yuan Renminbi and the US dollar) and on the Chinese authorities’ policy priorities. The situation could also cause problems for foreign companies investing in China, in some cases complicating the dividend remittance process and possibly acting as a deterrent to FDI inflows.
THE RISE OF THE GLOBAL CHINESE COMPANY
18 BUSINESS INSIGHTS ON EMERGING MARKETS 2017 © OECD 2017
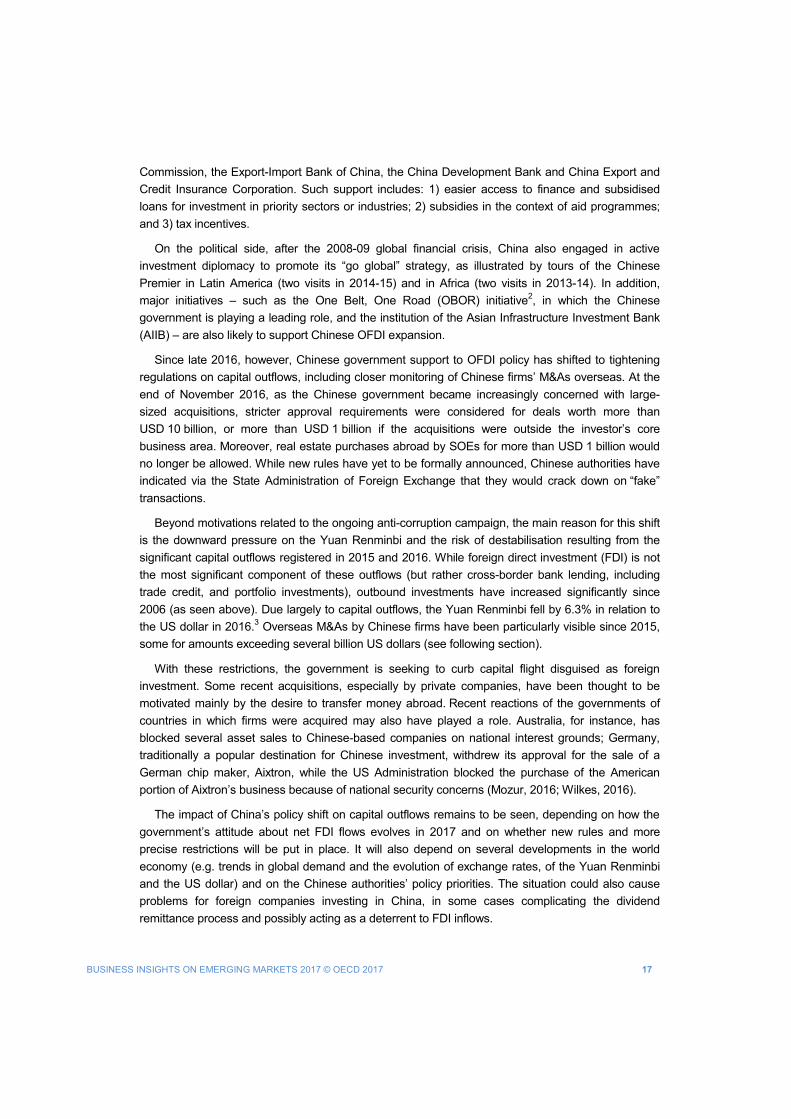
CHINA EMERGES AS A GLOBAL ACQUIRER As part of their overseas expansion, Chinese multinational corporations (MNCs) have entered
into a growing number of M&A deals. The value of such deals has increased since the early 2000s and especially since the 2008-09 global financial crisis (Figure 1.4). In 2015 and 2016 there has been an impressive surge in such transactions.
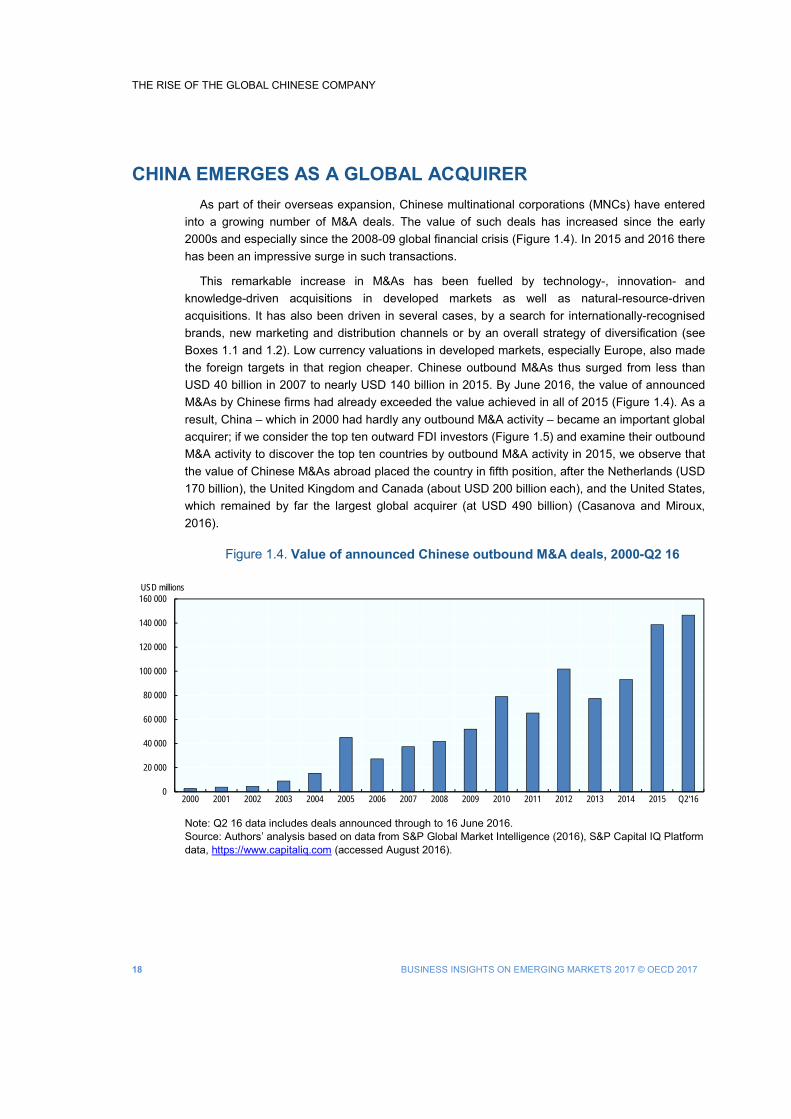
This remarkable increase in M&As has been fuelled by technology-, innovation- and knowledge-driven acquisitions in developed markets as well as natural-resource-driven acquisitions. It has also been driven in several cases, by a search for internationally-recognised brands, new marketing and distribution channels or by an overall strategy of diversification (see Boxes 1.1 and 1.2). Low currency valuations in developed markets, especially Europe, also made the foreign targets in that region cheaper. Chinese outbound M&As thus surged from less than USD 40 billion in 2007 to nearly USD 140 billion in 2015. By June 2016, the value of announced M&As by Chinese firms had already exceeded the value achieved in all of 2015 (Figure 1.4). As a result, China – which in 2000 had hardly any outbound M&A activity – became an important global acquirer; if we consider the top ten outward FDI investors (Figure 1.5) and examine their outbound M&A activity to discover the top ten countries by outbound M&A activity in 2015, we observe that the value of Chinese M&As abroad placed the country in fifth position, after the Netherlands (USD 170 billion), the United Kingdom and Canada (about USD 200 billion each), and the United States, which remained by far the largest global acquirer (at USD 490 billion) (Casanova and Miroux, 2016).
Figure 1.4. Value of announced Chinese outbound M&A deals, 2000-Q2 16
Note: Q2 16 data includes deals announced through to 16 June 2016. Source: Authors’ analysis based on data from S&P Global Market Intelligence (2016), S&P Capital IQ Platform data, https://www.capitaliq.com (accessed August 2016).
0
20 000
40 000
60 000
80 000
100 000
120 000
140 000
160 000
2000 2001 2002 2003 2004 2005 2006 2007 2008 2009 2010 2011 2012 2013 2014 2015 Q2'16
USD millions
BUSINESS INSIGHTS ON EMERGING MARKETS 2017 © OECD 2017 19
Figure 1.5. Value of announced outbound M&A deals by the 10 biggest acquirer countries, 2000-15
Source: Authors’ analysis based on data from S&P Global Market Intelligence (2016), S&P Capital IQ Platform data, https://www.capitaliq.com (accessed August 2016).
The total value of deals that originated in China as a percentage of the total value of deals from these top 10 countries increased from less than 1% in 2000 to 9% in 2015, compared, for instance, with 11% for the Netherlands, 12% for the United Kingdom and 14% for Canada. The United States alone accounted for 30% of the total value of outbound M&As by these top 10 global acquirers (Casanova and Miroux, 2016).
As part of its emergence as a global acquirer, China has come to play a significant role in mega deals. Of the top 100 global transactions announced between 1 July 2015 and 30 June 2016, 17 originated from China, the largest number of deals by a single country, led by the USD 43 billion announced acquisition of Syngenta by China National Chemical Corporation in February 2016. The latter is the fourth-biggest overseas deal by any company over this period. China was followed by the United States with 15 of the top 100 announced deals, then Canada (12), Germany (7) and the United Kingdom and France (6 each) (based on data from S&P Global Market Intelligence, 2016). Six Chinese acquisitions announced since 2008 have topped USD 10 billion and in 2016 alone, Chinese companies conducted 33 acquisitions valued at more than USD 1 billion each (Weinland, Mitchell and Wildau, 2016). In 2015, China bought more US companies than vice versa.
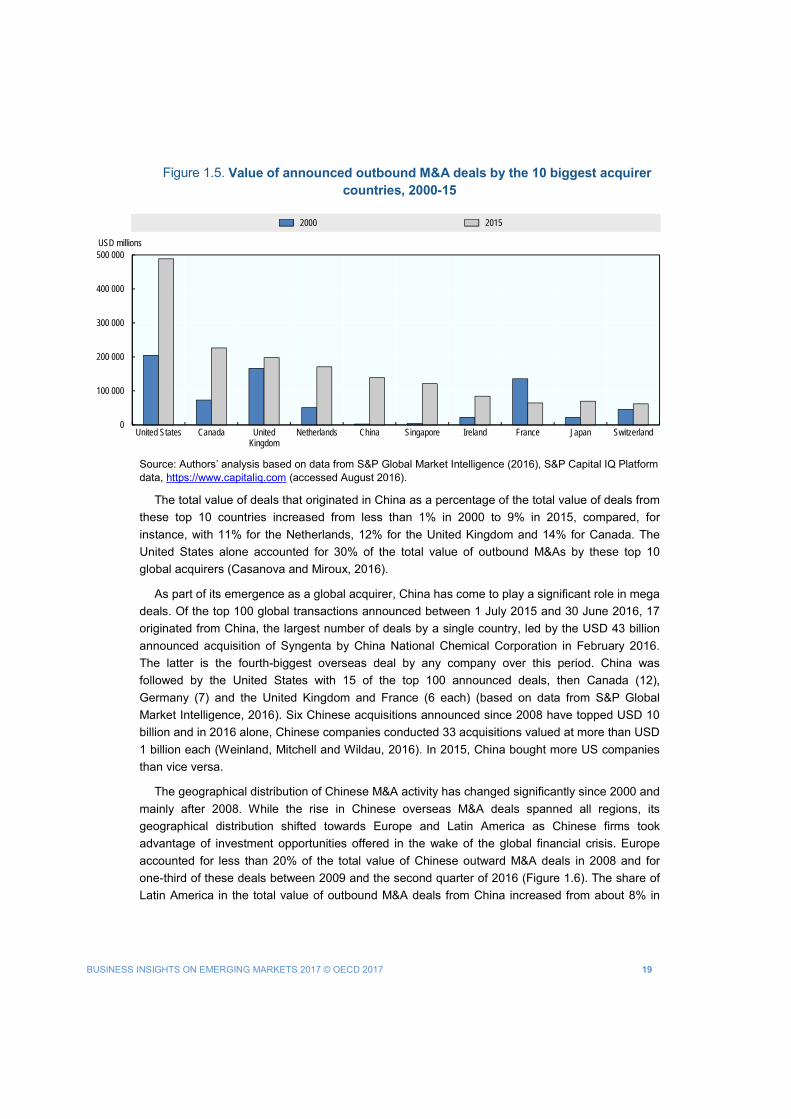
The geographical distribution of Chinese M&A activity has changed significantly since 2000 and mainly after 2008. While the rise in Chinese overseas M&A deals spanned all regions, its geographical distribution shifted towards Europe and Latin America as Chinese firms took advantage of investment opportunities offered in the wake of the global financial crisis. Europe accounted for less than 20% of the total value of Chinese outward M&A deals in 2008 and for one-third of these deals between 2009 and the second quarter of 2016 (Figure 1.6). The share of Latin America in the total value of outbound M&A deals from China increased from about 8% in
0
100 000
200 000
300 000
400 000
500 000
United States Canada UnitedKingdom
Netherlands China Singapore Ireland France Japan Switzerland
USD millions
2000 2015
THE RISE OF THE GLOBAL CHINESE COMPANY
20 BUSINESS INSIGHTS ON EMERGING MARKETS 2017 © OECD 2017
the pre-crisis period to 15% following the crisis (Figure 1.6). Africa and the Middle East have remained less important target regions for Chinese M&As.
Figure 1.6. Geographic distribution of announced Chinese outbound M&A deals, 2001-Q2 16
Percentage of total value in USD millions
Source: Authors’ analysis based on data from S&P Global Market Intelligence (2016), S&P Capital IQ Platform data, https://www.capitaliq.com (accessed August 2016).
Figure 1.7. Price and valuation of outbound M&A deals from China and the United States, 2015
Source: Author’s analysis based on data from S&P Global Market Intelligence (2016), S&P Capital IQ Platform data, https://www.capitaliq.com.
0
5
10
15
20
25
30
35
40
Europe Latin America and Caribbean Asia / Pacific United States and Canada Africa / Middle East
%
2001 - 2008 2009 - Q2'16
USD 269
USD 592
0 200 400 600 800
China
United States
USD millions
Average Deal Value
29.8%
26.2%
24 25 26 27 28 29 30 31
China
United States
%
Average Premium
BUSINESS INSIGHTS ON EMERGING MARKETS 2017 © OECD 2017 21
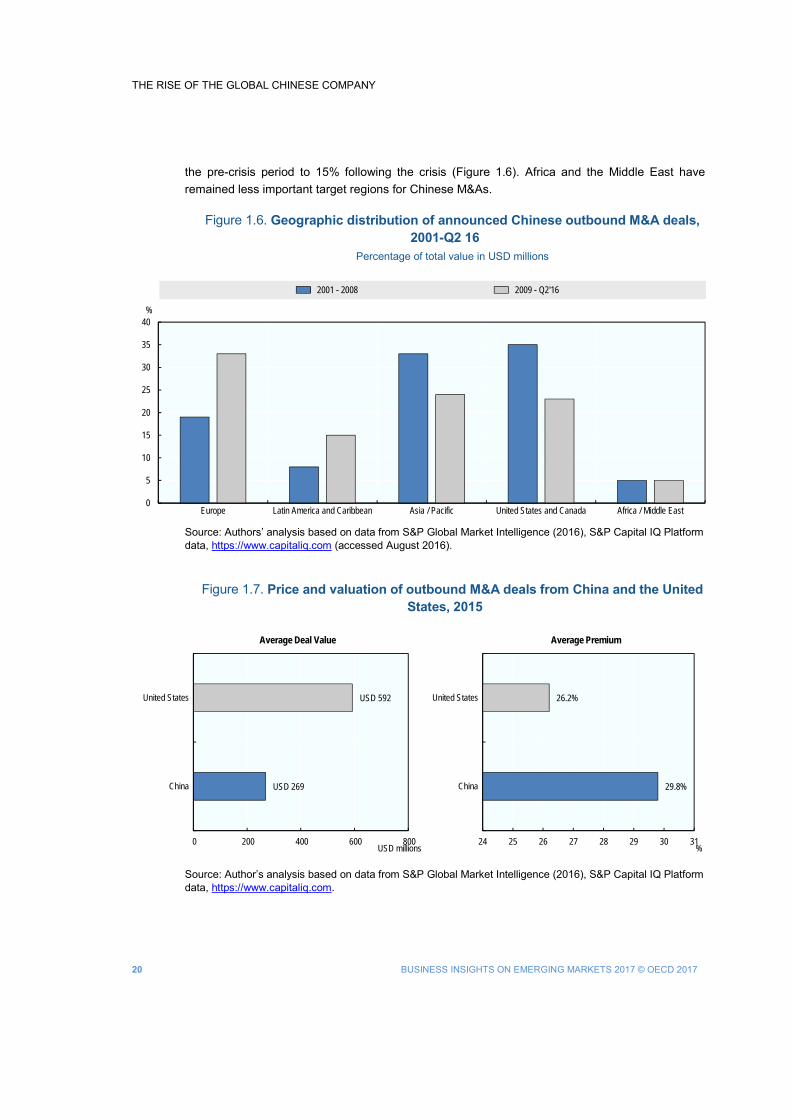
Along with the increase in the total value of deals, the average size of deals also increased from USD 211 million to USD 275 million from 2000-08 and the average premium rose from 27% to 36.4% in the same period. The average deal, however, is still below that of the United States whereas interestingly, the premiums are higher for Chinese companies. For instance, the average deal size for the United States in 2015 was USD 592 million compared to USD 269 million for outbound Chinese deals (Figure 1.7), but the higher premiums for Chinese companies may reflect the fact that Chinese companies are likely to be less known compared to US companies and may therefore be facing some resistance from sellers, therefore demanding higher premiums. The increased uncertainty – brought about by government reactions in target countries or by more complex approval processes in China – regarding the actual completion of deals involving a Chinese buyer is unlikely to reduce sellers’ apprehension.
Box 1.1. Huawei: Joint innovation
Huawei, a global information and communications technology (ICT) solutions provider, was founded in 1987 in Shenzhen, China. It started as an agent reselling private branch exchange (PBX), i.e. a private telephone system used within a company, and developed its own PBX product three years later. At the beginning, Huawei focused on rural markets. Soon thereafter, it expanded its business to major cities in China and started international expansion in 1999, setting up a research and development (R&D) centre in Bengaluru, India. Huawei diversified its product portfolio from manufacturing phone switches to end-to-end solutions in telecommunications and enterprise networks, devices, and cloud computing. Its ICT solutions, products and services have been used since 2016 in more than 170 countries and regions. Huawei is the largest telecommunications equipment manufacturer in the world with revenues of USD 60 billion in 2015, 70% of which come from outside China.
Huawei has invested heavily in R&D relying on the establishment of Joint Innovation Centres all over the world. It launched its first joint innovation centre in 2006 with Vodafone Spain, called Mobile Innovation Centre, later promoting such practices globally. Huawei now has 36 Joint Innovation Centres in the world, including in countries such as Belgium, Canada, France, Germany, Ireland, India, Italy, Finland, Pakistan, Sweden, the Russian Federation, the United Kingdom, and the United States. These facilities cover mobile broadband, fixed broadband, cloud computing, etc. Such practices have induced many benefits, including better leveraging of partners’ technology and understanding clients’ needs to offer the best and timely market solutions, as well as strengthening the relationship between the partners.
When Huawei started its digital journey, it also leveraged its experience in joint innovation, collaborating with partners with a strong market position. It launched initiatives in cloud and enterprise applications in collaboration with the German software corporation SAP and the US company Accenture; it also actively explored joint innovation with the Indian corporation Infosys, US firms GE and Microsoft, and the Swedish ICT provider Hexagon, in the areas, among others, of smart stadiums, core banking solutions, industrial Internet, cloud services and smart cities.
Sources: Hensmans, M. (2017), Competing Through Joint Innovation, MIT Sloan Management Review, Winter 2017, http://sloanreview.mit.edu/article/competing-through-joint-innovation/; Huawei (2016a), About Us section, www.huawei.com/us/about-huawei/; Huawei (2016b), Building a Better Connected World, www-file.huawei.com/~/media/CORPORATE/PDF/annual-report/AnnualReport2015_en.pdf?la=en; The Economist (2014), “ The Great Disrupter’s New Targets” , 20 September, www.economist.com/news/business/21618861-chinese-firm-prepares-take-hp-cisco-and-other-it-giants-great-disrupters-new.
THE RISE OF THE GLOBAL CHINESE COMPANY
22 BUSINESS INSIGHTS ON EMERGING MARKETS 2017 © OECD 2017
Box 1.2. HNA Group: Globalisation through the M&A route
HNA Group was established in 1993 on an island in South China as a regional airline company, Hainan Airlines. HNA highlights the ability of a Chinese firm to improve the quality its services, diversify its business and expand abroad through M&As. Its revenue reached about USD 30 billion in 2015.
Hainan Airlines did not have strong competitive advantages initially with regard to other airlines due to its island location outside the main routes. The firm also lacked brand recognition. To overcome this, Hainan Airlines focused on premium customer service, designed a detailed workflow for customer service and offered training and financial rewards for high-performing staff. This strategy helped it grow quickly and become an international airline with 1 250 planes by the end of 2015.
Despite its success, Hainan Airlines suffered during the severe acute respiratory syndrome (SARS) epidemic in Asia in 2003. To address the volatility inherent to the business, HNA diversified. It expanded into airport hotels and actively invested in other tourism-related activities and real estate. It also developed activities around the logistics chain; in 2016, HNA Logistics owns 40 companies covering cargo, warehouse and cold-chain service.
HNA Group started its internationalisation in 2010 and by the end of 2015 had 30 operational entities in 16 countries. The group resorted heavily to M&As to diversify and expand, betting on the growing appetite of Chinese tourists for overseas travel. HNA’s M&A activity has been particularly intense in 2015-16, with its domestic and foreign M&As exceeding USD 33 billion. About half were overseas acquisitions, illustrating HNA’s diversification strategy. For instance, in 2015, HNA bought the US firm Carlson Hotels. It continued enlarging its airlines business by buying a stake in Virgin Australia, purchasing the Irish aircraft leasing company Avolon and acquiring Swissport, a Swiss luggage handler. Moreover, it furthered its efforts to set up a global provider of logistics and supply chain services solutions by purchasing Ingram Micro, a US wholesaler of technology products and services. At the end of 2015, about 25% of HNA’s revenues came from overseas.
Sources: HNA Group (2016a), HNA Group website, www.hnagroup.com/en/; HNA Group (2016b), HNA Group, www.hnagroup.com/asset/index/downarea/14677847741566.pdf; Weinland, D. and B. Masters (2016),”HNA in race to grab Chinese tourists as it acquires Carlson Hotels”, www.ft.com/content/95cd867e-0d2f-11e6-ad80-67655613c2d6; Sheperd, C. and T. Mitchell (2016), “HNA’s Dizzying Expansion Raises Questions”, www.ft.com/content/9656a502-9a84-11e6-8f9b-70e3cabccfae.
Chinese multinational companies disrupt the competitive landscape
Like the acquisition trend, Chinese firms have grown at an impressive speed and, in 2016, featured prominently among the biggest in the world. Since 2004, the number of Chinese companies in the Fortune Global 500 list has increased fivefold, from 16 in 2004 to 98 in 2015, with a clear acceleration after the 2008-09 global financial crisis. These firms are quite young compared to US companies founded more than 100 years ago; most were founded after 1950 and many after 1980. Three of the biggest Chinese companies are not yet 20 years old.
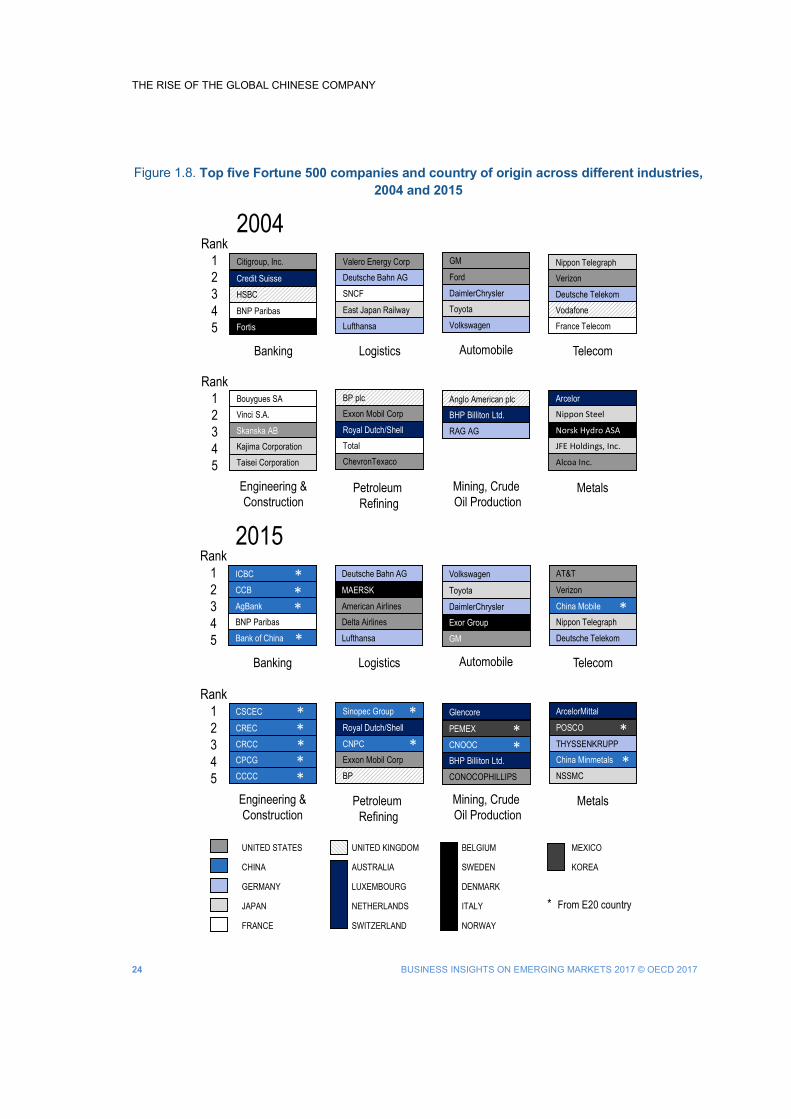
Chinese firms have become world industry leaders
Based on revenues, Chinese firms have become world leaders in several industries, rising to the first positions at remarkable speed. If we consider the five top leaders in eight industries: banking, logistics (defined as airlines, railroads and shipping), automobile (defined as motor vehicles and parts), telecommunications, engineering and construction, petroleum refining, mining and crude-oil production, and metals, in the Fortune Global 500, there were no emerging market
BUSINESS INSIGHTS ON EMERGING MARKETS 2017 © OECD 2017 23
multinationals among them in 2004, whilst in 2015, 40% were from emerging economies with one-third from China alone (Figure 1.8).
• The change in leadership has been startling in the engineering and construction industry. In
2004, Europe and Japan dominated the top five, while ten years later, the top five positions were held by Chinese companies, namely China State Construction Engineering Corporation (CSCEC); China Railway Engineering Corporation (CREC); China Railway Construction Corporation (CECC); Pacific Construction Group (CPCG); and China Communications Construction Company (CCCC).
• There has also been remarkable change in the banking industry. In 2015, all top five banks but one were Chinese, these being the Industrial and Commercial Bank of China (ICBC), the China Construction Bank (CCB), the Agricultural Bank of China (“AgBank” in Figure 1.8) and the Bank of China.
• China has also at least one firm among the top five in telecommunications, mining and crude oil production, petroleum refining and metals.
• In three industries – banking, engineering and construction, and petroleum refining – the number one firm in the world is Chinese.
Though Chinese firms have made outstanding inroads in terms of numbers and leadership, they still have a way to go in terms of profits, market capitalisation and internationalisation.
Profits and market capitalisation of Chinese firms versus US firms
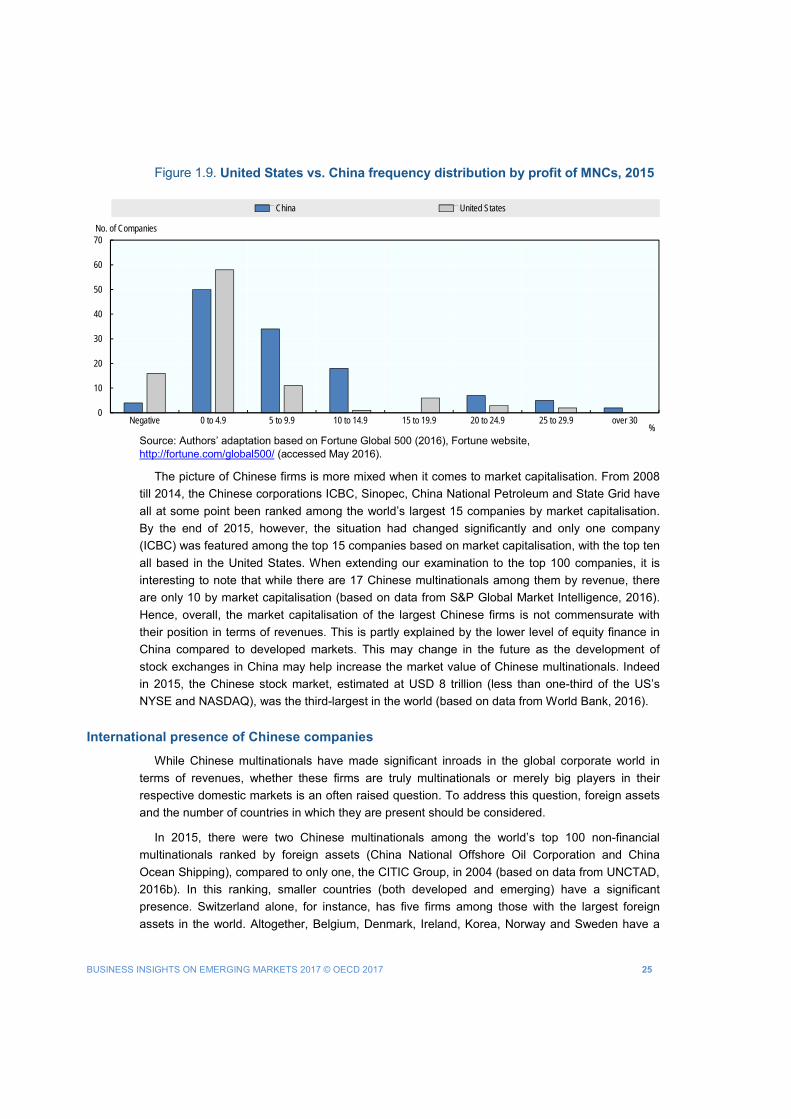
On average, the profitability of the largest Chinese firms lags behind that of the top 500 firms. Almost three-fourths of Chinese companies in the Fortune Global 500 list have a profit margin that is negative or less than 5% compared to 54% for US firms (Figure 1.9) and to 61% for the whole Fortune Global 500 companies. Excluding banking, the profit margins of Chinese multinationals in the industries in which Chinese firms are particularly strong are often below those of their counterparts in developed countries (Casanova and Miroux, 2016).
THE RISE OF THE GLOBAL CHINESE COMPANY
24 BUSINESS INSIGHTS ON EMERGING MARKETS 2017 © OECD 2017
***
*
*
ICBCCCBAgBankBNP ParibasBank of China
Banking
Deutsche Bahn AG
MAERSKAmerican AirlinesDelta AirlinesLufthansa
Logistics
Volkswagen
Toyota
DaimlerChryslerExor GroupGM
Automobile
AT&T
Verizon
China MobileNippon TelegraphDeutsche Telekom
Telecom
Rank12345
CSCEC
CRECCRCCCPCGCCCC
Sinopec Group
Royal Dutch/Shell
CNPCExxon Mobil CorpBP
Glencore
PEMEXCNOOCBHP Billiton Ltd.CONOCOPHILLIPS
ArcelorMittal
POSCO
THYSSENKRUPPChina MinmetalsNSSMC
*
*
*
*
*
*
***
*
*
Engineering & Construction
Petroleum Refining
Mining, CrudeOil Production
Metals
Rank12345
2015
*
***
*
*
Figure 1.8. Top five Fortune 500 companies and country of origin across different industries, 2004 and 2015
2004
Rank12345
Banking
Citigroup, Inc.
Credit SuisseHSBC
BNP ParibasFortis
Logistics
Valero Energy CorpDeutsche Bahn AGSNCF
East Japan RailwayLufthansa
Automobile
GM
FordDaimlerChryslerToyotaVolkswagen
Telecom
Nippon TelegraphVerizonDeutsche TelekomVodafoneFrance Telecom
Engineering & Construction
Bouygues SAVinci S.A.Skanska ABKajima CorporationTaisei Corporation
Petroleum Refining
BP plcExxon Mobil CorpRoyal Dutch/ShellTotalChevronTexaco
Mining, CrudeOil Production
Anglo American plcBHP Billiton Ltd.RAG AG
Metals
ArcelorNippon Steel
Norsk Hydro ASA
JFE Holdings, Inc.
Alcoa Inc.
Rank12345
UNITED STATES
CHINA
GERMANY
JAPAN
FRANCE
UNITED KINGDOM
AUSTRALIA
LUXEMBOURG
NETHERLANDS
SWITZERLAND
BELGIUM
SWEDEN
DENMARK
ITALY
NORWAY
MEXICO
KOREA
* From E20 country
BUSINESS INSIGHTS ON EMERGING MARKETS 2017 © OECD 2017 25
Figure 1.9. United States vs. China frequency distribution by profit of MNCs, 2015
Source: Authors’ adaptation based on Fortune Global 500 (2016), Fortune website, http://fortune.com/global500/ (accessed May 2016).
The picture of Chinese firms is more mixed when it comes to market capitalisation. From 2008 till 2014, the Chinese corporations ICBC, Sinopec, China National Petroleum and State Grid have all at some point been ranked among the world’s largest 15 companies by market capitalisation. By the end of 2015, however, the situation had changed significantly and only one company (ICBC) was featured among the top 15 companies based on market capitalisation, with the top ten all based in the United States. When extending our examination to the top 100 companies, it is interesting to note that while there are 17 Chinese multinationals among them by revenue, there are only 10 by market capitalisation (based on data from S&P Global Market Intelligence, 2016). Hence, overall, the market capitalisation of the largest Chinese firms is not commensurate with their position in terms of revenues. This is partly explained by the lower level of equity finance in China compared to developed markets. This may change in the future as the development of stock exchanges in China may help increase the market value of Chinese multinationals. Indeed in 2015, the Chinese stock market, estimated at USD 8 trillion (less than one-third of the US’s NYSE and NASDAQ), was the third-largest in the world (based on data from World Bank, 2016).
International presence of Chinese companies
While Chinese multinationals have made significant inroads in the global corporate world in terms of revenues, whether these firms are truly multinationals or merely big players in their respective domestic markets is an often raised question. To address this question, foreign assets and the number of countries in which they are present should be considered.
In 2015, there were two Chinese multinationals among the world’s top 100 non-financial multinationals ranked by foreign assets (China National Offshore Oil Corporation and China Ocean Shipping), compared to only one, the CITIC Group, in 2004 (based on data from UNCTAD, 2016b). In this ranking, smaller countries (both developed and emerging) have a significant presence. Switzerland alone, for instance, has five firms among those with the largest foreign assets in the world. Altogether, Belgium, Denmark, Ireland, Korea, Norway and Sweden have a
0
10
20
30
40
50
60
70
Negative 0 to 4.9 5 to 9.9 10 to 14.9 15 to 19.9 20 to 24.9 25 to 29.9 over 30
No. of Companies
%
China United States
THE RISE OF THE GLOBAL CHINESE COMPANY
26 BUSINESS INSIGHTS ON EMERGING MARKETS 2017 © OECD 2017
total of seven entries in the list. The United States has the largest number of firms, i.e. 21 companies, or considerably more than China.
The picture is somehow different when considering the number of countries (other than the home country) in which a company is present, which provides a better understanding of the internationalisation of firms. If, for instance, we examine the number of countries in which Fortune Global 500 companies are present, it appears that firms from the United States and Japan are present in an average of 28 and 26 countries, respectively, including their home country. By comparison, companies from Korea and China are present, on average, in a smaller number of countries: 17 countries for Korea, and 10 in the case of China, i.e. about one-third of the US average (Casanova and Miroux, 2016).
As stated in Casanova and Miroux (2016), Chinese companies are making strides in internationalisation; indeed, the number of Fortune Global 500 Chinese companies with presence in at least four countries (including China) totals 60. This compares with the data presented by Rugman, stating that five Chinese firms were present in three or more countries, based on data from Fortune Global 500 published in 2012, and qualified by him as “truly international” (Rugman and Nguyen, 2014). Overall, unlike what is quite commonly thought, the global footprint of Chinese multinationals is larger than expected.
LOOKING AT THE FUTURE: WILL CHINESE COMPANIES CONTINUE THEIR SURGE?
In less than a decade, China has become one of the top global investors, not only in neighbouring Asian countries, but also in other developing regions and in developed markets such as Europe and the United States. Buoyed by supportive government policies, such as the “go global” strategy, Chinese multinationals were supported in their outward expansion through access to finance, subsidies and tax incentives. Chinese multinationals have now made significant inroads into the global corporate world, becoming world leaders (in terms of revenues) in industries such as banking, engineering and construction, mining and crude oil production and telecommunications.
However, Chinese multinationals still have a way to go in terms of profits, market capitalisation and international presence compared to the more established Western multinationals.
• With average profit margins lagging behind their US and Japanese counterparts, they appear
for the moment to be looking for growth in revenues rather than profit margins. The differences are relatively significant, whether considering the Chinese firms as a whole or at the industry level, with some notable exceptions, however, as in banking. Chinese multinationals are betting on growth and increasing revenues and sacrificing margins.
• Regarding market capitalisation, the gap between older/Western and Chinese multinationals has become wider since 2014. Whether Chinese multinationals will soon close this gap remains to be seen. The difference in the financial cultures and contexts in which the firms operate partly explains this situation.
BUSINESS INSIGHTS ON EMERGING MARKETS 2017 © OECD 2017 27
• In terms of geographical expansion, Chinese companies are not as international as the leading US and Japanese companies, but they are catching up at a rapid pace. The explanation for this is twofold: a) Chinese multinationals are younger than their Western counterparts and b) their strong international expansion (see OFDI and M&A data above) was more prominent after the global financial crisis.
Further research needs to be done on the growth and internationalisation of Chinese multinationals to ratify these findings as well as the trends. Will Chinese companies increase their profitability or prefer to continue to sacrifice it in their search for growth? Will they continue their acquisition spree or, on the contrary, given heightened global economic uncertainty and some vivid reactions in target countries, pause for a while?
THE RISE OF THE GLOBAL CHINESE COMPANY
28 BUSINESS INSIGHTS ON EMERGING MARKETS 2017 © OECD 2017
Notes 1 FDI/OFDI statistics always need to be approached with some caution, partly because of the impact of round-tripping on
such statistics. In the case of China, estimates of the 2013 Chinese OFDI flows adjusted for the impact of round-tripping through Hong Kong, China, amounted to almost USD 82 billion, versus USD 108 billion with no adjustment, which still leaves China in a top position among investors, or 5th in 2013 world ranking (Garcia-Herrero, Xia and Casanova, 2015).
2 One Belt, One Road (OBOR) is an economic development initiative which has the goal of establishing greater connectivity between Asia, Europe and Africa.
3 The Renminbi fell from 1 CNY = 0.15372 (on 1 January 2016) to 0.14399 (on 31 December 2016). Source: www.xe.com.
References Casanova, L. and A. Miroux (2016), Emerging Market Multinationals Report: The China Surge, Emerging Market
Institute, Cornell School of Business, Cornell University, Ithaca, http://bit.ly/eMNCreport.
Fortune (2016), Fortune Global 500, Time Inc., Fortune website, http://fortune.com/global500/ (accessed May 2016).
Garcia-Herrero, A., Le Xia and C. Casanova (2015), “Chinese outbound foreign direct investment: How much goes where after round-tripping and offshoring?”, BBVA Research Working Paper Series, No. 15/17, Hong Kong, www.bbvaresearch.com/wp-content/uploads/2015/06/15_17_Working-Paper_ODI.pdf.
Hensmans, M. (2017), Competing Through Joint Innovation, MIT Sloan Management Review, Winter 2017, http://sloanreview.mit.edu/article/competing-through-joint-innovation/.
HNA Group (2016a), HNA Group website, www.hnagroup.com/en/.
HNA Group (2016b), HNA Group, HNA Group Co., Ltd., Haikou City, www.hnagroup.com/asset/index/downarea/14677847741566.pdf.
Huawei (2016a), About Us section, Huawei website, www.huawei.com/us/about-huawei/.
Huawei (2016b), Building a Better Connected World, 2015 Annual Report, Huawei Investment & Holding Co. Ltd., Shenzhen, www.huawei.com/us/about-huawei/annual-report/2015.
MOFCOM (2015), “2014 Statistical Bulletin of China’s Outward Foreign Direct Investment”, National Bureau of Statistics, Ministry of Commerce, People’s Republic of China, Beijing.
Mozur, P. (2016), “Obama Moves to Block Chinese Acquisition of a German Chip Maker”, The New York Times, 2 December, The New York Times website, www.nytimes.com/2016/12/02/business/dealbook/china-aixtron-obama-cfius.html.
OECD/CAF/ECLAC (2015), Latin American Economic Outlook 2016: Towards a New Partnership with China, OECD Publishing, Paris, http://dx.doi.org/10.1787/9789264246218-en.
Rugman, A.M. and Q.T.K. Nguyen (2014), “Modern international business theory and emerging market multinational companies”, in Cuervo-Cazurra, A. and R. Ramamurti (eds.), Understanding multinationals from emerging markets, Cambridge University Press, Cambridge, pp. 53-80.
S&P Global Market Intelligence (2016), S&P Capital IQ database, S&P Capital IQ Platform data, www.capitaliq.com (accessed August 2016).
Sheperd, C. and T. Mitchell (2016), “HNA’s dizzying expansion raises questions”, Financial Times, 26 October, Financial Times website, www.ft.com/content/9656a502-9a84-11e6-8f9b-70e3cabccfae.
The Economist (2014), “The Great Disrupter’s New Targets”, 20 September, The Economist website, www.economist.com/news/business/21618861-chinese-firm-prepares-take-hp-cisco-and-other-it-giants-great-disrupters-new.
UNCTAD (2016a), “Annex table 1: FDI Inflows, by region and economy, 1990-2015”, in World Investment Report 2016: Annex Tables, United Nations Conference on Trade and Development website, http://unctad.org/en/Pages/DIAE/World%20Investment%20Report/Annex-Tables.aspx (accessed August 2016).
BUSINESS INSIGHTS ON EMERGING MARKETS 2017 © OECD 2017 29
UNCTAD (2016b), “Annex table 24: The world’s top 100 non-financial MNEs, ranked by foreign assets, 2015”, in World Investment Report 2016: Annex Tables, United Nations Conference on Trade and Development website, http://unctad.org/en/Pages/DIAE/World%20Investment%20Report/Annex-Tables.aspx (accessed August 2016).
Weiland, D. and B. Masters (2016), “HNA in race to grab Chinese tourists as it acquires Carlson Hotels”, Financial Times, 28 April, Financial Times website, www.ft.com/content/95cd867e-0d2f-11e6-ad80-67655613c2d6.
Weinland, D., T. Mitchell and G. Wildau (2016), “The buying spree behind Beijing’s investment curbs”, Financial Times, 29 November, Financial Times website, www.ft.com/content/2f6849ba-b61b-11e6-961e-a1acd97f622d.
Wilkes, W. (2016), “Germany Withdraws Approval of Chinese Takeover of Aixtron”, The Wall Street Journal, 24 October, The Wall Street Journal website, www.wsj.com/articles/german-withdraws-approval-of-chinese-takeover-of-aixtron-1477297215.
World Bank (2016), “Market capitalization of listed domestic companies (current US$)” in World Federation of Exchanges database, Wold Bank website, http://data.worldbank.org/indicator/CM.MKT.LCAP.CD?end=2015&start=2015&view=bar (accessed July 2016)

Expanding business through regional integration
Regional economic integration progressed rapidly in 2015 and 2016 in Asia, with important consequences for future trade and development. This note provides insights and suggested policy recommendations from the business sector on the trade and investment implications of enhanced economic integration in Asia. The analysis builds on discussions at the OECD Emerging Markets Network (EMnet) meeting on doing business in Asia, “Expanding Business through Regional Integration”, held on 8 March 2016 at the OECD headquarters in Paris as well as on the analysis of the Economic Outlook for Southeast Asia, China and India, in addition to desk research and bilateral discussions with EMnet members.
Key messages include:
• Strengthening regional ties can play a key role in sustaining growth and build new opportunities for trade, investment and development, provided that adequate reforms are implemented to enhance the investment climate, improve the quality of infrastructure, increase talent retention and foster more linkages with small- and medium-sized enterprises (SMEs).
• The “interim period” in which regional trade agreements are still being negotiated or have yet to be ratified produces some uncertainty for businesses. In the meantime, bilateral agreements are instrumental to promote regional trade.
• Firms see wide development gaps amongst countries, persistent non-tariff barriers and restrictive policies in the services sector as key challenges to further integration and development.
• Despite some progress, local companies should be doing more to capture higher parts of global value chains (GVCs), by producing more value-added products and using acquisitions to upgrade brand names and technology.
• Financially viable projects are crucial to channelling capital into infrastructure investments, while financial markets need to be further developed to support this aim.
• On the energy front, the region is expected to shift further to renewables, as their competitiveness improves and favourable government policies are implemented.
• The Chinese slowdown provides both opportunities and challenges for the region, and companies can take advantage of this. In particular, China’s transition is an opportunity to procure low-cost commodities and further support domestic-led growth.
32 BUSINESS INSIGHTS ON EMERGING MARKETS 2017 © OECD 2017
ASIA’S ECONOMIC AND BUSINESS OVERVIEW
Economic trends in Emerging Asia
Emerging Asia (Southeast Asia, China and India) is the most dynamic region in the world. Economic growth is expected to remain robust over the medium term, backed by solid macroeconomic fundamentals and domestic demand. Future prospects may, however, be affected by China’s slowdown as export demand drops and investment flows decline. US monetary tightening also is likely to depress regional capital inflows.
Asia will account for 34% of the world’s gross domestic product (GDP) by 2019 (OECD, 2015a). GDP growth in the 12 Emerging Asia countries (ASEAN-10,1 People’s Republic of China [hereafter “China”] and India) will be robust with a projected annual average growth rate of 6.5% for 2016 and 6.4% for 2017.2
Table 2.1. Real GDP growth of Emerging Asia
Annual percentage change
Country 2015 2016 2017 2017-21 average
2011-13 average
ASEAN-5 countries
Indonesia 4.8 5.0 5.1 5.4 6.2
Malaysia 5.0 4.2 4.5 4.7 5.2
Philippines 5.9 6.8 6.2 6.1 5.9
Thailand 2.8 3.2 3.3 3.6 3.2
Viet Nam 6.7 6.0 6.2 6.2 5.6
Brunei Darussalam and Singapore
Brunei Darussalam -0.6 0.7 2.0 1.8 0.9
Singapore 2.0 1.8 2.0 1.8 4.1
CLM
Cambodia 7.0 7.1 7.1 7.3 7.3
Lao PDR 7.4 7.1 7.3 7.5 8.1
Myanmar 8.7 8.3 8.4 8.5 6.9
China and India
China 6.9 6.7 6.4 6.0 8.2
India 7.6 7.4 7.6 7.3 5.5
Average of ASEAN-10 countries 4.7 4.8 4.9 5.1 5.4
Average of Emerging Asia 6.6 6.5 6.4 6.2 7.0
Note: The cut-off date of data is 28 November 2016. Weighted averages are used for ASEAN and Emerging Asia. The figures for China, India and Indonesia (2016 and 2017 projections) are based on the OECD Economic Outlook No. 100, November 2016. India data refer to fiscal years starting in April. Source: OECD Development Centre, MPF-2017 (Medium-Term Projection Framework), cited in OECD (2017), Economic Outlook for Southeast Asia, China and India 2017, http://dx.doi.org/10.1787/saeo-2017-en. For more information on the MPF, please see www.oecd.org/dev/asia-pacific/mpf.htm.
BUSINESS INSIGHTS ON EMERGING MARKETS 2017 © OECD 2017 33
Growth paths differ substantially. The Philippines and Viet Nam are likely to lead ASEAN-5 growth with an expected growth of 6.8% and 6.0%, respectively, in 2016, and 6.2% for both in 2017. The low-income countries of Cambodia, Lao People’s Democratic Republic (hereafter “Lao PDR”) and Myanmar also are expected to sustain their high levels of growth. Cambodia and Lao PDR should maintain growth at 7.1% for 2016, and a projected 7.1% for Cambodia and 7.3% for Lao PDR in 2017. Myanmar’s predicted growth is 8.3% for 2016 and 8.4% for 2017. The economies of Southeast Asia’s major oil- and gas-exporting countries – Malaysia and Brunei Darussalam – were impacted by the decline in global energy prices; despite low oil prices, Brunei Darussalam was able to limit economic recession from -2.3% in 2014 to -0.6% in 2015, with further recovery expected in both 2016 and 2017 as oil prices are anticipated to rise. Malaysia’s slowdown is expected to improve slightly with its 4.2% growth rate in 2016 projected to rise to 4.5% in 2017.
The outlook for China and India is expected to differ, with China continuing to slow to 6.4% in 2017 while India will sustain growth (7.6%). In China, growth prospects are slowing as the manufacturing sector undergoes adjustment to manage excess capacity. In contrast, India’s development is supported by robust growth in manufacturing, improvement in foreign-investment regulations and the benefits of low oil and gas prices. Nonetheless, India faces critical challenges, such as structural reform implementation and the need to achieve inclusive development (OECD, 2016b).
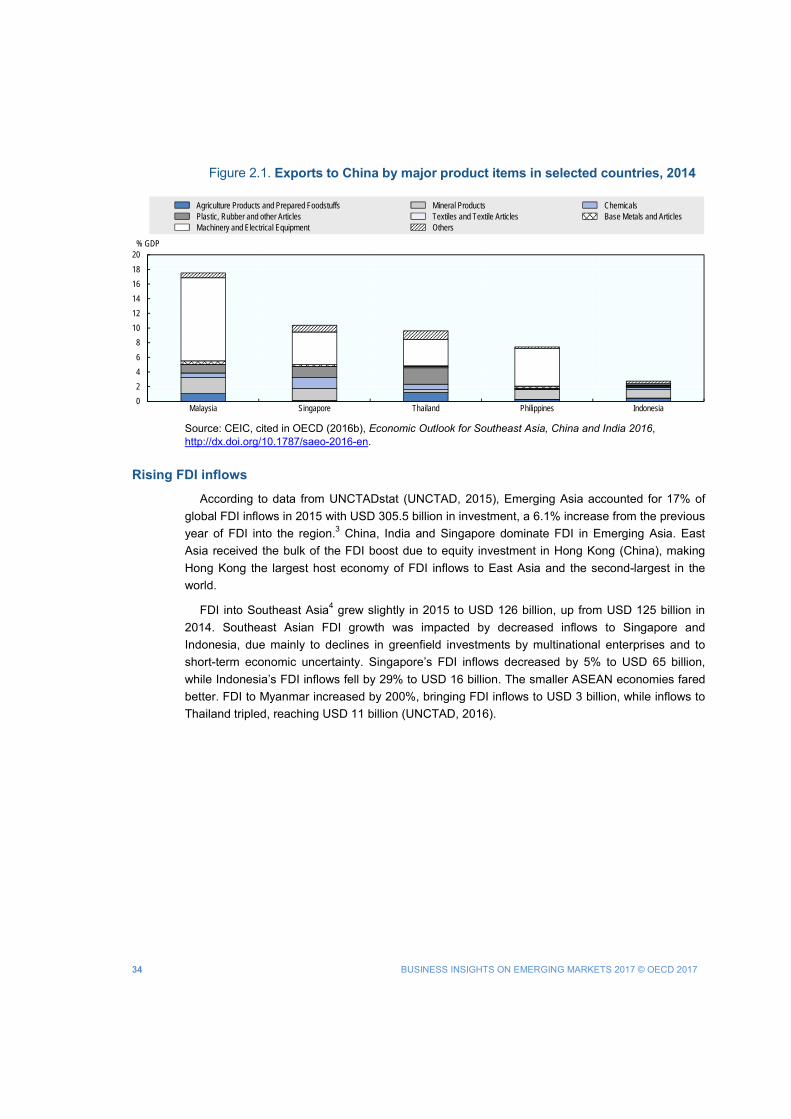
China’s slowing growth will affect the region through declining export demand, reduced foreign direct investment (FDI) and greater financial market volatility. Countries with extensive merchandise exports to China, such as Malaysia (12% of GDP), Singapore and Thailand (6-8% of GDP), already are feeling the impacts of reduced demand (see Figure 2.1). Malaysia and Thailand in particular rely on FDI inflows from China as an important source of investment. Increasing financial links in the region also heighten the spillover effects of financial market fluctuations. In the short term, China’s slowdown will be a demand shock to neighbouring countries, which can be partially mitigated by domestic macroeconomic policies. In the longer term, China’s slowdown is likely to bring about structural changes in industry and trade in many Asian countries (OECD, 2016b).
34 BUSINESS INSIGHTS ON EMERGING MARKETS 2017 © OECD 2017
Figure 2.1. Exports to China by major product items in selected countries, 2014
Source: CEIC, cited in OECD (2016b), Economic Outlook for Southeast Asia, China and India 2016, http://dx.doi.org/10.1787/saeo-2016-en.
Rising FDI inflows
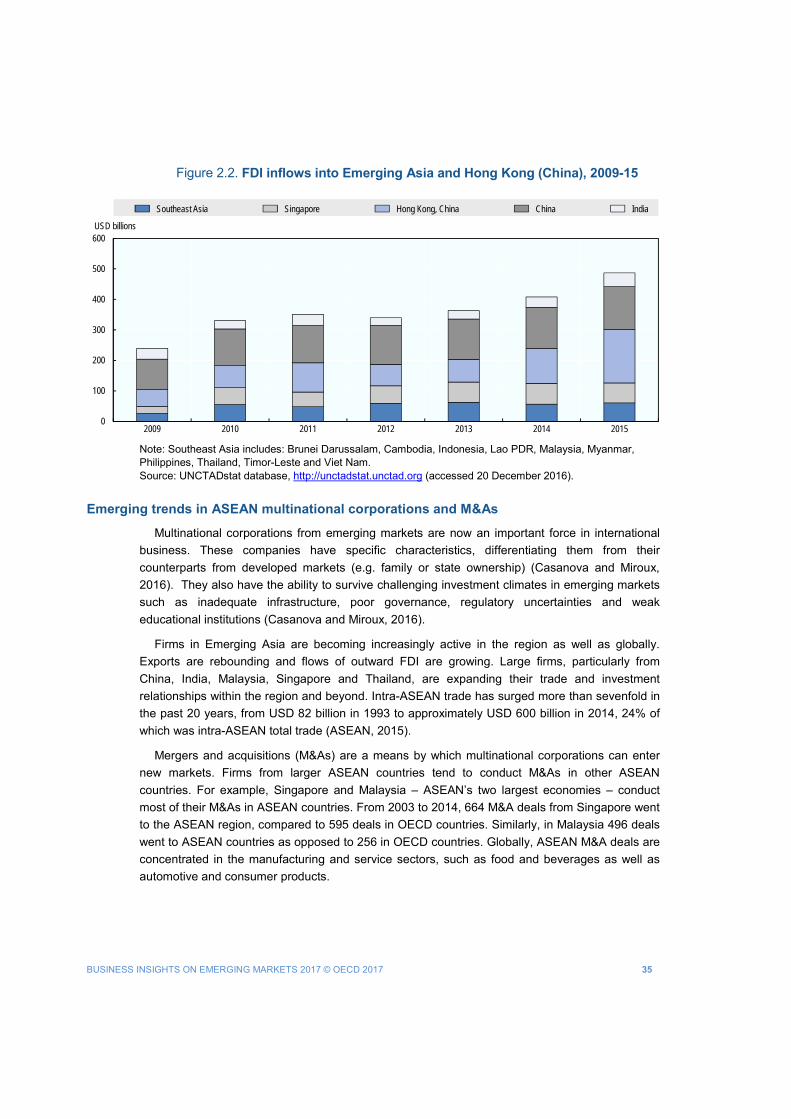
According to data from UNCTADstat (UNCTAD, 2015), Emerging Asia accounted for 17% of global FDI inflows in 2015 with USD 305.5 billion in investment, a 6.1% increase from the previous year of FDI into the region.3 China, India and Singapore dominate FDI in Emerging Asia. East Asia received the bulk of the FDI boost due to equity investment in Hong Kong (China), making Hong Kong the largest host economy of FDI inflows to East Asia and the second-largest in the world.
FDI into Southeast Asia4 grew slightly in 2015 to USD 126 billion, up from USD 125 billion in 2014. Southeast Asian FDI growth was impacted by decreased inflows to Singapore and Indonesia, due mainly to declines in greenfield investments by multinational enterprises and to short-term economic uncertainty. Singapore’s FDI inflows decreased by 5% to USD 65 billion, while Indonesia’s FDI inflows fell by 29% to USD 16 billion. The smaller ASEAN economies fared better. FDI to Myanmar increased by 200%, bringing FDI inflows to USD 3 billion, while inflows to Thailand tripled, reaching USD 11 billion (UNCTAD, 2016).
0
2
4
6
8
10
12
14
16
18
20
Malaysia Singapore Thailand Philippines Indonesia
% GDP
Agriculture Products and Prepared Foodstuffs Mineral Products ChemicalsPlastic, Rubber and other Articles Textiles and Textile Articles Base Metals and ArticlesMachinery and Electrical Equipment Others
BUSINESS INSIGHTS ON EMERGING MARKETS 2017 © OECD 2017 35
Figure 2.2. FDI inflows into Emerging Asia and Hong Kong (China), 2009-15
Note: Southeast Asia includes: Brunei Darussalam, Cambodia, Indonesia, Lao PDR, Malaysia, Myanmar, Philippines, Thailand, Timor-Leste and Viet Nam. Source: UNCTADstat database, http://unctadstat.unctad.org (accessed 20 December 2016).
Emerging trends in ASEAN multinational corporations and M&As
Multinational corporations from emerging markets are now an important force in international business. These companies have specific characteristics, differentiating them from their counterparts from developed markets (e.g. family or state ownership) (Casanova and Miroux, 2016). They also have the ability to survive challenging investment climates in emerging markets such as inadequate infrastructure, poor governance, regulatory uncertainties and weak educational institutions (Casanova and Miroux, 2016).
Firms in Emerging Asia are becoming increasingly active in the region as well as globally. Exports are rebounding and flows of outward FDI are growing. Large firms, particularly from China, India, Malaysia, Singapore and Thailand, are expanding their trade and investment relationships within the region and beyond. Intra-ASEAN trade has surged more than sevenfold in the past 20 years, from USD 82 billion in 1993 to approximately USD 600 billion in 2014, 24% of which was intra-ASEAN total trade (ASEAN, 2015).
Mergers and acquisitions (M&As) are a means by which multinational corporations can enter new markets. Firms from larger ASEAN countries tend to conduct M&As in other ASEAN countries. For example, Singapore and Malaysia – ASEAN’s two largest economies – conduct most of their M&As in ASEAN countries. From 2003 to 2014, 664 M&A deals from Singapore went to the ASEAN region, compared to 595 deals in OECD countries. Similarly, in Malaysia 496 deals went to ASEAN countries as opposed to 256 in OECD countries. Globally, ASEAN M&A deals are concentrated in the manufacturing and service sectors, such as food and beverages as well as automotive and consumer products.
0
100
200
300
400
500
600
2009 2010 2011 2012 2013 2014 2015
USD billions
Southeast Asia Singapore Hong Kong, China China India
36 BUSINESS INSIGHTS ON EMERGING MARKETS 2017 © OECD 2017
In a period of global economic uncertainty, strengthening regional ties and boosting regional trade can be tools to promote economic growth and private investment. The following section will discuss recent ASEAN Economic Community (AEC) developments as well as new trade agreements under discussion.
REGIONAL INTEGRATION INITIATIVES IN ASIA Given the size of the market, strengthening regional ties can further promote growth, generate
new business opportunities and bolster investor confidence. In 2013, Emerging Asia accounted for 70% of the world’s population and 26% of global GDP (ASEAN, 2014). The ASEAN region alone accounted for 11% of total global FDI inflows in 2014, compared with only 5% in 2007 (ASEAN, 2015). Furthermore, the ASEAN region is projected to average a 4.9% growth rate in 2017 (OECD, 2017). According to the Asian Development Bank (ADB), this growth rate may increase to 7% by 2025 and create 14 million additional jobs, driven by trade and investment facilitated by a single economic community (Groff, 2016).
Various initiatives to strengthen regional integration are in progress, such as the ASEAN Economic Community (AEC), the Trans-Pacific Partnership (TPP), the Regional Comprehensive Economic Partnership (RCEP), Asia-Pacific Economic Cooperation (APEC) and Chinese-led initiatives, such as the Asian Infrastructure Investment Bank (AIIB) and the One Belt, One Road (OBOR) Initiative. These initiatives can generate new trade and investment opportunities by forming common markets, reducing tariff and non-tariff barriers and improving regional infrastructure.
Regional trade agreements are, however, still evolving; negotiations for the RCEP are ongoing and the TPP is awaiting signatory ratification. It is therefore unclear how the agreements ultimately will affect regional trade and investment dynamics. Regardless of outcome, it is evident that the increasing network of regional trade agreements, often referred to as the “spaghetti bowl” – or the “noodle bowl” when referring to Asian trade agreements (Figure 2.3) – can bring about complexities for consolidation.
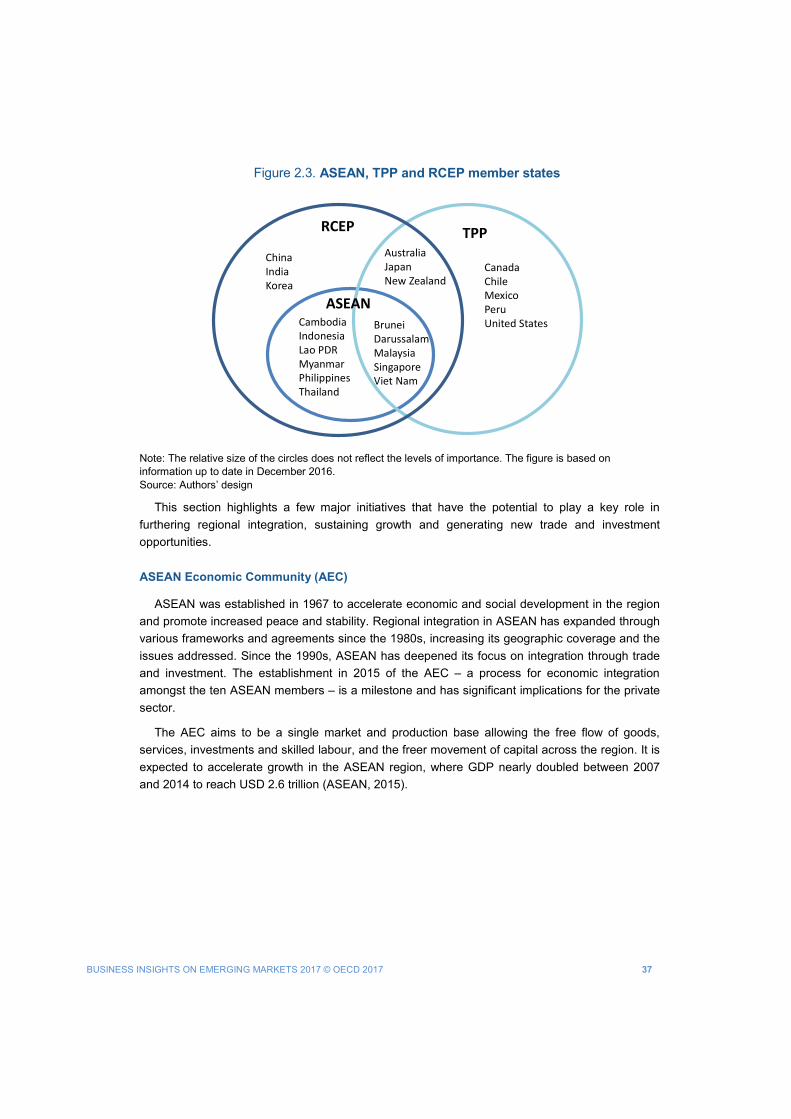
BUSINESS INSIGHTS ON EMERGING MARKETS 2017 © OECD 2017 37
Figure 2.3. ASEAN, TPP and RCEP member states
Note: The relative size of the circles does not reflect the levels of importance. The figure is based on information up to date in December 2016. Source: Authors’ design
This section highlights a few major initiatives that have the potential to play a key role in furthering regional integration, sustaining growth and generating new trade and investment opportunities.
ASEAN Economic Community (AEC)
ASEAN was established in 1967 to accelerate economic and social development in the region and promote increased peace and stability. Regional integration in ASEAN has expanded through various frameworks and agreements since the 1980s, increasing its geographic coverage and the issues addressed. Since the 1990s, ASEAN has deepened its focus on integration through trade and investment. The establishment in 2015 of the AEC – a process for economic integration amongst the ten ASEAN members – is a milestone and has significant implications for the private sector.
The AEC aims to be a single market and production base allowing the free flow of goods, services, investments and skilled labour, and the freer movement of capital across the region. It is expected to accelerate growth in the ASEAN region, where GDP nearly doubled between 2007 and 2014 to reach USD 2.6 trillion (ASEAN, 2015).
RCEP
ChinaIndiaKorea
CambodiaIndonesiaLao PDRMyanmarPhilippinesThailand
Brunei DarussalamMalaysiaSingaporeViet Nam
ASEAN
AustraliaJapanNew Zealand
TPP
CanadaChile MexicoPeru United States
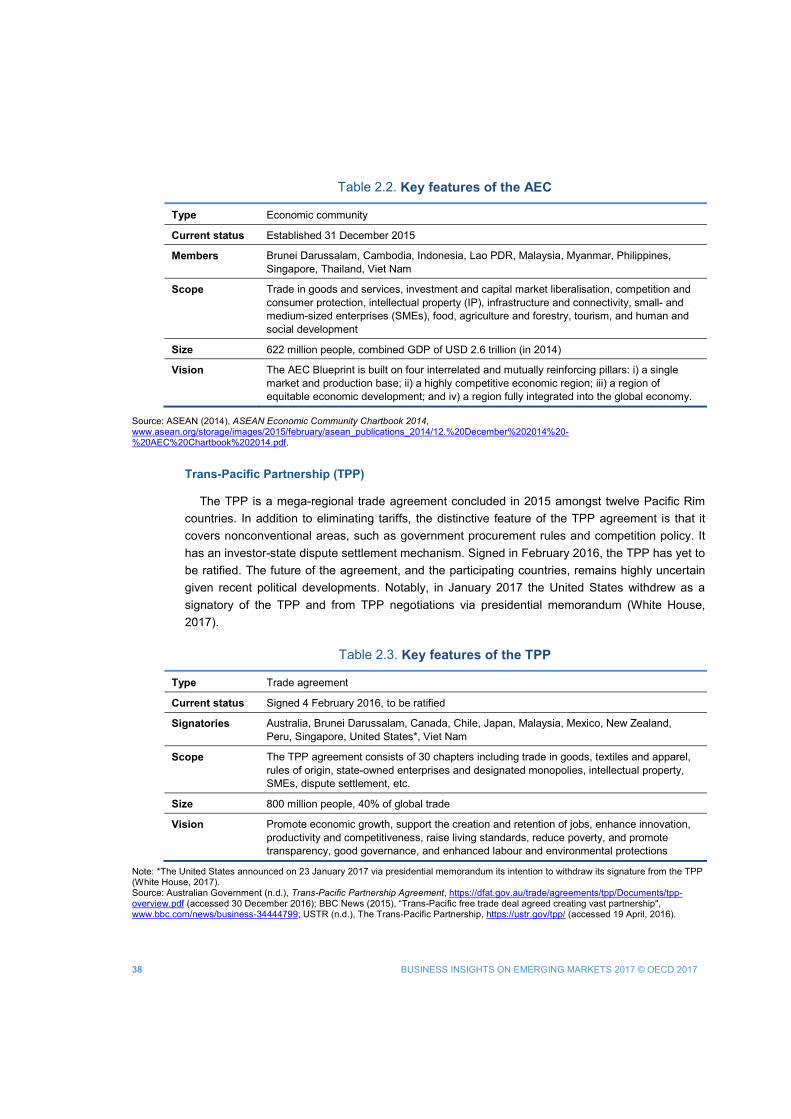
38 BUSINESS INSIGHTS ON EMERGING MARKETS 2017 © OECD 2017
Table 2.2. Key features of the AEC
Type Economic community
Current status Established 31 December 2015
Members Brunei Darussalam, Cambodia, Indonesia, Lao PDR, Malaysia, Myanmar, Philippines, Singapore, Thailand, Viet Nam
Scope Trade in goods and services, investment and capital market liberalisation, competition and consumer protection, intellectual property (IP), infrastructure and connectivity, small- and medium-sized enterprises (SMEs), food, agriculture and forestry, tourism, and human and social development
Size 622 million people, combined GDP of USD 2.6 trillion (in 2014)
Vision The AEC Blueprint is built on four interrelated and mutually reinforcing pillars: i) a single market and production base; ii) a highly competitive economic region; iii) a region of equitable economic development; and iv) a region fully integrated into the global economy.
Source: ASEAN (2014), ASEAN Economic Community Chartbook 2014, www.asean.org/storage/images/2015/february/asean_publications_2014/12.%20December%202014%20-%20AEC%20Chartbook%202014.pdf.
Trans-Pacific Partnership (TPP)
The TPP is a mega-regional trade agreement concluded in 2015 amongst twelve Pacific Rim countries. In addition to eliminating tariffs, the distinctive feature of the TPP agreement is that it covers nonconventional areas, such as government procurement rules and competition policy. It has an investor-state dispute settlement mechanism. Signed in February 2016, the TPP has yet to be ratified. The future of the agreement, and the participating countries, remains highly uncertain given recent political developments. Notably, in January 2017 the United States withdrew as a signatory of the TPP and from TPP negotiations via presidential memorandum (White House, 2017).
Table 2.3. Key features of the TPP
Type Trade agreement
Current status Signed 4 February 2016, to be ratified
Signatories Australia, Brunei Darussalam, Canada, Chile, Japan, Malaysia, Mexico, New Zealand, Peru, Singapore, United States*, Viet Nam
Scope The TPP agreement consists of 30 chapters including trade in goods, textiles and apparel, rules of origin, state-owned enterprises and designated monopolies, intellectual property, SMEs, dispute settlement, etc.
Size 800 million people, 40% of global trade
Vision Promote economic growth, support the creation and retention of jobs, enhance innovation, productivity and competitiveness, raise living standards, reduce poverty, and promote transparency, good governance, and enhanced labour and environmental protections
Note: *The United States announced on 23 January 2017 via presidential memorandum its intention to withdraw its signature from the TPP (White House, 2017). Source: Australian Government (n.d.), Trans-Pacific Partnership Agreement, https://dfat.gov.au/trade/agreements/tpp/Documents/tpp-overview.pdf (accessed 30 December 2016); BBC News (2015), “Trans-Pacific free trade deal agreed creating vast partnership", www.bbc.com/news/business-34444799; USTR (n.d.), The Trans-Pacific Partnership, https://ustr.gov/tpp/ (accessed 19 April, 2016).
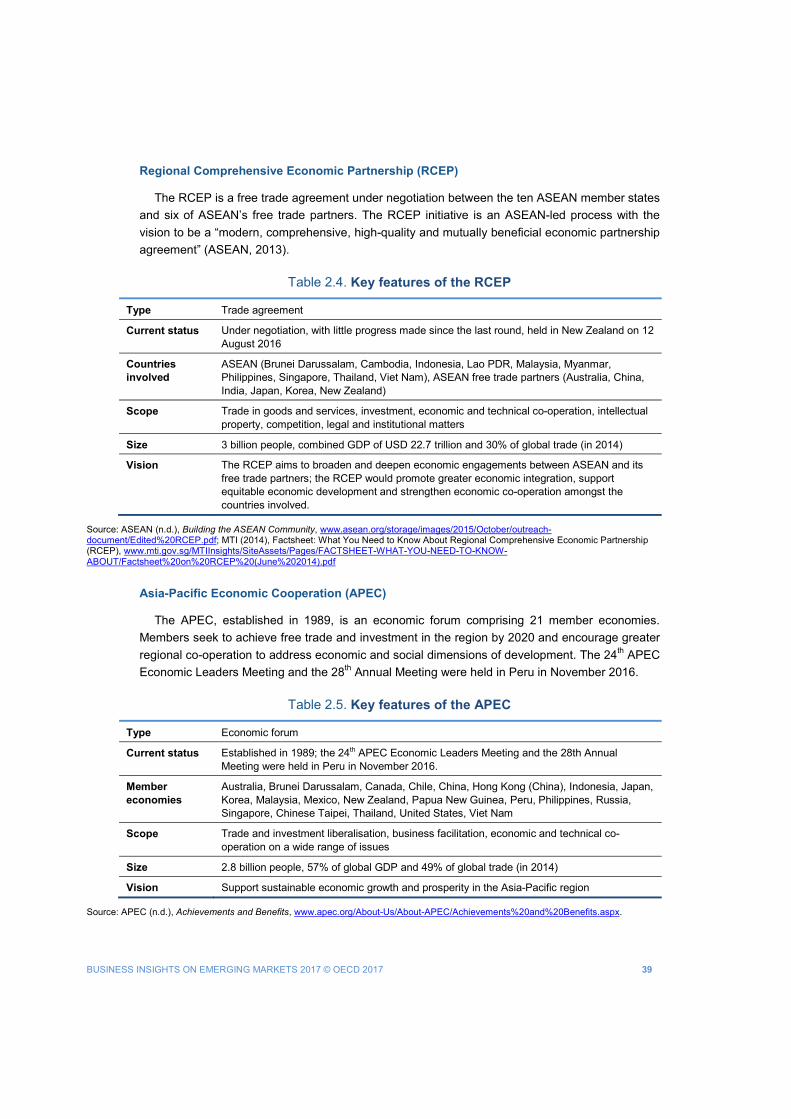
BUSINESS INSIGHTS ON EMERGING MARKETS 2017 © OECD 2017 39
Regional Comprehensive Economic Partnership (RCEP)
The RCEP is a free trade agreement under negotiation between the ten ASEAN member states and six of ASEAN’s free trade partners. The RCEP initiative is an ASEAN-led process with the vision to be a “modern, comprehensive, high-quality and mutually beneficial economic partnership agreement” (ASEAN, 2013).
Table 2.4. Key features of the RCEP
Type Trade agreement
Current status Under negotiation, with little progress made since the last round, held in New Zealand on 12 August 2016
Countries involved
ASEAN (Brunei Darussalam, Cambodia, Indonesia, Lao PDR, Malaysia, Myanmar, Philippines, Singapore, Thailand, Viet Nam), ASEAN free trade partners (Australia, China, India, Japan, Korea, New Zealand)
Scope Trade in goods and services, investment, economic and technical co-operation, intellectual property, competition, legal and institutional matters
Size 3 billion people, combined GDP of USD 22.7 trillion and 30% of global trade (in 2014)
Vision The RCEP aims to broaden and deepen economic engagements between ASEAN and its free trade partners; the RCEP would promote greater economic integration, support equitable economic development and strengthen economic co-operation amongst the countries involved.
Source: ASEAN (n.d.), Building the ASEAN Community, www.asean.org/storage/images/2015/October/outreach-document/Edited%20RCEP.pdf; MTI (2014), Factsheet: What You Need to Know About Regional Comprehensive Economic Partnership (RCEP), www.mti.gov.sg/MTIInsights/SiteAssets/Pages/FACTSHEET-WHAT-YOU-NEED-TO-KNOW-ABOUT/Factsheet%20on%20RCEP%20(June%202014).pdf
Asia-Pacific Economic Cooperation (APEC)
The APEC, established in 1989, is an economic forum comprising 21 member economies. Members seek to achieve free trade and investment in the region by 2020 and encourage greater regional co-operation to address economic and social dimensions of development. The 24th APEC Economic Leaders Meeting and the 28th Annual Meeting were held in Peru in November 2016.
Table 2.5. Key features of the APEC
Type Economic forum
Current status Established in 1989; the 24th APEC Economic Leaders Meeting and the 28th Annual Meeting were held in Peru in November 2016.
Member economies
Australia, Brunei Darussalam, Canada, Chile, China, Hong Kong (China), Indonesia, Japan, Korea, Malaysia, Mexico, New Zealand, Papua New Guinea, Peru, Philippines, Russia, Singapore, Chinese Taipei, Thailand, United States, Viet Nam
Scope Trade and investment liberalisation, business facilitation, economic and technical co-operation on a wide range of issues
Size 2.8 billion people, 57% of global GDP and 49% of global trade (in 2014)
Vision Support sustainable economic growth and prosperity in the Asia-Pacific region
Source: APEC (n.d.), Achievements and Benefits, www.apec.org/About-Us/About-APEC/Achievements%20and%20Benefits.aspx.
40 BUSINESS INSIGHTS ON EMERGING MARKETS 2017 © OECD 2017
Chinese-led regional integration initiatives
In recent years China has played a strong role in promoting regional integration in Emerging Asia. Two of the most prominent Chinese-led efforts include the Asian Infrastructure Investment Bank (AIIB) and the One Belt, One Road (OBOR) Initiative, both focusing on the importance of infrastructure as a facilitator of regional integration.
The Asian Infrastructure Investment Bank (AIIB)
The AIIB is a China-led multilateral development institution that opened for business in January 2016 with USD 100 billion in capital (AIIB, 2015). In co-operation with existing multilateral development banks and 57 member countries, the AIIB seeks to contribute to Asian infrastructure development and regional connectivity (AIIB, 2016a). The bank already is financing infrastructure projects in Indonesia, Tajikistan, Bangladesh and Pakistan (AIIB, 2016b).
The One Belt, One Road (OBOR) Initiative
China also has led other infrastructure development initiatives in the region, including OBOR, an economic development initiative with the goal of establishing greater connectivity between Asia, Europe and Africa. OBOR is supported in a number of ways, including by the Silk Road Fund, which is designed to promote the common development and prosperity of China and other countries and regions involved in the OBOR initiative. The fund was established in 2014 with investment from China’s State Administration of Foreign Exchange, the China Investment Corporation, the Export-Import Bank of China and the China Development Bank. With an initial capital investment of USD 10 billion, the fund has grown to USD 40 billion and is dedicated to the development of China and the other countries and regions involved in the OBOR initiative. The USD 1.65 billion Karot Hydropower Project in Pakistan was chosen as the first Silk Road Fund investment project (Smith, 2015).
The China-Pakistan Economic Corridor (CPEC) and the Bangladesh-China-India-Myanmar (BCIM) Economic Corridor also are closely related to the OBOR initiative. The CPEC is a collection of ongoing projects with Chinese investment to expand and enhance Pakistan’s infrastructure, involving a variety of sectors including energy, roads and railways. China will provide about USD 46 billion of investment in Pakistan through the CPEC as per a bilateral agreement between the two countries (Government of Pakistan, 2016). Likewise, the BCIM Economic Corridor plans to build infrastructure, such as industrial zones, ports and roadways, to improve connectivity and facilitate trade in the region that stretches from China to Bangladesh, Myanmar and India (Deshmukh, 2015).
The AEC, TPP, RCEP, APEC and the Chinese-led initiatives, such as the AIIB and OBOR, are regional-integration advancements in Emerging Asia. While these initiatives have the potential to generate new trade and investment opportunities, reduce tariff and non-tariff barriers and improve regional infrastructure, care must be taken in the negotiations and implementation of these initiatives as the potentially divergent objectives of member countries could hinder ASEAN solidarity (Hamanaka, 2014). While increased regional integration is one of the best strategic responses to a changing global environment – by insulating the region from the global risks of a sluggish external environment, lower commodity prices and financial fragility – adequate policies
BUSINESS INSIGHTS ON EMERGING MARKETS 2017 © OECD 2017 41
and regulations must first be in place to reap the benefits of regional integration. The next section will address the importance of public policy in facilitating regional integration and generating an environment conducive to business, investment and trade.
PUBLIC POLICY TO PROMOTE BUSINESS THROUGH REGIONAL INTEGRATION
Governments and multilateral institutions play a key role in strengthening regional integration and driving economic growth. This section outlines a series of policy reforms led by governments and regional institutions to support investment and trade, including in the areas of financial markets, infrastructure development and renewable energy.
Financial-market reforms
Financial-market reform can be strengthened to promote regional integration. For example, ASEAN has established a number of policies to develop financial markets within the region. At the same time, China also is implementing a number of economic reforms. While not a member of ASEAN, given the size of China’s economy, improvements in Chinese financial markets will have important spillover effects for the surrounding region in areas such as trade and investment flows.
Developing the financial market through ASEAN-led initiatives
Two major financial initiatives are underway to develop financial markets in the ASEAN region: the ASEAN Infrastructure Fund (AIF) and the Asian Bond Markets Initiative (ABMI). The AIF was established by the ADB and ASEAN countries to address the region’s infrastructure investment needs. The objective of the AIF is to finance projects that promote infrastructure development by mobilising regional savings, including foreign exchange reserves. All AIF-financed projects also are co-financed by the ADB. The ADB and ASEAN countries provided an initial equity of USD 485 million for the fund (ADB, 2016a). The AIF plans to provide a stream of USD 300 million in loans per year for regional infrastructure projects (APEC, 2015). By 2016, the AIF had financed seven projects in the amount of USD 300 million in Indonesia, Lao PDR, Myanmar and Viet Nam in the power, energy, water supply and sanitation, and transport sectors (ADB, 2016a).
The ABMI involves ASEAN+3 (ASEAN member states plus China, Japan, Korea) and aims to set up infrastructure and systems to promote greater market integration and capital flows. Key initiatives include establishing credit guarantee mechanisms, disseminating key information on national and regional bond markets and policies, facilitating demand for local currency denominated bonds and improving the regulatory framework for the bond market. The ABMI has supported investment in local currency denominated bonds, which can facilitate cross-border investment. In fact, issuance of local currency denominated bonds is growing faster than GDP in many of the economies participating in the ABMI (OECD, 2016b). Yet as Figure 2.4 depicts, bond markets are still underdeveloped, with the size of the region’s bond market as a share of GDP averaging 65.4% in the first quarter of 2016, compared to Japan’s at 221.4% (ADB, 2016c). In addition, growth in this market is dominated by government bonds, which accounted for 61.7% of the region’s stock in March 2016 (ADB, 2016c).5 Further work is needed to improve regulatory restrictions and a weak financial infrastructure, which prevent bonds from becoming a viable
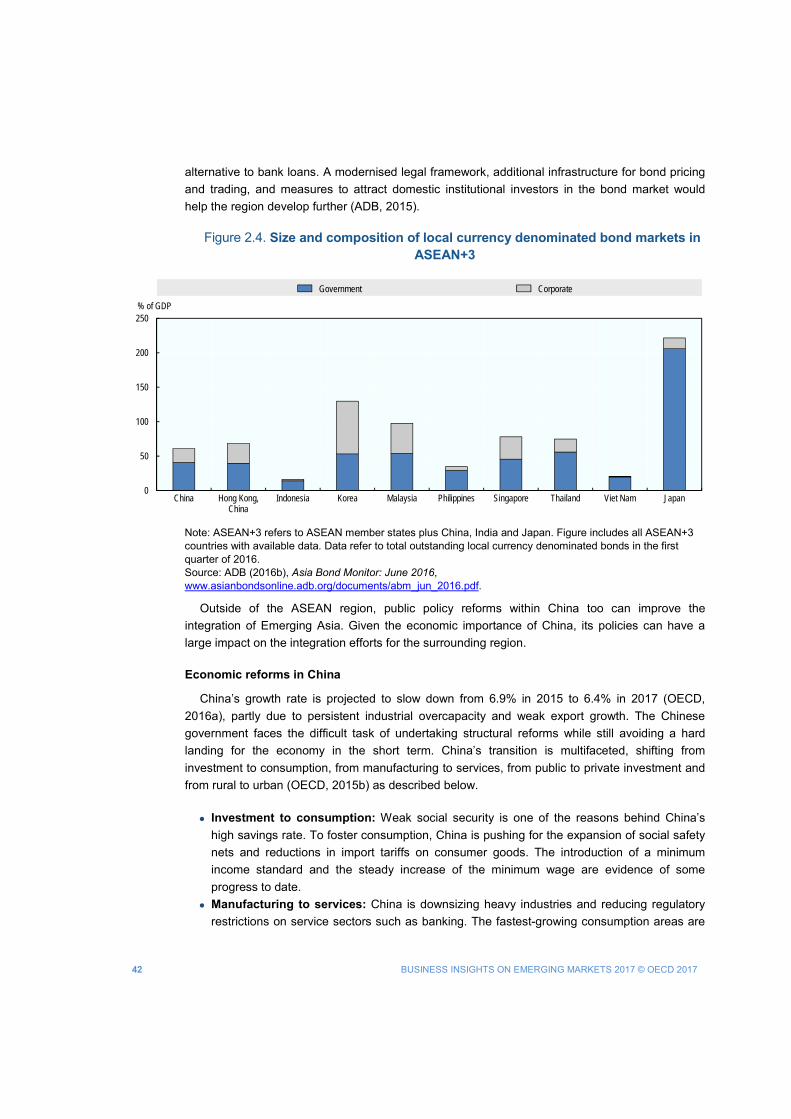
42 BUSINESS INSIGHTS ON EMERGING MARKETS 2017 © OECD 2017
alternative to bank loans. A modernised legal framework, additional infrastructure for bond pricing and trading, and measures to attract domestic institutional investors in the bond market would help the region develop further (ADB, 2015).
Figure 2.4. Size and composition of local currency denominated bond markets in ASEAN+3
Note: ASEAN+3 refers to ASEAN member states plus China, India and Japan. Figure includes all ASEAN+3 countries with available data. Data refer to total outstanding local currency denominated bonds in the first quarter of 2016. Source: ADB (2016b), Asia Bond Monitor: June 2016, www.asianbondsonline.adb.org/documents/abm_jun_2016.pdf.
Outside of the ASEAN region, public policy reforms within China too can improve the integration of Emerging Asia. Given the economic importance of China, its policies can have a large impact on the integration efforts for the surrounding region.
Economic reforms in China
China’s growth rate is projected to slow down from 6.9% in 2015 to 6.4% in 2017 (OECD, 2016a), partly due to persistent industrial overcapacity and weak export growth. The Chinese government faces the difficult task of undertaking structural reforms while still avoiding a hard landing for the economy in the short term. China’s transition is multifaceted, shifting from investment to consumption, from manufacturing to services, from public to private investment and from rural to urban (OECD, 2015b) as described below.
• Investment to consumption: Weak social security is one of the reasons behind China’s
high savings rate. To foster consumption, China is pushing for the expansion of social safety nets and reductions in import tariffs on consumer goods. The introduction of a minimum income standard and the steady increase of the minimum wage are evidence of some progress to date.
• Manufacturing to services: China is downsizing heavy industries and reducing regulatory restrictions on service sectors such as banking. The fastest-growing consumption areas are
0
50
100
150
200
250
China Hong Kong,China
Indonesia Korea Malaysia Philippines Singapore Thailand Viet Nam Japan
% of GDP
Government Corporate
BUSINESS INSIGHTS ON EMERGING MARKETS 2017 © OECD 2017 43
related to education, healthcare and tourism. Further reforms would be needed to improve access to sectors where foreign investment is restricted, for instance in sectors such as energy, banking and telecommunications, where barriers to private and foreign investment had previously been high (OECD, 2015b).
• Public to private investment: China is restructuring state-owned enterprises (SOEs) as part of its efforts to shift the focus from public to private investment. To prevent SOE restructuring from affecting consumption, the government has limited reforms to the coal and steel sectors, which will be implemented over a time span of five years. The government also is offering fiscal support to mitigate the aftershocks of SOE reform, such as assistance for unemployment and help to companies that cut non-performing assets (Bloomberg, 2016).
• Rural to urban: Chinese society is making a transition from rural to urban. The government is granting residence permits to 13 million previously rural Chinese unregistered residents (Reuters, 2015). Further reforms will be required, such as the introduction of residence permits for migrant workers in the largest cities and improvement in rural education.
China has made great strides in implementing economic reforms. However, a number of policies still can be put into place to facilitate greater access to Chinese financial markets. Economic and financial reforms both in the ASEAN region and in China are crucial to ensuring an environment conducive to business. Financial initiatives such as the AIF and ABMI can promote regional integration and generate a favourable business environment. While economic reforms are a crucial element in regional integration, other elements such as infrastructure also must be addressed.
Promoting infrastructure investment
Infrastructure investment is an important element of regional integration efforts as it facilitates greater connectivity and market access. Policies to promote infrastructure investment include enhancing production networks and logistics and strengthening public-private partnerships (PPPs) for infrastructure projects.
ASEAN countries are in varying stages of development in terms of logistics and economic infrastructure (ERIA, 2010). The Economic Research Institute for ASEAN and East Asia (ERIA) categorises countries into three different groups depending on their degree of participation in production networks: those not likely to join in the near future, those intending to participate and those already in production networks. Not one East Asia country falls into the first category; rather regions of countries, such as the mountainous areas of Mekong, the islands of eastern Indonesia and the Southern Philippines, are amongst those falling into this tier. Cambodia, Lao PDR and Myanmar (CLM) fall into the second category. Indonesia, the Philippines, Viet Nam, Singapore, Thailand and Malaysia are in the third category.
Development strategies vary depending on a nation’s level of development. The CLM countries are aiming to integrate into production networks through simple industries, such as textiles, garments, electronic parts or equipment manufacturing. Countries that are already integrated into global value chains (GVCs) are focused on stepping up from middle-income to developed economies. The strategy of Indonesia, the Philippines and Viet Nam is to form industrial agglomerations and further develop through technological innovation. Meanwhile, the strategy of
44 BUSINESS INSIGHTS ON EMERGING MARKETS 2017 © OECD 2017
Singapore, Thailand and Malaysia is to create innovation hubs and focus on attracting skilled labour.
The high cost of logistics remains a common challenge in the region, regardless of the country’s stage of development. According to the World Bank’s Logistics Performance Index (LPI) – an indicator of the efficiency of global supply chains coded from 1 (worst) to 5 (best) – the average LPI score of ASEAN countries in 2016 was 2.99, while the highest scoring country was Germany at 4.23 and the lowest was Syria at 1.6 (World Bank, 2016c). This shows that ASEAN countries have room to improve. In fact, logistics represent more than 15% of total supply chain cost in Thailand, 14% in Malaysia and 13% in Indonesia (Coia, 2013). Better infrastructure and regulations can lower logistics costs. A good example is the Philippines, where restrictions that prevented foreign shipping companies from serving domestic routes were abolished in 2015 to remove competition constraints and promote greater efficiency (OECD, 2016d).
Strengthening PPPs for infrastructure
Governments are making efforts to strengthen PPPs for infrastructure development. The Philippines, Indonesia and India have attempted various reforms to encourage PPPs (OECD, 2016b). Key advantages of a PPP for infrastructure projects include the incorporation of private sector expertise in the design and operation of a project, and the ability to provide the service in a more efficient manner (OECD, 2012). The private sector, however, can still face difficulties in raising large amounts of project finance.
One solution to this problem is viability gap funding (VGF), whereby the government supports infrastructure projects that are economically justified but fall short of financial viability. For instance, long payback periods or user charges that fall below commercial levels can affect the financial viability of a project. Through VGF, the government contributes capital as a shareholder to show long-term commitment and reduce the total project cost. Indonesia and India are amongst the countries that use VGF; and the Indian government, for instance, approved VGF for solar power projects in early 2016 (Business Standard, 2016).
Another way in which governments can facilitate PPPs is to guarantee infrastructure projects against potential losses. In 2009, for example, the Indonesian Infrastructure Guarantee Fund (IIGF) was established to provide government guarantees to leverage private infrastructure financing. This fund of USD 1.5 billion in capital aims to enhance the bankability of PPP projects for a broader base of investors (Roesly, 2013). Meanwhile, multilateral organisations such as the ADB provide guarantees to support infrastructure projects, financial institutions, capital market investors and trade financiers, covering both credit and political risks (ADB, 2016c).
Infrastructure investment is an essential element of enhanced regional integration. By investing in infrastructure, connectivity can be increased at the regional scale, providing an environment more favourable to business. Renewable energy is one specific infrastructure area that can help to green the energy mix and can benefit from increased regional integration.
BUSINESS INSIGHTS ON EMERGING MARKETS 2017 © OECD 2017 45
Public policy supporting investments in renewable energy
Renewable sources make up a considerable portion of the energy mix in Emerging Asia and renewable energy capacity is expected to increase. More than 24% of China’s power capacity was generated by renewable sources in 2015 compared to almost 16% in the Asia and Pacific region (excluding China) (IEA, 2016). China is the largest renewable energy market in the world. According to the International Energy Agency (IEA), total renewable energy capacity6 is expected to increase by roughly 60% in China with 305 gigawatts (GW) added from 2015-21. India’s current capacity will double to reach 160 GW over the same period (OECD/IEA, 2016).
Public policies and international co-operation play a key role in supporting growth in renewable energy by providing targeted support as well as reducing support for fossil-fuel energy sources. Prior to the 21st United Nations Conference of the Parties (COP21) and the Paris Agreement on climate change, governments played a key role in giving incentives to the private sector to foster greater investments in renewables and accelerate the phasing out of high-carbon energy sources.
The commitments by China to install 200 GW of wind power and 100 GW of solar photovoltaic (PV) power by 2020 and by India for 100 GW of solar PV power by 2022 are examples of government support for renewables (IEA, 2015). In the case of India, ambitious commitments in 2015 represent a fivefold increase from the target set in 2010 to reach 20 GW of installed solar energy by 2020. At COP21, India and France also launched an International Solar Alliance of 120 countries with the goal of investing in one terawatt of additional solar power capacity by 2030 (UNFCCC, 2015).
Governments are taking action to reduce subsidies for fossil fuels. Due in part to market fluctuations and lower oil prices, countries like India, Malaysia and Indonesia have embarked on programmes to reform fossil-fuel subsidies (IEA, 2015). India, for instance, abolished diesel subsidies in October 2014 after having implemented gasoline reforms in 2010 (IEA, 2015). Malaysia increased electricity tariffs by an average of 15% in January 2014 and eliminated gasoline and diesel subsidies in May 2014 (IEA, 2015). Indonesia stopped subsidies to gasoline and capped the diesel subsidy in January 2015 (IEA, 2015). Efforts to reduce fossil-fuel subsidies help to level the playing field for renewable energy producers.
Finally, enhanced regional co-operation in generation and distribution can further facilitate the expansion of renewable energy. ASEAN, for example, has made energy a key area for co-operation. The ASEAN Plan of Action for Energy Cooperation (APAEC) includes initiatives such as the ASEAN Power Grid and projects like the Trans-ASEAN Gas Pipeline. In the area of renewable energy, the “aspirational target” is to increase the share of renewables in the energy mix to 23% by 2015 (Zamora et al., 2015). Hydropower projects on the Mekong River are another area where enhanced regional ties can support future generation of renewable energy that can be exported throughout the region (OECD, 2016b).
By undertaking policy reforms in financial markets, infrastructure investment and energy markets, governments can enhance regional integration, which will produce an environment conducive to business. While regional integration efforts and policies are still shifting and evolving, this is an opportune moment to incorporate the views of the private sector into the development of regional integration initiatives. Accordingly, the next section provides private sector insights regarding increased regional integration in Asia.
46 BUSINESS INSIGHTS ON EMERGING MARKETS 2017 © OECD 2017
PRIVATE SECTOR INSIGHTS ON EXPANDING BUSINESS THROUGH REGIONAL INTEGRATION
This section includes insights on regional integration in Asia drawn from the EMnet Asia meeting held in Paris at the OECD headquarters on 8 March 2016. It provides an overview of policy areas mentioned by the private sector as key for improving the region’s investment climate, such as logistics and GVCs, infrastructure, the labour market and talent retention, finance, energy, innovation and SMEs. The private sector is particularly focused on the implications of China’s slowdown and the business opportunities generated by higher regional integration.
Sectoral views on regional integration
Logistics and GVCs: ASEAN firms should capture higher parts of global value chains by owning brand names and technology
Participants stressed the importance for Asian companies to get a higher part of the value chain through proprietary brand names and technologies. The participation of Southeast Asian and East Asian economies in GVCs increased from 43% in 2001 to 49% in 2011 (OECD and World Bank, 2015). However, ASEAN companies participate primarily in GVCs by contributing small components that generate employment but are limited to a marginal portion of the overall value chain. For instance, approximately 59% of the value of the iPhone has been captured by the United States, while the rest of the value is dispersed amongst Korea, China and the rest of the world (Kraemer, Linden and Dedrick, 2011). To get a higher part of the value chain, it is essential to own the brand name and technology, which can be acquired through technology transfer or M&As. A prime example is the Tata Group, which owns 70 brands in sectors such as automotive, financial, food and beverage, hotels and realty, products, retail, and services. Since 2000, the Tata Group has diversified its business and brand portfolio through approximately 80 M&As. Participants proposed that a group of “ASEAN multinationals” that hold their own brand names and can produce higher value goods and services should be nurtured in Asia to move higher up in the value chain.
Infrastructure: Financially viable projects are crucial to channelling capital into infrastructure investments
Infrastructure financing can channel the region’s available funds to viable and sustainable projects. The region has abundant capital in the form of foreign exchange reserves and savings. In the ASEAN region, foreign exchange reserves totalled approximately USD 700 billion in 2016 (IMF, 2016), and the average savings rate was 33% of GDP in 2014 (World Bank, 2016c). The key is to set up a framework for investors to make a proper risk assessment and distribute funds to infrastructure projects that are the most viable and sustainable. To improve the framework for private investment in infrastructure, special funds have been established in the Philippines to facilitate the preparation and financing of PPPs as a mechanism for risk sharing; these include the Strategic Support Fund, the Project Development and Monitoring Facility, and the Philippine Infrastructure Development Fund (OECD, 2016d). Meanwhile, Mahindra World City in Chennai, India has become the blueprint of the Smart Cities Mission, India’s plan to develop 100 smart
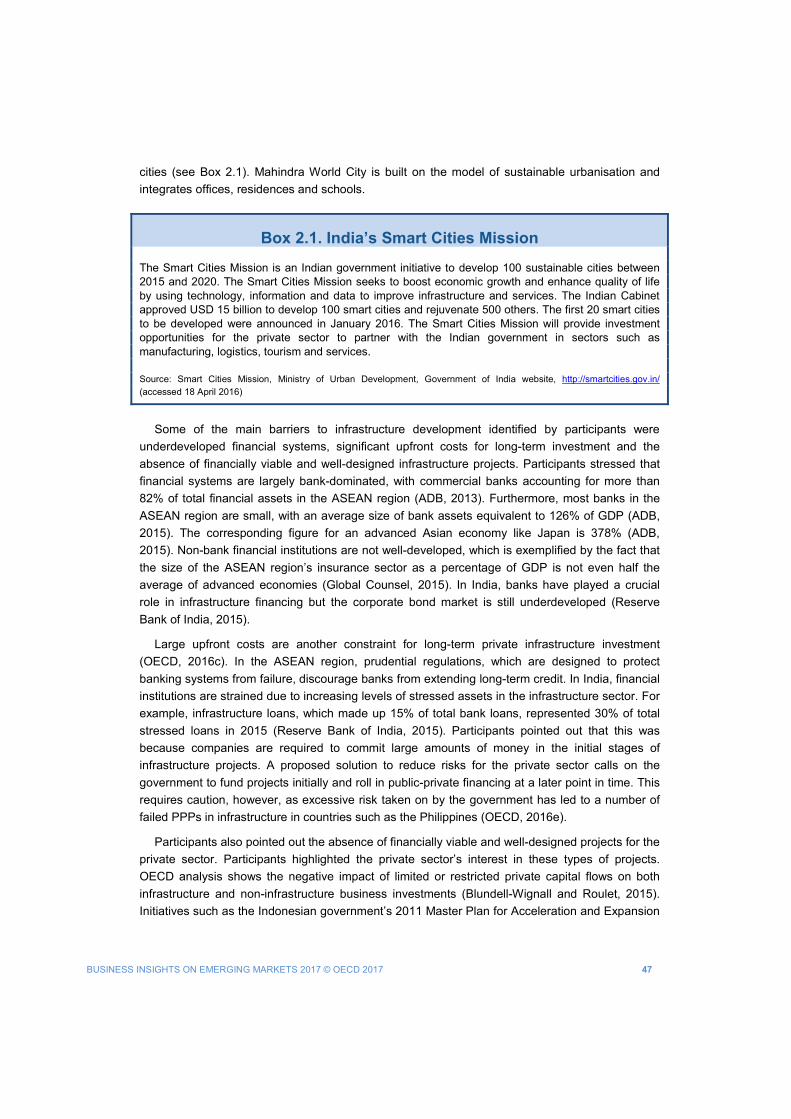
BUSINESS INSIGHTS ON EMERGING MARKETS 2017 © OECD 2017 47
cities (see Box 2.1). Mahindra World City is built on the model of sustainable urbanisation and integrates offices, residences and schools.
Box 2.1. India’s Smart Cities Mission
The Smart Cities Mission is an Indian government initiative to develop 100 sustainable cities between 2015 and 2020. The Smart Cities Mission seeks to boost economic growth and enhance quality of life by using technology, information and data to improve infrastructure and services. The Indian Cabinet approved USD 15 billion to develop 100 smart cities and rejuvenate 500 others. The first 20 smart cities to be developed were announced in January 2016. The Smart Cities Mission will provide investment opportunities for the private sector to partner with the Indian government in sectors such as manufacturing, logistics, tourism and services. Source: Smart Cities Mission, Ministry of Urban Development, Government of India website, http://smartcities.gov.in/ (accessed 18 April 2016)
Some of the main barriers to infrastructure development identified by participants were
underdeveloped financial systems, significant upfront costs for long-term investment and the absence of financially viable and well-designed infrastructure projects. Participants stressed that financial systems are largely bank-dominated, with commercial banks accounting for more than 82% of total financial assets in the ASEAN region (ADB, 2013). Furthermore, most banks in the ASEAN region are small, with an average size of bank assets equivalent to 126% of GDP (ADB, 2015). The corresponding figure for an advanced Asian economy like Japan is 378% (ADB, 2015). Non-bank financial institutions are not well-developed, which is exemplified by the fact that the size of the ASEAN region’s insurance sector as a percentage of GDP is not even half the average of advanced economies (Global Counsel, 2015). In India, banks have played a crucial role in infrastructure financing but the corporate bond market is still underdeveloped (Reserve Bank of India, 2015).
Large upfront costs are another constraint for long-term private infrastructure investment (OECD, 2016c). In the ASEAN region, prudential regulations, which are designed to protect banking systems from failure, discourage banks from extending long-term credit. In India, financial institutions are strained due to increasing levels of stressed assets in the infrastructure sector. For example, infrastructure loans, which made up 15% of total bank loans, represented 30% of total stressed loans in 2015 (Reserve Bank of India, 2015). Participants pointed out that this was because companies are required to commit large amounts of money in the initial stages of infrastructure projects. A proposed solution to reduce risks for the private sector calls on the government to fund projects initially and roll in public-private financing at a later point in time. This requires caution, however, as excessive risk taken on by the government has led to a number of failed PPPs in infrastructure in countries such as the Philippines (OECD, 2016e).
Participants also pointed out the absence of financially viable and well-designed projects for the private sector. Participants highlighted the private sector’s interest in these types of projects. OECD analysis shows the negative impact of limited or restricted private capital flows on both infrastructure and non-infrastructure business investments (Blundell-Wignall and Roulet, 2015). Initiatives such as the Indonesian government’s 2011 Master Plan for Acceleration and Expansion
48 BUSINESS INSIGHTS ON EMERGING MARKETS 2017 © OECD 2017
of Indonesian Economic Development 2011-25 (MP3EI) recognise the important role played by the private sector in economic development (OECD, 2015a). With the MP3EI, the Indonesian government hopes to lower regulatory barriers to investment and increase co-operation between the public and private sectors (WTO, 2013).
Beyond such initiatives, it is important for governments to maintain the principle of competitive neutrality to secure the private sector’s inclusion. This occurs when no entity operating in an economic market is subject to undue competitive advantages or disadvantages (OECD, 2012). The ensuing business environment is one where goods and services are produced by those who do so most efficiently.
The labour market and talent retention: Companies struggle to find talent due to talent emigration, language barriers and lack of soft skills
The private sector faces many difficulties in the labour market despite efforts to facilitate freer flow of skilled labour within the ASEAN region. ASEAN Mutual Recognition Arrangements allow professionals in key sectors – such as doctors, dentists, nurses, architects, engineers, accountants, surveyors, and tourism professionals – to work more easily in ASEAN countries (ASEAN, n.d.). Progress has been slow. Participants point to a range of challenges including labour cost volatility, labour relations challenges, local talent shortages, and a lack of soft skills and English language skills.
The share of employers reporting talent shortages in Asia-Pacific was 48% in 2015, higher than the global average of 38% (Figure 2.5) (ManpowerGroup, 2015). Indian companies outside of the IT industry have experienced difficulties in hiring engineers due to a rush of talent towards the IT industry. In China, the success of Internet enterprises such as the Alibaba Group as well as government support in the form, for instance, of university parks and technology business incubators have attracted local talent towards entrepreneurship rather than traditional employment. In fact, China has a high percentage of young entrepreneurs, with 57% of entrepreneurs in the 18 to 34 age group (Global Entrepreneurship Research Association, 2012). In Thailand, companies have found it difficult to attract locals into manufacturing as the country is driven by agriculture. Lack of soft skills and talent migration to Singapore have been key challenges faced by the private sector in Malaysia. The private sector is working with universities and governments to address the talent crunch and to develop soft skills. Business organisations also are making efforts to work closely with university networks.
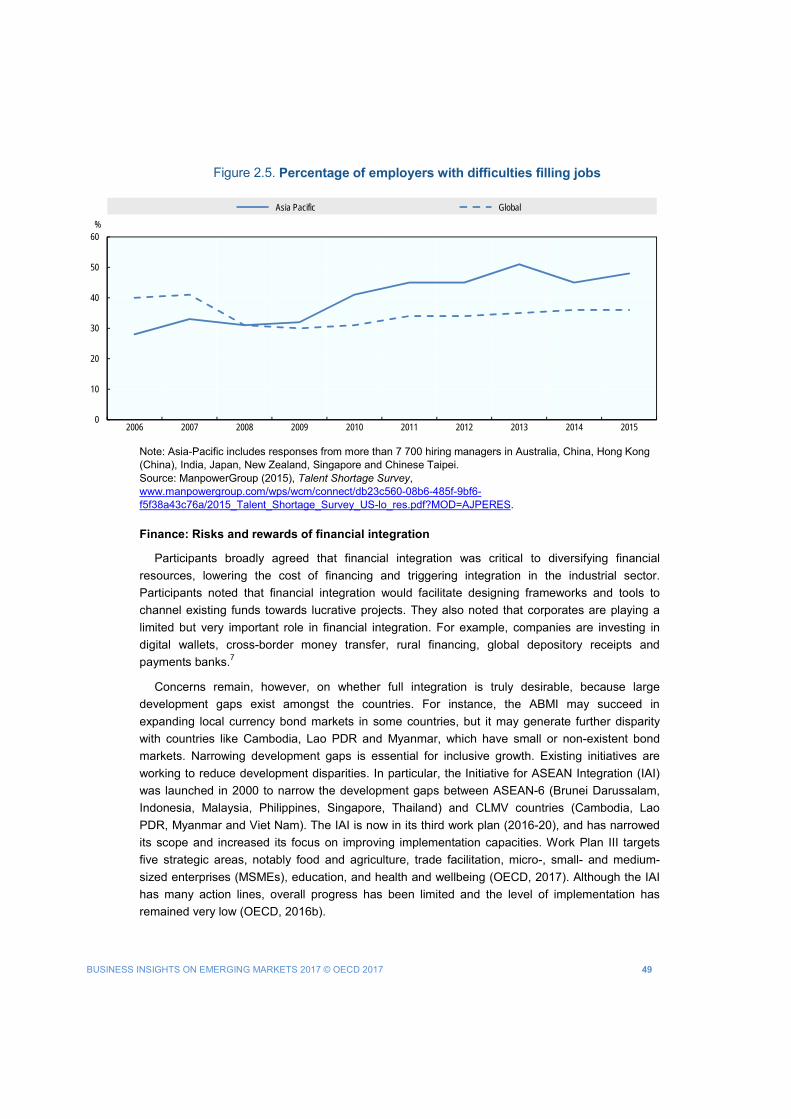
BUSINESS INSIGHTS ON EMERGING MARKETS 2017 © OECD 2017 49
Figure 2.5. Percentage of employers with difficulties filling jobs
Note: Asia-Pacific includes responses from more than 7 700 hiring managers in Australia, China, Hong Kong (China), India, Japan, New Zealand, Singapore and Chinese Taipei. Source: ManpowerGroup (2015), Talent Shortage Survey, www.manpowergroup.com/wps/wcm/connect/db23c560-08b6-485f-9bf6-f5f38a43c76a/2015_Talent_Shortage_Survey_US-lo_res.pdf?MOD=AJPERES.
Finance: Risks and rewards of financial integration
Participants broadly agreed that financial integration was critical to diversifying financial resources, lowering the cost of financing and triggering integration in the industrial sector. Participants noted that financial integration would facilitate designing frameworks and tools to channel existing funds towards lucrative projects. They also noted that corporates are playing a limited but very important role in financial integration. For example, companies are investing in digital wallets, cross-border money transfer, rural financing, global depository receipts and payments banks.7
Concerns remain, however, on whether full integration is truly desirable, because large development gaps exist amongst the countries. For instance, the ABMI may succeed in expanding local currency bond markets in some countries, but it may generate further disparity with countries like Cambodia, Lao PDR and Myanmar, which have small or non-existent bond markets. Narrowing development gaps is essential for inclusive growth. Existing initiatives are working to reduce development disparities. In particular, the Initiative for ASEAN Integration (IAI) was launched in 2000 to narrow the development gaps between ASEAN-6 (Brunei Darussalam, Indonesia, Malaysia, Philippines, Singapore, Thailand) and CLMV countries (Cambodia, Lao PDR, Myanmar and Viet Nam). The IAI is now in its third work plan (2016-20), and has narrowed its scope and increased its focus on improving implementation capacities. Work Plan III targets five strategic areas, notably food and agriculture, trade facilitation, micro-, small- and medium-sized enterprises (MSMEs), education, and health and wellbeing (OECD, 2017). Although the IAI has many action lines, overall progress has been limited and the level of implementation has remained very low (OECD, 2016b).
0
10
20
30
40
50
60
2006 2007 2008 2009 2010 2011 2012 2013 2014 2015
%
Asia Pacific Global
50 BUSINESS INSIGHTS ON EMERGING MARKETS 2017 © OECD 2017
Otherwise, participants highlighted that although China’s financial integration in the global economy is still low, it is becoming greater. Since the beginning of October 2016, for instance, the renminbi has been included in the International Monetary Fund (IMF) Special Drawing Rights (SDRs). SDRs are an international reserve asset set up by the IMF that can be exchanged into currencies. The value of the SDR is currently based on a basket of four currencies: the US dollar, the euro, the Japanese yen, and the British pound.
Energy: The region is expected to shift further to renewable energies as their competitiveness improves and they are supported by favourable government policies
Asia is emerging as a key market for renewable energy development driven by China and India. Significant regional investment in renewable energy is occurring, and enhanced regional integration could further stimulate investment. Indeed, investment is increasing and strong commitments by national governments to renewables have been facilitated by a variety of entities. What also helps are actions taken by regional groups and platforms like ASEAN, COP21 and the Group of Twenty (G20), which are expected to continue driving future investment. China is the largest global investor in renewable power, having invested USD 103 billion in 2015 or 35% of world investments (FS-UNEP, UNEP and BNEF, 2016). In some regions of India, for example, solar PV has become more cost-effective than conventional energy such as coal (Box 2.2).
The case of India and China demonstrate that renewables can be used as an industrial development policy, much in the same way as fossil fuels were used for industrialisation in the past 200 years. China and India have begun to include renewables as part of the industrialisation process – as a tool to generate employment, enhance energy security and reduce balance of payments burdens (Matthews, 2016).
BUSINESS INSIGHTS ON EMERGING MARKETS 2017 © OECD 2017 51
Box 2.2. Solar power and FDI: Market and policy convergence in India
Important policies to increase FDI inflows to India have been announced by the Modi government, including the “Make in India” initiative, which has a range of support measures for the deployment and development of renewable power in the country. The government is seeking to attract investors particularly for solar energy by providing a range of financial support instruments including energy subsidies, duty exemptions, guarantee schemes, loans at concessional rates and special incentives for all renewable energy technologies exported from India.
From a market dynamics perspective, solar PV has become increasingly cost-competitive over the years in certain regions of India. This is because investments in renewable energy drive down the cost of its production, expanding the market for its adoption and making further investment more attractive. For example, Solairedirect, an Engie subsidiary, won 140 megawatts (MW) in solar projects in the state of Rajasthan with an offer of INR 4.35 (Indian rupees) per kilowatt-hour (KwH), compared to INR 4.65 for coal-fuelled power. Solar is becoming competitive in terms of project delivery (between tendering and final commissioning). In addition, unlike mining, drilling or extraction, manufacturers benefit from learning curves that make production increasingly efficient and cost-effective. Solar PV facilities of up to 200 MW can now be delivered in 13 months, and such projects are becoming more attractive to international banks seeking to invest in India. Source: Make in India website, Renewable Energy section, www.makeinindia.com/sector/renewable-energy; Sinha (n.d.), “Riding the Renewable Wave”, www.makeinindia.com/article/-/v/success-stories-of-make-in-india; Solairedirect (n.d.), “ENGIE Wins Solar Energy Project Bidding”, www.solairedirect.com/es/actualites/engie-wins-solar-energy-project-bidding-for-140-mw-in-india/ (accessed 13 July 2016); Matthews (2016), “Developing Countries and The Renewable Energy Revolution”, www.oecd.org/dev/developing-countries-and-the-renewable-energy-revolution.htm
Regulatory harmonisation: Greater regulatory harmonisation can help firms adapt more quickly to local contexts
Regulatory harmonisation can facilitate regional integration. “Glocalisation”, which takes into account both the global and local contexts when conducting business, is a rigorous and costly process of adapting to local languages and regulations. Participants stressed that harmonisation of regulations through regional integration progress will reduce the costs of glocalisation significantly, since companies will be required to meet one standardised set of regulations in the region only rather than customising for each specific country.
SMEs: Sharing business knowledge, simplifying administrative processes and encouraging free movement of people can facilitate SME investments in Asia
Regional co-operation can play a role in encouraging investments by SMEs. Most large companies have operations in Asia, but SMEs tend to lack resources for international expansion. Sharing business knowledge, simplifying administrative processes and encouraging free movement of people will encourage SME growth. One example is the Make in India Mittelstand (MIIM) programme, which was initiated to facilitate German SMEs’ investment in India and entry into its market. MIIM offers a wide range of business support services, including strategy consulting, M&A advice, operational market entry support, tax and legal support, project financing, and the facilitation of approvals from central and state agencies. During the first six months, 42 German Mittelstand companies took part in the MIIM, 26 of which have announced concrete investment plans. The programme is expected to set up 15 new manufacturing plants, 6
52 BUSINESS INSIGHTS ON EMERGING MARKETS 2017 © OECD 2017
expansion projects and two pilot projects covering the states of Maharashtra, Gujarat, Karnataka and Tamil Nadu (Embassy of India, 2015; Mittelstand 2015).
Implications of China’s slowdown for business
China is a major part of the Asian economy; it is the largest contributor to FDI outflows and the second largest host economy to FDI inflows in developing Asia (UNCTAD, 2016). China’s development and growth will influence the region in both the public and private sectors. Accordingly, the private sector has highlighted a number of business implications of a Chinese slowdown.
China’s slowdown should be understood in terms of its two-tier economy
Participants stressed the importance of understanding the nature of China’s slowdown. The country is a two-tier economy. According to the National Bureau of Statistics of China (2015), in 2015 primary, secondary and tertiary industries made up 9%, 41% and 50% of GDP, respectively. The two tiers of China’s economy refer to the secondary and tertiary sectors. One half of China is the “old” economy, namely the secondary or industrial sector, which includes manufacturing, mining and construction. This sector is undergoing a hard landing, with year-on-year nominal growth close to 0% in 2015 (Siepmann, 2015). The other half of China’s economy is the “new” economy, or the tertiary sector, which includes services and retail. This sector has experienced strong growth. For example, year-on-year nominal growth of tertiary industries reached nearly 12% in the third quarter of 2015 (Siepmann, 2015). In other words, it was the tertiary sector that drove China’s total growth in 2015.
China is transitioning towards a new growth model. The old economy, however, is what has the most direct implications for the rest of the world, especially commodity exporters. China’s structural reforms are generating uncertainty in the rest of the region. SOE reform is particularly important to improve efficiency, manage non-performing debt and reduce excess labour. If successful, China may be able to increase potential growth and improve productivity in the long run. Participants agreed that China’s transition may be painful for the rest of the world in the short term; however, it has the potential to bring long-term benefits to the global economy.
China’s slowdown is impacting its neighbours through six main channels
The implications for and impact of China’s slowdown on other countries depend on the structure of the country’s economy and its ability to take advantage of opportunities and minimise risks. China’s neighbours are affected through six main channels, namely export demand, commodity prices, labour costs, exchange rates, FDI and cost of capital.
• Exports: Many developing Asian countries have depended on the Chinese market to export
commodities. As China restructures from “hard” sectors to the service sector, these countries are being impacted negatively.
• Commodity prices: With lower prices and less demand, commodity exporters have been hit hard by China’s slowdown. Lower prices can benefit countries that depend on imports and open opportunities for large commodity importers, such as India.
BUSINESS INSIGHTS ON EMERGING MARKETS 2017 © OECD 2017 53
• Labour costs: Labour costs are rising in some sectors as a consequence of the current economic transition. Countries that are able to enhance competitiveness in these sectors can benefit from the Chinese slowdown.
• Exchange rates: The Yuan renminbi fell nearly 5% against the US dollar in 2015 (Financial Times, 2016). Asian currencies face downward pressure due to their significant economic interdependencies (OECD, 2016e). Further impact will depend on whether devaluation continues and on other countries’ policy responses to remain competitive.
• Outward Chinese FDI: Despite the slowdown, China will continue to invest in natural resource extraction. Although overall investment volumes may decline, countries can still benefit from Chinese demand for commodities.
• Cost of capital: China has been a net capital exporter, which has contributed to low global interest rates. In other words, a large supply of savings originating from China has contributed to low global interest rates (Zhao, 2016).
China’s transition is an opportunity for economies to strengthen domestic-led growth
Participants speculated that China’s slowdown has resulted from the unsustainability of rapid economic growth based on the expansion of low value-added sectors. China has begun to phase out labour-intensive sectors and move into high-tech, high-value sectors. Beyond that, moving into knowledge-based industries, promoting service sectors, increasing productivity and improving tertiary education are key elements for the development of its internal markets. For other Asian economies, China’s transition represents an opportunity to restructure their economy and encourage a shift from export-led to domestic-led growth. It also should push commodity-oriented countries, which cannot rapidly shift to domestic-led growth, to search for new markets.
Chinese overcapacity and low commodity prices provide low-cost procurement opportunities
Commodity importers in Asia can leverage China’s overcapacity to source raw materials at a low cost. China produces eight to ten times more steel, aluminium, tyres and batteries than India. India and China, for example, produced 86.5 and 823 million tonnes of crude steel, respectively, out of a total global production of 1 665 million tonnes in 2014 (World Steel Association, 2015). Companies can benefit from low commodity prices and Chinese overcapacity to procure raw materials from China at lower costs.
China influences the rest of the ASEAN region in terms of the investment climate and the subsequent success of various regional integration initiatives. While progress has been made on regional integration, many challenges remain that need to be addressed moving forward. The private sector highlighted a number of prospects and challenges for current regional integration initiatives.
Prospects and challenges for regional agreements
While there are a number of promising regional agreements in Emerging Asia, the private sector also highlighted a number of challenges that could threaten the success of those integration efforts. These include economic gaps, non-tariff barriers and restrictive services policies. While these gaps, along with the uncertainty generated by the multiplication of trade
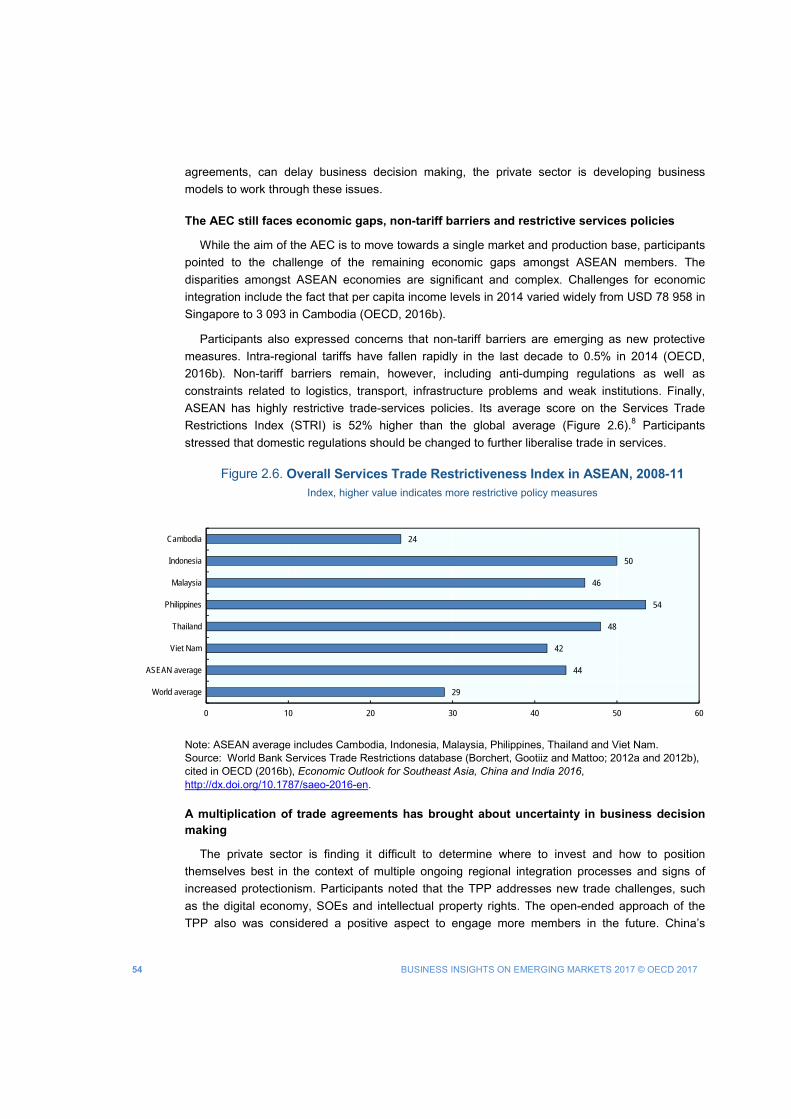
54 BUSINESS INSIGHTS ON EMERGING MARKETS 2017 © OECD 2017
agreements, can delay business decision making, the private sector is developing business models to work through these issues.
The AEC still faces economic gaps, non-tariff barriers and restrictive services policies
While the aim of the AEC is to move towards a single market and production base, participants pointed to the challenge of the remaining economic gaps amongst ASEAN members. The disparities amongst ASEAN economies are significant and complex. Challenges for economic integration include the fact that per capita income levels in 2014 varied widely from USD 78 958 in Singapore to 3 093 in Cambodia (OECD, 2016b).
Participants also expressed concerns that non-tariff barriers are emerging as new protective measures. Intra-regional tariffs have fallen rapidly in the last decade to 0.5% in 2014 (OECD, 2016b). Non-tariff barriers remain, however, including anti-dumping regulations as well as constraints related to logistics, transport, infrastructure problems and weak institutions. Finally, ASEAN has highly restrictive trade-services policies. Its average score on the Services Trade Restrictions Index (STRI) is 52% higher than the global average (Figure 2.6).8 Participants stressed that domestic regulations should be changed to further liberalise trade in services.
Figure 2.6. Overall Services Trade Restrictiveness Index in ASEAN, 2008-11 Index, higher value indicates more restrictive policy measures
Note: ASEAN average includes Cambodia, Indonesia, Malaysia, Philippines, Thailand and Viet Nam. Source: World Bank Services Trade Restrictions database (Borchert, Gootiiz and Mattoo; 2012a and 2012b), cited in OECD (2016b), Economic Outlook for Southeast Asia, China and India 2016, http://dx.doi.org/10.1787/saeo-2016-en.
A multiplication of trade agreements has brought about uncertainty in business decision making
The private sector is finding it difficult to determine where to invest and how to position themselves best in the context of multiple ongoing regional integration processes and signs of increased protectionism. Participants noted that the TPP addresses new trade challenges, such as the digital economy, SOEs and intellectual property rights. The open-ended approach of the TPP also was considered a positive aspect to engage more members in the future. China’s
29
44
42
48
54
46
50
24
0 10 20 30 40 50 60
World average
ASEAN average
Viet Nam
Thailand
Philippines
Malaysia
Indonesia
Cambodia
BUSINESS INSIGHTS ON EMERGING MARKETS 2017 © OECD 2017 55
absence, however, raised questions from private sector participants about the TPP’s comprehensiveness. Requirements for regulatory convergence in intellectual property rights, SOEs and competition also have made some ASEAN members reluctant to join the TPP. Otherwise, some participants were of the opinion that the RCEP, rather than the TPP, should be the business world’s priority. They pointed out that RCEP could be more relevant in the short term, since the final rounds of RCEP negotiations could conclude in 2017, while ratification of the TPP will take several years. The role of the United States in the TPP presents additional uncertainty. In January 2017, the United States withdrew as a signatory of the TPP and pledged to stop participation in TPP negotiations via a presidential memorandum (White House, 2017). In addition, the RCEP could be a stronger tool for ASEAN members to secure their interests owing to ASEAN’s strong role in the agreement. As the parties of the RCEP are the ten member states of ASEAN and six of ASEAN’s free trade partners, ASEAN plays a central role in the negotiations and can have a stronger voice.
Companies are changing their business models as a consequence of higher trade integration
In the interim period of uncertainty caused by ongoing agreements, companies have begun to use trade integration facilities to gain a competitive edge. In India, free trade agreements can sometimes produce an inverted duty structure, where the import duty for raw materials is higher than the import duty for the finished product. This has an adverse effect on manufacturers as it becomes cheaper to import a finished product than to manufacture it domestically. Companies are finding ways to work around these constraints. In particular, they can devise solutions within the framework of existing trade agreements to leverage the supply chain and gain competitiveness in the market. Participants in the EMnet meeting mentioned the example of an Indian manufacturer leveraging the existence of bilateral trade agreements between China and Thailand to supply zero-duty inputs from China to Thailand, where the Indian manufacturer makes the final product. The product is then shipped to India to be sold in the local market at a lower price than that of competitors. These strategies are unlikely to support local manufacturing or substantial employment and reflect the pragmatic approach that some companies are taking.
While the slowdown of the Chinese economy will influence the region for both the public and private sectors, increased regional integration offers a way forward for ASEAN in the face of global economic uncertainty. Although regional ties have been enhanced significantly since the 1980s, additional policy efforts are required to fully achieve integration targets. Countries in the region need to make additional efforts and take active steps to realise a single economic market and promote economic integration.
56 BUSINESS INSIGHTS ON EMERGING MARKETS 2017 © OECD 2017
CONCLUSION Enhanced regional ties can generate significant opportunities for the private sector. Even in the
context of a Chinese slowdown, enhanced regional ties in Asia can still generate significant opportunities for private-sector growth. In particular, the AEC has the potential to support higher trade and investment in the region. Amidst the various regional co-operation efforts underway, companies are capitalising on existing regional and bilateral trade agreements.
Challenges remain, however, particularly in areas such as trade in goods, trade in services, infrastructure and connectivity, and human and social development. The private sector highlighted these elements as critical for boosting regional integration in Asia and providing a favourable investment climate for inclusive growth and development. To facilitate regional integration further, policy makers could concentrate their efforts on reducing economic gaps and growth disparities, decreasing non-tariff barriers, and limiting restrictive services policies.
BUSINESS INSIGHTS ON EMERGING MARKETS 2017 © OECD 2017 57
Notes 1 ASEAN member states include Brunei Darussalam, Cambodia, Indonesia, Lao People’s Democratic Republic (hereafter
“Lao PDR”), Malaysia, Myanmar, Philippines, Singapore, Thailand and Viet Nam. 2 Unless otherwise noted, economic and financial data in this section are drawn from OECD (2017). 3 Unless otherwise noted, FDI data in this section is drawn from UNCTAD (2016). Emerging Asia includes ASEAN-10,
China and India. Hong Kong (China) is considered separately. 4 Southeast Asia includes ASEAN-10 plus Timor-Leste. 5 The region refers to China, Hong Kong (China), Indonesia, Korea, Malaysia, the Philippines, Singapore, Thailand and
Viet Nam. 6 Total renewable energy capacity includes capacity from bioenergy, hydropower, onshore and offshore wind, solar PV,
concentrated solar power (CSP), geothermal and ocean technologies. 7 A digital wallet is an electronic device for electronic-commerce transactions using a smartphone; a global depository
receipt is a certificate issued by a depository bank, which purchases shares of foreign companies and deposits it on the account; a payments bank is a basic banking service for people without bank accounts.
8 STRI helps identify which policy measures restrict trade, provides policy makers and negotiators with information and measurement tools to open up international trade in services, and negotiate international trade agreements.
References ADB (2016a), ASEAN Infrastructure Fund section, Asian Development Bank website, www.adb.org/site/aif/main
(accessed 13 April 2016).
ADB (2016b), Asia Bond Monitor: June 2016, Asian Development Bank, Mandaluyong City, www.asianbondsonline.adb.org/documents/abm_jun_2016.pdf.
ADB (2016c), Commercial Financing subsection, Asian Development Bank website, www.adb.org/site/private-sector-financing/commercial-cofinancing/guarantees (accessed 4 July 2016).
ADB (2015), Local Currency Bonds and Infrastructure Finance in ASEAN+3, Asian Development Bank, Mandaluyong City, https://asianbondsonline.adb.org/documents/abmi_lcy_bonds_infrastructure_finance.pdf.
ADB (2013), The Road to ASEAN Financial Integration: A Combined Study on Assessing the Financial Landscape and Formulating Milestones for Monetary and Financial Integration in ASEAN, Asian Development Bank, Mandaluyong City, www.adb.org/publications/road-asean-financial-integration.
AIIB (2015), “50 Countries Sign the Articles of Agreement for the Asian Infrastructure Investment Bank”, Asian Infrastructure Investment Bank website, www.aiib.org/html/2015/NEWS_0629/11.html (accessed 21 April 2016).
APEC (n.d.), Achievements and Benefits section, Asia-Pacific Economic Cooperation website, www.apec.org/About-Us/About-APEC/Achievements%20and%20Benefits.aspx (accessed January 6 2017).
APEC (2015), ASEAN Infrastructure Fund: Progress Update, Asia-Pacific Economic Cooperation, 2015/SFOM13/012, 13th Senior Finance Officials’ Meeting , Bagac, Philippines, 11-12 June 2015, Session 2, ADB Submission, http://mddb.apec.org/Documents/2015/FMP/SFOM13/15_sfom13_012.pdf.
ASEAN (2015), A Blueprint for Growth – ASEAN Economic Community 2015: Progress and Key Achievements, November, ASEAN Secretariat, Jakarta, www.asean.org/storage/images/2015/November/aec-page/AEC-2015-Progress-and-Key-Achievements.pdf.
ASEAN (2014), ASEAN Economic Community Chartbook 2014, ASEAN Secretariat, Jakarta, www.asean.org/storage/images/2015/february/asean_publications_2014/12.%20December%202014%20-%20AEC%20Chartbook%202014.pdf.
ASEAN (2013), “Regional Comprehensive Economic Partnership (RCEP) Joint Statement: The First Meeting of Trade Negotiating Committee”, Association of Southeast Asian Nations website, May, www.asean.org/regional-comprehensive-economic-partnership-rcep-jo0int-statement-the-first-meeting-of-trade-negotiating-committee/ (accessed 1 August 2016).
58 BUSINESS INSIGHTS ON EMERGING MARKETS 2017 © OECD 2017
ASEAN (n.d.), Building the ASEAN Community – Regional Comprehensive Economic Partnership: A Coherent Approach towards Economic Integration, Association of Southeast Asian Nations website, www.asean.org/storage/images/2015/October/outreach-document/Edited%20RCEP.pdf (accessed 19 April, 2016).
Australian Government (n.d.), Trans-Pacific Partnership Agreement: An Introduction, Department of Foreign Affairs and Trade, https://dfat.gov.au/trade/agreements/tpp/Documents/tpp-overview.pdf (accessed 30 December 2016).
BBC News (2015), “Trans-Pacific free trade deal agreed creating vast partnership", BBC website, 6 October, www.bbc.com/news/business-34444799.
Borchert, I., B. Gootiiz and A. Mattoo (2012a), “Guide to the Services Trade Restrictions Database”, World Bank Policy Research Working Paper (WPS6108), The World Bank, Washington DC, http://documents.worldbank.org/curated/en/878251468178764639/Guide-to-the-services-trade-restrictions-database.
Borchert, I., B. Gootiiz and A. Mattoo (2012b), “Policy Barriers to International Trade in Services: New Empirical Evidence”, World Bank Policy Research Working Paper (WPS6109), The World Bank, Washington DC, http://documents.worldbank.org/curated/en/277401468331247210/pdf/WPS6109.pdf.
Business Standard (2016), “Cabinet Clears Viability Gap Funding for 5 000 MW Solar Power Projects”, Business Standard website, 20 January, www.business-standard.com/article/economy-policy/cabinet-clears-viability-gap-funding-for-5-000-mw-solar-power-projects-116012000821_1.html.
Casanova, L. and A. Miroux (2016), Emerging Multinationals Report (EMR) 2016: The China Surge, Emerging Markets Institute, S.C. Johnson School of Management, Cornell University, Ithaca, https://drive.google.com/file/d/0B3MfmUF4N-GRcm5TbEpoZUxpb0E/view.
Coia, A. (2013), “Gaining Power Through Diversity in ASEAN”, Automotive Logistics website, 6 December, http://automotivelogistics.media/intelligence/gaining-power-through-diversity-in-asean.
Deshmukh, K.R. (2015), The Silk Route Economic Belt and 21st Century Maritime Silk Road: Implications for India, Knight Frank India, Mumbai, https://kfcontent.blob.core.windows.net/research/1004/documents/en/silkroute-pdf-3580.pdf.
Embassy of India (2015), Press release: Make in India Mittelstand (MIIM) Initiative Launched, https://www.indianembassy.de/pdf/MIIM_Eng.pdf.
Embassy of India (2015), Press release: German SMEs (Mittelstand) commits over Rs. 3000 crore investments under Make in India Mittelstand Initiative, https://www.indianembassy.de/pages.php?id=175.
ERIA (2010), The Comprehensive Asia Development Plan: ERIA Research Project Report 2009-7-1, Economic Research Institute for ASEAN and East Asia, Jakarta, www.eria.org/publications/research_project_reports/the-comprehensive-asia-development-plan.html.
Financial Times (2016), “Renminbi Weakness: China’s Challenge for 2016”, Financial Times website, www.ft.com/cms/s/3/39a66bc8-b2d9-11e5-b147-e5e5bba42e51.html#axzz45WNAWiXB (accessed 20 April).
FS-UNEP, UNEP and BNEF (2016), Global Trends in Renewable Energy Investment 2015, Frankfurt School-UNEP Collaborating Centre for Climate and Sustainable Energy Finance, United Nations Environment Programme, Bloomberg New Energy Finance, Frankfurt, http://fsunep-centre.org/publications/global-trends-renewable-energy-investment-2015.
Global Counsel (2015), ASEAN Insurance Markets: Integration, Regulation and Trade, Global Counsel LLP, London, www.global-counsel.co.uk/sites/default/files/special-reports/downloads/Global_Counsel_ASEAN_Insurance_Markets_Report_low-res.pdf.
Government of Pakistan (2016), Key Indicators for Economic Growth, Ministry of Planning, Development & Reform, Government of Pakistan website, www.pc.gov.pk/?cat=4 (accessed 19 April, 2016).
Groff, S. (2016), “Keynote Speech at the OECD Emerging Markets Network Business Meeting - Stephen Groff”, Asian Development Bank website, www.adb.org/news/speeches/keynote-speech-oecd-emerging-markets-network-business-meeting-stephen-groff (accessed 4 August 2016).
BUSINESS INSIGHTS ON EMERGING MARKETS 2017 © OECD 2017 59
Hamanaka, S. (2014), Trans-Pacific Partnership versus Regional Comprehensive Economic Partnership: Control of Membership and Agenda Setting, ADB Working Paper Series on Regional Economic Integration, No. 146, December, Asian Development Bank, Mandaluyong City, www.adb.org/sites/default/files/publication/152753/reiwp-146.pdf.
IEA (2016), Medium-Term Renewable Energy Market Report 2016, IEA, Paris, www.iea.org/bookshop/734-Medium-Term_Renewable_Energy_Market_Report_2016.
IEA (2015), Energy and Climate Change, World Energy Outlook Special Report, International Energy Agency, Paris, www.iea.org/publications/freepublications/publication/WEO2015SpecialReportonEnergyandClimateChange.pdf.
IMF (2016), “Data Template on International Reserves and Foreign Currency Liquidity”, International Monetary Fund website, www.imf.org/external/np/sta/ir/IRProcessWeb/colist.aspx (accessed 18 April, 2016).
Kahn, S.H.R (2015), “Financing for Infrastructure: Current Issues & Emerging Challenges”, Reserve Bank of India website, www.rbi.org.in/Scripts/BS_SpeechesView.aspx?Id=968 (accessed 18 April, 2016).
Kraemer K., Linden G. and Dedrick J. (2011), Capturing Value in Global Networks: Apple’s iPad and iPhone, University of California, Irvine, University of California, Berkeley and Syracuse University, http://pcic.merage.uci.edu/papers/2011/value_ipad_iphone.pdf.
Make in India website, Renewable Energy section, www.makeinindia.com/sector/renewable-energy (accessed 13 July 2016).
ManpowerGroup (2015), Talent Shortage Survey: 10th Annual Talent Shortage Survey, ManpowerGroup, Milwaukee, www.manpowergroup.com/wps/wcm/connect/db23c560-08b6-485f-9bf6-f5f38a43c76a/2015_Talent_Shortage_Survey_US-lo_res.pdf?MOD=AJPERES.
Matthews, J.A. (2016), “Developing Countries and the Renewable Energy Revolution”, OECD Development Centre Blog, 17 May, www.oecd.org/dev/developing-countries-and-the-renewable-energy-revolution.htm.
MTI (2014), Factsheet: What You Need to Know About Regional Comprehensive Economic Partnership (RCEP), Ministry of Trade and Industry, Singapore, Ministry of Trade and Industry website, www.mti.gov.sg/MTIInsights/SiteAssets/Pages/FACTSHEET-WHAT-YOU-NEED-TO-KNOW-ABOUT/Factsheet%20on%20RCEP%20(June%202014).pdf.
National Bureau of Statistics of China (2015), “Preliminary Accounting Results of GDP for the Fourth Quarter and Whole Year of 2015”, Press Release, National Bureau of Statistics of China website, www.stats.gov.cn/english/PressRelease/201601/t20160121_1307717.html (accessed 22 April, 2016).
OECD (2017), Economic Outlook for Southeast Asia, China and India 2017: Addressing Energy Challenges, OECD Publishing, Paris, http://dx.doi.org/10.1787/saeo-2017-en.
OECD (2016a), "Special Supplement: Update June 2016", in Economic Outlook for Southeast Asia, China and India 2016: Enhancing Regional Ties, OECD Publishing, Paris, http://dx.doi.org/10.1787/saeo-2016-25-en.
OECD (2016b), Economic Outlook for Southeast Asia, China, and India 2016: Enhancing Regional Ties, OECD Publishing, Paris, http://dx.doi.org/10.1787/saeo-2016-en.
OECD (2016c), “Business Insights on Emerging Markets 2015”, OECD Emerging Markets Network, OECD Development Centre, Paris, www.oecd.org/dev/development-philanthropy/EMnet_Business_insights_2015.pdf.
OECD (2016d), OECD Investment Policy Reviews: Philippines 2016, OECD Publishing, Paris, http://dx.doi.org/10.1787/9789264254510-en.
OECD (2016e), OECD Business and Finance Outlook 2016, OECD Publishing, Paris, http://dx.doi.org/10.1787/9789264257573-en.
OECD (2015a), Economic Outlook for Southeast Asia, China and India 2015: Strengthening Institutional Capacity, OECD Publishing, Paris, http://dx.doi.org/10.1787/saeo-2015-en.
OECD (2015b), OECD Economic Surveys: China 2015, OECD Publishing, Paris, http://dx.doi.org/10.1787/eco_surveys-chn-2015-en.
OECD (2012), Recommendation of the Council on Principles for Public Governance of Public-Private Partnerships, OECD Publishing, Paris, www.oecd.org/governance/budgeting/PPP-Recommendation.pdf.
60 BUSINESS INSIGHTS ON EMERGING MARKETS 2017 © OECD 2017
Reuters (2015), “China to Grant Residence Rights to 13 Million Unregistered Citizens”, 9 December, Reuters website, www.reuters.com/article/us-china-politics-idUSKBN0TS1UA20151209.
Roesly, S. (2013), The Role of IIGF in Supporting Bankable PPP Projects in Indonesia, Indonesia Infrastructure Guarantee Fund, Jakarta, www.jica.go.jp/press/2012/ku57pq000012e8t8-att/20130124_02_06.pdf.
Siepmann, C. (2015), “How Reliable are Chinese Growth Figures?”, 18 December, Generali Investments website, www.generali-invest.com/content/getdoc/1d9de04d-aace-4fe8-85ed-fe0f9428a7be/Focal_Point_China_growth.aspx.
Sinha, S. (n.d.), “Riding the Renewable Wave”, Make in India website, www.makeinindia.com/article/-/v/success-stories-of-make-in-india (accessed 13 July 2016).
Smith, E. (2015), “Energy Security in Pakistan: Could Hydropower be the Solution?”, International Hydropower Association blog, August 7, www.hydropower.org/blog/energy-security-in-pakistan-could-hydropower-be-the-solution.
Solairedirect (n.d.), “ENGIE Wins Solar Energy Project Bidding for 140 MW in India”, Solairedirect website, www.solairedirect.com/es/actualites/engie-wins-solar-energy-project-bidding-for-140-mw-in-india/ (accessed 13 July 2016).
UNCTAD (2015), United Nations Conference on Trade and Development, UNCTADstat website, http://unctadstat.unctad.org/wds/ReportFolders/reportFolders.aspx?sCS ChosenLang=en (accessed 20 November, 2015).
UNCTAD (2016), World Investment Report 2016 - Investor Nationality: Policy Challenges, United Nations Conference on Trade and Development, Geneva, http://unctad.org/en/pages/DIAE/World%20Investment%20Report/WIR-Series.aspx.
UNFCCC (2015), “India and France Launch International Solar Energy Alliance at COP21”, Announcement, United Nations Framework Convention on Climate Change, 30 November, http://newsroom.unfccc.int/clean-energy/international-solar-energy-alliance-launched-at-cop21/.
USTR (n.d.), The Trans-Pacific Partnership: Leveling the playing field for American workers and American businesses, Executive Office of the President, Office of the United States Trade Representative, USTR website, https://ustr.gov/tpp/ (accessed 19 April, 2016).
White House (2017), “Withdrawal of the United States from the Trans-Pacific Partnership Negotiations and Agreement, Presidential Memorandum, United States Office of the Press Secretary, January 23, www.whitehouse.gov/the-press-office/2017/01/23/presidential-memorandum-regarding-withdrawal-united-states-trans-pacific.
World Bank (2016c), Connecting to Compete 2016: Trade Logistics in the Global Economy, The International Bank for Reconstruction and Development / The World Bank, Washington DC, https://wb-lpi-media.s3.amazonaws.com/LPI_Report_2016.pdf.
World Steel Association (2015), World Steel in Figures 2015, World Steel Association, worldsteel.org website, www.worldsteel.org/en/dam/jcr:2e76bbc6-6db4-4d20-90ee-0e6e91ceeda8/World+Steel+in+Figures+2015.pdf.
Zamora, C.G. et al. (eds.) (2015), ASEAN Plan of Action for Energy Cooperation (APAEC) 2016-2025 Phase I: 2016-2020, ASEAN Centre for Energy, Jakarta, www.aseanenergy.org/wp-content/uploads/2015/12/HighRes-APAEC-online-version-final.pdf.
Zhao, L. (2016), “Global Low Interest Rates: Hypotheses, Implications and Strategies”, The Actuary, February-March, Vol. 13, No. 1, http://theactuarymagazine.org/wp-content/uploads/2016/02/SOA-006-FebMar16
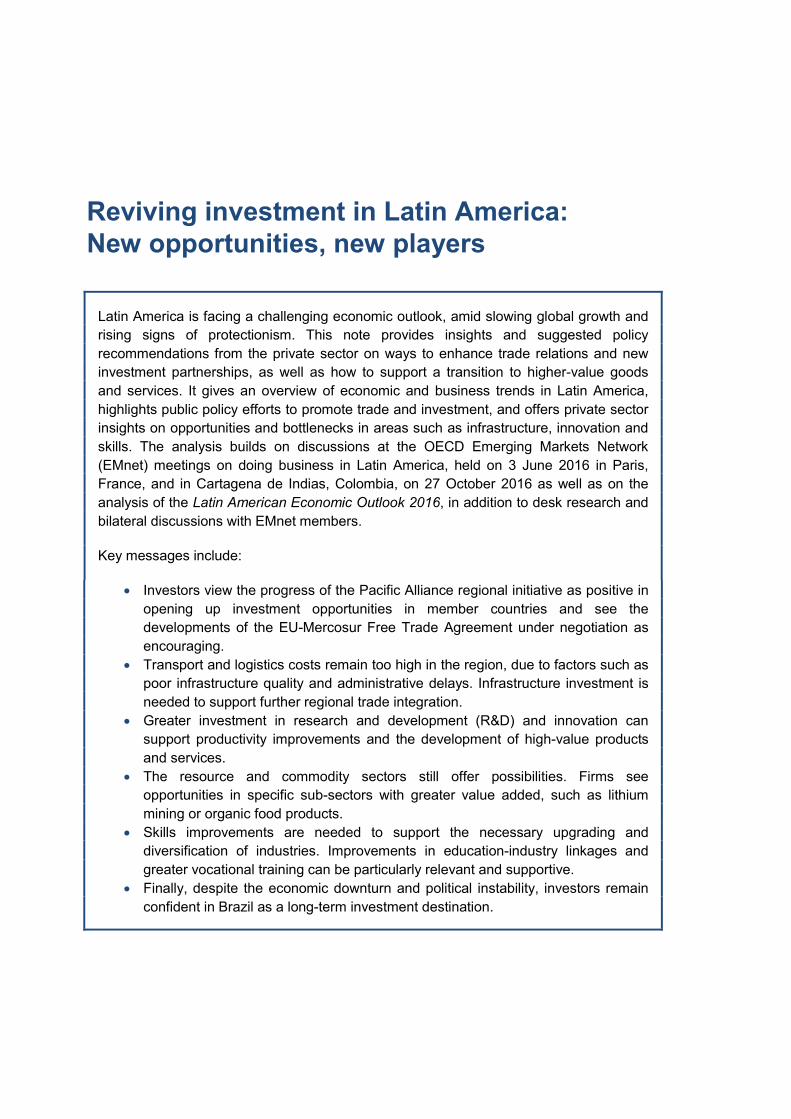
Reviving investment in Latin America: New opportunities, new players
Latin America is facing a challenging economic outlook, amid slowing global growth and rising signs of protectionism. This note provides insights and suggested policy recommendations from the private sector on ways to enhance trade relations and new investment partnerships, as well as how to support a transition to higher-value goods and services. It gives an overview of economic and business trends in Latin America, highlights public policy efforts to promote trade and investment, and offers private sector insights on opportunities and bottlenecks in areas such as infrastructure, innovation and skills. The analysis builds on discussions at the OECD Emerging Markets Network (EMnet) meetings on doing business in Latin America, held on 3 June 2016 in Paris, France, and in Cartagena de Indias, Colombia, on 27 October 2016 as well as on the analysis of the Latin American Economic Outlook 2016, in addition to desk research and bilateral discussions with EMnet members.
Key messages include:
• Investors view the progress of the Pacific Alliance regional initiative as positive in opening up investment opportunities in member countries and see the developments of the EU-Mercosur Free Trade Agreement under negotiation as encouraging.
• Transport and logistics costs remain too high in the region, due to factors such as poor infrastructure quality and administrative delays. Infrastructure investment is needed to support further regional trade integration.
• Greater investment in research and development (R&D) and innovation can support productivity improvements and the development of high-value products and services.
• The resource and commodity sectors still offer possibilities. Firms see opportunities in specific sub-sectors with greater value added, such as lithium mining or organic food products.
• Skills improvements are needed to support the necessary upgrading and diversification of industries. Improvements in education-industry linkages and greater vocational training can be particularly relevant and supportive.
• Finally, despite the economic downturn and political instability, investors remain confident in Brazil as a long-term investment destination.
62 BUSINESS INSIGHTS ON EMERGING MARKETS 2017 © OECD 2017
GROWTH, TRADE AND INVESTMENT TRENDS Latin America is facing a challenging macroeconomic outlook, with domestic growth slowing
since 2012. The external scenario also is unfavourable; global growth has hovered around 3% since 2012 with a predicted modest increase to 3.5% growth by 2018 (OECD, 2016a). Low global growth is compounded by tightening financial conditions, declining and volatile capital inflows to emerging markets and the end of a once-booming commodities super cycle (OECD/CAF/ECLAC, 2016). With growing global economic and political uncertainty and a pushback against the major tenants of globalisation — free trade and foreign investment (ECLAC, 2016a) — Latin American economies will need to develop alternative policies to boost productivity and growth. The diversity of Latin American economies means that region-wide solutions do not exist; nonetheless, the Latin American Economic Outlook 2017 highlights the importance of focusing on policy actions that boost physical and human capital while strengthening fiscal positions and improving regional competitiveness (OECD/CAF/ECLAC, 2016).
Regional growth amidst global economic uncertainty
Overall, Latin America is expected to return to positive growth (1.3%) in 2017, though with continued wide variation in economic performance across the region (ECLAC, 2016c) (Figure 3.1). Areas least dependent on commodities are projected to have the highest growth levels. For example, Mexico and Central America should have the strongest average growth as a region (2.3%) in 2017, although rising signs of global trade protectionism are generating uncertainty regarding future regional GDP growth. South American economies that rely heavily on commodities should experience weaker growth, but performance will vary widely. Peru (4.0%), Bolivia (3.8%) and Paraguay (3.8%) are expected to grow the strongest in 2017. Argentina’s growth is projected to rebound considerably in 2017 (2.9%) and 2018 (3.4%) as result of economic policy reforms (OECD, 2016a). Brazil should return to positive growth in 2017 (0.4%), a welcomed sign for many countries in the region that depend on trade and investment ties. Although the Bolivarian Republic of Venezuela’s (hereafter “Venezuela”) contraction ought to continue in 2017 (-4.7%), this is a recovery from 2016 levels (-9.7%). Caribbean economies should grow by 1.3% as a region, with the strongest 2017 performance expected in Saint Kitts and Nevis (5.3%), Guyana (3.8%) and Belize (3.7%) (ECLAC, 2016c).
BUSINESS INSIGHTS ON EMERGING MARKETS 2017 © OECD 2017 63
Figure 3.1. GDP growth in Latin America and the OECD, 2000-17 Annual percentage change
Source: OECD (2017), OECD Economic Outlook: Statistics and Projections (database), www.oecd.org/eco/outlook/economic-outlook-annex-tables.htm; CEPAL (2016), CEPALSTAT, http://estadisticas.cepal.org/.
A weakened fiscal space heightens risks for countries
Slow growth, reduced revenues due to low commodity prices and rising debt levels are limiting the manoeuvrability of governments in the region as fiscal deficits widen. Countries also are finding it harder and more expensive to finance public deficits (OECD/CAF/ECLAC, 2016). Governments will need to act carefully to avoid cutting spending in key areas that can promote growth, such as skills and infrastructure. While individual fiscal situations significantly vary, all countries in the region would benefit from improving the efficiency of goods and services provision (OECD/CAF/ECLAC, 2016).
Trade volumes are weakening and fears of protectionism are rising
Greater regional integration and expanded trade relations can be a driving force for growth, but global trade growth is slow and protectionism is rising. Growth in global trade volumes remains weak and is expected to rebound only slightly in 2017 and 2018 (Figure 3.2).
-4
-2
0
2
4
6
8
2000 2001 2002 2003 2004 2005 2006 2007 2008 2009 2010 2011 2012 2013 2014 2015 2016 2017
%
Latin America and the Caribbean OECD
64 BUSINESS INSIGHTS ON EMERGING MARKETS 2017 © OECD 2017
Figure 3.2. Change in world trade growth, 2001-18 Average percentage change from previous period of export and import volumes
Note: The cut-off date for information used in the compilation of the projections was 16 November 2016. Source: OECD (2017), OECD Economic Outlook: Statistics and Projections (database), www.oecd.org/eco/outlook/economic-outlook-annex-tables.htm.
When related to GDP growth, global trade growth also is stagnant and very weak relative to historic norms (Figure 3.3). This slowdown in global trade growth is cause for concern as it is contributing to the low-growth trap (OECD, 2016a)
Figure 3.3. Ratio of global trade growth to global GDP growth
Note: World trade volumes for goods and services; global GDP at constant prices and market exchange rates. Period averages are the ratio of average annual world trade growth to average annual GDP growth in the period shown. The cut-off date for information used in the compilation of the projections was 16 November 2016. Source: OECD (2016a), OECD Economic Outlook, Volume 2016 Issue 2, p. 23, http://dx.doi.org/10.1787/eco_outlook-v2016-2-en.
-15
-10
-5
0
5
10
15
1999 2000 2001 2002 2003 2004 2005 2006 2007 2008 2009 2010 2011 2012 2013 2014 2015 2016 2017 2018
%
World Average
0.6
0.8
1
1.2
1.4
1.6
1.8
2
2.2
2.4
2011 2012 2013 2014 2015 2016 2017 2018
Average 1970-2015 = 1.8
Average 1986-2007 = 2.14
BUSINESS INSIGHTS ON EMERGING MARKETS 2017 © OECD 2017 65
The reduced global trade has translated into lower trade volume growth in the region (Figure 3.4). The total value of Latin America’s exports is estimated to have fallen by 6% in 2016 due to low commodity prices, currency devaluations and appreciation of the US dollar (Giordano, Ramos and Michalczewsky, 2016).
Figure 3.4. Export growth in selected Latin American countries, 2015 and 2016 Annual growth rate, percentage
Source: Authors’ elaboration based on IDB Integration and Trade Sector with data from official sources, except Venezuela, estimated with data from OPEC and the IMF, cited in Giordano, Ramos and Michalczewsky (2016), Trade Trend Estimates: Latin America and the Caribbean – 2017 Edition, https://publications.iadb.org/handle/11319/7984.
Intra-regional trade within Latin America also is showing weak performance, and trade within the region contracted more than trade with China, the European Union (EU) and Asia overall in 2016. The economic slowdown in Brazil also has reduced demand for regional exports to the Brazilian market. For example, Brazil is Argentina’s main trading partner. A decline in exports to Brazil of Argentine transport goods was a main contributing factor to a 15% decline in Argentina’s trade in South America (Giordano, Ramos and Michalczewsky, 2016). Intra-regional trade is particularly important as it is often more intensive in high value-added products than extra-regional trade and can open markets for more diversified products and exports (ECLAC, 2015). Moreover, intra-regional trade often involves a greater participation of small- and medium-sized enterprises (SMEs), which can support job creation (ECLAC, 2015).
FDI inflows decline overall but vary by region
In 2015, overall foreign direct investment (FDI) into Latin America and the Caribbean declined, with varied performance in its sub-regions. Data from ECLAC (2016b) shows that FDI inflows into Latin America and the Caribbean declined by 9.1% between 2014 and 2015, dropping to USD 179.1 billion. In contrast, the United Nations Conference on Trade and Development (UNCTAD)’s World Investment Report 2016 (UNCTAD, 2016) puts 2015 total FDI inflows at USD 167.6 billion, or 1.6% less. While there is slight variation between the reports, both agree
-60
-50
-40
-30
-20
-10
0
10
Argentina Brazil Chile Colombia Costa Rica Mexico Panama Paraguay Venezuela Latin America
%
World Total 2015 vs 2014 World Total 2016 vs 2015
66 BUSINESS INSIGHTS ON EMERGING MARKETS 2017 © OECD 2017
that declines in commodity prices, coupled with worsening terms of trade and slow domestic demand, are hampering FDI inflows. Unless otherwise noted, this section uses data from ECLAC (2016b).
FDI to South America hurt by declining commodity prices
South America was particularly affected by the fall in commodity prices, owing to its specialisation in primary goods, especially oil and minerals, and its strong trade with China. Overall FDI flows into the region fell by 14% to USD 131 billion, the lowest level in 10 years. The end of the commodity super cycle decreased FDI inflows for most major South American economies. In Brazil – Latin America’s largest economy – FDI inflows shrank by 23% because of uncertainty in domestic markets and a decline in the price of the country’s raw material exports. In Chile and Colombia – Latin America’s third and fourth largest economies – FDI declined by 8% and 26%, respectively, due to falling metal prices. Bolivia also experienced a 22% decline because of volatility in the country’s hydrocarbon sector. Flows to Paraguay and Uruguay decreased by 18% and 25%, respectively, while FDI in Peru fell for the third consecutive year, dropping by 13%.
Only 3 of South America’s 10 economies experienced increases in FDI inflows in 2015. While FDI to the oil sectors in Ecuador and Venezuela declined, both countries experienced upsurges in overall FDI inflows of 37% and 153%, respectively, thanks to increases in manufacturing and intra-company loans. The increased FDI inflows to Argentina is a unique case in South America. While FDI inflows rose 130%, this was on the back of unusually low flows in 2014 due to the government’s compensation of Repsol (Spain) for the expropriation of its majority-owned subsidiary, YPF S.A. Excluding this transaction, inflows to Argentina posted a more moderate increase of 15% (UNCTAD, 2016), reflecting to some extent a more positive investor attitude.
FDI to Central America and Mexico grew while the Caribbean faltered
Flows to Central America increased in 2015 by 6% to USD 12 billion. Panama was the most important destination of FDI in the sub-region, followed by Costa Rica, Honduras and Guatemala. These countries have had greater capacity to absorb the shock of decreased commodity prices and to move to higher-value manufacturing because Central America is less dependent on natural resources.
Overall, Mexico was the largest recipient of FDI inflows, which rose 18% to USD 30 billion. The United States is the principal investor in the region, accounting for 52% of FDI, followed by Spain. These flows were mainly directed into manufacturing, which received 50% of total FDI inflows. Future flows might be impacted by potential changes in existing trade arrangements such as the North American Free Trade Agreement (NAFTA).
While not all Caribbean economies are commodity dependent, reduced commodity prices also have affected FDI into some of these. Overall inflows to the region declined 17% to USD 6 billion. The sub-region’s main recipient is the Dominican Republic (39%). Caribbean economies can generally be divided into those dependent on tourism and those specialised in natural resources. Accordingly, those that exploit natural resources have been hurt by the fall in commodity prices, while those dependent on tourism have benefited from the US economic recovery.
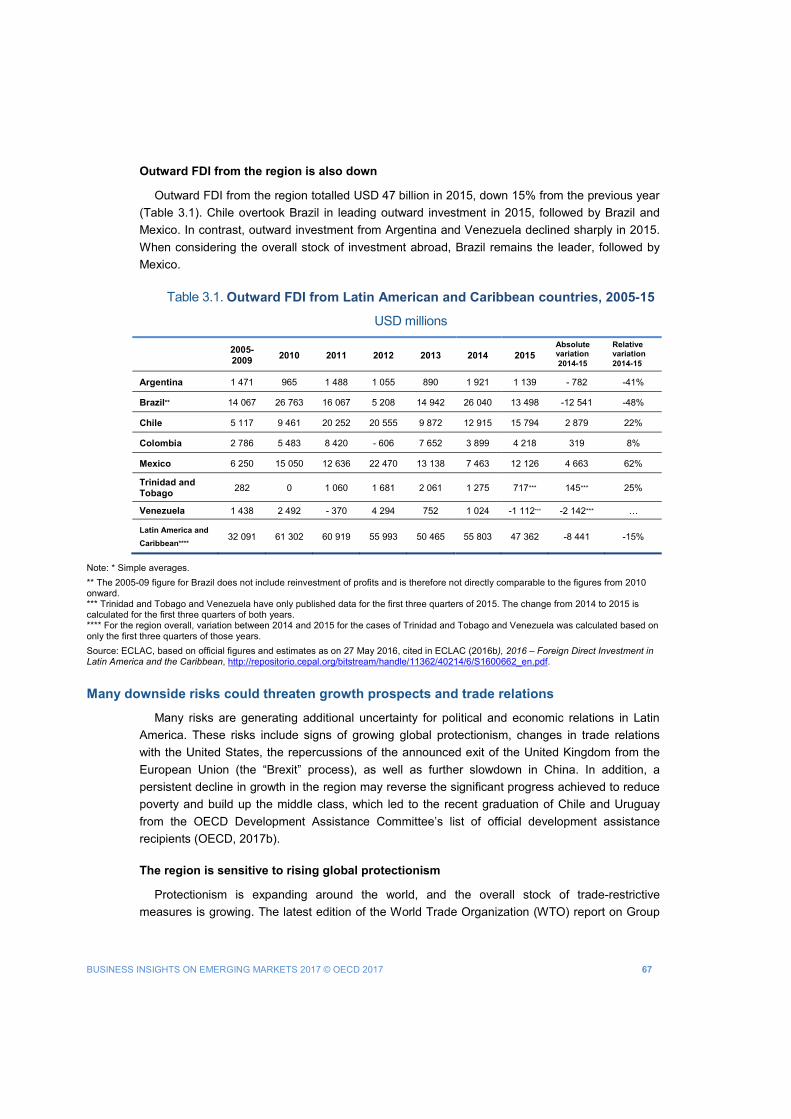
BUSINESS INSIGHTS ON EMERGING MARKETS 2017 © OECD 2017 67
Outward FDI from the region is also down
Outward FDI from the region totalled USD 47 billion in 2015, down 15% from the previous year (Table 3.1). Chile overtook Brazil in leading outward investment in 2015, followed by Brazil and Mexico. In contrast, outward investment from Argentina and Venezuela declined sharply in 2015. When considering the overall stock of investment abroad, Brazil remains the leader, followed by Mexico.
Table 3.1. Outward FDI from Latin American and Caribbean countries, 2005-15
USD millions
2005-2009 2010 2011 2012 2013 2014 2015
Absolute variation 2014-15
Relative variation 2014-15
Argentina 1 471 965 1 488 1 055 890 1 921 1 139 - 782 -41%
Brazil** 14 067 26 763 16 067 5 208 14 942 26 040 13 498 -12 541 -48%
Chile 5 117 9 461 20 252 20 555 9 872 12 915 15 794 2 879 22%
Colombia 2 786 5 483 8 420 - 606 7 652 3 899 4 218 319 8%
Mexico 6 250 15 050 12 636 22 470 13 138 7 463 12 126 4 663 62%
Trinidad and Tobago 282 0 1 060 1 681 2 061 1 275 717*** 145*** 25%
Venezuela 1 438 2 492 - 370 4 294 752 1 024 -1 112*** -2 142***
Latin America and Caribbean****
32 091 61 302 60 919 55 993 50 465 55 803 47 362 -8 441 -15%
Note: * Simple averages. ** The 2005-09 figure for Brazil does not include reinvestment of profits and is therefore not directly comparable to the figures from 2010 onward. *** Trinidad and Tobago and Venezuela have only published data for the first three quarters of 2015. The change from 2014 to 2015 is calculated for the first three quarters of both years. **** For the region overall, variation between 2014 and 2015 for the cases of Trinidad and Tobago and Venezuela was calculated based on only the first three quarters of those years. Source: ECLAC, based on official figures and estimates as on 27 May 2016, cited in ECLAC (2016b), 2016 – Foreign Direct Investment in Latin America and the Caribbean, http://repositorio.cepal.org/bitstream/handle/11362/40214/6/S1600662_en.pdf.
Many downside risks could threaten growth prospects and trade relations
Many risks are generating additional uncertainty for political and economic relations in Latin America. These risks include signs of growing global protectionism, changes in trade relations with the United States, the repercussions of the announced exit of the United Kingdom from the European Union (the “Brexit” process), as well as further slowdown in China. In addition, a persistent decline in growth in the region may reverse the significant progress achieved to reduce poverty and build up the middle class, which led to the recent graduation of Chile and Uruguay from the OECD Development Assistance Committee’s list of official development assistance recipients (OECD, 2017b).
The region is sensitive to rising global protectionism
Protectionism is expanding around the world, and the overall stock of trade-restrictive measures is growing. The latest edition of the World Trade Organization (WTO) report on Group
68 BUSINESS INSIGHTS ON EMERGING MARKETS 2017 © OECD 2017
of Twenty (G20) trade measures highlights that of the 1 671 trade-restrictive measures that have been recorded for G20 economies since 2008, only 408 had been removed by mid-October 2016 (OECD/WTO/UNCTAD, 2016). The OECD estimated that in 2016 the number of trade restrictive measures in G20 countries has reached a peak since the outbreak of the financial crisis in 2008 (OECD, 2016a).
Another risk factor is the possible decline of trade relations and partnerships between the United States and Latin America. Many Latin American economies, particularly in Central America and the Caribbean, are heavily dependent on the performance of the US economy and trade relations with the United States.
Mexico, which has benefited greatly from free trade with the United Sates, is particularly sensitive to changes in the US economy or in trade relations. In fact, US imports from Mexico are up 638% from 1993 (pre-NAFTA) (USTR, n.d.). Beyond trade, however, FDI also has been important to Mexico’s economy, particularly after the implementation of NAFTA, with the United States being the largest source of FDI in Mexico (Villarreal, 2016a).
NAFTA also has helped Mexico’s economy, but uncertainty is increasing regarding the future of the agreement. A study by the World Bank found that it is likely that NAFTA helped Mexico through a number of channels, including faster uptake of innovative technologies from the United States, with a probable positive impact on job creation and job quality. Moreover, the agreement doubtlessly reduced economic volatility and synchronised the business cycles of the United States, Canada and Mexico, making Mexico more prone to benefit from economic developments in the United States (Lederman, Maloney and Servén, 2005; Villarreal, 2016a). Hence, changes to the agreement could have the opposite effect. Although concrete actions have not taken place to date, the new US administration has expressed interest in renegotiating the agreement.
“Brexit” also fuels uncertainty
A lack of clarity regarding the United Kingdom’s announced exit from the EU, often referred to as “Brexit”, contributes to risk aversion around the world and could reduce the attractiveness of Latin America as an investment destination as investors exercise greater caution. Given this risk aversion, conditions for capital inflows to the region are likely to weaken (OECD/CAF/ECLAC, 2016). Nonetheless, trade links between the United Kingdom and Latin America are minor overall, with only 1% of the region’s exports destined to the United Kingdom (ECLAC, 2016a). The implications go beyond trade, however, and Brexit also may have contributed to the depreciation of several Latin American currencies since early 2015, particularly in Brazil and Colombia (OECD/CAF/ECLAC, 2016).
Chinese economic slowdown, coupled with persistently low commodity prices, is a risk
One the major risks for the future growth of Latin America economies is a Chinese hard landing, that is, an extreme slowdown in the Chinese economy. A significant decline in Chinese growth could threaten recovery in Latin America and keep the region in a recession for longer (Figure 3.5). In addition, China is Latin America’s third-largest export destination (de la Torre et al., 2015), accounting for 9% of the region’s exports in 2014. Latin America already has felt the effects of slower growth in China with the end of the commodities super cycle. Indeed, while the
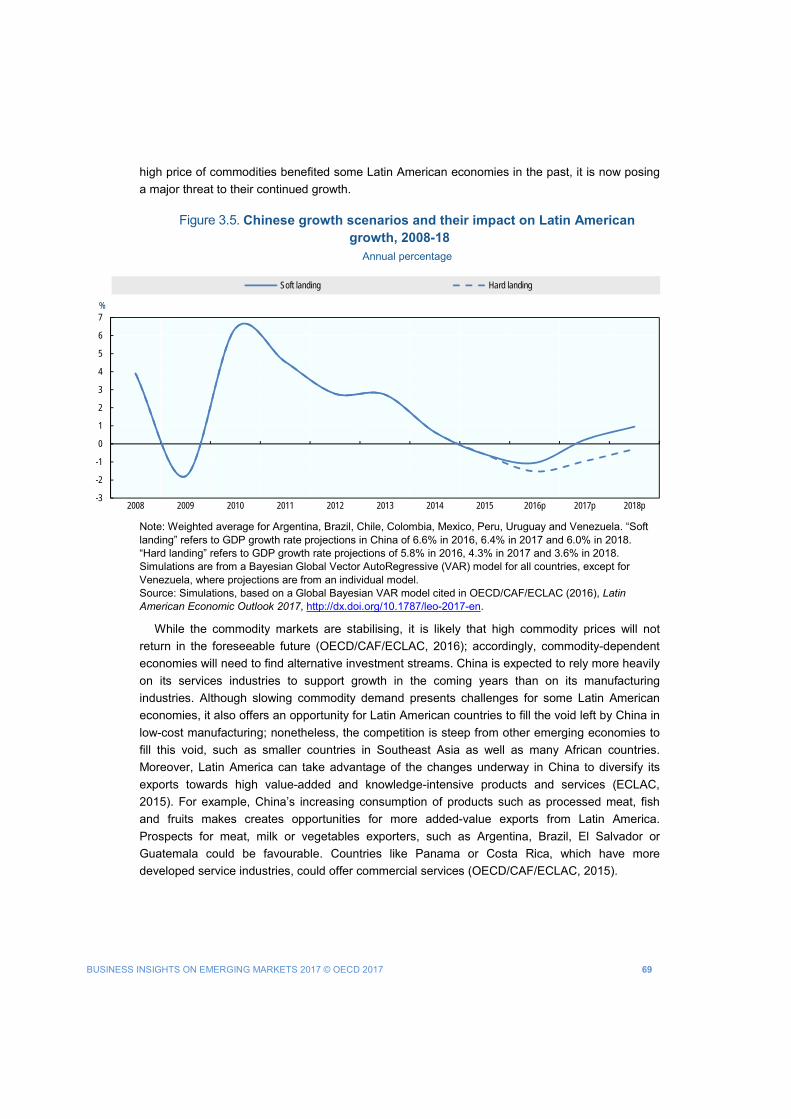
BUSINESS INSIGHTS ON EMERGING MARKETS 2017 © OECD 2017 69
high price of commodities benefited some Latin American economies in the past, it is now posing a major threat to their continued growth.
Figure 3.5. Chinese growth scenarios and their impact on Latin American growth, 2008-18
Annual percentage
Note: Weighted average for Argentina, Brazil, Chile, Colombia, Mexico, Peru, Uruguay and Venezuela. “Soft landing” refers to GDP growth rate projections in China of 6.6% in 2016, 6.4% in 2017 and 6.0% in 2018. “Hard landing” refers to GDP growth rate projections of 5.8% in 2016, 4.3% in 2017 and 3.6% in 2018. Simulations are from a Bayesian Global Vector AutoRegressive (VAR) model for all countries, except for Venezuela, where projections are from an individual model. Source: Simulations, based on a Global Bayesian VAR model cited in OECD/CAF/ECLAC (2016), Latin American Economic Outlook 2017, http://dx.doi.org/10.1787/leo-2017-en.
While the commodity markets are stabilising, it is likely that high commodity prices will not return in the foreseeable future (OECD/CAF/ECLAC, 2016); accordingly, commodity-dependent economies will need to find alternative investment streams. China is expected to rely more heavily on its services industries to support growth in the coming years than on its manufacturing industries. Although slowing commodity demand presents challenges for some Latin American economies, it also offers an opportunity for Latin American countries to fill the void left by China in low-cost manufacturing; nonetheless, the competition is steep from other emerging economies to fill this void, such as smaller countries in Southeast Asia as well as many African countries. Moreover, Latin America can take advantage of the changes underway in China to diversify its exports towards high value-added and knowledge-intensive products and services (ECLAC, 2015). For example, China’s increasing consumption of products such as processed meat, fish and fruits makes creates opportunities for more added-value exports from Latin America. Prospects for meat, milk or vegetables exporters, such as Argentina, Brazil, El Salvador or Guatemala could be favourable. Countries like Panama or Costa Rica, which have more developed service industries, could offer commercial services (OECD/CAF/ECLAC, 2015).
-3
-2
-1
0
1
2
3
4
5
6
7
2008 2009 2010 2011 2012 2013 2014 2015 2016p 2017p 2018p
%
Soft landing Hard landing
70 BUSINESS INSIGHTS ON EMERGING MARKETS 2017 © OECD 2017
An economic downturn could reverse social gains and threaten the middle class.
While Latin America has made a great deal of progress within the last 20 years, the current economic trends could put the most vulnerable populations of Latin America, including significant shares of the newer middle classes, at risk of falling back into poverty. An estimated 25-30 million people in Latin America and the Caribbean face a high risk of falling back into poverty, according to data from the United Nations Development Programme (UNDP, 2016). In terms of socio-economic progress, poverty has increased since 2013, with an estimated 29.2% of Latin Americans (175 million persons) living in poverty in 2015 (ECLAC, 2016d).
Growth of the consumer middle class will be limited. This economic weakness already is being felt in the labour markets. In Latin America, unemployment is rising, job quality is declining, wage growth is slowing and informality remains omnipresent (OECD/CAF/ECLAC, 2016). The economic slowdown has particularly affected the already vulnerable youth and female populations (OECD/CAF/ECLAC, 2016). For Latin America to continue building on the progress achieved over the last 20 years, the region will need to ensure that policies are in place that will boost productivity, develop skills, stimulate domestic demand and generate inclusive growth. These actions will contribute to increasing or at least sustaining fairness and well-being within the region in a period of low growth.
NEW PLAYERS AND OPPORTUNITIES TO ENCOURAGE INVESTMENTS IN THE REGION
In a context of low commodity prices and rising global economic uncertainty, investment and trade are essential to jumpstart growth in the region. This section highlights recent developments in investment from China and the region itself and trade relations in Latin America.
New players: China and “multilatinas”
Historically, investments in Latin America have been dominated by Europe and the United States. In recent years, however, China has taken a much more active investment role in Latin America. In parallel, “multilatinas”, or multinational firms of Latin American origin, are also emerging as important regional investors.
China is a key trade and investment partner in the region
China has become one of the main trading partners for several countries in the region, so any significant downturn in Chinese demand has consequences. Notwithstanding, Latin America’s engagement with China is uneven and tends to be concentrated in a few traditional commodity sectors for exports. Latin America exports raw materials and a few high-value products to China, while Latin American imports of Chinese products are dominated by manufactured goods such as domestic appliances, green technologies and textiles (OECD/CAF/ECLAC, 2015). Commodity exporters have increased their ties to China much faster than manufacturing exporters, which have remained more linked to value chains in the United States. These linkages also vary depending on the types of commodity exported, such as oil, minerals or agricultural goods (OECD/CAF/ECLAC, 2015). Commodity exports to China are concentrated in just a few products.
BUSINESS INSIGHTS ON EMERGING MARKETS 2017 © OECD 2017 71
For example, five commodities together accounted for 73% of the value of all regional sales to China in 2013. These products include copper ores and concentrates, refined copper, iron ores and concentrates, petroleum and soybeans (OECD/CAF/ECLAC, 2015). Additional discussion of the trade relations and value chain integration of Latin America and China can be found in this note’s section on private sector insights.
Multilatinas are also a force for investment in the region
Multilatinas are another important group of investors in the region and abroad. Multilatinas are Latin America-based firms that have expanded internationally, even though they often have remained largely focused on Latin America (Aguilar, Sardi Maldueño and Violin, 2015). Multilatinas began investing abroad in the 1990s, and investment surged in the 2000s (Blanco Estévez, 2015). An annual multilatina ranking is prepared by AméricaEconomía, a Latin American magazine. In the 2016 ranking, Mexichem, CEMEX, LATAM Airlines, JBS S.A. and Gruma topped the list (AméricaEconomía, 2016). Multilatinas operate at all stages of the value chain but have the largest presence in food and beverages, natural resources, chemicals, steelmaking, and manufacturing. Brazil, Mexico and Chile have the most multilatinas, and these firms often focus their investments in the region, the United States and Europe (Blanco Estévez, 2015). Internationalisation and diversification of sales were key factors in the 2016 ranking. Firms with greater diversification of revenues in the region and beyond have outperformed companies with more concentrated revenues (Almeida, 2016).
New opportunities through trade
Greater regional integration and expanded trade relations can be a driving force for growth. Efforts for bilateral, regional and global trade agreements are growing, but rising protectionism could threaten progress and momentum. In the face of these protectionist tendencies, a key challenge moving forward is to keep trade open within the region and increase intra-regional trade volumes.
Bilateral free trade agreements continue to expand
Countries in Latin America are using preferential trade agreements to expand trade relations. Sixty-eight preferential trade agreements involve at least one Latin American country, of which 32 are fully intra-regional agreements (OECD, 2016b). New agreements also are under discussion. Uruguay and Chile, for example, signed a free trade agreement (FTA) in October 2016. The expanding use of trade agreements is creating a complex web of regulations and standards. Larger regional trade agreements such as the Pacific Alliance can be a useful tool to consolidate and harmonise these agreements (OECD, 2016b).
The Pacific Alliance is advancing rapidly to further integrate the region
The Pacific Alliance has brought together Chile, Colombia, Mexico and Peru, and is a sign of a renewed effort in regional integration. Together, the four countries form an economic region that in 2015 represented 35% of Latin America’s nominal GDP and was home to 224 million people (Villarreal, 2016b). Since its formation in 2011, the Pacific Alliance has moved rapidly to foster greater economic integration, promote free trade and act as a platform for further integration with
72 BUSINESS INSIGHTS ON EMERGING MARKETS 2017 © OECD 2017
other foreign markets. The scope of the Pacific Alliance is deeper than other agreements such as the Trans-Pacific Partnership (TPP) as it goes a step further to include the free movement of people and stock market integration (Villarreal, 2016b).
The Pacific Alliance is prioritising linkages with Asia and building ties with new observers and members. This focus on interaction with the Asia-Pacific region distinguishes the Alliance from other regional platforms such as the Southern Common Market (Mercosur). The Alliance had attracted 49 observer states as of February 2017, including China, France, Germany, Spain, the United Kingdom, the United States and Turkey. Costa Rica and Panama also are candidates to become new members of the Alliance.
Mercosur and Pacific Alliance relations are showing new signs of potential alignment
Mercosur is a sub-regional trading bloc that was created in 1991 with Argentina, Brazil, Paraguay and Uruguay as founding members. Venezuela joined in 2012, and Bolivia is an associate member in the accession process. Mercosur aims to establish a common market. Although trade has increased significantly amongst Mercosur members since the creation of the trading bloc, intra-Mercosur trade has remained a small share of overall trade (Gomez Ramirez et al., 2016).
In a context of global and regional uncertainty, relations between the Pacific Alliance and Mercosur are showing signs of dynamism. Mercosur and the Pacific Alliance have been making efforts to collaborate since 2014 (D’Elia and Ramos, 2016). Momentum continued in 2016, and the change of leadership in Argentina has been supporting a close relationship, given President of Argentina Mauricio Macri’s vocal interest in further connections between Mercosur and the Pacific Alliance (Dinatale, 2016). In addition, Argentina became an official observer to the Pacific Alliance in June 2016, and Paraguay and Uruguay already had observer status (ICTSD, 2016).
The EU-Mercosur trade deal is back on the table
Renewed momentum for the long-standing negotiations for an FTA between the EU and Mercosur is attracting attention. EU-Mercosur trade in goods exceeded EUR 88 billion in 2015 (European Commission, 2016). Mercosur and the EU have been negotiating a bi-regional FTA since 1999. Negotiations were suspended in 2004 due to differences regarding trade in agriculture, services and the opening up of public procurement (Gomez Ramirez et al., 2016). Negotiations were re-launched in 2010 with the aim of setting up a comprehensive agreement that would include industrial and agricultural trade, improve customs and trade facilitation, and reduce technical trade barriers. Ten negotiation rounds took place before they paused again in 2012. In May 2016, for the first time since the 2010 re-launch, the EU and Mercosur exchanged offers covering, amongst other areas, market access for goods, services and public procurement (European Commission, 2017a).
EU-Mexico trade relations also are being closely watched
Renewed efforts continue to improve trade relations between the EU and Mexico, which since 1997 have fallen under an Economic Partnership, Political Coordination and Co-operation Agreement. The EU is a considerable market for Mexico. The EU is Mexico’s third-largest trading partner after the United States and China, and was Mexico’s second-largest export market after
BUSINESS INSIGHTS ON EMERGING MARKETS 2017 © OECD 2017 73
the United States in 2015 (European Commission, 2017b). In May 2016, the EU and Mexico began negotiations to modernise their trade relations. In 2017, to offset the “worrying rise of protectionism around the globe”, the EU and Mexico agreed to accelerate negotiations (European Commission, 2017c).
TOWARDS BETTER PUBLIC POLICIES TO PROMOTE EFFECTIVE INVESTMENT FOR DEVELOPMENT
Governments have a key role to play in promoting economic diversification, boosting productivity and improving competitiveness, but they are facing an increasingly challenging external context of lower overall global growth, weak trade volumes and rising protectionism. This section highlights recent public policy actions to support an increase in private investment in the region.
Governments are stepping up efforts to diversify exports and promote investment
In a period of economic downturn and low commodity prices, governments such as those of Chile, Peru and Argentina are focusing on investment promotion and export diversification. In 2015, Chile passed a new Framework Law for Foreign Investment, which provides a legal and institutional framework for investment promotion in Chile (InvestChile, 2015). The new approach has a more proactive investment strategy and the investment promotion agency has been modified to facilitate further foreign investment (OECD, 2015a). In 2015, Chile also launched its new investment promotion agency, InvestChile, which was to focus on priority sectors to attract FDI, notably: mining services, higher-value food products, sustainable tourism, energy and logistics infrastructure, and technological services (InvestChile, 2016). In Peru, the Ministry of Foreign Trade and Tourism (MINCETUR) launched the National Strategic Export Plan (PENX 2025) in 2015. PENX 2025 is part of the larger PENX programme, which focuses on internationalising firms and diversifying markets, diversifying exports, facilitating trade, and promoting an “export culture” (MINCETUR, 2015). Although Argentina experienced a recession in 2016, the government has stepped up efforts to enact reforms to remove restrictions on trade and capital mobility, increase transparency, and improve relations with creditors. As these reforms take effect, investment is expected to rebound and improve growth in 2017 and 2018 (OECD, 2016a).
Greater promotion of innovation is needed
The region needs increased investment in innovation to support productivity improvements and diversify the economies towards more value-added sectors and new technologies. Latin American governments and companies invest much less in R&D compared to OECD economies (Table 3.2).
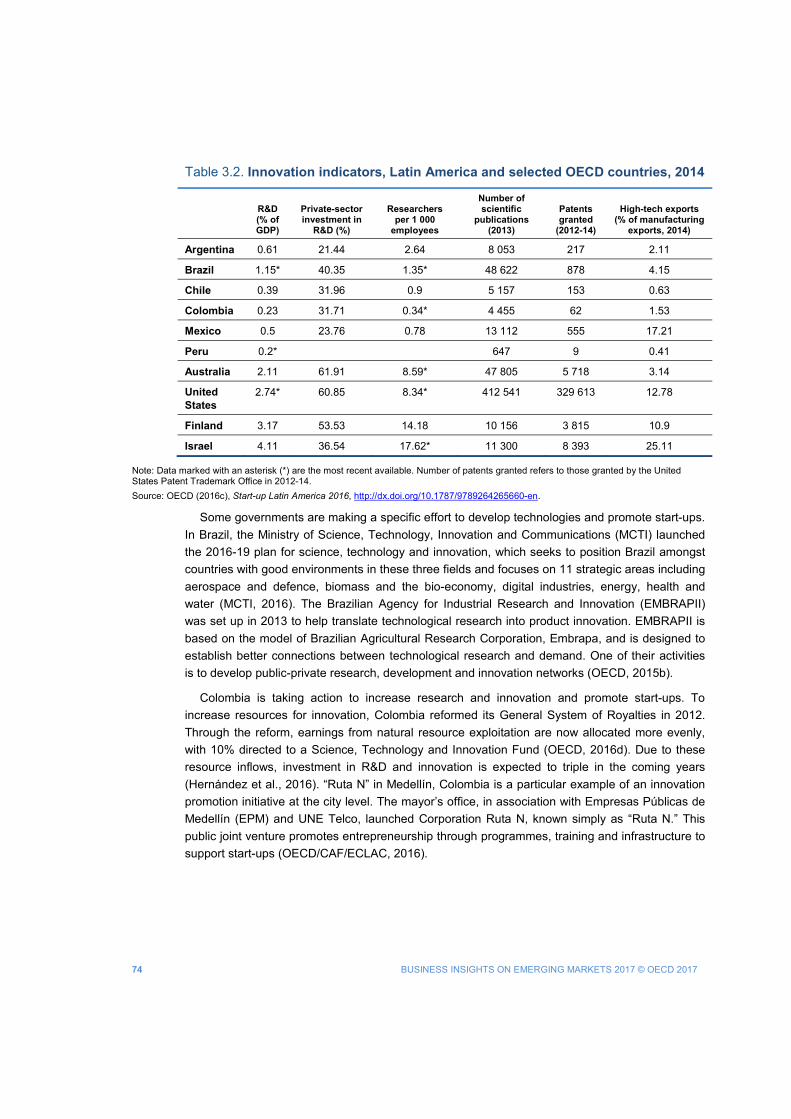
74 BUSINESS INSIGHTS ON EMERGING MARKETS 2017 © OECD 2017
Table 3.2. Innovation indicators, Latin America and selected OECD countries, 2014
R&D (% of GDP)
Private-sector investment in
R&D (%)
Researchers per 1 000
employees
Number of scientific
publications (2013)
Patents granted
(2012-14)
High-tech exports (% of manufacturing
exports, 2014)
Argentina 0.61 21.44 2.64 8 053 217 2.11
Brazil 1.15* 40.35 1.35* 48 622 878 4.15
Chile 0.39 31.96 0.9 5 157 153 0.63
Colombia 0.23 31.71 0.34* 4 455 62 1.53
Mexico 0.5 23.76 0.78 13 112 555 17.21
Peru 0.2* 647 9 0.41
Australia 2.11 61.91 8.59* 47 805 5 718 3.14
United States
2.74* 60.85 8.34* 412 541 329 613 12.78
Finland 3.17 53.53 14.18 10 156 3 815 10.9
Israel 4.11 36.54 17.62* 11 300 8 393 25.11
Note: Data marked with an asterisk (*) are the most recent available. Number of patents granted refers to those granted by the United States Patent Trademark Office in 2012-14. Source: OECD (2016c), Start-up Latin America 2016, http://dx.doi.org/10.1787/9789264265660-en.
Some governments are making a specific effort to develop technologies and promote start-ups. In Brazil, the Ministry of Science, Technology, Innovation and Communications (MCTI) launched the 2016-19 plan for science, technology and innovation, which seeks to position Brazil amongst countries with good environments in these three fields and focuses on 11 strategic areas including aerospace and defence, biomass and the bio-economy, digital industries, energy, health and water (MCTI, 2016). The Brazilian Agency for Industrial Research and Innovation (EMBRAPII) was set up in 2013 to help translate technological research into product innovation. EMBRAPII is based on the model of Brazilian Agricultural Research Corporation, Embrapa, and is designed to establish better connections between technological research and demand. One of their activities is to develop public-private research, development and innovation networks (OECD, 2015b).
Colombia is taking action to increase research and innovation and promote start-ups. To increase resources for innovation, Colombia reformed its General System of Royalties in 2012. Through the reform, earnings from natural resource exploitation are now allocated more evenly, with 10% directed to a Science, Technology and Innovation Fund (OECD, 2016d). Due to these resource inflows, investment in R&D and innovation is expected to triple in the coming years (Hernández et al., 2016). “Ruta N” in Medellín, Colombia is a particular example of an innovation promotion initiative at the city level. The mayor’s office, in association with Empresas Públicas de Medellín (EPM) and UNE Telco, launched Corporation Ruta N, known simply as “Ruta N.” This public joint venture promotes entrepreneurship through programmes, training and infrastructure to support start-ups (OECD/CAF/ECLAC, 2016).
BUSINESS INSIGHTS ON EMERGING MARKETS 2017 © OECD 2017 75
Chile is developing strategic industries
Chile is making particular efforts to develop strategic programmes (Programas Estratégicos) to promote co-ordination between the public and private sectors in high-growth industries to encourage the emergence of clusters (OECD, 2015a). These industries include renewable energy, food, advanced manufacturing and tourism. The OECD has been cautious on cluster-based programmes as they can be distortionary. Focusing on specific industries can, however, be a useful strategy if this includes co-operation between industry and science, and promotes dialogue between government and the private sector as well as between companies (Dougherty, 2015).
The OECD has highlighted that governments can modernise traditional industrial policy, which has often focused on picking specific industries or subsidising particular markets, by adopting a broader or more horizontal approach that can improve the environment for a wider range of investments (Warwick, 2013). Initial analysis of Chile’s programme indicates a similar approach (OECD, 2015a). Some of the downsides of traditional industrial policy could be reduced through a “soft” industrial policy that encourages interaction between government and industry players to define priorities (Warwick, 2013).
Improving productivity remains a pressing challenge
Faced with slowing economic growth, policies to improve productivity are crucial for Latin America. In 2016 the OECD launched a Latin America and Caribbean Regional Programme to support reforms with three key regional priorities of increasing productivity, advancing social inclusion, and strengthening institutions and governance. Investments in cross-cutting areas that can enable productivity gains such as infrastructure, education, tax policy and anti-corruption are crucial. A number of areas exist where public polices can facilitate private sector investment that can support productivity through, for example, competition policies and investments in innovation and the digital economy (OECD/IDB, 2016a). Governments can also establish public institutions dedicated to finding ways to improve productivity through policy design, evaluation and reform. Since 2013, Mexico and Chile have both established Productivity Commissions (OECD/IDB, 2016a) and Chile launched a specific “Productivity Agenda” for the 2014-18 period.
PRIVATE-SECTOR INSIGHTS ON REVIVING INVESTMENT Despite the challenging macroeconomic context, firms still see opportunities in the region.
Companies see greater trade integration, upgrading and diversifying industries, and matching skills with labour market needs as the most important priorities in the region.
Trade integration holds promise
Despite its importance and optimism for future progress, trade integration remains persistently low in Latin America. Companies are confident that further trade integration can be a way to diversify export markets in a period of economic slowdown. The Pacific Alliance was highlighted as a recent initiative for trade integration that could support investment and the deepening of value chains in the region. Businesses also see strong momentum for a trade agreement between Mercosur and the European Union. Nonetheless, infrastructure improvements are needed to
76 BUSINESS INSIGHTS ON EMERGING MARKETS 2017 © OECD 2017
support trade expansion, and companies underscored reducing transport costs and improving logistics networks as indispensable to boosting trade and development.
Companies see the expansion of free trade agreements as a way to diversify export markets
Firms highlighted the case of Chile, which has engaged in many bilateral FTAs as a useful tool to expand and diversify export markets. Chile has more than 20 bilateral free trade or preferential trade agreements in force (OAS, 2016), which have helped to diversify its exports. Chile’s 2014 exports were dominated by Asia (China, 25%; Japan, 10%; and Korea, 6.3%), the United States (12%) and Brazil (5.3%) (MIT, 2016). This contrasts with Argentina, which has less FTAs in place and where trade in 2014 focused on Mercosur countries, notably Brazil (20%), Venezuela (2.9%), Uruguay (2.1%) and Paraguay (2%). While China (6.5%) and the United States (6%) are key trading partners for Argentina, they play a much less significant role than in the Chilean case (MIT, 2016).
Optimism continues that the Pacific Alliance will support business opportunities
The Pacific Alliance is perceived by companies attending EMnet events as pragmatic, dynamic and supportive of business. Firms consider the Pacific Alliance committed to learning from best practices. They appreciate the presence of a Business Council within the Pacific Alliance. Created in 2013, the Business Council of the Pacific Alliance is composed of the business associations from the four Pacific Alliance member countries. It provides recommendations regarding the progress of economic integration initiatives and suggests areas for future co-operation. The Business Council can provide “real world” feedback, facilitate integration and promote dialogue. As the Pacific Alliance advances its integration efforts, firms see it as supportive of growing participation in global value chains and as useful for increasing intra-regional trade in Latin America. Pacific Alliance members have harmonised their rules of origin for trade to allow for the “accumulation” of origin, which can support the development of regional value chains and encourage exports (Marczak and George, 2016). Accumulation of origin can facilitate trade as it allows for inputs from a member country to be used in another member country to be considered as domestic input. It can therefore help to improve regional trade integration and establish more backward linkages, i.e. using inputs from members to produce exports.
Businesses welcome the negotiations of the EU-Mercosur Free Trade Agreement
Despite years of negotiations and many setbacks, firms are strongly optimistic that the conditions are now more favourable to achieve an EU-Mercosur Free Trade Agreement. In April 2016, the EU and Mercosur exchanged offers for the first time since 2004 regarding market access, with negotiations following in September 2016. The momentum is expected to continue at the next round of negotiations, which will take place in Buenos Aires in March 2017. Companies see a new commitment to business and open trade in Brazil and Argentina. The EU is the main trading partner for Mercosur and represented 21% of Mercosur’s total trade in 2015 (European Commission, 2017a).
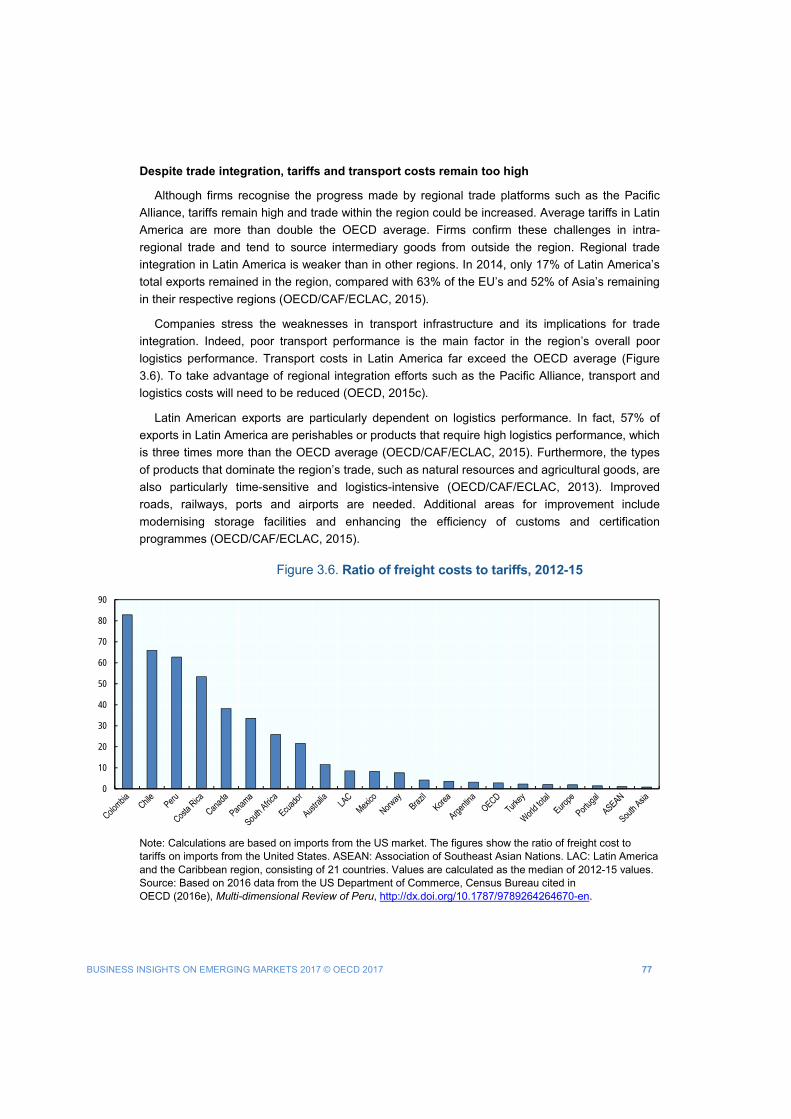
BUSINESS INSIGHTS ON EMERGING MARKETS 2017 © OECD 2017 77
Despite trade integration, tariffs and transport costs remain too high
Although firms recognise the progress made by regional trade platforms such as the Pacific Alliance, tariffs remain high and trade within the region could be increased. Average tariffs in Latin America are more than double the OECD average. Firms confirm these challenges in intra-regional trade and tend to source intermediary goods from outside the region. Regional trade integration in Latin America is weaker than in other regions. In 2014, only 17% of Latin America’s total exports remained in the region, compared with 63% of the EU’s and 52% of Asia’s remaining in their respective regions (OECD/CAF/ECLAC, 2015).
Companies stress the weaknesses in transport infrastructure and its implications for trade integration. Indeed, poor transport performance is the main factor in the region’s overall poor logistics performance. Transport costs in Latin America far exceed the OECD average (Figure 3.6). To take advantage of regional integration efforts such as the Pacific Alliance, transport and logistics costs will need to be reduced (OECD, 2015c).
Latin American exports are particularly dependent on logistics performance. In fact, 57% of exports in Latin America are perishables or products that require high logistics performance, which is three times more than the OECD average (OECD/CAF/ECLAC, 2015). Furthermore, the types of products that dominate the region’s trade, such as natural resources and agricultural goods, are also particularly time-sensitive and logistics-intensive (OECD/CAF/ECLAC, 2013). Improved roads, railways, ports and airports are needed. Additional areas for improvement include modernising storage facilities and enhancing the efficiency of customs and certification programmes (OECD/CAF/ECLAC, 2015).
Figure 3.6. Ratio of freight costs to tariffs, 2012-15
Note: Calculations are based on imports from the US market. The figures show the ratio of freight cost to tariffs on imports from the United States. ASEAN: Association of Southeast Asian Nations. LAC: Latin America and the Caribbean region, consisting of 21 countries. Values are calculated as the median of 2012-15 values. Source: Based on 2016 data from the US Department of Commerce, Census Bureau cited in OECD (2016e), Multi-dimensional Review of Peru, http://dx.doi.org/10.1787/9789264264670-en.
0
10
20
30
40
50
60
70
80
90
78 BUSINESS INSIGHTS ON EMERGING MARKETS 2017 © OECD 2017
Upgrading and innovating to move up value chains
Firms find that a key challenge in Latin America lies in how to transform the region into a production base and go beyond simply a consumption market. To accomplish this, the region will need to expand and diversify production as well as increase the amount of higher value goods and services. Latin America already is home to globally leading companies in certain sectors such as the Brazilian firm Embraer(airplanes), and the Mexican firm Softtek ( IT services provider).
Latin America is faced with a challenging external environment and new signs of growing global protectionism. Companies feel that during the boom years of high commodity prices, Latin American countries did not take advantage of windfalls to invest in productivity improvements and in diversifying the economy. During the EMnet meeting, firms stressed that opportunities still exist in natural resources and commodity sectors, but they are increasingly found in niche or higher-value products. Greater integration into global value chains (GVCs) and more investment in innovation also are seen as tools to upgrade and diversify.
Furthermore, tax systems that treat domestic and international investors equally also can support the expansion and deepening of value chains in the region. In particular, firms have noted that tax incentives to domestic industries can inadvertently harm prospects for expansion, because wherever tax systems provide particular support for domestic producers versus their foreign competitors, the incentive is little to go beyond national borders. In addition, formalisation of production and trade is often required, as the continued prevalence of untaxed sales or imports does not support the emergence of legitimate businesses that can help grow the domestic economy and later expand it internationally.
Opportunities remain in the resources sector despite the commodity slowdown
Despite falls in commodity prices, firms argued during the EMnet meeting that opportunities are still promising for investment in traditional Latin American resource sectors. Latin America is home to vast mineral reserves in copper, iron, silver and tin (Perotti and Coviello, 2015). Prices for oil as well as non-energy commodity prices continued to decline in 2016, though the latter experienced a less severe price reduction than the former (OECD/CAF/ECLAC, 2016).
In this context, lithium and potash were highlighted as commodities with favourable prospects in certain locations. Lithium is used in batteries for electric vehicles, power storage and portable electronics. Demand is expected to grow significantly, and South America is home to substantial lithium resources. It is estimated that the region, notably Argentina, Bolivia and Chile, holds half of the world’s identified available resources (O’Brien and Nickel, 2016). Resource developers highlighted particular lithium mining opportunities in Argentina. Investment opportunities for potash were also highlighted. Notably, Brazil has domestic potash endowments but imports 90% of its potash requirements (Brazil Potash Corp, 2015). According to the Food and Agriculture Organization, global demand for potash is projected to grow by 2.5% annually between 2015 and 2019 (FAO, 2016a). Developing potash resources in Brazil is an effort to promote self-sufficiency over the long term, and firms find this to be a potentially attractive investment opportunity that promotes the development of national resource endowments.
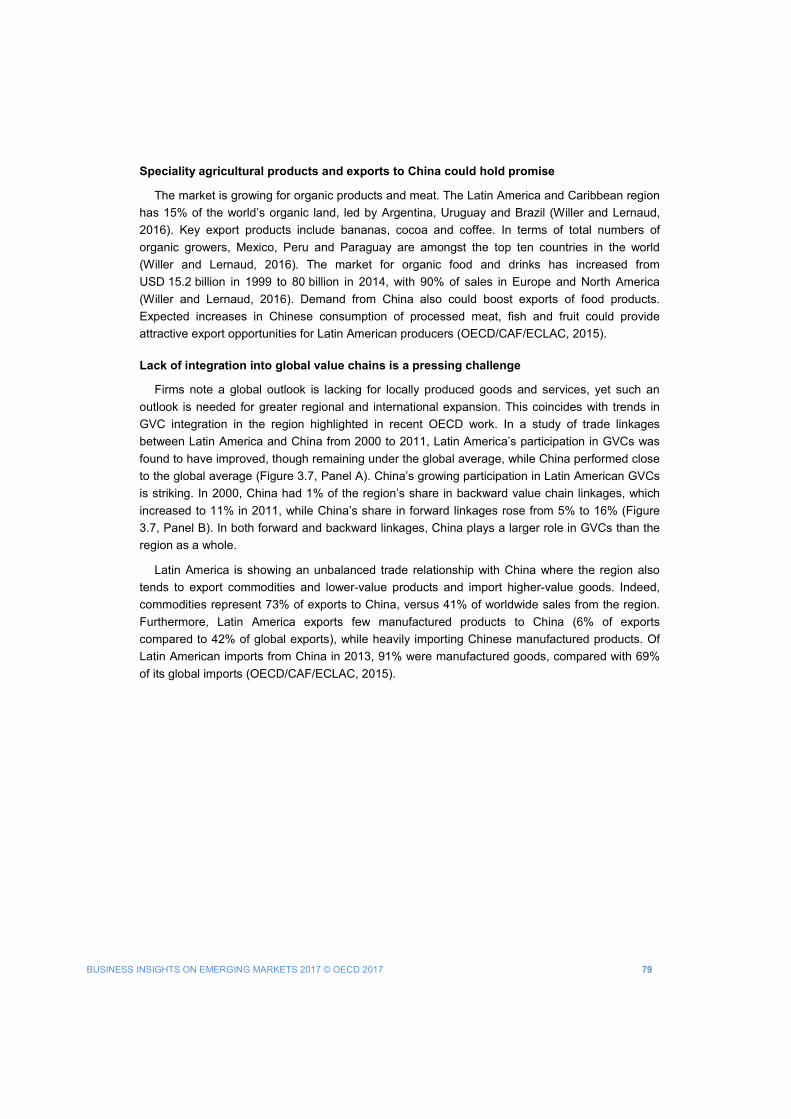
BUSINESS INSIGHTS ON EMERGING MARKETS 2017 © OECD 2017 79
Speciality agricultural products and exports to China could hold promise
The market is growing for organic products and meat. The Latin America and Caribbean region has 15% of the world’s organic land, led by Argentina, Uruguay and Brazil (Willer and Lernaud, 2016). Key export products include bananas, cocoa and coffee. In terms of total numbers of organic growers, Mexico, Peru and Paraguay are amongst the top ten countries in the world (Willer and Lernaud, 2016). The market for organic food and drinks has increased from USD 15.2 billion in 1999 to 80 billion in 2014, with 90% of sales in Europe and North America (Willer and Lernaud, 2016). Demand from China also could boost exports of food products. Expected increases in Chinese consumption of processed meat, fish and fruit could provide attractive export opportunities for Latin American producers (OECD/CAF/ECLAC, 2015).
Lack of integration into global value chains is a pressing challenge
Firms note a global outlook is lacking for locally produced goods and services, yet such an outlook is needed for greater regional and international expansion. This coincides with trends in GVC integration in the region highlighted in recent OECD work. In a study of trade linkages between Latin America and China from 2000 to 2011, Latin America’s participation in GVCs was found to have improved, though remaining under the global average, while China performed close to the global average (Figure 3.7, Panel A). China’s growing participation in Latin American GVCs is striking. In 2000, China had 1% of the region’s share in backward value chain linkages, which increased to 11% in 2011, while China’s share in forward linkages rose from 5% to 16% (Figure 3.7, Panel B). In both forward and backward linkages, China plays a larger role in GVCs than the region as a whole.
Latin America is showing an unbalanced trade relationship with China where the region also tends to export commodities and lower-value products and import higher-value goods. Indeed, commodities represent 73% of exports to China, versus 41% of worldwide sales from the region. Furthermore, Latin America exports few manufactured products to China (6% of exports compared to 42% of global exports), while heavily importing Chinese manufactured products. Of Latin American imports from China in 2013, 91% were manufactured goods, compared with 69% of its global imports (OECD/CAF/ECLAC, 2015).
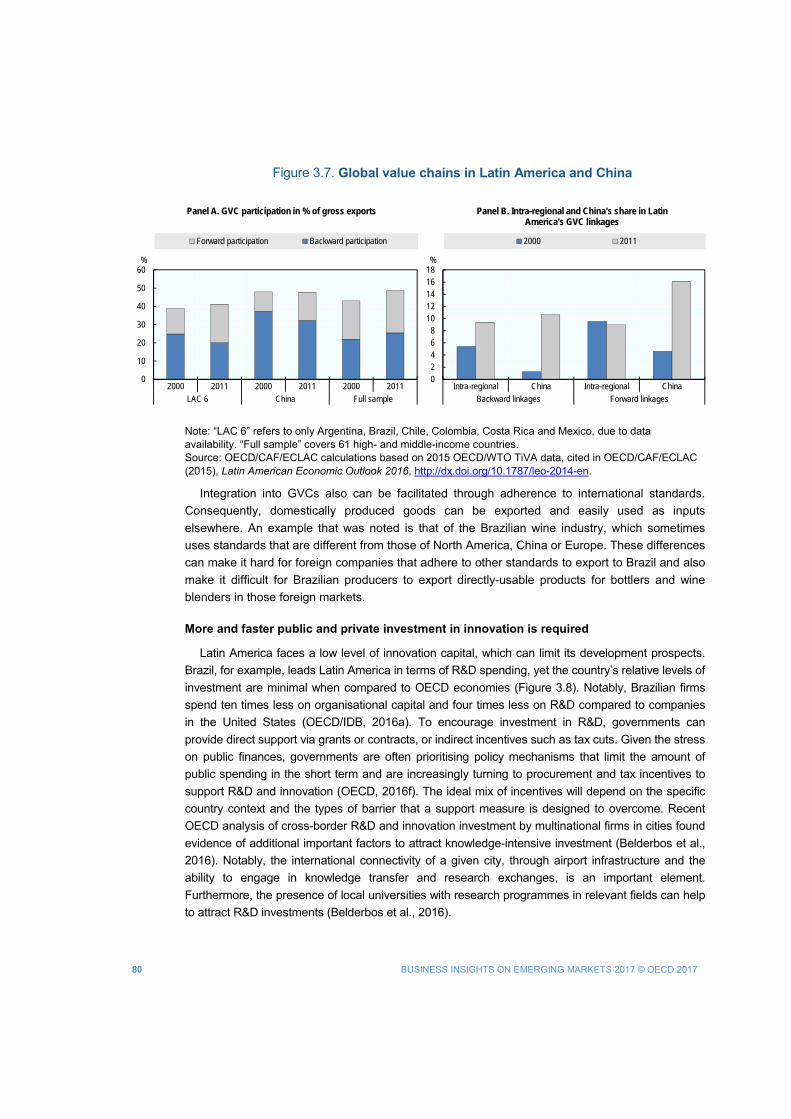
80 BUSINESS INSIGHTS ON EMERGING MARKETS 2017 © OECD 2017
Figure 3.7. Global value chains in Latin America and China
Note: “LAC 6” refers to only Argentina, Brazil, Chile, Colombia, Costa Rica and Mexico, due to data availability. “Full sample” covers 61 high- and middle-income countries. Source: OECD/CAF/ECLAC calculations based on 2015 OECD/WTO TiVA data, cited in OECD/CAF/ECLAC (2015), Latin American Economic Outlook 2016, http://dx.doi.org/10.1787/leo-2014-en.
Integration into GVCs also can be facilitated through adherence to international standards. Consequently, domestically produced goods can be exported and easily used as inputs elsewhere. An example that was noted is that of the Brazilian wine industry, which sometimes uses standards that are different from those of North America, China or Europe. These differences can make it hard for foreign companies that adhere to other standards to export to Brazil and also make it difficult for Brazilian producers to export directly-usable products for bottlers and wine blenders in those foreign markets.
More and faster public and private investment in innovation is required
Latin America faces a low level of innovation capital, which can limit its development prospects. Brazil, for example, leads Latin America in terms of R&D spending, yet the country’s relative levels of investment are minimal when compared to OECD economies (Figure 3.8). Notably, Brazilian firms spend ten times less on organisational capital and four times less on R&D compared to companies in the United States (OECD/IDB, 2016a). To encourage investment in R&D, governments can provide direct support via grants or contracts, or indirect incentives such as tax cuts. Given the stress on public finances, governments are often prioritising policy mechanisms that limit the amount of public spending in the short term and are increasingly turning to procurement and tax incentives to support R&D and innovation (OECD, 2016f). The ideal mix of incentives will depend on the specific country context and the types of barrier that a support measure is designed to overcome. Recent OECD analysis of cross-border R&D and innovation investment by multinational firms in cities found evidence of additional important factors to attract knowledge-intensive investment (Belderbos et al., 2016). Notably, the international connectivity of a given city, through airport infrastructure and the ability to engage in knowledge transfer and research exchanges, is an important element. Furthermore, the presence of local universities with research programmes in relevant fields can help to attract R&D investments (Belderbos et al., 2016).
0
10
20
30
40
50
60
2000 2011 2000 2011 2000 2011LAC 6 China Full sample
%
Panel A. GVC participation in % of gross exports
Forward participation Backward participation
02468
1012141618
Intra-regional China Intra-regional ChinaBackward linkages Forward linkages
%
Panel B. Intra-regional and China's share in Latin America's GVC linkages
2000 2011
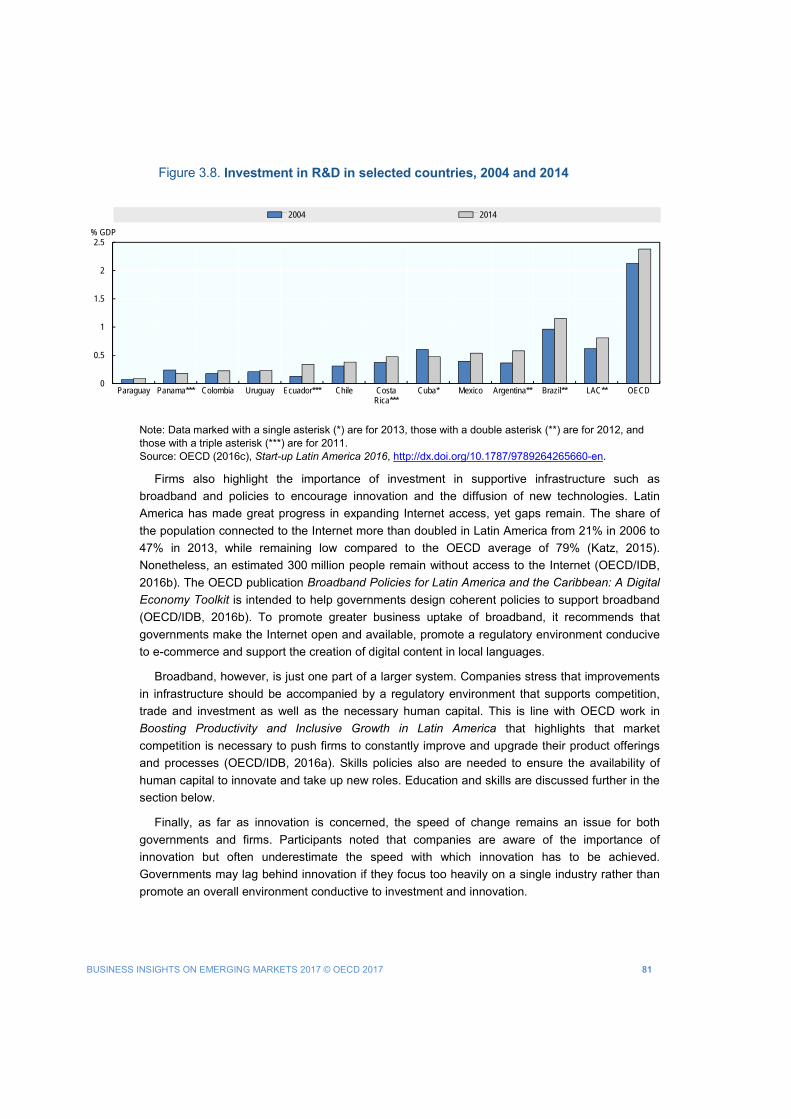
BUSINESS INSIGHTS ON EMERGING MARKETS 2017 © OECD 2017 81
Figure 3.8. Investment in R&D in selected countries, 2004 and 2014
Note: Data marked with a single asterisk (*) are for 2013, those with a double asterisk (**) are for 2012, and those with a triple asterisk (***) are for 2011. Source: OECD (2016c), Start-up Latin America 2016, http://dx.doi.org/10.1787/9789264265660-en.
Firms also highlight the importance of investment in supportive infrastructure such as broadband and policies to encourage innovation and the diffusion of new technologies. Latin America has made great progress in expanding Internet access, yet gaps remain. The share of the population connected to the Internet more than doubled in Latin America from 21% in 2006 to 47% in 2013, while remaining low compared to the OECD average of 79% (Katz, 2015). Nonetheless, an estimated 300 million people remain without access to the Internet (OECD/IDB, 2016b). The OECD publication Broadband Policies for Latin America and the Caribbean: A Digital Economy Toolkit is intended to help governments design coherent policies to support broadband (OECD/IDB, 2016b). To promote greater business uptake of broadband, it recommends that governments make the Internet open and available, promote a regulatory environment conducive to e-commerce and support the creation of digital content in local languages.
Broadband, however, is just one part of a larger system. Companies stress that improvements in infrastructure should be accompanied by a regulatory environment that supports competition, trade and investment as well as the necessary human capital. This is line with OECD work in Boosting Productivity and Inclusive Growth in Latin America that highlights that market competition is necessary to push firms to constantly improve and upgrade their product offerings and processes (OECD/IDB, 2016a). Skills policies also are needed to ensure the availability of human capital to innovate and take up new roles. Education and skills are discussed further in the section below.
Finally, as far as innovation is concerned, the speed of change remains an issue for both governments and firms. Participants noted that companies are aware of the importance of innovation but often underestimate the speed with which innovation has to be achieved. Governments may lag behind innovation if they focus too heavily on a single industry rather than promote an overall environment conductive to investment and innovation.
0
0.5
1
1.5
2
2.5
Paraguay Panama*** Colombia Uruguay Ecuador*** Chile CostaRica***
Cuba* Mexico Argentina** Brazil** LAC** OECD
% GDP
2004 2014
82 BUSINESS INSIGHTS ON EMERGING MARKETS 2017 © OECD 2017
Firm-level innovation is happening at all stages of the value chain
Companies cautioned against taking an overly narrow view of innovation to reflect only high-tech companies in Latin America. They pointed to business strategies to promote innovation by promoting exports as well as by expanding internationally, a strategy highlighted by EMnet participants. By expanding outside of home markets, companies are able to learn and innovate in their processes within new contexts. Firms can innovate at any stage of the value chain and often do so in specific processes within traditional industries. For example, in 2014 the French tire company Michelin acquired Sascar, a Brazilian firm specialised in digital management of trucking fleets. This acquisition strengthened Michelin’s capabilities in connectivity platforms, known as telematics, for trucks (Michelin, 2014). In Chile, the Strategic Programmes launched in 2015 offer technological roadmaps with the aim of improving productivity and competitiveness in traditional sectors such as mining and logistics, in addition to newer fields such as solar energy and information and communications technology products (OECD, 2015a).
Skills and education can support regional development and diversification
A closer relationship should be formed between universities and businesses
Companies stressed the importance of partnerships and alliances between the business community and universities. Overall, observers pointed to a general misunderstanding or underestimation of the relevance of the former to the latter and vice versa. In particular, academia will place less importance on the profitability of a potential innovation and focus less on marketing its advances. Furthermore, businesses may not prioritise R&D until they are in urgent need of a new product or solution. Building partnerships and alliances to communicate respective advances and future needs can help both businesses and universities move forward.
Firms are already taking steps to build partnerships with universities. For example, French electricity firm Schneider Electric formed a partnership with the French Ministry for National Education, Higher Education and Research and the Escuela Tecnológica Instituto Técnico Central (ETITC) in Colombia. The partnership will establish a training centre in Colombia to enhance skills and promote knowledge sharing in the energy field (Schneider Electric, 2015). In addition, as part of their collaboration agreement with the National Autonomous University of Mexico (UNAM), the Chinese telecommunications company Huawei is set to train and certify students and professors in new technologies (Huawei, 2014).
Developing a more flexible skill set rather than promoting specific careers could be useful
Technology is changing the way we work, the types of jobs that humans will do and the needed skills. For example, fewer employees are required in some traditional sectors and professions that have been automated, such as in certain customer services. The private sector cannot necessarily predict what jobs they will hire for in the future, but they can often estimate what types of skills will be important.
English language skills, emotional intelligence and the ability to work with new technologies will be needed for future jobs. Companies see a role for governments to support a more flexible development of skills rather than a narrow focus on specific professions that may lose their relevance in the future.
BUSINESS INSIGHTS ON EMERGING MARKETS 2017 © OECD 2017 83
Latin America must not forget the importance of productive development policies and of aligning skills with these policies
Companies stressed that Latin America still needs to do more to develop clear long-term productive development policies and promote relevant skills. While discussion of the digital economy is increasing, firms emphasised the importance of promoting industrial development (e.g. manufacturing and services) in parallel. Furthermore, the supply and demand of skills are often mismatched. Firms noted that skills assessments are often conducted after a policy is createdd, rather than including analysis of skill endowments and educational trends in the design-phase. This lack of consideration can result in industrial policies that will be difficult to implement as they are incompatible with available skills.
Business implications of Brazil’s economic downturn and political instability
At the EMnet Latin America meeting in June 2016, the economic situation in Brazil was a key concern and core topic of discussion. Although the economic and political instability in Brazil was being watched closely, prospects still remained for both short- and long-term investors. In addition to the overall global economic downturn and persistent declines in commodity prices, currency depreciations and heavily dollarised debt are straining corporations and financial services companies. The political crisis also was highlighting the importance of reducing corruption. In this context, Brazil’s instability was creating opportunities for mergers and acquisitions.
Declines in major Brazilian firms, which were major drivers of investment, are worrying for investors
Brazilian firms are cutting investment plans in response to the economic downturn. Major firms such as Petrobras have made significant cuts to their investment plans and outlook. Petrobras, Brazil’s state-owned oil company, accounts for a significant share of national investment and concern is growing regarding the ramifications of the slowdown on the company’s investment plans. In 2016, Petrobras further downgraded its investment plans (Petrobras, 2016). Petrobras’ investments support a wide range of supplier and construction companies. For example, the Brazilian oil-rig operator Sete Brasil Participações filed for bankruptcy protection in April 2016 with BRL 18 billion (Brazil reales), or approximately USD 5.1 billion, in liabilities. Petrobras was Sete’s only client, and it cut the number of rigs it had planned to lease from Sete significantly (Marcelino, 2016).
Despite the crisis, capital flows into Brazil and acquisition opportunities continue
Given the challenging economic environment, many firms are selling assets to reduce debt during this period of uncertainty. For EMnet participants, the situation is not all negative. For example, the slowdown offers an opportunity to acquire and redevelop assets from firms that are deleveraging; Petrobras and Vale alone are expected to sell as much as USD 20 billion in assets to reduce debt (Lewis and Jelmayer, 2016). Oi, one of Brazil’s major telephone operators, filed for bankruptcy protection in June 2016 with BRL 65 billion (approximately USD 19 billion) in debt. This is the largest bankruptcy filing on record for Brazil (Pearson, 2016). Many other local and international firms are restructuring, such as the construction and engineering conglomerate OAS and Shree Renuka do Brasil Participações Ltda, the Brazilian subsidiary of the Indian sugar
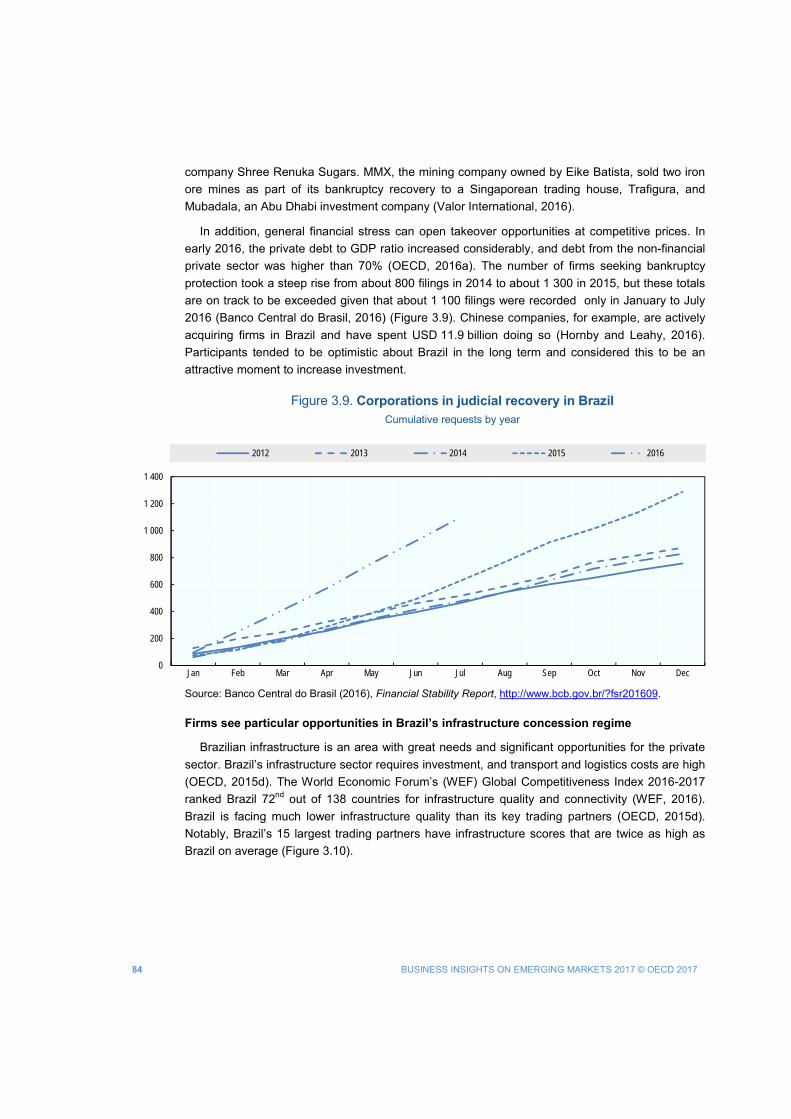
84 BUSINESS INSIGHTS ON EMERGING MARKETS 2017 © OECD 2017
company Shree Renuka Sugars. MMX, the mining company owned by Eike Batista, sold two iron ore mines as part of its bankruptcy recovery to a Singaporean trading house, Trafigura, and Mubadala, an Abu Dhabi investment company (Valor International, 2016).
In addition, general financial stress can open takeover opportunities at competitive prices. In early 2016, the private debt to GDP ratio increased considerably, and debt from the non-financial private sector was higher than 70% (OECD, 2016a). The number of firms seeking bankruptcy protection took a steep rise from about 800 filings in 2014 to about 1 300 in 2015, but these totals are on track to be exceeded given that about 1 100 filings were recorded only in January to July 2016 (Banco Central do Brasil, 2016) (Figure 3.9). Chinese companies, for example, are actively acquiring firms in Brazil and have spent USD 11.9 billion doing so (Hornby and Leahy, 2016). Participants tended to be optimistic about Brazil in the long term and considered this to be an attractive moment to increase investment.
Figure 3.9. Corporations in judicial recovery in Brazil Cumulative requests by year
Source: Banco Central do Brasil (2016), Financial Stability Report, http://www.bcb.gov.br/?fsr201609.
Firms see particular opportunities in Brazil’s infrastructure concession regime
Brazilian infrastructure is an area with great needs and significant opportunities for the private sector. Brazil’s infrastructure sector requires investment, and transport and logistics costs are high (OECD, 2015d). The World Economic Forum’s (WEF) Global Competitiveness Index 2016-2017 ranked Brazil 72nd out of 138 countries for infrastructure quality and connectivity (WEF, 2016). Brazil is facing much lower infrastructure quality than its key trading partners (OECD, 2015d). Notably, Brazil’s 15 largest trading partners have infrastructure scores that are twice as high as Brazil on average (Figure 3.10).
0
200
400
600
800
1 000
1 200
1 400
Jan Feb Mar Apr May Jun Jul Aug Sep Oct Nov Dec
2012 2013 2014 2015 2016
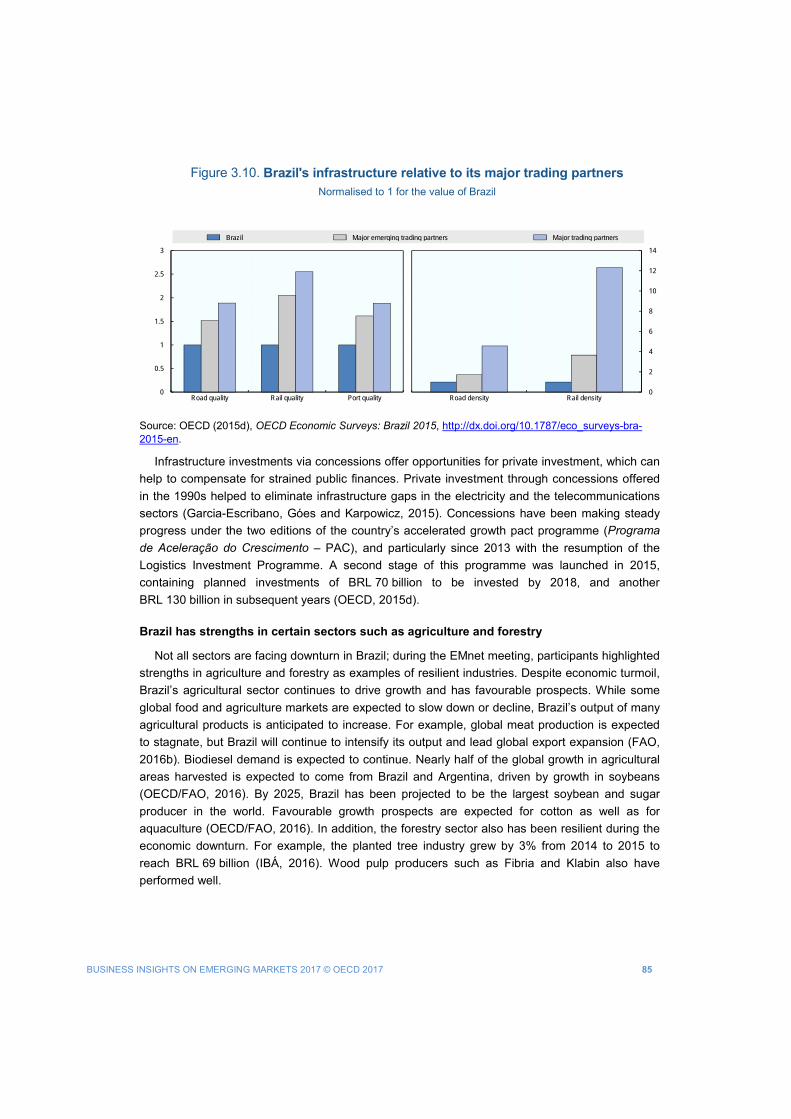
BUSINESS INSIGHTS ON EMERGING MARKETS 2017 © OECD 2017 85
Figure 3.10. Brazil's infrastructure relative to its major trading partners Normalised to 1 for the value of Brazil
Source: OECD (2015d), OECD Economic Surveys: Brazil 2015, http://dx.doi.org/10.1787/eco_surveys-bra-2015-en.
Infrastructure investments via concessions offer opportunities for private investment, which can help to compensate for strained public finances. Private investment through concessions offered in the 1990s helped to eliminate infrastructure gaps in the electricity and the telecommunications sectors (Garcia-Escribano, Góes and Karpowicz, 2015). Concessions have been making steady progress under the two editions of the country’s accelerated growth pact programme (Programa de Aceleração do Crescimento – PAC), and particularly since 2013 with the resumption of the Logistics Investment Programme. A second stage of this programme was launched in 2015, containing planned investments of BRL 70 billion to be invested by 2018, and another BRL 130 billion in subsequent years (OECD, 2015d).
Brazil has strengths in certain sectors such as agriculture and forestry
Not all sectors are facing downturn in Brazil; during the EMnet meeting, participants highlighted strengths in agriculture and forestry as examples of resilient industries. Despite economic turmoil, Brazil’s agricultural sector continues to drive growth and has favourable prospects. While some global food and agriculture markets are expected to slow down or decline, Brazil’s output of many agricultural products is anticipated to increase. For example, global meat production is expected to stagnate, but Brazil will continue to intensify its output and lead global export expansion (FAO, 2016b). Biodiesel demand is expected to continue. Nearly half of the global growth in agricultural areas harvested is expected to come from Brazil and Argentina, driven by growth in soybeans (OECD/FAO, 2016). By 2025, Brazil has been projected to be the largest soybean and sugar producer in the world. Favourable growth prospects are expected for cotton as well as for aquaculture (OECD/FAO, 2016). In addition, the forestry sector also has been resilient during the economic downturn. For example, the planted tree industry grew by 3% from 2014 to 2015 to reach BRL 69 billion (IBÁ, 2016). Wood pulp producers such as Fibria and Klabin also have performed well.
0
2
4
6
8
10
12
14
Road density Rail density0
0.5
1
1.5
2
2.5
3
Road quality Rail quality Port quality
Brazil Major emerging trading partners Major trading partners
86 BUSINESS INSIGHTS ON EMERGING MARKETS 2017 © OECD 2017
The corruption crisis is deep but could also generate positive momentum for future reforms
The corruption crisis that engulfed Brazil, known as “Operação Lava Jato’’ or Operation Car Wash, has expanded in size and scope to dwarf previous scandals. The Lava Jato case was initially an investigation into money laundering at gas stations and car washes. Over time it expanded to include allegations of corruption in the state-owned oil company Petrobras, whose officials are accused of accepting bribes in exchange for awarding contracts to construction companies at inflated prices. Investigations have reviewed BRL 6.2 billion in bribes paid, resulting in estimated losses to the state of BRL 29-42 billion (Leahy, 2016). The corruption scandal has also involved the Brazilian construction firm Odebrecht, which in December 2016 signed a leniency deal with the Brazilian, US and Swiss legal authorities and agreed to pay a fine for violating corruption laws (Odebrecht, 2016; EIU, 2017).
Though the current political instability has generated a significant business risk in Brazil, companies stressed that the political crisis is felt most at the level of the central government, while activities at the subnational and municipal levels continue to function. Given the depth of the corruption scandal, however, companies believe it can open up space for meaningful reform, potentially helping to increase transparency and strengthen institutions.
CONCLUSION This is indeed a challenging moment for Latin America. The region needs to upgrade, diversify
and innovate quickly to catch up with the global economy. Although commodities will continue to provide a source of revenue for many countries, high commodity prices are unlikely to return soon. In this period of downturn and weakened government spending capacity, partnerships with the private sector can be particularly valuable. This can be particularly relevant in key enabling areas, such as for example logistics and transport infrastructure development.
In this period of global uncertainty and rising protectionism, firms are watching trade policy closely and underscoring the need for open trade to support sustainable economic development. Economic diversification is of crucial importance at this moment, and companies support government efforts to promote innovation and encourage higher value-added products and services. It is essential to ensure that regulations can support businesses and encourage investment. Improved business-university partnerships and better matching of skills to labour market demands can supplement and strengthen these efforts to overcome uncertainty.
BUSINESS INSIGHTS ON EMERGING MARKETS 2017 © OECD 2017 87
References
Aguilar, O., P. Sardi Maldueño and B. Violin (2015), Becoming a Multilatina: Key Factors to Regionalizing in Latin America, Deloitte Development LLC., Deloitte website, www2.deloitte.com/content/dam/Deloitte/us/Documents/strategy/us-cons-becoming-a-multilatina.pdf.
Almeida, A. (2016), “La mirada sigue afuera”, Ránking Multilatinas 2016, AméricaEconomía Intelligence, AméricaEconomía website, http://rankings.americaeconomia.com/2016/multilatinas/.
AméricaEconomía (2016), “Ránking Multilatinas 2016”, AméricaEconomía website, http://rankings.americaeconomia.com/2016/multilatinas/ranking.
Banco Central do Brasil (2016), Financial Stability Report, Vol. 15, No. 2, September, Banco Central do Brasil website, http://www.bcb.gov.br/?fsr201609.
Belderbos, R., et al. (2016), “Where to Locate Innovative Activities in Global Value Chains: Does Co-location Matter?”, OECD Science, Technology and Industry Policy Papers, No. 30, OECD Publishing, Paris, http://dx.doi.org/10.1787/5jlv8zmp86jg-en.
Blanco Estévez, A. (2015), The Latin American Foreign Investment Boom: Recent Trends and the Evolution of Multilatinas, Latin American Program, Mexico Institute, Wilson Center, Washington, DC, www.wilsoncenter.org/sites/default/files/Blanco_Multilatinas_English_final_0.pdf.
Brazil Potash Corp. (2015), Shareholder Update, 3 February, http://potassiodobrasil.com.br/uploads/files/brazil_potash_shareholder_update_3_feb_2015_-_final.pdf.
CEPAL (2016), CEPALSTAT, Bases de Datos y Publicaciones Estadísticas, Comisión Económica para América Latina y el Caribe, http://estadisticas.cepal.org/ (accessed December 2016).
de la Torre, A. et al. (2015), Latin America and the Rising South: Changing World, Changing Priorities, Latin America and Caribbean Studies, World Bank Publications, Washington, DC, https://openknowledge.worldbank.org/handle/10986/21869.
D’Elia, C. and A. Ramos (2016), “The MERCOSUR and the Pacific Alliance: A Turning Point?”, Integration Ideas, No. 239, Inter-American Development Bank, IDB website, www.iadb.org/intal/conexionintal/2016/07/05/mercosur-y-la-alianza-del-pacifico-un-punto-de-inflexion/?lang=en.
Dinatale, M. (2016), “Mauricio Macri aseguró que el Mercosur debe ‘salir del congelamiento’ para ir a un acuerdo de libre comercio con la Alianza del Pacífico”, La Nación, 30 June, La Nación website, www.lanacion.com.ar/1914081-mauricio-macri-aseguro-que-el-mercosur-debe-salir-del-descongelamiento-para-ir-a-un-acuerdo-de-libre-comercio-con-la-alianza-del-pacifico.
Dougherty, S. (2015), “Boosting Growth and Reducing Informality in Mexico”, OECD Economics Department Working Papers, No. 1188, OECD Publishing, Paris. http://dx.doi.org/10.1787/5js4w28dnn28-en.
ECLAC (2016a), Latin America and the Caribbean in the World Economy 2016: The region amid the tensions of globalization. Briefing paper, Economic Commission for Latin America and the Caribbean, Division of International Trade and Integration of ECLAC, United Nations Publication, Buenos Aires, http://repositorio.cepal.org/bitstream/handle/11362/40745/S1600895_en.pdf?sequence=1&isAllowed=y.
ECLAC (2016b), 2016 – Foreign Direct Investment in Latin America and the Caribbean, Economic Commission for Latin America and the Caribbean, Unit on Investment and Corporate Strategies of the Division of Production, Productivity and Management, United Nations Publication, Santiago de Chile, http://repositorio.cepal.org/bitstream/handle/11362/40214/6/S1600662_en.pdf.
ECLAC (2016c), Growth Projections for Latin America and the Caribbean, 2016 – 2017 – Gross Domestic Product – Variation Rates, December, Economic Commission for Latin America and the Caribbean, United Nations Publication, Santiago de Chile, www.cepal.org/sites/default/files/pr/files/tabla_balancepreliminar2016_eng.pdf.
ECLAC (2016d), Social Panorama of Latin America 2015, Briefing paper, Economic Commission for Latin America and the Caribbean, United Nations Publication, Santiago de Chile, http://repositorio.cepal.org/bitstream/handle/11362/40327/50/S1600797_en.pdf.
88 BUSINESS INSIGHTS ON EMERGING MARKETS 2017 © OECD 2017
ECLAC (2015), Latin America and the Caribbean in the World Economy, 2015 – The regional trade crisis: assessment and outlook, Economic Commission for Latin America and the Caribbean, United Nations Publication, Santiago de Chile, http://repositorio.cepal.org/bitstream/handle/11362/39011/4/S1501141_en.pdf.
EIU (2017), “Odebrecht Scandal Puts a Spotlight on Corruption”, The Economist Intelligence Unit, 28 January, http://country.eiu.com/article.aspx?articleid=855169669&Country=Dominican%20Republic&topic=Politics.
European Commission (2017a), “Mercosur”, European Commission webpage, updated 27 January, http://ec.europa.eu/trade/policy/countries-and-regions/regions/mercosur/ (accessed 2 February 2017).
European Commission (2017b), “Mexico”, European Commission webpage, updated 1 February, http://ec.europa.eu/trade/policy/countries-and-regions/countries/mexico/ (accessed 2 February 2017).
European Commission (2017c), “EU and Mexico agree to accelerate trade talks”, 1 February, News archive, European Commission website, http://trade.ec.europa.eu/doclib/press/index.cfm?id=1617.
European Commission (2016), “EU and Mercosur agree to advance trade talks”, 8 April, News archive, European Commission website, http://trade.ec.europa.eu/doclib/press/index.cfm?id=1478.
FAO (2016a), “World fertilizer trends and outlook to 2019”, Summary Report, Food and Agriculture Organization of the United Nations, Rome, www.fao.org/3/a-i5627e.pdf.
FAO (2016b), Food Outlook: Biannual Report on Global Food Markets, June, Food and Agriculture Organization of the United Nations, Rome, www.fao.org/3/a-I5703E.pdf.
Garcia-Escribano, M., C. Góes and I. Karpowicz (2015), “Filling the Gap: Infrastructure Investment in Brazil", IMF Working Paper, WP/15/180, International Monetary Fund, Washington DC, www.imf.org/external/pubs/cat/longres.aspx?sk=43139.0.
Giordano, P., A. Ramos and K. Michalczewsky (2016), Trade Trend Estimates: Latin America and the Caribbean – 2017 Edition, Inter-American Development Bank, Washington DC, https://publications.iadb.org/handle/11319/7984.
Gomez Ramirez, E., E. Lazarou, L. Puccio and G. Sabbati (2016), “EU-Latin America trade relations: Overview and figures”, In-depth analysis, European Parliamentary Research Service, March, European Union, Brussels, www.europarl.europa.eu/RegData/etudes/IDAN/2016/579086/EPRS_IDA(2016)579086_EN.pdf.
Hernández, L. et al. (2016), Innovation and internationalization of Latin American services, Economic Commission for Latin America in collaboration with El Colegio de la Frontera Norte, Santiago de Chile, www.cepal.org/en/publications/40301-innovation-and-internationalization-latin-american-services.
Hornby, L. and J. Leahy (2016), “China’s investors target Brazil in hunt for growth”, Financial Times, 4 December, Financial Times website, www.ft.com/content/01972f58-ae62-11e6-a37c-f4a01f1b0fa1.
Huawei (2014), “Huawei Apoya a Profesores y Estudiantes de la UNAM con Certificaciones en Tecnologías de Vanguardia”, Press Release, 17 October, Huawei website, www.huawei.com/mx/about-huawei/newsroom/press-release/hw-376154.htm.
IBÁ (2016), Indústria Brasileira de Árvores 2016, Indústria Brasileira de Árvores, IBÁ website, http://iba.org/images/shared/Biblioteca/IBA_RelatorioAnual2016_.pdf.
ICTSD (2016), “Argentina Welcomed as Pacific Alliance Observer”, International Centre for Trade and Sustainable Development, Bridges, Vol. 20, No. 22., www.ictsd.org/bridges-news/bridges/news/argentina-welcomed-as-pacific-alliance-observer.
InvestChile (2016), Estrategia de Fomento y Promoción de la Inversión Extranjera Directa, Government of Chile, Santiago de Chile, www.investchile.gob.cl/wp-content/uploads/2016/05/ESTRATEGIA-PROMOCION.pdf.
InvestChile (2015), “President Bachelet promulgates new Framework Law for Foreign Investment”, 16 June, News section of InvestChile website, www.investchile.gob.cl/en/espanol-presidenta-bachelet-promulgo-nueva-ley-marco-para-la-inversion-extranjera-en-chile/.
Katz, R. (2015), “El ecosistema y la economía digital en América Latina, Editorial Ariel, Fundación Telefónica, Editorial Planeta, Madrid and Barcelona, http://scioteca.caf.com/handle/123456789/768.
BUSINESS INSIGHTS ON EMERGING MARKETS 2017 © OECD 2017 89
Leahy, J. (2016), “What is the Petrobras scandal that is engulfing Brazil?”, Financial Times, 31 March, Financial Times website, www.ft.com/cms/s/2/6e8b0e28-f728-11e5-803c-d27c7117d132.html#axzz4IExlKvpp.
Lederman, D., W.F. Maloney and L. Servén (2005), Lessons from NAFTA for Latin America and the Caribbean: A Summary of Research Findings, The World Bank, Washington DC, http://siteresources.worldbank.org/DEC/Resources/BookNAFTAWorldBank.pdf.
Lewis, J.T. and R. Jelmayer (2016), “Brazil Assets Are Attractive as Companies Try to Cut Debt”, The Wall Street Journal, 15 April, The Wall Street Journal website, http://www.wsj.com/articles/brazil-assets-are-attractive-as-companies-try-to-cut-debt-1460748042.
Marcelino, F. (2016), “Sete Brasil Shareholders Approve Plan to File for Bankruptcy”, Bloomberg, 20 April, Bloomberg website, www.bloomberg.com/news/articles/2016-04-20/sete-brasil-shareholders-said-to-approve-plan-to-file-bankruptcy.
Marczak, J. and S. George (2016), Pacific Alliance 2.0: Next Steps in Integration, The Atlantic Council of the United States and The Bertelsmann Foundation, Washington DC, www.atlanticcouncil.org/publications/reports/pacific-alliance-2-0-next-steps-in-integration.
MCTI (2016), “MCTI lança Estratégia Nacional de Ciência, Tecnologia e Inovação 2016-2019”, Ministério da Ciência, Tecnologia, Inovaçãoes e Comunicaçãoes, 12 May, www.mcti.gov.br/noticia/-/asset_publisher/epbV0pr6eIS0/content/mcti-lanca-estrategia-nacional-de-ciencia-tecnologia-e-inovacao-2016-2019.
Michelin (2014), “Michelin Acquires Sascar, Brazil’s Leading Digital Fleet Management Company”, Press Release, 9 June, Michelin website, www.michelin.com/eng/media-room/press-and-news/press-releases/Finance/Michelin-acquires-Sascar-Brazil-s-leading-digital-fleet-management-company.
MINCETUR (2015), Plan Estratégico Nacional Exportador: PENX 2025 (National Strategic Export Plan: PENX2025), Ministerio de Comercio Exterior y Turismo, Lima, MINCETUR website, www.mincetur.gob.pe/newweb/Portals/0/transparencia/proyectos%20resoluciones/RM_051_2015_PLAN.pdf.
MIT (2016), The Observatory of Economic Complexity, http://atlas.media.mit.edu/en/ (accessed 12 December 2016).
OAS (2016), “Information on Chile”, Foreign Trade Information System, Organization of American States website, www.sice.oas.org/ctyindex/CHL/CHLagreements_e.asp#Inforce (accessed 10 February 2017).
O'Brien, R. and R. Nickel (2016), “Battery-hungry world turns to South America’s ‘lithium triangle’”, Reuters, 15 March, Reuters website, www.reuters.com/article/us-latam-lithium-idUSKCN0WH1BZ.
Odebrecht (2016), “Odebrecht Signs Agreement with Authorities in Brazil, United States and Switzerland”, Press Release, December 21, www.odebrecht.com/en/communication/releases/odebrecht-signs-agreement-authorities-brazil-united-states-and-switzerland.
OECD (2017a), “OECD Economic Outlook No. 100 – November 2016: Economic Outlook Annex Tables”, OECD Economic Outlook: Statistics and Projections (database), www.oecd.org/eco/outlook/economic-outlook-annex-tables.htm (accessed 31 January 2017).
OECD (2017b), DAC List of ODA Recipients, www.oecd.org/dac/stats/daclist.htm (accessed 10 March 2017)
OECD (2016a), OECD Economic Outlook, Volume 2016 Issue 2, OECD Publishing, Paris, http://dx.doi.org/10.1787/eco_outlook-v2016-2-en.
OECD (2016b), Promoting Productivity for Inclusive Growth in Latin America, OECD Publishing, Paris, http://dx.doi.org/10.1787/9789264258389-en.
OECD (2016c), Start-up Latin America 2016: Building an Innovative Future, OECD Publishing, Paris, http://dx.doi.org/10.1787/9789264265660-en.
OECD (2016d), Making the Most of Public Investment in Colombia: Working Effectively across Levels of Government, OECD Publishing, Paris, http://dx.doi.org/10.1787/9789264265288-en.
OECD (2016e), Multi-dimensional Review of Peru: Volume 2. In-depth Analysis and Recommendations, OECD Publishing, Paris, http://dx.doi.org/10.1787/9789264264670-en.
90 BUSINESS INSIGHTS ON EMERGING MARKETS 2017 © OECD 2017
OECD (2016f), OECD Science, Technology and Innovation Outlook 2016, OECD Publishing, Paris. http://dx.doi.org/10.1787/sti_in_outlook-2016-en.
OECD (2015a), OECD Economic Surveys: Chile 2015, OECD Publishing, Paris, http://dx.doi.org/10.1787/eco_surveys-chl-2015-en.
OECD (2015b), OECD Environmental Performance Reviews: Brazil 2015, OECD Publishing, Paris, http://dx.doi.org/10.1787/9789264240094-en.
OECD (2015c), Multi-dimensional Review of Peru: Volume I. Initial Assessment, OECD Publishing, Paris, http://dx.doi.org/10.1787/9789264243279-en.
OECD (2015d), OECD Economic Surveys: Brazil 2015, OECD Publishing, Paris, http://dx.doi.org/10.1787/eco_surveys-bra-2015-en.
OECD/CAF/ECLAC (2016), Latin American Economic Outlook 2017: Youth, Skills and Entrepreneurship, OECD Publishing, Paris. http://dx.doi.org/10.1787/leo-2017-en.
OECD/CAF/ECLAC (2015), Latin American Economic Outlook 2016: Towards a New Partnership with China, OECD Publishing, Paris, http://dx.doi.org/10.1787/9789264246218-en.
OECD/CAF/ECLAC (2013), Latin American Economic Outlook 2014: Logistics and Competitiveness for Development, OECD Publishing, Paris, http://dx.doi.org/10.1787/leo-2014-en.
OECD/FAO (2016), OECD-FAO Agricultural Outlook 2016-2025, OECD Publishing, Paris, http://dx.doi.org/10.1787/agr_outlook-2016-en.
OECD/IDB (2016a), Boosting Productivity and Inclusive Growth in Latin America, OECD Latin America and Caribbean Regional Programme, OECD Publishing, Paris, www.oecd.org/latin-america/Boosting_Productivity_Inclusive_Growth.pdf.
OECD/IDB (2016b), Broadband Policies for Latin America and the Caribbean: A Digital Economy Toolkit, OECD Publishing, Paris, http://dx.doi.org/10.1787/9789264251823-en.
OECD/WTO/UNCTAD (2016), Reports on G20 Trade and Investment Measures: Mid-May to Mid-October 2016, 10 November, Organisation for Economic Co-operation and Development, World Trade Organization, United Nations Conference on Trade and Development, www.oecd.org/daf/inv/investment-policy/16th-Report-on-G20-Trade-and-Investment-Measures.pdf.
Pearson, S. (2016), “Oi Bankruptcy latest chapter in Brazil telecoms soap opera”, Financial Times, 23 June, Financial Times website, www.ft.com/content/56e92e94-3927-11e6-9a05-82a9b15a8ee7.
Perotti, R. and M.F. Coviello (2015), “Governance of strategic minerals in Latin America: the case of Lithium”, Project Document, Economic Commission for Latin America and the Caribbean, United Nations Publication, Santiago de Chile, http://repositorio.cepal.org/bitstream/handle/11362/38961/1/S1500861_en.pdf.
Petrobras (2016), “Adjustments to the 2015-2019 Business and Management Plan”, Form 6-K, Report of Foreign Private Issuer, U.S. Securities and Exchange Commission, Washington DC, www.sec.gov/Archives/edgar/data/1119639/000129281416003268/pbra20160112_6k.htm.
Schneider Electric (2015), “Schneider Electric creates a new centre of excellence in Colombia to further support its actions towards vocational training”, Press Release, 27 January, Schneider Electric website, www.schneider-electric.com/corporate/en/press/press-releases/viewer-press-releases.page?c_filepath=/templatedata/Content/Press_Release/data/en/shared/2015/01/20150127_schneider_electric_creates_a_new_centre_of_excellence_in_colombia_to_f.xml.
UNDP (2016), Human Development Report for Latin America and the Caribbean 2016, United Nations Development Programme, New York, http://www.latinamerica.undp.org/content/rblac/en/home/library/human_development/informe-regional-sobre-desarrollo-humano-para-america-latina-y-e/.
UNCTAD (2016), World Investment Report 2016 – Investor Nationality: Policy Challenges, United Nations Conference on Trade and Development, United Nations Publication, Geneva, http://unctad.org/en/PublicationsLibrary/wir2016_en.pdf.
BUSINESS INSIGHTS ON EMERGING MARKETS 2017 © OECD 2017 91
USTR (n.d.), Mexico section of the Office of the United States Trade Representative website, https://ustr.gov/countries-regions/americas/mexico (accessed 20 December 2016).
Valor International (2016), “MMX moves ahead with sales of mines amid bankruptcy recovery”, 1 November, Valor International website, www.valor.com.br/international/news/4762133/mmx-moves-ahead-sale-mines-amid-bankruptcy-recovery.
Villarreal, M.A. (2016a), “U.S.-Mexico Economic Relations: Trends, Issues, and Implications”, CRS Report, 4 November, Congressional Research Service, Library of Congress, Washington DC, https://fas.org/sgp/crs/row/RL32934.pdf.
Villarreal, M.A. (2016b), “The Pacific Alliance: A Trade Integration Initiative in Latin America”, CRS Report, 29 March, Congressional Research Service, www.fas.org/sgp/crs/row/R43748.pdf.
Warwick, K. (2013), “Beyond Industrial Policy: Emerging Issues and New Trends”, OECD Science, Technology and Industry Policy Papers, No. 2, OECD Publishing, Paris, http://dx.doi.org/10.1787/5k4869clw0xp-en.
WEF (2016), The Global Competitiveness Report 2016-2017, World Economic Forum, Cologny/Geneva, Switzerland, www.weforum.org/docs/GCR2016-2017/05FullReport/TheGlobalCompetitivenessReport2016-2017_FINAL.pdf.
Willer, H. and J. Lernaud (eds.) (2016), The World of Organic Agriculture: Statistics and Emerging Trends 2016, Research Institute of Organic Agriculture (FiBL) and IFOAM – Organics International, Frick, Switzerland and Bonn, https://shop.fibl.org/fileadmin/documents/shop/1698-organic-world-2016.pdf.

Investing in growing African cities
This edition of the EMnet Africa Policy Note provides insights and policy recommendations from the private sector on investment challenges in African cities. The note examines the latest macroeconomic trends on the continent and provides an overview of recent urbanisation policies, highlighting how policy makers are supporting private-sector led investments in African cities. The analysis builds on discussions from the business meeting held on 30 September 2016 at the OECD headquarters in Paris and organised by the OECD Emerging Markets Network (EMnet) as well as on the analysis of the African Economic Outlook 2016, in addition to desk research and bilateral discussions with EMnet members.
Key messages include:
• By joining forces with local partners, firms have been successful in investing in African urban markets. A thorough understanding of local specificities and a multi-stage approach have been indicated as key success factors of foreign direct investments.
• To build more efficient and sustainable cities, reduce environmental risk factors and create more value-added jobs, investments in infrastructure such as roads, sewage, water systems and in information technologies, are needed.
• Public-private partnerships (PPPs) could facilitate the implementation of large infrastructure projects and further reduce the cost of such investments. However, if adequate institutional and human capacities are not in place, PPPs could instead drive the cost of such investments up.
• Financing African cities will come from various sources. The private sector is playing an increasingly important role in financing infrastructure development, although public investment accounts for two-thirds of the total in developing countries.
• Innovative business solutions, such as digital technologies for mobile payment systems, can offer opportunities to address the growing issue of the urban informal economy.
94 BUSINESS INSIGHTS ON EMERGING MARKETS 2017 © OECD 2017
AFRICA’S BUSINESS AND ECONOMIC OVERVIEW According to the African Economic Outlook 2016 (AfDB/OECD/UNDP, 2016), Africa’s overall
economic growth will remain relatively stable in the near term despite a weak global economy. The average economic growth of African economies stood at 3.6% in 2015 and was projected to stagnate in 2016 (Figure 4.1) (AfDB/OECD/UNDP, 2016). Since the launch of the Outlook in May 2016, lower commodity prices, disruptive weather conditions and conflict-related spillovers has led to a downward revision of regional growth estimates (World Bank Group, 2017).
Figure 4.1. Africa’s economic growth, 2003-16
Note: (e) estimates; (p) projections. Latest data available released on 23 May 2016. Source: AfDB/OECD/UNDP (2016), African Economic Outlook 2016, http://dx.doi.org/10.1787/aeo-2016-en
Over the last 10-15 years, gross domestic product (GDP) registered between approximately 4% and 6.5% growth due to the “commodity super cycle”, i.e. high commodity prices combined with a growing population. In the new medium-term scenario, Africa may report a lower overall growth rate due to a slower recovery of commodity prices, uncertainty in European and US policies, and a weaker global financial outlook (World Bank Group, 2017). To drive growth, African countries that are rich in natural resources will need to diversify their economic base and deepen domestic markets.
Regional growth paths differ substantially
While African growth has decelerated, performance has varied across sub-regions. It is particularly worth noting the difference in growth patterns between East and West Africa.1 With the end of the commodity super cycle, investment has shifted from the resource-rich West towards the diversified economies of the East, where major technology hubs are appearing.
0
1
2
3
4
5
6
7
8
2003 2004 2005 2006 2007 2008 2009 2010 2011 2012 2013 2014 2015 (e) 2016 (p)
%
Africa Africa excl. Libya
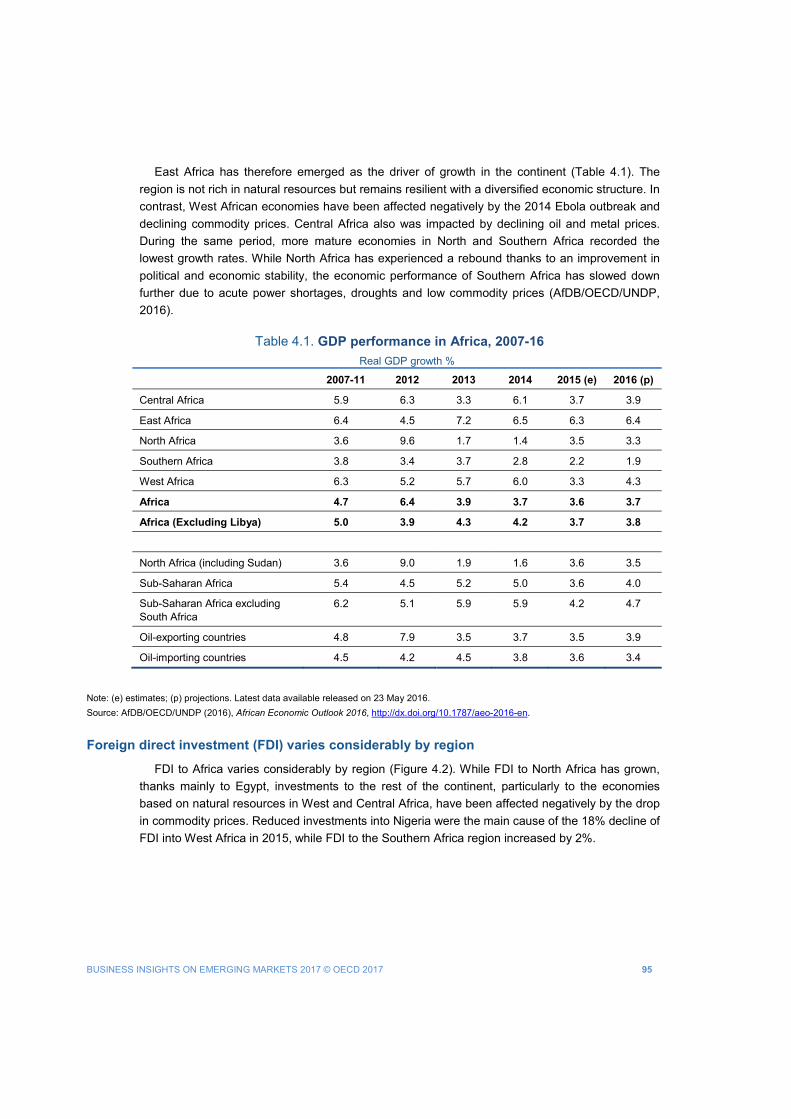
BUSINESS INSIGHTS ON EMERGING MARKETS 2017 © OECD 2017 95
East Africa has therefore emerged as the driver of growth in the continent (Table 4.1). The region is not rich in natural resources but remains resilient with a diversified economic structure. In contrast, West African economies have been affected negatively by the 2014 Ebola outbreak and declining commodity prices. Central Africa also was impacted by declining oil and metal prices. During the same period, more mature economies in North and Southern Africa recorded the lowest growth rates. While North Africa has experienced a rebound thanks to an improvement in political and economic stability, the economic performance of Southern Africa has slowed down further due to acute power shortages, droughts and low commodity prices (AfDB/OECD/UNDP, 2016).
Table 4.1. GDP performance in Africa, 2007-16
Real GDP growth %
2007-11 2012 2013 2014 2015 (e) 2016 (p)
Central Africa 5.9 6.3 3.3 6.1 3.7 3.9
East Africa 6.4 4.5 7.2 6.5 6.3 6.4
North Africa 3.6 9.6 1.7 1.4 3.5 3.3
Southern Africa 3.8 3.4 3.7 2.8 2.2 1.9
West Africa 6.3 5.2 5.7 6.0 3.3 4.3
Africa 4.7 6.4 3.9 3.7 3.6 3.7
Africa (Excluding Libya) 5.0 3.9 4.3 4.2 3.7 3.8
North Africa (including Sudan) 3.6 9.0 1.9 1.6 3.6 3.5
Sub-Saharan Africa 5.4 4.5 5.2 5.0 3.6 4.0
Sub-Saharan Africa excluding South Africa
6.2 5.1 5.9 5.9 4.2 4.7
Oil-exporting countries 4.8 7.9 3.5 3.7 3.5 3.9
Oil-importing countries 4.5 4.2 4.5 3.8 3.6 3.4
Note: (e) estimates; (p) projections. Latest data available released on 23 May 2016. Source: AfDB/OECD/UNDP (2016), African Economic Outlook 2016, http://dx.doi.org/10.1787/aeo-2016-en.
Foreign direct investment (FDI) varies considerably by region
FDI to Africa varies considerably by region (Figure 4.2). While FDI to North Africa has grown, thanks mainly to Egypt, investments to the rest of the continent, particularly to the economies based on natural resources in West and Central Africa, have been affected negatively by the drop in commodity prices. Reduced investments into Nigeria were the main cause of the 18% decline of FDI into West Africa in 2015, while FDI to the Southern Africa region increased by 2%.
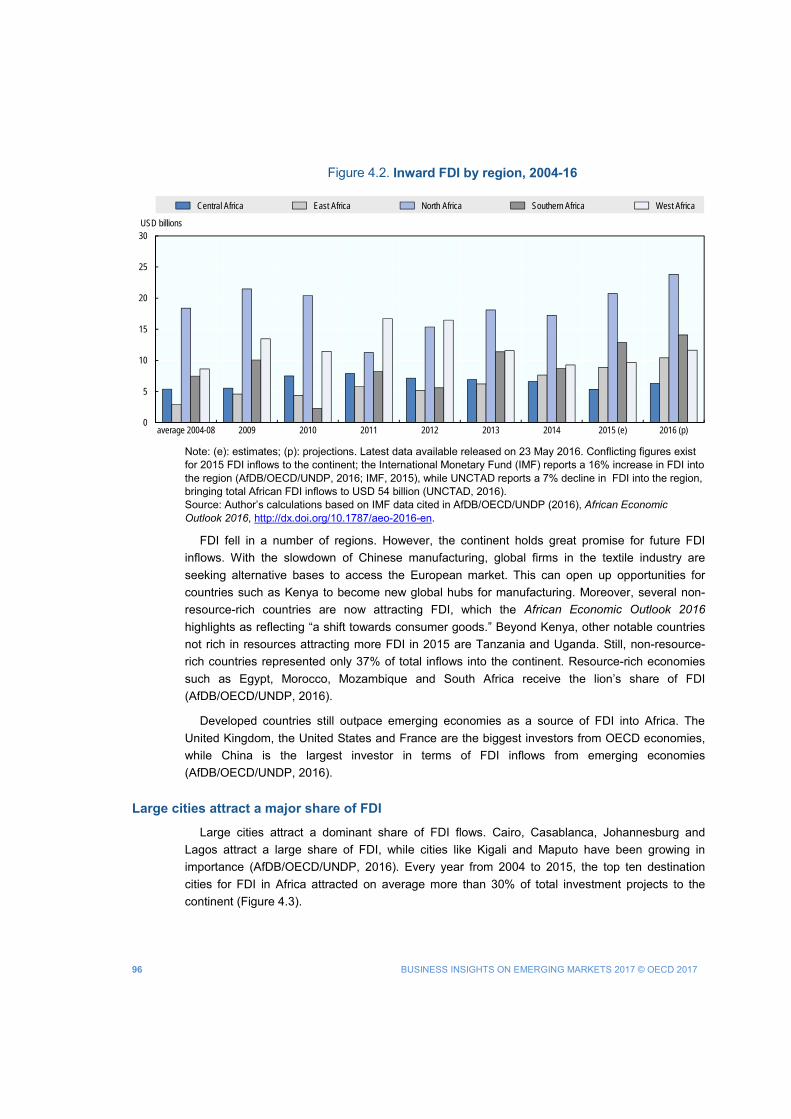
96 BUSINESS INSIGHTS ON EMERGING MARKETS 2017 © OECD 2017
Figure 4.2. Inward FDI by region, 2004-16
Note: (e): estimates; (p): projections. Latest data available released on 23 May 2016. Conflicting figures exist for 2015 FDI inflows to the continent; the International Monetary Fund (IMF) reports a 16% increase in FDI into the region (AfDB/OECD/UNDP, 2016; IMF, 2015), while UNCTAD reports a 7% decline in FDI into the region, bringing total African FDI inflows to USD 54 billion (UNCTAD, 2016). Source: Author’s calculations based on IMF data cited in AfDB/OECD/UNDP (2016), African Economic Outlook 2016, http://dx.doi.org/10.1787/aeo-2016-en.
FDI fell in a number of regions. However, the continent holds great promise for future FDI inflows. With the slowdown of Chinese manufacturing, global firms in the textile industry are seeking alternative bases to access the European market. This can open up opportunities for countries such as Kenya to become new global hubs for manufacturing. Moreover, several non-resource-rich countries are now attracting FDI, which the African Economic Outlook 2016 highlights as reflecting “a shift towards consumer goods.” Beyond Kenya, other notable countries not rich in resources attracting more FDI in 2015 are Tanzania and Uganda. Still, non-resource-rich countries represented only 37% of total inflows into the continent. Resource-rich economies such as Egypt, Morocco, Mozambique and South Africa receive the lion’s share of FDI (AfDB/OECD/UNDP, 2016).
Developed countries still outpace emerging economies as a source of FDI into Africa. The United Kingdom, the United States and France are the biggest investors from OECD economies, while China is the largest investor in terms of FDI inflows from emerging economies (AfDB/OECD/UNDP, 2016).
Large cities attract a major share of FDI
Large cities attract a dominant share of FDI flows. Cairo, Casablanca, Johannesburg and Lagos attract a large share of FDI, while cities like Kigali and Maputo have been growing in importance (AfDB/OECD/UNDP, 2016). Every year from 2004 to 2015, the top ten destination cities for FDI in Africa attracted on average more than 30% of total investment projects to the continent (Figure 4.3).
0
5
10
15
20
25
30
average 2004-08 2009 2010 2011 2012 2013 2014 2015 (e) 2016 (p)
USD billions
Central Africa East Africa North Africa Southern Africa West Africa
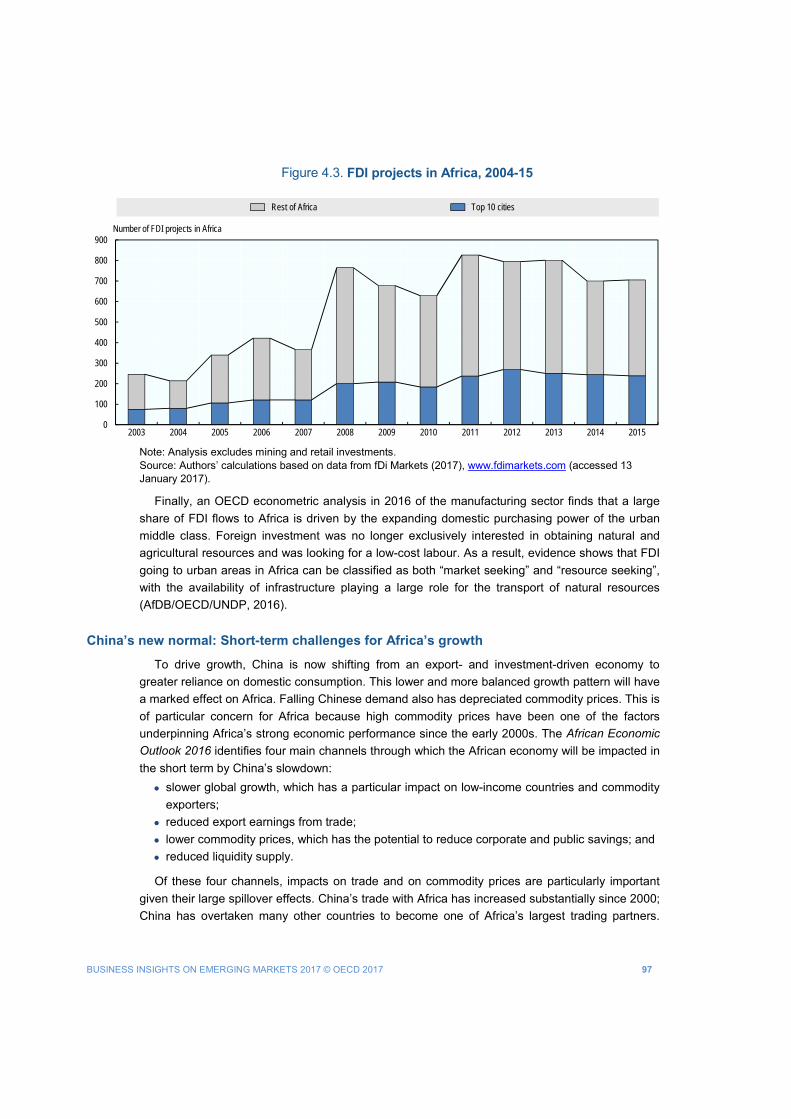
BUSINESS INSIGHTS ON EMERGING MARKETS 2017 © OECD 2017 97
Figure 4.3. FDI projects in Africa, 2004-15
Note: Analysis excludes mining and retail investments. Source: Authors’ calculations based on data from fDi Markets (2017), www.fdimarkets.com (accessed 13 January 2017).
Finally, an OECD econometric analysis in 2016 of the manufacturing sector finds that a large share of FDI flows to Africa is driven by the expanding domestic purchasing power of the urban middle class. Foreign investment was no longer exclusively interested in obtaining natural and agricultural resources and was looking for a low-cost labour. As a result, evidence shows that FDI going to urban areas in Africa can be classified as both “market seeking” and “resource seeking”, with the availability of infrastructure playing a large role for the transport of natural resources (AfDB/OECD/UNDP, 2016).
China’s new normal: Short-term challenges for Africa’s growth
To drive growth, China is now shifting from an export- and investment-driven economy to greater reliance on domestic consumption. This lower and more balanced growth pattern will have a marked effect on Africa. Falling Chinese demand also has depreciated commodity prices. This is of particular concern for Africa because high commodity prices have been one of the factors underpinning Africa’s strong economic performance since the early 2000s. The African Economic Outlook 2016 identifies four main channels through which the African economy will be impacted in the short term by China’s slowdown:
• slower global growth, which has a particular impact on low-income countries and commodity exporters;
• reduced export earnings from trade; • lower commodity prices, which has the potential to reduce corporate and public savings; and • reduced liquidity supply.
Of these four channels, impacts on trade and on commodity prices are particularly important given their large spillover effects. China’s trade with Africa has increased substantially since 2000; China has overtaken many other countries to become one of Africa’s largest trading partners.
0
100
200
300
400
500
600
700
800
900
2003 2004 2005 2006 2007 2008 2009 2010 2011 2012 2013 2014 2015
Rest of Africa Top 10 cities
Number of FDI projects in Africa
98 BUSINESS INSIGHTS ON EMERGING MARKETS 2017 © OECD 2017
Accordingly, the strong economic performance of China in the past decade has had a large impact on the economic growth of the African continent. Consequently, the current Chinese slowdown has hurt the trade relationship between China and Africa with negative consequences on the economic performance of the latter.
In the longer term, the overall net effect of China’s rebalancing is likely to change the composition of exports from Africa. Evidence shows that Chinese consumption-led growth is likely to boost African exports of consumer goods and agricultural products (AfDB/OECD/UNDP, 2016).
GROWING AFRICAN CITIES: CHALLENGES AND OPPORTUNITIES FOR THE PRIVATE SECTOR
Urbanisation in Africa is occurring at an unforeseen rapid pace. The population of cities has doubled in 20 years to reach 472 million in 2015. Moreover, while 40% of Africa is currently urbanised, the United Nations Department of Economic and Social Affairs projects that Africa will reach 50% urbanisation by the mid-2030s (UN-DESA, 2014). With such unprecedented growth, African cities are an important target for companies in many sectors such as consumer goods, logistics, business and finance services, real estate and transport. Important factors that can potentially influence foreign investment include population growth, the quality of infrastructure and the potential development of intermediary cities.
A growing population
Africa’s population is growing fast. Within the coming decades, Africa will have one of the most favourable demographic structures in the world with the working-age population (defined as 12-64) growing faster than the total population (AfDB/OECD/UNDP, 2016) (Figure 4.4). The African Economic Outlook 2016 estimated that Africa’s population growth could boost its annual GDP per capita growth by up to 0.5% over the next 15 years (AfDB/OECD/UNDP, 2016).
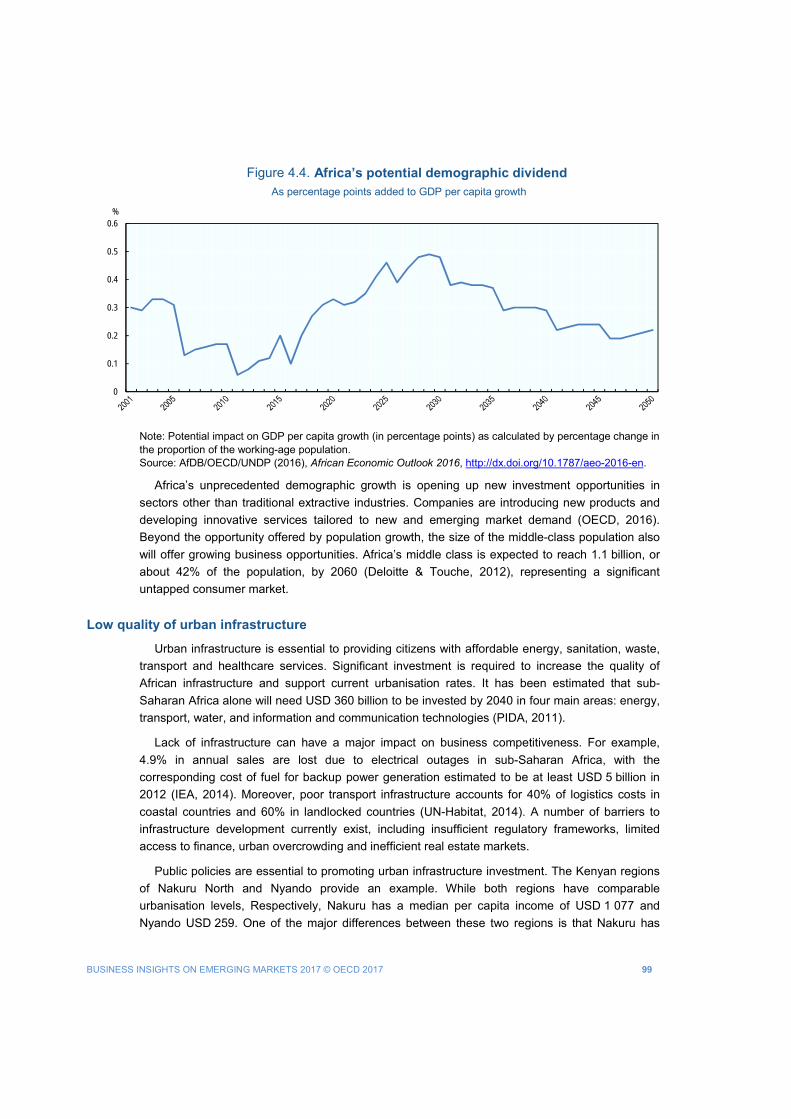
BUSINESS INSIGHTS ON EMERGING MARKETS 2017 © OECD 2017 99
Figure 4.4. Africa’s potential demographic dividend As percentage points added to GDP per capita growth
Note: Potential impact on GDP per capita growth (in percentage points) as calculated by percentage change in the proportion of the working-age population. Source: AfDB/OECD/UNDP (2016), African Economic Outlook 2016, http://dx.doi.org/10.1787/aeo-2016-en.
Africa’s unprecedented demographic growth is opening up new investment opportunities in sectors other than traditional extractive industries. Companies are introducing new products and developing innovative services tailored to new and emerging market demand (OECD, 2016). Beyond the opportunity offered by population growth, the size of the middle-class population also will offer growing business opportunities. Africa’s middle class is expected to reach 1.1 billion, or about 42% of the population, by 2060 (Deloitte & Touche, 2012), representing a significant untapped consumer market.
Low quality of urban infrastructure
Urban infrastructure is essential to providing citizens with affordable energy, sanitation, waste, transport and healthcare services. Significant investment is required to increase the quality of African infrastructure and support current urbanisation rates. It has been estimated that sub-Saharan Africa alone will need USD 360 billion to be invested by 2040 in four main areas: energy, transport, water, and information and communication technologies (PIDA, 2011).
Lack of infrastructure can have a major impact on business competitiveness. For example, 4.9% in annual sales are lost due to electrical outages in sub-Saharan Africa, with the corresponding cost of fuel for backup power generation estimated to be at least USD 5 billion in 2012 (IEA, 2014). Moreover, poor transport infrastructure accounts for 40% of logistics costs in coastal countries and 60% in landlocked countries (UN-Habitat, 2014). A number of barriers to infrastructure development currently exist, including insufficient regulatory frameworks, limited access to finance, urban overcrowding and inefficient real estate markets.
Public policies are essential to promoting urban infrastructure investment. The Kenyan regions of Nakuru North and Nyando provide an example. While both regions have comparable urbanisation levels, Respectively, Nakuru has a median per capita income of USD 1 077 and Nyando USD 259. One of the major differences between these two regions is that Nakuru has
0
0.1
0.2
0.3
0.4
0.5
0.6%
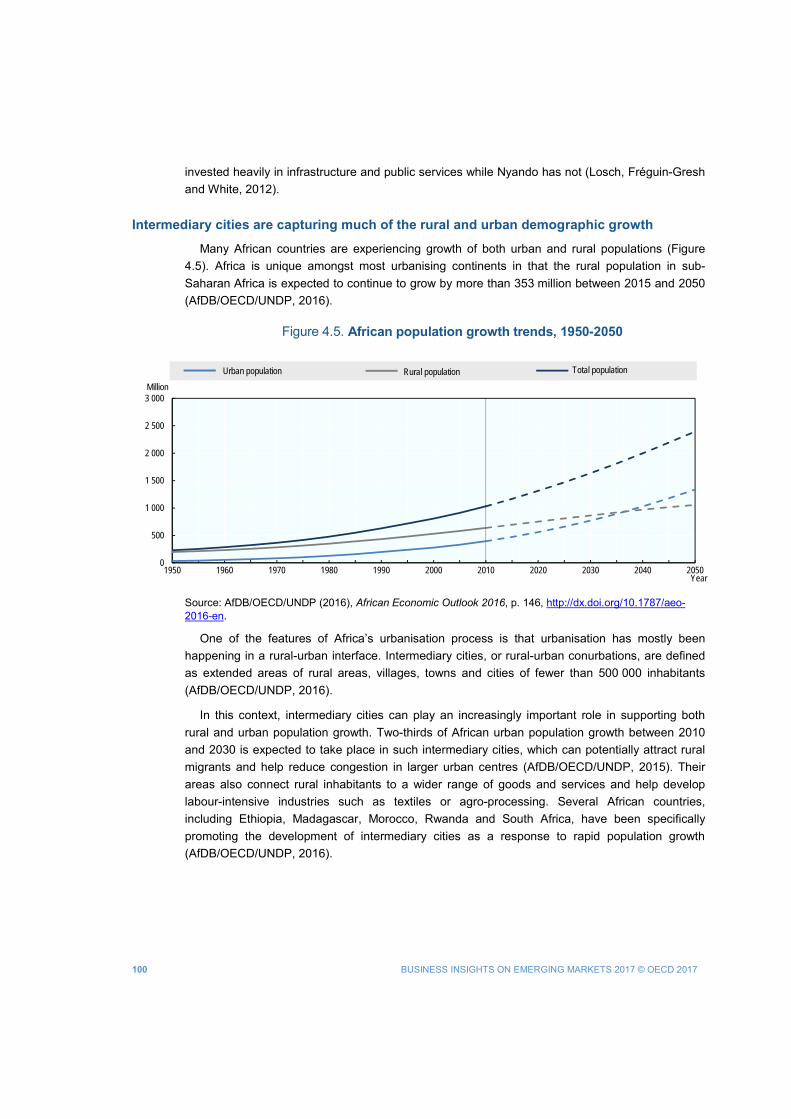
100 BUSINESS INSIGHTS ON EMERGING MARKETS 2017 © OECD 2017
invested heavily in infrastructure and public services while Nyando has not (Losch, Fréguin-Gresh and White, 2012).
Intermediary cities are capturing much of the rural and urban demographic growth
Many African countries are experiencing growth of both urban and rural populations (Figure 4.5). Africa is unique amongst most urbanising continents in that the rural population in sub-Saharan Africa is expected to continue to grow by more than 353 million between 2015 and 2050 (AfDB/OECD/UNDP, 2016).
Figure 4.5. African population growth trends, 1950-2050
Source: AfDB/OECD/UNDP (2016), African Economic Outlook 2016, p. 146, http://dx.doi.org/10.1787/aeo-2016-en.
One of the features of Africa’s urbanisation process is that urbanisation has mostly been happening in a rural-urban interface. Intermediary cities, or rural-urban conurbations, are defined as extended areas of rural areas, villages, towns and cities of fewer than 500 000 inhabitants (AfDB/OECD/UNDP, 2016).
In this context, intermediary cities can play an increasingly important role in supporting both rural and urban population growth. Two-thirds of African urban population growth between 2010 and 2030 is expected to take place in such intermediary cities, which can potentially attract rural migrants and help reduce congestion in larger urban centres (AfDB/OECD/UNDP, 2015). Their areas also connect rural inhabitants to a wider range of goods and services and help develop labour-intensive industries such as textiles or agro-processing. Several African countries, including Ethiopia, Madagascar, Morocco, Rwanda and South Africa, have been specifically promoting the development of intermediary cities as a response to rapid population growth (AfDB/OECD/UNDP, 2016).
0
500
1 000
1 500
2 000
2 500
3 000
1950 1960 1970 1980 1990 2000 2010 2020 2030 2040 2050
Million
Year
Urban population Rural population Total population
BUSINESS INSIGHTS ON EMERGING MARKETS 2017 © OECD 2017 101
PUBLIC POLICIES TO SUPPORT AFRICA’S URBANISATION GROWTH
National urban strategies, which are essential for Africa’s long-term development, are unevenly implemented across the continent. In 2016, out of 51 African countries, only 16 had adopted national urbanisation strategies, focusing on social-service delivery, infrastructure development, financing and land ownership (AfDB/OECD/UNDP, 2016). Some key issues to be considered when implementing these strategies include financing African cities, increasing public sector capacity building, managing intermediary cities and using technology-oriented policies to tackle urban challenges.
Improving resources to finance African cities
Limited financial resources remain a major challenge for African cities, and progress towards more fiscal decentralisation and subnational decision-making is not adequate (AfDB/OECD/UNDP, 2015). Difficulties in generating local revenues also mean that national transfers remain a predominant source of funding for cities. Even in contexts of devolution of powers, such as in decentralised countries like Tanzania and Uganda, or federal countries like Nigeria, local governments receive most of their revenues from central administrations (AfDB/OECD/UNDP, 2015).
Examples of decentralisation show that local governments have been able to raise their revenues through private finance and borrow from financial markets, provided that they respect strict macro-prudential guidelines. Johannesburg has been issuing municipal bonds since 2004 to finance the city’s large-scale infrastructure projects. In 2014, the city also issued green bonds amounting to ZAR 1.46 billion to fund initiatives such as the installation of 43 000 solar water heaters in districts that lack access to energy or where the populations cannot afford energy tariffs (JSE, 2014).
While financial markets can help mobilise additional resources to finance African cities, stock markets in Africa are still illiquid and fragmented (AfDB/OECD/UNDP, 2016). Better integration and harmonisation of financial markets and regulatory reforms could help further improve access to finance for investments.
Building public sector capacity
Local government officials need to have adequate skills to design appropriate urban policies that promote sustainable projects and engage with the private sector. Investments and capacity building in urban planning could help reduce the cost of infrastructure development. Moreover, the current shortage of skilled professionals also might be exacerbated by the lack of incentives to pursue careers as civil servants (AfDB/OECD/UNDP, 2016).
In these cases, governments need to be proactive to provide the right environment for human capital development. In Ethiopia, the Ministry of Urban Development and Housing and the Ethiopian Civil Service University worked together to increase urban management graduate-level training twelvefold, reaching a yearly enrolment of 350 students between 2006 and 2015 (AfDB/OECD/UNDP, 2016). In South Africa, the Municipal Institute of Learning was established by
102 BUSINESS INSIGHTS ON EMERGING MARKETS 2017 © OECD 2017
the eThekwini Municipality in Durban and trained 3 600 local government officials in various urban development fields, including waste management, sanitation and strategic planning (AfDB/OECD/UNDP, 2016). Other types of organisations also can fill the skills gap. For example, the Association of African Planning Schools, a network of 55 universities in 18 African countries, has been training and facilitating knowledge exchanges amongst urban planners since 1999 (AAPS, 2016).
Supporting technology-oriented policies for enhanced urban development
Policies supporting the use of technological solutions can further improve the connectivity and sustainability of African urban areas, as well as their governance and monitoring capabilities. In Rwanda, the Ministry of Youth and ICT demonstrated its commitment to technology for private operators by installing 4 500 kilometres of fibre optic cables and making available both 4G Long Term Evolution (LTE) in Kigali and extensive 3G access throughout the country (White, 2015). This increased connectivity has opened a space in which new efficient and sustainable technologies can emerge, driven by foreign multinational companies such as the telecommunications firm Ericsson. Moreover, recent announcements by the government of Rwanda of such services such as “e-imboni”, a system allowing public institutions to share documents electronically and securely, and “Irembo”, a one-stop Internet portal for e-government services, help improve time management and reduce paper use (Engerati, 2016).
Better information and communications technology (ICT) systems also can improve tax administrations and increase the tax base for cities to finance development projects. A study on revenue collection in Cameroon, Côte d’Ivoire, Mauritius, Morocco, Rwanda, Senegal, South Africa and Tunisia found that tax-to-GDP ratios range from 16.1% to 31.3% compared to the 34.4% average in OECD countries (OECD/ATAF/AUC, 2016). A study of 15 African countries found that ICT allowed for reduced tax administration and compliance costs, reinforced revenue and collection, increased transparency and integrity, and increased risk management (ATAF, 2016).2 One example is the Kenya Revenue Authority’s iTax system, which increased taxpayer registration from about 70 000 to nearly 3 million taxpayers between March 2013 and September 2014 (ATAF, 2016). This was made possible through partnerships with Kenya’s commercial banks, where taxpayers could use mobile devices to pay their taxes through the iTax Payment Gateway feature. Moving towards electronic filing in Kenya also has implications for businesses as the number of steps required for corporations to file their taxes, from pre-filling to post-assessment, has shrunk from 59 to 16. In the case of Rwanda, the compulsory use of electronic pre-filling reduced the time to prepare files and pay taxes by 10 hours, from 119 hours to 109 in 2014-2015 (World Bank, 2016). OECD studies also highlight how streamlining tax administration can help improve the investment climate by managing incentives more effectively (OECD, 2013; OECD, 2014a; OECD, 2015).
BUSINESS INSIGHTS ON EMERGING MARKETS 2017 © OECD 2017 103
PRIVATE SECTOR INSIGHTS ON URBANISATION CHALLENGES IN AFRICA
The challenges posed by rapid urbanisation in Africa will not be solved without private sector participation. Within this context, participants at the EMnet Africa meeting highlighted a number of relevant topics, including the need for strong partnerships, the importance of sharing risks when financing cities, the urgency of enhancing local skills and the potential of technology to support urbanisation.
Partnerships can be mutually beneficial for the delivery of urban projects
Participants suggested that PPPs in infrastructure projects can be mutually beneficial for both the private and public sectors. A relevant example is the construction of the Dakar Diamniadio toll highway in Senegal. The national government, the French construction company Eiffage, and several international donors and financial institutions co-operated successfully to reduce the commuting time from the centre of Dakar to its suburbs from two hours to 30 minutes (Carter, 2015). In Benin, the government used a PPP structure to develop a new container terminal for the port of Cotonou. A 25-year concession to build the new terminal was awarded to Groupe Bolloré with the purpose of doubling container traffic in the first eight years of operations, create 450 jobs, generate up to USD 300 million in taxes, and stimulate trade with neighbouring land-locked countries such as Niger, Mali and Burkina Faso (Kenny and Lavanchy, 2013).
Nonetheless, effective regulatory frameworks are still missing in numerous countries, with only a few African countries such as Morocco, Tunisia and Egypt having structured PPP programmes (PwC, 2014; OECD, 2014b). Developing a PPP framework at the national level can help reduce the cost of doing business, since it allows for more clarity on the terms, conditions and procedures for the design and implementation of projects. This can help companies prepare their business plans and aid municipalities in identifying the expected benefits for local communities. However, OECD analysis shows that PPPs are difficult to implement and require strong institutional and human capacities that are often lacking. In this case, PPPs could instead drive the cost of investment up (Bitran, Nieto-Parra and Robledo, 2013).
Risks remain for successful PPP implementation in Africa. Financing risks, followed by regulatory and political risks, are the most significant obstacles for PPP implementation, according to BMI’s Infrastructure Project Finance Ratings - an assessment of the risks in raising and repaying funds over the lifecycle of a project (BMI Research, 2013). For many infrastructure projects in the region, such as the pipeline project in the Niger Delta, security remains a main concern for both international workers and physical infrastructure (the pipeline is often a target of vandalism) (PwC, 2014).
Companies present at EMnet Africa also confirmed the importance of co-operation with banks and international organisations. For example, Morocco’s National Power and Drinking Water Office (ONEE) chose the Spanish firm Abengoa to lead a seawater desalination project, which was supported by the InfraMaroc investment fund and a consortium of local banks led by the Banque Marocaine du Commerce Extérieur. Once operational, the plant will provide 800 000 people with water daily and play an important role in the region’s economic development (ICA,
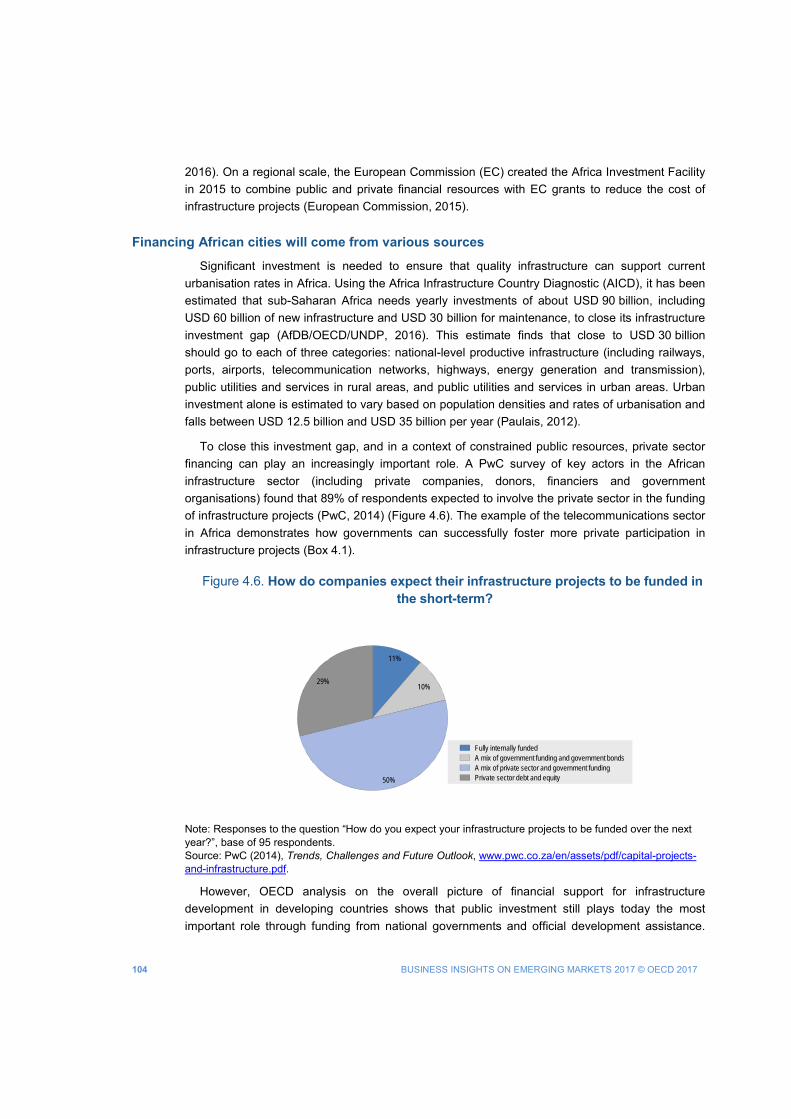
104 BUSINESS INSIGHTS ON EMERGING MARKETS 2017 © OECD 2017
2016). On a regional scale, the European Commission (EC) created the Africa Investment Facility in 2015 to combine public and private financial resources with EC grants to reduce the cost of infrastructure projects (European Commission, 2015).
Financing African cities will come from various sources
Significant investment is needed to ensure that quality infrastructure can support current urbanisation rates in Africa. Using the Africa Infrastructure Country Diagnostic (AICD), it has been estimated that sub-Saharan Africa needs yearly investments of about USD 90 billion, including USD 60 billion of new infrastructure and USD 30 billion for maintenance, to close its infrastructure investment gap (AfDB/OECD/UNDP, 2016). This estimate finds that close to USD 30 billion should go to each of three categories: national-level productive infrastructure (including railways, ports, airports, telecommunication networks, highways, energy generation and transmission), public utilities and services in rural areas, and public utilities and services in urban areas. Urban investment alone is estimated to vary based on population densities and rates of urbanisation and falls between USD 12.5 billion and USD 35 billion per year (Paulais, 2012).
To close this investment gap, and in a context of constrained public resources, private sector financing can play an increasingly important role. A PwC survey of key actors in the African infrastructure sector (including private companies, donors, financiers and government organisations) found that 89% of respondents expected to involve the private sector in the funding of infrastructure projects (PwC, 2014) (Figure 4.6). The example of the telecommunications sector in Africa demonstrates how governments can successfully foster more private participation in infrastructure projects (Box 4.1).
Figure 4.6. How do companies expect their infrastructure projects to be funded in the short-term?
Note: Responses to the question “How do you expect your infrastructure projects to be funded over the next year?”, base of 95 respondents. Source: PwC (2014), Trends, Challenges and Future Outlook, www.pwc.co.za/en/assets/pdf/capital-projects-and-infrastructure.pdf.
However, OECD analysis on the overall picture of financial support for infrastructure development in developing countries shows that public investment still plays today the most important role through funding from national governments and official development assistance.
11%
10%
50%
29%
Fully internally fundedA mix of government funding and government bondsA mix of private sector and government fundingPrivate sector debt and equity
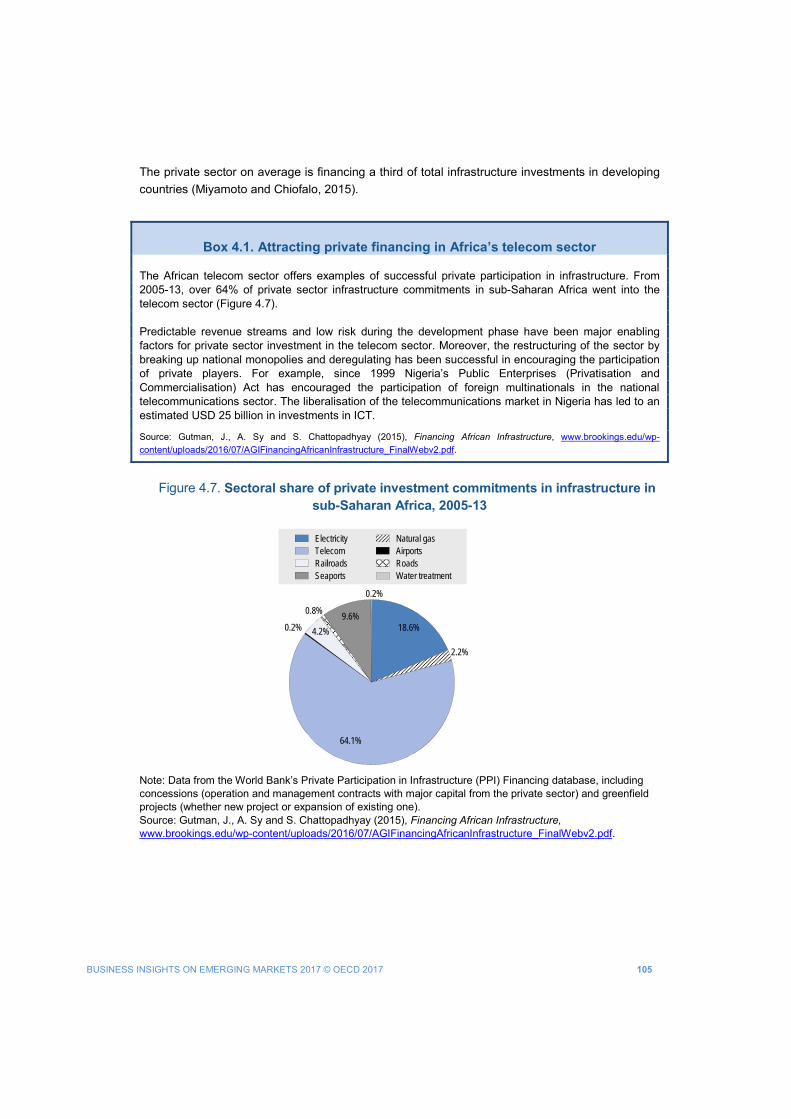
BUSINESS INSIGHTS ON EMERGING MARKETS 2017 © OECD 2017 105
The private sector on average is financing a third of total infrastructure investments in developing countries (Miyamoto and Chiofalo, 2015).
Box 4.1. Attracting private financing in Africa’s telecom sector The African telecom sector offers examples of successful private participation in infrastructure. From 2005-13, over 64% of private sector infrastructure commitments in sub-Saharan Africa went into the telecom sector (Figure 4.7).
Predictable revenue streams and low risk during the development phase have been major enabling factors for private sector investment in the telecom sector. Moreover, the restructuring of the sector by breaking up national monopolies and deregulating has been successful in encouraging the participation of private players. For example, since 1999 Nigeria’s Public Enterprises (Privatisation and Commercialisation) Act has encouraged the participation of foreign multinationals in the national telecommunications sector. The liberalisation of the telecommunications market in Nigeria has led to an estimated USD 25 billion in investments in ICT.
Source: Gutman, J., A. Sy and S. Chattopadhyay (2015), Financing African Infrastructure, www.brookings.edu/wp-content/uploads/2016/07/AGIFinancingAfricanInfrastructure_FinalWebv2.pdf.
Figure 4.7. Sectoral share of private investment commitments in infrastructure in
sub-Saharan Africa, 2005-13
Note: Data from the World Bank’s Private Participation in Infrastructure (PPI) Financing database, including concessions (operation and management contracts with major capital from the private sector) and greenfield projects (whether new project or expansion of existing one). Source: Gutman, J., A. Sy and S. Chattopadhyay (2015), Financing African Infrastructure, www.brookings.edu/wp-content/uploads/2016/07/AGIFinancingAfricanInfrastructure_FinalWebv2.pdf.
18.6%
2.2%
64.1%
0.2% 4.2%
0.8%9.6%
0.2%
Electricity Natural gasTelecom AirportsRailroads RoadsSeaports Water treatment
106 BUSINESS INSIGHTS ON EMERGING MARKETS 2017 © OECD 2017
Business linkages can help foreign multinationals penetrate new markets
Developing business linkages with local partners can be highly beneficial for multinational firms seeking to expand in African urban markets. This can occur in three different ways: 1) backward linkages with suppliers; 2) linkages with technology partners; and 3) forward linkages with distributors and retailers (UNCTAD, 2010):
• Backward linkages can occur when multinational firms buy inputs from local suppliers such
as services or raw materials. In 2013, GE Transportation, a subsidiary of General Electric, set up a partnership with South Africa’s Transnet Rail Engineering to assemble and manufacture locomotives at Transnet’s Koedoespoort facility in Pretoria, South Africa. The goal was to reach 40% in local content and involve several local small- and medium-sized enterprises as suppliers (GE South Africa Technologies, 2013).
• Linkages with technology partners can be strategic partnerships, joint ventures or licensing deals. One example is the multinational ICT provider Huawei and its partnership with the Kenyan mobile network operator company Safaricom to improve local security in the areas covered by Huawei’s Safe City Solution project (Huawei, 2016a).
• Forward linkages with distributors and retailers are the result of outsourcing product distribution and local brand name management. Kellogg set up a joint venture with the Singaporean Tolaram Group’s Nigerian food distributor Multipro Enterprise Limited to expand sales in Africa (Fick, 2015; Giammona, 2015).
Local skills are needed to develop sustainable African cities
Participants in the EMnet Africa meeting highlighted their experiences in finding and retaining local talent. In the case of South Africa, for example, a study led by ManpowerGroup found that 34% of employers were encountering difficulties in finding the right candidates. The hardest profiles to find are workers in skilled trades, management executives, office support staff and engineers (ManpowerGroup, 2016). A survey conducted in 2014 by EY of 308 companies operating in 23 sub-Saharan countries showed that 70% of respondents were recruiting to support their growth on the continent, but only one-third of the respondents considered labour market institutions to be effective. The same survey highlighted that workers were more attracted by learning opportunities, career development and quality management than high wages (EY, 2014).
The rapidly changing marketplace and the increased technicality of jobs require companies to train local workers to meet their own hiring needs. For example, Johnson & Johnson’s new global public health policy for Africa, together with the University of Cape Town’s Drug Discovery and Development Centre, aims to expand research and development (R&D) skills and capacity among African scientists (Johnson & Johnson, 2016). In addition, Cisco Networking Academy programmes are now present in 47 African countries with 810 institutions and have taught more than 92 574 students how to design, build and maintain telecommunications networks (Meads, 2015).
Some firms during the EMnet meeting highlighted the risk that employees benefitting from training become more attractive in the labour market and get hired elsewhere with better job conditions. The same firms, however, confirm that they are willing to take this risk, because the
BUSINESS INSIGHTS ON EMERGING MARKETS 2017 © OECD 2017 107
benefits of improving their employees’ skills and competencies are greater than the costs of losing some of them afterwards.
Significant investment opportunities exist for technology solutions in support of African cities
New technologies have the potential to generate significant investment opportunities for African cities. Mobile phone technologies are expected to reach a 97% average subscription rate in Africa by 2017. This has enabled cities to bypass regular fixed landlines and leapfrog the associated maintenance costs developed nations face (Meads, 2015). To fully benefit from digitalisation and the “Internet of Things” (IoT) – the idea of connecting and integrating any device to the Internet – Africa will need to improve its Internet penetration, which was still at 26% in 2015 (Meads, 2015). High-speed broadband development in Africa remains low despite progress in connectivity. Commercial, technical and affordability difficulties to extend coverage to poorer urban districts and remote rural areas seem to be the main reason for this poor performance (Reed, 2016).
The Smart Africa Alliance, for example, places the private sector at the centre of Africa’s ICT development for cities and demonstrates how new technologies can serve as catalysts to attract investments from foreign multinational companies (Box 4.2).
Box 4.2. Global multinationals in support of smart African cities: The Smart Africa Alliance
The Smart Africa Alliance is based on the core principles of the Smart Africa Manifesto, a document that was endorsed in 2014 by all the members of the African Union aimed at accelerating ICT usage for enhanced socio-economic development. The Alliance aims to harmonise regulatory and legal policy frameworks on the continent, generate demand for ICT, establish favourable market conditions, enable the formation of new industries and job creation, and attract USD 300 billion in ICT investments by 2020. To reach these goals, the Alliance puts the private sector at the centre of Africa’s ICT transformation, which is to be efficient, more accountable and open. The initiative therefore involves global companies with extensive expertise in the telecommunications sector across the continent:
• Huawei joined the Alliance in July 2016. One of the first Chinese firms to invest in Africa in 1998, the company now provides improved connectivity solutions in more than 50 African coun-tries, promoting Africa’s digitalisation, fostering skills transfer and improving ICT infrastructure.
• The telecommunications and networking company Ericsson, following its partnership with the government of Rwanda on projects in the public security, financial, transport and utilities sectors as part of the Smart Kigali initiative, joined the Alliance in 2016 to share the expertise it gained with other African nations.
• Inmarsat, a satellite telecommunications company, joined the Alliance in 2015 and is investing in sub-Saharan Africa as part of a two-year programme of the UK Space Agency. It is involved in Nigeria and Kenya, where it seeks to increase connectivity via satellites. And Immarsat part-nered with the Equity Bank Group to help develop access to financial services in more than 200 sites across Kenya.
Source: Huawei (2016b), “Huawei joins Smart Africa to drive Africa's digital transformation”, www.huawei.com/en/news/2016/7/Huawei-joins-Smart-Africa; Ericsson (2016), “Ericsson joins the SMART Africa Alliance to drive a digital Africa”, www.ericsson.com/news/160512-ericsson-joins-the-smart-africa-alliance_244039855_c; Inmarsat (2016), Digital Frontiers Overview section, Inmarsat website, www.inmarsat.com/digital-frontiers/; Transform Africa (2013), “The Smart Africa Manifesto”, www.smartafrica.org/IMG/pdf/smart_africa_manifesto_2013_-_english_version.pdf; Smart Africa (2016), Smart Africa Strategic Vision, www.smartafrica.org/IMG/pdf/smart_africa_strategic_vision.pdf.
108 BUSINESS INSIGHTS ON EMERGING MARKETS 2017 © OECD 2017
Technology and digitalisation can help cities tackle urban challenges
African cities are facing numerous sustainability challenges related to environmental issues. The economic cost of premature deaths from four environmental risk factors – ambient and household air pollution, unsafe water and poor sanitation – is estimated to have exceeded USD 850 billion in 2013 and is heading towards USD 1 trillion in the near future, or nearly two-thirds of the continent’s GDP (Roy, 2016).
New technologies and digitalisation brought in by the private sector can help to solve these sustainability issues while reducing the cost of products and services. For example, using intelligent sensors for motion-reacting street lights could substantially benefit Africa, where only 20% of countries have implemented sustainable strategies on energy usage (AfDB/OECD/UNDP, 2016). Seeing this opportunity, IBM invested in research centres in Kenya and South Africa to make African urban areas “smarter” (IBM, 2016). In Kenya, IBM helped the government to develop applications to improve the city of Nairobi’s waste management by monitoring dumpsite capacity, garbage collection time and the time spent in traffic, and road quality (Onyalo, Kandie and Njuki, 2015). Veolia Africa has provided governments throughout the continent with solutions to manage energy supply, clean water and waste services. For example, Veolia’s water company Société d’Exploitation des Eaux du Niger provided access to water to over 2.7 million people in Niger in 2015 (SEEN, 2015).
Innovative business models can include Africa’s informal economy
The informal economy accounts for up to 50-80% of the overall African economy (Benjamin and Mbaye, 2014). Lack of formal employment and a growing informal sector have been particularly challenging for sub-Saharan Africa. Low productivity and informal jobs are prevalent in urban areas of countries that have based their economic development on natural resource extraction and agricultural exports (AfDB/OECD/UNDP, 2016).
Some companies are using innovative ways to address informality. The Bel Group, a French cheese-making firm, takes informal entrepreneurs on board via a network called “Sharing Cities” to build and optimise its distribution systems based on existing street-vendor communities across Africa (Guesné and Ménascé, 2014). It also provides benefits to informal micro-entrepreneurs, such as training and access to micro-credit, thus providing support towards the formalisation of their businesses. Another example is the spread of digital payment systems, such as Orange Money in Côte d’Ivoire and M-Pesa in Kenya, that provide informal businesses with easier access to credit and allows them to interact more easily with the formal economy (AfDB/OECD/UNDP, 2016).
BUSINESS INSIGHTS ON EMERGING MARKETS 2017 © OECD 2017 109
CONCLUSION The private sector can play a significant role in Africa’s urban development. Participants
highlighted the importance of technology, connectivity and digitalisation to make cities more efficient and sustainable. Businesses also can support the generation of more formal job opportunities and encourage skills development. Setting up business linkages with local companies was perceived as a critical step to facilitate foreign investment, but finding suitable local partners remains challenging. Since two-thirds of urban investments are still to be made by 2050, financing for African cities will come from various sources and will increasingly involve the private sector in the future.
The challenges posed by rapidly growing cities also will require greater government support. EMnet Africa participants highlighted three main areas where public policies are needed. First, capacities and skills of civil servants must be reinforced. Beyond this, the private sector finds it difficult to hire local staff with the skills needed to support business operations. Secondly, while some PPPs have supported the completion of large infrastructure projects, such as Senegal’s Dakar-Diamniadio toll highway and Cotonou’s container terminal in Benin, efforts to create nationwide regulatory frameworks for PPPs could further reduce associated costs and risks. Finally, commitment from governments is necessary to enhance FDI in value-added sectors. The example of telecommunications is particularly relevant to show how an appropriate enabling environment can be a key success factor in attracting private investment.
110 BUSINESS INSIGHTS ON EMERGING MARKETS 2017 © OECD 2017
Notes 1 West Africa comprises Benin, Burkina Faso, Cape Verde, Côte d'Ivoire, Gambia, Ghana, Guinea, Guinea-Bissau,
Liberia, Mali, Niger, Nigeria, Senegal, Sierra Leone and Togo. East Africa comprises Burundi, Comoros, Djibouti, Eritrea, Ethiopia, Kenya, Rwanda, Seychelles, Somalia, South Sudan, Sudan, Tanzania and Uganda.
2 The following countries were included in the ATAF study: Burundi, Cameroon, Gambia, Kenya, Lesotho, Mauritius, Rwanda, Senegal, Seychelles, South Africa, Swaziland, Tanzania, Togo, Uganda and Zimbabwe.
References
AAPS (2016), Who We Are section, Association of Planning African Schools website, www.africanplanningschools.org.za/about-us/who-we-are (accessed 6 December 2016).
AfDB/OECD/UNDP (2016), African Economic Outlook 2016: Sustainable Cities and Structural Transformation, OECD Publishing, Paris. http://dx.doi.org/10.1787/aeo-2016-en.
AfDB/OECD/UNDP (2015), African Economic Outlook 2015: Regional Development and Spatial Inclusion, OECD Publishing, Paris. http://dx.doi.org/10.1787/aeo-2015-en.
ATAF (2016), Africa Tax Outlook 2016, African Tax Administration Forum Publication, Menlo Park, South Africa, www.ataftax.org/en/Documents/ATO%20Africa%20Tax%20Outlook_Book_Eng%20Version_Final_Lowres.pdf.
Benjamin, N. and A. A. Mbaye (2014), “Informality, growth, and development in Africa”, United Nations University - World Institute for Development Economics Research, WIDER Working Paper No. 2014/052, UNU-WIDER, Helsinki, www.wider.unu.edu/sites/default/files/wp2014-052.pdf.
Bitran, E., Nieto-Parra, S. and Robledo J.S. (2013), “Opening the Black Box of Contract Renegotiations: An Analysis of Road Concessions in Chile, Colombia and Peru”, OECD Development Centre Working Papers, No. 317, OECD Publishing, Paris, http://www.oecd.org/officialdocuments/publicdisplaydocumentpdf/?cote=DEV/DOC%282013%292&docLanguage=En.
BMI Research (2013), “New PPPs Flood Market, As Capital Remains Scarce”, 10 October, Fitch Group Company, BMI Research website, www.bmiresearch.com/news-and-views/new-ppps-flood-market-as-capital-remains-scarce.
Carter, L. (2015), “Five secrets of success of Sub-Saharan Africa’s first road PPP”, World Bank Group, Infrastructure & Public-Private Partnerships Blog, 29 May, The World Bank website, http://blogs.worldbank.org/ppps/five-secrets-success-sub-saharan-africa-s-first-road-ppp.
Deloitte & Touche (2012), “Deloitte on Africa: The Rise and Rise of the African Middle Class”, Deloitte & Touche, Johannesburg, Deloitte & Touche website, www.deloitte.com/content/dam/Deloitte/au/Documents/international-specialist/deloitte-au-aas-rise-african-middle-class-12.pdf.
Engerati (2016), “Smart cities: Adapting the concept to the African continent”, 8 July, Engerati website, www.engerati.com/article/smart-cities-adapting-concept-african-continent.
Ericsson (2016), “Ericsson joins the SMART Africa Alliance to drive a digital Africa”, 5 May, Ericsson website, www.ericsson.com/news/160512-ericsson-joins-the-smart-africa-alliance_244039855_c.
European Commission (2015), “Creation of the Africa Investment Facility - Action fiche”, Annex of the Commission Decision on the individual measure "creation of an Africa Investment Facility" under the 11th European Development Fund, European Commission, Brussels, https://ec.europa.eu/europeaid/creation-africa-investment-facility-action-fiche_en.
EY (2014), Realising potential, EY 2014 Sub-Saharan Africa Talent Trends and Practices Survey, Ernst & Young Global Limited, London, www.ey.com/Publication/vwLUAssets/EY-2014-SSA-Talent-Trends-Survey-Report/$FILE/EY-2014-SSA-Talent-Trends-Survey-Report.pdf.
fDi Markets (2017), fDi Markets online data bank, Financial Times Ltd., www.fdimarkets.com (accessed 13 January 2017).
BUSINESS INSIGHTS ON EMERGING MARKETS 2017 © OECD 2017 111
Fick, M. (2015), “Kellogg faces tough environment as it expands in Nigeria”, 23 September, Financial Times, Financial Times website, www.ft.com/content/5437ef98-603b-11e5-9846-de406ccb37f2.
GE South Africa Technologies (2013), “GE, Transnet partner to revive Africa’s rail, drive regional integration and growth”, 15 February, GE South Africa Technologies website, www.gesat.co.za/news/entry/ge-transnet-partner-to-revive-africas-rail-drive-regional-integration-and-g.
Giammona, C. (2015), “Kellogg to Buy $450 Million Multipro Stake to Grow in Africa”, 15 September, Bloomberg website, www.bloomberg.com/news/articles/2015-09-15/kellogg-to-buy-450-million-stake-in-multipro-to-grow-in-africa.
Guesné J.-M. & and D. Ménascé (2014), “Sharing Cities: An Innovative Partnership between the Bel Group and Street Vendors: The experience in Ho Chi Minh”, Field Actions Science Reports, Last Mile Delivery, Special Issue No. 12, http://factsreports.revues.org/3694.
Gutman, J., A. Sy and S. Chattopadhyay (2015), Financing African Infrastructure: Can the World Deliver?, March, Global Economy and Development program, Brookings Institution, Washington DC, www.brookings.edu/wp-content/uploads/2016/07/AGIFinancingAfricanInfrastructure_FinalWebv2.pdf.
Huawei (2016a), Huawei Hosts Safe City Summit in Africa, 15 October, Huawei website, http://eblog.huawei.com/huawei-hosts-safe-city-summit-africa.
Huawei (2016b), “Huawei joins Smart Africa to drive Africa's digital transformation”, 18 July, Huawei website, www.huawei.com/en/news/2016/7/Huawei-joins-Smart-Africa.
IBM (2016), “IBM Research Opens in South Africa; Cognitive Computing and the IoT help Track Diseases and Forecast Air Quality”, Press Release, 25 August, IBM website, www.ibm.com/press/us/en/pressrelease/50396.wss.
ICA (2016), Infrastructure Financing Trends in Africa – 2015, ICA Report, The Infrastructure Consortium for Africa, Abidjan, www.icafrica.org/fileadmin/documents/Annual_Reports/ICA_2015_annual_report.pdf.
IEA (2014), Africa Energy Outlook: A Focus on Energy Prospects in Sub-Saharan Africa, World Energy Outlook Special Report, International Energy Agency, Paris, www.iea.org/publications/freepublications/publication/WEO2014_AfricaEnergyOutlook.pdf.
IMF (2015), Regional Economic Outlook: Sub-Saharan Africa 2015 Navigating Headwinds, April, International Monetary Fund, Washington DC, www.imf.org/external/pubs/ft/reo/2015/afr/eng/pdf/sreo0415.pdf.
Inmarsat (2016), Digital Frontiers Overview section, Inmarsat website, www.inmarsat.com/digital-frontiers/ (accessed 5 December 2016).
Johnson & Johnson (2016), “Johnson & Johnson Announces Launch of New Global Public Health Strategy at Opening of New Operations in Africa”, Press Release, 6 April, http://ideas.jnjinnovation.com/GPH%20Strategy%20Africa%20Ops%20Launch%20PR%20FINAL%207PM%20EST%20APRIL%205.pdf.
JSE (2014), “The Johannesburg Stock Exchange lists its first green bond”, 9 June, Johannesburg Stock Exchange website, www.jse.co.za/news/the-johannesburg-stock-exchange-lists-its-first-green-bond.
Kenny, J. and R. Lavanchy (2013), Emerging Partnerships: Top 40 PPPs in Emerging Markets, Infrastructure Journal, PPIAF and International Finance Corporation, World Bank Group, Washington DC, http://documents.worldbank.org/curated/en/735231468162282764/pdf/758380WP0Emerg00Box374351B00PUBLIC0.pdf.
Losch, B., S. Fréguin-Gresh and E.T. White (2012), Structural Transformation and Rural Change Revisited: Challenges for Late Developing Countries in a Globalizing World, African Development Forum series, World Bank, Washington DC, www.afd.fr/webdav/site/afd/shared/PUBLICATIONS/RECHERCHE/Scientifiques/Co-editions/Structural_Transformation_RuralChange_Revisited.pdf.
ManpowerGroup (2016), “2016/2017 Talent Shortage Survey: South Africa Results”, Africa Business, http://africabusiness.com/wp-content/uploads/2016/10/2016_TSS_SouthAfrica_Infographic.pdf.
Meads, D. (2015), “What the Internet of Everything will do for Africa”, World Economic Forum (WEF), WEF website, 2 June, www.weforum.org/agenda/2015/06/what-the-internet-of-everything-will-do-for-africa/.
112 BUSINESS INSIGHTS ON EMERGING MARKETS 2017 © OECD 2017
Miyamoto, K. and E. Chiofalo (2015), "Official Development Finance for Infrastructure: Support by Multilateral and Bilateral Development Partners", OECD Development Co-operation Working Papers, No. 25, OECD Publishing, Paris, http://dx.doi.org/10.1787/5jrs3sbcrvzx-en.
OECD/ATAF/AUC (2016), Revenue Statistics in Africa, OECD Publishing, Paris, http://dx.doi.org/10.1787/9789264253308-en-fr.
OECD (2016), Business Insights on Emerging Markets 2015, OECD Emerging Markets Network, OECD Development Centre, Paris, www.oecd.org/dev/oecdemnet.htm.
OECD (2015), OECD Investment Policy Reviews: Nigeria 2015, OECD Publishing, Paris, http://dx.doi.org/10.1787/9789264208407-en.
OECD (2014a), OECD Investment Policy Reviews: Botswana 2014, OECD Publishing, Paris, http://dx.doi.org/10.1787/9789264203365-en.
OECD (2014b), Public-Private Partnerships in the Middle East and North Africa: A Handbook for Policy Makers, Private Sector Development Handbook, OECD Publishing, Paris, www.oecd.org/mena/competitiveness/PPP%20Handbook_EN_with_covers.pdf.
OECD (2013), OECD Investment Policy Reviews: Tanzania 2013, OECD Publishing, Paris, http://dx.doi.org/10.1787/9789264204348-en.
Onyalo, N., H. Kandie and J. Njuki (2015), “The Internet of Things, Progress Report for Africa: A Survey”, International Journal of Computer Science and Software Engineering, Vol. 4, No. 9, September, http://ijcsse.org/published/volume4/issue9/p2-V4I9.pdf.
Paulais, T. (2012), Financing Africa's Cities: The Imperative of Local Investment, Africa Development Forum; World Bank Group, Washington DC, https://openknowledge.worldbank.org/handle/10986/12480.
PIDA (2011), Infrastructure Outlook 2040, Programme for Infrastructure Development in Africa, African Development Bank Group, http://afdb-org.jp/file/news-and-pressrelease/PIDA_EN_140523_ONRI-Rapport_jp.pdf.
PwC (2014), Trends, challenges and future outlook: Capital projects and infrastructure in East Africa, Southern Africa and West Africa, PricewaterhouseCoopers website, www.pwc.co.za/en/assets/pdf/capital-projects-and-infrastructure.pdf.
Reed, M. (2016), “Africa poised to hit 1bn mobile subscriptions”, 20 December, Financial Times blogs, http://blogs.ft.com/beyond-brics/2016/12/20/africa-poised-to-hit-1bn-mobile-subscriptions/.
Roy, R. (2016), “The cost of air pollution in Africa”, OECD Development Centre Working Papers, No. 333, OECD Publishing, Paris, http://dx.doi.org/10.1787/5jlqzq77x6f8-en.
SEEN (2015), “L’eau potable, essence de la vie”, Société d’Exploitation des Eaux du Niger, SEEN website, www.seen-niger.com/fr/activites/gestion-de-l-eau/l-eau-potable-essence-de-la-vie (accessed 4 January).
Smart Africa (2016), Smart Africa Strategic Vision, Smart Africa website, www.smartafrica.org/IMG/pdf/smart_africa_strategic_vision.pdf.
Transform Africa (2013), “The Smart Africa Manifesto – Endorsed by Heads of State and Government in Kigali on 29th October 2013”, Smart Africa website, www.smartafrica.org/IMG/pdf/smart_africa_manifesto_2013_-_english_version.pdf.
UNCTAD (2016), World Investment Report 2016 – Investor Nationality: Policy Challenges, United Nations Conference on Trade and Development, New York, http://unctad.org/en/PublicationsLibrary/wir2016_en.pdf.
UNCTAD (2010), Creating Business Linkages: A Policy Perspective, United Nations Conference on Trade and Development, New York and Geneva, www.unctad.org/en/docs/diaeed20091_en.pdf.
UN-DESA (2014), World Urbanization Prospects (database), United Nations Department of Economic and Social Affairs, https://esa.un.org/unpd/wpp/.
UN-Habitat (2014), The State of African cities 2014: Re-imagining Sustainable Urban Transitions, United Nations Human Settlements Programme, Nairobi, http://mirror.unhabitat.org/pmss/getElectronicVersion.aspx?nr=3528&alt=1.
BUSINESS INSIGHTS ON EMERGING MARKETS 2017 © OECD 2017 113
White, D. (2015), “Rwanda’s vision of an ICT-enabled economy”, 24 April, Financial Times, Financial Times website, www.ft.com/content/fc318106-deda-11e4-b9ec-00144feab7de.
World Bank (2016), Doing Business 2016: Measuring Regulatory Quality and Efficiency, World Bank, Washington DC, www.doingbusiness.org/reports/global-reports/doing-business-2016.
World Bank Group (2017), Global Economic Prospects, January 2017: Weak Investment in Uncertain Times, World Bank, Washington DC, https://openknowledge.worldbank.org/bitstream/handle/10986/25823/9781464810169.pdf?sequence=5&isAllowed=y.

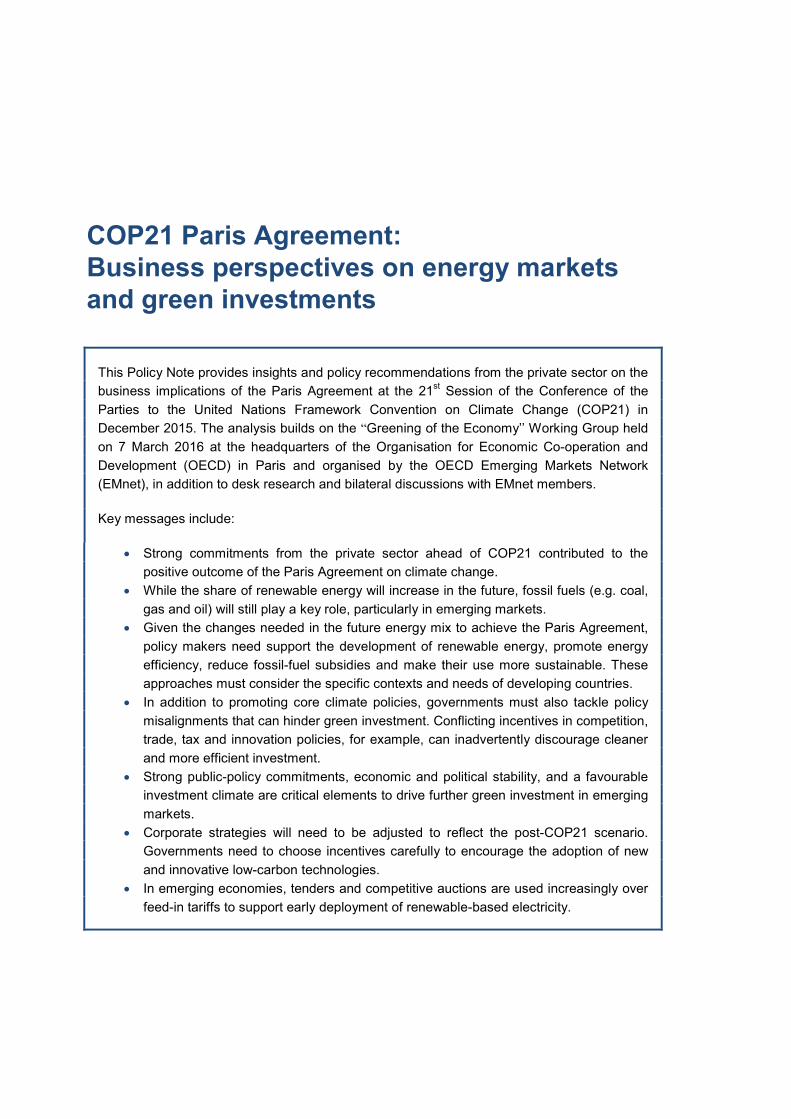
COP21 Paris Agreement: Business perspectives on energy markets and green investments
This Policy Note provides insights and policy recommendations from the private sector on the business implications of the Paris Agreement at the 21st Session of the Conference of the Parties to the United Nations Framework Convention on Climate Change (COP21) in December 2015. The analysis builds on the “Greening of the Economy’’ Working Group held on 7 March 2016 at the headquarters of the Organisation for Economic Co-operation and Development (OECD) in Paris and organised by the OECD Emerging Markets Network (EMnet), in addition to desk research and bilateral discussions with EMnet members.
Key messages include:
• Strong commitments from the private sector ahead of COP21 contributed to the positive outcome of the Paris Agreement on climate change.
• While the share of renewable energy will increase in the future, fossil fuels (e.g. coal, gas and oil) will still play a key role, particularly in emerging markets.
• Given the changes needed in the future energy mix to achieve the Paris Agreement, policy makers need support the development of renewable energy, promote energy efficiency, reduce fossil-fuel subsidies and make their use more sustainable. These approaches must consider the specific contexts and needs of developing countries.
• In addition to promoting core climate policies, governments must also tackle policy misalignments that can hinder green investment. Conflicting incentives in competition, trade, tax and innovation policies, for example, can inadvertently discourage cleaner and more efficient investment.
• Strong public-policy commitments, economic and political stability, and a favourable investment climate are critical elements to drive further green investment in emerging markets.
• Corporate strategies will need to be adjusted to reflect the post-COP21 scenario. Governments need to choose incentives carefully to encourage the adoption of new and innovative low-carbon technologies.
• In emerging economies, tenders and competitive auctions are used increasingly over feed-in tariffs to support early deployment of renewable-based electricity.
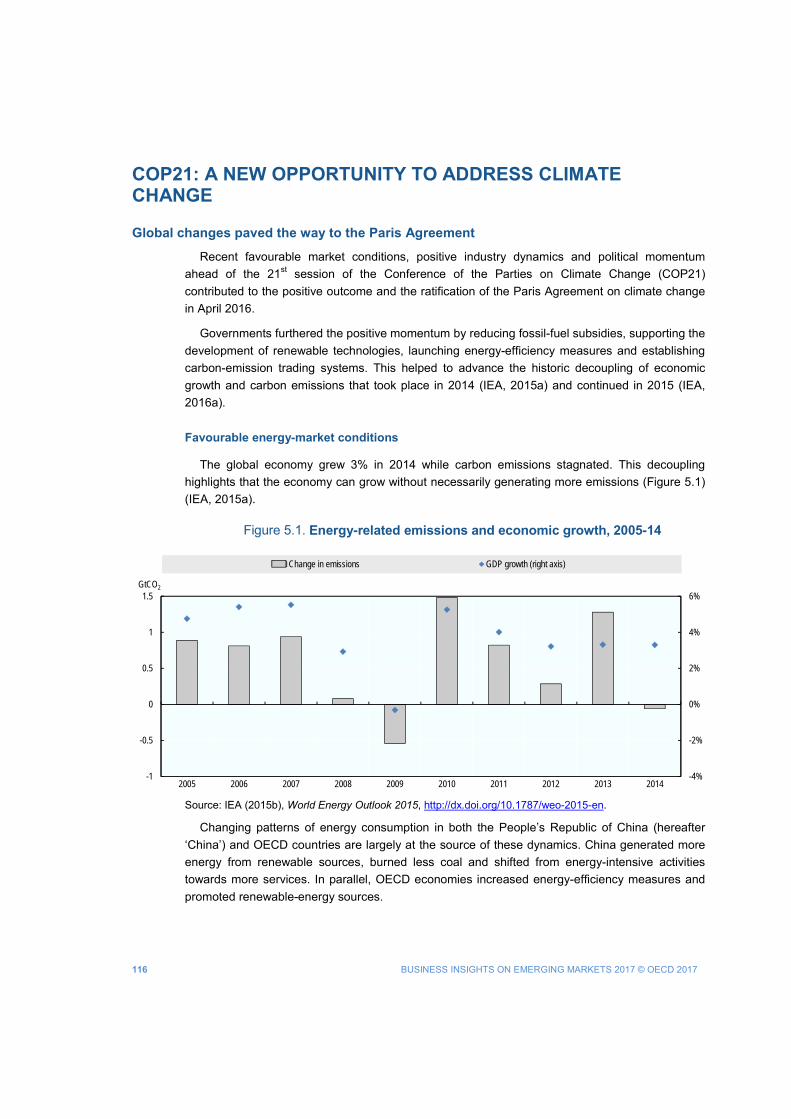
116 BUSINESS INSIGHTS ON EMERGING MARKETS 2017 © OECD 2017
COP21: A NEW OPPORTUNITY TO ADDRESS CLIMATE CHANGE
Global changes paved the way to the Paris Agreement
Recent favourable market conditions, positive industry dynamics and political momentum ahead of the 21st session of the Conference of the Parties on Climate Change (COP21) contributed to the positive outcome and the ratification of the Paris Agreement on climate change in April 2016.
Governments furthered the positive momentum by reducing fossil-fuel subsidies, supporting the development of renewable technologies, launching energy-efficiency measures and establishing carbon-emission trading systems. This helped to advance the historic decoupling of economic growth and carbon emissions that took place in 2014 (IEA, 2015a) and continued in 2015 (IEA, 2016a).
Favourable energy-market conditions
The global economy grew 3% in 2014 while carbon emissions stagnated. This decoupling highlights that the economy can grow without necessarily generating more emissions (Figure 5.1) (IEA, 2015a).
Figure 5.1. Energy-related emissions and economic growth, 2005-14
Source: IEA (2015b), World Energy Outlook 2015, http://dx.doi.org/10.1787/weo-2015-en.
Changing patterns of energy consumption in both the People’s Republic of China (hereafter ‘China’) and OECD countries are largely at the source of these dynamics. China generated more energy from renewable sources, burned less coal and shifted from energy-intensive activities towards more services. In parallel, OECD economies increased energy-efficiency measures and promoted renewable-energy sources.
-4%
-2%
0%
2%
4%
6%
-1
-0.5
0
0.5
1
1.5
2005 2006 2007 2008 2009 2010 2011 2012 2013 2014
GtCO2
Change in emissions GDP growth (right axis)
BUSINESS INSIGHTS ON EMERGING MARKETS 2017 © OECD 2017 117
It also is worth noting that the sharp fall in fossil-fuel prices has not reduced the appetite for electricity generation from renewable sources. According to the IEA, “easier financing, new business models and clearer long-term price signals, underpinned by supportive policies, have driven investment despite low fossil-fuel prices” (IEA, 2016b). In the long term, the growing cost of extracting oil and gas as sources become more difficult to reach will provide a further competitive edge to renewables (IEA, 2015b).
Positive industry dynamics for renewable energies
With new installed capacity reaching 130 gigawatts (GW) in 2014 (about USD 270 billion in investments), the renewable energy sector has become, collectively, the second-largest source of electricity generation worldwide, behind coal (IEA, 2015b).
While hydropower still accounts for nearly three-fourths of total renewable electricity generation (94% from large hydropower projects in 2014), non-hydro renewable sources such as wind and solar photovoltaics (PV) have increased their share in the global energy mix (IEA, 2015b; IEA, 2015c).1
Wind and solar power also made significant gains in installed capacity. Wind power, like hydropower, added more capacity to the grid and witnessed a near-record year in 2014 with a total of 48 GW in capacity additions. Three regions accounted for most wind and solar installations: China (20 GW), the European Union (12 GW) and the United States (5 GW) (IEA, 2015b). The annual amount of solar PV installations reached almost 40 GW in 2013, a nearly 70-fold increase in one decade, mainly driven by Japan and China (IEA, 2015b).
The renewable energy industry also has become an important source of job creation. In 2014, the industry employed 7.7 million persons worldwide (excluding large hydro construction projects), which amounted to an 18% increase over the previous year. The main employers were the solar PV sector with 2.5 million jobs (mainly in China), bioenergy industries with 1.8 million and wind with 1 million (IRENA, 2015).2
Wind and solar are becoming increasingly cost-competitive (Figure 5.2). Technological improvements, the expansion of manufacturing capacity and lower costs of production lines in China (accounting for 70% of global production in 2014) led the way to the bulk of cost reductions in solar PV. Reduced production costs and lower prices for solar panels were accompanied by lower “soft costs” in areas such as system design, installation and labour. In the wind industry, recent innovations in turbine technology produce more electricity for modest additional costs (IEA, 2015b and 2015c).
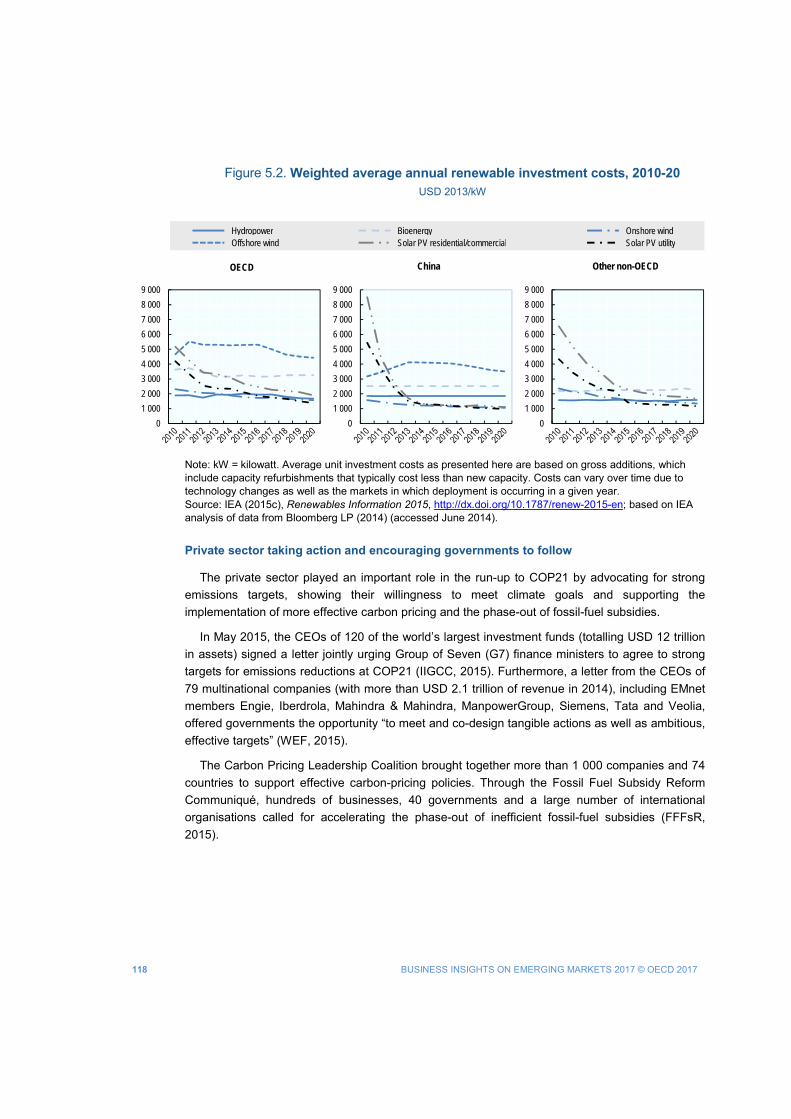
118 BUSINESS INSIGHTS ON EMERGING MARKETS 2017 © OECD 2017
Figure 5.2. Weighted average annual renewable investment costs, 2010-20 USD 2013/kW
Note: kW = kilowatt. Average unit investment costs as presented here are based on gross additions, which include capacity refurbishments that typically cost less than new capacity. Costs can vary over time due to technology changes as well as the markets in which deployment is occurring in a given year. Source: IEA (2015c), Renewables Information 2015, http://dx.doi.org/10.1787/renew-2015-en; based on IEA analysis of data from Bloomberg LP (2014) (accessed June 2014).
Private sector taking action and encouraging governments to follow
The private sector played an important role in the run-up to COP21 by advocating for strong emissions targets, showing their willingness to meet climate goals and supporting the implementation of more effective carbon pricing and the phase-out of fossil-fuel subsidies.
In May 2015, the CEOs of 120 of the world’s largest investment funds (totalling USD 12 trillion in assets) signed a letter jointly urging Group of Seven (G7) finance ministers to agree to strong targets for emissions reductions at COP21 (IIGCC, 2015). Furthermore, a letter from the CEOs of 79 multinational companies (with more than USD 2.1 trillion of revenue in 2014), including EMnet members Engie, Iberdrola, Mahindra & Mahindra, ManpowerGroup, Siemens, Tata and Veolia, offered governments the opportunity “to meet and co-design tangible actions as well as ambitious, effective targets” (WEF, 2015).
The Carbon Pricing Leadership Coalition brought together more than 1 000 companies and 74 countries to support effective carbon-pricing policies. Through the Fossil Fuel Subsidy Reform Communiqué, hundreds of businesses, 40 governments and a large number of international organisations called for accelerating the phase-out of inefficient fossil-fuel subsidies (FFFsR, 2015).
0
1 000
2 000
3 000
4 000
5 000
6 000
7 000
8 000
9 000
OECD
0
1 000
2 000
3 000
4 000
5 000
6 000
7 000
8 000
9 000
China
0
1 000
2 000
3 000
4 000
5 000
6 000
7 000
8 000
9 000
Other non-OECD
Hydropower Bioenergy Onshore windOffshore wind Solar PV residential/commercial Solar PV utility
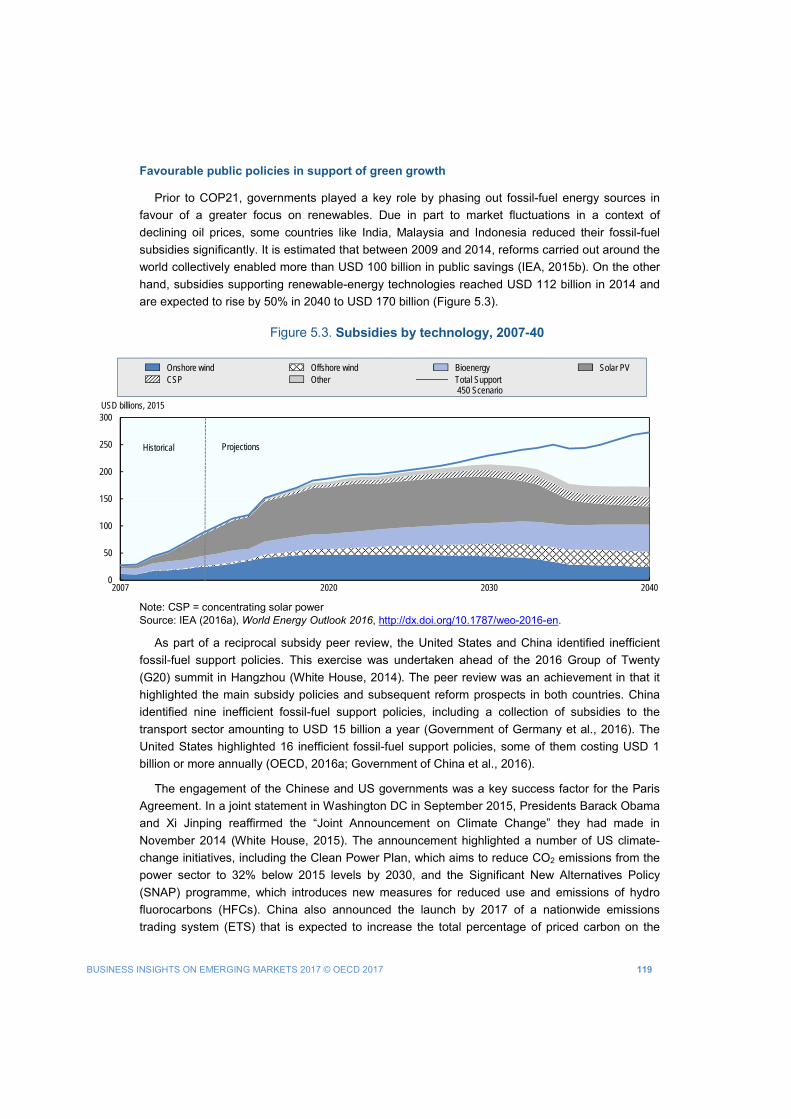
BUSINESS INSIGHTS ON EMERGING MARKETS 2017 © OECD 2017 119
Favourable public policies in support of green growth
Prior to COP21, governments played a key role by phasing out fossil-fuel energy sources in favour of a greater focus on renewables. Due in part to market fluctuations in a context of declining oil prices, some countries like India, Malaysia and Indonesia reduced their fossil-fuel subsidies significantly. It is estimated that between 2009 and 2014, reforms carried out around the world collectively enabled more than USD 100 billion in public savings (IEA, 2015b). On the other hand, subsidies supporting renewable-energy technologies reached USD 112 billion in 2014 and are expected to rise by 50% in 2040 to USD 170 billion (Figure 5.3).
Figure 5.3. Subsidies by technology, 2007-40
Note: CSP = concentrating solar power Source: IEA (2016a), World Energy Outlook 2016, http://dx.doi.org/10.1787/weo-2016-en.
As part of a reciprocal subsidy peer review, the United States and China identified inefficient fossil-fuel support policies. This exercise was undertaken ahead of the 2016 Group of Twenty (G20) summit in Hangzhou (White House, 2014). The peer review was an achievement in that it highlighted the main subsidy policies and subsequent reform prospects in both countries. China identified nine inefficient fossil-fuel support policies, including a collection of subsidies to the transport sector amounting to USD 15 billion a year (Government of Germany et al., 2016). The United States highlighted 16 inefficient fossil-fuel support policies, some of them costing USD 1 billion or more annually (OECD, 2016a; Government of China et al., 2016).
The engagement of the Chinese and US governments was a key success factor for the Paris Agreement. In a joint statement in Washington DC in September 2015, Presidents Barack Obama and Xi Jinping reaffirmed the “Joint Announcement on Climate Change” they had made in November 2014 (White House, 2015). The announcement highlighted a number of US climate-change initiatives, including the Clean Power Plan, which aims to reduce CO2 emissions from the power sector to 32% below 2015 levels by 2030, and the Significant New Alternatives Policy (SNAP) programme, which introduces new measures for reduced use and emissions of hydro fluorocarbons (HFCs). China also announced the launch by 2017 of a nationwide emissions trading system (ETS) that is expected to increase the total percentage of priced carbon on the
0
50
100
150
200
250
300
2007 2020 2030 2040
USD billions, 2015
Historical Projections
ProjectionsHistorical
Onshore wind Offshore wind Bioenergy Solar PVCSP Other Total Support
450 Scenario
120 BUSINESS INSIGHTS ON EMERGING MARKETS 2017 © OECD 2017
market from 13% to nearly 50%. China also is taking action to improve energy efficiency, whereby more than half of the country’s production is now subject to mandatory energy-efficiency standards compared to 3% in 2005 (IEA, 2015b).
Paris Agreement: Main takeaways for businesses
The unprecedented level of participation at COP21 in Paris led to an agreement including pledges from 190 countries. The commitments, represented by the countries’ Nationally Determined Contributions (NDCs), cover more than 95% of all energy-related greenhouse gas emissions (Chatterton, 2015). The scale of these commitments amounts to a real game-changer compared to past agreements; for example, the 1992 Kyoto Protocol covered only 15% of global energy-related emissions.
The outcomes of COP21 sent clear and strong political signals about the willingness to transition, by the end of the century, to zero net greenhouse gas emissions. To support this goal, economic and social policies must become resilient to climatic variability. In addition, financing must be leveraged, investment in technology scaled up further and capacity building expanded to support these aims. More specifically, the Paris Agreement includes a long-term goal of keeping temperature “well below” 2°C and to pursue the “efforts to limit” temperature increase to 1.5°C. The agreement further highlights that developing countries will take longer to achieve the peaking of emissions (UNFCCC, 2015).
The OECD experts from the EMnet Working Group underscored climate change mitigation, adaptation and finance as the elements of the agreement that are particularly relevant for the private sector. Mitigation refers to actions to reduce greenhouse gas emissions, adaptation to measures to enhance resilience to the impacts of climate change, and finance to the efforts to increase public funds available for low-carbon and climate-resilient investment.
Mitigation commitments to boost renewables and energy-efficiency opportunities
In terms of mitigation, the Paris Agreement establishes a set of binding commitments to “prepare, communicate and maintain” NDCs and to communicate a new NDC every five years. The agreement presses parties to “pursue domestic measures with the aim of achieving the objectives” (UNFCCC, 2015) without making this a binding obligation. Finally, it encourages countries to communicate their long-term low-emission strategies.
These mitigation commitments should further drive the implementation of supportive measures to develop renewables and promote energy-efficiency projects. New low-emission projects will be supported by major banks that pledged to scale up financing for renewable energy, green bonds and other low-carbon solutions. Examples of commitments include companies such as Crédit Agricole (dedicating USD 60 billion by 2018), BNP Paribas (lending USD 15 billion by 2020) and Bank of America (USD 125 billion pledged to low-carbon businesses by 2025) (Nakhooda, 2015; BNP Paribas, 2015).
In addition, industrial groups are taking action to support the development of a low-carbon economy. Mahindra & Mahindra announced in October 2016 its adoption of an internal carbon price of USD 10 per tonne of carbon emitted. This commitment is aligned with the company’s
BUSINESS INSIGHTS ON EMERGING MARKETS 2017 © OECD 2017 121
target to reduce greenhouse gas emissions by 25% and with India’s national climate-change policy following the ratification of the Paris Agreement (Mahindra & Mahindra, 2016).
Adaptation commitments will support infrastructure investments
Adaptation was highlighted as a crucial issue in the agreement. The qualitative, collective goal is to enhance adaptive capacity, strengthen resilience and reduce vulnerability. Nonetheless, countries “should” but are not obligated to communicate on their adaptation actions and priorities. As underscored by the IEA, investments of USD 359 trillion will need to be made in the building, industry, transport and power-generation sectors between 2015 and 2050 to reach the 2°C target (IEA, 2015d). Many of these investments will contribute to adaptation objectives.
These investments also will be opportunities for private companies seeking to invest in areas relevant for adaptation, such as constructing new buildings and expanding or retrofitting existing buildings and power plants. Adapting fossil-fuel-fired power plants for climate resiliency will offer additional opportunities. For example, to extend their lifetime, existing coal-fired power plants should be ready for Carbon Capture and Storage (CCS) retrofits, taking into account the space required for future storage sites and capture-related equipment (IEA, 2016b). Finally, the commitments made during COP21 by 25 Green Building Councils and 125 corporate members to “register, renovate or certify over 1.25 billion square metres of green building space” (about twice the size of Singapore) will represent significant opportunities for the private sector (World Green Building Council, 2015).
Climate finance to unlock green investment from the private sector
Financial support for the new climate goals plays a major role in the agreement, as stated in Article 2.1.c., which highlights the need for finance flows to be “consistent with a pathway towards low greenhouse gas emissions and climate-resilient development” (UNFCCC, 2015). Developed countries are legally obligated to “provide financial resources to assist developing country Parties with respect to both mitigation and adaptation.” The agreement “strongly urges” developed countries to scale up their level of financial support, “with a concrete roadmap to achieve the goal of jointly providing USD 100 billion annually by 2020” (UNFCCC, 2015).
Increased public financial support can play a role in improving the profitability of green investments and the development of innovative low-carbon technologies. Various institutions such as bilateral and multilateral development banks, as well as green investment banks, have been providing public climate finance. Since 2007, the European Investment Bank has increased its lending for renewable-energy and energy-efficiency projects, while the German national KfW Development Bank aims to invest EUR 27 billion every year to implement the bank’s energy turnaround plan by 2020 (Cochran et al., 2014). Since 2006, the European Bank for Reconstruction and Development has combined support for national-policy dialogue through its Sustainable Energy Initiative with project-level financing for less-energy-demanding industries (Cochran et al., 2014).
Publicly capitalised green investment banks are a new type of institution being used by policy makers to attract private capital into low-carbon, climate-resilient infrastructure projects, notably investments in renewable energy and energy efficiency. Green investment banks tend to combine
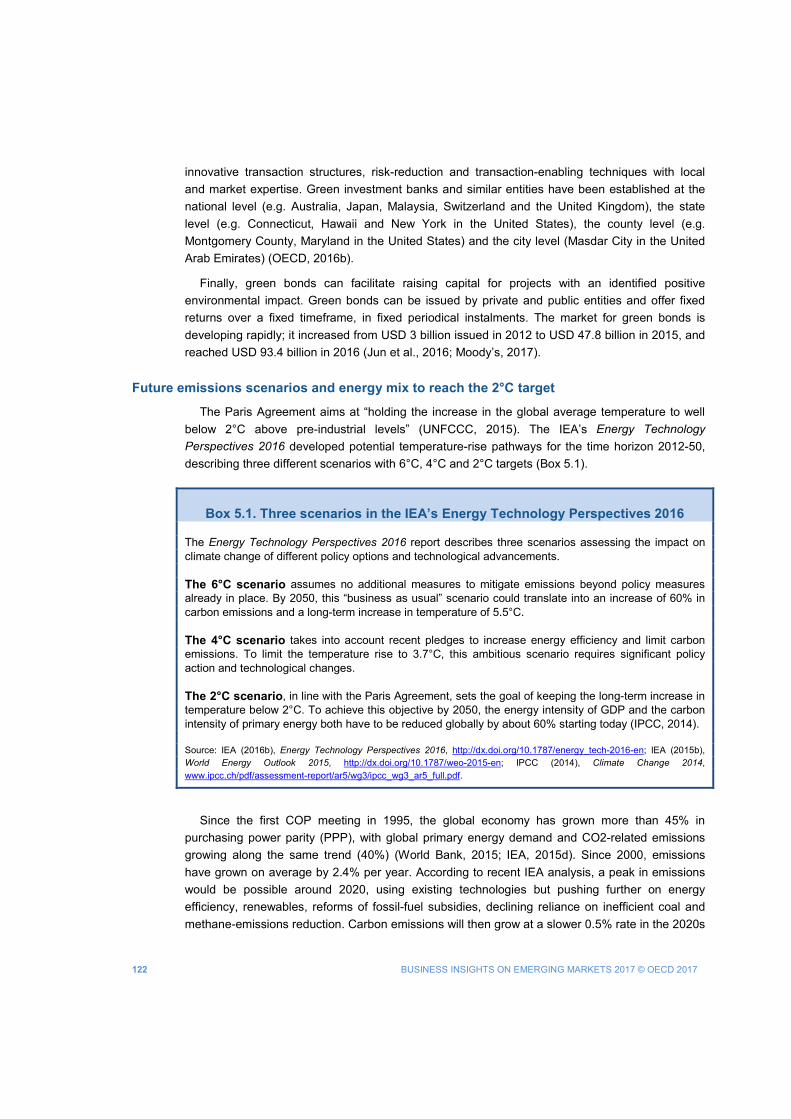
122 BUSINESS INSIGHTS ON EMERGING MARKETS 2017 © OECD 2017
innovative transaction structures, risk-reduction and transaction-enabling techniques with local and market expertise. Green investment banks and similar entities have been established at the national level (e.g. Australia, Japan, Malaysia, Switzerland and the United Kingdom), the state level (e.g. Connecticut, Hawaii and New York in the United States), the county level (e.g. Montgomery County, Maryland in the United States) and the city level (Masdar City in the United Arab Emirates) (OECD, 2016b).
Finally, green bonds can facilitate raising capital for projects with an identified positive environmental impact. Green bonds can be issued by private and public entities and offer fixed returns over a fixed timeframe, in fixed periodical instalments. The market for green bonds is developing rapidly; it increased from USD 3 billion issued in 2012 to USD 47.8 billion in 2015, and reached USD 93.4 billion in 2016 (Jun et al., 2016; Moody’s, 2017).
Future emissions scenarios and energy mix to reach the 2°C target
The Paris Agreement aims at “holding the increase in the global average temperature to well below 2°C above pre-industrial levels” (UNFCCC, 2015). The IEA’s Energy Technology Perspectives 2016 developed potential temperature-rise pathways for the time horizon 2012-50, describing three different scenarios with 6°C, 4°C and 2°C targets (Box 5.1).
Box 5.1. Three scenarios in the IEA’s Energy Technology Perspectives 2016
The Energy Technology Perspectives 2016 report describes three scenarios assessing the impact on climate change of different policy options and technological advancements.
The 6°C scenario assumes no additional measures to mitigate emissions beyond policy measures already in place. By 2050, this “business as usual” scenario could translate into an increase of 60% in carbon emissions and a long-term increase in temperature of 5.5°C.
The 4°C scenario takes into account recent pledges to increase energy efficiency and limit carbon emissions. To limit the temperature rise to 3.7°C, this ambitious scenario requires significant policy action and technological changes.
The 2°C scenario, in line with the Paris Agreement, sets the goal of keeping the long-term increase in temperature below 2°C. To achieve this objective by 2050, the energy intensity of GDP and the carbon intensity of primary energy both have to be reduced globally by about 60% starting today (IPCC, 2014). Source: IEA (2016b), Energy Technology Perspectives 2016, http://dx.doi.org/10.1787/energy_tech-2016-en; IEA (2015b), World Energy Outlook 2015, http://dx.doi.org/10.1787/weo-2015-en; IPCC (2014), Climate Change 2014, www.ipcc.ch/pdf/assessment-report/ar5/wg3/ipcc_wg3_ar5_full.pdf.
Since the first COP meeting in 1995, the global economy has grown more than 45% in purchasing power parity (PPP), with global primary energy demand and CO2-related emissions growing along the same trend (40%) (World Bank, 2015; IEA, 2015d). Since 2000, emissions have grown on average by 2.4% per year. According to recent IEA analysis, a peak in emissions would be possible around 2020, using existing technologies but pushing further on energy efficiency, renewables, reforms of fossil-fuel subsidies, declining reliance on inefficient coal and methane-emissions reduction. Carbon emissions will then grow at a slower 0.5% rate in the 2020s
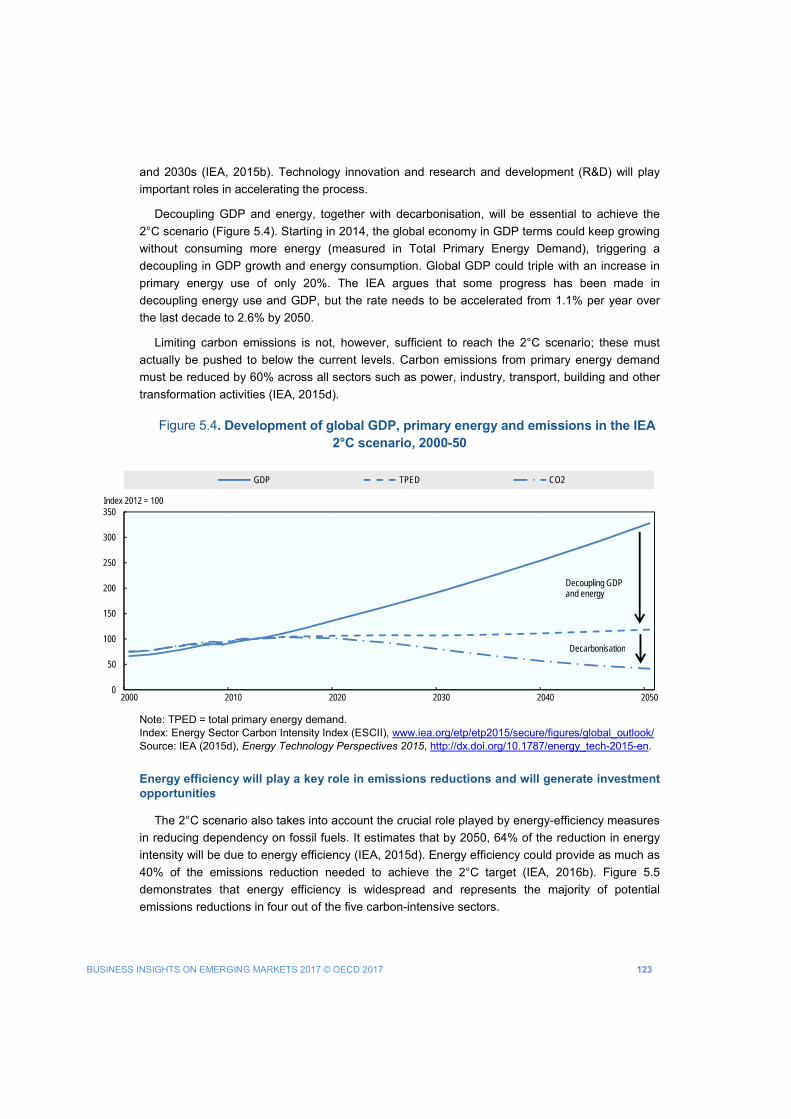
BUSINESS INSIGHTS ON EMERGING MARKETS 2017 © OECD 2017 123
and 2030s (IEA, 2015b). Technology innovation and research and development (R&D) will play important roles in accelerating the process.
Decoupling GDP and energy, together with decarbonisation, will be essential to achieve the 2°C scenario (Figure 5.4). Starting in 2014, the global economy in GDP terms could keep growing without consuming more energy (measured in Total Primary Energy Demand), triggering a decoupling in GDP growth and energy consumption. Global GDP could triple with an increase in primary energy use of only 20%. The IEA argues that some progress has been made in decoupling energy use and GDP, but the rate needs to be accelerated from 1.1% per year over the last decade to 2.6% by 2050.
Limiting carbon emissions is not, however, sufficient to reach the 2°C scenario; these must actually be pushed to below the current levels. Carbon emissions from primary energy demand must be reduced by 60% across all sectors such as power, industry, transport, building and other transformation activities (IEA, 2015d).
Figure 5.4. Development of global GDP, primary energy and emissions in the IEA 2°C scenario, 2000-50
Note: TPED = total primary energy demand. Index: Energy Sector Carbon Intensity Index (ESCII), www.iea.org/etp/etp2015/secure/figures/global_outlook/ Source: IEA (2015d), Energy Technology Perspectives 2015, http://dx.doi.org/10.1787/energy_tech-2015-en.
Energy efficiency will play a key role in emissions reductions and will generate investment opportunities
The 2°C scenario also takes into account the crucial role played by energy-efficiency measures in reducing dependency on fossil fuels. It estimates that by 2050, 64% of the reduction in energy intensity will be due to energy efficiency (IEA, 2015d). Energy efficiency could provide as much as 40% of the emissions reduction needed to achieve the 2°C target (IEA, 2016b). Figure 5.5 demonstrates that energy efficiency is widespread and represents the majority of potential emissions reductions in four out of the five carbon-intensive sectors.
0
50
100
150
200
250
300
350
2000 2010 2020 2030 2040 2050
Index 2012 = 100
GDP TPED CO2
Decarbonisation
Decoupling GDP and energy
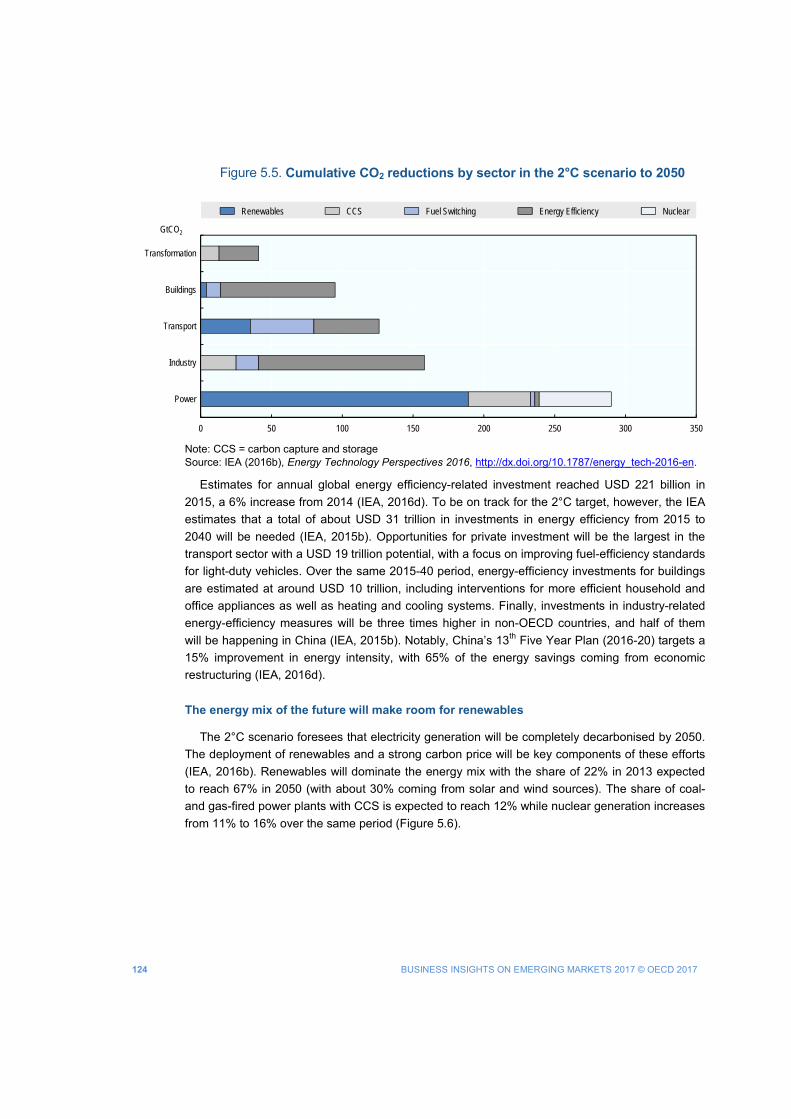
124 BUSINESS INSIGHTS ON EMERGING MARKETS 2017 © OECD 2017
Figure 5.5. Cumulative CO2 reductions by sector in the 2°C scenario to 2050
Note: CCS = carbon capture and storage Source: IEA (2016b), Energy Technology Perspectives 2016, http://dx.doi.org/10.1787/energy_tech-2016-en.
Estimates for annual global energy efficiency-related investment reached USD 221 billion in 2015, a 6% increase from 2014 (IEA, 2016d). To be on track for the 2°C target, however, the IEA estimates that a total of about USD 31 trillion in investments in energy efficiency from 2015 to 2040 will be needed (IEA, 2015b). Opportunities for private investment will be the largest in the transport sector with a USD 19 trillion potential, with a focus on improving fuel-efficiency standards for light-duty vehicles. Over the same 2015-40 period, energy-efficiency investments for buildings are estimated at around USD 10 trillion, including interventions for more efficient household and office appliances as well as heating and cooling systems. Finally, investments in industry-related energy-efficiency measures will be three times higher in non-OECD countries, and half of them will be happening in China (IEA, 2015b). Notably, China’s 13th Five Year Plan (2016-20) targets a 15% improvement in energy intensity, with 65% of the energy savings coming from economic restructuring (IEA, 2016d).
The energy mix of the future will make room for renewables
The 2°C scenario foresees that electricity generation will be completely decarbonised by 2050. The deployment of renewables and a strong carbon price will be key components of these efforts (IEA, 2016b). Renewables will dominate the energy mix with the share of 22% in 2013 expected to reach 67% in 2050 (with about 30% coming from solar and wind sources). The share of coal- and gas-fired power plants with CCS is expected to reach 12% while nuclear generation increases from 11% to 16% over the same period (Figure 5.6).
0 50 100 150 200 250 300 350
Power
Industry
Transport
Buildings
Transformation
GtCO2
Renewables CCS Fuel Switching Energy Efficiency Nuclear
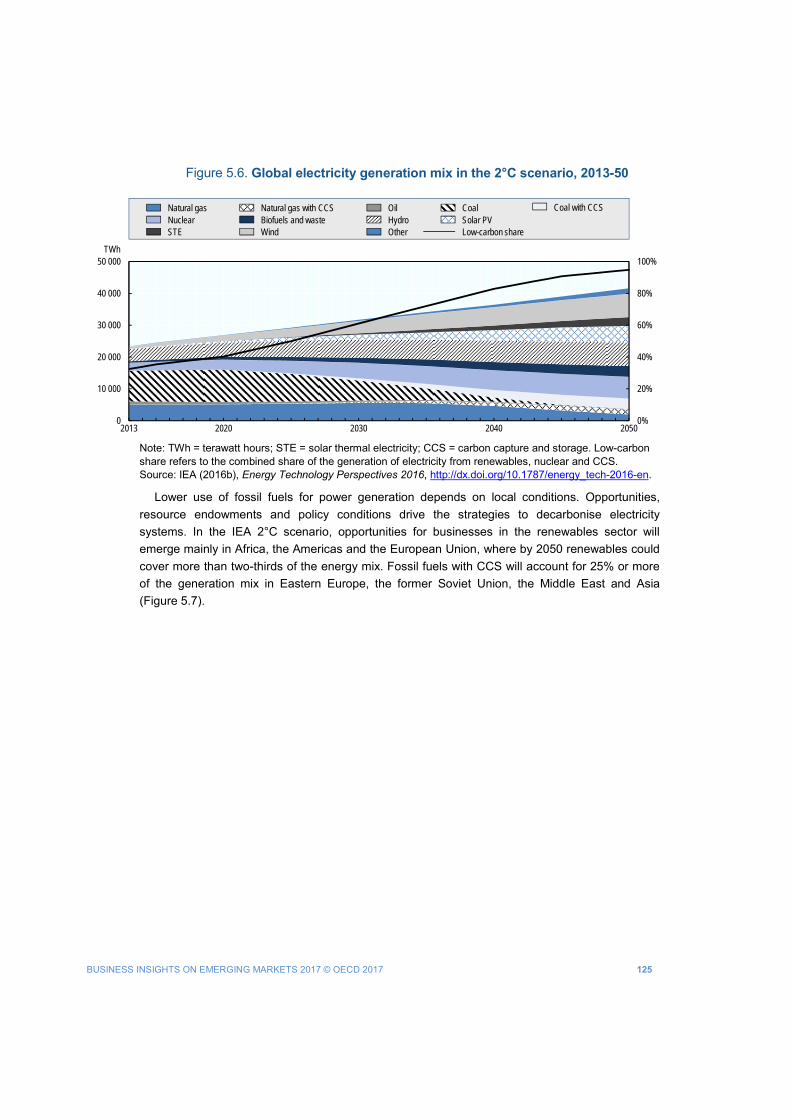
BUSINESS INSIGHTS ON EMERGING MARKETS 2017 © OECD 2017 125
Figure 5.6. Global electricity generation mix in the 2°C scenario, 2013-50
Note: TWh = terawatt hours; STE = solar thermal electricity; CCS = carbon capture and storage. Low-carbon share refers to the combined share of the generation of electricity from renewables, nuclear and CCS. Source: IEA (2016b), Energy Technology Perspectives 2016, http://dx.doi.org/10.1787/energy_tech-2016-en.
Lower use of fossil fuels for power generation depends on local conditions. Opportunities, resource endowments and policy conditions drive the strategies to decarbonise electricity systems. In the IEA 2°C scenario, opportunities for businesses in the renewables sector will emerge mainly in Africa, the Americas and the European Union, where by 2050 renewables could cover more than two-thirds of the energy mix. Fossil fuels with CCS will account for 25% or more of the generation mix in Eastern Europe, the former Soviet Union, the Middle East and Asia (Figure 5.7).
0%
20%
40%
60%
80%
100%
0
10 000
20 000
30 000
40 000
50 000
2013 2020 2030 2040 2050
TWh
Natural gas Natural gas with CCS Oil Coal Coal with CCSNuclear Biofuels and waste Hydro Solar PVSTE Wind Other Low-carbon share
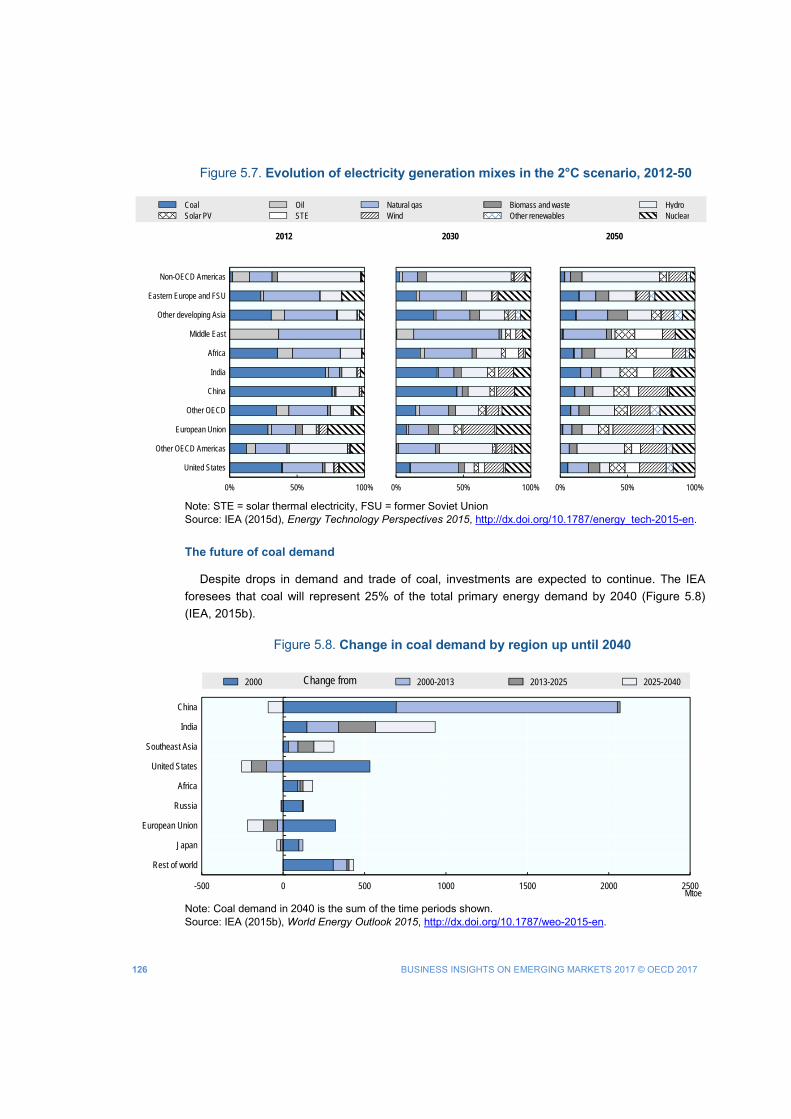
126 BUSINESS INSIGHTS ON EMERGING MARKETS 2017 © OECD 2017
Figure 5.7. Evolution of electricity generation mixes in the 2°C scenario, 2012-50
Note: STE = solar thermal electricity, FSU = former Soviet Union Source: IEA (2015d), Energy Technology Perspectives 2015, http://dx.doi.org/10.1787/energy_tech-2015-en.
The future of coal demand
Despite drops in demand and trade of coal, investments are expected to continue. The IEA foresees that coal will represent 25% of the total primary energy demand by 2040 (Figure 5.8) (IEA, 2015b).
Figure 5.8. Change in coal demand by region up until 2040
Note: Coal demand in 2040 is the sum of the time periods shown. Source: IEA (2015b), World Energy Outlook 2015, http://dx.doi.org/10.1787/weo-2015-en.
-500 0 500 1000 1500 2000 2500
Rest of world
Japan
European Union
Russia
Africa
United States
Southeast Asia
India
China
Mtoe
change from2000 2000-2013 2013-2025 2025-2040Change from
0% 50% 100%
United States
Other OECD Americas
European Union
Other OECD
China
India
Africa
Middle East
Other developing Asia
Eastern Europe and FSU
Non-OECD Americas
2012
0% 50% 100%
2030
0% 50% 100%
2050
Coal Oil Natural gas Biomass and waste HydroSolar PV STE Wind Other renewables Nuclear
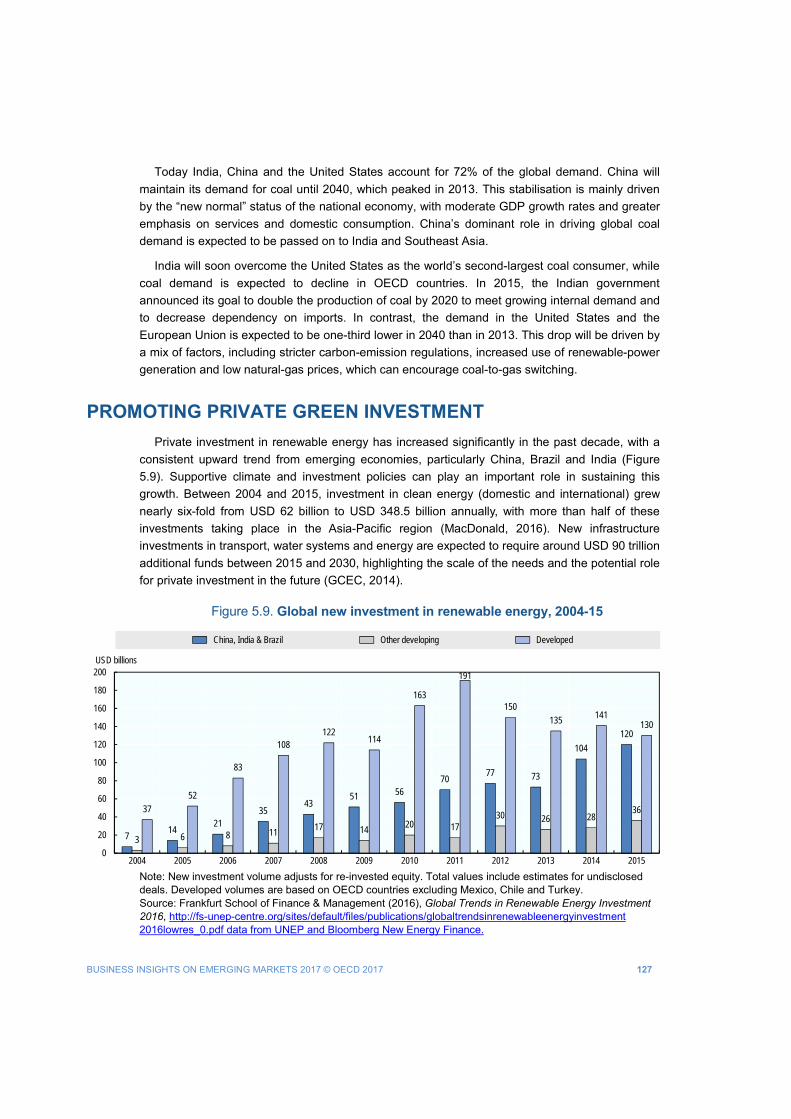
BUSINESS INSIGHTS ON EMERGING MARKETS 2017 © OECD 2017 127
Today India, China and the United States account for 72% of the global demand. China will maintain its demand for coal until 2040, which peaked in 2013. This stabilisation is mainly driven by the “new normal” status of the national economy, with moderate GDP growth rates and greater emphasis on services and domestic consumption. China’s dominant role in driving global coal demand is expected to be passed on to India and Southeast Asia.
India will soon overcome the United States as the world’s second-largest coal consumer, while coal demand is expected to decline in OECD countries. In 2015, the Indian government announced its goal to double the production of coal by 2020 to meet growing internal demand and to decrease dependency on imports. In contrast, the demand in the United States and the European Union is expected to be one-third lower in 2040 than in 2013. This drop will be driven by a mix of factors, including stricter carbon-emission regulations, increased use of renewable-power generation and low natural-gas prices, which can encourage coal-to-gas switching.
PROMOTING PRIVATE GREEN INVESTMENT Private investment in renewable energy has increased significantly in the past decade, with a
consistent upward trend from emerging economies, particularly China, Brazil and India (Figure 5.9). Supportive climate and investment policies can play an important role in sustaining this growth. Between 2004 and 2015, investment in clean energy (domestic and international) grew nearly six-fold from USD 62 billion to USD 348.5 billion annually, with more than half of these investments taking place in the Asia-Pacific region (MacDonald, 2016). New infrastructure investments in transport, water systems and energy are expected to require around USD 90 trillion additional funds between 2015 and 2030, highlighting the scale of the needs and the potential role for private investment in the future (GCEC, 2014).
Figure 5.9. Global new investment in renewable energy, 2004-15
Note: New investment volume adjusts for re-invested equity. Total values include estimates for undisclosed deals. Developed volumes are based on OECD countries excluding Mexico, Chile and Turkey. Source: Frankfurt School of Finance & Management (2016), Global Trends in Renewable Energy Investment 2016, http://fs-unep-centre.org/sites/default/files/publications/globaltrendsinrenewableenergyinvestment 2016lowres_0.pdf data from UNEP and Bloomberg New Energy Finance.
714
2135
4351 56
7077 73
104
120
3 6 8 1117 14
20 1730 26 28
363752
83
108122
114
163
191
150135 141
130
0
20
40
60
80
100
120
140
160
180
200
2004 2005 2006 2007 2008 2009 2010 2011 2012 2013 2014 2015
USD billions
China, India & Brazil Other developing Developed
128 BUSINESS INSIGHTS ON EMERGING MARKETS 2017 © OECD 2017
Setting up climate policies and aligning them with the broader policy portfolio
The OECD report on Aligning Policies for a Low-Carbon Economy highlights that the effectiveness of climate policies can be weakened if not aligned with the broader policy portfolio (OECD, 2015g). These misalignments can happen in multiple dimensions, including at different levels of government, with different stakeholders or beyond national borders. For example, sub-national governments are critical decision makers for urban transport planning, but a lack of co-ordination and capacity can hinder efforts towards climate-policy action. Furthermore, import tariffs and protectionism can penalise the diffusion of successful low-carbon technologies. Setting a coherent and supportive policy framework is essential to attracting more investment.
Supportive policies for private investment and innovation in low-carbon technologies
Beyond climate-change policies, governments need to ensure the proper enabling environment for both national and international investors in low-carbon technologies. The importance of private funds to support both early and more mature stages of technological development highlights the need to mitigate barriers to long-term investment. In the field of renewable energy, for example, key policy obstacles include inefficient fossil-fuel subsidies, retroactive changes in support of clean-energy projects, and a lack of incentives to invest in transmission, distribution and energy storage (OECD, 2015b). OECD’s Policy Framework for Investment (OECD, 2015c) and Policy Guidance for Investment in Clean Energy Infrastructure (OECD, 2015b) highlights the following ways government can seek to mobilise private green investment. These strategies should be considered alongside analysis of the specific context and needs of developing countries.
• Promote sound investment policy principles to ensure predictability in the long term,
by focusing on the protection of intellectual property rights (securing land tenure and against expropriation), contract enforcement, transparency and land rights, and non-discrimination (OECD, 2015c).
• Encourage investment promotion and facilitation towards greener technologies for the long term, by creating incentives to shift investments away from fossil fuels to low-carbon technologies in the power sector, facilitating the licensing process for renewable-energy projects, reducing legal and administrative costs, and putting a price on carbon (OECD, 2015a).
• Reinforce competition policies to limit market distortions and facilitate access for new entrants, by keeping markets open and neutral to maximise foreign and domestic investment. Distortions in clean-energy markets can be generated when giving outward investment or state-owned enterprises preferential access to finance. Key issues include the design of transparent procurement processes and the unbundling of vertically integrated electricity operators (OECD, 2015c).
• Improve financial-market policy and use innovative financial mechanisms, by facilitating long-term access to finance for investment in renewable-electricity projects. Policy makers can support the development of debt instruments, green bonds, guarantees or other risk-reduction tools and specialised institutions, such as green investment banks, to promote private investment in renewable energy, low-carbon technologies and climate-resilient infrastructure (OECD, 2016b; OECD, 2015d; OECD and Bloomberg Philanthropies, 2015).
BUSINESS INSIGHTS ON EMERGING MARKETS 2017 © OECD 2017 129
• Ensure policy coherence across all levels of government, by strengthening consistency of policy objectives through early participation of key stakeholders, including authorities dealing with natural-resource management, energy, investment and environment. Reinforced cooperation can help in the case of urban mobility, where sub-national governments seeking to implement climate policies can face organisational, institutional and financial bottlenecks (OECD, 2015g).
• Address outstanding barriers to international trade and investment, by looking at local-content requirements, incentives favouring domestic versus foreign investors and regulatory restrictions on FDI (OECD, 2015a).
Instruments to support private investment in renewable energies
According to EMnet Working Group participants, a reliable regulatory framework ensuring transparency and predictability is essential to promote long-term private investment in renewable energies. Key elements include clear renewable-energy targets and a well-defined development strategy for the sector.
In addition, a variety of targeted, time-limited incentive schemes exist to attract investment in deployed renewable-power technologies such as feed-in tariffs, tax incentives, Renewable Energy Certificates (RECs) and public tenders. Their degree of effectiveness can vary, however, depending on the timing of the incentives, technological maturity and other specific market conditions. To drive down costs, incentive schemes should include a provision also for their eventual phase-out (Cárdenas Rodríguez et al., 2014; Haščič et al., 2015).
As highlighted by the IEA’s Medium-Term Renewable Energy Market Report 2016, different markets will use various sets of instruments to promote investments in renewable-energy technologies:
• In China, driven by growing air-pollution concerns, the government is using feed-in tariffs and
minimum-generation quotas to achieve renewable-energy targets. • In North America, the United States adopted federal tax incentives, Canada focuses on
investment-policy improvements and Mexico uses long-term auction contracts and green certificates.
• In the Asia and Pacific region (excluding China), India will use a new competitive tender policy to drive solar PV expansion. In Japan and the ASEAN countries, feed-in tariffs will be the main policy instrument to promote renewable investment.
• In the European Union, tenders and competitive auctions will be chosen increasingly over feed-in tariffs to support renewable-energy projects. Specific country contexts can affect national growth prospects.
• In Latin America, renewable-energy investments have been promoted through competitive energy tenders; the current regional economic slowdown is, however, expected to reduce the demand and the outlook for new renewable projects, particularly in a key regional market like Brazil.
• In the Middle East and North Africa, government-backed tenders are the main driver of growth in renewables.
130 BUSINESS INSIGHTS ON EMERGING MARKETS 2017 © OECD 2017
• In sub-Saharan Africa, hydropower remains the main focus for the development of renewables, with the exception of South Africa’s renewable procurement programme for solar PV and onshore wind (IEA, 2016e).
Furthermore, to attract more investors in emerging countries, competitive bidding processes can be reinforced by well-defined rules and incentives such as long-term Power Purchase Agreements (PPAs) guaranteed by governments, indexed and cost-reflective tariffs, and streamlined permitting processes.
Several studies highlight that public support for research, development and demonstration (RD&D) (e.g. through grants, tax incentives and other public expenditures) has contributed significantly to the early-stage design of solar PV technologies (Gambhir, Gross and Green, 2014). This suggests that governments should use public R&D funding to stimulate the development of early-stage technologies such as smart grids, offshore wind and CCS (Gambhir, Gross and Green, 2014). In the case of more mature technologies such as solar PV, feed-in tariffs have played a larger role than public R&D in mobilising private investment (Gambhir, Gross and Green, 2014; Grau, Huo and Neuhoff, 2012).
Finally, EMnet Working Group participants highlighted that thanks to recent technological improvements, renewable energies have become much more competitive, the capital expenditure needed has decreased and prices have come down dramatically. In this context, however, sectoral competitiveness is possible only where the proper regulatory conditions are in place.
Forthcoming OECD research on Enabling Investment and Innovation in Renewable Energy will assess empirically how specific climate-mitigation policies and broader investment conditions impact investment and innovation in the renewable-power sector within G20 and OECD countries (OECD, 2017a; OECD, 2017b forthcoming). The project also will assess how investment conditions interact with climate policies. This research aims to help G20 and OECD policy makers enhance the effectiveness of incentives and other climate policies in encouraging investment and innovation in renewables by addressing misalignments in the broader investment environment.
PRIVATE SECTOR INSIGHTS AND RECOMMENDATIONS The outcomes of COP21 were received positively by the participants in the March 2016
meeting of the EMnet Working Group on Greening the Economy. The Paris Agreement was acknowledged as a key milestone, set to influence and reshape future business strategies. Key areas of discussion of the EMnet Working Group included the composition of the future energy mix, the role of emission-trading schemes, the risks associated with doing business in emerging economies and the impact of COP21 on future business strategies. This section also features messages from the private sector on the opportunities for renewable energy investment in Asia, which draw upon the discussions at the EMnet Asia meeting held in March 2016.
The fossil-fuel mix of tomorrow will experience dynamic changes
Members of the EMnet Working Group highlighted the importance of considering the composition of tomorrow’s fossil-fuel mix and its implications for the private sector. Participants and IEA experts had similar views on the different pathways that each fossil-fuel category is
BUSINESS INSIGHTS ON EMERGING MARKETS 2017 © OECD 2017 131
expected to follow in the future. The IEA depicts a pathway to the 2°C climate goal through technologies approaching commercial viability and assumes the implementation of a set of policies to reduce carbon emissions. The following points highlight the outlook for the fossil-fuel mix in a context of increasing climate action (IEA, 2015b).
• Oil: While still representing 40% of the energy mix in 2014, oil consumption is set to decline
throughout OECD countries after reaching peak demand by 2020. The global demand is expected to drop from 90 million barrels per day (mb/d) in 2014 to 74 mb/d in 2040.
• Gas: Investment and consumption of gas are expected to grow until the end of the 2020s, when additional policies limiting CO2 emissions will be introduced.
• Coal: It is expected that coal will follow different demand-growth trajectories based on country-specific situations. The demand is set to increase significantly in India and Southeast Asia, decrease in the United States and the European Union and remain flat in China after peak demand in 2013.
The implementation of the Paris Agreement will be challenging
The participants of the EMnet Working Group highlighted the numerous implementation challenges policy makers face to achieve the objectives of the Paris Agreement and discussed a few ideas to address them. Development of carbon-pricing mechanisms, support for energy-efficiency and renewable energies, deployment of CCS technology, and the reduction of air pollution were the main topics debated during the meeting.
Implement competitive carbon-pricing mechanisms. This involves introducing strong carbon prices to raise the cost of using fossil fuels without CCS and therefore discourage their use (IEA, 2015d). In the context of low-carbon prices, however, triggering new investments in the power sector will require additional incentives (especially for projects moving from pilot to large-scale deployment). The soon-to-be implemented Chinese emissions trading system will triple the volume of priced carbon on the global market by 2017. This will set crucial standards for the future of carbon-trading markets, opening new opportunities for low-carbon investments.
Increase the focus on energy efficiency. Energy efficiency will potentially contribute to 40% of total emissions reductions in the 2°C scenario, and even more in the emerging economies. Though progress has been made, energy efficiency only attracted 12% of all energy-related investments in 2015 (IEA, 2016c). Participants in the EMnet Working Group stressed that energy efficiency is touching all sectors of the economy; the impact on residential energy consumption, however, can be considered higher than in other sectors. Recently adopted measures should further strengthen support for energy efficiency, such as the European Union’s Efficiency First initiative and the commitment of the 2017 German G20 Presidency to set a “framework for investments in low/zero-carbon energy technologies” (IPEEC, 2016). A possible way forward involves the design of policies seeking to minimise financial risks, promote technology improvements, and develop green bonds for energy efficiency and energy contracting.
Leverage the momentum for renewables to meet the emission-reduction targets. Large-scale deployment of wind and solar PV technologies will require energy storage and smart-grid infrastructure. On the policy side, these technologies rely more on predictability and reliability in
132 BUSINESS INSIGHTS ON EMERGING MARKETS 2017 © OECD 2017
the regulatory framework than on economic incentives. Participants particularly emphasised the importance of clear and stable long-term price signals, which can reduce investment risks for utility projects. While solar PV and wind technologies have become more cost-competitive, other industries such as offshore wind, solar-thermal energy or ocean power still require high investment costs that are slowing their development (IEA, 2015d). Participants pointed out that the environment of low-interest rates in OECD countries has had a positive effect on the renewable-energy sector, reducing the cost of debt and encouraging more investments. However, companies are preparing for the possibility of a future tightening of monetary policy, which could have an impact on energy-related investments (IEA, 2016c).
Implement CCS-ready plants as they become commercially viable. CCS technology has great potential to contribute to a low-carbon economy; it still needs appropriate public policy support, however, particularly in developing countries. The IEA highlights that the most important CCS projects are currently based in Canada and the United States (IEA, 2015d). In October 2014, SaskPower’s Boundary Dam power station in Canada became the world’s first commercial electricity-generating unit with full carbon capture (Box 5.2). Given the long technical lifetime of power-generation technologies, it is important to avoid lock-in of carbon-intensive technologies, which can be done by either equipping plants with CCS or designing them for future retrofits. Taking CCS into account in future plans, as is done for fuel supply, grid and cooling connections, would mean considering transport and large-storage capacity for future CO2 (IEA, 2015d).
Tackling the issues of air pollution, climate mitigation and energy access at the same time can generate positive synergies and goes hand-in-hand with the transformation of the energy sector agreed at COP21. The Fifth Assessment Report of the Intergovernmental Panel on Climate Change highlights that designing horizontal policies addressing the issues of energy security, climate and air pollution together can be less expensive than dealing with them independently (IPCC, 2013).
Box 5.2. Making CCS technology commercially viable: Canada’s SaskPower Boundary Dam
Carbon capture and storage (CCS) technology, while not yet largely deployed in emerging economies, has shown progress in reaching commercial viability in more mature markets. In October 2014, the SaskPower Boundary Dam project in Canada developed the world’s first commercial electricity-generating unit, where nearly 90% of carbon emissions are captured and stored every year. The project rebuilt a coal-fired generation unit with CCS technology. More than 60% of the total cost of the project, which was CAD 1.3 billion (Canadian dollars), went to the installation of CCS technology, and 38% covered the retrofit costs (MIT, 2016). Financial support came from various stakeholders and included contributions from the federal and provincial governments. The project faced numerous technical challenges along the way. Nonetheless, in April 2016 SaskPower announced that 757 000 tonnes of CO2 had been captured since the operational start-up in 2014 (MIT, 2016). Source: IEA (2015d), Energy Technology Perspectives 2015, http://dx.doi.org/10.1787/energy_tech-2015-en; MIT (2016), “Boundary Dam Fact Sheet”, https://sequestration.mit.edu/tools/projects/boundary_dam.html
BUSINESS INSIGHTS ON EMERGING MARKETS 2017 © OECD 2017 133
Emissions trading systems and carbon taxes have potential but require careful design
According to EMnet Working Group participants, discussions at COP21 lacked appropriate emphasis on carbon pricing via mechanisms such as emissions trading systems (ETS) or carbon taxes. Participants agreed that ETS should not be seen as mechanisms to provide greater public-revenue sources but should act rather as catalytic instruments to redirect funds towards green investments. As mentioned by IEA experts, the success of the new Chinese nationwide ETS, set to come into force in 2017, is crucial for global carbon pricing efforts and essential to achieve COP21 targets (Box 5.3). The decision to implement carbon taxes should consider the broader fiscal-reform agenda. By combining carbon taxes with the use of low-carbon technologies, greater emissions reductions are more likely to be achieved (OECD, 2015f).
Box 5.3. Emissions trading systems in China: Pilot projects and the nationwide rollout
Since 2011, China has been experimenting with seven pilot regional emissions trading systems (ETS) in cities (Shanghai, Shenzhen, Chongqing, Tianjin and Beijing) and provinces (Hubei and Guangdong). The country will launch a three-year pilot national ETS starting in 2017 through the National Development and Reform Commission (NDRC) (OECD, 2015e). The sectors targeted include nonferrous metals, building materials, metallurgy, power generation, aviation and chemicals, and will account for 3 000 to 4 000 million tonnes of CO2 per year (ICAP, 2015). The results of the new nationwide ETS will be crucial to reach the 2°C target set at COP21 and encourage a higher volume of private investment in renewables in China. Investment in renewables is traditionally public and channelled through state-owned enterprises (Wang, 2015). If successful, this new ETS in China could potentially serve as a model to be replicated in other countries. Source: OECD (2015e), Climate Change Mitigation: Policies and Progress, http://dx.doi.org/10.1787/9789264238787-en; Wang, H. (2015), Emissions Trading in China, www.iisd.org/sites/default/files/publications/emissions-trading-in-china-renewable-energy.pdf.
Political, transfer and pricing risks can hinder investment in renewable energies
Participants in the EMnet Working Group highlighted that political, transfer and pricing risks could prevent investments in clean technologies from happening. First, short-term political gains can mask the potential long-term benefits stemming from clean investments. Second, transfer risks were identified as one of the barriers to be addressed when investing in emerging economies. Transfer risks refer to the probability of losses due to currency volatility and restrictions. Finally, pricing risks, based on the volatility of various business incentives, were identified as a major risk for companies seeking stable returns on investment.
A range of risk-mitigation tools can support investment in clean energy. Guarantees often are used as a credit-enhancement mechanism for debt instruments such as bonds and loans. Guarantees also can be used in the context of guaranteeing the performance of a given technology such as solar panels or wind turbines and energy-efficient technologies. Insurance products may protect against a range of risks such as construction or operational risks, market risks such as price changes, weather-related production-volatility risks, and political, regulatory or policy issues (OECD, 2015d).
134 BUSINESS INSIGHTS ON EMERGING MARKETS 2017 © OECD 2017
Corporate strategies will be adjusted to reflect the post-COP21 context
Members of the EMnet Working Group highlighted the importance of changes in corporate and investment strategies to adjust to a new post-COP21 environment. Companies are leveraging the post-COP momentum to integrate more sustainable practices into their business models. The French company Engie cancelled a coal-fired plant project originally planned in Turkey. This was a result of an announced three-year transformation plan to divest from fossil-fuel sources (Engie, 2015). Italy’s Enel is aiming to achieve carbon neutrality of its production mix by 2050 and make 55% of its total managed capacity from renewable energy sources by 2019 (Enel, 2016a; Enel, 2016b).
The financial sector also has started to adjust its business strategy to reflect the COP21 engagements. For example, BNP Paribas pledged to more than double its lending in the renewable energy sector from nearly EUR 7 billion in 2014 to EUR 15 billion in 2020 (BNP Paribas, 2015). The Portfolio Decarbonization Coalition seeks to reduce portfolio exposure to greenhouse gas emissions and increase investments in areas such as renewable energy sources, gathering 27 asset owners and representing over USD 3 trillion in assets under management (UNEP FI, 2016). Finally, the Montreal Carbon Pledge has been signed by over 120 investors with over USD 10 trillion in assets under management, pledging to measure and disclose the carbon footprint of part or their entire equity portfolio (PRI, 2016).
Finally, initiatives such as the Oil and Gas Climate Initiative, representing 20% of global oil and gas production, were mentioned as a response from the oil and gas industry to the challenge of climate change (OGCI, 2016). This is an industry-driven initiative analysing the role of natural gas in the future energy mix, exploring carbon-reduction instruments and tools, and sharing visions on technical and non-technical solutions to meet future energy needs.
Renewable energy opportunities in Asia abound
At the EMnet Asia meeting on regional integration, which took place on 8 March 2016, one session focused on business opportunities for renewable energy. Participants highlighted India’s efforts to increase investment in renewables and the increasing cost-competitiveness of solar in certain regions, as well as the potential that hydropower still has to offer.
Renewable energy is one of the sectors targeted by “Make in India”, a programme announced by Prime Minister Modi in 2014 aiming to turn India into a global design and manufacturing hub. The initiative includes a range of support measures for the deployment and development of renewable power in the country, such as tax holidays and customs-duty exemptions. India’s annual solar installations are expected to grow more than four-fold by 2017, and the government has set a target to reach 100 gigawatts (GW) in solar capacity by 2022. The accompanying increases in manufacturing scale and experience can lower costs for solar modules. Moreover, the government is seeking to attract investors in solar energy by providing a range of financial-support instruments, including energy subsidies, duty exemptions, guarantee schemes, loans at concessional rates and special incentives for all renewable-energy technologies exported from India (Make in India, 2016a, b).
From a market-dynamics perspective, solar PV has become more and more cost-competitive over the years in certain states in India. For example, Solairedirect, an Engie subsidiary, won 140
BUSINESS INSIGHTS ON EMERGING MARKETS 2017 © OECD 2017 135
megawatts (MW) in solar projects in the Rajasthan state with an offer of INR 4.35 (Indian rupees) per KwH, compared to INR 4.65 for coal. Solar is becoming competitive in terms of project delivery (between tendering and final commissioning). Solar PV facilities of up to 200 MW can now be delivered in 13 months, and such projects are becoming more attractive to international banks seeking to invest in India (Solairedirect, 2016).
While hydro is viewed as an “old” source of renewable power compared to newer developments such as solar PV, hydropower projects on the Mekong River – flowing through China, Myanmar, Thailand, Lao PDR, Cambodia and Viet Nam – are a promising source of future generation capacity that can be exported throughout the region. Despite numerous challenges, such as large capital expenditure requirements, and technological and social risks, participants also highlighted the potential and importance for hydropower to both improve electricity access and contribute to economic development. Key challenges include improving grid connections and electrical regulations. The countries in the region are lacking a common grid code. In addition, sustainability challenges extend far beyond simply environmental concerns to include settlement relocation and loss of livelihoods. Accordingly, regional co-operation is essential to benefit from and ensure the sustainability of the Mekong River (OECD, 2016c).
136 BUSINESS INSIGHTS ON EMERGING MARKETS 2017 © OECD 2017
CONCLUSION The agreement reached at COP21 sent a strong policy signal that governments are committed
to reduce carbon emissions and fight global warming. In the future energy-mix scenario, the development of the renewable energy sector will be accompanied by important energy-efficiency programmes and a more sustainable use of fossils fuels. The private sector welcomed the results of COP21 and is preparing to adapt future business strategies to the expected changes in the energy mix.
Public commitments and pledges must, however, be accompanied by context-specific policy decisions to reduce carbon emissions, scale up green investment, promote clean infrastructure and support the development of low-carbon technologies.
In this transition period, governments need to make careful choices for the right incentives to support the private sector. While so far, for example, feed-in tariffs have been the preferred way of promoting low-carbon technologies, competitive auctions have been chosen increasingly in recent times to support early deployment of renewable-based electricity and further engage with the private sector. Fossils fuel subsidies should be also reduced. Establishing an appropriate policy framework also will be essential for governments in emerging markets to encourage greater green investment. Participants emphasised the need to promote fair competition amongst energy providers to set the right pricing of carbon emissions.
In emerging markets, political, transfer and pricing risks were highlighted as key barriers to green investment that policy makers should tackle as a priority. It is also important to note that the fall in global oil prices is not impacting persistent interest in renewable energies.
Finally, in addition to promoting core climate policies, governments must also tackle policy misalignments that can hinder green investment. Conflicting incentives in competition, trade, tax and innovation policies, for example, can inadvertently discourage cleaner and more efficient investment.
BUSINESS INSIGHTS ON EMERGING MARKETS 2017 © OECD 2017 137
Notes 1 Large hydropower is defined here as more than 10 MW. 2 Job creation in bioenergy industries include biofuels (1.8 million), biomass (822 000) and biogas (381 000). For further
details, see IRENA (2015), Renewable Energy and Jobs: Annual Review 2015, International Renewable Energy Agency, Abu Dhabi. Employment data from IRENA refer to direct and indirect jobs. Indirect jobs include employment in upstream industries that supply and support core activities of renewable energy. The employment data includes information for the latest available year. Overall, most of the numbers are from 2013 and 2014.
References BNP Paribas (2015), “BNP Paribas Dedicates €15BN in Financing for Renewable Energy and Reinforces its Carbon
Risk Management Policies”, Press Release, 19 November, BNP Paribas, Paris, https://group.bnpparibas/en/press-release/bnp-paribas-dedicates-e15bn-financing-renewable-energy-reinforces-carbon-risk-management-policies.
Cárdenas Rodríguez, M. et al. (2014), “Inducing Private Finance for Renewable Energy Projects: Evidence from Micro-Data”, OECD Environment Working Papers, No. 67, 16 October, OECD Publishing, Paris, http://dx.doi.org/10.1787/5jxvg0k6thr1-en.
Chatterton, R. (2015), “COP21: The Definitive Guide”, Presentation, 30 November – 11 December, Bloomberg New Energy Finance, London and New York, https://data.bloomberglp.com/bnef/sites/4/2015/11/COP21_Definitive_Guide.pdf.
Cochran, I. et al. (2014), “Public Financial Institutions and the Low-carbon Transition: Five Case Studies on Low-Carbon Infrastructure and Project Investment”, OECD Environment Working Papers, No. 72, OECD Publishing, Paris, http://dx.doi.org/10.1787/5jxt3rhpgn9t-en.
Enel (2016a), “Enel Group Presents 2017-2019 Enhanced Strategic Plan, Focused on Digitisation and Customers”, Press Release, 22 November, Enel Group, Rome, www.enel.com/content/dam/enel-common/press/en/1666493-1_PDF-1.pdf.
Enel (2016b), Our Vision: New Era, New Energy, Enel webpage, www.enel.com/en/aboutus/a201608-vision.html (accessed 5 December 2016)
Engie (2015), “Why the ENGIE Group will Embark on No New Coal-fired Power Plant Projects”, Interview for Le Figaro of ENGIE Chairman & CEO Gérard Mestrallet published 15 October, Engie Group, Paris La Défense, www.engie.com/en/group/opinions/energy-transition-climate/embark-on-no-new-coal-fired-power-plant-projects/.
FFFsR (2015), “Fossil-Fuel Subsidy Reform Communiqué”, Friends of Fossil Fuel Subsidy Reform webpage, http://fffsr.org/communique/ (accessed 23 December 2016).
Frankfurt School of Finance & Management (2016), Global Trends in Renewable Energy Investment 2016, United Nations Environment Programme and Bloomberg New Energy Finance, Frankfurt am Main, http://fs-unep-centre.org/sites/default/files/publications/globaltrendsinrenewableenergyinvestment2016lowres_0.pdf.
Gambhir A., R. Gross and R. Green (2014), “The Impact of Policy on Technology Innovation and Cost Reduction: A Case Study on Crystalline Silicon Solar PV Modules”, Working paper, Imperial College London, www.imperial.ac.uk/media/imperial-college/grantham-institute/public/publications/working-papers/The-impact-of-policy-on-technology-innovation-and-cost-reduction-WP.pdf.
GCEC (2014), Better Growth, Better Climate: The New Climate Economy Report – The Global Report, September, Global Commission on the Economy and Climate, New Climate Economy, World Resources Institute, Washington DC, www.unilever.com/Images/better-growth-better-climate-new-climate-economy-global-report-september-2014_tcm244-425167_en.pdf.
Government of China et al. (2016), “The United States’ Efforts to Phase Out and Rationalise its Inefficient Fossil-fuel Subsidies: A Report on the G20 Peer-review of Inefficient Fossil-fuel Subsidies that Encourage Wasteful consumption in the United States”, Berlin.
Government of Germany et al. (2016), “China’s Efforts to Phase Out and Rationalise its Inefficient Fossil-fuel Subsidies: A Report on the G20 Peer Review of Inefficient Fossil-fuel Subsidies that Encourage Wasteful Consumption in China”, Berlin.
138 BUSINESS INSIGHTS ON EMERGING MARKETS 2017 © OECD 2017
Grau T., M. Huo and K. Neuhoff (2012), “Survey of Photovoltaic Industry and Policy in Germany and China”, Energy Policy, Vol. 51, December, pp. 20-37, www.sciencedirect.com/science/article/pii/S0301421512003345.
Haščič, I. et al. (2015), “Public Interventions and Private Climate Finance Flows: Empirical Evidence from Renewable Energy Financing”, OECD Environment Working Papers, No. 80, 3 February, OECD Publishing, Paris, http://dx.doi.org/10.1787/5js6b1r9lfd4-en.
ICAP (2015), “China to Cap Emissions from Six Sectors, ETS to Launch 2016”, International Carbon Action Partnership webpage; https://icapcarbonaction.com/en/news/news-archive/268-china-to-cap-emissions-from-six-sectors-ets-to-launch-2016 (accessed 21 July 2016).
IEA (2016a), World Energy Outlook 2016, OECD/IEA Publishing, Paris, http://dx.doi.org/10.1787/weo-2016-en.
IEA (2016b), Energy Technology Perspectives 2016, OECD/IEA Publishing, Paris, http://dx.doi.org/10.1787/energy_tech-2016-en.
IEA (2016c), World Energy Investment 2016, OECD/IEA, Paris, http://dx.doi.org/10.1787/9789264262836-en.
IEA (2016d), Energy Efficiency Market Report 2016, OECD/IEA, Paris. www.iea.org/eemr16/files/medium-term-energy-efficiency-2016_WEB.PDF.
IEA (2016e), Medium-Term Renewable Energy Market Report 2016, IEA, Paris, www.iea.org/bookshop/734-Medium-Term_Renewable_Energy_Market_Report_2016.
IEA (2015a), Energy and Climate Change: World Energy Outlook Special Report. OECD/IEA, Paris, www.iea.org/publications/freepublications/publication/WEO2015SpecialReportonEnergyandClimateChange.pdf.
IEA (2015b), World Energy Outlook 2015, OECD/IEA Publishing, Paris, http://dx.doi.org/10.1787/weo-2015-en.
IEA (2015c), Renewables Information 2015, OECD/IEA Publishing, Paris, http://dx.doi.org/10.1787/renew-2015-en.
IEA (2015d), Energy Technology Perspectives 2015, OECD/IEA Publishing, Paris, http://dx.doi.org/10.1787/energy_tech-2015-en.
IIGCC (2015), “For the attention of the Finance Ministers of the Group of Seven (G-7)”, Open letter to Finance Ministers of the G7, 25 May, www.iigcc.org/files/publicationfiles/20150818_Investor_CEO_letter_to_Finance_Ministers_Final_FINAL_FORMATTED.pdf.
IPCC (2014), Climate Change 2014: Mitigation of Climate Change – Working Group III Contribution to the Fifth Assessment Report of the Intergovernmental Panel on Climate Change, Cambridge University Press, New York, www.ipcc.ch/pdf/assessment-report/ar5/wg3/ipcc_wg3_ar5_full.pdf.
IPCC (2013), Climate Change 2013: The Physical Science Basis – Contribution of Working Group I to the Fifth Assessment Report of the Intergovernmental Panel on Climate Change, Cambridge University Press, New York, www.climatechange2013.org/images/report/WG1AR5_ALL_FINAL.pdf.
IPEEC (2016), “Germany Begins its 2017 G20 Presidency”, Press Release, 1 December, International Partnership for Energy Efficiency Cooperation, Paris, https://ipeec.org/en/newsroom/223-germany-begins-its-2017-g20-presidency.html.
IRENA (2015), Renewable Energy and Jobs: Annual Review 2015, International Renewable Energy Agency, Abu Dhabi. www.irena.org/DocumentDownloads/Publications/IRENA_RE_Jobs_Annual_Review_2015.pdf.
IRENA and CEM (2015), Renewable Energy Auctions - A Guide to Design, International Renewable Energy Agency, Abu Dhabi, www.irena.org/DocumentDownloads/Publications/IRENA_RE_Auctions_Guide_2015_2_policies.pdf.
Jun, Ma et al. (2016), “Green Bonds: Country Experiences, Barriers and Options”, Input paper for the G20 Green Finance Study Group (GFSG), prepared by the Organisation for Economic Co-operation and Development (OECD), International Capital Markets Association (ICMA), Climate Bonds Initiative (CBI) and the Green Finance Committee (GFC) of China Society for Finance and Banking, www.oecd.org/environment/cc/Green_Bonds_Country_Experiences_Barriers_and_Options.pdf.
MacDonald, J. (2016), “Clean Energy Investment in 2016 Undershoots Last Year’s Record”, Press Release, 14 July, Bloomberg New Energy Finance, London and New York, www.bbhub.io/bnef/sites/4/2016/07/Q2-2016-BNEF-Press-Release.pdf.
BUSINESS INSIGHTS ON EMERGING MARKETS 2017 © OECD 2017 139
Mahindra & Mahindra (2016), “Mahindra & Mahindra First Indian Company to Announce Carbon Price”, Press Release, www.mahindra.com/news-room/press-release/mahindra-and-mahindra-first-Indian-company-to-announce-Carbon-Price.
Make in India (2016a), Renewable Energy section, Make in India website, http://www.makeinindia.com/sector/renewable-energy (accessed 13 July 2016).
Make in India (2016b), “Riding the Renewable Wave”, Make in India webpage, www.makeinindia.com/article/-/v/success-stories-of-make-in-india (accessed 13 July 2016).
MIT (2016), “Boundary Dam Fact Sheet: Carbon Dioxide Capture and Storage Project”, Carbon capture & Sequestration Technologies, Massachusetts Institute of Technology, Cambridge MA, https://sequestration.mit.edu/tools/projects/boundary_dam.html.
Moody’s (2017), “Global Green Bond Issuance Could Rise to USD206B in 2017 After Record in 2016”, Announcement, January 18, www.moodys.com/research/Moodys-Global-green-bond-issuance-could-rise-to-USD206B-in--PR_360880?WT.mc_id=AM~WWFob29fRmluYW5jZV9TQl9SYXRpbmcgTmV3c19BbGxfRW5n~20170118_PR_360880.
Nakhooda, S. (2015), “Climate Finance: What was Actually Agreed in Paris?” Overseas Development Institute webpage, www.odi.org/comment/10201-climate-finance-agreed-paris-cop21 (accessed 27 December 2016).
OECD (2017a, forthcoming), Enabling Investment and Innovation in Renewable Energy, OECD Publishing, Paris.
OECD (2017b, forthcoming), The Empirics of Enabling Investment and Innovation in Renewable Energy, OECD Publishing, Paris.
OECD (2016a), “OECD Welcomes Ground-breaking Peer Reviews by China and US of their Fossil Fuel Subsidies”, Press Release, www.oecd.org/greengrowth/oecd-welcomes-ground-breaking-peer-reviews-by-china-and-us-of-their-fossil-fuel-subsidies.htm.
OECD (2016b), Green Investment Banks: Scaling up Private Investment in Low-carbon, Climate-resilient Infrastructure, OECD Publishing, Paris, http://dx.doi.org/10.1787/9789264245129-en.
OECD (2016c), Economic Outlook for Southeast Asia, China and India 2016: Enhancing Regional Ties, OECD Publishing, Paris, http://dx.doi.org/10.1787/saeo-2016-en.
OECD (2015a), Green Finance and Investment: Overcoming Barriers to International Investment in Clean Energy, OECD Publishing, Paris, http://dx.doi.org/10.1787/9789264227064-en.
OECD (2015b), Policy Guidance for Investment in Clean Energy Infrastructure: Expanding Access to Clean Energy for Green Growth and Development, OECD Publishing, Paris, http://dx.doi.org/10.1787/9789264212664-en.
OECD (2015c), Policy Framework for Investment, 2015 Edition, OECD Publishing, Paris, http://dx.doi.org/10.1787/9789264208667-en.
OECD (2015d), Green Finance and Investment: Mapping Channels to Mobilise Institutional Investment in Sustainable Energy, OECD Publishing, Paris, http://dx.doi.org/10.1787/9789264224582-en.
OECD (2015e), Climate Change Mitigation: Policies and Progress, OECD Publishing, Paris, http://dx.doi.org/10.1787/9789264238787-en.
OECD (2015f), OECD Economic Surveys: China 2015, OECD Publishing, Paris, http://dx.doi.org/10.1787/eco_surveys-chn-2015-en.
OECD (2015g), Aligning Policies for a Low-carbon Economy, OECD Publishing, Paris, http://dx.doi.org/10.1787/9789264233294-en.
OECD and Bloomberg Philanthropies (2015), Green Bonds: Mobilising the Debt Capital Markets for a Low-carbon Transition, Policy Perspectives, https://issuu.com/oecd.publishing/docs/green-bonds-policy-perspectives-lr.
OGCI (2016), Overview of the Oil and Gas Climate Initiative, Oil and Gas Climate Initiative website, www.oilandgasclimateinitiative.com/about (accessed 5 December 2016).
140 BUSINESS INSIGHTS ON EMERGING MARKETS 2017 © OECD 2017
PRI (2016), Montreal Pledge, Principles for Responsible Investment, http://montrealpledge.org/wp-content/uploads/2016/12/MontrealPledge_A4-Flyer-2016.pdf.
Solairedirect (2016), “ENGIE Wins Solar Energy Project Bidding for 140 MW in India”, Solairedirect webpage, https://www.solairedirect.com/es/actualites/engie-wins-solar-energy-project-bidding-for-140-mw-in-india/ (accessed 13 July 2016).
UNEP FI (2016), Investment Portfolios in a Carbon Constrained World: The Second Annual Progress Report of the Portfolio Decarbonization Coalition, United Nations Environment Programme Finance Initiative, Geneva www.unepfi.org/wordpress/wp-content/uploads/2016/11/PDCreport2016.pdf.
UNFCCC (2015), Adoption of the Paris Agreement, Draft decision CP.21, Conference of the Parties, Twenty-first Session, Paris, 30 November to 11 December 2015, United Nations Framework Convention on Climate Change, Bonn, https://unfccc.int/resource/docs/2015/cop21/eng/l09r01.pdf.
Wang, H. (2015), Emissions Trading in China: An Opportunity for Renewable Energy? A Survey of Expert Opinions, IISD Report, International Institute for Sustainable Development, April, Winnipeg, www.iisd.org/sites/default/files/publications/emissions-trading-in-china-renewable-energy.pdf.
White House (2015), “US-China Joint Presidential Statement on Climate Change”, Press Release, Office of the Press Secretary, Washington DC, www.whitehouse.gov/the-press-office/2015/09/25/us-china-joint-presidential-statement-climate-change.
White House (2014), “U.S.-China Joint Announcement on Climate Change”, Press Release, Office of the Press Secretary, Washington DC, www.whitehouse.gov/the-press-office/2014/11/11/us-china-joint-announcement-climate-change.
World Bank (2015), World Development Indicators, GDP per capita (current US$), The World Bank website, http://data.worldbank.org/indicator/NY.GDP.PCAP.CD?end=2015&start=1995&view=chart (accessed 27 July 2016).
WEF (2015), Open Letter from CEOs to World Leaders Urging Climate Action, World Economic Forum webpage, www.weforum.org/agenda/2015/11/open-letter-from-ceos-to-world-leaders-urging-climate-action/.
World Green Building Council (2015), “Green Building Councils Commit to Green Area Twice the Size of Singapore”, News Section, World Green Building Council webpage, www.worldgbc.org/activities/news/global-news/green-iibuilding-councils-commit-green-area-twice-size-singapore.
For more information about the OECD Emerging Markets Network, contact the Secretariat:
www.oecd.org/dev/oecdemnet.htm