Embed Size (px)
Citation preview

2013FIRSTHALFRESULTS
CONSOLIDATED REPORT & ACCOUNTS First Nine Months 2015
Unaudited

R&A - First Nine Months 2015
Index
INDEX
I – Consolidated Management Report
Message from the Chairman and CEO - Pedro Soares dos Santos 3
1. Sales Analysis 3
2. Results Analysis 4
3. Balance Sheet 5
4. Outlook 2015 6
II – Consolidated Management Report Appendix
1. Sales Growth 7
2. Store Network 7
3. EBITDA Margin Breakdown 7
4. Financial Costs Breakdown 7
5. Definitions 7
6. Information Regarding Individual Financial Statements 7
III – Consolidated Financial Statements
1. Consolidated Financial Statements 8
2. Notes to the Consolidated Financial Statements 12

R&A - First Nine Months 2015
Consolidated Management Report
3
CONSOLIDATED MANAGEMENT REPORT
Message from the Chairman and CEO – Pedro Soares dos Santos
‘In the first nine months of the year the Group strengthened its competitive position in all markets where i t operates while strongly increasing cash flow generation.
Biedronka strengthened its market share and continues reinforcing the competitiveness of its model for the
future.
In Portugal, Pingo Doce and Recheio continued to outperform their respective markets.
In Colombia, in line with our expansion plan, we opened a second region in the Caribbean Coast, and we had 110 stores operating under the Ara brand at the end of September.
With most of the year behind us, I feel reassured by the proven capacity of all our Companies to leverage
on their differentiated strategies and to keep on track to deliver our targets, with top line growth as their main priority.’
1. Sales Analysis
(Million Euro)
% total % total Pln Euro % total % total Pln Euro
Biedronka 6,836 67.2% 6,191 66.3% 9.8% 10.4% 2,337 66.2% 2,162 65.9% 8.4% 8.1%
Pingo Doce 2,511 24.7% 2,391 25.6% 5.0% 888 25.2% 835 25.4% 6.4%
Recheio 631 6.2% 603 6.5% 4.6% 238 6.7% 229 7.0% 3.9%
Mkt. Repr. and Rest. Serv. 56 0.6% 56 0.6% 0.9% 20 0.6% 20 0.6% 0.3%
Others & Cons. Adjustments 140 1.4% 92 1.0% n.a. 48 1.3% 35 1.1% n.a.
Total JM 10,175 100% 9,333 100% 9.0% 3,531 100% 3,281 100% 7.6%
D % Q3 15 Q3 14 D %9M 15 9M 14
In the first nine months of the year, Group sales increased 9.0% to €10,175m (+8.7% excluding the currency impact).
6.191
2.391
603148
9.333
6.836
2.511
631196
10.175
Biedronka Pingo Doce Recheio Others &Cons.Adjust.
JMConsolidated
Sales (Million Euro)
9M 14 9M 15
+33.1%
+10.4%
+4.6%
+5.0%
+9.0%
The performance in the period was the result of solid delivery across all banners which drove Group LFL sales to increase by 3.3%.
In Poland, the competitive landscape remained intense and promotion oriented. Food deflation was at -2.2%
in the nine months, softening from -2.1% in second quarter of 2015 to -0.9% in third quarter of 2015.
Biedronka total sales grew 10.4% to €6,836m both driven by 2.9% LFL sales increase and by our continued store expansion programme. In the third quarter of the year, Biedronka maintained a strong LFL of 3.5%
with volume growth substantially overcompensating basket deflation which remained close to -3%. In the first nine months of the year, the Company opened 92 stores (72 net additions).
I
2.9%
4.1%* 4.2%
3.3%
LFL Growth (9M 15/9M 14)
* Ex-Fuel LFL: 4.7%
9.5%
2.0%2.6%
5.3%
Biedronka PingoDoce
Recheio JM Cons.
Crescimento LFL (1T 12/1T 11)

R&A - First Nine Months 2015
Consolidated Management Report
4
In third quarter of 2015 Biedronka focused on its revamping programme and its in-store adjustments in
order to benefit fully from the new offer already in place.
In Portugal, while food inflation was 1.2% for the nine months of the year (+1.7% in third quarter of 2015) the market remained very promotion-driven.
Pingo Doce had another very strong quarter with LFL sales growth, excluding fuel, reaching 4.7% in the nine
months of the year (+5.2% in third quarter of 2015).
Pingo Doce maintained its promotional strategy while continuing to improve the shopping experience (21 remodellings in the nine months) and quality and innovation of the overall offer. Pingo Doce opened 19
stores, two of which replaced existing locations.
Recheio delivered another sound quarter with LFL reaching 4.2% in nine months of the year (+3.9% in third quarter of 2015). Total sales increase 4.6% over the nine months of 2014.
In the nine months of the year, Ara and Hebe sales were €83m and €72m, respectively.
In September, Ara opened its second distribution centre entering in the Caribbean Coast region, and ended
the month with a total of 110 stores.
2. Results Analysis
(Million Euro) 9M 15 9M 14 D Q3 15 Q3 14 D
Net Sales and Services 10,175 9,333 9.0% 3,531
3,281
7.6%
Total Margin 2,169 21.3% 1,980 21.2% 9.5% 757 21.5% 694 21.1% 9.2%
Operating Costs -1,581 15.5% 1,432 15.3% 10.4% -533 -15.1% -488 -14.9% 9.3%
EBITDA 588 5.8% 547 5.9% 7.3% 224 6.4% 206 6.3% 8.9%
Depreciation -221 -2.2% -205 -2.2% 7.6% -74 -2.1% -70 -2.1% 5.4%
EBIT 367 3.6% 342 3.7% 7.1% 151 4.3% 136 4.1% 10.8%
Financial Results -20 -0.2% -26 -0.3% -24.7% -7 -0.2% -8 -0.3% -18.8%
Profit in Associated Companies 15 0.1% 15 0.2% -0.4% 7 0.2% 7 0.2% 1.6%
Non-Recurrent Items -7 -0.1% -1 0.0% n.a. -3 -0.1% -1 0.0% n.a.
EBT 354 3.5% 330 3.5% 7.4% 148 4.2% 133 4.1% 10.7%
Taxes -83 -0.8% -74 -0.8% 11.5% -34 -0.9% -30 -0.9% 13.2%
Net Profit 272 2.7% 256 2.7% 6.2% 114 3.2% 104 3.2% 10.0%
Non Controlling Interests -20 -0.2% -19 -0.2% 4.3% -11 -0.3% -12 -0.4% -2.0%
Net Profit attributable to JM 252 2.5% 237 2.5% 6.4% 103 2.9% 92 2.8% 11.5%
EPS (€) 0.40 0.38 6.4% 0.16 0.15 11.5%
Operating Profit
At the Group level, in the nine months of the year consolidated EBITDA grew 7.3% to €588m. The respective margin was 5.8%, 10bps down from the margin registered in the same period last year. In third
quarter of 2015, EBITDA grew 8.9% with an EBITDA margin of 6.4%, 10bps higher than in third quarter of 2014.
547588
5.9% 5.8%
0%
6%
0
300
600
9M 159M 14
+7.3%
(Million Euro) (% Sales)

R&A - First Nine Months 2015
Consolidated Management Report
5
In the first nine months, Biedronka’s EBITDA reached €474m, posting an increase of 9.4% on previous year
(+10.8% in third quarter of 2015). EBITDA margin was at 6.9%, 10bps down in the nine months of 2014, reflecting the investments made in the value proposition.
The distribution businesses in Portugal reached an EBITDA of €169m, 1.3% ahead of the same period last
year. EBITDA margin was at 5.4%, 20bps down on previous year impacted by the investments in the value proposition and in the top line.
Financial Results
Financial charges for the Group were €20m, €6m below the nine months of 2014 due to lower average net debt and lower cost of debt.
Net Results Net Profit attributable to Jerónimo Martins in the nine months of the year was €252m, 6.4% ahead of the
same period last year. The nine months of the year net profit includes start-up losses in Ara and Hebe which at EBITDA level amounted to €42m.
3. Balance Sheet
(Million Euro) 9M 15 2014 9M 14 (1)
Net Goodwill 642 640 647
Net Fixed Assets 2,997 2,940 2,895
Total Working Capital -1,829 -1,778 -1,630
Others 114 111 119
Invested Capital 1,924 1,912 2,031
Total Borrowings 689 714 742
Leasings 0 1 2
Accrued Interest 5 4 10
Marketable Sec. & Bank Deposits -519 -446 -305
Net Debt 176 273 449
Non Controlling Interests 248 243 240
Share Capital 629 629 629
Reserves and Retained Earnings 871 767 713
Shareholders Funds 1,748 1,639 1,582
Gearing 10.1% 16.7% 28.4%
(1) Change of accounting policies The Group changed the previous accounting policy for Land (classified as
Tangible Assets) and adopted the historical cost for Land in the financial statements prepared as at December 31, 2014, as explained in the 2014 Annual Report. The Balance Sheet presented for September 2014 was restated in line with the new accounting policy.
Net Debt for the Group was €176m and Gearing was 10.1%.
Cash Flow
(Million Euro) 9M 15 9M 14
EBITDA 588 547
Interest Payment -20 -23
Other Financial Items 11 16
Income Tax -84 -85
Funds From Operations 496 455
Capex Payment -283 -348
Working Capital Movement 51 0
Others -5 1
Free Cash Flow 258 109
The Free Cash Flow in the period, after capex payments, was €258m, €150m above the same period in
2014.

R&A - First Nine Months 2015
Consolidated Management Report
6
Investment Programme The Group Capex was €283m in the first nine months of the year, c.50% of which was invested in
Biedronka.
Distribution from Free Reserves At its meeting on November 4, 2015, the Board of Directors decided to request the Chairman of the General Meeting to summon an Extraordinary Shareholders’ Meeting to present a proposal for the distribution of an
amount of €235,662,832.50 from free reserves payable in 2015. This includes the dividends that would be paid in 2016 and is equivalent to the gross amount of €0.375 per share, to be distributed to the
Shareholders proportionally to their holdings, excluding own shares.
4. Outlook for 2015
The solid performance in the first nine months of the year reinforces our confidence that the banners will
deliver their targets. Our commitment to top line performance across the markets where we operate
remains unchanged.
For Ara and Hebe EBITDA losses are still expected in the range €60-70m (excl. F/X).
Our capex for the year is estimated to be no higher than €450m following an efficient execution of the
revamping plan in Biedronka.
The store opening programme in Biedronka is confirmed in line with the planned 100 new stores for the
year.
Due to both strong volume growth and tightly controlled execution plan, Biedronka’s EBITDA margin for the
year is expected to be above the established floor of 6.5% on sales.
Lisbon, 4th November 2015
The Board of Directors

R&A - First Nine Months 2015
Consolidated Management Report Appendix
7
CONSOLIDATED MANAGEMENT REPORT APPENDIX
1. Sales Growth
Total Sales Growth LFL Sales Growth
Q1 15 Q2 15 H1 15 Q3 15 9M 15 Q1 15 Q2 15 H1 15 Q3 15 9M 15
Biedronka
Euro 11.2% 12.1% 11.7% 8.1% 10.4%
PLN 11.4% 9.8% 10.6% 8.4% 9.8% 2.9% 2.4% 2.6% 3.5% 2.9%
Pingo Doce 3.9% 4.7% 4.3% 6.4% 5.0% 3.4% 4.2% 3.8% 4.5% 4.1%
Ex-Fuel 4.7% 5.2% 4.9% 7.1% 5.6% 4.2% 4.7% 4.5% 5.2% 4.7%
Recheio 4.1% 5.8% 5.0% 3.9% 4.6% 4.7% 4.1% 4.4% 3.9% 4.2%
2. Stores Network
Closings
Q1 15 Q2 15 Q3 15 9M 15 9M 15 9M 14
Biedronka 2,587 58 25 9 20 2,659 2,527
Pingo Doce 380 2 4 13 2 397 380
Recheio 41 0 0 0 0 41 41
Closings/
Remodellings
Q1 15 Q2 15 Q3 15 9M 15 9M 15 9M 14
Biedronka 1,649,889 40,870 17,991 6,250 4,465 1,710,534 1,604,628
Pingo Doce 460,863 1,252 4,540 12,486 1,018 478,123 460,863
Recheio 128,665 0 0 0 524 128,141 128,665
Number of Stores 2014Openings
Sales Area (sqm) 2014Openings Network
Network
3. EBITDA Margin Breakdown
(% of sales) 9M 15 % total 9M 14 % total
Biedronka 6.9% 80.7% 7.0% 79.1%
Distribution Portugal 5.4% 28.8% 5.6% 30.5%
Others & Cons. Adjustments n.a. -9.4% n.a. -9.6%
JM Consolidated 5.8% 100% 5.9% 100%
4. Financial Costs Breakdown
(Million Euro) 9M 15 9M 14
Net Interest -17 -23
Exchange Differences 0 0
Others -3 -3
Financial Results -20 -26
5. Definitions
Like For Like (LFL) sales: sales made by stores that operated under the same conditions in the two periods. Excludes stores opened or closed in one of the two periods. Sales of stores that underwent profound
remodelling are excluded for the remodelling period (store closure);
Cash Flow per share: (Net Profit + Depreciation – Deferred Tax – Non-recurrent Items) / Number of Shares;
Gearing: Net Debt / Shareholder Funds.
6. Information Regarding Individual Financial Statements
In accordance with number 3 of article 10 of the Regulation number 5/2008 of the Portuguese Securities
Market Commission (CMVM), the Quarter Individual Financial Statements of Jerónimo Martins SGPS, S.A. will not be disclosed as they do not include additional relevant information, compared to the one presented
in this report.
II
R&A - First Nine Months 2015
Consolidated Financial Statements
8
CONSOLIDATED FINANCIAL STATEMENTS
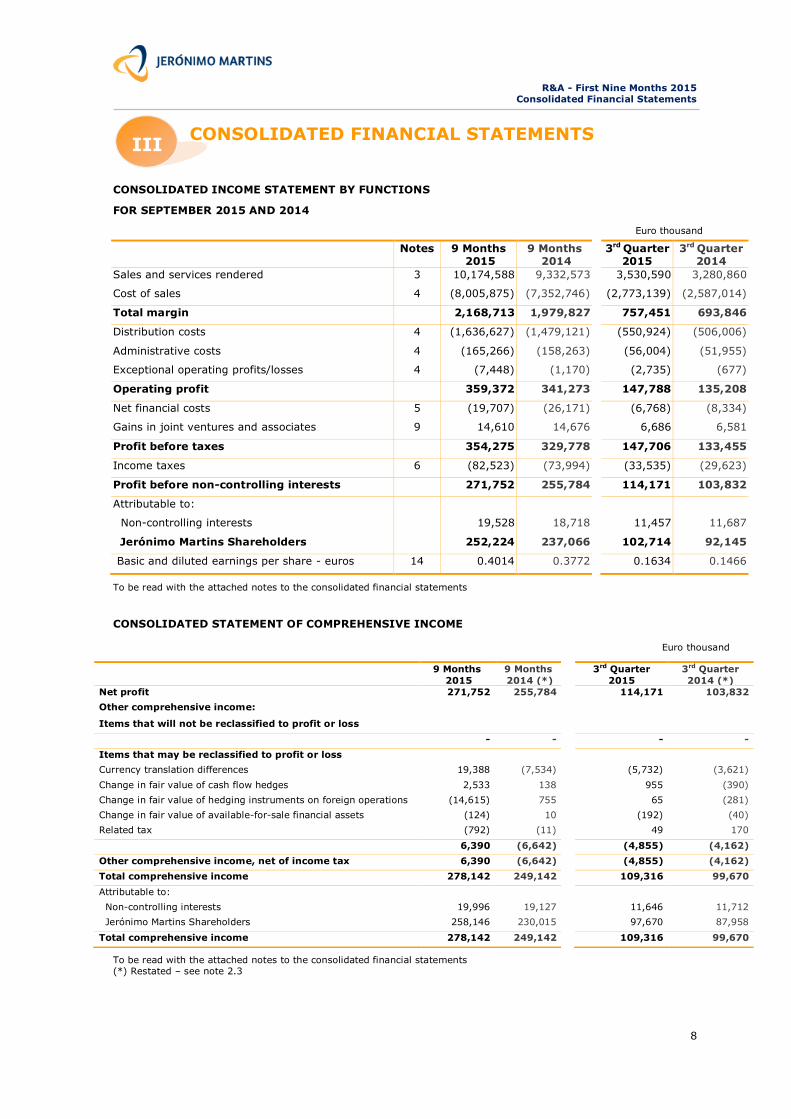
CONSOLIDATED INCOME STATEMENT BY FUNCTIONS
FOR SEPTEMBER 2015 AND 2014
Euro thousand
To be read with the attached notes to the consolidated financial statements
CONSOLIDATED STATEMENT OF COMPREHENSIVE INCOME
Euro thousand
To be read with the attached notes to the consolidated financial statements (*) Restated – see note 2.3
Notes 9 Months 2015
9 Months 2014
3rd Quarter 2015
3rd Quarter 2014
Sales and services rendered 3 10,174,588 9,332,573 3,530,590 3,280,860
Cost of sales 4 (8,005,875) (7,352,746) (2,773,139) (2,587,014)
Total margin 2,168,713 1,979,827 757,451 693,846
Distribution costs 4 (1,636,627) (1,479,121) (550,924) (506,006)
Administrative costs 4 (165,266) (158,263) (56,004) (51,955)
Exceptional operating profits/losses 4 (7,448) (1,170) (2,735) (677)
Operating profit 359,372 341,273 147,788 135,208
Net financial costs 5 (19,707) (26,171) (6,768) (8,334)
Gains in joint ventures and associates 9 14,610 14,676 6,686 6,581
Profit before taxes 354,275 329,778 147,706 133,455
Income taxes 6 (82,523) (73,994) (33,535) (29,623)
Profit before non-controlling interests 271,752 255,784 114,171 103,832
Attributable to:
Non-controlling interests 19,528 18,718 11,457 11,687
Jerónimo Martins Shareholders 252,224 237,066 102,714 92,145
Basic and diluted earnings per share - euros 14 0.4014 0.3772 0.1634 0.1466
9 Months
2015
9 Months
2014 (*)
3rd Quarter
2015
3rd Quarter
2014 (*)
Net profit 271,752 255,784 114,171 103,832
Other comprehensive income:
Items that will not be reclassified to profit or loss
- - - -
Items that may be reclassified to profit or loss
Currency translation differences 19,388 (7,534) (5,732) (3,621)
Change in fair value of cash flow hedges 2,533 138 955 (390)
Change in fair value of hedging instruments on foreign operations (14,615) 755 65 (281)
Change in fair value of available-for-sale financial assets (124) 10 (192) (40)
Related tax (792) (11) 49 170
6,390 (6,642) (4,855) (4,162)
Other comprehensive income, net of income tax 6,390 (6,642) (4,855) (4,162)
Total comprehensive income 278,142 249,142 109,316 99,670
Attributable to:
Non-controlling interests 19,996 19,127 11,646 11,712
Jerónimo Martins Shareholders 258,146 230,015 97,670 87,958
Total comprehensive income 278,142 249,142 109,316 99,670
III
R&A - First Nine Months 2015
Consolidated Financial Statements
9
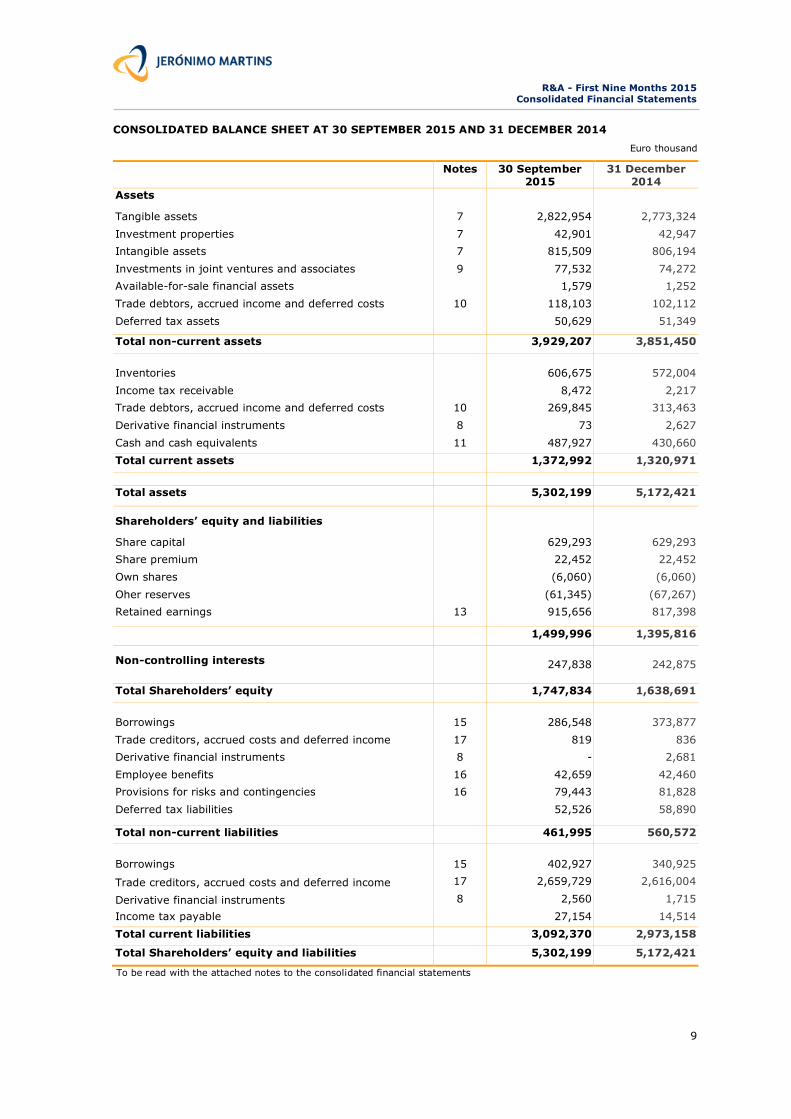
CONSOLIDATED BALANCE SHEET AT 30 SEPTEMBER 2015 AND 31 DECEMBER 2014
Euro thousand
Notes 30 September 2015
31 December 2014
Assets
Tangible assets 7 2,822,954 2,773,324
Investment properties 7 42,901 42,947
Intangible assets 7 815,509 806,194
Investments in joint ventures and associates 9 77,532 74,272
Available-for-sale financial assets 1,579 1,252
Trade debtors, accrued income and deferred costs 10 118,103 102,112
Deferred tax assets 50,629 51,349
Total non-current assets 3,929,207 3,851,450
Inventories 606,675 572,004
Income tax receivable 8,472 2,217
Trade debtors, accrued income and deferred costs 10 269,845 313,463
Derivative financial instruments 8 73 2,627
Cash and cash equivalents 11 487,927 430,660
Total current assets 1,372,992 1,320,971
Total assets 5,302,199 5,172,421
Shareholders’ equity and liabilities
Share capital 629,293 629,293
Share premium 22,452 22,452
Own shares (6,060) (6,060)
Oher reserves (61,345) (67,267)
Retained earnings 13 915,656 817,398
1,499,996 1,395,816
Non-controlling interests 247,838 242,875
Total Shareholders’ equity 1,747,834 1,638,691
Borrowings 15 286,548 373,877
Trade creditors, accrued costs and deferred income 17 819 836
Derivative financial instruments 8 - 2,681
Employee benefits 16 42,659 42,460
Provisions for risks and contingencies 16 79,443 81,828
Deferred tax liabilities 52,526 58,890
Total non-current liabilities 461,995 560,572
Borrowings 15 402,927 340,925
Trade creditors, accrued costs and deferred income 17 2,659,729 2,616,004
Derivative financial instruments 8 2,560 1,715
Income tax payable 27,154 14,514
Total current liabilities 3,092,370 2,973,158
Total Shareholders’ equity and liabilities 5,302,199 5,172,421
To be read with the attached notes to the consolidated financial statements

R&A - First Nine Months 2015
Consolidated Financial Statements
10
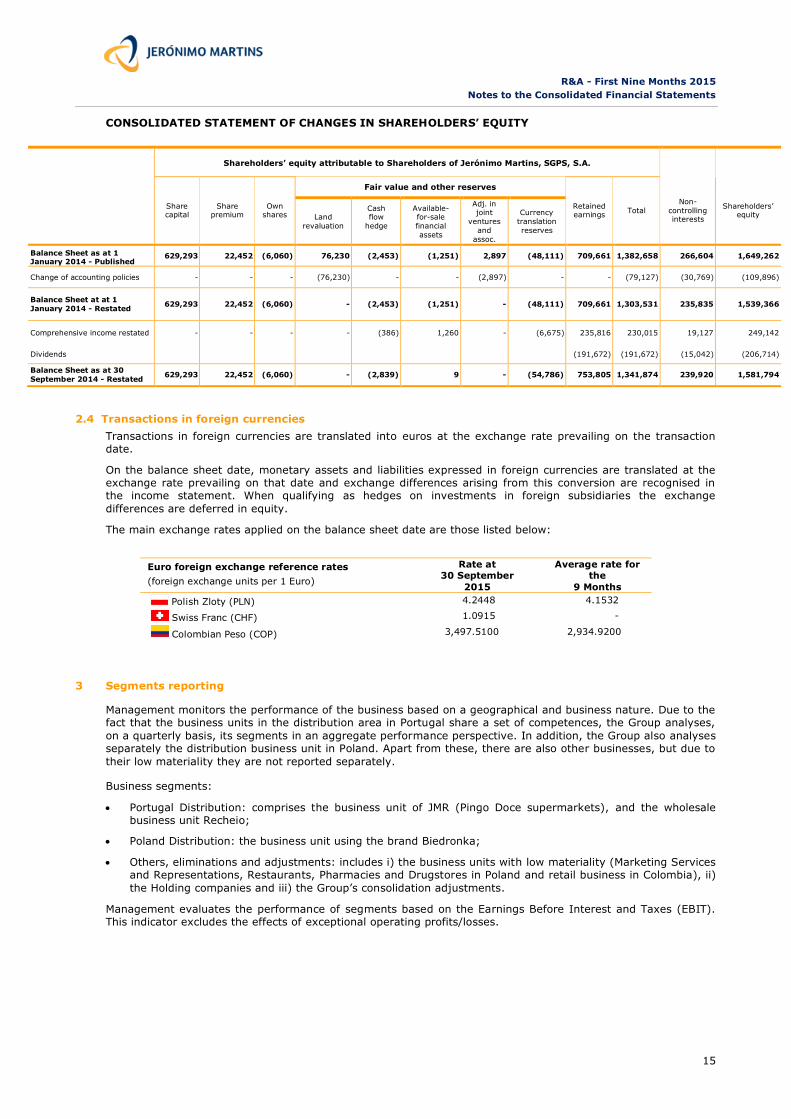
CONSOLIDATED STATEMENT OF CHANGES IN SHAREHOLDERS’ EQUITY
Euro thousand
Shareholders’ equity attributable to Shareholders of Jerónimo Martins, SGPS, S.A.
N
o
t e
s
Share
capital
Share
premium
Own
shares
Other reserves
Retained
earnings Total
Non-
controlling interests
Shareholders’
equity Cash flow
hedge
Available-for-
sale financial
assets
Currency
translation
reserves
Balance Sheet as at 31
December 2013 (*) 629,293 22,452 (6,060) (2,453) (1,251) (48,111) 709,661 1,303,531 235,835 1,539,366
Equity changes in the 9
Months of 2014
Currency translation differences
5 (7,430) (7,425) (7,425)
Change in fair value of cash
flow hedging (391) (391) 409 18
Change in fair value of
hedging instruments on
foreign operations
755 755 755
Change in fair value of
available-for-sale financial
investments
1,260 (1,250) 10 10
Other comprehensive
income - - - (386) 1,260 (6,675) (1,250) (7,051) 409 (6,642)
Net profit 237,066 237,066 18,718 255,784
Total comprehensive
income - - - (386) 1,260 (6,675) 235,816 230,015 19,127 249,142
Dividends (191,672) (191,672) (15,042) (206,714)
Balance Sheet as at 30
September 2014 (*) 629,293 22,452 (6,060) (2,839) 9 (54,786) 753,805 1,341,874 239,920 1,581,794
Balance Sheet as at 31
December 2014 629,293 22,452 (6,060) (2,548) (157) (64,562) 817,398 1,395,816 242,875 1,638,691
Equity changes in the 9
Months of 2015
Currency translation
differences (13) 19,105 19,092 19,092
Change in fair value of cash flow hedging
1,541 1,541 468 2,009
Change in fair value of
hedging instruments on
foreign operations
(14,615) (14,615) (14,615)
Change in fair value of
available-for-sale financial
investments
(96) (96) (96)
Other comprehensive
income - - - 1,528 (96) 4,490 - 5,922 468 6,390
Net profit 252,224 252,224 19,528 271,752
Total comprehensive income for the year
- - - 1,528 (96) 4,490 252,224 258,146 19,996 278,142
Dividends 13 (153,966) (153,966) (15,033) (168,999)
Balance Sheet as at 30
September 2015 629,293 22,452 (6,060) (1,020) (253) (60,072) 915,656 1,499,996 247,838 1,747,834
To be read with the attached notes to the consolidated financial statements
(*) Restated – see note 2.3
R&A - First Nine Months 2015
Consolidated Financial Statements
11
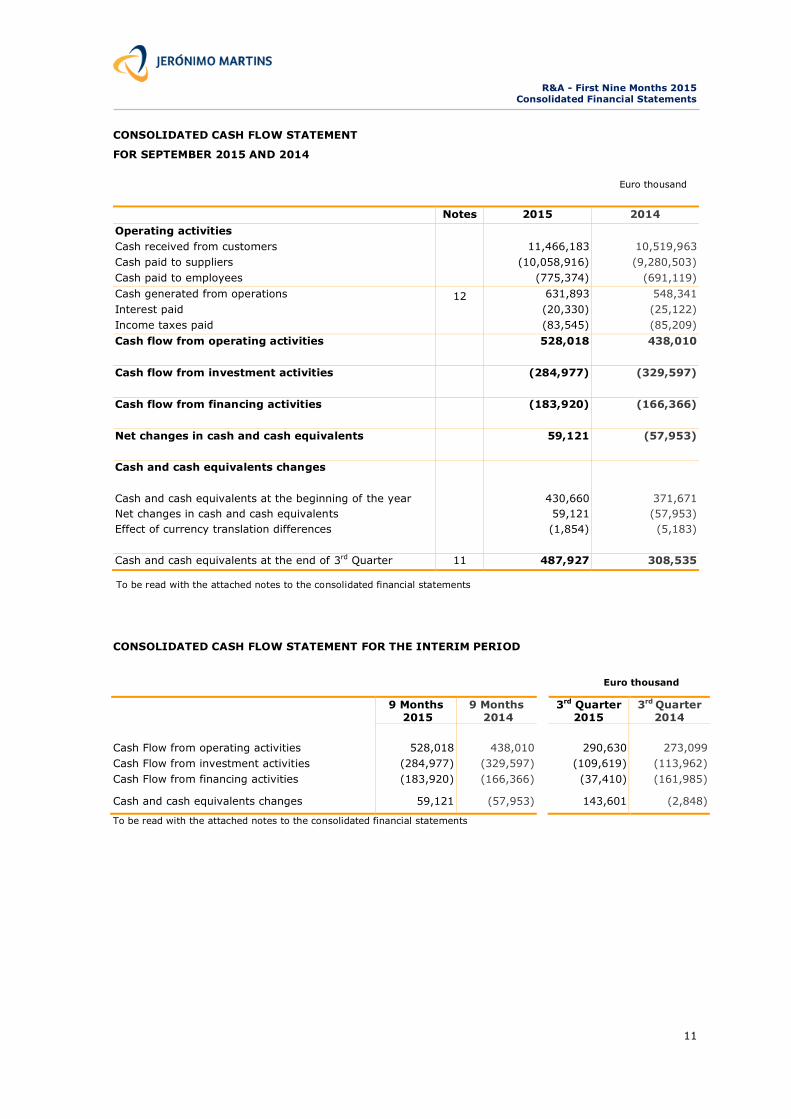
CONSOLIDATED CASH FLOW STATEMENT
FOR SEPTEMBER 2015 AND 2014
Euro thousand
To be read with the attached notes to the consolidated financial statements
CONSOLIDATED CASH FLOW STATEMENT FOR THE INTERIM PERIOD
Euro thousand
9 Months 2015
9 Months 2014
3rd Quarter 2015
3rd Quarter 2014
Cash Flow from operating activities 528,018 438,010 290,630 273,099
Cash Flow from investment activities (284,977) (329,597) (109,619) (113,962)
Cash Flow from financing activities (183,920) (166,366) (37,410) (161,985)
Cash and cash equivalents changes 59,121 (57,953) 143,601 (2,848)
To be read with the attached notes to the consolidated financial statements
Notes 2015 2014
Operating activities
Cash received from customers 11,466,183 10,519,963
Cash paid to suppliers (10,058,916) (9,280,503)
Cash paid to employees (775,374) (691,119)
Cash generated from operations 12 631,893 548,341
Interest paid (20,330) (25,122)
Income taxes paid (83,545) (85,209)
Cash flow from operating activities 528,018 438,010
Cash flow from investment activities (284,977) (329,597)
Cash flow from financing activities (183,920) (166,366)
Net changes in cash and cash equivalents 59,121 (57,953)
Cash and cash equivalents changes
Cash and cash equivalents at the beginning of the year 430,660 371,671
Net changes in cash and cash equivalents 59,121 (57,953)
Effect of currency translation differences (1,854) (5,183)
Cash and cash equivalents at the end of 3rd Quarter 11 487,927 308,535

R&A - First Nine Months 2015
Notes to the Consolidated Financial Statements
12
Index to the Notes to the Consolidated Financial Statements Page
1 Activity ................................................................................................................................................ 13
2 Accounting policies ................................................................................................................................ 13
3 Segments reporting ............................................................................................................................... 15
4 Total margin and operating costs ............................................................................................................ 16
5 Net financial costs ................................................................................................................................. 17
6 Income tax recognised in the income statement ........................................................................................ 17
7 Fixed assets, intangible assets and investment property ........................................................................... 17
8 Derivative financial instruments .............................................................................................................. 18
9 Investments in joint ventures and associates ............................................................................................ 18
10 Trade debtors, accrued income and deferred costs .................................................................................... 18
11 Cash and cash equivalents ..................................................................................................................... 19
12 Cash generated from operations ............................................................................................................. 19
13 Dividends ............................................................................................................................................. 19
14 Basic and diluted earnings per share........................................................................................................ 19
15 Borrowings ........................................................................................................................................... 19
16 Provisions and employee benefits ............................................................................................................ 20
17 Trade creditors, accrued costs and deferred income ................................................................................... 20
18 Contingencies ....................................................................................................................................... 20
19 Related parties...................................................................................................................................... 21
20 Events after the balance sheet date ......................................................................................................... 21

R&A - First Nine Months 2015
Notes to the Consolidated Financial Statements
13
1 Activity
Jerónimo Martins, SGPS, S.A. (JMH), is the parent Company of Jerónimo Martins Group (Group) and has its head office in Lisbon.
The Group is devoted to the production, distribution and sale of food and other fast moving consumer goods products. The Group operates in Portugal, Poland and Colombia.
Head Office: Rua Actor António Silva, n.º 7, 1649-033 Lisboa
Share Capital: 629,293,220 euros
Registered at the Commercial Registry Office and Tax Number: 500 100 144
JMH has been listed on Euronext Lisbon since 1989.
The Board of Directors approved these consolidated financial statements on 4th November 2015.
2 Accounting policies
All amounts are shown in thousand euros (EUR thousand) unless otherwise stated.
The JMH consolidated financial statements were prepared in accordance with the interim financial reporting
standard (IAS 34), and all other International Financial Reporting Standards (IFRS) issued by International
Accounting Standards Board (IASB) and with the interpretations of the International Financial Reporting Interpretations Committee (IFRIC) as adopted by the European Union.
The consolidated financial statements were prepared in accordance with the same standards and accounting policies adopted by the Group in the preparation of the annual financial statements, including an explanation of
the events and relevant changes for the understanding of variations in the financial position and Group performance since the last annual report. Thus, some of the notes from the 2014 annual report are omitted
because no changes occurred or they are not materially relevant for the understanding of the interim financial statements.
As mentioned in the Consolidated Financial Statements chapter of the 2014 Annual Report, point 30 - Financial risks, the Company, as a result of its normal activity, is exposed to several risks which are monitored and
mitigated throughout the year. During the first nine months of 2015, there was no material changes in addition to the notes detailed below, that could significantly change the assessment of the risks that the group is exposed
to.
2.1 New standards, amendments and interpretations adopted by the Group
In 2014, the EU issued the following Regulations, which were adopted by the Group from January 1st 2015:
EU Regulation IASB Standard or IFRIC Interpretation endorsed by EU
Issued in Mandatory for financial years
beginning on or after
Regulation no. 1361/2014
Annual Improvements to IFRS’s 2011–2013 Cycle: IFRS 1 First-time Adoption of IFRS, IFRS 3 Business Combinations,
IFRS 13 Fair Value Measurement and IAS 40 Investment Property (Amendment)
December 2013 January 1, 2015
The Group adopted the new improvements, with no significant impact on the Consolidated Financial Statements.
2.2 New standards, amendments and interpretations endorsed by EU but not effective for the financial year beginning 1 January 2015 and not early adopted
The EU adopted several improvements to IFRS’s, issued by the IASB and Interpretations issued by the IFRIC:
EU Regulation IASB Standard or IFRIC Interpretation
endorsed by EU
Issued in Mandatory for
financial years beginning on or after
Regulation no. 28/2015
Annual Improvements to IFRS’s 2010–2012 Cycle: IFRS 2
Share-Based Payment, IFRS 3 Business Combinations, IFRS 8 Operating Segments, IFRS 13 Fair Value Measurement, IAS 16 Property, Plant and Equipment, IAS 24 Related Party
Disclosures and IAS 38 Intangible Assets (Amendment)
December 2013 February 1, 2015
Regulation no. 29/2015 IAS 19 Employee Benefits: Defined Benefit Plans - Employee
Contributions (Amendment) November 2013 February 1, 2015
These amendments to standards are effective for annual periods beginning on or after February 1st, 2015, and
have not been applied in preparing these consolidated financial statements. None of these amendments is
expected to have a significant impact on the Group’s Consolidated Financial Statements.

R&A - First Nine Months 2015
Notes to the Consolidated Financial Statements
14
2.3 Restatement of financial statements (change of accounting policies)
The Group has decided to adopt the historical cost for land (classified as tangible assets) in the financial
statements prepared as at December 31, 2014, with restatement of the opening balances at January 1, 2014 and January 1st, 2013.
In accordance with IAS 8, the effects of the change in the accounting policy were applied retrospectively. There
are no impacts on the Income Statement for the first nine months of 2014. The Balance Sheet opening and closing balances for the year 2014, Statement of Comprehensive Income and Statement of Changes in
Shareholders’ Equity were impacted as follows:
CONSOLIDATED BALANCE SHEET
30 September 2014
Published
Change of accounting
policies Restated
Assets
Tangible assets 2,854,225 (129,728) 2,724,497
Investment property 44,071 - 44,071
Intangible assets 817,574 - 817,574
Investments in joint ventures and associates 79,866 (2,897) 76,969
Other non-current assets 131,935 - 131,935
Total non-current assets 3,927,671 (132,625) 3,795,046
Inventories 544,732 - 544,732
Other current assets 292,399 - 292,399
Cash and cash equivalents 308,535 - 308,535
Total current assets 1,145,666 - 1,145,666
Total assets 5,073,337 (132,625) 4,940,712
Shareholders’ equity and liabilities
Attributable to Jerónimo Martins Shareholders 1,420,867 (78,993) 1,341,874
Non-controlling interests 270,689 (30,769) 239,920
Total shareholders’ equity 1,691,556 (109,762) 1,581,794
Borrowings 607,733 - 607,733
Deferred tax liabilities 78,068 (22,863) 55,205
Other non-current liabilities 120,967 - 120,967
Total non-current liabilities 806,768 (22,863) 783,905
Borrowings 136,770 - 136,770
Other current liabilities 2,438,243 - 2,438,243
Total current liabilities 2,575,013 - 2,575,013
Total shareholders’ equity and liabilities 5,073,337 (132,625) 4,940,712
CONSOLIDATED STATEMENT OF COMPREHENSIVE INCOME
30 September
2014
Published
Change of
accounting policies
Restated
Net profit 255,784 - 255,784
Other comprehensive income:
Items that will not be reclassified to profit or loss - - -
- - -
Items that may be reclassified to profit or loss
Currency translation differences (7,699) 165 (7,534)
Change in fair value of cash flow hedging 138 - 138
Change in fair value of hedging instruments on foreign operations 755 - 755
Change in fair value of available-for-sale financial assets 10 - 10
Related tax 20 (31) (11)
(6,776) 134 (6,642)
Other comprehensive income, net of income taxes (6,776) 134 (6,642)
Total comprehensive income 249,008 134 249,142
Attributable to:
Non-controlling interests 19,127 - 19,127
Jerónimo Martins Shareholders 229,881 134 230,015
Total comprehensive income 249,008 134 249,142
R&A - First Nine Months 2015
Notes to the Consolidated Financial Statements
15
CONSOLIDATED STATEMENT OF CHANGES IN SHAREHOLDERS’ EQUITY
Shareholders’ equity attributable to Shareholders of Jerónimo Martins, SGPS, S.A.
Share capital
Share premium
Own shares
Fair value and other reserves
Retained earnings
Total
Non-
controlling interests
Shareholders’ equity
Land
revaluation
Cash flow
hedge
Available-for-sale
financial
assets
Adj. in joint
ventures
and
assoc.
Currency
translation
reserves
Balance Sheet as at 1 January 2014 - Published
629,293 22,452 (6,060) 76,230 (2,453) (1,251) 2,897 (48,111) 709,661 1,382,658 266,604 1,649,262
Change of accounting policies - - - (76,230) - - (2,897) - - (79,127) (30,769) (109,896)
Balance Sheet at at 1
January 2014 - Restated 629,293 22,452 (6,060) - (2,453) (1,251) - (48,111) 709,661 1,303,531 235,835 1,539,366
Comprehensive income restated - - - - (386) 1,260 - (6,675) 235,816 230,015 19,127 249,142
Dividends (191,672) (191,672) (15,042) (206,714)
Balance Sheet as at 30
September 2014 - Restated 629,293 22,452 (6,060) - (2,839) 9 - (54,786) 753,805 1,341,874 239,920 1,581,794
2.4 Transactions in foreign currencies
Transactions in foreign currencies are translated into euros at the exchange rate prevailing on the transaction date.
On the balance sheet date, monetary assets and liabilities expressed in foreign currencies are translated at the exchange rate prevailing on that date and exchange differences arising from this conversion are recognised in the income statement. When qualifying as hedges on investments in foreign subsidiaries the exchange
differences are deferred in equity.
The main exchange rates applied on the balance sheet date are those listed below:
3 Segments reporting
Management monitors the performance of the business based on a geographical and business nature. Due to the fact that the business units in the distribution area in Portugal share a set of competences, the Group analyses,
on a quarterly basis, its segments in an aggregate performance perspective. In addition, the Group also analyses separately the distribution business unit in Poland. Apart from these, there are also other businesses, but due to
their low materiality they are not reported separately.
Business segments:
Portugal Distribution: comprises the business unit of JMR (Pingo Doce supermarkets), and the wholesale business unit Recheio;
Poland Distribution: the business unit using the brand Biedronka;
Others, eliminations and adjustments: includes i) the business units with low materiality (Marketing Services and Representations, Restaurants, Pharmacies and Drugstores in Poland and retail business in Colombia), ii)
the Holding companies and iii) the Group’s consolidation adjustments.
Management evaluates the performance of segments based on the Earnings Before Interest and Taxes (EBIT). This indicator excludes the effects of exceptional operating profits/losses.
Euro foreign exchange reference rates
(foreign exchange units per 1 Euro)
Rate at 30 September
2015
Average rate for the
9 Months
Polish Zloty (PLN) 4.2448 4.1532
Swiss Franc (CHF) 1.0915 -
Colombian Peso (COP) 3,497.5100 2,934.9200

R&A - First Nine Months 2015
Notes to the Consolidated Financial Statements
16
Detailed information by segment at September 2015 and 2014
Portugal Distribution
Poland Distribution
Others, eliminations and adjustments
Total JM Consolidated
2015 2014 2015 2014 2015 2014 2015 2014
Net sales and services 3,143,285 2,998,452 6,836,051 6,191,011 195,252 143,110 10,174,588 9,332,573
Inter-segments 169 104 1,121 1,182 (1,290) (1,286) - -
External customers 3,143,116 2,998,348 6,834,930 6,189,829 196,542 144,396 10,174,588 9,332,573
Operational cash-flow (EBITDA) 168,952 166,813 473,936 433,232 (55,371) (52,577) 587,517 547,468
Depreciations and amortisations (80,163) (81,779) (130,164) (114,640) (10,370) (8,606) (220,697) (205,025)
Operational result (EBIT) 88,789 85,034 343,772 318,592 (65,741) (61,183) 366,820 342,443
Exceptional operating profits/losses (7,448) (1,170)
Financial results (5,097) (11,495)
Income tax (82,523) (73,994)
Net result attributable to JM 252,224 237,066
Total assets (1) 2,074,120 1,986,221 2,769,929 2,826,930 458,150 359,270 5,302,199 5,172,421
Total liabilities (1) 1,518,706 1,440,543 2,054,648 2,100,836 (18,989) (7,649) 3,554,365 3,533,730
Investments in fixed assets 100,241 29,223 144,898 245,855 37,714 25,573 282,853 300,651
(1) The comparable amounts of total assets and liabilities are reported to 31 December 2014.
Reconciliation between EBIT and the operational result of the income statement by functions
September 2015 September 2014
EBIT 366,820 342,443
Exceptional operating profits/losses (7,448) (1,170)
Operational result 359,372 341,273
4 Total margin and operating costs
September 2015 September 2014
Net sales and services 10,174,588 9,332,573
Net cost of products sold (7,979,824) (7,331,903)
Net cash discount and interest paid to suppliers (4,840) (3,549)
Electronic payment commissions (14,853) (12,441)
Other supplementary costs (6,358) (4,853)
Cost of sales (8,005,875) (7,352,746)
Total margin 2,168,713 1,979,827
Supplies and services (374,544) (341,970)
Advertising costs (54,103) (51,314)
Rents (247,516) (225,955)
Staff costs (785,274) (694,571)
Amortization (219,002) (203,328)
Profit/loss with tangible and intangible assets (1,344) (1,676)
Transportation costs (111,443) (111,820)
Other operational profit/loss (8,667) (6,750)
Distribution and administrative costs (1,801,893) (1,637,384)
Legal contingencies (291) -
Losses from organizational restructuring programmes (6,386) (1,146)
Assets write-offs and gains/losses in sale of tangible assets (981) (24)
Others 210 -
Exceptional operating profits/losses (7,448) (1,170)
Operating profit 359,372 341,273
R&A - First Nine Months 2015
Notes to the Consolidated Financial Statements
17
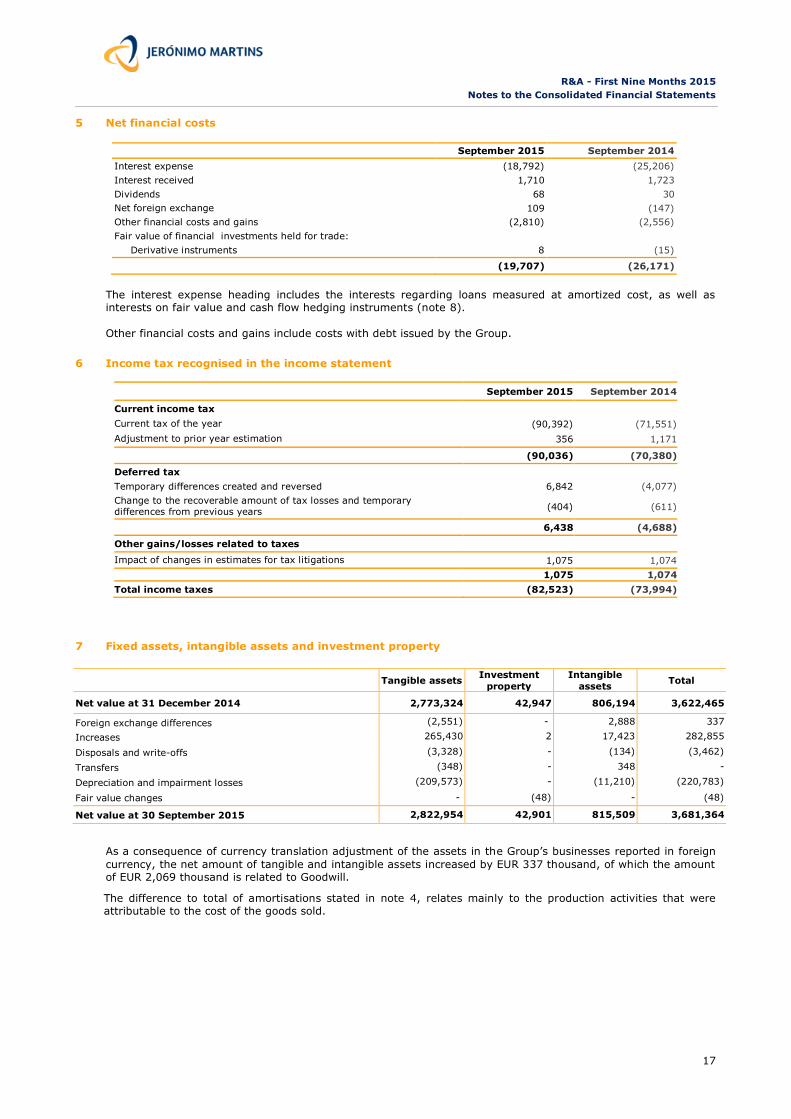
5 Net financial costs
September 2015 September 2014
Interest expense (18,792) (25,206)
Interest received 1,710 1,723
Dividends 68 30
Net foreign exchange 109 (147)
Other financial costs and gains (2,810) (2,556)
Fair value of financial investments held for trade:
Derivative instruments 8 (15)
(19,707) (26,171)
The interest expense heading includes the interests regarding loans measured at amortized cost, as well as interests on fair value and cash flow hedging instruments (note 8).
Other financial costs and gains include costs with debt issued by the Group.
6 Income tax recognised in the income statement
September 2015 September 2014
Current income tax
Current tax of the year (90,392) (71,551)
Adjustment to prior year estimation 356 1,171
(90,036) (70,380)
Deferred tax
Temporary differences created and reversed 6,842 (4,077)
Change to the recoverable amount of tax losses and temporary differences from previous years
(404) (611)
6,438 (4,688)
Other gains/losses related to taxes
Impact of changes in estimates for tax litigations 1,075 1,074
1,075 1,074
Total income taxes (82,523) (73,994)
7 Fixed assets, intangible assets and investment property
Tangible assets
Investment
property
Intangible
assets Total
Net value at 31 December 2014 2,773,324 42,947 806,194 3,622,465
Foreign exchange differences (2,551) - 2,888 337
Increases 265,430 2 17,423 282,855
Disposals and write-offs (3,328) - (134) (3,462)
Transfers (348) - 348 -
Depreciation and impairment losses (209,573) - (11,210) (220,783)
Fair value changes - (48) - (48)
Net value at 30 September 2015 2,822,954 42,901 815,509 3,681,364
As a consequence of currency translation adjustment of the assets in the Group’s businesses reported in foreign
currency, the net amount of tangible and intangible assets increased by EUR 337 thousand, of which the amount of EUR 2,069 thousand is related to Goodwill.
The difference to total of amortisations stated in note 4, relates mainly to the production activities that were
attributable to the cost of the goods sold.

R&A - First Nine Months 2015
Notes to the Consolidated Financial Statements
18
8 Derivative financial instruments
Notional
September 2015 Notional
December 2014
Assets Liabilities Assets Liabilities
Current Non-
current Current
Non-
current Current
Non-
current Current
Non-
current
Derivatives held for trading
Currency forwards (PLN) 5 million PLN 8 - - - - - - -
Cash flow hedging derivatives
Interest rate swap (EUR) 225 million
EUR - - 994 -
225 million EUR
- - 1,715 -
Interest rate swap (PLN) 500 million
PLN - - 1,566 -
500 million
PLN - - - 2,681
Foreign operation investments hedging derivatives
Currency forwards (PLN) 50 million PLN 65 - - - 600 million
PLN 2,627 - - -
Total derivatives held for trading 8 - - - - - - -
Total hedging derivatives 65 - 2,560 - 2,627 - 1,715 2,681
Total assets/liabilities derivatives 73 - 2,560 - 2,627 - 1,715 2,681
At September 2015 the values shown include interest receivable or payable related with these financial instruments that are due. The net payable amount is EUR 1,104 thousand (December 2014: payable EUR 423).
9 Investments in joint ventures and associates
During the first nine months of 2015, the movement under this heading was as follows:
Joint ventures Associates Total
September 2015
December 2014
September 2015
December 2014
September 2015
December 2014
Opening balance 73,537 77,639 735 895 74,272 78,534
Equity method:
Net result 14,586 14,973 24 208 14,610 15,181
Dividends and other income received (11,350) (19,159) - (368) (11,350) (19,527)
Other comprehensive income - 84 - - - 84
Closing balance 76,773 73,537 759 735 77,532 74,272
10 Trade debtors, accrued income and deferred costs
September 2015 December 2014
Non-current
Other debtors 80,378 79,131
Collateral deposits associated to financial debt 34,367 19,367
Deferred costs 3,358 3,614
118,103 102,112
Current
Commercial customers 57,303 50,868
Other debtors 89,209 97,649
Other taxes receivable 8,132 16,011
Accrued income and deferred costs 115,201 148,935
269,845 313,463
Non-current debtors are mainly related to additional tax liquidation as well as pre-paid tax, which the Group has
already contested and made a legal claim for reimbursement.
The debtor’s amount is registered at the recoverable value. The Group constitutes provisions for impairment
losses whenever there are signs of uncollectable amounts.

R&A - First Nine Months 2015
Notes to the Consolidated Financial Statements
19
11 Cash and cash equivalents
September 2015 December 2014
Bank deposits 200,286 171,790
Short-term investments 284,071 255,043
Cash and cash equivalents 3,570 3,827
487,927 430,660
12 Cash generated from operations
September 2015 September 2014
Net results 252,224 237,066
Adjustments for:
Non-controlling interests 19,528 18,718
Income tax 82,523 73,994
Depreciations and amortisations 220,697 205,025
Provisions and other operational gains and losses 6,709 1,924
Net financial costs 19,707 26,171
Profit/ Losses in associated companies (14,610) (14,676)
Profit/ Losses on tangible and intangible assets 2,122 1,706
588,900 549,928
Changes in working capital:
Inventories (36,565) 28,589
Trade debtors, accrued income and deferred costs (8,695) (7,607)
Trade creditors, accrued costs and deferred income 88,253 (22,569)
631,893 548,341
13 Dividends
Dividends distributed in 2015 in the amount of EUR 168,999 thousand, include an amount of EUR 153,966
thousand paid to JMH Shareholders, and an amount of EUR 15,033 thousand paid to non-controlling interests in the Group companies.
14 Basic and diluted earnings per share
September 2015 September 2014
Ordinary shares issued at the beginning of the year 629,293,220 629,293,220
Own shares at the beginning of the year (859,000) (859,000)
Shares issued during the year - -
Weighted average number of ordinary shares 628,434,220 628,434,220
Diluted net result attributable to ordinary shares 252,224 237,066
Basic and diluted earnings per share – euros 0.4014 0.3772
15 Borrowings
JM Nieruchomosci - Sp. Komandytowo-akcyjna contracted a loan on a total amount of PLN 415.000 thousand
with maturity in 2020.
Renewal of the Commercial Paper Programme held by JMH and Recheio, SGPS until August 2020 with
improvement of the financial conditions associated.
Jeronimo Martins Polska negotiated a new credit facility in a total amount of PLN 300.000 thousand for one year,
renewable until 2020.
Early redemption of the loan held by Jeronimo Martins Polska that would end in 2017, in a total amount of PLN 150.000 thousand.
Jeronimo Martins Colombia issued new short term credit facilities in a total amount of COP 56.000.000 thousand and renewed other existing short term facility of COP 60.000.000 thousand for one more year.

R&A - First Nine Months 2015
Notes to the Consolidated Financial Statements
20
15.1 Current and non-current loans
September 2015 December 2014
Non-current loans
Bank loans 286,425 373,651
Financial lease liabilities 123 226
286,548 373,877
Current loans
Bank overdrafts 16,348 58,327
Bank loans 161,435 56,544
Bond loans 225,000 225,000
Financial lease liabilities 144 1,054
402,927 340,925
15.2 Financial debt
The Group entered into several foreign exchange rate risk and interest risk hedging operations, as well as short-term investments. The net consolidated financial debt at the balance sheet date is as follows:
September 2015 December 2014
Non-current loans (note 15.1) 286,548 373,877
Current loans (note 15.1) 402,927 340,925
Derivative financial instruments (note 8) 2,487 1,769
Interest on accruals and deferrals 2,922 2,622
Bank deposits (note 11) (200,286) (171,790)
Short-term investments (note 11) (284,071) (255,043)
Collateral deposits (34,367) (19,367)
176,160 272,993
16 Provisions and employee benefits
Risks and
contingencies
Employee
benefits
Balance at 1 January 81,828 42,460
Set up, reinforced and transfers 3,301 2,372
Unused and reversed (2,446) -
Foreign exchange difference (15) -
Used (3,225) (2,173)
Balance at 30 September 79,443 42,659
17 Trade creditors, accrued costs and deferred income
September 2015 December 2014
Non-current
Other non-commercial creditors 1 -
Accrued costs and deferred income 818 836
819 836
Current
Other commercial creditors 2,189,044 2,182,406
Other non-commercial creditors 164,426 175,726
Other taxes payables 81,748 79,456
Accrued costs and deferred income 224,511 178,416
2,659,729 2,616,004
18 Contingencies
Following the contingencies mentioned in the 2014 Annual Report, changes occurred on the headings as follows:
f) The Portuguese Tax Authorities carried out some corrections of VAT rates applied to certain goods sold by
some Group companies. With these corrections the total amount of assessments for the years 2005 to 2012 in Pingo Doce, Feira Nova and Recheio amounted to EUR 1,814 thousand, EUR 1,300 thousand and EUR 551

R&A - First Nine Months 2015
Notes to the Consolidated Financial Statements
21
thousand, respectively. The Board of Directors believes that the Tax Authorities have no grounds to request this payment and these assessments have been challenged;
i) Sociedade Ponto Verde (SPV) claimed through a judicial proceeding against Pingo Doce, in September 2014,
an amount of EUR 3,397 thousand (including outstanding interest), related to the Management of the secondary and tertiary packaging waste system. Pingo Doce contested considering that SPV does not
manage that kind of waste and therefore no amount is due. The Civil Court, having the same understanding of Pingo Doce, declared itself materially incompetent to decide the case, saying that it should be judged by
the administrative courts. SPV filed an appeal to the Court of Appeal. The Court of Appeal ruled in favor of SPV and the case returned to the Civil Court, where the procedure stands by;
j) The Food and Veterinary Department (Direcção-Geral de Alimentação e Veterinária) claimed from Pingo
Doce the amount of EUR 8.654 thousand, in respect of the Food Safety Tax (Taxa de Segurança Alimentar Mais – TSAM) assessed for the years 2012 to 2015. The values at stake have been challenged in Court by
Pingo Doce, since it understands that this tax is not due, namely on the grounds of the unconstitutional nature of the Statute that approved the TSAM.
19 Related parties
Sociedade Francisco Manuel dos Santos owns 56.14% of the Group. No transactions occurred between this Company and any company of the Group in the first nine months of 2015, neither were there any amounts payable or receivable between them on September 30th, 2015.
Balances and transactions of Group companies with related parties are as follows:
Sales and services rendered Stocks purchased and services supplied
September 2015 September 2014 September 2015 September 2014
Joint ventures 46 346 75,055 69,658
Associates - - - 9
Other related parties (*) 69 73 89 191
Trade debtors, accrued income and
deferred costs Trade creditors, accrued costs and
deferred income
September 2015 December 2014 September 2015 December 2014
Joint ventures 263 640 17,741 5,774
Associates - - - -
Other related parties (*) 34 17 - -
(*) Entities controlled by the major Shareholder of Jerónimo Martins and entities owned or controlled by members of the Board
of Directors.
All the transactions with these related parties were made under normal market conditions, i.e. the transaction
value corresponds to prices that would be applicable between non-related parties.
Outstanding balances between Group companies and related parties, being a result of a trade agreement, are
settled in cash, and are subject to the same payment terms as those applicable to other agreements celebrated between Group companies and their suppliers.
The amounts receivable are not covered by insurance and no guarantees are given or received, as the Group holds a relevant influence over these companies.
There are no adjustments for doubtful debts and no costs were recognised during the year related with bad or doubtful debts with these related parties.
20 Events after the balance sheet date
At the conclusion of this Report there were no relevant events to highlight that are not disclosed in the Financial Statements.
Lisbon, 4th November, 2015
The Certified Accountant The Board of Directors