Embed Size (px)
Citation preview

Constraining Surface Deformation Predictions Resulting from Coal Seam Gas ExtractionGEOSCIENCE AUSTRALIARECORD 2014/44
N. J. Brown1, A. W. Woods2, J. A. Neufeld2, C. Richardson2
1. Geoscience Australia2. BP Institute, University of Cambridge, Bullard Laboratories, Madingley Rd, Cambridge, United Kingdom, CB30EZ.

Department of IndustryMinister for Industry: The Hon Ian Macfarlane MPParliamentary Secretary: The Hon Bob Baldwin MPSecretary: Ms Glenys Beauchamp PSM
Geoscience AustraliaChief Executive Officer: Dr Chris PigramThis paper is published with the permission of the CEO, Geoscience Australia
© Commonwealth of Australia (Geoscience Australia) 2014
With the exception of the Commonwealth Coat of Arms and where otherwise noted, all material in this publication is provided under a Creative Commons Attribution 3.0 Australia Licence. (http://www.creativecommons.org/licenses/by/3.0/au/deed.en)
Geoscience Australia has tried to make the information in this product as accurate as possible. However, it does not guarantee that the information is totally accurate or complete. Therefore, you should not solely rely on this information when making a commercial decision.
Geoscience Australia is committed to providing web accessible content wherever possible. If you are having difficulties with accessing this document please email [email protected].
ISSN 2201-702X (PDF)
ISBN 978-1-925124-34-7 (PDF)
GeoCat 75663
Bibliographic reference: Brown, N. J., Woods, A.W., Neufeld, J. A., Richardson, C. 2014. Constraining Surface Deformation Predictions Resulting from Coal Seam Gas Extraction. Record 2014/14. Geoscience Australia, Canberra. http://dx.doi.org/10.11636/Record.2014.044

Contents
Executive Summary................................................................................................................................ 1
1 Introduction.......................................................................................................................................... 31.1 Background.................................................................................................................................... 31.2 Coal Seam Gas.............................................................................................................................. 31.3 Predicting surface deformation.......................................................................................................41.4 Monitoring and inversion................................................................................................................4
2 Surface Deformation Theory................................................................................................................52.1 Introduction.................................................................................................................................... 52.2 Linear theory of poroelasticity........................................................................................................52.3 Assumptions and rationale of poroelastic theory............................................................................52.4 Reservoir deformation.................................................................................................................... 6
2.4.1 Linear stress – strain relations..................................................................................................72.4.2 Uniaxial reservoir compaction...................................................................................................8
2.5 Surface deformation....................................................................................................................... 92.5.1 Geerstma’s nucleus of strain model..........................................................................................92.5.2 Effect of the free surface.........................................................................................................102.5.3 Depth to Radius ratio..............................................................................................................11
2.6 Summary...................................................................................................................................... 12
3 Predicting Surface Deformation.........................................................................................................133.1 Model comparison........................................................................................................................13
3.1.1 Iona pressure changes...........................................................................................................133.1.2 Iona gas storage field and modelling data..............................................................................143.1.3 3D geomechanical model results............................................................................................143.1.4 SURDEF results.....................................................................................................................153.1.5 Comparing the 3D geomechanical and SURDEF results.......................................................15
3.2 Surat Basin analysis.....................................................................................................................163.2.1 Surat Basin stratigraphy.........................................................................................................163.2.2 Drawdown predictions............................................................................................................173.2.3 Cumulative surface deformation.............................................................................................18
3.3 Parameter sensitivity analysis......................................................................................................28
4 Monitoring and Inversion................................................................................................................... 314.1 Surat Basin monitoring................................................................................................................. 314.2 Inverting monitoring data to constrain reservoir parameters........................................................33
5 Conclusions....................................................................................................................................... 34
6 Acknowledgements............................................................................................................................ 35
7 References........................................................................................................................................ 36
Constraining Surface Deformation Predictions Resulting from Coal Seam Gas Extraction

Constraining Surface Deformation Predictions Resulting from Coal Seam Gas Extraction

Executive Summary
This Record describes techniques which can be used to predict surface deformation caused by natural or anthropogenic subsurface fluid changes. Using predictive (forward) models, simulations have been developed to estimate the range of potential surface deformation caused by the Coal Seam Gas (CSG) extraction operations in the Surat Basin.
The objectives of this research were to:
Develop a predictive model that enables Geoscience Australia to estimate the magnitude and areal extent of surface deformation caused by natural or anthropogenic fluid activities.
Report the capability, accuracy and limitations of the predictive model.
Apply the predictive model to Coal Seam Gas operations in the Surat Basin, Queensland.
Describe the monitoring techniques capable of measuring subsurface fluid changes.
Discuss how geodetic data can be used to constrain the poroelastic properties of reservoirs.
We developed software called SURDEF, based on the equations of Geertsma and Van Opstal (1973), to predict surface deformation in Australia. SURDEF is an analytical treatment of the subsidence – compaction relationship in homogeneous rock which can be used to determine the displacement field outside a compacting reservoir. Analytical predictive models such as SURDEF are based on the assumption that pressure change only occurs within a porous elastic reservoir. Although the reservoir may only account for a small fraction of the subsurface, surface deformation predictions can often be made based on the expansion or contraction of this zone. In complex geological scenarios (e.g. subsurface containing faults) numerical modelling techniques may be required; however, in some cases, surface deformation predictions using analytical modelling should provide comparable results and offer significant savings in time, cost and computational requirements.
Simulation of the CSG operations of the Surat Basin, Queensland, revealed the possibility of surface deformation due to the cumulative impact of multiple operators extracting groundwater within close proximity. Our hypothesis is that the combined influence of drawdown from adjoining leases could cause about a decimetre of subsidence, with the result being dependent on the poroelastic properties of the reservoir, depth of the coal seam, extraction rate and dimensions of the impacted area.
The results of the forward modelling simulations have also shown to be useful to develop a monitoring plan to measure deformation before, during and after the operational period. In the case of CSG operations, graphical depictions of the cumulative impact of surface deformation can be used to identify optimal locations for monitoring. Furthermore, geodetic observations can be used in an inversion model to monitor changes in pressure within CSG formations and constrain geological properties of the reservoir.
The major findings of the Record are:
Comparisons with a numerical model suggest that analytical forward models can be used to predict the order of magnitude of surface deformation when the assumptions of homogenous subsurface stratigraphy and poroelastic equations allow it.
Constraining Surface Deformation Predictions Resulting from Coal Seam Gas Extraction 1

Predictions can assist in the process of designing monitoring networks to measure and monitor the Earth’s response to natural or anthropogenic fluid activities.
Geodetic data collected by monitoring networks could be used in an inversion to reveal information about the poroelastic properties of reservoirs and possibly improve future surface deformation predictions.
2 Constraining Surface Deformation Predictions Resulting from Coal Seam Gas Extraction

1 Introduction
1.1 BackgroundSurface deformation is induced by myriad natural and anthropogenic causes including earthquakes (Dawson et al., 2008), groundwater extraction (Gambolati et al., 1991) and oil and gas production (Castle et al., 1969). This Record describes a method to predict surface deformation induced by the contraction of reservoirs associated with Coal Seam Gas (CSG) extraction. The application to CSG extraction is in response to the recommendations of Geoscience Australia and Habermehl (2010) who reported the need for more analysis of the cumulative impact of multiple CSG operators working in close proximity.
It is hoped that this work will underpin the development of additional geoscience capabilities by providing:
Surface deformation predictions which will allow Geoscience Australia to identify potential impacts to our National Geospatial Reference System.
Capacity within Geoscience Australia to perform forward and inverse modelling to better understand resource extraction practices in Australia.
Quantifiable estimates of deformation caused by fluid extraction.
Technical advice to Government on the impacts of anthropogenic and natural fluid changes.
1.2 Coal Seam Gas
Coal Seam Gas is a natural gas (predominantly methane) extracted from relatively shallow coal beds which are often uncommercial. It is an ‘unconventional’ gas as opposed to the ‘conventional’ resources commonly found offshore in many parts of Australia. Australia has significant CSG resources in the coal basins of Queensland and New South Wales equal to more than 100 years of CSG production at current rates, with Queensland’s Surat and Bowen Basins containing 95% of the known reserves (GA and ABARE, 2010).
Under natural conditions, the gas within the coal is adsorbed (adhesion on the surface of the coal) into the coal matrix and is held in place by the pressure of formation water (CSIRO, 2012). In order to release the gas, the pressure in the formation needs to be decreased by removing water from the coal seam. In the early stages of production the volume of produced water is relatively high compared to the release of gas, however, this decreases as gas production increases. Once sufficient groundwater has been removed the methane desorbs from the coal and begins to migrate to the surface.
Coal Seam Gas extraction has the potential to cause a range of physical and chemical changes to reservoirs and the surrounding geology. It requires the skills from a multi-disciplinary team to fully understand the geology, geophysics, geochemistry and potential impacts of operations in a specific region. For the purposes of this study we are limited to assessing one of these impacts; the surface deformation associated with CSG extraction.
Constraining Surface Deformation Predictions Resulting from Coal Seam Gas Extraction 3
1.3 Predicting surface deformationAnthropogenic activities such as CSG extraction involve altering the pressure and stress conditions within the Earth’s subsurface. Based on the geomechanical and geological properties of a reservoir, and expected pressure changes, it is possible to predict subsurface reservoir deformation and the surface expression of this deformation. Forward modelling predictions can help quantify the potential impact to infrastructure and the environment associated with these operations.
In Section 2, a predictive modelling technique is described based on the theory of poroelasticity that enables Geoscience Australia to estimate the magnitude and extent of surface deformation caused by natural or anthropogenic fluid activities. We include a description of the capability, accuracy and limitations of the predictive model. In Section 3, the theory is applied in the form of a predictive model, to CSG simulations in the Surat Basin, Queensland. By comparing the results of regional simulations (multiple operators working in close proximity) to site simulations (a single operator working in isolation) we attempt to quantify the impact of cumulative CSG operations and highlight the variability in results caused by site-specific parameters.
1.4 Monitoring and inversion
Recent studies have shown that the effect of subsurface fluid changes can be detected on the surface using geodetic techniques (e.g. Vasco et al., 2010) and used to better understand the geomechanics and properties of the subsurface (e.g. Vasco et al., 2008). Furthermore, observations of the magnitude and extent of deformation can be used to help design monitoring networks to observe deformation throughout, and beyond, the operation life cycle.
Geodetic monitoring techniques have the capacity to complement other monitoring data sources and can potentially be used to help quantify surface deformation over CSG operation areas, providing new insights into groundwater and CSG withdrawal processes. Furthermore, when used in an inversion, the geodetic observations can be used to help constrain the geophysical parameters of the reservoir (e.g. Sambridge, 1999). Although this inversion process does not negate the need for traditional subsurface exploration techniques such as seismic monitoring, it could complement them by providing more cost-effective and higher temporal resolution data.
Section 4 provides a description of the geophysical and geodetic monitoring techniques capable of measuring subsurface fluid changes and a sample monitoring plan which could be applied to the Surat Basin. Finally, it provides a description of how geodetic data can be used in an inversion to find the ensemble of acceptable models and appraise the variety of compatible solutions to make inferences about the poroelastic properties of the CSG formations of the Surat Basin.
4 Constraining Surface Deformation Predictions Resulting from Coal Seam Gas Extraction

2 Surface Deformation Theory
2.1 IntroductionSurface deformation can be caused by the compaction or expansion of subsurface reservoirs. In the case of Coal Seam Gas (CSG) extraction, surface deformation can be induced by pore-pressure decline in fluid-filled rocks. The magnitude and extent of surface deformation is largely dependent on the magnitude of pore-pressure change, the geological properties of the reservoir rocks and their response to stress. This process can be modelled using the linear theory of poroelasticity, an adaptation of the linear theory of elasticity.
2.2 Linear theory of poroelasticity
The way rocks behave including their elastic response and their failure stresses depend, to a large extent, on the non-solid part of the materials (Fjær et al., 2008), that is, the void, or porous, space in rock. The linear theory of poroelasticity describes the coupled interaction of the fluid which fills that pore space (interstitial fluid) and porous rock based on linear relationships between applied stresses and strains.
The theory of poroelasticity is applicable to many geomechanical processes including: soil consolidation (Terzaghi, 1925), tensile failure induced by pressurisation of boreholes (e.g. Rice and Cleary, 1976), hydraulic fracturing (e.g. Ruina, 1978), and, as we discuss, subsidence due to fluid withdrawal (e.g. Verruijt, 1969). Although it was Terzaghi (1925) who was first to account for this coupled diffusion-deformation interaction with an application to one-dimensional soil consolidation, it was Biot (1941) who developed the first linear theory of poroelasticity that is consistent with the two mechanisms which play a key role in the interaction between interstitial fluid and porous rock:
an increase of pore-pressure induces a dilation of the rock, and
compression of the rock causing a rise of pore-pressure if fluid is prevented from escaping the pore network (Detournay and Cheng, 1993).
2.3 Assumptions and rationale of poroelastic theoryThe linear theory of poroelasticity makes a number of assumptions (Biot, 1941):
1. Isotropy of the material
2. Reversibility of the stress-strain relations under final equilibrium conditions
3. Linearity of stress-strain relations
4. Small strains
5. Fluid in the pores is incompressible
6. Fluid may contain air bubbles
7. Fluid flows through the porous skeleton according to Darcy’s law
Constraining Surface Deformation Predictions Resulting from Coal Seam Gas Extraction 5

As Biot (1941) describes, assumptions 2 and 3 are generally the subject of the greatest criticism. However, in suitable conditions, analytical and semi-analytical models can provide satisfactory results for science and engineering applications (e.g. Terzaghi, 1925: Verruijt, 1969; Ruina, 1978; Ketelaar, 2009, Rutqvist et al., 2010).
In a study undertaken in the Netherlands, both an analytical approach of the poroelastic theory from Geertsma (1973) and a numerical technique were applied to predict subsidence due to hydrocarbon production. The results were shown to be comparable in many cases. For this reason, analytical techniques based on the poroelastic theory are used to predict deformation for the majority of their gas fields (Ketelaar, 2009).
The assumptions of the poroelastic theory are not however valid in all situations. For example, in the case of the Netherlands gas fields, numerical modelling is required for the Ameland reservoir which is located below a complicated salt structure which behaviour cannot be modelled using the analytical method (Ketelaar, 2009).
This highlights that, where possible, a thorough understanding of: the geological structure, geological properties, the distribution of stress within the stratigraphy, the influence of the groundwater etc. is required to perform an accurate assessment of potential deformation. However, in situations where limited data are available, or the data indicate that the study area conforms to the assumptions of the poroelastic theory; analytical models can provide a relatively simple method to predict reservoir or surface deformation.
2.4 Reservoir deformationThe change in pressure within a reservoir caused by fluid withdrawal or injection changes the amount of stress placed on the solid framework of the reservoir. If we take the example of CSG extraction, fluid withdrawal reduces the pore-pressure, p, of the reservoir. The pore-pressure decline causes the reservoir pressure to be lower than the surrounding geological units. This leads to a strain mismatch, with the reservoir rocks compacting more than the surroundings (Segall, 1992). This causes an increase in the effective stress (stress on the solid framework), σ ', where, σ , represents the total stress
σ '=σ−αp (2.01)
and α is the Biot coefficient, or poroelastic coefficient, which can be roughly described as an increasing measure of porosity (0≤α≤1). The poroelastic coefficient can be approximated by
α=1−(1−φ )m(φ) (2.02)
where
m(φ)= 3(1−φ )
(2.03)
6 Constraining Surface Deformation Predictions Resulting from Coal Seam Gas Extraction

and φ is the porosity of the reservoir rock. This concept can be used to compute the compaction of a reservoir assuming linear poroelasticity and a homogeneous reservoir of isotropic rock (Fjær et al., 2008). Before describing the compaction process, we first describe how the linear theory of poroelasticity can be used to compute stress and strain.
2.4.1 Linear stress – strain relations
Most rocks behave non-linearly when subjected to large stresses; however, their behaviour can normally be described by linear relations for sufficiently small changes in stress (Fjær et al., 2008). In accordance with Hooke’s law, if a rock sample behaves linearly, there is a linear relationship between stress (in z-direction), σ z, and strain (in the z-direction), ε z, and can be written as
ε z=1Eσ z (2.04)
The normal stress applied in the z-direction causes strain based on the Young’s modulus (a measure of stiffness), E, of the rock sample. Young’s modulus is one of the elastic moduli used to describe the elastic, and poroelastic, properties of the reservoir.
Another of the elastic moduli is Poisson’s ratio, v, which is a measure of the lateral expansion of the rock sample relative to longitudinal contraction (Fjær et al., 2008)
v=−ε yε x
(2.05)
In three dimensions, the normal stresses applied in two directions (e.g. y and z-directions) contribute to the strain in the third direction (e.g. x-direction). The general relations between stress and strain can be written as
ε x=σ x
E− vE (σ y+σ z ) (2.06)
ε y=σ y
E− v
E (σx+σ z ) (2.07)
ε z=σz
E− vE (σ x+σ y ) (2.08)
γ yz=σ yz
G(2.09)
γ xz=σ xz
G(2.10)
Constraining Surface Deformation Predictions Resulting from Coal Seam Gas Extraction 7

γ xy=σ xy
G(2.11)
where, G, is the shear modulus, a measure of the rock sample resistance against shear deformation (Fjær et al., 2008) and, γ, represents the shear strain components. These stress-strain relations (2.06-2.11) are the fundamental equations for the description of isotropic, linear elastic materials (Fjær et al., 2008).
2.4.2 Uniaxial reservoir compaction
The deformation within a reservoir can be expressed by Hooke’s law by transposing Equations (2.06 – 2.08), replacing the stress terms with effective stress terms and using the initial stress state (i.e. start of production) as reference for the strains (Fjær et al., 2008).
Eεx=∆σ ' x−v (∆σ ' y+∆σ ' z ) (2.12)
Eε y=∆σ ' y−v (∆σ ' x+∆σ ' z ) (2.13)
Eεz=∆σ ' z−v (∆ σ ' y+∆σ ' x ) (2.14)
The compaction of the reservoir, ∆T , of thickness, T , caused by vertical strain, ε z, can be described by
∆T=−ε zT (2.15)
Compaction of the reservoir is therefore a value of negative ∆T .
According to Fjær et al. (2008), two assumptions are commonly made to compute compaction:
Uniaxial Compaction – lateral strain is neglected because the lateral extent of the reservoir is much larger than the thickness. As a result the reservoir is assumed to only compact vertically.
ε x=ε y=0 (2.16)
In order to maintain uniaxial vertical compaction during reservoir depletion, the effective horizontal stresses must increase. By inserting Equation (2.16) into Equation (2.12) and (2.13), it is shown
∆ σ 'x=∆σ '
y=v
(1−v )∆σ '
z (2.17)
Constant Stress – the total vertical stress acting on the reservoir remains constant (∆ σz=0) during production. As a result, the total weight of the overburden is felt by the reservoir at all times as the pore-pressure is reduced. Thus, shielding of the stress by the overburden is
8 Constraining Surface Deformation Predictions Resulting from Coal Seam Gas Extraction

neglected. With reference to Equation (2.01), if the change in total vertical stress is zero, the change in effective stress on the rock framework is directly proportional to the change in pore-pressure, i.e.
∆ σ 'z=∆σ z−α ∆ p=−α ∆ p (2.18)
When these conditions are inserted for all three principal stress changes into Equation (2.14), the compaction formula from Fjær et al. (2008) becomes
∆TT
= 1E
(1+v ) (1−2v )1−v
α ∆ p=Cmα∆ p (2.19)
where
Cm=1E
(1+v ) (1−2v )1−v
=(1−2v)2G(1−v )
(2.20)
The uniaxial compaction coefficient, Cm, can be estimated via Equation (2.20). Alternatively, Cm can be measured from rock core samples (Teeuw, 1973) or from radio-active bullets shot into observation wells of the reservoir (Nagel, 2001).
With reference to Equation (2.19), there are three influences on reservoir compaction. Geertsma (1973) describe these as: (1) reduction of reservoir pressure, (2) vertical extent of the zone in which pore-pressure reduction takes place, and (3) poroelastic properties of the reservoir rock.
The reservoir properties can be inherently difficult to obtain given the mechanical properties and pore-pressure distribution is not uniform throughout the reservoir. For this reason, it is useful to perform a parameter sensitivity analysis to constrain the range of potential reservoir compaction instead of relying on a single solution.
2.5 Surface deformationDeformation from the compacting reservoir propagates through the overburden and can cause surface deformation. One method of computing surface deformation is Geerstma’s nucleus of strain model in the half space (Geertsma, 1973; Geerstma and Van Opstal, 1973). The idea from Geerstma is that pressure change occurs within many small spheres in the reservoir. Surface deformation can be computed by adding the influence of these depleting spheres. Given that Geertsma’s models are linear and the entire subsurface is assumed to be isotropic, superposition is allowable.
2.5.1 Geerstma’s nucleus of strain model
The radial displacement at some distance,r, from the centre of a depleting sphere (of radius R0) is described by Fjær et al. (2008) as
Constraining Surface Deformation Predictions Resulting from Coal Seam Gas Extraction 9

u (r )=u0R02
r2(2.21)
where, u0, is the radial displacement at the surface of the depleting sphere.
If we assume that the radial displacement of the depleting sphere is induced by pore-pressure decline, the volume change can be described as
∆V=−4 π R02u0 (2.22)
When the change in volume (Equation 2.22) is combined with the uniaxial compaction coefficient (Equation 2.20) and volumetric strain (Equation 2.23), where volumetric strain, ε vol, equals the divergence of u⃗
ε vol=∇ ∙u⃗=−dVV
(2.23)
the radial displacement at the surface of the depleting sphere can be written as
u0=−CmVα ∆ p4 π R0
2 (2.24)
Fjær et al. (2008) show the radial displacement at some distance, r , from the centre of a depleting sphere is
u (r )=−Cm
4 πVα ∆ p 1
r2(2.25)
As shown in Equation (2.25), the magnitude of the displacement field is governed by the product, Vα ∆ p. As a consequence, this model predicts the same displacement field outside R0 for a sphere of half the volume if the ∆ p is doubled (Fjær et al., 2008).
2.5.2 Effect of the free surface
Equation (2.25) provides a method to compute displacement at some point outside R0, however, it does not account for a free surface at which the vertical stress must be zero (Fjær et al., 2008). Geertsma (1973) solved this using known solutions from the theory of thermoelasticity (Mindlin and Cheng, 1950a, 1950b) to provide the corrected expressions for vertical and horizontal surface displacement due to a nucleus of strain of small but finite volume, V , caused by pore-pressure change, ∆ p1
1 Note: Geertsma (1973), and Geertma and Van Opstal (1973) assume α is part of Cm while Fjær et al. (2008) maintains α as a separate term. Given equations are interchanged in this Section; the terminology from Fjær et al. (2008) has been used.
10 Constraining Surface Deformation Predictions Resulting from Coal Seam Gas Extraction

U z (r ,0 )=−1π
Cmα (1−v ) D
(r2+D2 )32
∆ pV (2.26)
U r (r ,0 )=1πCmα(1−v ) r
(r 2+D2 )32
∆ pV (2.27)
where, D, is the depth of the nucleus of strain, and, r , is the radial distance from vertical axis through the nucleus. As Fjær et al. (2008) describe, a comparison of Equation (2.25) with Equations (2.26) and (2.27) reveal that a consequence of introducing the free surface is that it typically enhances displacement by a factor of three.
Geertsma and Van Opstal (1973) provided equations which can be used to compute surface deformation above a reservoir of any geometric shape. Equations (2.28 – 2.30) are volume integrals of the nucleus solution of block-sized reservoir elements of dimension, ιxn , ι yn , ιzn
U x ( x , y ,0 )=Cmα(1−v )
π ∑n=1
N
∆ pn(x−ξn )ι xnι yn ιzn
{(x−ξn )2+( y−ηn )2+(D n)2}32
(2.28)
U y ( x , y ,0 )=Cmα (1−v )
π ∑n=1
N
∆ pn( y−ηn ) ιxn ι yn ιzn
{(x−ξn )2+( y−ηn )2+(Dn )2}32
(2.29)
U z (x , y ,0 )=−Cmα (1−v)
π ∑n=1
N
∆ pn
Dnι xnι yn ιzn
{ (x−ξn )2+( y−ηn )2+(Dn )2}32
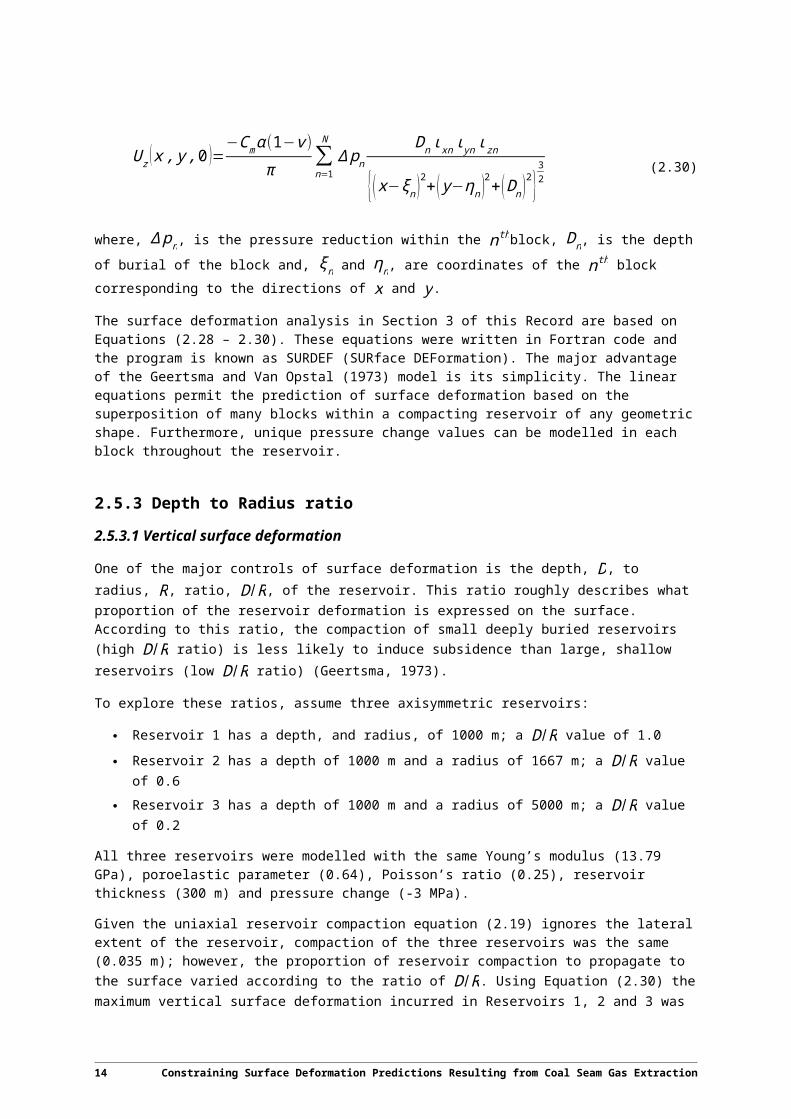
(2.30)
where, ∆ pn, is the pressure reduction within the nthblock, Dn, is the depth of burial of the block and, ξn and ηn, are coordinates of the nth block corresponding to the directions of x and y.
The surface deformation analysis in Section 3 of this Record are based on Equations (2.28 – 2.30). These equations were written in Fortran code and the program is known as SURDEF (SURface DEFormation). The major advantage of the Geertsma and Van Opstal (1973) model is its simplicity. The linear equations permit the prediction of surface deformation based on the superposition of many blocks within a compacting reservoir of any geometric shape. Furthermore, unique pressure change values can be modelled in each block throughout the reservoir.
2.5.3 Depth to Radius ratio
2.5.3.1 Vertical surface deformation
One of the major controls of surface deformation is the depth, D, to radius, R, ratio, D /R, of the reservoir. This ratio roughly describes what proportion of the reservoir deformation is expressed on the
Constraining Surface Deformation Predictions Resulting from Coal Seam Gas Extraction 11

surface. According to this ratio, the compaction of small deeply buried reservoirs (high D /R ratio) is less likely to induce subsidence than large, shallow reservoirs (low D /R ratio) (Geertsma, 1973).
To explore these ratios, assume three axisymmetric reservoirs:
Reservoir 1 has a depth, and radius, of 1000 m; a D /R value of 1.0
Reservoir 2 has a depth of 1000 m and a radius of 1667 m; a D /R value of 0.6
Reservoir 3 has a depth of 1000 m and a radius of 5000 m; a D /R value of 0.2
All three reservoirs were modelled with the same Young’s modulus (13.79 GPa), poroelastic parameter (0.64), Poisson’s ratio (0.25), reservoir thickness (300 m) and pressure change (-3 MPa).
Given the uniaxial reservoir compaction equation (2.19) ignores the lateral extent of the reservoir, compaction of the three reservoirs was the same (0.035 m); however, the proportion of reservoir compaction to propagate to the surface varied according to the ratio of D /R. Using Equation (2.30) the maximum vertical surface deformation incurred in Reservoirs 1, 2 and 3 was -0.015 m, -0.025 m and -0.042 m respectively. This correlates to surface deformation propagation of approximately 45%, 70% and 120% for Reservoirs 1, 2 and 3. As shown for Reservoir 3, vertical surface deformation may exceed reservoir deformation for homogeneous rock conditions with the maximum ratio being 2(1−v ) (Geertsma, 1973).
Du and Olson (2001) provide a dimensionless example of how vertical surface deformation varies with the D /R ratio for an axisymmetric reservoir. The maximum surface deformation occurs at the centre of the reservoir (i.e. r /R=0) where, r , is the radial distance on the surface from the centre of the reservoir. Also, shallower reservoirs exhibit steeper boundaries of the subsidence zone than deeper reservoirs which have a boundary spread over a larger area (Du and Olson, 2001).
2.5.3.2 Horizontal surface deformation
The D /R ratio also has an influence on the magnitude of horizontal deformation as shown in Figure 2.1. Reservoirs with a high D /R ratio cause less horizontal displacement than reservoirs with a low D /R ratio. In each case the greatest amount of maximum horizontal surface displacement is expected to occur in areas of maximum tilt which is often directly above the boundary of the reservoir (i.e. r /R=1.0).
12 Constraining Surface Deformation Predictions Resulting from Coal Seam Gas Extraction

Figure 2.1 Plot showing the influence the depth / radius ratio of the reservoir has in computing the amount of horizontal deformation.
For D /R ratios of 1.0, 0.6 and 0.2, the analytical model approximates that 20%, 35% and 80% of the reservoir compaction will be expressed as horizontal surface deformation respectively. With reference to Reservoirs 1, 2 and 3, this corresponds to 0.007 m, 0.012 m and 0.028 m of horizontal surface deformation directly above the boundary of the reservoir.
2.6 SummaryIn this Section we have reviewed the linear theory of poroelasticity which can be used to describe the reservoir compaction and surface deformation induced by pore-pressure decline in fluid-filled rocks. Analytical techniques which assume an isotropic subsurface, such as those presented by Geertsma, provide a relatively simple model which is flexible enough to be applied to a reservoir of any geometric shape. Given this model assumes most of the surface deformation is explained by the poroelastic expansion or contraction of the reservoir, less in situ geological data is required than that needed for numerical models.
Constraining Surface Deformation Predictions Resulting from Coal Seam Gas Extraction 13

3 Predicting Surface Deformation
In this Section we apply the theory of poroelasticity to predict the magnitude and areal extent of surface deformation that could result from CSG operations in Australia. This ‘forward modelling’ process provides useful input into the design of baseline monitoring networks. Before showing the results of the surface deformation predictions of the analytical model (SURDEF) in the Surat Basin, we compare the predictions from SURDEF to a 3D geomechanical model (Tenthorey et al., 2011; 2013) based on the change in pressure at a gas storage field in Victoria.
3.1 Model comparisonThe Iona field is a methane gas storage facility located in southern Victoria, approximately 20 km east of the CO2CRC Otway Project in the Naylor field. Originally a gas production field, Iona was converted to a gas storage field in 2000 in response to the Longford gas incident in 1998. The Victorian Government decided additional gas storage facilities were required to provide energy security.
Using data provided by EnergyAustralia, Tenthorey et al. (2011; 2013) undertook a 3D geomechanical modelling study of the Iona gas storage field. They assessed the reservoir deformation and surface deformation induced by pressure changes throughout the history of the storage field. Given the proprietary nature of data acquired by energy companies, the information provided by EnergyAustralia relating to the pore-pressure change, along with in situ rock property data measured by CO2CRC, make the study of Tenthorey et al. (2011; 2013) a rare source of comparison for the analytical model used in this report.
3.1.1 Iona pressure changes
The pressure changes assessed in this Record are referenced to Stage 0 (S0) at which time the reservoir had a field pressure of 12 MPa (Table 3.1). Between S0 and Stage 2 (S2), the pressure change was -2 MPa. Between S2 and Stage 3 (S3) the field was converted to a gas storage facility which resulted in an increase in field pressure of 2.6 MPa.
Table 3.1 Iona gas field pressure changes.
Stage Pressure
0 12 MPa
2 10 MPa
3 12.6 MPa
Source:Tenthorey et al. (2013)
14 Constraining Surface Deformation Predictions Resulting from Coal Seam Gas Extraction

3.1.2 Iona gas storage field and modelling data
Structurally, the Iona field is a tilted anticline which is bound by two main faults which Tenthorey et al. (2011) have modelled with a thickness of 40 – 70 m. The gas is stored in the Upper Cretaceous Waarre C Formation located ~1300 m below ground level and is a high permeability sandstone divided into three units which are intercalated with thin shale units, and capped by ~150 m of Belfast mudstone (Tenthorey et al., 2011). The poroelastic coefficient was derived using Equation (2.02), based on a porosity value of 24% (Goiye, 2009).
The elastic moduli, E and v, of the sandstone formation (Table 3.2) were estimated using sonic log data calibrated against core samples from the nearby Naylor field (less than 20 km away). Core samples from the Iona field were not suitable for laboratory mechanical testing due to their poor quality and friable nature (Tenthorey et al., 2011). The observed sonic logs were used to calculate ‘undrained dynamic’ moduli. These were converted to ‘drained static’ moduli by Tenthorey et al. (2011). Undrained and drained moduli refer to the rock response for flow (drained) and no flow (undrained) conditions in rock testing while static and dynamic refers to whether the testing of the rock properties are measured using wave velocity (dynamic) or mechanical (static) testing.
Table 3.2 Iona gas field properties as described by Goiye (2009) and Tenthorey et al. (2013).
Property Value Reference
Poroelastic coefficient (α ) 0.66 (porosity 24%) Goiye (2009)
Depth (D) 1300 m Tenthorey et al. (2013)
Thickness (T ) 40 – 70 m Tenthorey et al. (2013)
Dimensions (L xW ) 2000 x 2000 m Tenthorey et al. (2013)
Young’s Modulus (E) 5.2 – 6.8 GPa Tenthorey et al. (2013)
Poisson’s Ratio (v) 0.1 – 0.25 Tenthorey et al. (2013)
Source: Goiye (2009) and Tenthorey et al. (2013).
3.1.3 3D geomechanical model results
Tenthorey et al. (2011) developed a 3D coupled geomechanical model of the Iona gas field to assess the effects of gas injection and withdrawal. The model was developed using geomechanical data, in situ geological and stress data, and a fault model. The purpose was to solve for the maximum stress path, quantify cap rock integrity and fault stability, and predict of the magnitude of ground deformation during peak periods of injection and withdrawal (Tenthorey et al., 2011).
Tenthorey et al. (2011) computed the surface deformation at S2 and S3. The deformation results were measured relative to S0 in both cases. At S2, the pressure change was -2 MPa which induced -9 mm of vertical surface deformation above the centre of the Iona field. The injection of gas between S2 and S3 caused the pressure within the reservoir to rise by 0.6 MPa relative to S0. According to the 3D geomechanical model analysis, this caused vertical surface deformation of +2.5 mm above the centre of the Iona field.
Constraining Surface Deformation Predictions Resulting from Coal Seam Gas Extraction 15
3.1.4 SURDEF results
Surface deformation predictions were computed using our Fortran software, SURDEF, based on the Geertsma and Van Opstal (1973) analytical model (Equations 2.28 – 2.30). Due to the assumptions of the model, the average reservoir Young’s modulus (6 GPa) and Poisson’s ratio (0.16) values from Tenthorey et al. (2011) were used along with the pressure information provided in Section 3.1.1. The reservoir was modelled with dimensions of 2 2 km and cell dimensions of 50 50 × 55 m (thickness). The compaction or expansion of each cell was modelled as the deformation of a nucleus of strain located at the centre of each cell.
SURDEF was used to predict surface deformation out to four kilometres from the centre of the reservoir. Relative to S0, the maximum vertical surface deformation prediction was -5 mm and +2 mm for S2 and S3 respectively (Figure 3.2).
Figure 3.2 Vertical surface deformation predictions from SURDEF based on: a) pressure change between S0 and S2 (-2 MPa), and b) pressure change between S0 and S3 (+0.6 MPa).
3.1.5 Comparing the 3D geomechanical and SURDEF results
As shown in Table 3.3, the -2 MPa change in pressure within the reservoir between S0 and S2 was predicted to induce surface deformation of -9 mm and -5 mm by the 3D geomechanical model and SURDEF respectively. Between S0 and S3, when gas was injected into the reservoir, the +0.6 MPa change in pressure within the reservoir was predicted to cause surface deformation of +2.5 mm by the 3D geomechanical model and +2 mm by SURDEF.
16 Constraining Surface Deformation Predictions Resulting from Coal Seam Gas Extraction

Table 3.3 Comparison of the vertical surface deformation predictions of the 3D geomechanical model (Tenthorey et al., 2013) and SURDEF.
Stage 3D Geomechanical SURDEF
S2 (-2 MPa) -9 mm -5 mm
S3 (+0.6 MPa) +2.5 mm +2 mm
Source:Tenthorey et al. (2013).
Without observations of the surface deformation at S2 and S3, it is not possible to assess the accuracy of either model; however, this comparison does demonstrate that analytical techniques based the linear theory of poroelasticity can provide results comparable to those from more sophisticated numerical techniques when the assumptions of the linear theory of poroelasticity are valid for the reservoir and surrounding burden.
3.2 Surat Basin analysisThe Surat and Bowen Basins are the two basins predominantly exploited for CSG in Australia; however, exploration and research is also being undertaken across almost every Australian state and territory (Baker and Slater, 2009). In this Section we attempt to quantify the surface deformation that could be caused by CSG extraction within the Surat Basin.
The Walloon Coal Measures (WCM) hosts the target coal seams in the Surat Basin. The elastic moduli of the WCM used in the modelling were taken from the Department of Resources, Energy and Tourism (DRET) reports, CSG operator Environmental Impact Statements (EISs) and the literature. A range of simulations have been undertaken to predict surface deformation caused by the cumulative impact of CSG operations in the Surat Basin.
3.2.1 Surat Basin stratigraphy
The Surat Basin underlies approximately 300,000 km2 with three quarters of the basin located in south-eastern Queensland and the remainder in north-eastern New South Wales. On a basin scale, sedimentation was generally continuous from the Early Jurassic to Early Cretaceous with only minor erosional unconformities (Scott, 2008). It is a multilayer aquifer system comprising thick sequences of generally low permeability (aquitards) that separate several recognised aquifers which are predominantly sandstone formations (Exon, 1976; Figure 3.3).
Constraining Surface Deformation Predictions Resulting from Coal Seam Gas Extraction 17

Figure 3.3 Simplified stratigraphy of the Surat Basin (after Scott et al., 2004).
The stratigraphy of the Surat Basin shown in Figure 3.3 is simplified. In reality, the basin stratigraphy is a far more complex combination of lithofacies which are anisotropic. The degree of anisotropy is however not well known due to the limited data available relating to the subsurface physical properties and structure.
Given that limited data are available, analytical models are used in this research in an attempt to predict the order of magnitude of surface deformation based on the assumptions of the poroelastic theory and analytical model. It is important to recognise that if further information relating to the geological properties and structure, stress regime and groundwater hydrology show that the assumptions of the analytical model and poroelastic theory are invalid, the predictions would also be invalid.
3.2.2 Drawdown predictions
Drawdown is the difference between the groundwater pressure before and after pumping or depressurisation (QWC, 2012). In the scenarios below, surface deformation predictions are based on ‘long-term impact’ drawdown estimates of the WCM derived by a regional numerical groundwater flow model developed by the Queensland Water Commission (QWC, 2012). The model was constructed using MODFLOW with 1.5 km resolution and is based on existing water bore and gas well information, and data from petroleum tenure holders about planned development over the life of the CSG industry
18 Constraining Surface Deformation Predictions Resulting from Coal Seam Gas Extraction

(QWC, 2012). The long-term impact is the maximum drawdown predicted by the groundwater model in a given area at any time in the future (QWC, 2012). For example, the maximum drawdown of the WCM at Site A may be 600 m in 2025, while the maximum at the adjoining Site B may also be 600 m, but not until 2035.
In the simulations below, SURDEF predictions are based on the assumption that the long-term impacts are occurring simultaneously. For example, the MODFLOW model predicts a long-term impact of ~650 m for a 30 x 20 km area south-east of Roma (QWC, 2012). That is, 20 x 13 cells of the MODFLOW model at some point in the future are predicted to have ~650 m of drawdown. Based on this assumption, if the long-term impact is not simultaneous SURDEF predictions are an over-estimate the surface deformation. The predictions provided in the scenarios below therefore represent an upper limit of surface deformation.
The predicted long-term impact on the WCM is expected to be less than 150 m throughout most of the CSG operational area and its surrounds; however, within the production area the magnitude of impact can be much greater (QWC, 2012). There is a need to lower the hydraulic head down to approximately 35-40 m above the top of the uppermost coal seam to reduce the pressure and allow the methane to desorb from the coal (APLNG, 2010). As a result, in the more westerly areas of CSG operation, where the coal formation is deep, the drawdown and therefore pressure reduction is expected to be larger than the eastern operation area (QWC, 2012).
This analysis does not include the drawdown effects from the overlying and underlying layers such as the Springbok Sandstone. Preliminary analysis was undertaken to test the influence of these layers and the impact was found to be significantly smaller than the uncertainty associated with the modelling procedure.
3.2.2.1 Convert drawdown to pressure change
As indicated in Geerstma and Van Opstal (1973), the analytical model to compute surface deformation (Equations 2.28 – 2.30) uses the pressure change parameter, not drawdown. Drawdown can be converted to pressure change, ∆ p, using Equation (3.01)
∆ p=ρg∆h (3.01)
where, ρ, is the density of water (1000 kg.m-3), g, is gravitational acceleration (9.8 m.s-2) and ∆ h, is the change in drawdown.
3.2.3 Cumulative surface deformation
One of the uncertainties associated with CSG extraction in the Surat Basin is the cumulative impact of many CSG wells withdrawing water from the WCM in close proximity. To predict the surface deformation this could cause, three regional surface deformation scenarios were developed, simulating pressure reduction from 12 adjoining CSG leases and the surrounding area.
The objective of this series of simulations was to: (1) quantify the cumulative impact of CSG extraction for a number of production areas within the Surat Basin and, (2) demonstrate the impact the depth, thickness and pressure changes parameters have on surface deformation predictions.
Constraining Surface Deformation Predictions Resulting from Coal Seam Gas Extraction 19

In the simulations below, the cumulative surface deformation impact was quantified using SURDEF by comparing the predicted surface deformation induced by CSG operations at a single 10 x 10 km site, the approximate dimensions of a single CSG lease (Sites 1, 2 and 3), to surface deformation predicted due to pressure reduction from 12 adjoining leases and an extended 20 km drawdown buffer over 80 x 80 km area (Regions 1, 2 and 3) (Figure 3.4).
Figure 3.4 Locations, dimensions and parameters of the three sites and regions at which surface deformation predictions were made. Single lease surface deformation predictions were made at Sites 1, 2 and 3 (solid grey squares). Cumulative surface deformation predictions were made in Regions 1, 2 and 3 (transparent grey squares). The grey area within the location diagram is the extent of the Surat Basin.
3.2.3.1 Choice of parameters
In each scenario, the parameters of the analytical model are representative of the geological conditions (Table 3.4). The poroelastic coefficient of 0.64 was estimated from Equation (2.02) based on the average porosity of the rock, 0.23 (DRET, 2012). Elastic moduli, E, and, v were based on laboratory tested core samples from the Ridgewood pilot study (Johnson et al., 2010) within the Surat Basin. The depth to the centre of the WCM and thickness properties were taken from operator EISs (QGC, 2009; Santos, 2009; APLNG, 2010) and the pressure change was based on the long-term impact analysis from QWC (2012).
As indicated in the QWC (2012) modelling, drawdown caused by CSG operation is not constrained to the boundaries of CSG leases with long-term impacts shown to decrease with distance from the CSG leases (QWC, 2012). The pressure reductions applied in our simulations are a simple representation of this trend.
20 Constraining Surface Deformation Predictions Resulting from Coal Seam Gas Extraction

The Young’s modulus, Poisson’s ratio and poroelastic coefficient were held fixed in all predictions based on the average values provided by Johnson et al. (2010). Fixing the elastic moduli and poroelastic coefficient was done in order to demonstrate the variability of surface deformation predictions caused by depth, thickness and predicted pressure change within the WCM.
Table 3.4 Parameters used for the three site and regional simulations.
Parameter Site / Region 1 Site / Region 2 Site / Region 3
Poroelastic coefficient (α ) 0.64 0.64 0.64
Depth (D) 1100 m (Santos, 2009; APLNG, 2010) 450 m (QGC, 2009) 550 m (APLNG, 2010)
Thickness (T ) 250 m (APLNG, 2010) 400 m (QGC, 2009) 300 m (APLNG, 2010)
Drawdown 650 m (QWC, 2012) 550 m (QWC, 2012) 200 m (QWC, 2012)
Young’s Modulus (E) 13.79 GPa 13.79 GPa 13.79 GPa
Poisson’s Ratio (v) 0.3 0.3 0.3
Max. pressure change (∆ p) 6.37 MPa 5.39 MPa 1.96 MPa
3.2.3.2 Region 1
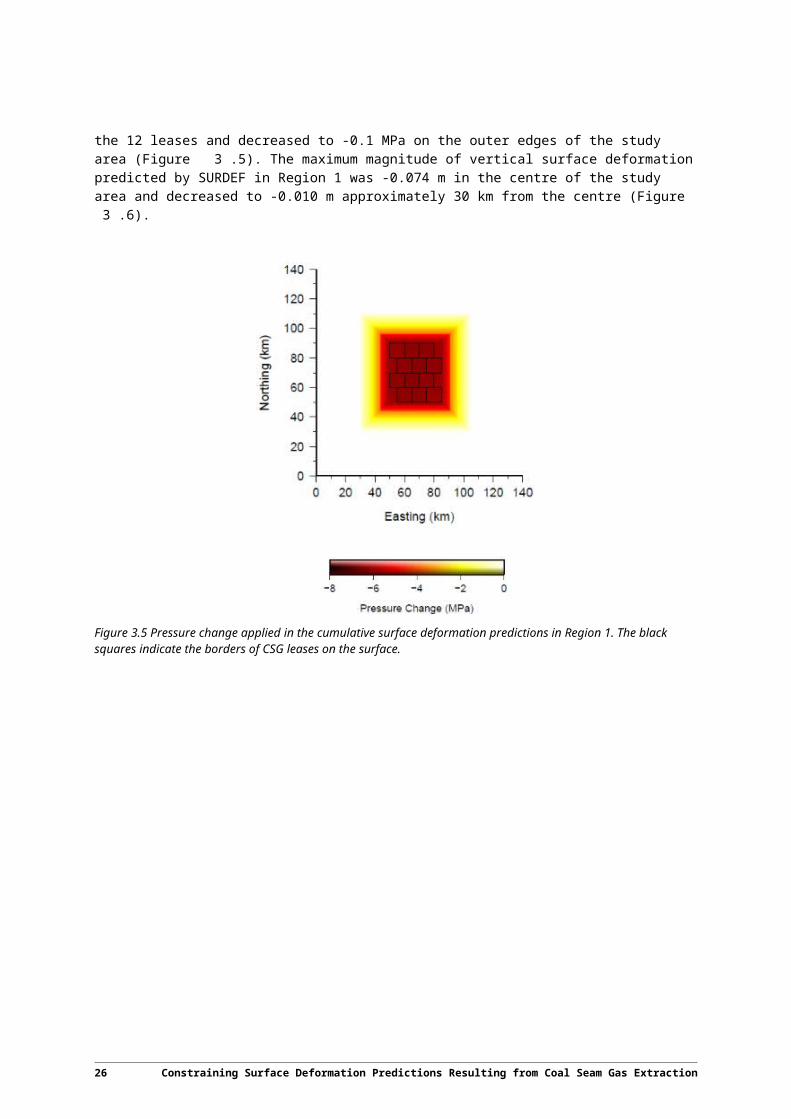
The WCM to the south-east of Roma are relatively deep (1100 m) compared to other portions of the WCM and have an average thickness of 250 m. Based on the long-term drawdown predictions, the pressure change simulated in the WCM throughout Region 1 varied between -6.37 MPa and -6.10 MPa throughout the 12 leases and decreased to -0.1 MPa on the outer edges of the study area (Figure 3.5). The maximum magnitude of vertical surface deformation predicted by SURDEF in Region 1 was -0.074 m in the centre of the study area and decreased to -0.010 m approximately 30 km from the centre (Figure 3.6).
Constraining Surface Deformation Predictions Resulting from Coal Seam Gas Extraction 21

Figure 3.5 Pressure change applied in the cumulative surface deformation predictions in Region 1. The black squares indicate the borders of CSG leases on the surface.
Figure 3.6 SURDEF prediction of vertical surface deformation based on the pressure changes shown in Figure 3.5.
22 Constraining Surface Deformation Predictions Resulting from Coal Seam Gas Extraction

To assess the impact of cumulative drawdown, the Region 1 SURDEF prediction of maximum surface deformation was compared to the surface deformation prediction from Site 1, a 10 x 10 km area in the centre of Region 1. Applying the same parameters as Region 1 with a pressure change of -6.37 MPa throughout the 10 x 10 km portion of the WCM, the surface deformation predicted using SURDEF was -0.062 m (Figure 3.7). The cumulative impact was therefore an increase in the maximum vertical surface deformation of -0.012 m; a 19% increase in deformation.
Figure 3.7 SURDEF prediction of vertical surface deformation caused by drawdown of the Walloon Coal Measures at Site 1 within the Surat Basin. The black square represents the 10 x 10 km dimensions of the CSG lease.
SURDEF was also used to compute the simulated horizontal surface deformation caused by the pressure change within the WCM. As described in Section 2.5.3.2 the greatest amount of horizontal deformation occurs in areas of maximum tilt which is often above the boundary of the reservoir. In Region 1, the greatest amount of horizontal deformation predicted was 0.055 m on the edges of the simulated drawdown region (Figure 3.8) above the portion of the WCM where the simulated pressure was reduced by 3.5 MPa over 10 km (Figure 3.5).
The horizontal deformation in both the x and y-directions are shown to move toward the centre of the reservoir as expected for a region of subsidence. The combined horizontal deformation value (Figure 3.8c) is defined by Equation (3.02).
U h=√U x2+U y
2 (3.02)
Constraining Surface Deformation Predictions Resulting from Coal Seam Gas Extraction 23

Figure 3.8 SURDEF predictions of horizontal surface deformation based on the pressure changes shown in Figure 3.5 in (a) x-direction, (b) y-direction and (c) combined.
3.2.3.3 Region 2
In Region 2, south of Miles, the pressure change modelled within the leases was between -5.39 MPa and -5.20 MPa, and like Region 1, reduced to -0.1 MPa on the outer edges of the study area (Figure 3.9). The maximum vertical surface deformation predicted using SURDEF was -0.105 m (Figure 3.10); this is a 40% increase in subsidence compared to Region 1. Although the simulated pressure change was lower in Region 2 than Region 1, greater surface deformation was predicted due to the WCM being at half the depth of Region 1 (450 m) and the thickness of the WCM being 150 m greater.
Figure 3.9 Pressure change applied in the cumulative surface deformation predictions in Region 2. The black squares indicate the borders of CSG leases on the surface.
24 Constraining Surface Deformation Predictions Resulting from Coal Seam Gas Extraction

Figure 3.10 SURDEF prediction of vertical surface deformation based on the pressure changes shown in Figure 3.9.
The cumulative impact in Region 2 compared to Site 2 was a 9% (0.009 m) increase in the maximum vertical surface deformation; lower than the 19% increase predicted between Region 1 and Site 1. This difference was largely due to the relatively shallow depth of the WCM. Shallow reservoirs cause steeper boundaries of the subsidence zone than deeper reservoirs. As a result, the shallower WCM of Region 2 impact on a smaller portion of the surface above, and cause less cumulative impact than Region 1.
The magnitude of horizontal deformation was predicted to be larger in Region 2 than Region 1 with up to 0.072 m of deformation on the outer edges of the simulated leases (Figure 3.11). The relatively shallow and thick WCM cause steeper boundaries of the subsidence zone and therefore cause greater tilt and horizontal surface deformation.
Constraining Surface Deformation Predictions Resulting from Coal Seam Gas Extraction 25
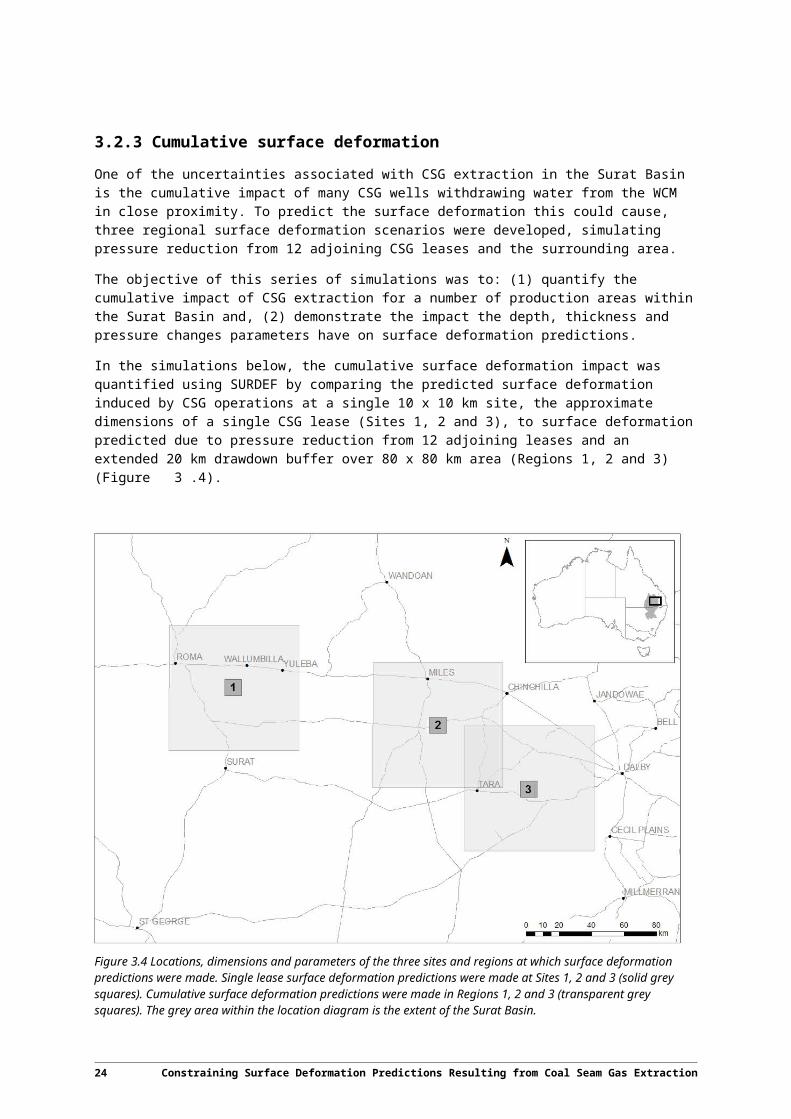
Figure 3.11 SURDEF predictions of horizontal surface deformation based on the pressure changes shown in Figure 3.9 in (a) x-direction, (b) y-direction and (c) combined.
3.2.3.4 Region 3
In Region 3, west of Dalby, the long-term impact expected to occur within the WCM is substantially less than Regions 1 and 2. The pressure change simulated within the leases varied between -1.96 MPa and -1.85 MPa and decreased to -0.1 MPa on the outer edges of the study area (Figure 3.12). Due to the relatively small amount of drawdown compared to Regions 1 and 2, the maximum vertical surface deformation of -0.026 m in the centre of Region 3 (Figure 3.13) was substantially less than Regions 1 and 2.
26 Constraining Surface Deformation Predictions Resulting from Coal Seam Gas Extraction

Figure 3.12 Pressure change applied in the cumulative surface deformation predictions in Region 3. The black squares indicate the borders of CSG leases on the surface.
Figure 3.13 SURDEF prediction of vertical surface deformation based on the pressure changes shown in Figure 3.12.
The cumulative impact between Site 3 and Region 3 was 0.002 m (7%). This small cumulative impact is primarily due to the combination of a relatively low simulated pressure change within the
Constraining Surface Deformation Predictions Resulting from Coal Seam Gas Extraction 27
WCM (1.96 MPa) and a relatively shallow depth compared to Region 1. Like Region 2, the steeper boundaries of the subsidence zone restrict the influence of the reservoir compaction to a smaller surface area.
The horizontal surface deformation pattern predicted for Region 3 was similar to that from Regions 1 and 2, however the magnitude of the deformation was smaller due to the lower simulated pressure change (Figure 3.14). Less drawdown causes less tilt and therefore less horizontal surface deformation. Up to 0.019 m of horizontal surface deformation was predicted on the outer edges of the drawdown zone, but this was not predicted to extend as far from the centre of the study area as Regions 1 and 2.
Figure 3.14 SURDEF predictions of horizontal surface deformation based on the pressure changes shown in Figure 3.12 in (a) x-direction, (b) y-direction and (c) combined.
3.2.3.5 Cumulative impact summary
In the scenarios presented above we predicted the cumulative surface deformation from three regions in the Surat Basin which already are, or are anticipated to be, subject to CSG extraction. Our analysis was based on the assumptions of the linear theory of poroelasticity, the choice of poroelastic parameters and the long-term drawdown predictions from QWC (2012).
The surface deformation predicted in each region was found to vary significantly due to the simulated depth, thickness and drawdown within the WCM. Furthermore, the depth to radius ratio was also shown to have a significant impact. Region 2 which was predicted to have the greatest amount of surface deformation was not the region which experienced the greatest cumulative impact. This analysis indicates the importance of site-specific and region-specific studies.
28 Constraining Surface Deformation Predictions Resulting from Coal Seam Gas Extraction

Table 3.5 The maximum amount of vertical surface deformation predicted for Sites, and Regions, 1, 2 and 3 using SURDEF and the cumulative impact.
Location Site Region Cumulative Impact
1 -0.062 m -0.074 m +19%
2 -0.096 m -0.105 m +9%
3 -0.026 m -0.028 m +7%
The results we have presented are not the maximum or minimum surface deformation predictions for the Surat Basin, only a prediction for the regions we investigated. Also, we have restricted the analysis to the average values of the WCM in each region provided in the literature and EISs. In the next Section we provide a more thorough investigation based a parameter sensitivity analysis.
3.3 Parameter sensitivity analysisAn ensemble of forward modelling solutions was developed in which a range of values for each parameter were tested while all other parameter values were fixed to an average or likely reference value (Table 3.6). This form of analysis aims to:
provide constraint on the likely range of potential surface deformation,
highlight the significance each parameter has in analytical predictions of surface deformation, and
quantify the potential error in surface deformation predictions due to uncertainty in the parameter value.
Table 3.6 Parameter sensitivity analysis reference and range values.
Parameter Reference Value Range Reference
Poroelastic coefficient (α ) 0.64 0.44 – 0.78 DRET (n. d)
Depth (D) 775 m 450 – 1100 m QGC (2009); Santos (2009); APLNG (2010)
Thickness (T ) 325 m 250 – 400 m QGC (2009); APLNG (2010)
Drawdown 350 m 200 – 650 m QWC (2012)
WCM Dimensions (L×W ) 10 x 10 km 2 x 2 – 20 x 20 km
Young’s Modulus (E) 13.79 GPa 6.89 – 20.68 GPa Johnson et al. (2010)
Poisson’s Ratio (ν) 0.3 0.2 – 0.4 Johnson et al. (2010)
Pressure Change (∆ p) 4 MPa 1.96 – 6.37 MPa QWC (2012)
Equation (2.02) was used to derive a range of poroelastic coefficient values based on the porosity of the rock. DRET (n .d) estimated that the porosity of the Surat Basin at the depth of the WCM varies between 0.15 and 0.3. For the purpose of this analysis, a value of 0.23 was chosen as the reference
Constraining Surface Deformation Predictions Resulting from Coal Seam Gas Extraction 29

value which is equivalent to a poroelastic coefficient value of 0.64 and porosity values of 0.15 and 0.3 were used to establish a range between 0.44 and 0.78.
The elastic moduli, Young’s modulus, E, and Poisson’s ratio,v, used in the sensitivity analysis were based on laboratory tested core samples from the Ridgewood pilot study (Johnson et al., 2010) within the Surat Basin. The log data of the WCM from the study area showed the Young’s modulus values vary between 1 Mpsi and 3 Mpsi with an average of 2 Mpsi, equivalent to 13.79 GPa. The Poisson’s ratio values within the WCM range between 0.2 and 0.4 with an average of 0.3. The depth, to the centre of the WCM, and thickness properties were taken from operator EISs (QGC, 2009; Santos, 2009; APLNG, 2010) and the range of pressure change was based on the long-term impact analysis from QWC (2012).
Based on the range of values tested for each parameter, the rock properties of Young’s modulus and Poisson’s ratio were found to be two of the most influential when predicting surface deformation caused within the WCM (Figure 3.15). With respect to the Young’s modulus, decreasing the stiffness of the WCM from 20.68 GPa to 6.89 GPa increased the vertical surface deformation by 0.072 m. The decrease from 0.4 to 0.2 in the Poisson’s ratio was shown to induce 0.046 m of surface deformation.
Figure 3.15 Results of parameter sensitivity analysis.
Although obtaining accurate rock properties can be difficult, this sensitivity analysis highlights that uncertainty in the Young’s modulus parameter in relatively stiff portions of the WCM (e.g. E between 15 – 20 GPa) will not cause a significant difference in the surface deformation predictions. However, in portions of the WCM with a relatively low Young’s modulus value (e.g. E between 3 – 8 GPa), the impact of uncertainty in the parameter prediction has the potential to cause greater uncertainty in deformation predictions. This non-linear relationship also exists for the dimensions parameter. As the dimensions of the depressurised zone of the WCM increased from 2 km2 to 20 km2, the potential error in surface deformation by incorrectly predicting the size of the depressurised portion of the WCM reduces.
The change in pressure experienced within the WCM was also shown to be an influential parameter. This demonstrates the importance of accurate drawdown predictions with a difference of up to 0.060 m in maximum vertical surface deformation between 1.96 MPa and 6.37 MPa. Given that the pressure
30 Constraining Surface Deformation Predictions Resulting from Coal Seam Gas Extraction

reduction required is generally dependent on the depth of the WCM, this value should be fairly well constrained. Therefore, the variability in these results is a clear demonstration of the influence of the parameter in surface deformation predictions, not the uncertainty in maximum surface deformation predictions for a particular region.
As discussed in Section 3.2.1, given that limited data are available, the parameter sensitivity analysis predicts surface deformation based on the assumptions of the poroelastic theory and analytical model. This is not however a ‘conceptualisation sensitivity analysis’. If new geological property data demonstrate a high degree of anisotropy in the subsurface, or a fault in the study area is identified, the assumptions of the analytical model and poroelastic theory are invalid and the predictions of this parameter sensitivity analysis would also be invalid.
Constraining Surface Deformation Predictions Resulting from Coal Seam Gas Extraction 31

4 Monitoring and Inversion
A multidisciplinary study of geodetic, geophysical and geochemical monitoring data from a variety of techniques is needed to perform a comprehensive assessment of the impact of CSG operations. Given the scope of this report was limited to assessing the surface deformation caused by CSG operations, the monitoring techniques and plan discussed in this Section are based around developing a capability to: (1) predict and quantify surface deformation caused by CSG operations, (2) calibrate and verify predictive models, and (3) constrain the poroelastic properties of reservoirs to improve future surface deformation predictions.
4.1 Surat Basin monitoringA range of monitoring techniques are available to measure surface (e.g. InSAR; Vasco et al., 2010, tiltmetres; Vasco et al., 1998) and subsurface changes (e.g. 4D seismic; Boait et al., 2011) caused by fluid injection or extraction operations such CSG. A combination of observational techniques which complement each other is often required. Some techniques have limited data coverage or sparse temporal sampling which doesn’t observe important transient phenomena (e.g. seismic), while others are unable to directly map geophysical measurements to geological properties (e.g. InSAR). It is therefore important to utilise monitoring techniques which are both site- and outcome-specific. The choice is ultimately a trade-off between the need for verification and safety, against cost and suitability (Michael et al., 2010). Based on our objectives in the Surat Basin, we have developed a sample data capture and monitoring plan which requires the use of different techniques before, during and after CSG operations (Table 4.7).
Table 4.7 Summary of monitoring techniques and in situ data used to predict and monitor the impacts of CSG operations throughout the life-cycle of the study area. Techniques are ranked in terms of importance from dark to light blue.
Pre-Operation Operation Post-Operation
3D Seismic & Microseismic
Baseline site-specific surveys can help identify and characterise faults prior to CSG operations commencing.
Provides information pertaining to the depth, thickness and dimensions of the reservoir and burden.
Key to subsurface model development and provides useful information for forward and inverse modelling.
Monitor subsurface stress changes, identify faults and used down wells to check degree of fracturing.
Monitor subsurface stress changes, identify faults and used down wells to check degree of fracturing.
Core Data and Sonic Logs
Provides elastic moduli and poroelastic coefficient values (and associated uncertainty).
Assess the change in reservoir and burden properties caused by CSG operations.
Assess the change in reservoir and burden properties caused by CSG operations.
32 Constraining Surface Deformation Predictions Resulting from Coal Seam Gas Extraction

Pre-Operation Operation Post-Operation
InSAR Observe baseline surface deformation such as variation due to seasonal change.
Observe potential surface deformation.
Quantify potential surface deformation and infer reservoir property values.
Aid in the development of forward and inversion models.
Observe potential surface deformation.
Quantify potential surface deformation and infer reservoir property values.
Aid in the development of forward and inversion models.
GNSS Tie techniques together in an absolute reference frame.
Tie techniques together in an absolute reference frame.
Tie techniques together in an absolute reference frame.
Groundwater Monitor baseline groundwater levels and pressure within the WCM and aquifers / aquitards.
Monitor groundwater levels and pressure within the WCM and aquifers / aquitards.
Constrain inversion of InSAR data when inverting for reservoir properties.
Monitor groundwater levels and pressure within the WCM and aquifers / aquitards.
Constrain inversion of InSAR data when inverting for reservoir properties.
Tiltmeters Detect and calibrate for subtle changes of the Earth caused by temperature variations, lunar and tidal forces.
Provides independent measure of strain and can be placed at depths up to 1 km.
Provides independent measure of strain and can be placed at depths up to 1 km.
Levelling Baseline independent and in situ surface deformation data.
Independent and in situ surface deformation data.
Independent and in situ surface deformation data.
Before CSG operations begin, estimates of the elastic moduli, poroelastic coefficient, dimensions of the reservoir and surrounding burden, and the expected pressure change are required to model and predict the range of potential surface deformation. This requires baseline seismic data, core and sonic log data and groundwater pressure data. The results of the forward modelling provide a range of potential surface deformation for the region and the parameter sensitivity analysis will indicate any potential data gaps. For example, in the case of our modelling in Section 3, the value of Young’s modulus was shown to have a significant impact on the magnitude of surface deformation. More representative elastic moduli data from each of the three regions would be useful to constrain the surface deformation predictions.
In order to better understand the natural variations in the surface height, and quantify the contribution of CSG operations to surface deformation, baseline Interferometric Synthetic Aperture Radar (InSAR) and Global Navigation Satellite Systems (GNSS) observations would be beneficial. InSAR is a space geodesy technique which uses two or more synthetic aperture radar images to measure line-of-sight surface deformation. The deformation observation is based on the differences in the phase of the waves returning to the satellite caused by changes in the position of the surface between observed images (Massonnet and Feigl, 1998).
Although InSAR has the capability to detect surface motion with precision of a ±0.1 mm/yr (e.g. Colesanti et al., 2006), it is often necessary to analyse it in combination with GNSS since InSAR only measures the relative change in surface height over large areas. GNSS (e.g. GPS) provides accurate and absolute three dimensional coordinates and can therefore tie InSAR data to an accurate and absolute reference frame. For example, if cumulative surface deformation occurs over the same size area as an InSAR scene (e.g. 100 km2), the entire region is deforming and the relative change in
Constraining Surface Deformation Predictions Resulting from Coal Seam Gas Extraction 33

surface height detected by InSAR will only be a fraction of the absolute change in surface height. GNSS data is required to ensure this change in surface height is accurate.
Throughout, and after, the CSG production interval, GNSS and InSAR provide a useful monitoring combination. InSAR has been used to detect a variety of geophysical deformation processes such as groundwater variations (Massonnet and Feigl, 1998), geothermal production (Burgmann et al., 2000), earthquake-related deformation or dislocation (Dawson et al., 2008) and CO2 sequestration (Vasco et al., 2010). Furthermore, satellite-based techniques such as InSAR have the advantages of generally being less expensive, having higher temporal resolution (1–4 weeks), high spatial resolution and coverage (1 1 m over a region 100 km2) and less invasive than other geophysical monitoring techniques such as seismic or electromagnetic methods. This makes the combination of InSAR and GNSS an accurate and cost effective method of monitoring the transient surface deformation caused by changes in fluid pressure as opposed to the discrete measurements from other geophysical techniques. Further work may also be required to correlate deformation with CSG operations as opposed to other impacts on fluid pressure caused by other extractive activities or climatic factors.
The combination of baseline seismic data, representative core and sonic log data, groundwater data and the geodetic observational techniques described above are capable of predicting and quantifying potential surface deformation. Applying the forward modelling predictions and parameter sensitivity analysis techniques described in Section 3 provides estimates of the magnitude and extent of deformation which can be used to design a monitoring network. For example, it provides an estimate of the dimensions of the deformation zone to ensure the InSAR scene of a given sensor and mode of operation will be wide enough, and assists in identifying regions outside the deformation zone where GNSS stations can provide control.
4.2 Inverting monitoring data to constrain reservoir parametersInverse theory is the process of making statistical inferences about physical systems from observed data (Scales et al., 1997). The aim is to determine the unknown parameters of a model which best describe the physical system. Once CSG monitoring data is available, the objective will be to calibrate and verify our predictive model, use a geophysical inversion technique to constrain the poroelastic properties of reservoirs and improve future surface deformation predictions.
Geophysical inversion techniques can be described as either being formulated for optimisation or to derive an ensemble of potentially good fitting models. Optimisation techniques generally seek a single model which minimises the misfit to the observations; however, often the observations cannot uniquely determine the model. Sometimes, there are infinite, or no models that satisfy the data. The alternative is to find the entire ensemble of acceptable models and appraise the variety of compatible solutions (Parker, 1994). The advantage of this technique is that the inversion can be more exploratory and search a wider range of potential solutions compared to optimisation techniques which often require constraint. In the case of CSG operations, observations from monitoring sources (e.g. InSAR and GNSS) could be used to find an ensemble of models which preferentially sample the good fitting data-regions of parameter space (Sambridge, 1999). This ensemble methodology could be applied to make inferences about the poroelastic properties of the WCM in the Surat Basin to help constrain the range of potential surface deformation in the Surat Basin.
34 Constraining Surface Deformation Predictions Resulting from Coal Seam Gas Extraction

5 Conclusions
This Record described the capability and limitations of an analytical model to predict surface deformation caused by natural or anthropogenic subsurface fluid changes. Simulations of CSG operations in the Surat Basin show that an analytical model based on the linear theory of poroelasticity can be used to describe the reservoir compaction and surface deformation induced by pore-pressure decline in fluid-filled rocks. Analytical techniques provide a relatively simple method to predict surface deformation for reservoirs of any geometric shape. Furthermore, given that these techniques assume most of the surface deformation is explained by the poroelastic expansion or contraction of the reservoir, less in situ geological data is required than that needed for numerical models.
In Section 3, we applied our software SURDEF, a Fortran formulation of the analytical model, to compute the cumulative impact of surface deformation predictions caused by the CSG operations in the Surat Basin. Based on our analysis of three regional studies (80 km2) the maximum cumulative surface deformation was predicted to be approximately -0.1 m. Predictions in each region were found to vary significantly due to the simulated depth, thickness and pressure change within the WCM, indicating the importance of site-specific and region-specific studies.
Due to the assumptions of the analytical model and uncertainty associated with some of the parameter values, a sensitivity analysis was undertaken in which a range of realistic parameters were tested. This analysis can be used to constrain the likely range of potential surface deformation. Furthermore, it highlights the significance each parameter has in analytical predictions of surface deformation, and can help quantify the potential error in surface deformation predictions due to uncertainty in parameter values. This analysis suggests that within the range of measured physical parameters and assumptions of system homogeneity, the maximum potential surface deformation is likely to be less than 0.2 m. However, given that the real system will have considerable heterogeneity, it is likely that this deformation will be unevenly distributed.
The range of predictions performed in this Record suggests that surface deformation will be able to be detected using geodetic techniques in the Surat Basin. Based on the magnitude and extent of deformation predicted by SURDEF we have developed a monitoring plan which could be used to measure surface deformation before, during and after the operational period. In the future, we plan on using observations from monitoring techniques, such as InSAR and GNSS, in a geophysical inversion to constrain the choice of forward modelling parameters and improve predictions of surface deformation.
Constraining Surface Deformation Predictions Resulting from Coal Seam Gas Extraction 35

6 Acknowledgements
The authors would like to thank John Dawson, Andrew McPherson, Matthew Garthwaite, Jane Coram, Ken Lawrie and Eric Tenthorey for their constructive feedback and input into this work. We also thank Barry Drummond, Clinton Foster and Gary Johnston for having the foresight to recognise a need for this research.
36 Constraining Surface Deformation Predictions Resulting from Coal Seam Gas Extraction

7 References
Australia Pacific Liquid Natural Gas (APLNG), 2010. Environmental Impact Statement – Volume 5, Attachment 21: Groundwater Technical Report – Gas Fields.
Baker, G. L., Slater, S. M., 2009. Coal seam gas – an increasingly significant source of natural gas in eastern Australia, Australian Petroleum Production and Exploration Association Journal, 49, 79-100.
Biot, M. A., 1941. General theory of three-dimensional consolidation, Journal of Applied Physics, 12, 2, 155-164.
Boait, F., White, N., Chadwick, A., Noy, D., Bickle, M., 2011. Layer spreading and dimming within the CO2 plume at the Sleipner Field in the North Sea, Energy Procedia, 4, 3254–3261.
Burgmann, R., Rosen, P. A., Fielding, E. J., 2000. Synthetic aperture radar interferometry to measure Earth’s surface topography and its deformation, Annual Review of Earth and Planetary Sciences, 28, 169–209.
Castle, R. O., Yerkes, R. F., Riley, F. S.,1969. A linear relationship between liquid production and oil-related subsidence. Land subsidence, 597-604.
Colesanti, C., Crosta, G. B., Ferretti, A. and Ambrosi, C., 2006. Monitoring and assessing the state of activity of slope instabilities by the Permanent Scatterers Technique. In Landslides from Massive Rock Slope Failure, 175-194, Springer Netherlands.
CSIRO, 2012, Coal seam gas – produced water and site management (fact sheet), http://www.csiro.au/news/coal-seam-gas#FactSheets, accessed online: 19/04/2013.
Dawson, J., Cummins, P., Tregoning, P., Leonard, M., 2008. Shallow intraplate earthquakes in Western Australia observed by Interferometric Synthetic Aperture Radar, Journal of Geophysical Research, 113, B11408.
Detournay, E., Cheng A. H. D., 1993. Fundamentals of poroelasticity, Chapter 5 in Comprehensive Rock Engineering: Principles, Practice and Projects, Vol. II, Analysis and Design Method, Ed. Fairhurst C, Pergamon Press, 113-171.
Department of Resources, Energy and Tourism (DRET), n.d.. Surat Basin. Du, J., Olson, J. E., 2001. A poroelastic reservoir model for predicting subsidence and mapping
subsurface pressure fronts, Journal of Petroleum Science and Engineering, 30, 3-4, 181-197.Exon, N.F., 1976. Geology of the Surat Basin in Queensland. Bureau of Mineral Resources Bulletin
166, Australia.Fjær, E., Holt, R. M., Raaen, A. M., Risnes, R., and Horsrud, P., 2008. Petroleum related rock
mechanics (Vol. 53). Elsevier.Gambolati, G., Ricceri, G., Bertoni, W., Brighenti, G., Vuillermin, E., 1991. Mathematical simulation of
the subsidence of Ravenna. Water Resources Research, 27, 11, 2899-2918.Geertsma, J., 1973. Land subsidence above compacting oil and gas reservoirs, Journal of Petroleum
Technology, 25, 6, 734-744.Geertsma, J., Van Opstal, G., 1973. A numerical technique for predicting subsidence above
compacting reservoirs based on the nucleus of strain concept, Verhandelingen Kon. Ned. Geol. Mijnbouwk, 28, 63-78.
Geoscience Australia and Habermehl, 2010. Summary of advice in relation to the potential impacts of coal seam gas extraction in the Surat and Bowen Basins, Queensland.
Geoscience Australia and Australian Bureau of Agriculture and Resource Economics, 2010. Australian Energy Resource Assessment, Canberra, Australia.
Constraining Surface Deformation Predictions Resulting from Coal Seam Gas Extraction 37

Goiye, A., 2009, Gas Storage Project, Otway Basin, Victoria, Australia, Presentation to SPE and PESA, April 22nd 2009, TruEnergy.
Johnson, R.L., Glassborow, B., Scott, M.P., Pallikathekathil, Z.J., Datey, A., Meyer, J., 2010. Utilizing current technologies to understand permeability, stress azimuths and magnitudes and their impact on hydraulic fracturing success in a coal seam gas reservoir. Paper presented at SPE Asia Pacific Oil & Gas Conference and Exhibition, Brisbane, SPE 133066.
Ketelaar, V. B. H., 2009. Satellite Radar Interferometry: Subsidence Monitoring Techniques, Springer.Massonnet, D., Feigl, K. L., 1998. Radar interferometry and its application to changes in the earth’s
surface, Reviews of Geophysics, 36, 4, 441–500.Mindlin, R. D., Cheng D. H, 1950a. Nuclei of Strain in the Semi-Infinite Solid, Journal of Applied
Physics, 21(9), 926-930.Mindlin, R. D., Cheng D. H., 1950b. Thermoelastic Stress in the Semi-Infinite Solid, Journal of Applied
Physics, 21(9), 931-933.Michael, K., Golab, A.V., Shulakova, V., Ennis-King, J.G., Allinson, G., Sharma, S., Aiken, T.T., 2010.
Geological storage of CO2 in saline aquifers—a review of the experience from existing storage operations, International Journal of Greenhouse Gas Control, 4, 659–667.
Nagel, N. B., 2001. Compaction and Subsidence issues within the petroleum industry: from Wilmington to Ekofisk and beyond, Physics and Chemistry of the Earth (A), 26, 1-2, 3-14.
Parker, R. L., 1994. Geophysical Inverse Theory, Princeton University Press, Princeton.Queensland Gas Company, 2009. Coal seam gas field component for environmental impact
statement: QGC groundwater study Surat Basin, Queensland (Appendix 3.4).Queensland Water Commission, 2012. Report for QWC17-10 Stage 2: Surat Cumulative Management
Area Groundwater Model Report.Rice, J. R., Cleary, M. P., 1976. Some basic stress diffusion solutions for fluid-saturated elastic porous
media with compressible constituents. Reviews of Geophysics, 14(2), 227-241.Ruina, A., 1978. Influence of coupled deformation-diffusion effects on the retardation of hydraulic
fracture, Proceedings of the 19th U.S. Rock Mechanics Symposium, 274-282.Rutqvist, J., Vasco, D.W., Myer L., 2010. Coupled reservoir geomechanical analysis of CO2 injection
and ground deformations at In Salah, Algeria, International Journal of Greenhouse Gas Control, 4, 225-230.
Sambridge, M., 1999. Geophysical inversion with a neighbourhood algorithm – I. Searching the parameter space, Geophysical Journal International, 138, 479-494.
Santos, 2009. Santos GLNG Environmental Impact Statement: Groundwater (Deep Aquifer Modelling).
Scales, J. A., Smith, M. L., Treitel, S., 1997. Introductory Geophysical Inverse Theory. Samizdat Press.
Scott, S.G., Anderson, B., Crosdale, P.J., Dingwall, J.A., Leblang, G., 2004. Revised geology and coal seam gas characteristics of the Walloon Subgroup — Surat Basin Queensland. In: Boult, P.J, Johns, D.R., Lang, S.C. (Eds.), Eastern Australasian Basins Symposium II. Petroleum Exploration Society of Australia, Special Publication, 345–355.
Scott, S. G., 2008, The geology stratigraphy and coal seam gas characteristics of the Walloon subgroup-northeastern Surat Basin, Diss. James Cook University.
Segall, P., 1992. Induced stresses due to fluid extraction from axisymmetric reservoirs, Pure and Applied Geophysics, 139, 3, 535-560.
Tenthorey, E., Backe, G., Puspitasari, R., John, Z., Vidal-Gilbert, S., Maney, B., Dewhurst, D., 2011. 3D Geomechanical Modelling Study of the Iona Gas Storage Field, CO2CRC Report No: RPT11-2993.
Tenthorey, E., Vidal-Gilbert, S., Backé, G., Puspitasari, R., John Pallikathekathil, Z., Maney, B., Dewhurst, D., 2013. Modelling the geomechanics of gas storage: A case study from the Iona gas field, Australia. International Journal of Greenhouse Gas Control, 13, 138-148.
38 Constraining Surface Deformation Predictions Resulting from Coal Seam Gas Extraction

Terzaghi, K., 1925. Principle of soil mechanics, Engineering News Record, series of articles.Teeuw, D., 1973, Laboratory Measurements of Groningen Reservoir Rock, Transactions of the Royal
Dutch Society of Geologists and Mining Engineers, 28, 19-32.Underschultz, J., Connell, L., Jeffery, R., Sherwood, N., 2011. Coal Seam Gas in Australia: Resource
Potential and Production Issues, Search and Discovery, Article #80129.Vasco, D. W., Karasaki, K., Myer, L., 1998. Inversion of surface tilt caused by fluid migration, Journal
of Geotechnical and Geoenvironmental Engineering, 124, 29–37.Vasco, D. W., Ferretti, A., Novali, F., 2008. Reservoir monitoring and characterization using satellite
geodetic data: interferometric synthetic aperture radar observations from the Krechba field, Algeria. Geophysics, 73, 6, WA113–WA122.
Vasco, D. W., Rucci, A., Ferretti, A., Novali, F., Bissell, R. C., Ringrose, P. S., Mathieson, A. S., Wright I. W., 2010. Satellite-based measurements of surface deformation reveal fluid flow associated with the geological storage of carbon dioxide, Geophysical Research Letters, 37, 1–5.
Verruijt, A., 1969. Elastic storage of aquifers, In Flow Through Porous Media, (Ed.) DeWiest, R.J.M., Academic Press, New York.
Constraining Surface Deformation Predictions Resulting from Coal Seam Gas Extraction 39