Embed Size (px)
Citation preview

1. Math 101
Lines and Slope
Professor Richard Blecksmith
Dept. of Mathematical Sciences
Northern Illinois University
Math 101 Website: http://math.niu.edu/∼richard/Math101
Section 2 Website: http://math.niu.edu/∼richard/Math101/fall06
2. Construction Problem
A contractor builds two types of homes: the standard modeland the deluxe model. The standard model requires one lot,$12,000 capital, 150 labor-days to build, and is sold for a profitof $2400. The deluxe model requires one lot, $32,000 capital, 200labor-days to build, and is sold for a profit of $3400. The con-tractor has 150 lots. The bank is willing to loan him $2,880,000for the project and he has a maximum labor force available of24,000 labor-days. How many houses should he build to realizethe greatest profit?
3. Two Forms of a Line
• Slope–Intercept Form• y = mx + b
– m is the slope– b is the y-intercept
1

2
• Standard Form• ax + by = c
4. Point–Slope Formula
• If we know– (1) the slope m of a line and– (2) a point P = (x1, y1) on the line
• then we can use• The Point–Slope Formula• y − y1 = m(x − x1)
• to find the equation of the line
5. Point–Slope Example
• Problem. Find the equation of the line that passes throughthe point (2,3) and has the slope m = 1
2.
• Solution. In the Point–Slope Formula– (1) the slope m = 1
2and
– (2) the point P = (2, 3) on the line• Plugging these into the Point–Slope Formula• y − y1 = m(x − x1) yields• y − 3 = 1
2(x − 2)
• y − 3 = 1
2x − 1
• y = 1
2x + 2
6. Slope
• Problem: How to find the slope of a line:– If you know two points P = (x1, y1) and Q =
(x2, y2)– Subtract: y2 − y1

3
– Subtract: x2 − x1
– Now divide: slope =y2 − y1
x2 − x1
• Example: Find the slope of the line through the points• P = (1, 2) and Q = (3, 8)
7. Graph
(1,2)
(3,8)
s
s
���������������
���
��
��
slope =8 − 2
3 − 1=
6
2= 3
8. Line thru Two Points
• Problem. Find the equation of the line passing throughthe points (1, 2) and (3, 8)
• Solution. Once we know the slope
• m =8 − 2
3 − 1=
6
2= 3
• we can plug m = 3 and P = (1, 2) into the Point–SlopeFormula

4
• y − y1 = m(x − x1) to get• y − 2 = 3(x − 1)• y − 2 = 3x − 3• y = 3x − 1
9. The Distance Formula
• The distance between two points (x1, y1) and (x2, y2) is givenby
• The Distance Formula
• distance =√
(x2 − x1)2 + (y2 − y1)2
• The distance between (1, 2) and (3, 8) is
• distance =√
(3 − 1)2 + (8 − 2)2
=√
22 + 62
=√
4 + 36
=√
40
10. Converting Celcius to Fahrenheit
• Note that Celsius and Centigrade are interchangable• They refer to the metric system measurement of tempera-
ture• The problem in converting temperature is that the 0 points
are different in the two systems– 0 meters = 0 inches– Both signify no length– 0 square meters = 0 square yards– Both signify no area– But 0 degrees centigrade = 32 degrees Fahrenheit

5
– the freezing point of water
11. Celcius to Fahrenheit Cont’d
• You cannot just multiply centigrade temperature by a con-version factor to get the Fahrenheit temperature
• You must adjust for the fact that the zero point are different• The conversion is represented by a line in the plane• The x–values are degrees Centigrade• The y–values are degrees Fahrenheit
12. Celcius to Fahrenheit Cont’d
• We know two points on this line.• Freezing point of water
– 0◦ Centigrade = 32◦ Fahrenheit– So (0, 32) is a point on the line
• Boiling point of water– 100◦ Centigrade = 212◦ Fahrenheit– So (100, 212) is another point on the line

6
13. Graph of the Line
sDegrees Centigrade
Degrees
Fahrenheit
(0,32)
(100,212)212
100
s
s
14. Finding the Equation
• The slope of this line is
• m =212 − 32
100 − 0=
180
100=
9
5
• The equation for our line is
• F =9
5C + b
• To determine the constant b,
• Plug in the point C = 0, F = 32:

7
• 32 =9
5× 0 + b
• So b = 32 and
• F =9
5C + 32
15. Converting Temperatures
• F =9
5C + 32
• You are visiting Paris, France, and the a sign says the tem-perature is 16◦
• Since France uses the metric system, you know this temper-ature is in Centigrade
• What’s the temperature in Fahrenheit?• Use the Formula• F = 9
5× 16 + 32 = 60.8
• or about 61 degrees.
16. A Practical Rule of Thumb
• The problem with this method is– No one remembers the formula.– The fractions are hard to compute in your head.
• Here’s an easier method:• Use the formula F = 2C + 30• For the previous problem, if C = 16, then• F = 2 × 16 + 30 = 62• This answer is very close to the correct answer of 60.8

8
17. Comparing the Lines
sDegrees Centigrade
Degrees
Fahrenheit
(0,32)
(100,212)212
100
s
s
F = 9
5C + 32
F = 2C + 30
18. Zooming In to Normal Temps
10 20 30 40
40
50
60
70
80
90
100
t
Degrees Centigrade
Degrees
Fahrenheit
(0,32)
100
t
F=9
5C+32
F=2C+30

9
19. Conclusion
As can be seen from the graph, for temperatures between 0 and30 Centigrade, the second formula
F = 2C + 30
is accurate to within 2 degrees.
20. Linear Versus Nonlinear
• Many functions are linear, that is, their graphs are straightlines.
• Example: You work at an hourly wage of $6.50. Thenyour weekly salary is linear, as a function of the number ofhours worked:– On your first hour, you make $6.50.– On your second hour, you make $6.50.– On your 19th hour, you make $6.50.
• In general, your salary is
Salary = 6.5 × hours worked
21. Some Non-Linear Functions
• The interest you pay on your mortgage is not linear.• It is very large at the beginning of your loan and tapers off
toward the end.• The Dow Jones Average is not linear.• It fluctuates from day to day.• When you drive a car, the distance you travel is not linear
(with respect to time) unless you are using “cruise control”• The temperature in DeKalb is not linear.

10
22. PT Cruiser
Example: Road & Track Magazine tested Chrysler’s PT Cruiser.
• They needed 131 feet to stop the car from a speed of 60mph.
• They needed 232 feet to stop the car from a speed of 80mph.
• Increasing the speed by 20 mph almost doubles the distanceto stop.
• This is not linear behavior.• Moral: Not all functions are linear
23. Sir Issac Newton
• Sir Issac Newton: inventor of Calculus (and a popular fig-filled cookie):
• Stopping distance increases with the square of the speed.• Stopping Distance = K × Speed2
where K is the (braking) constant.
24. Stopping a PT Cruiser
• Plugging in Distance = 131 and Speed = 60 allows us tosolve for K:
• 131 = K · 602
• Solve for K by dividing by 602:
• K =131
602= .0364
• Stopping Distance = .0364×Speed2

11
25. Newton’s Prediction
• Stopping Distance = .0364×Speed2
• This equation predicts that when Speed = 80, the stoppingdistance will be
• Stopping Distance = .0364× 802 = 232.9• Compare this will the actual value found by Road & Track’s
test drivers:• Stopping distance at 80 mph was 232 feet.• Way to go, Newton.• Not bad for a guy who predated the automobile by 200
years.
26. Stopping Distance Table
SpeedStopping
Distance5 .910 3.615 8.220 14.625 22.730 32.835 44.640 58.245 73.750 91.0
SpeedStopping
Distance55 110.160 13165 153.770 178.375 204.780 232.985 262.990 294.895 328.4100 363.9
27. Stopping Distance Graph
Stopping Distance vs. Speed

12
20 40 60 80 100
50
100
150
200
250
300
350
28. Driving Considerations
• If you increase your speed by 5 mph, it requires an addi-tional 4.6 feet to stop if you are going 10 to 15 mph.
• It requires an additional 30 feet to stop if you are going 80to 85 mph.
• This is not a linear function.• It take four times longer to stop from 60 mph than from 30
mph.• It take nine times longer to stop from 90 mph than from 30
mph.• Moral: Don’t tailgate on the interstates.
29. Homework and Quiz
• Homework due next week in RecitationPersonal Finance Section V.3 page 301.
• Note: The homework has been changed;so check the new homework list on line.

13
• Miniquiz 3:1 pt What’s your name, Z-number, and Recitation SectionNumber?
• 2 pts You borrow $11,000 to buy a car. Your car paymentsare $275 per month and the length of the loan is 4 years.
What is the total amount of interest you are paying?
30. Math 101
Linear Systems of Equation
Professor Richard Blecksmith
Dept. of Mathematical Sciences
Northern Illinois University
Math 101 Website: http://math.niu.edu/∼richard/Math101
Section 2 Website: http://math.niu.edu/∼richard/Math101/fall06
31. Correct Homework List
Ch 0.2 page 15. 1acegi, 2abcd, 3ac
Ch 0.4 page 27. 1ac, 5abc
IV.3 page 224. 1, 2
III.1 page 164. 7abcd
IV.1 page 205. 6, 8abcdf, 17, 23, 25, 29
III.2 page 173. 1, 3, 7, 8, 9, 22
14
This homework is due on Wednesday, Sept 27, the day of Test1.
32. Slope from the equation
• Suppose you have an equation for the line:• Case 1. If the equation looks like
– y = mx + b
– then m is the slope.• Examples 1. The slope of y = 2x + 3 is
2.
• Examples 2. The slope of y = −3
4x +
1
2is
−3
4.
33. Case 2
• Case 2. If the equation looks like
ax + by = c
• Solve for y to find the slope.• Example. To find the slope of the line 2x + 3y = 6• Move 2x to right: 3y = −2x + 6
• Divide by 3: y =−2x + 6
3= −
2
3x + 2
• The slope is −2
3
34. Connection to Geometry
Given two lines.
• If they have different slopes, then they intersect.

15
• If they have the same slope, then they are parallel.• Unless they are the same line.• See Homework III.1, page 164, #7 e and g.
35. Homework page 164 Problem 7e
Determine whether the following two lines intersect, are paral-lel, or are the same line:
{
3x + 5y = 15
x − 3y = 9
• Find the slope of Line 1.
• 3x + 5y = 15 can be rewritten
– 5y = −3x + 15 or– y = −3
5x + 3
• So the first line has slope −3
5
36. Problem 7e Cont’d
• Find the slope of Line 2.• x − 3y = 9 can be rewritten
– 3y = x − 9 or– y = 1
3x − 3
• So the second line has slope 1
3
• Since these slopes are different, the lines intersect.

16
37. Picture
r
Line 1
Line 2
38. Homework page 164 Problem 7g
Determine whether the following two lines intersect, are paral-lel, or are the same line:
{
y = x − 6
3y − 3x = 0
• Find the slope of Line 1.
• We see immediately that y = x − 6 has slope 1.
• Find the slope of Line 2.
• 3y − 3x = 0 can be rewritten
– 3y = 3x or– y = x
• So the second line has slope 1

17
39. Problem 7g Cont’d
• Since these slopes are the same, but the equations– y = x − 6 and– y = x
• are different, the lines are parallel.
40. Picture
r Line 1
Line 2
41. Where do two Lines Cross?
Determine where the following two lines intersect:
{
3x + 5y = 15
x − 3y = 9

18
• The Addition–Subtraction Method
• Multiply the two equations by appropriate numbers so that
• When they are added (or subtracted)
• One of the variables drops out of the equation.
42. Problem #7e Revisited
• Step 1. Write the equations.– (1) 3x + 5y = 15– (2) x − 3y = 9
• Step 2. Multiply so that x drops out– (1) 3x + 5y = 15– 3 × (2) 3x − 9y = 27– Subtract 0x + 14y = −12
• So y = −12
14= −
6
7
43. Problem #7e Cont’d
• Step 3. Plug back into original equation (2)– x − 3y = 9
– x − 3(
−6
7
)
= 9
– x +18
7= 9
– x = 9 −18
7=
63
7−
18
7=
45
7
• Step 4. Write down the solution:

19
• x =45
7, y = −
6
7,
44. Picture
u
Line 1
Line 2
(
45
7,−6
7
)
u
45. Peach Problem #20, Page 166
Brenda decides to sell the peaches from her backyard to thewomen in the neighborhood. She sells Mrs. Jones 10 large peachesand 15 small peaches for $9.50. She sells Mrs. Williams 15 largepeaches and 10 small peaches for $10.50. How much does shecharge for a small and a large peach?
46. Problem #20, Page 166
• Step 1. Make the variables.– L = the price of a large peach– S = the price of a small peach
• Step 2. Write the equations.– (1) 10L + 15S = 9.5– (2) 15L + 10S = 10.5
• Step 3. Solve for one of the variables.– 3 × (1) 30L + 45S = 28.5– 2 × (2) 30L + 20S = 21

20
– Subtract 0L + 25S = 7.5
• So S =7.5
25= .30
47. Problem #20 Cont’d
• Step 4. Plug back into original equation (1)– 10L + 15 × .30 = 9.50– 10L + 4.50 = 9.50– 10L = 5.00– L = .50
• Step 5. Write down the solution:• A large peach costs 50 cents; a small peach costs 30 cents.
48. Math 101
Linear Programming Problems
Professor Richard Blecksmith
Dept. of Mathematical Sciences
Northern Illinois University
Math 101 Website: http://math.niu.edu/∼richard/Math101
Section 2 Website: http://math.niu.edu/∼richard/Math101/fall06
49. Solving Inequalities
You solve inequalities the way you solve equations:

21
Algebra Rule Equation Inequality
2x − 5 = 3 2x − 5 ≤ 3
Add 5 to both sides 2x = 8 2x ≤ 8
Divide by 2 x = 4 x ≤ 4
With One Important Difference...
50. The Inequality Trap
Consider the following
Algebra Rule Equation Inequality
−3x + 2 = −4 −3x + 2 ≥ −4
Subtract 2 −3x = −6 −3x ≥ −6
Divide by −3 x = 2 x≤ 2
Why did the inequality change from
“greater than” (≥) to “less than” (≤) ?
22
51. The Negative Rule for Inequalities
When multiplying or dividing an inequality by a negative number,the direction of the inequality changes.
• Multiply 2 < 3 by −7:• Solution: −14 > −21• 14 below zero is warmer than 21 below zero• Divide −3x ≥ −6 by −3:• Solution: x ≤ 2• Check. Try value of x less than 2:
– x = 1 satisfies −3(1) ≥ −6– x = 0 satisfies −3(0) ≥ −6– x = −2 satisfies −3(−2) ≥ −6
52. Graphing a Line in Standard Form
Graph the line x + 2y = 6
• Step a. Find x–intercept.– When y = 0,– x + 0 = 6 =⇒ x = 6– So x–intercept is (6, 0)
• Step b. Find y–intercept.– When x = 0,– 0 + 2y = 6 =⇒ y = 3– So y–intercept is (0, 3)
53. Plot and Graph
• Step c. Draw line.– Mark the points (6, 0) and (0, 3) on your graph paper.– Using a ruler, draw a line through these two points.

23
– This is the line x + 2y = 6.
54. Graph of the Line
v
(6,0)
(0,3)
v
vHHHHHHHHHHHHHHHHHHHHHHHH
HHLine: x + 2y = 6
55. Graphing an Inequality
• Graph the inequality x + 2y ≤ 6• Fact: This inequality is a halfplane, whose edge is the line
x + 2y = 6, which we just graphed.• Idea: To determine which halfplane it is (above or below
the line), try a test point, usually (0, 0).– Is 0 + 0 ≤ 6?– Yes. So the halfplane x + 2y ≤ 6 contains (0, 0) and
therefore lies below the line x + 2y = 6.

24
56. Graph of the Halfplane
v
(6,0)
(0,3)
v
vHHHHHHHHHHHHHHHHHHHHHHHH
HHHalfplane: x + 2y ≤ 6
57. Systems of Inequalities
Sketch the region determined by the following set of inequali-ties:
• x + y ≤ 16• 5x + 2y ≤ 50• y ≤ 12• x ≥ 0, y ≥ 0
58. Halfplane 1: x + y ≤ 16
• Step a. Find x–intercept.– When y = 0,– x + 0 = 16 =⇒ x = 16– So x–intercept is (16, 0)
• Step b. Find y–intercept.– When x = 0,– 0 + y = 16 =⇒ y = 16
25
– So y–intercept is (0, 16)
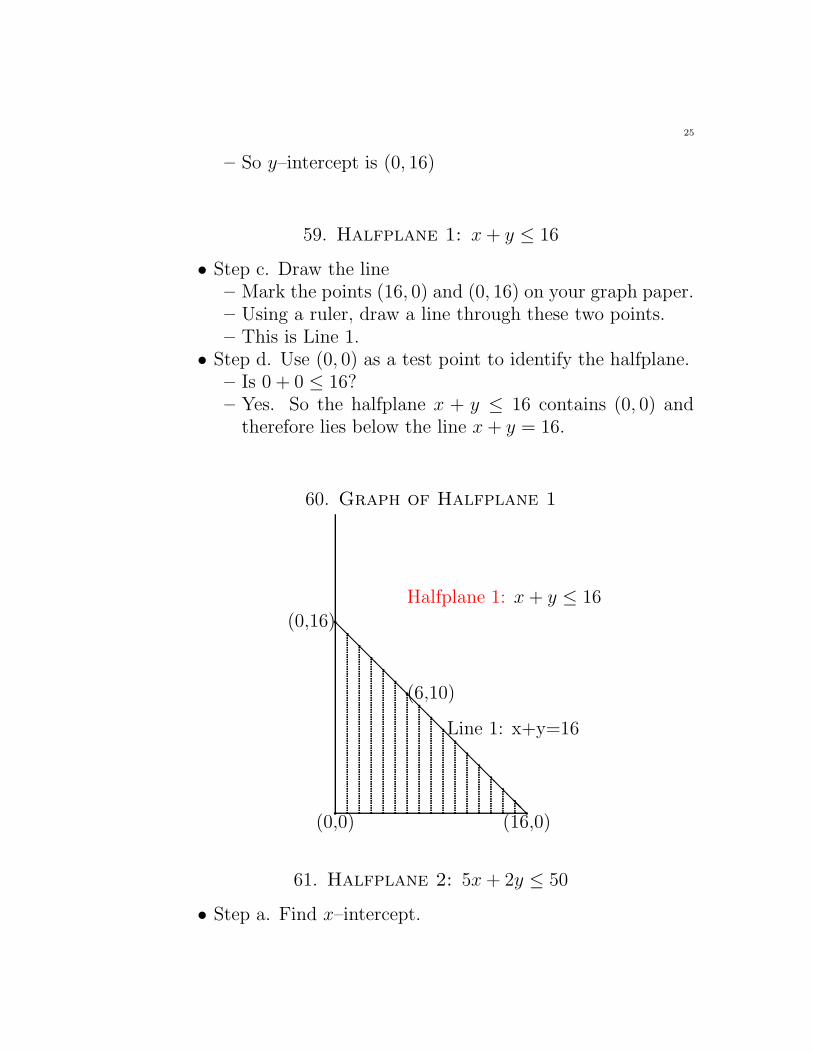
59. Halfplane 1: x + y ≤ 16
• Step c. Draw the line– Mark the points (16, 0) and (0, 16) on your graph paper.– Using a ruler, draw a line through these two points.– This is Line 1.
• Step d. Use (0, 0) as a test point to identify the halfplane.– Is 0 + 0 ≤ 16?– Yes. So the halfplane x + y ≤ 16 contains (0, 0) and
therefore lies below the line x + y = 16.
60. Graph of Halfplane 1
(0,0)q
@@
@@
@@
@@
@@
@@
@@@
Line 1: x+y=16
(16,0)
(0,16)
q
q
(6,10)q
Halfplane 1: x + y ≤ 16
61. Halfplane 2: 5x + 2y ≤ 50
• Step a. Find x–intercept.
26
– When y = 0,– 5x + 0 = 50 =⇒ x = 10– So x–intercept is (10, 0)
• Step b. Find y–intercept.– When x = 0,– 0 + 2y = 50 =⇒ y = 25– So y–intercept is (0, 25)
62. Halfplane 2: 5x + 2y ≤ 50
• Step c. Draw line– Mark the points (10, 0) and (0, 25) on your graph paper.– Using a ruler, draw a line through these two points.– This is Line 2.
• Step d. Use (0, 0) as a test point to identify the halfplane.– Is 0 + 0 ≤ 50?– Yes. So the halfplane 5x + 2y ≤ 50 contains (0, 0) and
therefore lies below the line 5x + 2y = 50.

27
63. Graph of Halfplane 2
(0,0)q
LLLLLLLLLLLLLLLLLLLLLLL
Line 2: 5x+2y=50
(10,0)
(0,25)
q
q
Halfplane 2: 5x + 2y ≤ 50
64. Where do Line 1 and Line 2 intersect?
• Step a. Write the equations:
•(1) 5x + 2y = 50
(2) x + y = 16• Step b. Solve for one of the variables.
•original(1) 5x + 2y = 50
2 × (2) 2x + 2y = 32
Subtract 3x = 18
• So x =18
3= 6
65. Interesection Cont’d
• Step c. Solve for the other variable.
28
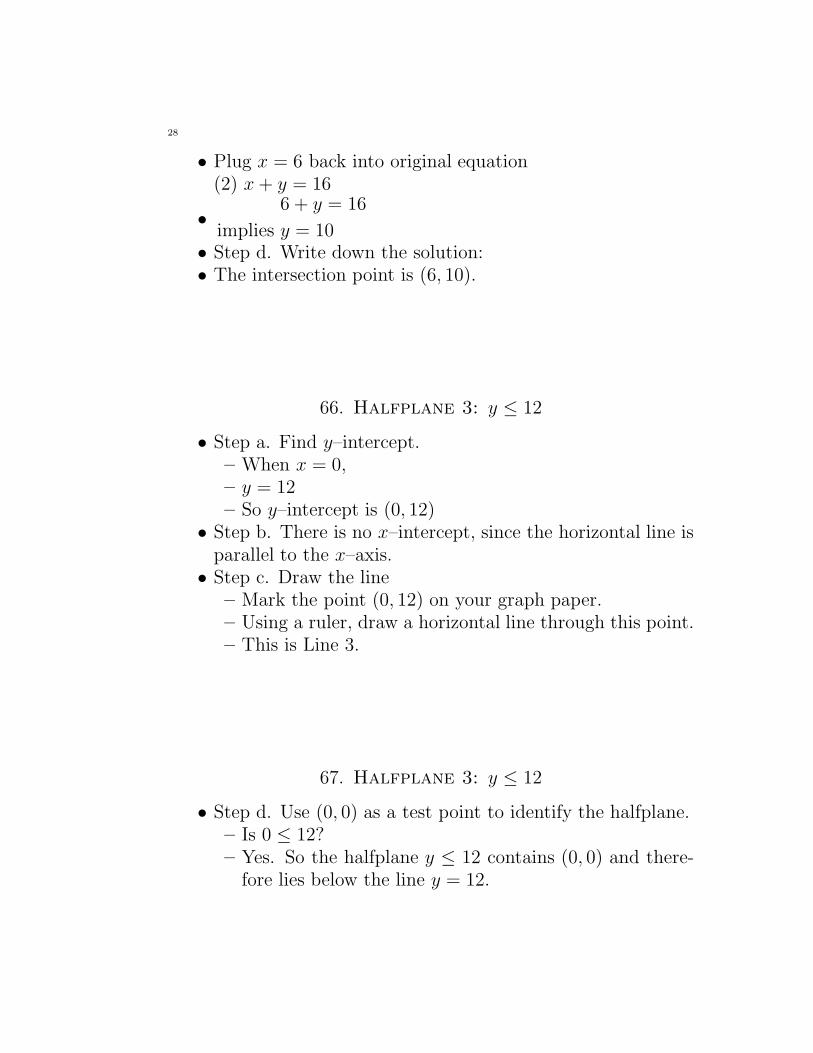
• Plug x = 6 back into original equation(2) x + y = 16
•6 + y = 16
implies y = 10• Step d. Write down the solution:• The intersection point is (6, 10).
66. Halfplane 3: y ≤ 12
• Step a. Find y–intercept.– When x = 0,– y = 12– So y–intercept is (0, 12)
• Step b. There is no x–intercept, since the horizontal line isparallel to the x–axis.
• Step c. Draw the line– Mark the point (0, 12) on your graph paper.– Using a ruler, draw a horizontal line through this point.– This is Line 3.
67. Halfplane 3: y ≤ 12
• Step d. Use (0, 0) as a test point to identify the halfplane.– Is 0 ≤ 12?– Yes. So the halfplane y ≤ 12 contains (0, 0) and there-
fore lies below the line y = 12.

29
68. Graph of Halfplane 3
(0,0)q
(0,12)Line: y=12
q
Halfplane 3: y ≤ 12
69. Where do Line 1 and Line 3 intersect?
• Step a. Write the equations:
•(1) x + y = 16
(2) y = 12• Step b. Plug y = 12 into equation (1)
•x + 12 = 16
=⇒ x = 4• Step c. Write down the solution:• The intersection point is (4, 12).
70. Putting it all together
• Step a. Graph Line 1, using the points (16, 0) and (0, 16)• Step b. Graph Line 2, using the points (10, 0) and (0, 25)• Step c. Graph Line 3, the horizontal line through the point
(0, 12)

30
• Step d. Label the corner points (6, 10), (4, 12), (0, 16),(10, 0), and (0, 0)
• Step e. Shade in the intersection of the 3 halfplanes.
71. Graph
(0,0)q
@@
@@
@@
@@
@@
@@
@@@
Line 1: x+y=16
(16,0)
(0,16)
q
q
LLLLLLLLLLLLLLLLLLLLLLL
Line 2: 5x+2y=50
(10,0)
(0,25)
q
q
(0,12) (4, 12) Line: y=12qq
(6,10)q
72. Linear Programming Problems
A linear programming problems has the form:
• Maximize an objective function– usually profit– or revenue
• subject to certain conditions– usually resource– or time constraints
• The objective function and the restraining conditions areall linear, that is no squares or worse.

31
73. Solving Linear Programming Problems
• The feasible region is the set of points satisfying the con-straining equations.
• This region will consist of the intersection of halfplanes,whose respective lines meet in corner points of the region.
• When the feasible set is finite, the maximum (or minimum)is found by the following
Linear Programming Rule:
Maximums (and minimums) occur at corner points
74. Linear Programming Example
• So to find the maximum (or minimum) we simply evaluatethe objective function at all the corner points of the feasibleregion.
• Maximize P = 7x + 5y subject to the following set of in-equalities:– x + y ≤ 16– 5x + 2y ≤ 50– y ≤ 12– x ≥ 0, y ≥ 0
• We have seen that the corner points are(0, 0), (0, 16), (4, 12), (6, 10), and (10, 0)

32
75. Solving the Problem
x y P = 7x + 5y0 0 00 12 604 12 886 10 9210 0 70
Maximum value of P is
• 92 and occurs at the point (6, 10)
Note: The minimum value is 0 at the point (0, 0)
76. Construction Problem
A contractor builds two types of homes: the standard modeland the deluxe model. The standard model requires one lot,$12,000 capital, 150 labor-days to build, and is sold for a profitof $2400. The deluxe model requires one lot, $32,000 capital, 200labor-days to build, and is sold for a profit of $3400. The con-tractor has 150 lots. The bank is willing to loan him $2,880,000for the project and he has a maximum labor force available of24,000 labor-days. How many houses should he build to realizethe greatest profit?
77. Set the Variables
Let
33
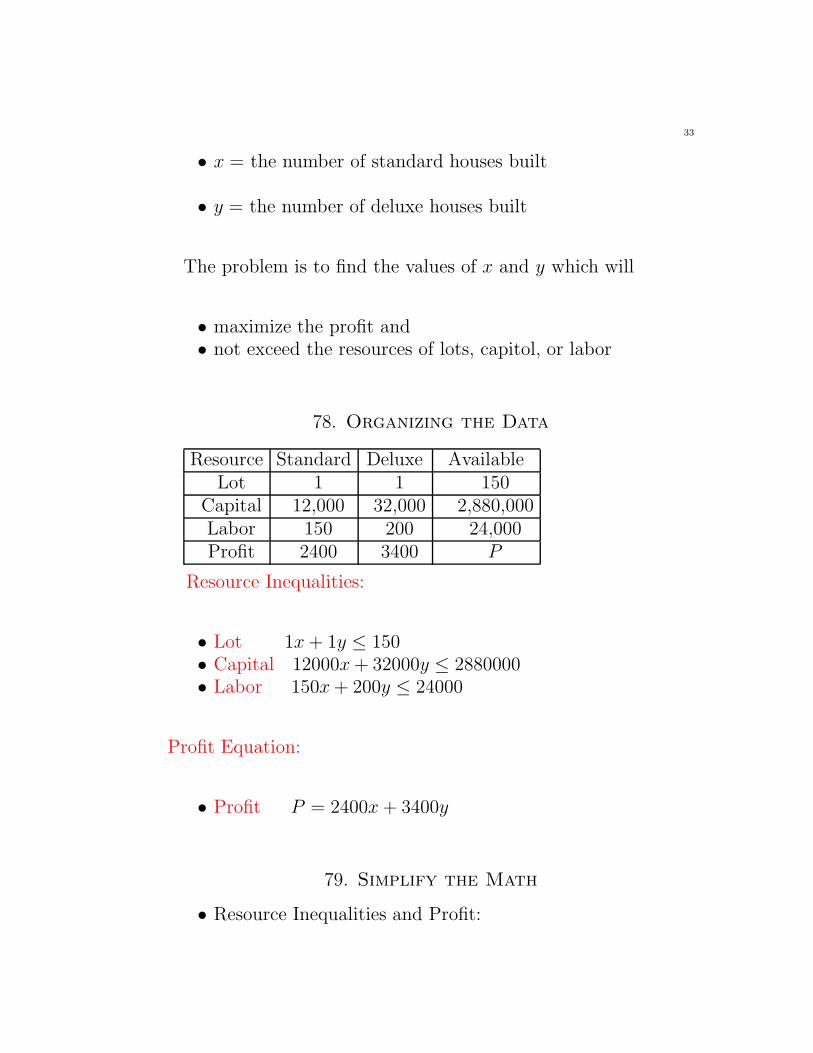
• x = the number of standard houses built
• y = the number of deluxe houses built
The problem is to find the values of x and y which will
• maximize the profit and• not exceed the resources of lots, capitol, or labor
78. Organizing the Data
Resource Standard Deluxe AvailableLot 1 1 150
Capital 12,000 32,000 2,880,000Labor 150 200 24,000Profit 2400 3400 P
Resource Inequalities:
• Lot 1x + 1y ≤ 150• Capital 12000x + 32000y ≤ 2880000• Labor 150x + 200y ≤ 24000
Profit Equation:
• Profit P = 2400x + 3400y
79. Simplify the Math
• Resource Inequalities and Profit:

34
– Lot 1x + 1y ≤ 150– Capital 12000x + 32000y ≤ 2880000– Labor 150x + 200y ≤ 24000– Profit P = 2400x + 3400y
• Math Simplification– Divide Capital Inequality by 4000– Divide Labor Inequality by 50
• Simplified Equations:– Lot x + y ≤ 150– Capital 3x + 8y ≤ 720– Labor 3x + 4y ≤ 480– Profit P = 2400x + 3400y
80. Graph
(0,0)q
Lot x + y = 150
(150,0)
(0,150)
q
q
Capitol 3x+8y=720
(240,0)
(0,90)
q
q
Labor 3x+4y=480
(160,0)
(0,120)
q
q
81. Where do Capitol and Labor Lines Cross?
• Write the equations:

35
Capitol 3x + 8y = 720
Labor 3x + 4y = 480
Subtract 4y = 240
• Divide by 4:
• So y =240
4= 60
• Plug y = 60 back into the Labor equation 3x + 4y = 480
82. Capitol and Labor Line Intersection
3x + 4 · 60 = 480
3x + 240 = 480
3x = 480 − 240 = 240
x = 240
3= 80
• The intersection point is (80, 60).
83. Where do Labor and Lot Lines Intersect?
• Write the equations:
Labor 3x + 4y = 480
Lot x + y = 150
36
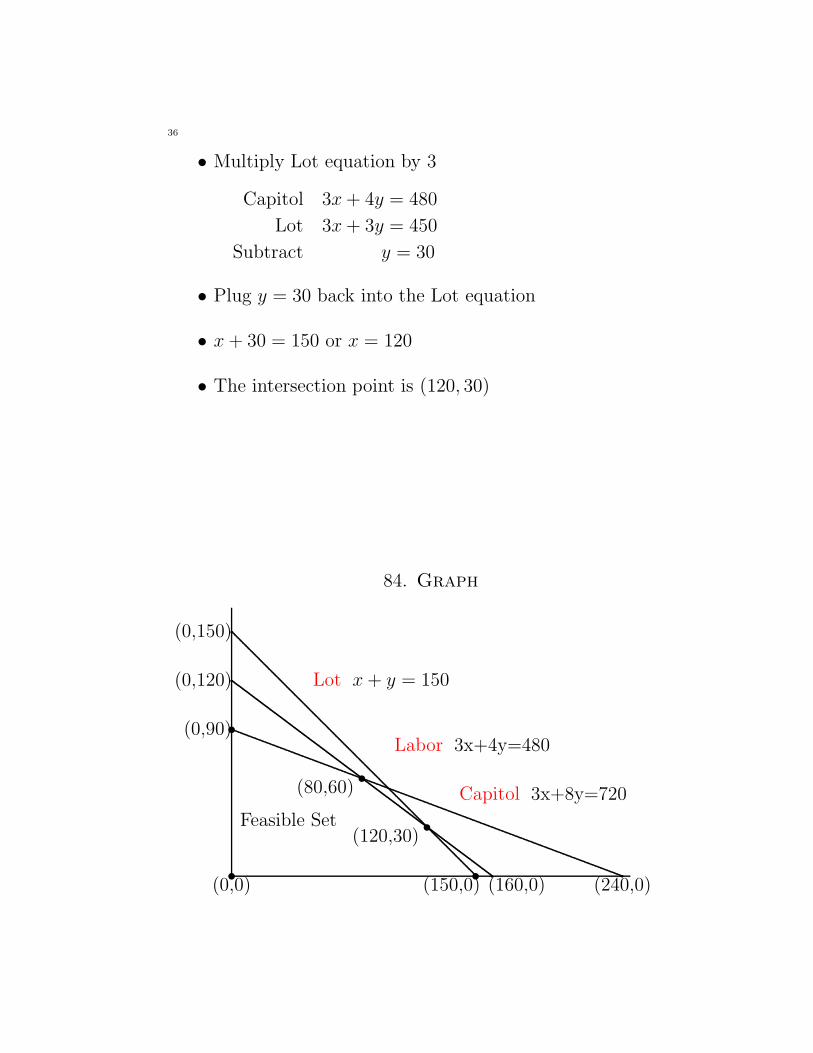
• Multiply Lot equation by 3
Capitol 3x + 4y = 480
Lot 3x + 3y = 450
Subtract y = 30
• Plug y = 30 back into the Lot equation
• x + 30 = 150 or x = 120
• The intersection point is (120, 30)
84. Graph
(0,0)t
Lot x + y = 150
(150,0)
(0,150)
t
q
Capitol 3x+8y=720
(240,0)
(0,90)
q
t
Labor 3x+4y=480
(160,0)
(0,120)
q
q
(80,60)
(120,30)
t
tFeasible Set

37
85. Solving the Problem
x y P = 2400x + 3400y0 0 00 90 $306,00080 60 $396,000120 30 $390,000150 0 $360,000
Maximum Profit
• 80 standard• 60 deluxe• $396,000 profit• Note: 10 lots are unused
86. Homework and Quiz
• Homework due next week in Class on Wednesday• Turn it in when you hand in your exam.• Assigned Sections: 0.2, 0.4, IV.3, III.1, IV.1, III.2• Check the homework list on line.
• Miniquiz 3:1 pt What’s your name, Z-number, and Recitation SectionNumber?
• 2 pts Find the equation of the line through the points (1, 2)and (3, 6). Write your answer in the form y = mx + b.