Embed Size (px)
Citation preview
© 2012 Graphic Packaging International, Inc.
Graphic Packaging International, Inc.
Investor Presentation
September 2012
Consumer Packaging Solutions that Make a World of Difference
© 2012 Graphic Packaging International, Inc. 2
Graphic Packaging at a Glance
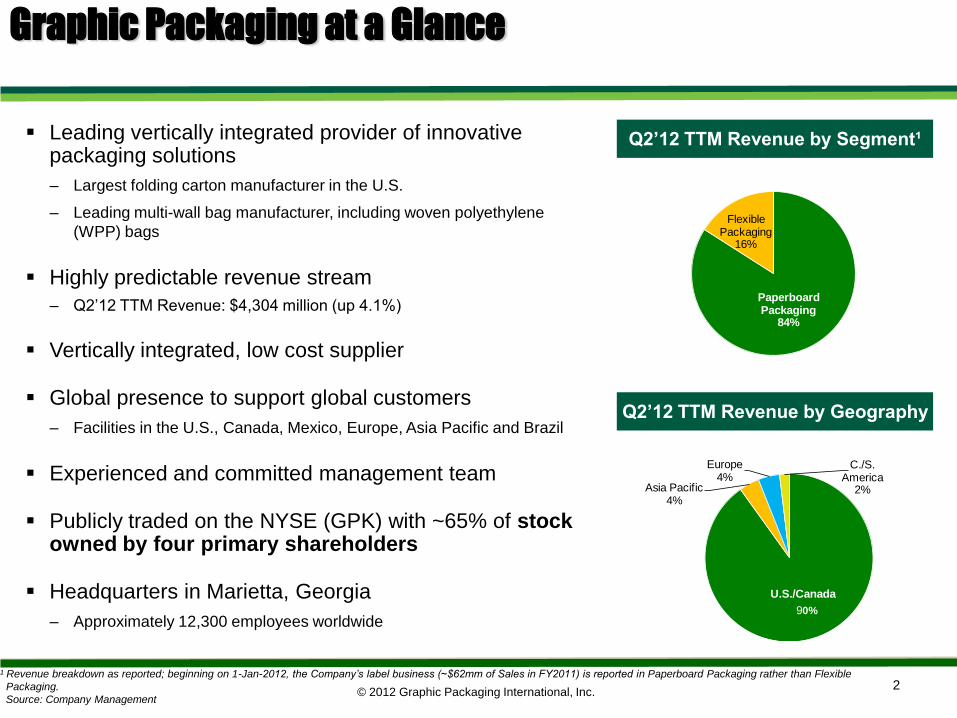
Leading vertically integrated provider of innovative packaging solutions
– Largest folding carton manufacturer in the U.S.
– Leading multi-wall bag manufacturer, including woven polyethylene
(WPP) bags
Highly predictable revenue stream
– Q2‘12 TTM Revenue: $4,304 million (up 4.1%)
Vertically integrated, low cost supplier
Global presence to support global customers
– Facilities in the U.S., Canada, Mexico, Europe, Asia Pacific and Brazil
Experienced and committed management team
Publicly traded on the NYSE (GPK) with ~65% of stock owned by four primary shareholders
Headquarters in Marietta, Georgia
– Approximately 12,300 employees worldwide
Q2’12 TTM Revenue by Segment¹
Q2’12 TTM Revenue by Geography
¹ Revenue breakdown as reported; beginning on 1-Jan-2012, the Company’s label business (~$62mm of Sales in FY2011) is reported in Paperboard Packaging rather than Flexible
Packaging.
Source: Company Management
Flexible Packaging
16%
PaperboardPackaging
84%
90%
Asia Pacific4%
Europe4%
C./S.America
2%
U.S./Canada
© 2012 Graphic Packaging International, Inc. 3
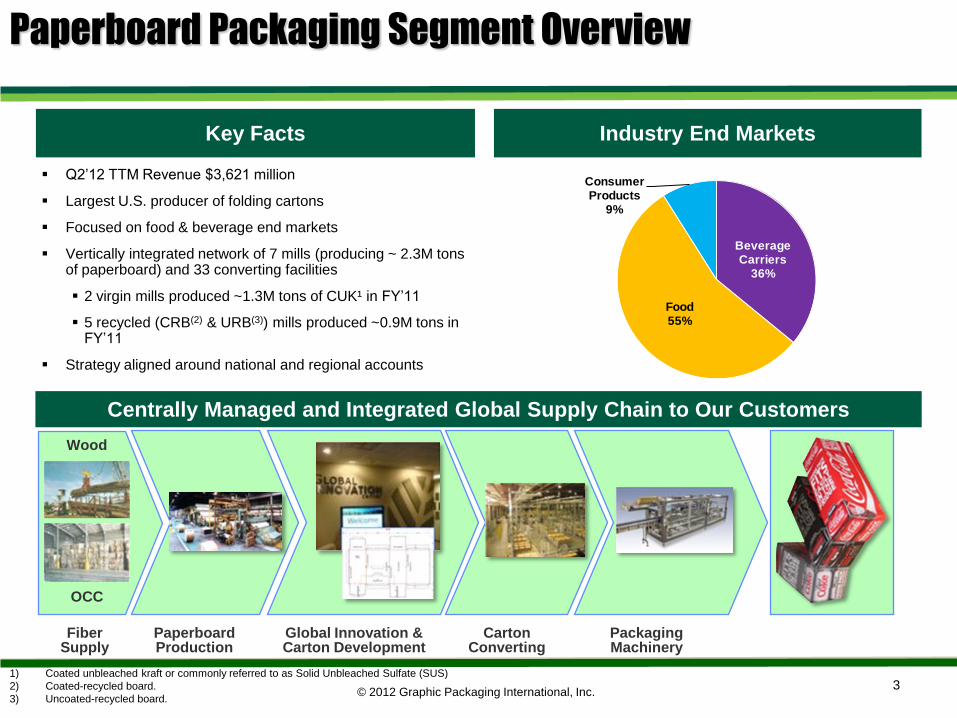
Beverage Carriers
36%
Food55%
Consumer Products
9%
Centrally Managed and Integrated Global Supply Chain to Our Customers
Q2‘12 TTM Revenue $3,621 million
Largest U.S. producer of folding cartons
Focused on food & beverage end markets
Vertically integrated network of 7 mills (producing ~ 2.3M tons of paperboard) and 33 converting facilities
2 virgin mills produced ~1.3M tons of CUK¹ in FY‘11
5 recycled (CRB(2) & URB(3)) mills produced ~0.9M tons in FY‘11
Strategy aligned around national and regional accounts
Industry End Markets Key Facts
Fiber Supply
Packaging Machinery
Carton Converting
Global Innovation & Carton Development
Paperboard Production
Wood
OCC
1) Coated unbleached kraft or commonly referred to as Solid Unbleached Sulfate (SUS)
2) Coated-recycled board.
3) Uncoated-recycled board.
Paperboard Packaging Segment Overview
© 2012 Graphic Packaging International, Inc. 4
Industry End Markets Key Facts
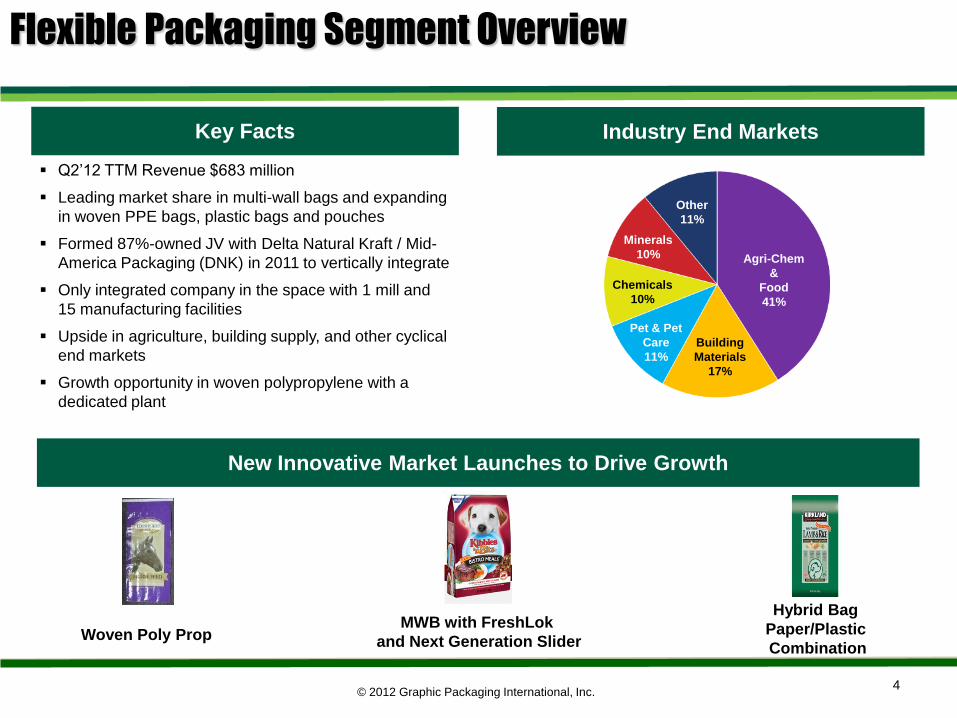
Agri-Chem
&
Food
41%
Building
Materials
17%
Pet & Pet
Care
11%
Chemicals
10%
Minerals
10%
Other
11%
New Innovative Market Launches to Drive Growth
Woven Poly Prop MWB with FreshLok
and Next Generation Slider
Hybrid Bag
Paper/Plastic
Combination
Q2‘12 TTM Revenue $683 million
Leading market share in multi-wall bags and expanding
in woven PPE bags, plastic bags and pouches
Formed 87%-owned JV with Delta Natural Kraft / Mid-
America Packaging (DNK) in 2011 to vertically integrate
Only integrated company in the space with 1 mill and
15 manufacturing facilities
Upside in agriculture, building supply, and other cyclical
end markets
Growth opportunity in woven polypropylene with a
dedicated plant
Flexible Packaging Segment Overview
© 2012 Graphic Packaging International, Inc. 5
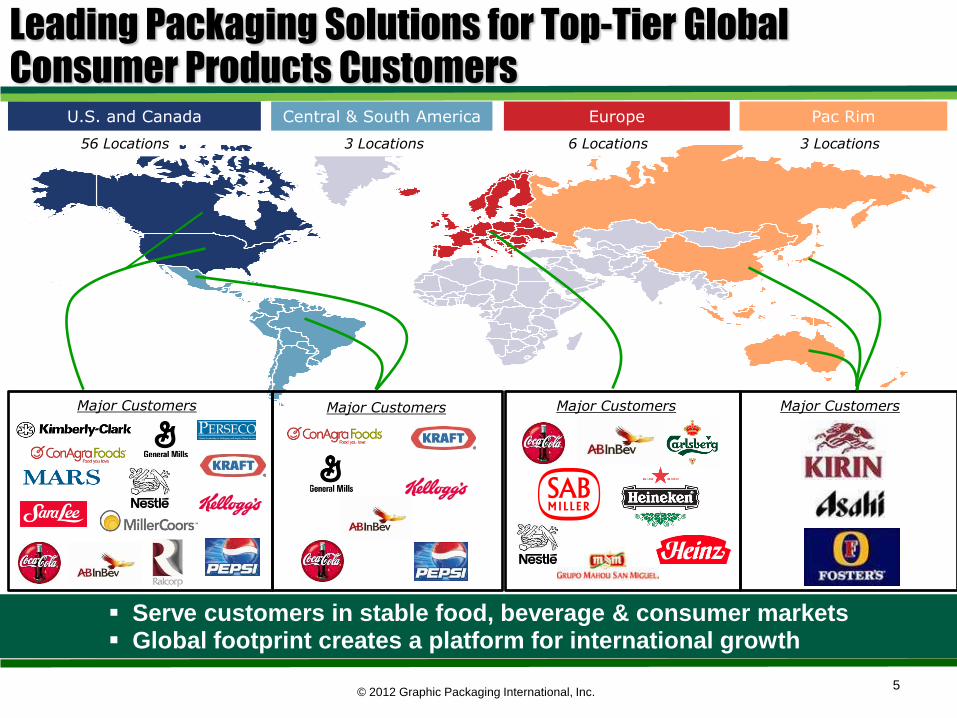
Major Customers
56 Locations 3 Locations 6 Locations 3 Locations
Major Customers Major Customers Major Customers
Leading Packaging Solutions for Top-Tier Global Consumer Products Customers
Serve customers in stable food, beverage & consumer markets Global footprint creates a platform for international growth
U.S. and Canada Central & South America Europe Pac Rim
© 2012 Graphic Packaging International, Inc.
GPK
35%
RKT
26%
Paperworks
11%
Other
28%
6
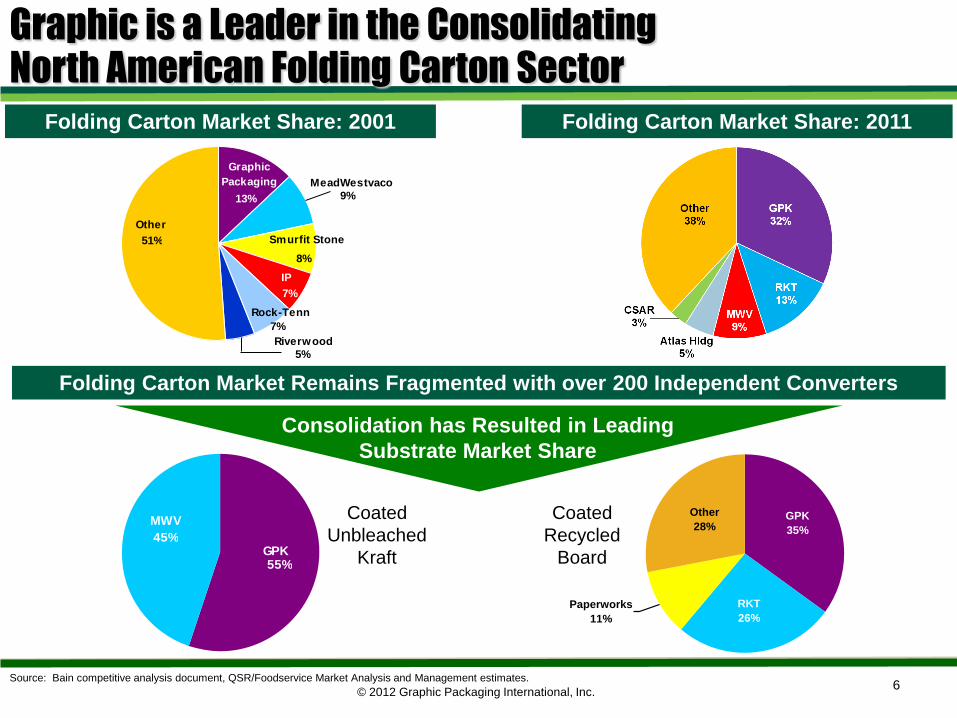
Graphic is a Leader in the Consolidating North American Folding Carton Sector
Folding Carton Market Share: 2001 Folding Carton Market Share: 2011
Source: Bain competitive analysis document, QSR/Foodservice Market Analysis and Management estimates.
Coated
Recycled
Board
Coated
Unbleached
Kraft
Other
Riverwood
Rock-Tenn
IP
Smurfit Stone
MeadWestvaco
Graphic
Packaging
13% 9%
8%
7%
7%
5%
51%
Consolidation has Resulted in Leading
Substrate Market Share
MWV
GPK55%
45%
Folding Carton Market Remains Fragmented with over 200 Independent Converters
© 2012 Graphic Packaging International, Inc.
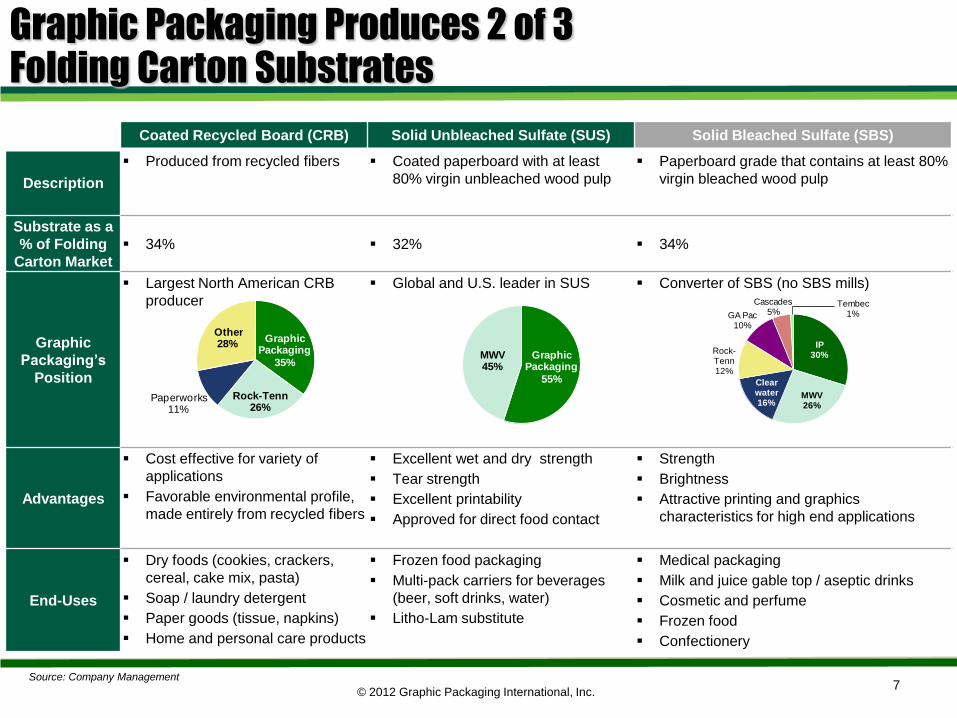
Coated Recycled Board (CRB) Solid Unbleached Sulfate (SUS) Solid Bleached Sulfate (SBS)
Description
Produced from recycled fibers
Coated paperboard with at least
80% virgin unbleached wood pulp
Paperboard grade that contains at least 80%
virgin bleached wood pulp
Substrate as a
% of Folding
Carton Market
34% 32% 34%
Graphic
Packaging’s
Position
Largest North American CRB
producer
Global and U.S. leader in SUS Converter of SBS (no SBS mills)
Advantages
Cost effective for variety of
applications
Favorable environmental profile,
made entirely from recycled fibers
Excellent wet and dry strength
Tear strength
Excellent printability
Approved for direct food contact
Strength
Brightness
Attractive printing and graphics
characteristics for high end applications
End-Uses
Dry foods (cookies, crackers,
cereal, cake mix, pasta)
Soap / laundry detergent
Paper goods (tissue, napkins)
Home and personal care products
Frozen food packaging
Multi-pack carriers for beverages
(beer, soft drinks, water)
Litho-Lam substitute
Medical packaging
Milk and juice gable top / aseptic drinks
Cosmetic and perfume
Frozen food
Confectionery
7
Graphic Packaging
35%
Rock-Tenn26%
Paperworks11%
Other28%
Graphic Packaging
55%
MWV45%
IP30%
Clearwater16%
Rock-Tenn12%
GA Pac10%
Cascades5%
Tembec1%
MWV26%
Graphic Packaging Produces 2 of 3 Folding Carton Substrates
Source: Company Management
© 2012 Graphic Packaging International, Inc.
(6.2%)
(12.1%)
(11.1%)
(8.0%)
(3.4%)
(0.6%) (0.3%)
0.6% 0.3%
Total Retail & Food
Services
Auto Furnishings Electronics, Appliances
Clothing Sporting Goods,
Hobbies, Book & Music
General Merchandise
Food Services &
Drinking
Grocery & Liquor
8
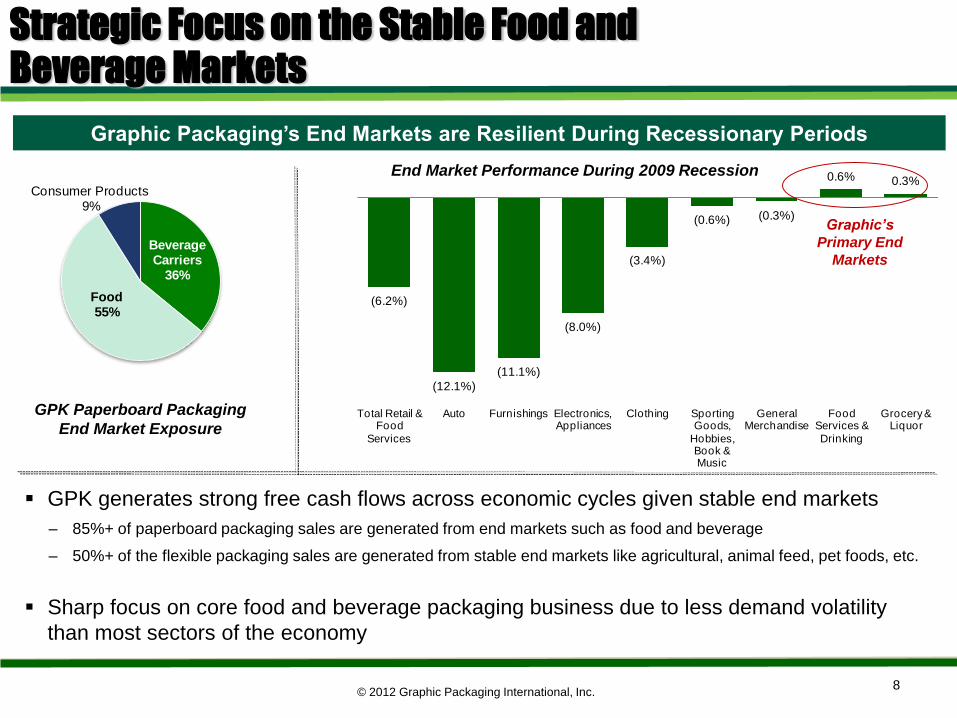
Strategic Focus on the Stable Food and Beverage Markets
Graphic Packaging’s End Markets are Resilient During Recessionary Periods
GPK Paperboard Packaging
End Market Exposure
End Market Performance During 2009 Recession
Graphic’s
Primary End
Markets Beverage Carriers
36%
Food55%
Consumer Products 9%
GPK generates strong free cash flows across economic cycles given stable end markets
– 85%+ of paperboard packaging sales are generated from end markets such as food and beverage
– 50%+ of the flexible packaging sales are generated from stable end markets like agricultural, animal feed, pet foods, etc.
Sharp focus on core food and beverage packaging business due to less demand volatility
than most sectors of the economy
© 2012 Graphic Packaging International, Inc. 9
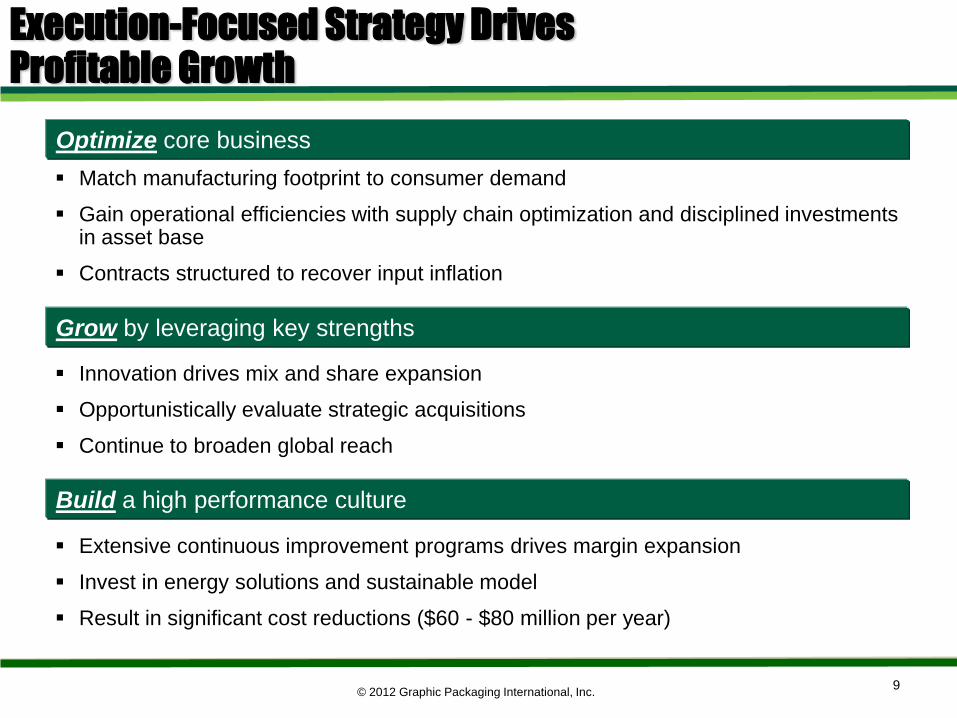
Execution-Focused Strategy Drives Profitable Growth
Match manufacturing footprint to consumer demand
Gain operational efficiencies with supply chain optimization and disciplined investments in asset base
Contracts structured to recover input inflation
Innovation drives mix and share expansion
Opportunistically evaluate strategic acquisitions
Continue to broaden global reach
Extensive continuous improvement programs drives margin expansion
Invest in energy solutions and sustainable model
Result in significant cost reductions ($60 - $80 million per year)
Optimize core business
Grow by leveraging key strengths
Build a high performance culture
© 2012 Graphic Packaging International, Inc.
10
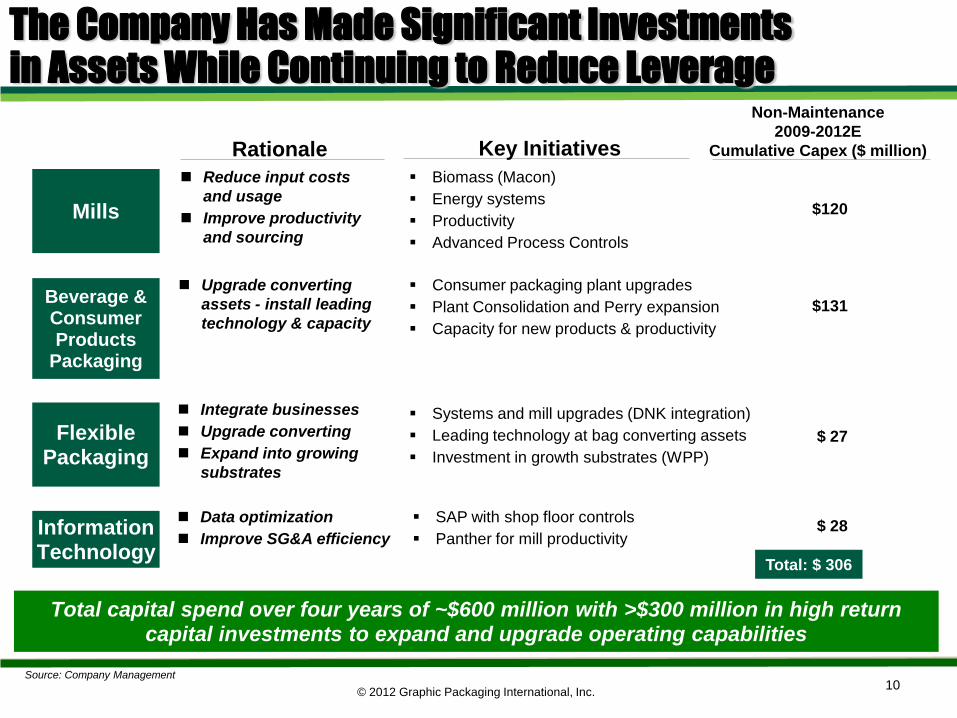
Mills
Biomass (Macon)
Energy systems
Productivity
Advanced Process Controls
The Company Has Made Significant Investments in Assets While Continuing to Reduce Leverage
Beverage & Consumer Products
Packaging
Flexible Packaging
Information Technology
Key Initiatives
Non-Maintenance
2009-2012E
Cumulative Capex ($ million)
$120
Consumer packaging plant upgrades
Plant Consolidation and Perry expansion
Capacity for new products & productivity
$131
Systems and mill upgrades (DNK integration)
Leading technology at bag converting assets
Investment in growth substrates (WPP)
$ 27
SAP with shop floor controls
Panther for mill productivity $ 28
Total capital spend over four years of ~$600 million with >$300 million in high return capital investments to expand and upgrade operating capabilities
Rationale
Reduce input costs
and usage
Improve productivity
and sourcing
Upgrade converting
assets - install leading
technology & capacity
Integrate businesses
Upgrade converting
Expand into growing
substrates
Data optimization
Improve SG&A efficiency
Total: $ 306
Source: Company Management
© 2012 Graphic Packaging International, Inc. 11
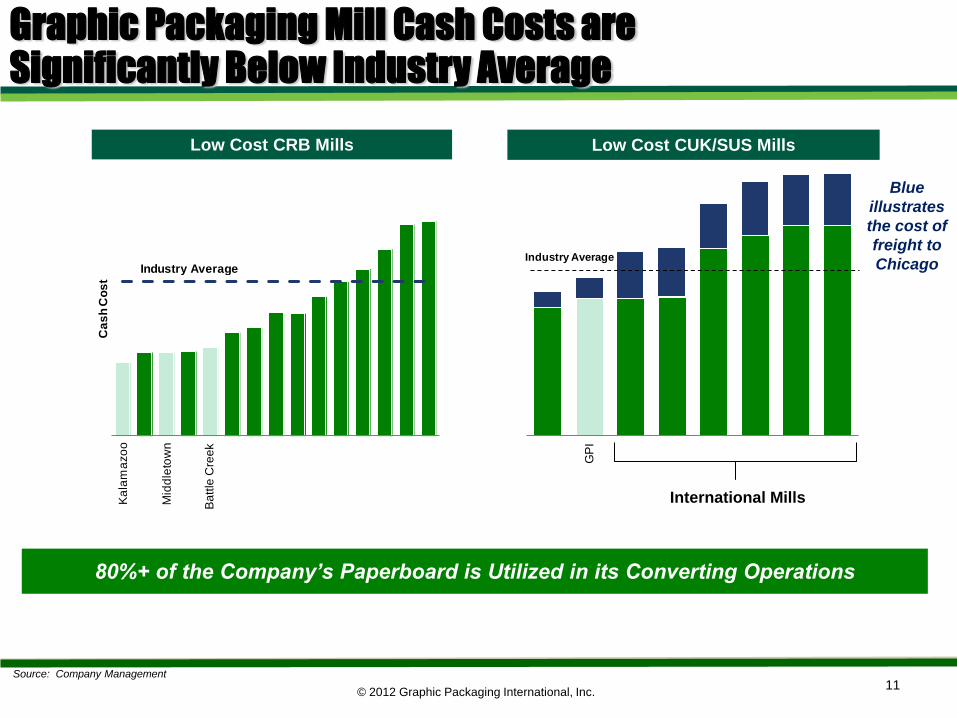
Low Cost CRB Mills Low Cost CUK/SUS Mills
International Mills
Blue
illustrates
the cost of
freight to
Chicago
Graphic Packaging Mill Cash Costs are Significantly Below Industry Average
Source: Company Management
80%+ of the Company’s Paperboard is Utilized in its Converting Operations G
PI
Industry Average
Ka
lam
azo
o
Mid
dle
tow
n
Ba
tle
Cre
ek
Ca
sh
Co
st
Industry Average
Ba
ttle
Cre
ek
© 2012 Graphic Packaging International, Inc.
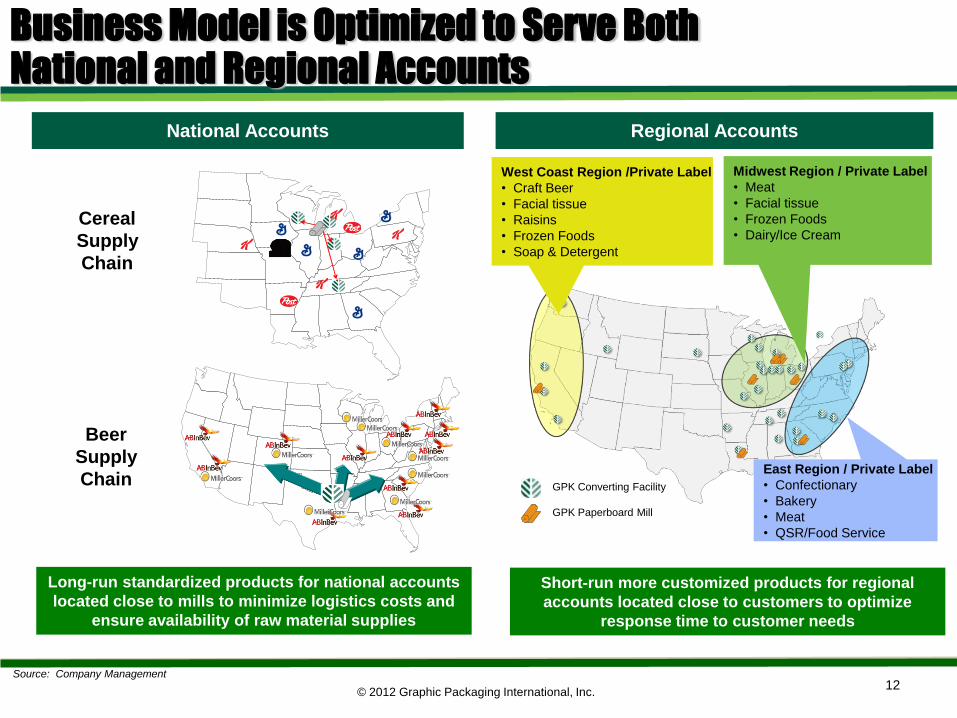
GPK Converting Facility
GPK Paperboard Mill
West Coast Region /Private Label
• Craft Beer
• Facial tissue
• Raisins
• Frozen Foods
• Soap & Detergent
Midwest Region / Private Label
• Meat
• Facial tissue
• Frozen Foods
• Dairy/Ice Cream
East Region / Private Label
• Confectionary
• Bakery
• Meat
• QSR/Food Service
12
Long-run standardized products for national accounts
located close to mills to minimize logistics costs and
ensure availability of raw material supplies
Short-run more customized products for regional
accounts located close to customers to optimize
response time to customer needs
Beer
Supply
Chain
Cereal
Supply
Chain
Regional Accounts National Accounts
Business Model is Optimized to Serve Both National and Regional Accounts
Source: Company Management
© 2012 Graphic Packaging International, Inc.
13
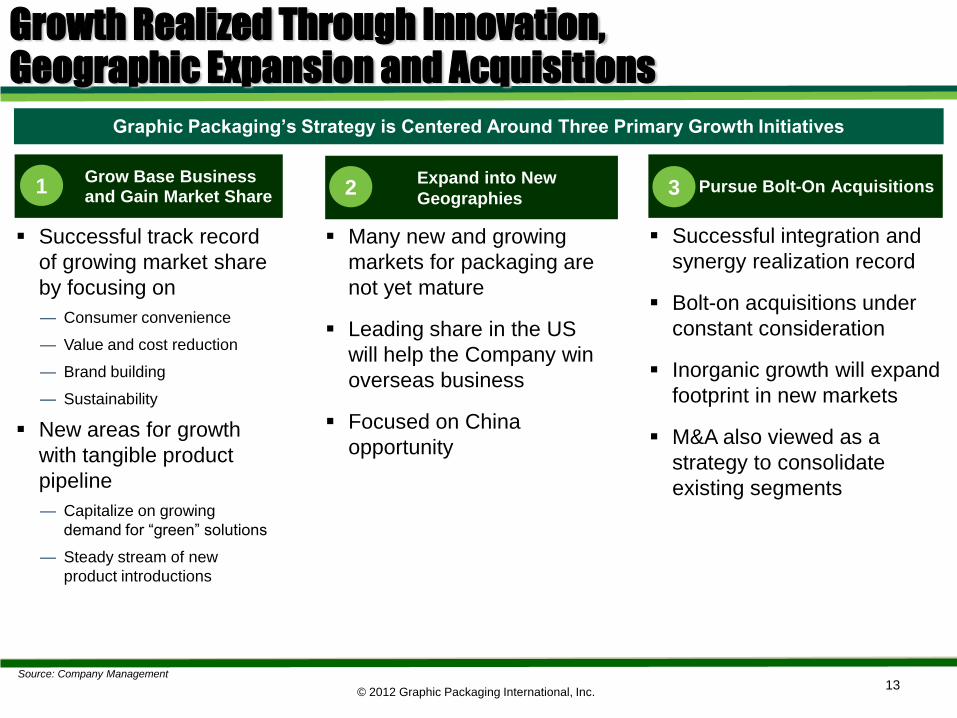
Graphic Packaging’s Strategy is Centered Around Three Primary Growth Initiatives
Grow Base Business and Gain Market Share
Expand into New
Geographies Pursue Bolt-On Acquisitions
Successful track record
of growing market share
by focusing on
— Consumer convenience
— Value and cost reduction
— Brand building
— Sustainability
New areas for growth
with tangible product
pipeline
— Capitalize on growing
demand for ―green‖ solutions
— Steady stream of new
product introductions
Successful integration and
synergy realization record
Bolt-on acquisitions under
constant consideration
Inorganic growth will expand
footprint in new markets
M&A also viewed as a
strategy to consolidate
existing segments
Many new and growing
markets for packaging are
not yet mature
Leading share in the US
will help the Company win
overseas business
Focused on China
opportunity
1 2 3
Growth Realized Through Innovation, Geographic Expansion and Acquisitions
Source: Company Management
© 2012 Graphic Packaging International, Inc.
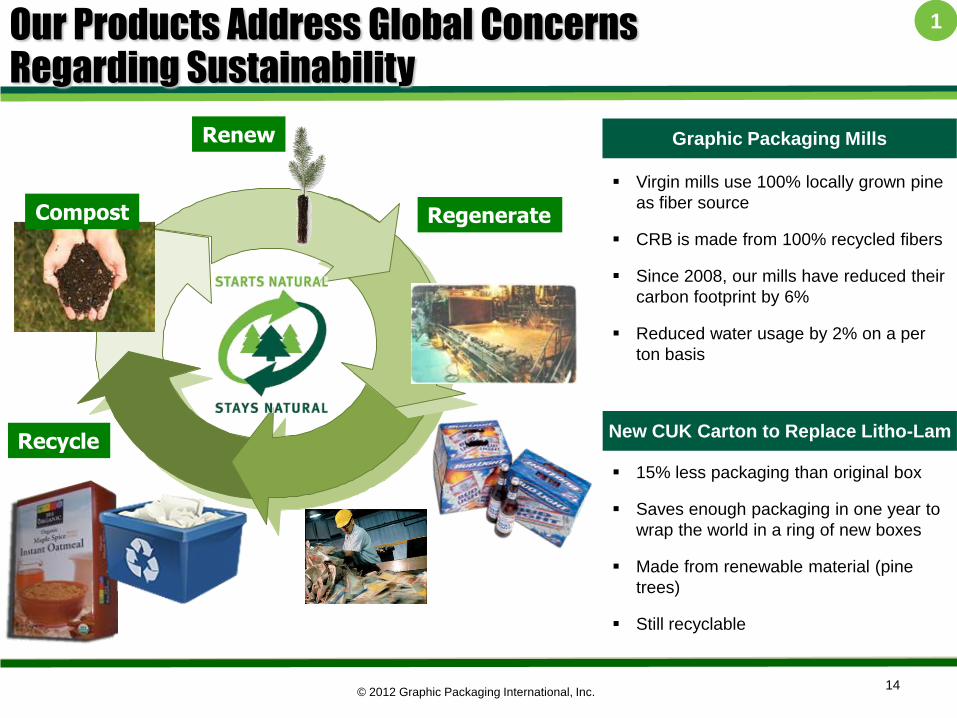
Virgin mills use 100% locally grown pine
as fiber source
CRB is made from 100% recycled fibers
Since 2008, our mills have reduced their
carbon footprint by 6%
Reduced water usage by 2% on a per
ton basis
15% less packaging than original box
Saves enough packaging in one year to
wrap the world in a ring of new boxes
Made from renewable material (pine
trees)
Still recyclable
Renew
Recycle
Regenerate
Our Products Address Global Concerns Regarding Sustainability
Compost
New CUK Carton to Replace Litho-Lam
Graphic Packaging Mills
14
1
© 2012 Graphic Packaging International, Inc.
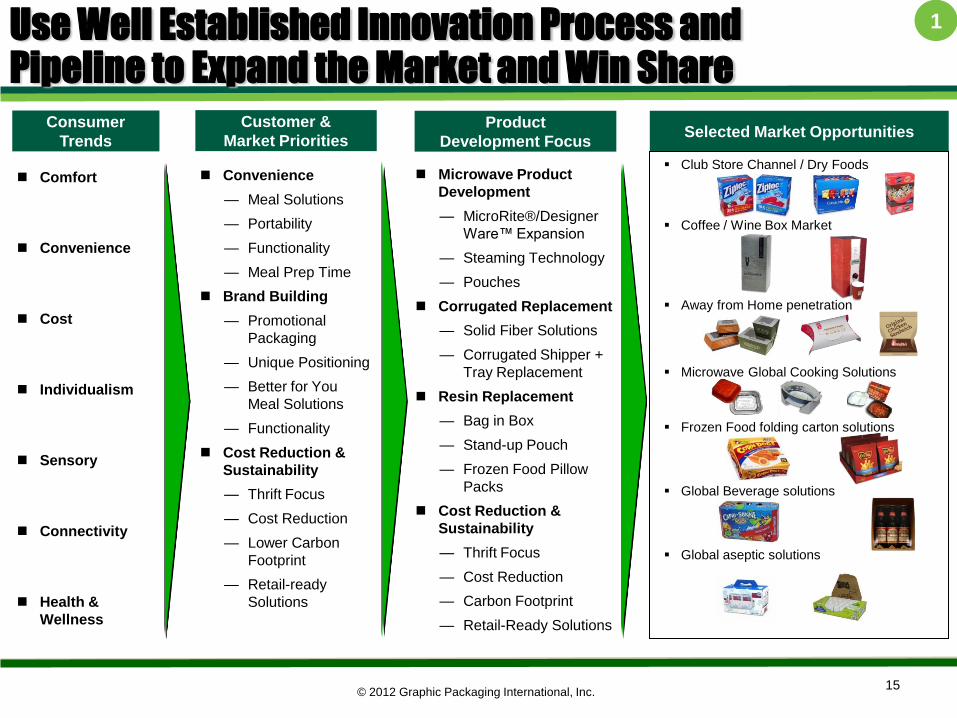
Microwave Product
Development
— MicroRite®/Designer
Ware™ Expansion
— Steaming Technology
— Pouches
Corrugated Replacement
— Solid Fiber Solutions
— Corrugated Shipper +
Tray Replacement
Resin Replacement
— Bag in Box
— Stand-up Pouch
— Frozen Food Pillow
Packs
Cost Reduction &
Sustainability
— Thrift Focus
— Cost Reduction
— Carbon Footprint
— Retail-Ready Solutions
Convenience
— Meal Solutions
— Portability
— Functionality
— Meal Prep Time
Brand Building
— Promotional
Packaging
— Unique Positioning
— Better for You
Meal Solutions
— Functionality
Cost Reduction &
Sustainability
— Thrift Focus
— Cost Reduction
— Lower Carbon
Footprint
— Retail-ready
Solutions
Comfort
Convenience
Cost
Individualism
Sensory
Connectivity
Health &
Wellness
Consumer
Trends
Customer &
Market Priorities Product
Development Focus Selected Market Opportunities
Use Well Established Innovation Process and Pipeline to Expand the Market and Win Share
15
Club Store Channel / Dry Foods
Coffee / Wine Box Market
Away from Home penetration
Microwave Global Cooking Solutions
Frozen Food folding carton solutions
Global Beverage solutions
Global aseptic solutions
1
© 2012 Graphic Packaging International, Inc.
16
2
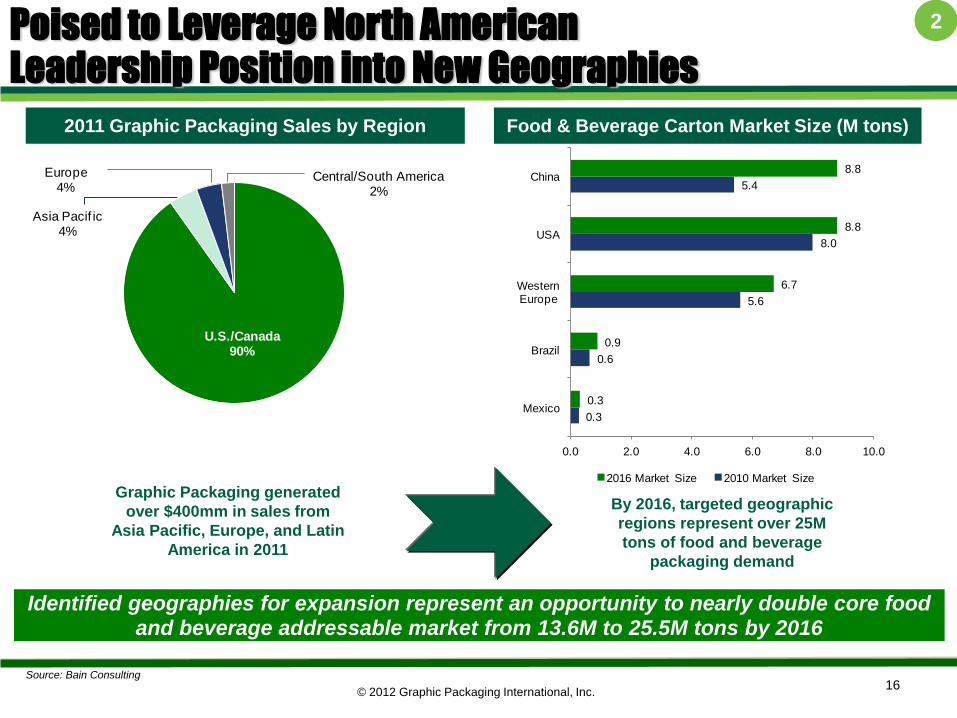
Identified geographies for expansion represent an opportunity to nearly double core food and beverage addressable market from 13.6M to 25.5M tons by 2016
Food & Beverage Carton Market Size (M tons) 2011 Graphic Packaging Sales by Region
0.3
0.6
5.6
8.0
5.4
0.3
0.9
6.7
8.8
8.8
0.0 2.0 4.0 6.0 8.0 10.0
Mexico
Brazil
Western Europe
USA
China
2016 Market Size 2010 Market Size
Graphic Packaging generated
over $400mm in sales from
Asia Pacific, Europe, and Latin
America in 2011
By 2016, targeted geographic
regions represent over 25M
tons of food and beverage
packaging demand
Poised to Leverage North American Leadership Position into New Geographies
Source: Bain Consulting
U.S./Canada90%
Europe4%
Asia Pacif ic4%
Central/South America2%
© 2012 Graphic Packaging International, Inc. 17
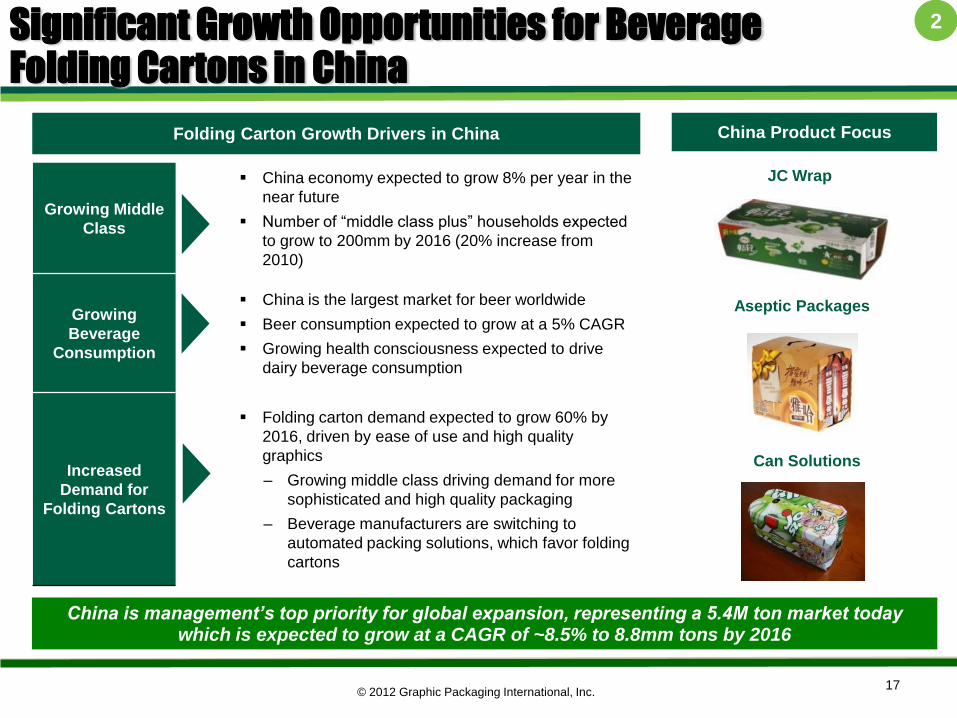
China is management’s top priority for global expansion, representing a 5.4M ton market today which is expected to grow at a CAGR of ~8.5% to 8.8mm tons by 2016
China Product Focus Folding Carton Growth Drivers in China
JC Wrap
Aseptic Packages
Can Solutions
Growing Middle
Class
China economy expected to grow 8% per year in the
near future
Number of ―middle class plus‖ households expected
to grow to 200mm by 2016 (20% increase from
2010)
Growing
Beverage
Consumption
China is the largest market for beer worldwide
Beer consumption expected to grow at a 5% CAGR
Growing health consciousness expected to drive
dairy beverage consumption
Increased
Demand for
Folding Cartons
Folding carton demand expected to grow 60% by
2016, driven by ease of use and high quality
graphics
– Growing middle class driving demand for more
sophisticated and high quality packaging
– Beverage manufacturers are switching to
automated packing solutions, which favor folding
cartons
Significant Growth Opportunities for Beverage Folding Cartons in China
2
© 2012 Graphic Packaging International, Inc. 18
Agri-Chem
&
Food
41%
Other
11%
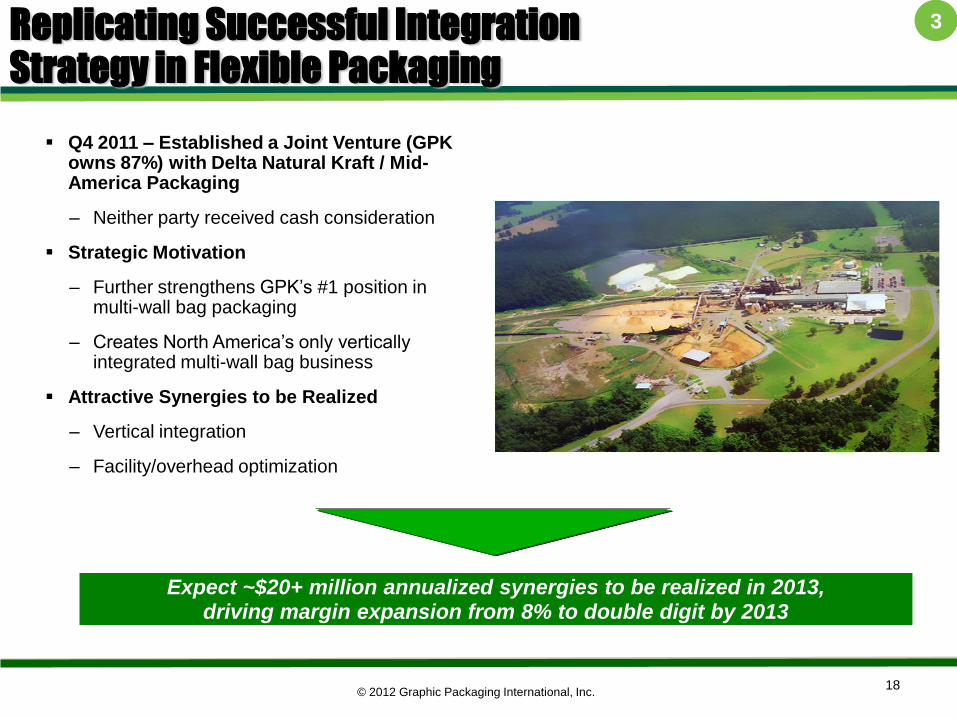
Q4 2011 – Established a Joint Venture (GPK owns 87%) with Delta Natural Kraft / Mid-America Packaging
– Neither party received cash consideration
Strategic Motivation
– Further strengthens GPK‘s #1 position in multi-wall bag packaging
– Creates North America‘s only vertically integrated multi-wall bag business
Attractive Synergies to be Realized
– Vertical integration
– Facility/overhead optimization
Expect ~$20+ million annualized synergies to be realized in 2013, driving margin expansion from 8% to double digit by 2013
3 Replicating Successful Integration Strategy in Flexible Packaging

© 2012 Graphic Packaging International, Inc.
GPI Mills 52 kT 30% External
Sources 123 kT
70%
Kraft Paper Sourcing
in 2011 Kraft Paper Sourcing
in 2013
Outsource 20k – 40k
Strategic tons
Expand Mill
Capacity: Improve
Efficiency and
Reduce Bottlenecks
Open Market
Presence to Balance
Demand
Grow Converting
Volume
Drives
EBITDA
and
Cash Flow GPI Mills
153 kT 88%
External Sources
22 kT 12%
Leverage Kraft
Mill Integration
The Recent Vertical Integration of Supply Chain for Flexible Packaging Provides the Necessary Operational Levers and will Increase Margins in the Near Term
Recent Vertical Integration with Kraft Mills Will Improve Efficiency and Expand Margins
19
3
© 2012 Graphic Packaging International, Inc. 20
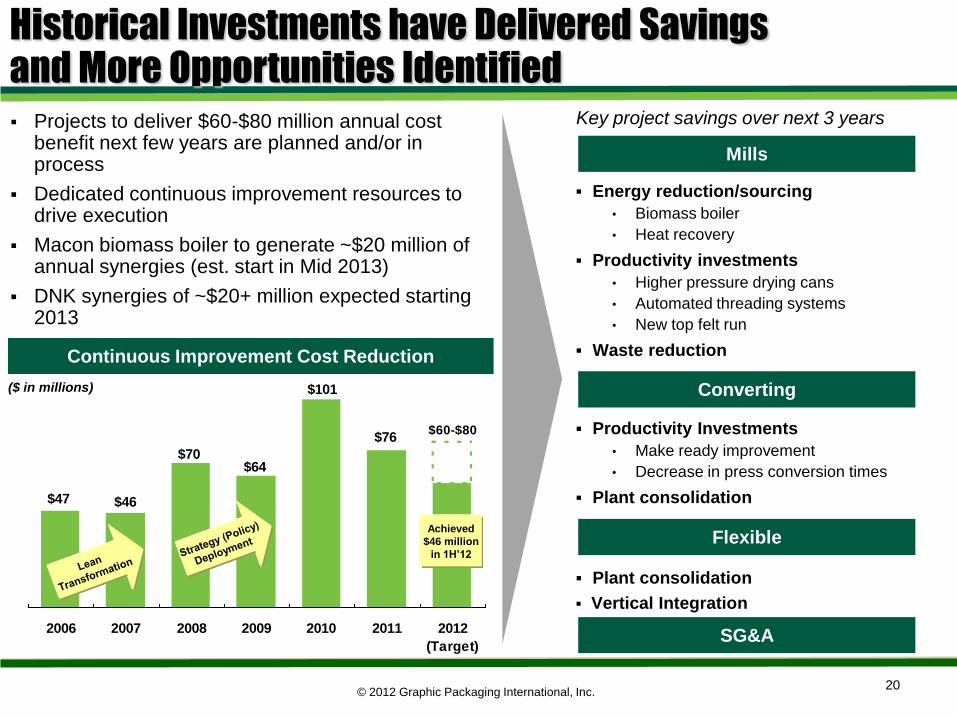
$64$70
$46$47
$101
$76$60-$80
2006 2007 2008 2009 2010 2011
(Prelim)
2012
(Target)
Key project savings over next 3 years
Energy reduction/sourcing
• Biomass boiler
• Heat recovery
Productivity investments
• Higher pressure drying cans
• Automated threading systems
• New top felt run
Waste reduction
Productivity Investments
• Make ready improvement
• Decrease in press conversion times
Plant consolidation
Plant consolidation
Vertical Integration
Mills
Converting
Flexible
Historical Investments have Delivered Savings and More Opportunities Identified
SG&A
Projects to deliver $60-$80 million annual cost benefit next few years are planned and/or in process
Dedicated continuous improvement resources to drive execution
Macon biomass boiler to generate ~$20 million of annual synergies (est. start in Mid 2013)
DNK synergies of ~$20+ million expected starting 2013
Continuous Improvement Cost Reduction
($ in millions)
Achieved
$46 million
in 1H’12
© 2012 Graphic Packaging International, Inc. 21
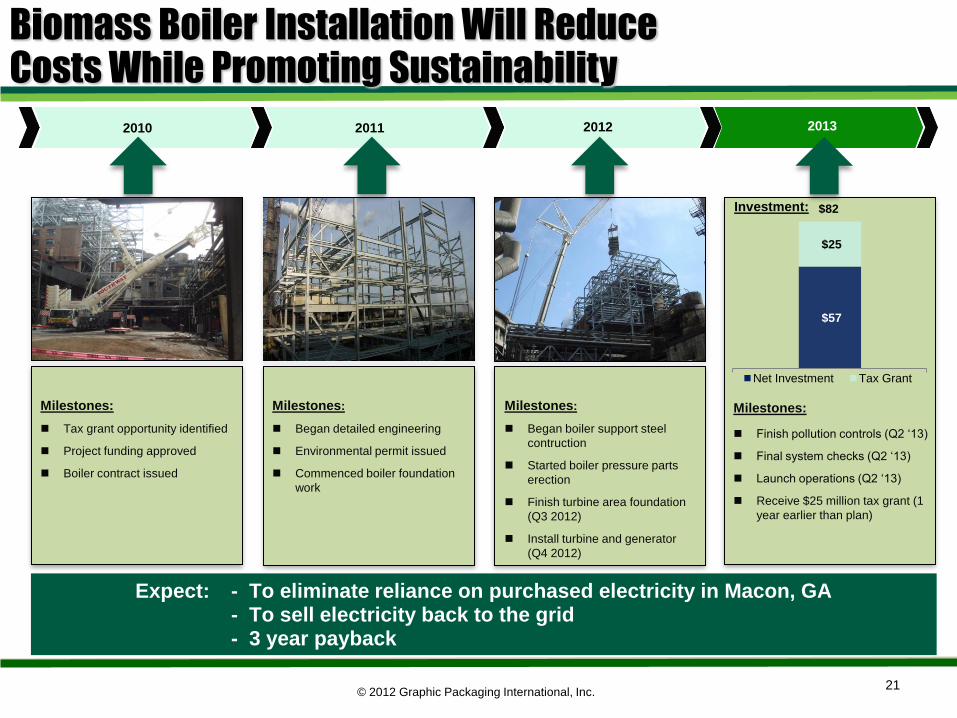
$57
$25
Net Investment Tax Grant
2013 2012 2011 2010
Milestones:
Began boiler support steel
contruction
Started boiler pressure parts
erection
Finish turbine area foundation
(Q3 2012)
Install turbine and generator
(Q4 2012)
Milestones:
Finish pollution controls (Q2 ‗13)
Final system checks (Q2 ‗13)
Launch operations (Q2 ‗13)
Receive $25 million tax grant (1
year earlier than plan)
Milestones:
Tax grant opportunity identified
Project funding approved
Boiler contract issued
Milestones:
Began detailed engineering
Environmental permit issued
Commenced boiler foundation
work
Investment: $82
Biomass Boiler Installation Will Reduce Costs While Promoting Sustainability
Expect: - To eliminate reliance on purchased electricity in Macon, GA - To sell electricity back to the grid - 3 year payback
© 2012 Graphic Packaging International, Inc. 22
Financial Overview
© 2012 Graphic Packaging International, Inc. 23
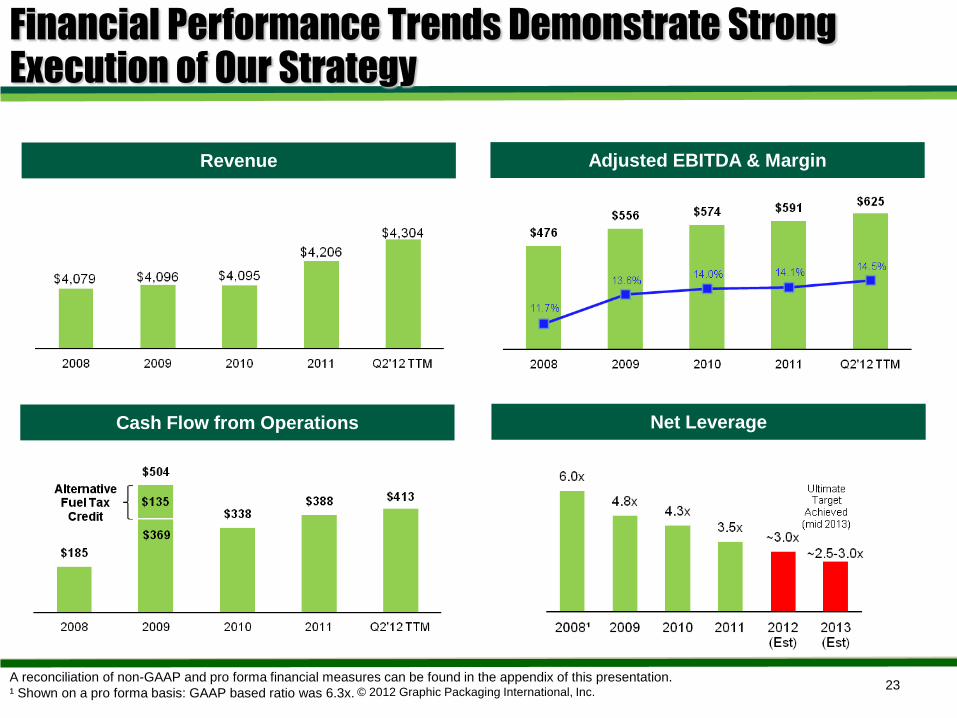
Adjusted EBITDA & Margin
Cash Flow from Operations Net Leverage
Revenue
A reconciliation of non-GAAP and pro forma financial measures can be found in the appendix of this presentation.
¹ Shown on a pro forma basis: GAAP based ratio was 6.3x.
Financial Performance Trends Demonstrate Strong Execution of Our Strategy
© 2012 Graphic Packaging International, Inc. 24
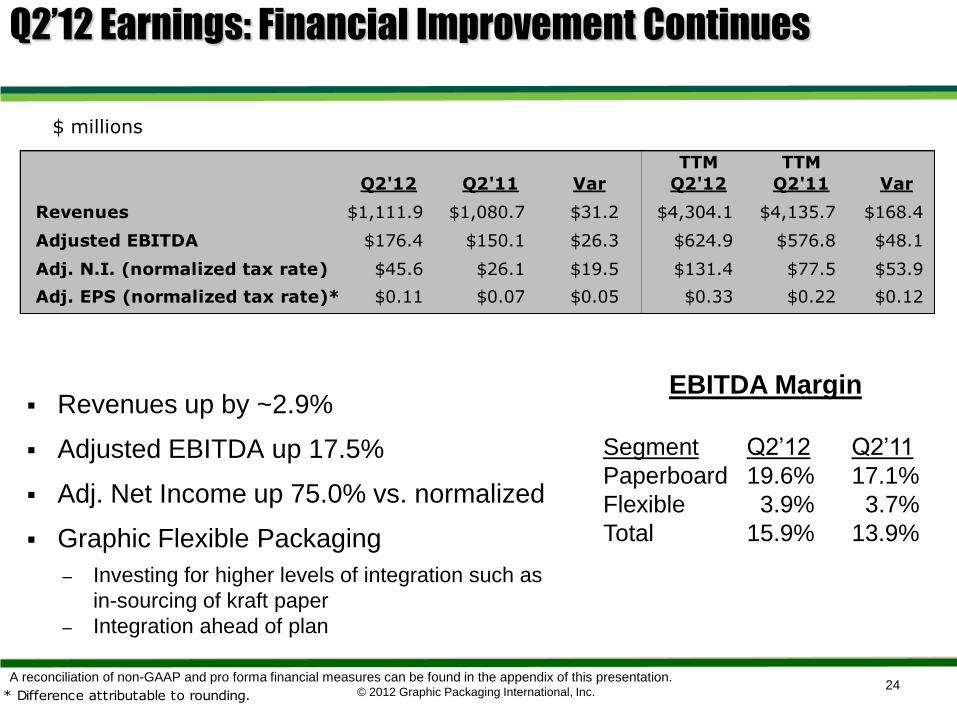
Q2’12 Earnings: Financial Improvement Continues
$ millions
Revenues up by ~2.9%
Adjusted EBITDA up 17.5%
Adj. Net Income up 75.0% vs. normalized
Graphic Flexible Packaging
– Investing for higher levels of integration such as
in-sourcing of kraft paper
– Integration ahead of plan
A reconciliation of non-GAAP and pro forma financial measures can be found in the appendix of this presentation.
EBITDA Margin
Segment Q2‘12 Q2‘11
Paperboard 19.6% 17.1%
Flexible 3.9% 3.7%
Total 15.9% 13.9%
Q2'12 Q2'11 Var
TTM
Q2'12
TTM
Q2'11 Var
Revenues $1,111.9 $1,080.7 $31.2 $4,304.1 $4,135.7 $168.4
Adjusted EBITDA $176.4 $150.1 $26.3 $624.9 $576.8 $48.1
Adj. N.I. (normalized tax rate) $45.6 $26.1 $19.5 $131.4 $77.5 $53.9
Adj. EPS (normalized tax rate)* $0.11 $0.07 $0.05 $0.33 $0.22 $0.12
* Difference attributable to rounding.

© 2012 Graphic Packaging International, Inc. 25
Poised to Continue Performance Improvement A
dj.
EB
ITD
A i
n $
mil
lio
ns
Primed for Continued Improvement
$577
~$81 ~$5
~($88)
~$93
~($14)
$625
~$(29)
200
250
300
350
400
450
500
550
600
650
700
Q2'11 TTM Price Volume/Mix* Commodity Inflation
Labor, Benefit & Other Inflation
Performance FX/Other Q2'12 TTM
Continued investment in product innovation to expand addressable market
Vertical integration drives production optimization
Contractual inflation recovery and ―net purchaser of paperboard‖ position
$60-$80 million annual cost reduction
Strong infrastructure for creating value with ―tuck-under‖ acquisitions
*Includes market related downtime.
Volumes trending in
the right direction
2H’11 1H’12
~($8) ~$13
© 2012 Graphic Packaging International, Inc. 26
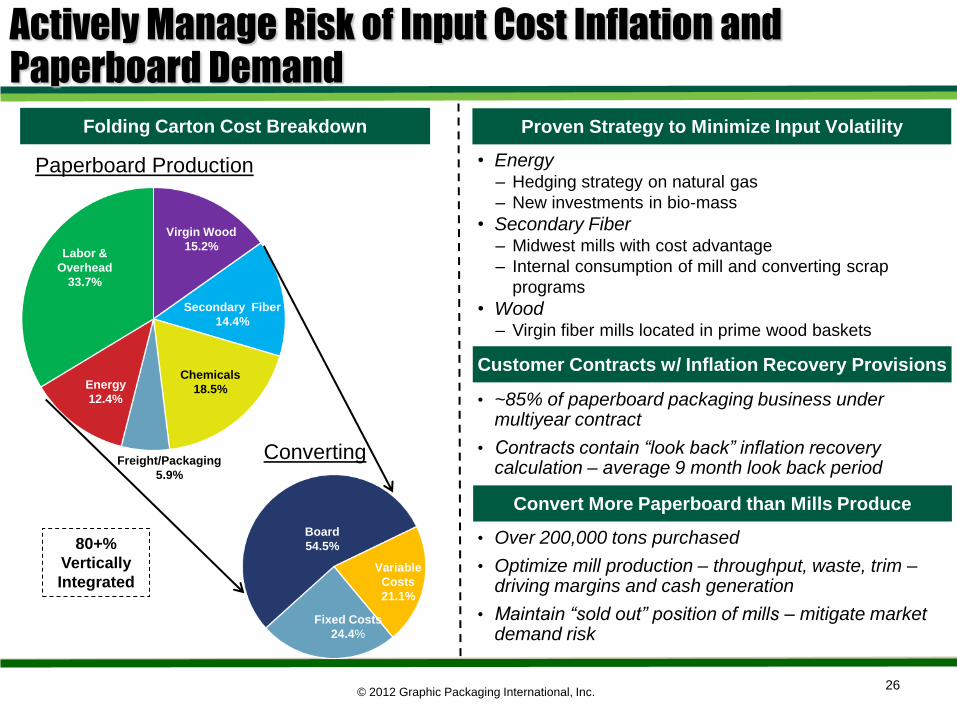
Actively Manage Risk of Input Cost Inflation and Paperboard Demand
• Energy
– Hedging strategy on natural gas
– New investments in bio-mass
• Secondary Fiber – Midwest mills with cost advantage
– Internal consumption of mill and converting scrap
programs
• Wood – Virgin fiber mills located in prime wood baskets
• ~85% of paperboard packaging business under
multiyear contract
• Contracts contain “look back” inflation recovery calculation – average 9 month look back period
• Over 200,000 tons purchased
• Optimize mill production – throughput, waste, trim – driving margins and cash generation
• Maintain “sold out” position of mills – mitigate market demand risk
Converting
Folding Carton Cost Breakdown
Secondary Fiber
14.4%
Energy
12.4%
Freight/Packaging
5.9%
Virgin Wood
15.2% Labor &
Overhead
33.7%
Chemicals
18.5%
Variable
Costs
21.1%
Fixed Costs
24.4%
Board
54.5% 80+%
Vertically
Integrated
Paperboard Production
Proven Strategy to Minimize Input Volatility
Customer Contracts w/ Inflation Recovery Provisions
Convert More Paperboard than Mills Produce
© 2012 Graphic Packaging International, Inc.
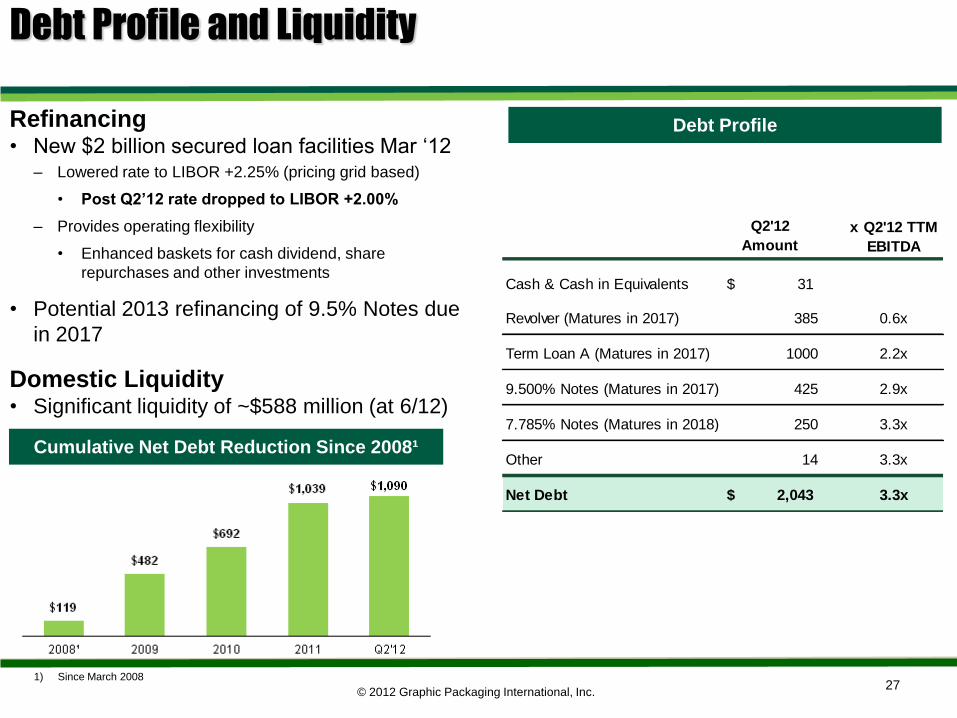
Debt Profile and Liquidity
1) Since March 2008
Debt Profile Refinancing • New $2 billion secured loan facilities Mar ‗12
– Lowered rate to LIBOR +2.25% (pricing grid based)
• Post Q2’12 rate dropped to LIBOR +2.00%
– Provides operating flexibility
• Enhanced baskets for cash dividend, share
repurchases and other investments
• Potential 2013 refinancing of 9.5% Notes due
in 2017
Domestic Liquidity • Significant liquidity of ~$588 million (at 6/12)
Cumulative Net Debt Reduction Since 2008¹
27
Q2'12
Amount
Cash & Cash in Equivalents 31$
Revolver (Matures in 2017) 385
Term Loan A (Matures in 2017) 1000
9.500% Notes (Matures in 2017) 425
7.785% Notes (Matures in 2018) 250
Other 14
Net Debt 2,043$
2.2x
3.3x
0.6x
x Q2'12 TTM
EBITDA
2.9x
3.3x
3.3x
© 2012 Graphic Packaging International, Inc. 28
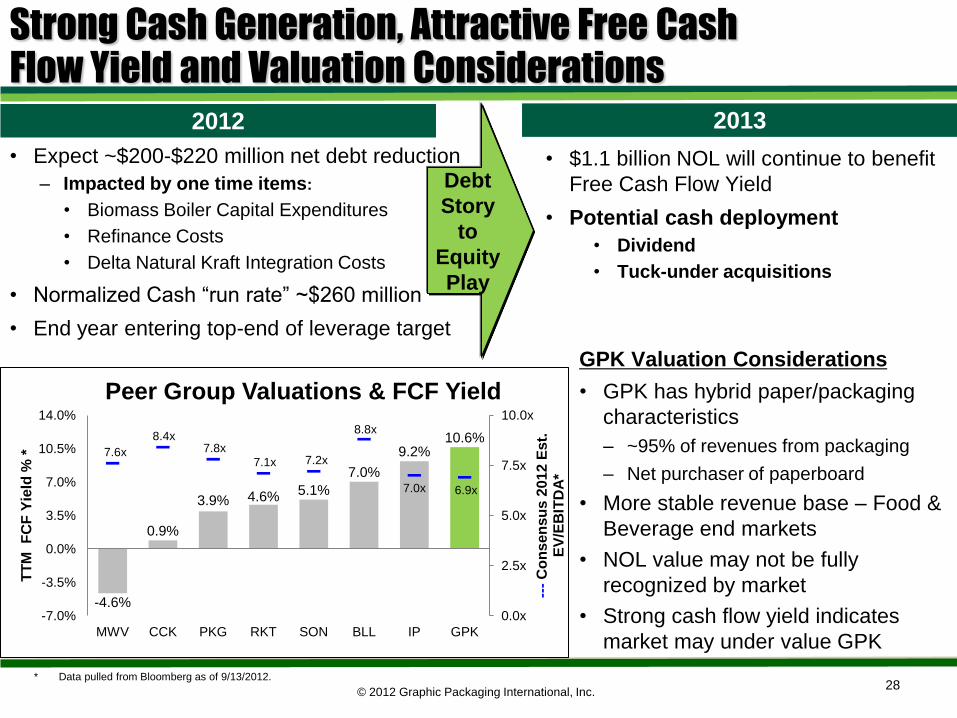
• Expect ~$200-$220 million net debt reduction
– Impacted by one time items:
• Biomass Boiler Capital Expenditures
• Refinance Costs
• Delta Natural Kraft Integration Costs
• Normalized Cash ―run rate‖ ~$260 million
• End year entering top-end of leverage target
Debt
Story
to
Equity
Play
• $1.1 billion NOL will continue to benefit
Free Cash Flow Yield
• Potential cash deployment
• Dividend
• Tuck-under acquisitions
-4.6%
0.9%
3.9% 4.6% 5.1%
7.0%
9.2% 10.6%
7.6x
8.4x 7.8x
7.1x 7.2x
8.8x
7.0x 6.9x
0.0x
2.5x
5.0x
7.5x
10.0x
-7.0%
-3.5%
0.0%
3.5%
7.0%
10.5%
14.0%
MWV CCK PKG RKT SON BLL IP GPK
---
Co
ns
en
su
s 2
01
2 E
st.
E
V/E
BIT
DA
*
TT
M F
CF
Yie
ld %
*
Peer Group Valuations & FCF Yield
Strong Cash Generation, Attractive Free Cash Flow Yield and Valuation Considerations
* Data pulled from Bloomberg as of 9/13/2012.
2013 2012
GPK Valuation Considerations
• GPK has hybrid paper/packaging
characteristics
– ~95% of revenues from packaging
– Net purchaser of paperboard
• More stable revenue base – Food &
Beverage end markets
• NOL value may not be fully
recognized by market
• Strong cash flow yield indicates
market may under value GPK
© 2012 Graphic Packaging International, Inc.
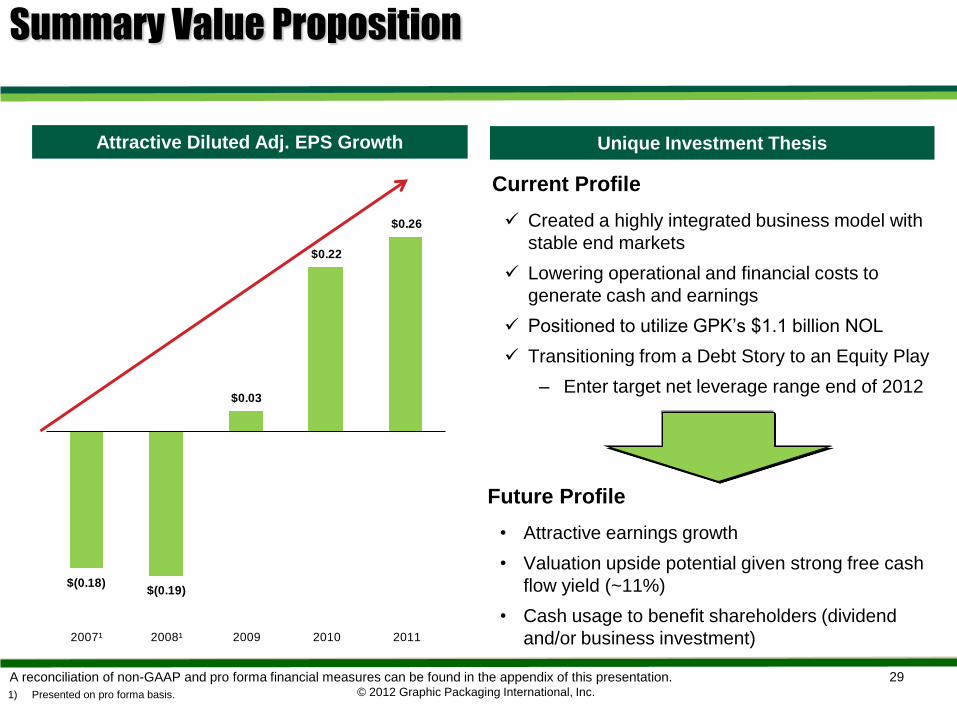
$(0.18)$(0.19)
$0.03
$0.22
$0.26
2007¹ 2008¹ 2009 2010 2011
Attractive Diluted Adj. EPS Growth
Summary Value Proposition
Current Profile
Created a highly integrated business model with
stable end markets
Lowering operational and financial costs to
generate cash and earnings
Positioned to utilize GPK‘s $1.1 billion NOL
Transitioning from a Debt Story to an Equity Play
– Enter target net leverage range end of 2012
Unique Investment Thesis
29
1) Presented on pro forma basis.
Future Profile
• Attractive earnings growth
• Valuation upside potential given strong free cash
flow yield (~11%)
• Cash usage to benefit shareholders (dividend
and/or business investment)
A reconciliation of non-GAAP and pro forma financial measures can be found in the appendix of this presentation.
© 2012 Graphic Packaging International, Inc. 30
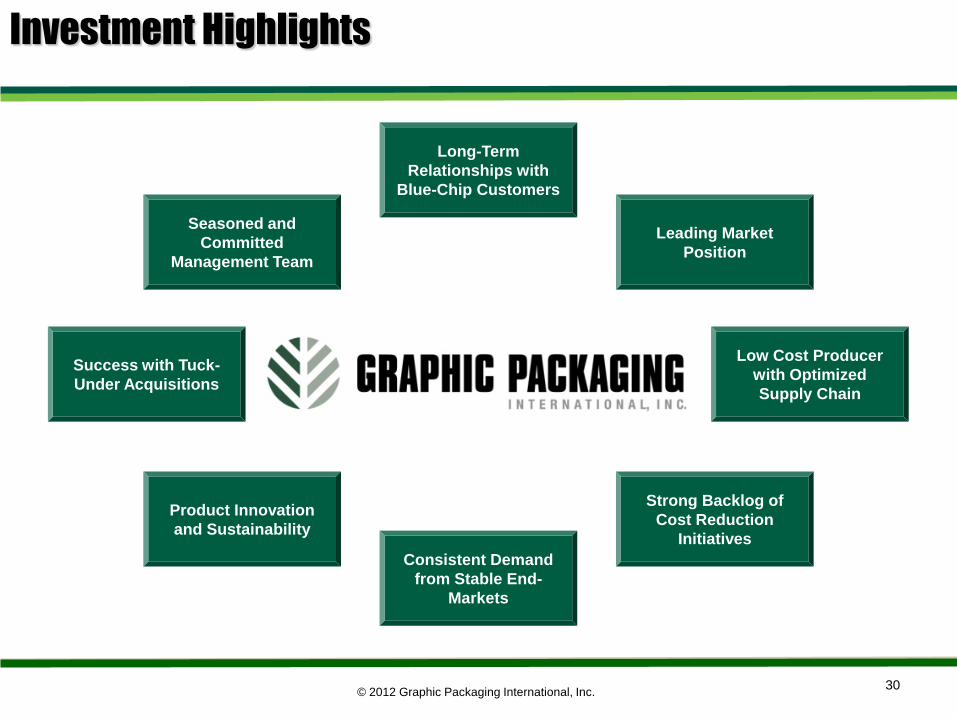
Investment Highlights
Leading Market
Position
Success with Tuck-
Under Acquisitions
Low Cost Producer
with Optimized
Supply Chain
Product Innovation
and Sustainability
Seasoned and
Committed
Management Team
Long-Term
Relationships with
Blue-Chip Customers
Consistent Demand
from Stable End-
Markets
Strong Backlog of
Cost Reduction
Initiatives
© 2012 Graphic Packaging International, Inc. 31
Appendix
© 2012 Graphic Packaging International, Inc. 32
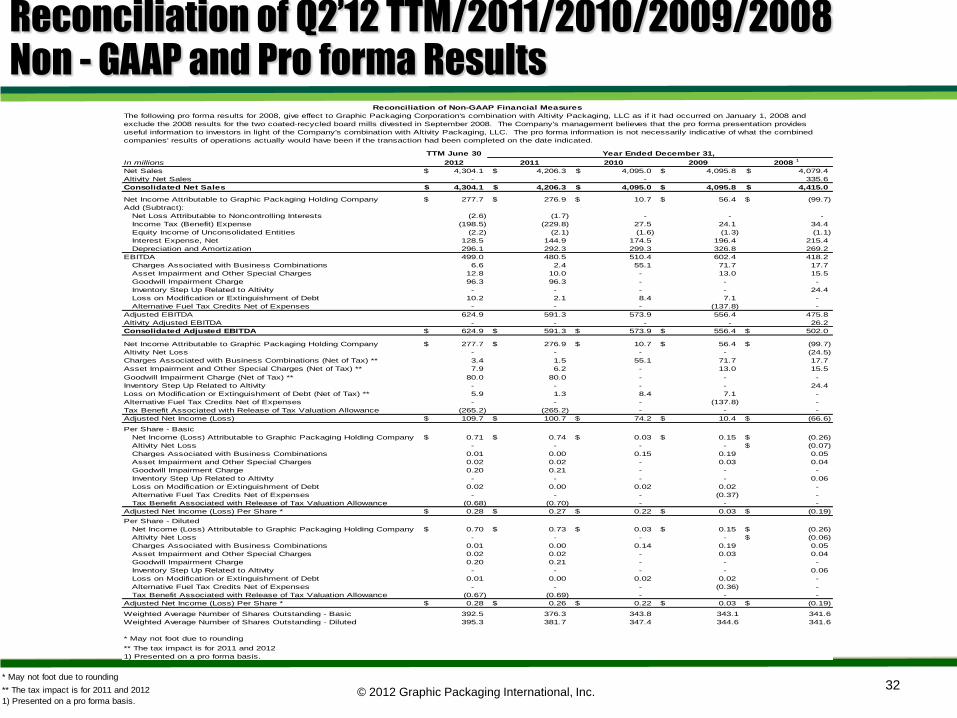
Reconciliation of Q2’12 TTM/2011/2010/2009/2008 Non - GAAP and Pro forma Results
* May not foot due to rounding
** The tax impact is for 2011 and 2012
1) Presented on a pro forma basis.
TTM June 30
In millions 2012 2011 2010 2009 2008 1
Net Sales 4,304.1$ 4,206.3$ 4,095.0$ 4,095.8$ 4,079.4$
Altivity Net Sales - - - - 335.6
Consolidated Net Sales 4,304.1$ 4,206.3$ 4,095.0$ 4,095.8$ 4,415.0$
Net Income Attributable to Graphic Packaging Holding Company 277.7$ 276.9$ 10.7$ 56.4$ (99.7)$
Add (Subtract):
Net Loss Attributable to Noncontrolling Interests (2.6) (1.7) - - -
Income Tax (Benefit) Expense (198.5) (229.8) 27.5 24.1 34.4
Equity Income of Unconsolidated Entities (2.2) (2.1) (1.6) (1.3) (1.1)
Interest Expense, Net 128.5 144.9 174.5 196.4 215.4
Depreciation and Amortization 296.1 292.3 299.3 326.8 269.2
EBITDA 499.0 480.5 510.4 602.4 418.2
Charges Associated with Business Combinations 6.6 2.4 55.1 71.7 17.7
Asset Impairment and Other Special Charges 12.8 10.0 - 13.0 15.5
Goodwill Impairment Charge 96.3 96.3 - - -
Inventory Step Up Related to Altivity - - - - 24.4
Loss on Modification or Extinguishment of Debt 10.2 2.1 8.4 7.1 -
Alternative Fuel Tax Credits Net of Expenses - - - (137.8) -
Adjusted EBITDA 624.9 591.3 573.9 556.4 475.8
Altivity Adjusted EBITDA - - - - 26.2
Consolidated Adjusted EBITDA 624.9$ 591.3$ 573.9$ 556.4$ 502.0$
Net Income Attributable to Graphic Packaging Holding Company 277.7$ 276.9$ 10.7$ 56.4$ (99.7)$
Altivity Net Loss - - - - (24.5)
Charges Associated with Business Combinations (Net of Tax) ** 3.4 1.5 55.1 71.7 17.7
Asset Impairment and Other Special Charges (Net of Tax) ** 7.9 6.2 - 13.0 15.5
Goodwill Impairment Charge (Net of Tax) ** 80.0 80.0 - - -
Inventory Step Up Related to Altivity - - - - 24.4
Loss on Modification or Extinguishment of Debt (Net of Tax) ** 5.9 1.3 8.4 7.1 -
Alternative Fuel Tax Credits Net of Expenses - - - (137.8) -
Tax Benefit Associated with Release of Tax Valuation Allowance (265.2) (265.2) - - -
Adjusted Net Income (Loss) 109.7$ 100.7$ 74.2$ 10.4$ (66.6)$
Per Share - Basic
Net Income (Loss) Attributable to Graphic Packaging Holding Company 0.71$ 0.74$ 0.03$ 0.15$ (0.26)$
Altivity Net Loss - - - - (0.07)$
Charges Associated with Business Combinations 0.01 0.00 0.15 0.19 0.05
Asset Impairment and Other Special Charges 0.02 0.02 - 0.03 0.04
Goodwill Impairment Charge 0.20 0.21 - - -
Inventory Step Up Related to Altivity - - - - 0.06
Loss on Modification or Extinguishment of Debt 0.02 0.00 0.02 0.02 -
Alternative Fuel Tax Credits Net of Expenses - - - (0.37) -
Tax Benefit Associated with Release of Tax Valuation Allowance (0.68) (0.70) - - -
Adjusted Net Income (Loss) Per Share * 0.28$ 0.27$ 0.22$ 0.03$ (0.19)$
Per Share - Diluted
Net Income (Loss) Attributable to Graphic Packaging Holding Company 0.70$ 0.73$ 0.03$ 0.15$ (0.26)$
Altivity Net Loss - - - - (0.06)$
Charges Associated with Business Combinations 0.01 0.00 0.14 0.19 0.05
Asset Impairment and Other Special Charges 0.02 0.02 - 0.03 0.04
Goodwill Impairment Charge 0.20 0.21 - - -
Inventory Step Up Related to Altivity - - - - 0.06
Loss on Modification or Extinguishment of Debt 0.01 0.00 0.02 0.02 -
Alternative Fuel Tax Credits Net of Expenses - - - (0.36) -
Tax Benefit Associated with Release of Tax Valuation Allowance (0.67) (0.69) - - -
Adjusted Net Income (Loss) Per Share * 0.28$ 0.26$ 0.22$ 0.03$ (0.19)$
Weighted Average Number of Shares Outstanding - Basic 392.5 376.3 343.8 343.1 341.6
Weighted Average Number of Shares Outstanding - Diluted 395.3 381.7 347.4 344.6 341.6
* May not foot due to rounding
** The tax impact is for 2011 and 2012
1) Presented on a pro forma basis.
The following pro forma results for 2008, give effect to Graphic Packaging Corporation's combination with Altivity Packaging, LLC as if it had occurred on January 1, 2008 and
exclude the 2008 results for the two coated-recycled board mills divested in September 2008. The Company's management believes that the pro forma presentation provides
useful information to investors in light of the Company's combination with Altivity Packaging, LLC. The pro forma information is not necessarily indicative of what the combined
companies' results of operations actually would have been if the transaction had been completed on the date indicated.
Reconciliation of Non-GAAP Financial Measures
Year Ended December 31,
© 2012 Graphic Packaging International, Inc. 33
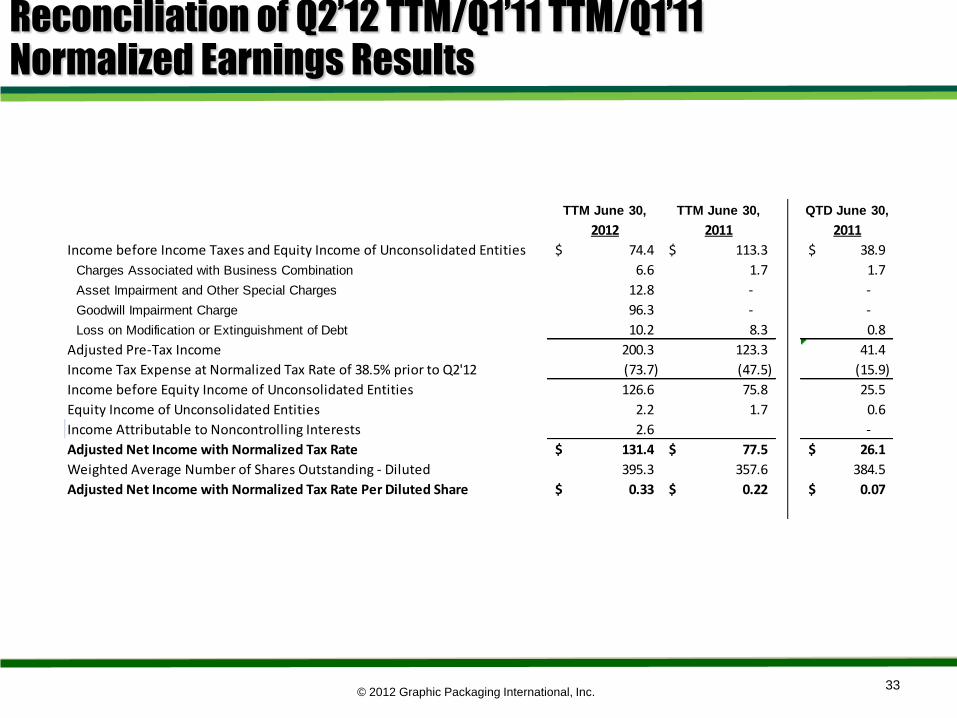
Reconciliation of Q2’12 TTM/Q1’11 TTM/Q1’11 Normalized Earnings Results
TTM June 30, TTM June 30, QTD June 30,
2012 2011 2011
Income before Income Taxes and Equity Income of Unconsolidated Entities 74.4$ 113.3$ 38.9$
Charges Associated with Business Combination 6.6 1.7 1.7
Asset Impairment and Other Special Charges 12.8 - -
Goodwill Impairment Charge 96.3 - -
Loss on Modification or Extinguishment of Debt 10.2 8.3 0.8
Adjusted Pre-Tax Income 200.3 123.3 41.4
Income Tax Expense at Normalized Tax Rate of 38.5% prior to Q2'12 (73.7) (47.5) (15.9)
Income before Equity Income of Unconsolidated Entities 126.6 75.8 25.5
Equity Income of Unconsolidated Entities 2.2 1.7 0.6
Income Attributable to Noncontrolling Interests 2.6 -
Adjusted Net Income with Normalized Tax Rate 131.4$ 77.5$ 26.1$
Weighted Average Number of Shares Outstanding - Diluted 395.3 357.6 384.5
Adjusted Net Income with Normalized Tax Rate Per Diluted Share 0.33$ 0.22$ 0.07$
© 2012 Graphic Packaging International, Inc. 34
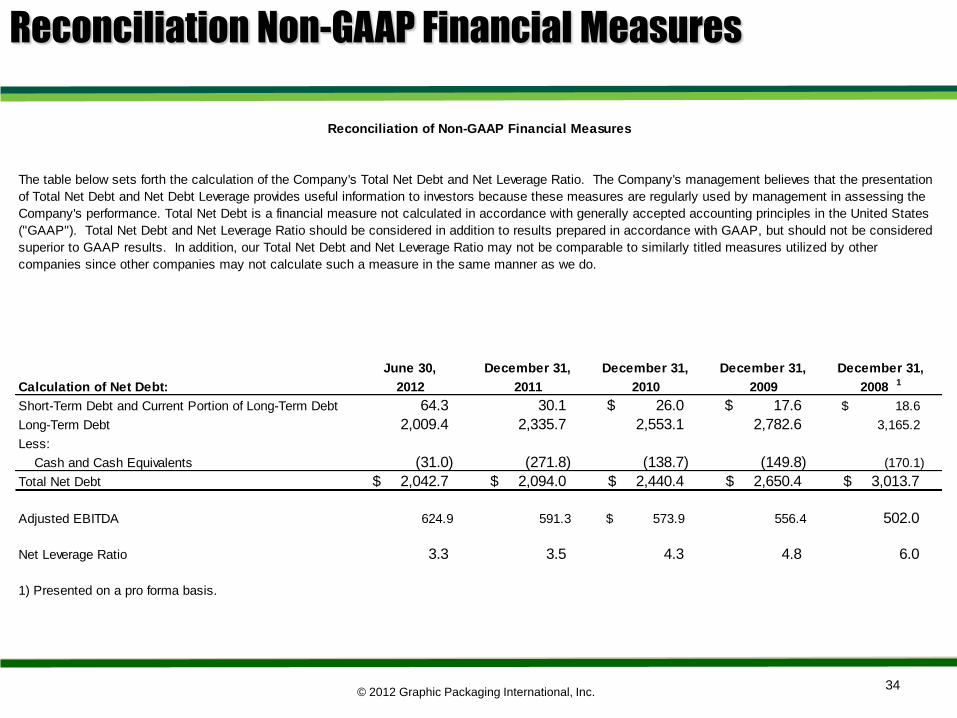
Reconciliation Non-GAAP Financial Measures
June 30, December 31, December 31, December 31, December 31,
Calculation of Net Debt: 2012 2011 2010 2009 2008 1
Short-Term Debt and Current Portion of Long-Term Debt 64.3 30.1 26.0$ 17.6$ 18.6$
Long-Term Debt 2,009.4 2,335.7 2,553.1 2,782.6 3,165.2
Less:
Cash and Cash Equivalents (31.0) (271.8) (138.7) (149.8) (170.1)
Total Net Debt 2,042.7$ 2,094.0$ 2,440.4$ 2,650.4$ 3,013.7$
Adjusted EBITDA 624.9 591.3 573.9$ 556.4 502.0
Net Leverage Ratio 3.3 3.5 4.3 4.8 6.0
1) Presented on a pro forma basis.
Reconciliation of Non-GAAP Financial Measures
The table below sets forth the calculation of the Company's Total Net Debt and Net Leverage Ratio. The Company's management believes that the presentation
of Total Net Debt and Net Debt Leverage provides useful information to investors because these measures are regularly used by management in assessing the
Company's performance. Total Net Debt is a financial measure not calculated in accordance with generally accepted accounting principles in the United States
("GAAP"). Total Net Debt and Net Leverage Ratio should be considered in addition to results prepared in accordance with GAAP, but should not be considered
superior to GAAP results. In addition, our Total Net Debt and Net Leverage Ratio may not be comparable to similarly titled measures utilized by other
companies since other companies may not calculate such a measure in the same manner as we do.