Embed Size (px)
Citation preview
Consumer Price Index- February 2017
1
Statistics BotswanaStatistics Botswana. Private Bag 0024 Gaborone Botswana
Tel: (+267) 367 1300. Fax: (+267) 395 2201. Email: [email protected] Website: www.statsbots.org.bw
Contact Statistician: Phaladi Labobedi
Consumer Price IndexFEBRUARY 2017
Consumer Price Index- February 2017
2
Statistics Botswana
CONTENTS
COMMENTARY
Section 1: Headline Inflation
Section 2: Core Inflation
CHARTS
1. National Rates of Inflation, February 2014 – February 2017
2. Monthly Changes in the Cost-of-Living Index, February 2014 – February 2017
3. Non-Tradable Inflation Rates, February 2014 –February 2017
4. Tradable Inflation Rates, February 2014 – February 2017
TABLES
1. Cost-of-Living Index Series (January 2014 – February 2017)
2. National Cost-of-Living Group and Section Indices
3. Cost-of-Living Index by Tradability (January 2014 – February 2017)
4. Core Inflation Rates
5. Annual Average Inflation Rates 2009-2016
MAPS
1. CPI Area Coverage
GLOSSARY
Consumer Price Index- February 2017
3
Statistics Botswana
COMMENTARY
Section 1: Headline Inflation
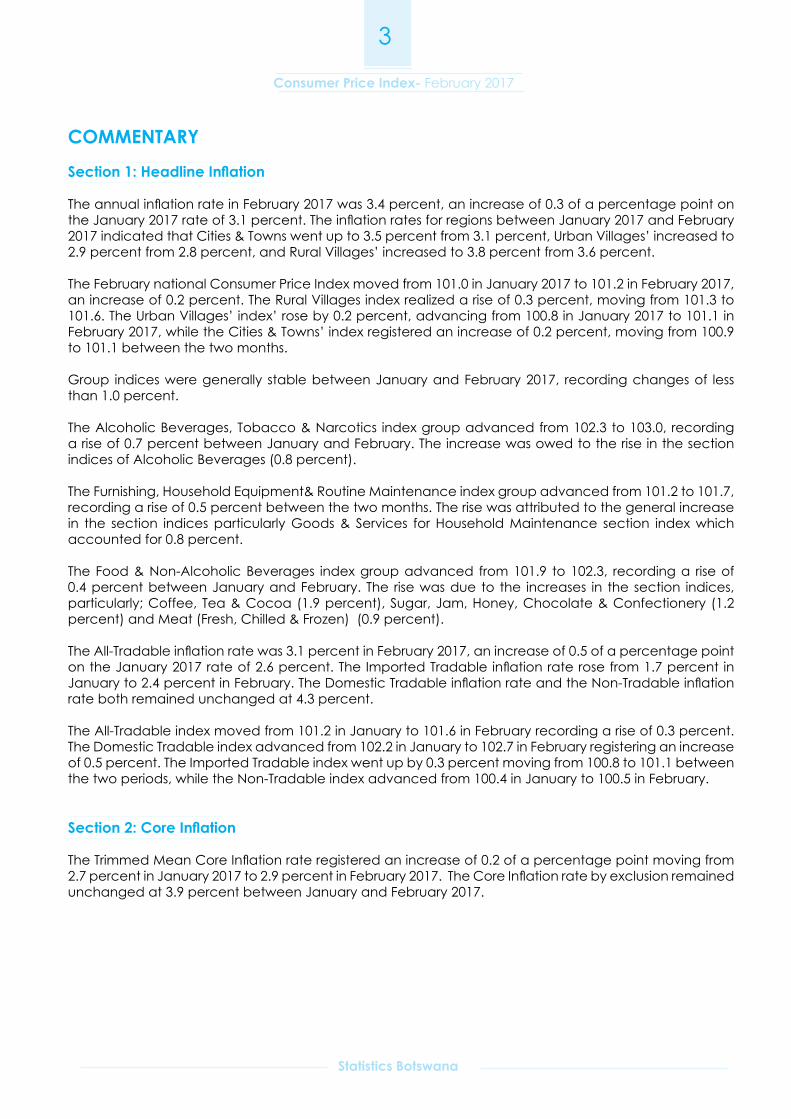
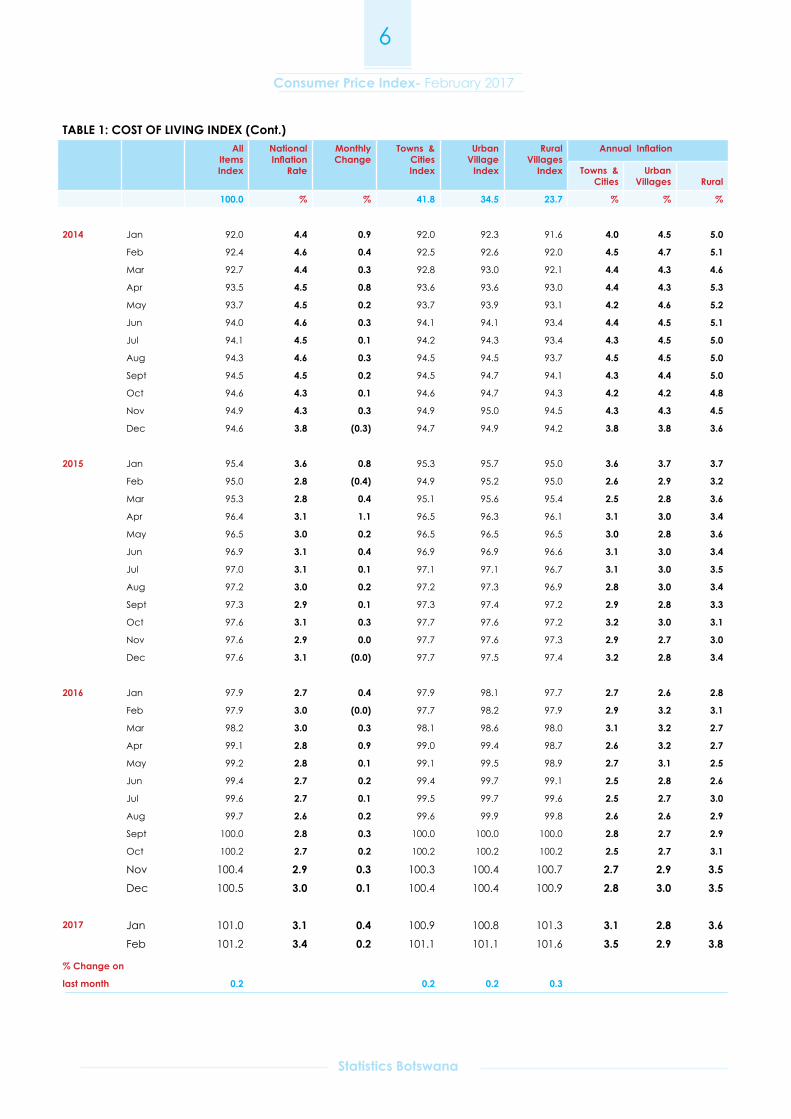
The annual inflation rate in February 2017 was 3.4 percent, an increase of 0.3 of a percentage point on the January 2017 rate of 3.1 percent. The inflation rates for regions between January 2017 and February 2017 indicated that Cities & Towns went up to 3.5 percent from 3.1 percent, Urban Villages’ increased to 2.9 percent from 2.8 percent, and Rural Villages’ increased to 3.8 percent from 3.6 percent.
The February national Consumer Price Index moved from 101.0 in January 2017 to 101.2 in February 2017, an increase of 0.2 percent. The Rural Villages index realized a rise of 0.3 percent, moving from 101.3 to 101.6. The Urban Villages’ index’ rose by 0.2 percent, advancing from 100.8 in January 2017 to 101.1 in February 2017, while the Cities & Towns’ index registered an increase of 0.2 percent, moving from 100.9 to 101.1 between the two months.
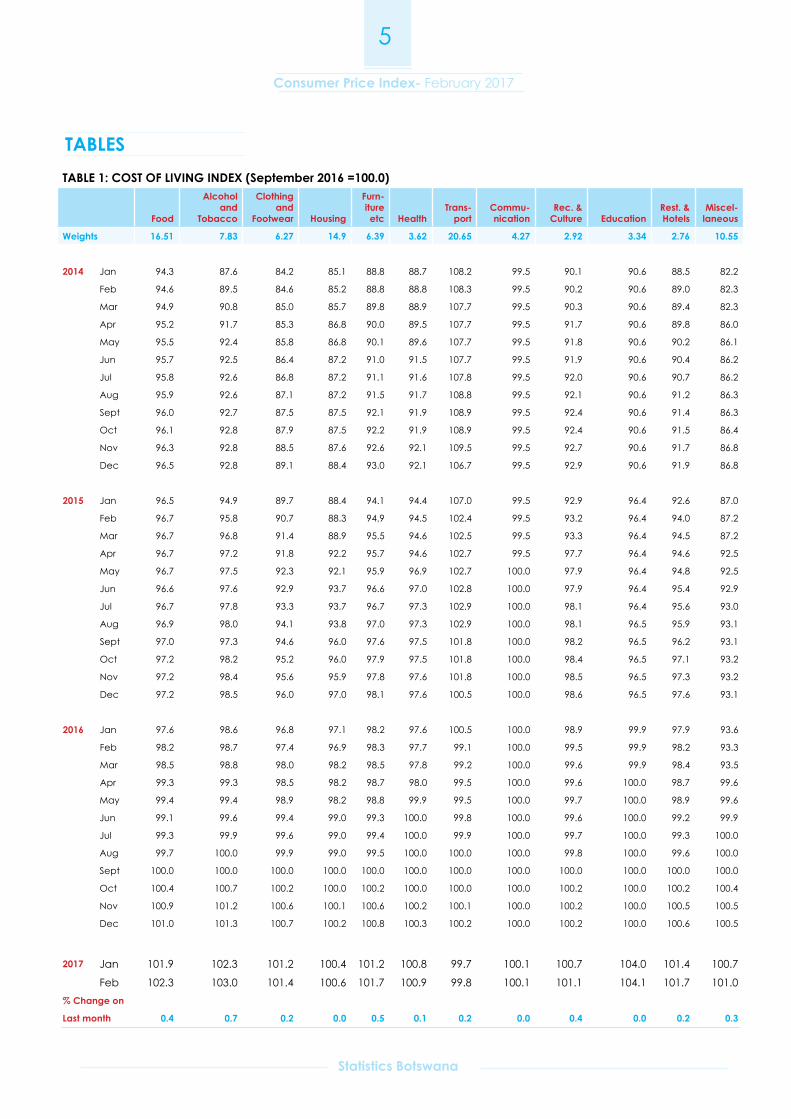
Group indices were generally stable between January and February 2017, recording changes of less than 1.0 percent.
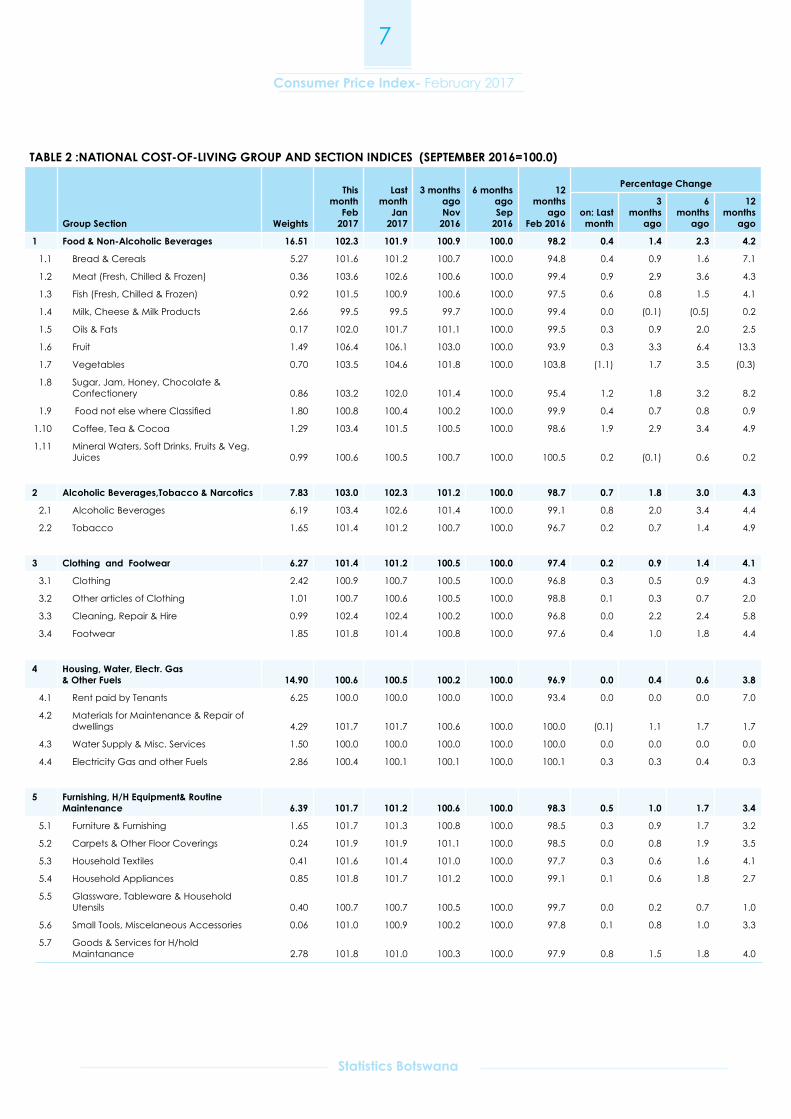
The Alcoholic Beverages, Tobacco & Narcotics index group advanced from 102.3 to 103.0, recording a rise of 0.7 percent between January and February. The increase was owed to the rise in the section indices of Alcoholic Beverages (0.8 percent).
The Furnishing, Household Equipment& Routine Maintenance index group advanced from 101.2 to 101.7, recording a rise of 0.5 percent between the two months. The rise was attributed to the general increase in the section indices particularly Goods & Services for Household Maintenance section index which accounted for 0.8 percent.
The Food & Non-Alcoholic Beverages index group advanced from 101.9 to 102.3, recording a rise of 0.4 percent between January and February. The rise was due to the increases in the section indices, particularly; Coffee, Tea & Cocoa (1.9 percent), Sugar, Jam, Honey, Chocolate & Confectionery (1.2 percent) and Meat (Fresh, Chilled & Frozen) (0.9 percent).
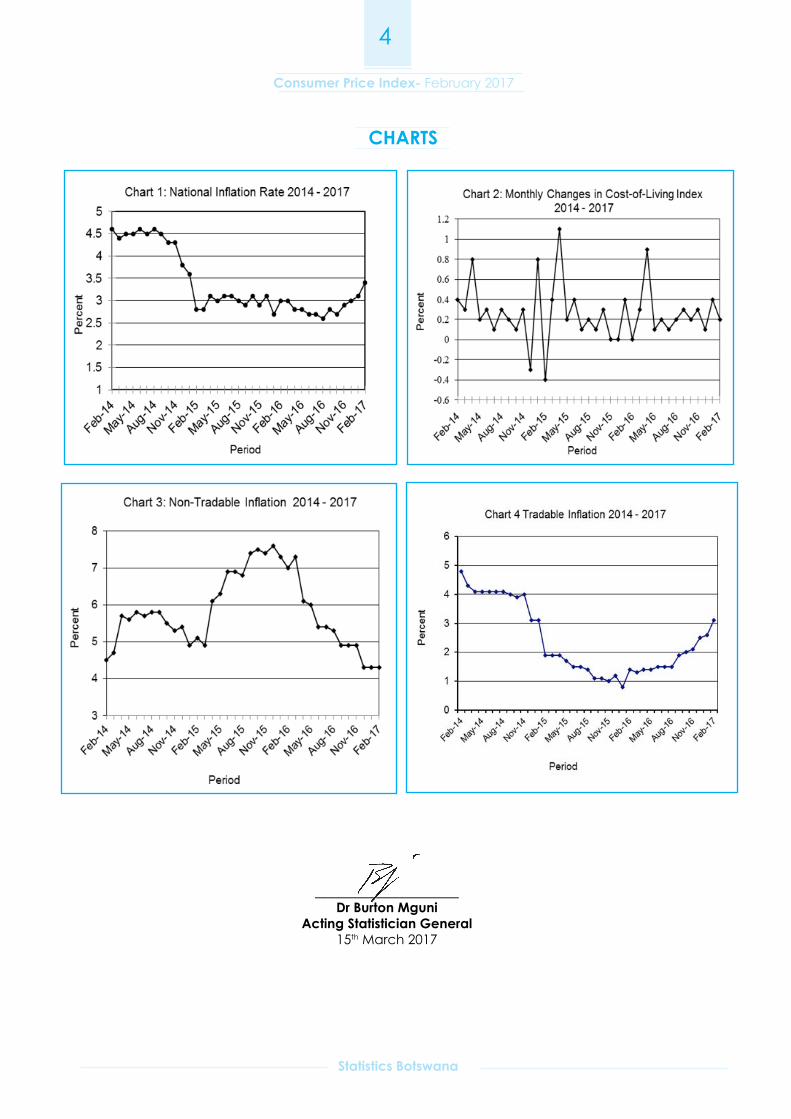
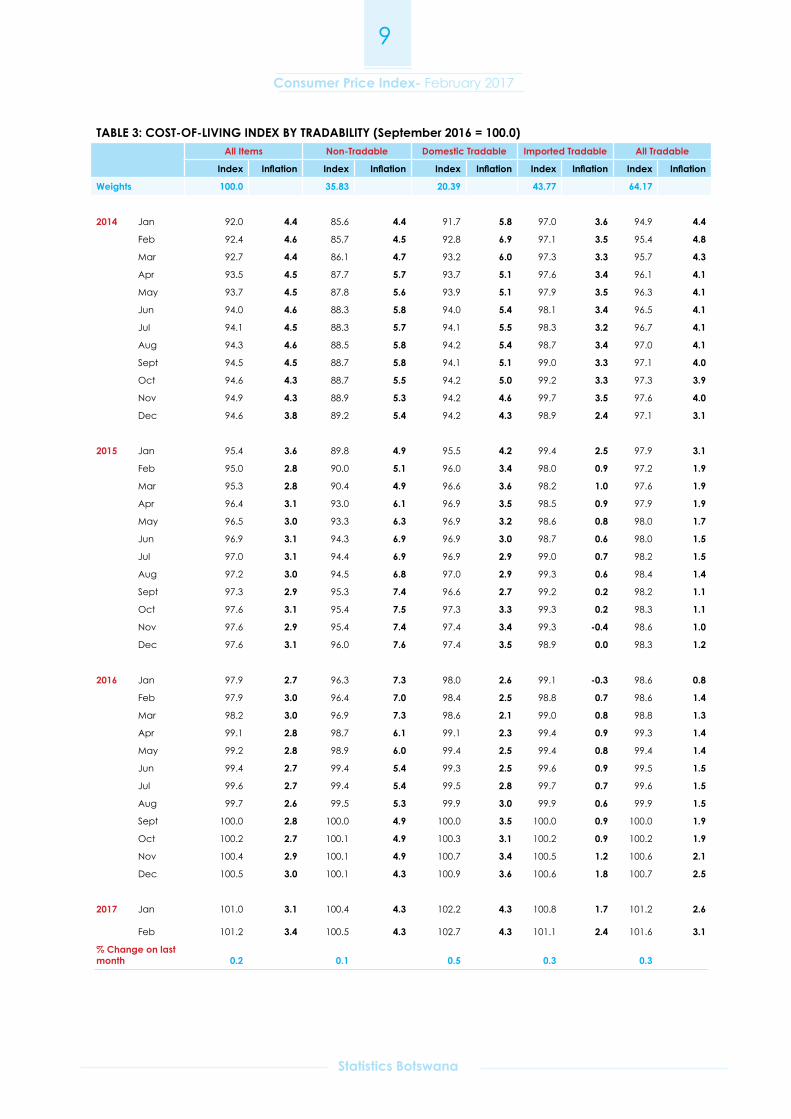
The All-Tradable inflation rate was 3.1 percent in February 2017, an increase of 0.5 of a percentage point on the January 2017 rate of 2.6 percent. The Imported Tradable inflation rate rose from 1.7 percent in January to 2.4 percent in February. The Domestic Tradable inflation rate and the Non-Tradable inflation rate both remained unchanged at 4.3 percent.
The All-Tradable index moved from 101.2 in January to 101.6 in February recording a rise of 0.3 percent. The Domestic Tradable index advanced from 102.2 in January to 102.7 in February registering an increase of 0.5 percent. The Imported Tradable index went up by 0.3 percent moving from 100.8 to 101.1 between the two periods, while the Non-Tradable index advanced from 100.4 in January to 100.5 in February.
Section 2: Core Inflation
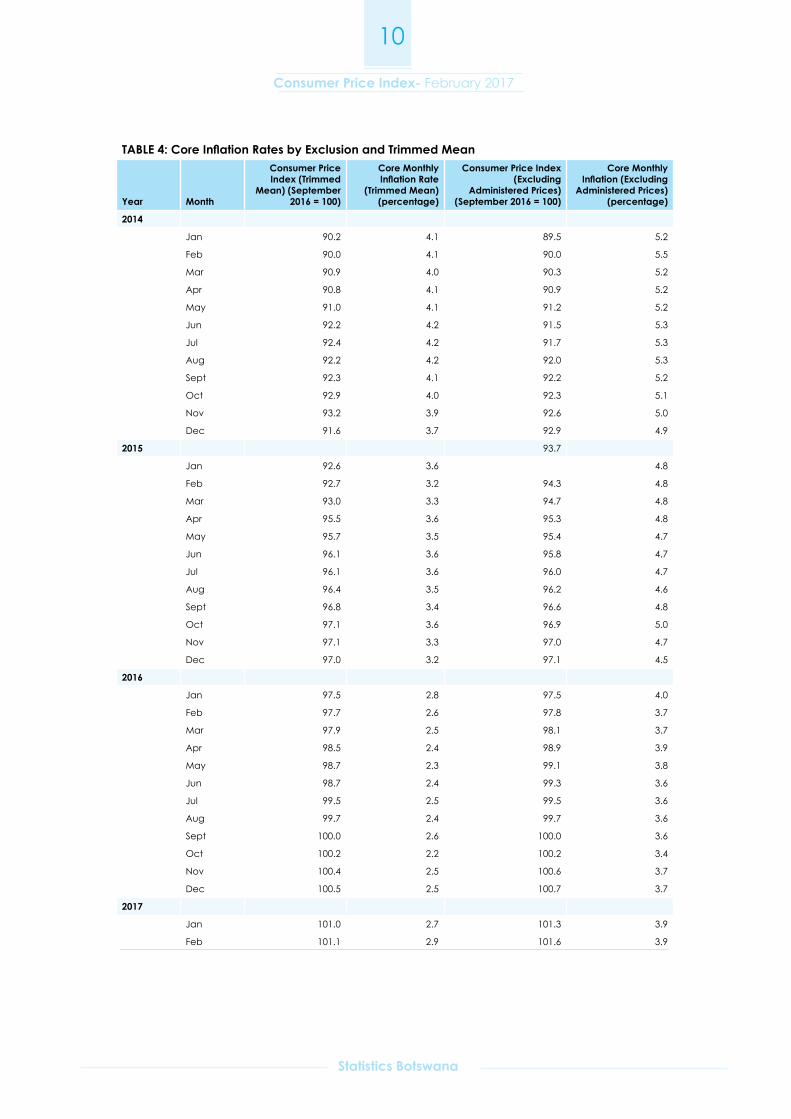
The Trimmed Mean Core Inflation rate registered an increase of 0.2 of a percentage point moving from 2.7 percent in January 2017 to 2.9 percent in February 2017. The Core Inflation rate by exclusion remained unchanged at 3.9 percent between January and February 2017.
Consumer Price Index- February 2017
4
Statistics Botswana
__________________Dr Burton Mguni
Acting Statistician General15th March 2017
CHARTS
Consumer Price Index- February 2017
5
Statistics Botswana
TABLESTABLE 1: COST OF LIVING INDEX (September 2016 =100.0)
Food
Alcoholand
Tobacco
Clothingand
Footwear Housing
Furn-itureetc Health
Trans-port
Commu-nication
Rec. & Culture Education
Rest. & Hotels
Miscel-laneous
Weights 16.51 7.83 6.27 14.9 6.39 3.62 20.65 4.27 2.92 3.34 2.76 10.55
2014 Jan 94.3 87.6 84.2 85.1 88.8 88.7 108.2 99.5 90.1 90.6 88.5 82.2
Feb 94.6 89.5 84.6 85.2 88.8 88.8 108.3 99.5 90.2 90.6 89.0 82.3
Mar 94.9 90.8 85.0 85.7 89.8 88.9 107.7 99.5 90.3 90.6 89.4 82.3
Apr 95.2 91.7 85.3 86.8 90.0 89.5 107.7 99.5 91.7 90.6 89.8 86.0
May 95.5 92.4 85.8 86.8 90.1 89.6 107.7 99.5 91.8 90.6 90.2 86.1
Jun 95.7 92.5 86.4 87.2 91.0 91.5 107.7 99.5 91.9 90.6 90.4 86.2
Jul 95.8 92.6 86.8 87.2 91.1 91.6 107.8 99.5 92.0 90.6 90.7 86.2
Aug 95.9 92.6 87.1 87.2 91.5 91.7 108.8 99.5 92.1 90.6 91.2 86.3
Sept 96.0 92.7 87.5 87.5 92.1 91.9 108.9 99.5 92.4 90.6 91.4 86.3
Oct 96.1 92.8 87.9 87.5 92.2 91.9 108.9 99.5 92.4 90.6 91.5 86.4
Nov 96.3 92.8 88.5 87.6 92.6 92.1 109.5 99.5 92.7 90.6 91.7 86.8
Dec 96.5 92.8 89.1 88.4 93.0 92.1 106.7 99.5 92.9 90.6 91.9 86.8
2015 Jan 96.5 94.9 89.7 88.4 94.1 94.4 107.0 99.5 92.9 96.4 92.6 87.0
Feb 96.7 95.8 90.7 88.3 94.9 94.5 102.4 99.5 93.2 96.4 94.0 87.2
Mar 96.7 96.8 91.4 88.9 95.5 94.6 102.5 99.5 93.3 96.4 94.5 87.2
Apr 96.7 97.2 91.8 92.2 95.7 94.6 102.7 99.5 97.7 96.4 94.6 92.5
May 96.7 97.5 92.3 92.1 95.9 96.9 102.7 100.0 97.9 96.4 94.8 92.5
Jun 96.6 97.6 92.9 93.7 96.6 97.0 102.8 100.0 97.9 96.4 95.4 92.9
Jul 96.7 97.8 93.3 93.7 96.7 97.3 102.9 100.0 98.1 96.4 95.6 93.0
Aug 96.9 98.0 94.1 93.8 97.0 97.3 102.9 100.0 98.1 96.5 95.9 93.1
Sept 97.0 97.3 94.6 96.0 97.6 97.5 101.8 100.0 98.2 96.5 96.2 93.1
Oct 97.2 98.2 95.2 96.0 97.9 97.5 101.8 100.0 98.4 96.5 97.1 93.2
Nov 97.2 98.4 95.6 95.9 97.8 97.6 101.8 100.0 98.5 96.5 97.3 93.2
Dec 97.2 98.5 96.0 97.0 98.1 97.6 100.5 100.0 98.6 96.5 97.6 93.1
2016 Jan 97.6 98.6 96.8 97.1 98.2 97.6 100.5 100.0 98.9 99.9 97.9 93.6
Feb 98.2 98.7 97.4 96.9 98.3 97.7 99.1 100.0 99.5 99.9 98.2 93.3
Mar 98.5 98.8 98.0 98.2 98.5 97.8 99.2 100.0 99.6 99.9 98.4 93.5
Apr 99.3 99.3 98.5 98.2 98.7 98.0 99.5 100.0 99.6 100.0 98.7 99.6
May 99.4 99.4 98.9 98.2 98.8 99.9 99.5 100.0 99.7 100.0 98.9 99.6
Jun 99.1 99.6 99.4 99.0 99.3 100.0 99.8 100.0 99.6 100.0 99.2 99.9
Jul 99.3 99.9 99.6 99.0 99.4 100.0 99.9 100.0 99.7 100.0 99.3 100.0
Aug 99.7 100.0 99.9 99.0 99.5 100.0 100.0 100.0 99.8 100.0 99.6 100.0
Sept 100.0 100.0 100.0 100.0 100.0 100.0 100.0 100.0 100.0 100.0 100.0 100.0
Oct 100.4 100.7 100.2 100.0 100.2 100.0 100.0 100.0 100.2 100.0 100.2 100.4
Nov 100.9 101.2 100.6 100.1 100.6 100.2 100.1 100.0 100.2 100.0 100.5 100.5
Dec 101.0 101.3 100.7 100.2 100.8 100.3 100.2 100.0 100.2 100.0 100.6 100.5
2017 Jan 101.9 102.3 101.2 100.4 101.2 100.8 99.7 100.1 100.7 104.0 101.4 100.7
Feb 102.3 103.0 101.4 100.6 101.7 100.9 99.8 100.1 101.1 104.1 101.7 101.0 % Change on
Last month 0.4 0.7 0.2 0.0 0.5 0.1 0.2 0.0 0.4 0.0 0.2 0.3
Consumer Price Index- February 2017
6
Statistics Botswana
TABLE 1: COST OF LIVING INDEX (Cont.) All
ItemsIndex
NationalInflation
Rate
MonthlyChange
Towns & CitiesIndex
UrbanVillage
Index
RuralVillages
Index
Annual Inflation
Towns & Cities
Urban Villages Rural
100.0 % % 41.8 34.5 23.7 % % %
2014 Jan 92.0 4.4 0.9 92.0 92.3 91.6 4.0 4.5 5.0
Feb 92.4 4.6 0.4 92.5 92.6 92.0 4.5 4.7 5.1
Mar 92.7 4.4 0.3 92.8 93.0 92.1 4.4 4.3 4.6
Apr 93.5 4.5 0.8 93.6 93.6 93.0 4.4 4.3 5.3
May 93.7 4.5 0.2 93.7 93.9 93.1 4.2 4.6 5.2
Jun 94.0 4.6 0.3 94.1 94.1 93.4 4.4 4.5 5.1
Jul 94.1 4.5 0.1 94.2 94.3 93.4 4.3 4.5 5.0
Aug 94.3 4.6 0.3 94.5 94.5 93.7 4.5 4.5 5.0
Sept 94.5 4.5 0.2 94.5 94.7 94.1 4.3 4.4 5.0
Oct 94.6 4.3 0.1 94.6 94.7 94.3 4.2 4.2 4.8
Nov 94.9 4.3 0.3 94.9 95.0 94.5 4.3 4.3 4.5
Dec 94.6 3.8 (0.3) 94.7 94.9 94.2 3.8 3.8 3.6
2015 Jan 95.4 3.6 0.8 95.3 95.7 95.0 3.6 3.7 3.7
Feb 95.0 2.8 (0.4) 94.9 95.2 95.0 2.6 2.9 3.2
Mar 95.3 2.8 0.4 95.1 95.6 95.4 2.5 2.8 3.6
Apr 96.4 3.1 1.1 96.5 96.3 96.1 3.1 3.0 3.4
May 96.5 3.0 0.2 96.5 96.5 96.5 3.0 2.8 3.6
Jun 96.9 3.1 0.4 96.9 96.9 96.6 3.1 3.0 3.4
Jul 97.0 3.1 0.1 97.1 97.1 96.7 3.1 3.0 3.5
Aug 97.2 3.0 0.2 97.2 97.3 96.9 2.8 3.0 3.4
Sept 97.3 2.9 0.1 97.3 97.4 97.2 2.9 2.8 3.3
Oct 97.6 3.1 0.3 97.7 97.6 97.2 3.2 3.0 3.1
Nov 97.6 2.9 0.0 97.7 97.6 97.3 2.9 2.7 3.0
Dec 97.6 3.1 (0.0) 97.7 97.5 97.4 3.2 2.8 3.4
2016 Jan 97.9 2.7 0.4 97.9 98.1 97.7 2.7 2.6 2.8
Feb 97.9 3.0 (0.0) 97.7 98.2 97.9 2.9 3.2 3.1
Mar 98.2 3.0 0.3 98.1 98.6 98.0 3.1 3.2 2.7
Apr 99.1 2.8 0.9 99.0 99.4 98.7 2.6 3.2 2.7
May 99.2 2.8 0.1 99.1 99.5 98.9 2.7 3.1 2.5
Jun 99.4 2.7 0.2 99.4 99.7 99.1 2.5 2.8 2.6
Jul 99.6 2.7 0.1 99.5 99.7 99.6 2.5 2.7 3.0
Aug 99.7 2.6 0.2 99.6 99.9 99.8 2.6 2.6 2.9
Sept 100.0 2.8 0.3 100.0 100.0 100.0 2.8 2.7 2.9
Oct 100.2 2.7 0.2 100.2 100.2 100.2 2.5 2.7 3.1
Nov 100.4 2.9 0.3 100.3 100.4 100.7 2.7 2.9 3.5Dec 100.5 3.0 0.1 100.4 100.4 100.9 2.8 3.0 3.5
2017 Jan 101.0 3.1 0.4 100.9 100.8 101.3 3.1 2.8 3.6Feb 101.2 3.4 0.2 101.1 101.1 101.6 3.5 2.9 3.8
% Change on
last month 0.2 0.2 0.2 0.3
Consumer Price Index- February 2017
7
Statistics Botswana
TABLE 2 :NATIONAL COST-OF-LIVING GROUP AND SECTION INDICES (SEPTEMBER 2016=100.0)
Group Section Weights
Thismonth
Feb2017
Lastmonth
Jan 2017
3 monthsagoNov
2016
6 monthsagoSep
2016
12 months
agoFeb 2016
Percentage Change
on: Lastmonth
3 months
ago
6 months
ago
12 months
ago
1 Food & Non-Alcoholic Beverages 16.51 102.3 101.9 100.9 100.0 98.2 0.4 1.4 2.3 4.2
1.1 Bread & Cereals 5.27 101.6 101.2 100.7 100.0 94.8 0.4 0.9 1.6 7.1
1.2 Meat (Fresh, Chilled & Frozen) 0.36 103.6 102.6 100.6 100.0 99.4 0.9 2.9 3.6 4.3
1.3 Fish (Fresh, Chilled & Frozen) 0.92 101.5 100.9 100.6 100.0 97.5 0.6 0.8 1.5 4.1
1.4 Milk, Cheese & Milk Products 2.66 99.5 99.5 99.7 100.0 99.4 0.0 (0.1) (0.5) 0.2
1.5 Oils & Fats 0.17 102.0 101.7 101.1 100.0 99.5 0.3 0.9 2.0 2.5
1.6 Fruit 1.49 106.4 106.1 103.0 100.0 93.9 0.3 3.3 6.4 13.3
1.7 Vegetables 0.70 103.5 104.6 101.8 100.0 103.8 (1.1) 1.7 3.5 (0.3)
1.8 Sugar, Jam, Honey, Chocolate & Confectionery 0.86 103.2 102.0 101.4 100.0 95.4 1.2 1.8 3.2 8.2
1.9 Food not else where Classified 1.80 100.8 100.4 100.2 100.0 99.9 0.4 0.7 0.8 0.9
1.10 Coffee, Tea & Cocoa 1.29 103.4 101.5 100.5 100.0 98.6 1.9 2.9 3.4 4.9
1.11 Mineral Waters, Soft Drinks, Fruits & Veg. Juices 0.99 100.6 100.5 100.7 100.0 100.5 0.2 (0.1) 0.6 0.2
2 Alcoholic Beverages,Tobacco & Narcotics 7.83 103.0 102.3 101.2 100.0 98.7 0.7 1.8 3.0 4.3
2.1 Alcoholic Beverages 6.19 103.4 102.6 101.4 100.0 99.1 0.8 2.0 3.4 4.4
2.2 Tobacco 1.65 101.4 101.2 100.7 100.0 96.7 0.2 0.7 1.4 4.9
3 Clothing and Footwear 6.27 101.4 101.2 100.5 100.0 97.4 0.2 0.9 1.4 4.1
3.1 Clothing 2.42 100.9 100.7 100.5 100.0 96.8 0.3 0.5 0.9 4.3
3.2 Other articles of Clothing 1.01 100.7 100.6 100.5 100.0 98.8 0.1 0.3 0.7 2.0
3.3 Cleaning, Repair & Hire 0.99 102.4 102.4 100.2 100.0 96.8 0.0 2.2 2.4 5.8
3.4 Footwear 1.85 101.8 101.4 100.8 100.0 97.6 0.4 1.0 1.8 4.4
4 Housing, Water, Electr. Gas & Other Fuels 14.90 100.6 100.5 100.2 100.0 96.9 0.0 0.4 0.6 3.8
4.1 Rent paid by Tenants 6.25 100.0 100.0 100.0 100.0 93.4 0.0 0.0 0.0 7.0
4.2
Materials for Maintenance & Repair of dwellings 4.29 101.7 101.7 100.6 100.0 100.0 (0.1) 1.1 1.7 1.7
4.3 Water Supply & Misc. Services 1.50 100.0 100.0 100.0 100.0 100.0 0.0 0.0 0.0 0.0
4.4 Electricity Gas and other Fuels 2.86 100.4 100.1 100.1 100.0 100.1 0.3 0.3 0.4 0.3
5 Furnishing, H/H Equipment& Routine Maintenance 6.39 101.7 101.2 100.6 100.0 98.3 0.5 1.0 1.7 3.4
5.1 Furniture & Furnishing 1.65 101.7 101.3 100.8 100.0 98.5 0.3 0.9 1.7 3.2
5.2 Carpets & Other Floor Coverings 0.24 101.9 101.9 101.1 100.0 98.5 0.0 0.8 1.9 3.5
5.3 Household Textiles 0.41 101.6 101.4 101.0 100.0 97.7 0.3 0.6 1.6 4.1
5.4 Household Appliances 0.85 101.8 101.7 101.2 100.0 99.1 0.1 0.6 1.8 2.7
5.5
Glassware, Tableware & HouseholdUtensils 0.40 100.7 100.7 100.5 100.0 99.7 0.0 0.2 0.7 1.0
5.6 Small Tools, Miscelaneous Accessories 0.06 101.0 100.9 100.2 100.0 97.8 0.1 0.8 1.0 3.3
5.7
Goods & Services for H/hold Maintanance 2.78 101.8 101.0 100.3 100.0 97.9 0.8 1.5 1.8 4.0

Consumer Price Index- February 2017
8
Statistics Botswana
TABLE 2 :NATIONAL COST-OF-LIVING GROUP AND SECTION INDICES (SEPTEMBER 2016=100.0) Cont’d
Group Section Weights
Thismonth
Feb2017
Lastmonth
Jan2017
3 monthsagoNov
2016
6 monthsagoSep
2016
12 months
agoFeb 2016
Percentage Change
on: Last
month
3 months
ago
6 months
ago
12 months
ago
6 Health 3.62 100.9 100.8 100.2 100.0 97.7 0.1 0.7 0.9 3.3
6.1 Medical Products, App. & Equip. 0.81 103.1 102.9 101.0 100.0 99.5 0.1 2.0 3.1 3.6
6.2 Out-patient Services 0.70 101.1 100.9 100.0 100.0 98.9 0.2 1.1 1.1 2.2
6.3 Hospital Services 2.10 100.0 100.0 100.0 100.0 96.7 0.0 0.0 0.0 3.4
7 Transport 20.65 99.8 99.7 100.1 100.0 99.1 0.2 (0.3) (0.2) 0.7
7.1 Purchase of Vehicles 5.29 98.7 98.1 100.2 100.0 97.8 0.6 (1.5) (1.3) 0.9
7.2 Operation of Personal Transport 11.13 100.3 100.3 100.1 100.0 99.6 0.0 0.2 0.3 0.7
7.3 Transport Services 4.22 100.0 100.0 100.0 100.0 100.0 0.0 0.0 0.0 0.0
8 Communication 4.27 100.1 100.1 100.0 100.0 100.0 0.0 0.1 0.1 0.1
8.1 Postal Services 0.15 100.0 100.0 100.0 100.0 100.0 0.0 0.0 0.0 0.0
8.2 Telephone & Telefax Equipment 0.71 100.4 100.4 100.0 100.0 100.0 0.0 0.4 0.4 0.4
8.3 Telephone & Telefax Services 3.41 100.0 100.0 100.0 100.0 100.0 0.0 0.0 0.0 0.0
9 Recreation & Culture 2.92 101.1 100.7 100.2 100.0 99.5 0.4 0.9 1.1 1.6
9.1 Audio Visual, Photographic & Info. Proce. Equip. 1.96 101.4 101.0 100.3 100.0 99.3 0.4 1.1 1.4 2.1
9.2 Other Recreational Items & Equip. 0.46 100.5 100.3 100.2 100.0 99.6 0.3 0.3 0.5 1.0
9.3 Recreational & Cultural Services 0.37 100.0 100.0 100.0 100.0 100.0 0.0 0.0 0.0 0.0
9.4 Newspapers, Books & Stationary 0.13 100.7 100.3 100.1 100.0 98.2 0.4 0.5 0.7 2.6
10 Education 3.34 104.1 104.0 100.0 100.0 99.9 0.0 4.1 4.1 4.2
10.1 Pre-Primary & Primary Education 0.80 105.0 105.0 100.0 100.0 99.8 0.1 5.0 5.0 5.2
10.2 Secondary & Tertiary Education 2.54 103.8 103.7 100.0 100.0 100.0 0.0 3.8 3.8 3.8
11 Restaurants & Hotels 2.76 101.7 101.4 100.5 100.0 98.2 0.2 1.1 1.7 3.6
11.1 Restaurants, Cafes and the Like 2.31 101.9 101.6 100.5 100.0 98.2 0.3 1.3 1.9 3.8
11.2 Accommodation Services 0.45 100.6 100.6 100.5 100.0 97.7 0.0 0.2 0.6 3.0
12 Miscellaneous Goods & Services 10.55 101.0 100.7 100.5 100.0 93.3 0.3 0.5 1.0 8.3
12.1 Personal Care 1.71 101.7 101.1 100.7 100.0 99.1 0.6 0.9 1.7 2.6
12.2 Personal Effects N.E.C. 1.24 102.0 101.2 100.0 100.0 98.8 0.8 2.0 2.0 3.3
12.3 Social Protection 0.07 102.0 102.0 100.0 100.0 100.0 0.0 2.0 2.0 2.0
12.4 Insurance 4.73 100.7 100.7 100.7 100.0 90.9 0.0 0.0 0.7 10.7
12.5 Financial Services 0.79 101.1 100.7 100.4 100.0 98.4 0.4 0.7 1.1 2.7
12.6 Taxes Licences, Fees 2.01 100.5 100.0 100.1 100.0 97.8 0.4 0.4 0.5 2.7
All-Items Index 100.0 101.2 101.0 100.4 100.0 97.9 0.2 0.8 1.2 3.4
Consumer Price Index- February 2017
9
Statistics Botswana
TABLE 3: COST-OF-LIVING INDEX BY TRADABILITY (September 2016 = 100.0) All Items Non-Tradable Domestic Tradable Imported Tradable All Tradable
Index Inflation Index Inflation Index Inflation Index Inflation Index Inflation
Weights 100.0 35.83 20.39 43.77 64.17
2014 Jan 92.0 4.4 85.6 4.4 91.7 5.8 97.0 3.6 94.9 4.4
Feb 92.4 4.6 85.7 4.5 92.8 6.9 97.1 3.5 95.4 4.8
Mar 92.7 4.4 86.1 4.7 93.2 6.0 97.3 3.3 95.7 4.3
Apr 93.5 4.5 87.7 5.7 93.7 5.1 97.6 3.4 96.1 4.1
May 93.7 4.5 87.8 5.6 93.9 5.1 97.9 3.5 96.3 4.1
Jun 94.0 4.6 88.3 5.8 94.0 5.4 98.1 3.4 96.5 4.1
Jul 94.1 4.5 88.3 5.7 94.1 5.5 98.3 3.2 96.7 4.1
Aug 94.3 4.6 88.5 5.8 94.2 5.4 98.7 3.4 97.0 4.1
Sept 94.5 4.5 88.7 5.8 94.1 5.1 99.0 3.3 97.1 4.0
Oct 94.6 4.3 88.7 5.5 94.2 5.0 99.2 3.3 97.3 3.9
Nov 94.9 4.3 88.9 5.3 94.2 4.6 99.7 3.5 97.6 4.0
Dec 94.6 3.8 89.2 5.4 94.2 4.3 98.9 2.4 97.1 3.1
2015 Jan 95.4 3.6 89.8 4.9 95.5 4.2 99.4 2.5 97.9 3.1
Feb 95.0 2.8 90.0 5.1 96.0 3.4 98.0 0.9 97.2 1.9
Mar 95.3 2.8 90.4 4.9 96.6 3.6 98.2 1.0 97.6 1.9
Apr 96.4 3.1 93.0 6.1 96.9 3.5 98.5 0.9 97.9 1.9
May 96.5 3.0 93.3 6.3 96.9 3.2 98.6 0.8 98.0 1.7
Jun 96.9 3.1 94.3 6.9 96.9 3.0 98.7 0.6 98.0 1.5
Jul 97.0 3.1 94.4 6.9 96.9 2.9 99.0 0.7 98.2 1.5
Aug 97.2 3.0 94.5 6.8 97.0 2.9 99.3 0.6 98.4 1.4
Sept 97.3 2.9 95.3 7.4 96.6 2.7 99.2 0.2 98.2 1.1
Oct 97.6 3.1 95.4 7.5 97.3 3.3 99.3 0.2 98.3 1.1
Nov 97.6 2.9 95.4 7.4 97.4 3.4 99.3 -0.4 98.6 1.0
Dec 97.6 3.1 96.0 7.6 97.4 3.5 98.9 0.0 98.3 1.2
2016 Jan 97.9 2.7 96.3 7.3 98.0 2.6 99.1 -0.3 98.6 0.8
Feb 97.9 3.0 96.4 7.0 98.4 2.5 98.8 0.7 98.6 1.4
Mar 98.2 3.0 96.9 7.3 98.6 2.1 99.0 0.8 98.8 1.3
Apr 99.1 2.8 98.7 6.1 99.1 2.3 99.4 0.9 99.3 1.4
May 99.2 2.8 98.9 6.0 99.4 2.5 99.4 0.8 99.4 1.4
Jun 99.4 2.7 99.4 5.4 99.3 2.5 99.6 0.9 99.5 1.5
Jul 99.6 2.7 99.4 5.4 99.5 2.8 99.7 0.7 99.6 1.5
Aug 99.7 2.6 99.5 5.3 99.9 3.0 99.9 0.6 99.9 1.5
Sept 100.0 2.8 100.0 4.9 100.0 3.5 100.0 0.9 100.0 1.9
Oct 100.2 2.7 100.1 4.9 100.3 3.1 100.2 0.9 100.2 1.9
Nov 100.4 2.9 100.1 4.9 100.7 3.4 100.5 1.2 100.6 2.1
Dec 100.5 3.0 100.1 4.3 100.9 3.6 100.6 1.8 100.7 2.5
2017 Jan 101.0 3.1 100.4 4.3 102.2 4.3 100.8 1.7 101.2 2.6
Feb 101.2 3.4 100.5 4.3 102.7 4.3 101.1 2.4 101.6 3.1
% Change on last month 0.2 0.1 0.5 0.3 0.3
Consumer Price Index- February 2017
10
Statistics Botswana
TABLE 4: Core Inflation Rates by Exclusion and Trimmed Mean
Year Month
Consumer Price Index (Trimmed
Mean) (September 2016 = 100)
Core Monthly Inflation Rate
(Trimmed Mean) (percentage)
Consumer Price Index (Excluding
Administered Prices) (September 2016 = 100)
Core Monthly Inflation (Excluding
Administered Prices) (percentage)
2014
Jan 90.2 4.1 89.5 5.2
Feb 90.0 4.1 90.0 5.5
Mar 90.9 4.0 90.3 5.2
Apr 90.8 4.1 90.9 5.2
May 91.0 4.1 91.2 5.2
Jun 92.2 4.2 91.5 5.3
Jul 92.4 4.2 91.7 5.3
Aug 92.2 4.2 92.0 5.3
Sept 92.3 4.1 92.2 5.2
Oct 92.9 4.0 92.3 5.1
Nov 93.2 3.9 92.6 5.0
Dec 91.6 3.7 92.9 4.9
2015 93.7
Jan 92.6 3.6 4.8
Feb 92.7 3.2 94.3 4.8
Mar 93.0 3.3 94.7 4.8
Apr 95.5 3.6 95.3 4.8
May 95.7 3.5 95.4 4.7
Jun 96.1 3.6 95.8 4.7
Jul 96.1 3.6 96.0 4.7
Aug 96.4 3.5 96.2 4.6
Sept 96.8 3.4 96.6 4.8
Oct 97.1 3.6 96.9 5.0
Nov 97.1 3.3 97.0 4.7
Dec 97.0 3.2 97.1 4.5
2016
Jan 97.5 2.8 97.5 4.0
Feb 97.7 2.6 97.8 3.7
Mar 97.9 2.5 98.1 3.7
Apr 98.5 2.4 98.9 3.9
May 98.7 2.3 99.1 3.8
Jun 98.7 2.4 99.3 3.6
Jul 99.5 2.5 99.5 3.6
Aug 99.7 2.4 99.7 3.6
Sept 100.0 2.6 100.0 3.6
Oct 100.2 2.2 100.2 3.4
Nov 100.4 2.5 100.6 3.7
Dec 100.5 2.5 100.7 3.7
2017
Jan 101.0 2.7 101.3 3.9
Feb 101.1 2.9 101.6 3.9
Consumer Price Index- February 2017
11
Statistics Botswana
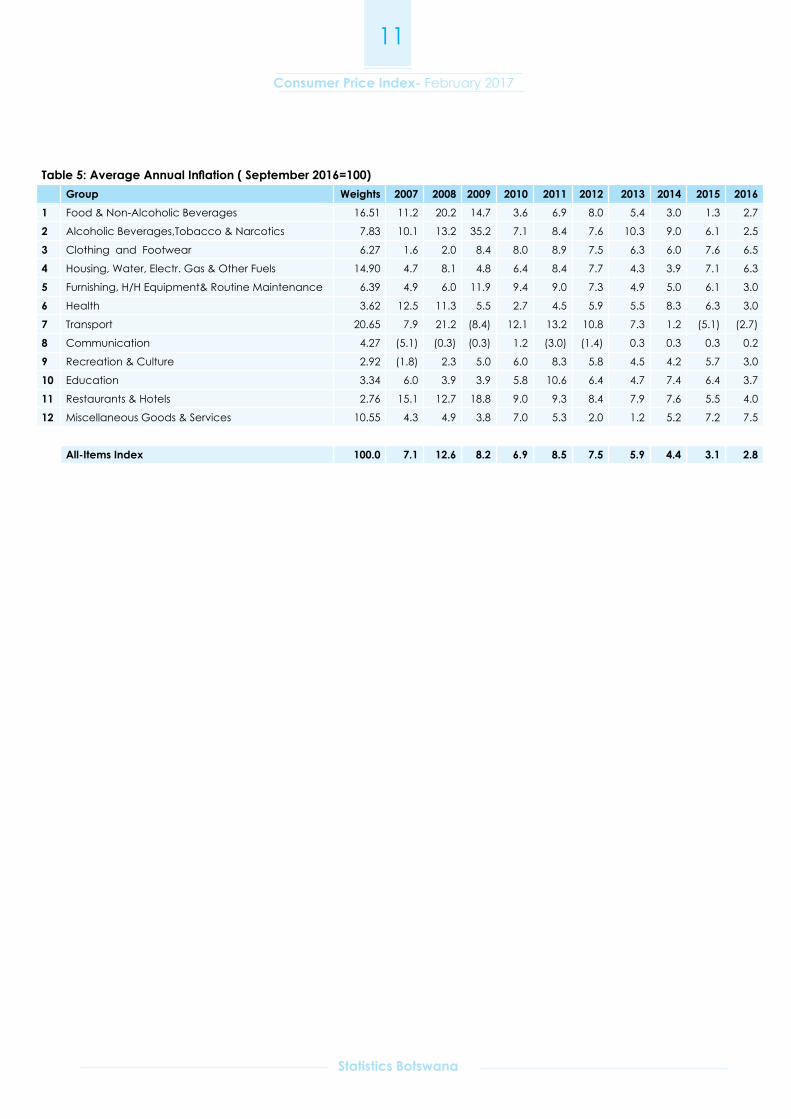
Table 5: Average Annual Inflation ( September 2016=100)Group Weights 2007 2008 2009 2010 2011 2012 2013 2014 2015 2016
1 Food & Non-Alcoholic Beverages 16.51 11.2 20.2 14.7 3.6 6.9 8.0 5.4 3.0 1.3 2.7
2 Alcoholic Beverages,Tobacco & Narcotics 7.83 10.1 13.2 35.2 7.1 8.4 7.6 10.3 9.0 6.1 2.5
3 Clothing and Footwear 6.27 1.6 2.0 8.4 8.0 8.9 7.5 6.3 6.0 7.6 6.5
4 Housing, Water, Electr. Gas & Other Fuels 14.90 4.7 8.1 4.8 6.4 8.4 7.7 4.3 3.9 7.1 6.3
5 Furnishing, H/H Equipment& Routine Maintenance 6.39 4.9 6.0 11.9 9.4 9.0 7.3 4.9 5.0 6.1 3.0
6 Health 3.62 12.5 11.3 5.5 2.7 4.5 5.9 5.5 8.3 6.3 3.0
7 Transport 20.65 7.9 21.2 (8.4) 12.1 13.2 10.8 7.3 1.2 (5.1) (2.7)
8 Communication 4.27 (5.1) (0.3) (0.3) 1.2 (3.0) (1.4) 0.3 0.3 0.3 0.2
9 Recreation & Culture 2.92 (1.8) 2.3 5.0 6.0 8.3 5.8 4.5 4.2 5.7 3.0
10 Education 3.34 6.0 3.9 3.9 5.8 10.6 6.4 4.7 7.4 6.4 3.7
11 Restaurants & Hotels 2.76 15.1 12.7 18.8 9.0 9.3 8.4 7.9 7.6 5.5 4.0
12 Miscellaneous Goods & Services 10.55 4.3 4.9 3.8 7.0 5.3 2.0 1.2 5.2 7.2 7.5
All-Items Index 100.0 7.1 12.6 8.2 6.9 8.5 7.5 5.9 4.4 3.1 2.8
Consumer Price Index- February 2017
12
Statistics Botswana
"
"
"
!
!
!
!
!
!
!
!
!
!
!!
!!
!!
!
!
!
!
"
"!
!
!
!
!
!!
!
!
!!
!
!
!
!
!
!
!
!
!
!
! !
!
MaunNata
Kang
Kanye
Tutume
Tonota
Serowe
Kasane
Ghanzi
Shakawe
Mochudi
Masunga
Palapye
Tsabong
Sehithwa
Ramotswa
Bobonong
Mahalapye
Letlhakane
MolepololeJwaneng
Lobatse
Selebi Phikwe
Gaborone
Francistown
Tsau
Werda
Serule
MopipiRakops
Gumare
Pitsane
Manyana
Artesia
Sikwane
Ratholo
Khakhea
Mogobane
Tshesebe
Hukuntsi
Good Hope
Machaneng
Mabutsane
Letlhakeng
Tsetsebjwe
Lentsweletau
Pandamatenga
Charles Hill
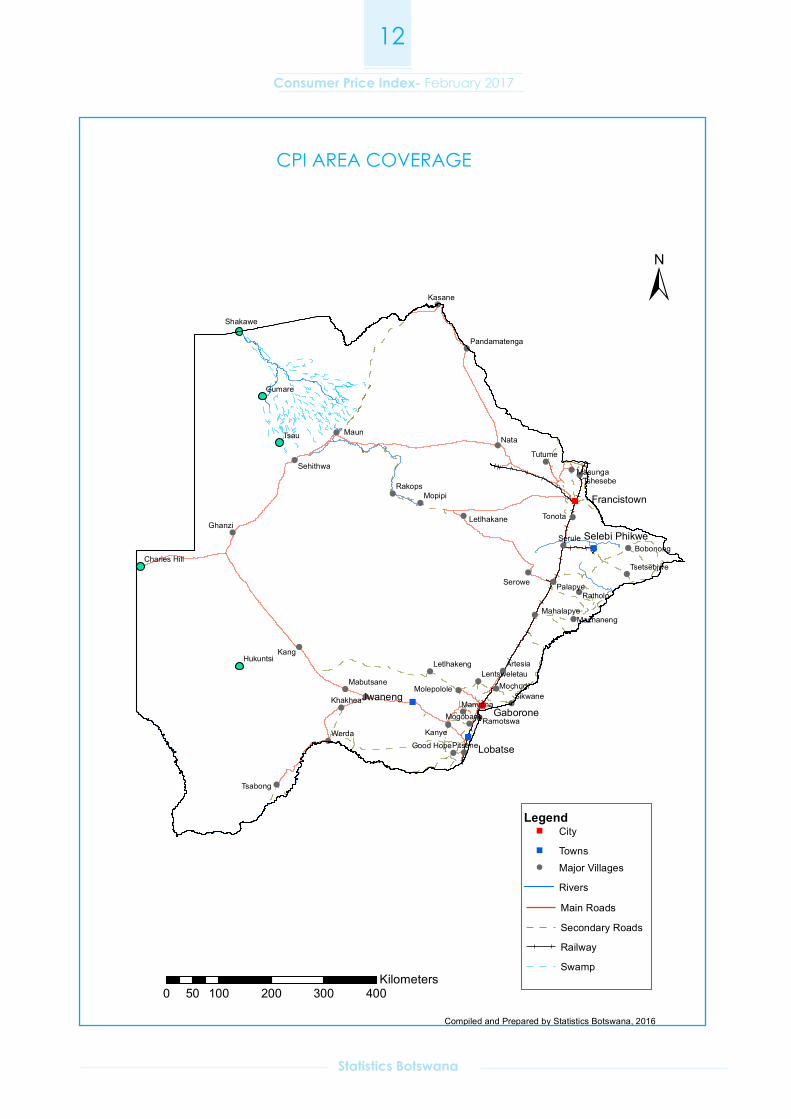
CPI Area Coverage
Compiled and Prepared by Statistics Botswana, 2016
0 100 200 300 40050Kilometers
±
Legend
! Major Villages
Railway
Rivers
Swamp
Main Roads
Secondary Roads
City"
Towns"
CPI AREA COVERAGE
Consumer Price Index- February 2017
13
Statistics Botswana
GLOSSARY
Consumer Price Index (CPI) is an index which measures price changes in goods and services with reference to a base period.
Inflation is a measurement of prices movement of goods and services in a particular country.
Domestic Tradable refers to the goods and services which a country (Botswana) can export to other countries.
Imported Tradable represents the goods and services which a country (Botswana) imports from other countries (trading partners).
Non-Tradable refers to the goods and services which a country cannot either export or import to other countries.
All –Tradable refers to the total of Domestic and Imported tradable.
Trimmed Mean Core Inflation- attempts to remove 8 percent (by weight) of the commodity sub-groups with the largest price changes at each of the ends of an ordered series of price changes in any given month.
Core inflation by Exclusion is a measure used to remove the volatility inherent in prices that are only adjusted periodically and not always in response to currently prevailing market forces.