Embed Size (px)
Citation preview
Statistical agency
Statistics Sweden
Quality declaration Page
2017-02-17 1 (21)
QUALITY DECLARATION Consumer Price Index
Subject area Prices and consumption
Statistical area Consumer Price Index
Product code PR0101
Reference time 2017 month
Statistical agency
Statistics Sweden
Quality declaration Page
2017-02-17 2 (21)
The quality of the statistics ......................................................................................... 3 1 Relevance ....................................................................................................................... 3
1.1 Purpose and information needs..................................................................................... 3 1.1.1 Purpose of the statistics ..................................................................................... 3 1.1.2 User information needs ...................................................................................... 4
1.2 Content of the statistics .......................................................................................... 5 1.2.1 Units and populations ........................................................................................ 5 1.2.2 Variables ............................................................................................................ 6 1.2.3 Statistical measures ........................................................................................... 6 1.2.4 Study domains ................................................................................................... 7 1.2.5 Reference time .................................................................................................. 8
2 Accuracy ......................................................................................................................... 8 2.1 Overall accuracy .................................................................................................... 8 2.2 Sources of inaccuracy ............................................................................................ 9
2.2.1 Sampling ............................................................................................................ 9 2.2.2 Frame coverage ............................................................................................... 12 2.2.3 Measurement ................................................................................................... 12 2.4.4 Non-response .................................................................................................. 15 2.2.5 Data processing ............................................................................................... 15 2.2.6 Model assumptions .......................................................................................... 15
2.3 Preliminary statistics compared with final statistics .............................................. 17 3 Timeliness and punctuality ............................................................................................ 17
3.1 Production time .................................................................................................... 17 3.2 Frequency ............................................................................................................ 17 3.3 Punctuality ............................................................................................................ 17
4 Accessibility and clarity ................................................................................................. 18 4.1 Access to the statistics ......................................................................................... 18 4.2 Possibility of obtaining additional statistics ........................................................... 18 4.3 Presentation ......................................................................................................... 18 4.4 Documentation ..................................................................................................... 18
5 Comparability and coherence ....................................................................................... 19 5.1 Comparability over time ........................................................................................ 19 5.2 Comparability among groups ............................................................................... 20 5.3 Other coherence .................................................................................................. 20 5.4 Numerical consistency ......................................................................................... 20
General information ................................................................................................... 20 A The classification Official Statistics of Sweden ............................................................. 20 B Confidentiality and the handling of personal data ......................................................... 20 C Storage and elimination ................................................................................................ 20 D Obligation to provide information .................................................................................. 20 E EU regulation and international reporting ...................................................................... 20 F History ........................................................................................................................... 21 G Contact details .............................................................................................................. 21
Statistical agency
Statistics Sweden
Quality declaration Page
2017-02-17 3 (21)
The quality of the statistics
1 Relevance The Consumer Price Index (CPI) is partly used for the indexation of various agreements and in part for economic analyses. Many agreements, taxes and public expenditures are directly linked to the CPI or indirectly via the price base amount, which is projected forward with the CPI inflation in June on an annual basis.1 The inflation rate, or the twelve-month figure, is calculated as the percentage change in the CPI over the past 12 months. Other measures of inflation, such as with fixed interest, constant tax and excluding energy products, are also calculated.
In parallel with the CPI, the EU-defined measure HICP (Harmonised Index of Consumer Prices) is calculated to improve comparisons between countries. HICP differ somewhat from the CPI with regard to the coverage of products and calculation methods.
In the individual user situation, the CPI’s ‘basket of goods’ (i.e. the composition of goods and services in the CPI) can be more or less relevant. The ‘plutocratic’ basket of goods with a weighting factor based on the total expenditure per purpose within the total private consumption may be highly relevant for economic analyses. A democratic approach that entails calculating an average of all households’ or individuals’ price trends may arguably be more relevant for various compensation purposes. This is because different demographic groups spend different amounts of money and use different social transfers. Such a calculation is not practicable, though.
1.1 Purpose and information needs
1.1.1 Purpose of the statistics The CPI shall measure the average price trend for private consumption. The survey provides a number of statistical measures with different delimitations of the basket of goods (i.e. the goods included in the measurement). The CPI index figure with the base year 1980 is the prevailing measure for calculations of price adjustments and compensations, i.e. revaluations of individual amounts transferred between the public and the private sectors.
On a detailed level (for different goods and services), index figures in the CPI are used for volume calculations (deflation) of private consumption in the national accounts and retail trade turnover. As part of the Official Statistics of Sweden, Statistics Sweden has also been calculating the measure CPI-CT (CPI with constant tax) since 2014. In CPI-CT, the effects of changed indirect taxes and subsidies are excluded from the CPI.
The inflation rate, calculated as the percentage change in the CPI over the past 12 months, is used in economic analyses. The CPI inflation chiefly constitutes
1 In a study by the Riksbank, it was found that approximately a fourth of the government’s total figures have a direct connection to the CPI or the price base amount (http://www.riksbank.se/Documents/Rapporter/ Riksbanksstudie/2016/rap_riksbanksstudie_160914_sve.pdf ).

Statistical agency
Statistics Sweden
Quality declaration Page
2017-02-17 4 (21)
a target variable for Sweden’s monetary policy. Statistics Sweden also calculates other measures of inflation, such as CPIF (CPI with fixed interest) and CPIF excluding energy on behalf of Sweden’s central bank, the Riksbank. In CPIF and CPIF excluding energy, the direct effects of changed interest rates on housing loans are excluded from the CPI. In CPIF excluding energy, the price trend for energy products is also excluded.
The HICP has been developed to allow comparisons of inflation between countries within the EU. The way national consumer price indices are calculated varies between countries and in HICP, the methods have been coordinated to a certain extent. In relation to HICP, a constant tax index called HICP-CT is also calculated.
All price indices calculated by Statistics Sweden are based on the same monthly collected price information, even if the coverage and index construction differ to some extent. The basis of the CPI has been adopted by the government and the Riksdag following proposals in government inquiries. The most important calculation rules date from the 1952 Index Committee, the 1955 Housing Index Inquiry and the 1999 Index Inquiry, SOU 1999:124. A special committee is linked to Statistics Sweden and the CPI, the Consumer Price Index Board. The Board shall assist in matters of principle relating to the application of the index calculation criteria and promote the development of methods for calculating the CPI. Memoranda from past meetings in recent years are accessible on Statistics Sweden’s website, www.scb.se/sv_/Om-SCB/Verksamhet/Rad-och-namnder/Namnden-for-konsumentprisindex/Underlag-namnden-for-konsumentprisindex/.
1.1.2 User information needs The main users of the CPI and measures related to the CPI:
• The Ministry of Health and Social Affairs: for establishing the price base amount which is linked to certain pensions, other social benefits and student loans.
• The Riksbank: the CPI as an explicit target variable and as a basis for monetary policy decisions. CPIF and other related measures as supplementary measures of inflation.
• The Ministry of Finance: as a basis for decisions on economic policy and stabilisation policy.
• Swedish National Institute of Economic Research: for economic analyses.
• The Swedish Tax Agency: for the calculation of conversion ratios for the taxation of capital gains on property and for calculating break points in income tax rates.
• Statistics Sweden: for deflating in the national accounts as well as the service industry statistics (concerning turnover and inventory).
• Other government administration: including the Swedish Board of Agriculture, which monitors and analyses consumption figures and price trends on the consumer level.
Statistical agency
Statistics Sweden
Quality declaration Page
2017-02-17 5 (21)
• Organisations, enterprises and individuals: for indexation of agreements and conversions of value amounts to fixed monetary values.
• Asset management enterprises and institutions: as a basis for assessing future interest rates and real returns.
The principal users of HICP are:
• The European Central Bank (ECB): for evaluating the EMU’s monetary policy goals and for following up the convergence criterion regarding price stability for membership in the EMU.
1.2 Content of the statistics The CPI shall measure the average price trend for all private consumption in Sweden.
1.2.1 Units and populations The population of interest consists of all transactions in private consumption in Sweden in the period to which the price index refers.
It would not be practicable to observe and measure transactions between enterprises and private consumers except in exceptional cases. The survey’s target population is therefore defined by the goods offered for sale by companies to private consumers (product offers). The difference from the goods actually sold by enterprises (the population of interest) is that in the target population includes goods that may not be sold at all during the reference period. In the implementation, it is considered important that the price collector chooses product offers that are considered to sell well, i.e. which can be regarded as representative.
The target population includes goods that are largely purchased by foreigners visiting Sweden, such as hotel nights. The consumption of Swedes abroad is not included. Package tours that include foreign holidays are included if the whole service is purchased in Sweden. Foreign travel by air, train, bus and boat is included if the trip departs from Sweden and tickets are sold here. Commerce from domestic Internet websites is included. Areas not included in the target population are certain other health and social care fees (childcare and elderly care are included, though), certain financial services and various other services (such as company car benefits). Product groups with high artistic values cannot be measured as it would be impossible to make comparisons over time.
To describe the target population, a population of retail outlets (unit = shops, service outlets, websites, etc.) and a population of products (unit = goods and services) are defined. That way, the combination of retail outlet and product results in the specific product offer to be measured.
The retail outlet population changes somewhat over the year as some units close down, start up or change. The product unit has different meanings in the surveys. Packaged food consists of products that are fully specified with an article number. For furniture, for example, generic definitions are used that delimit the definition of a chair without an upholstered seat and a seat with an upholstered seat. Products may cease to exist or be added from month to month, in the entire market or in a specific retail outlet. While certain products
Statistical agency
Statistics Sweden
Quality declaration Page
2017-02-17 6 (21)
are considered to be entirely new, others can be regarded as substitutes for others, even though they are not exactly alike. The population of products is described by the product groups in Table 1 below.
A product offer is an observable good or service that is offered for sale at a given price in a certain retain outlet (such as a shop), on certain terms and conditions at a certain point of time. The price on a product offer can change during a month, which means that the survey must delimit the time for the population of product offers. An entire calendar month should be an ideal population, at least for price adjustments and compensations, but a practical delimitation to the week in the middle of the month, or the three weeks in the middle of the month, is considered to be a sufficient approximation for most purposes.
1.2.2 Variables The primary variable is the price paid by the consumer for the product offer. To allow adjustments of the prices for comparability between product offers that may differ in some ways, packaging sizes and quality characteristics are also collected.
1.2.3 Statistical measures
CPI CPI is an index figure with the base year 1980 = 100
The CPI is calculated as a chain index with annual links. Every annual link measures how much the average price level has changed during the year from the average price level in the previous year. You could say that the chaining runs via the full year. The weighting factors are calculated based on the value of the consumption volume of the two years concerned. A final link measures the change in the current month’s price level from the average price level of the full two years before. The weighting factors are calculated based on full-year consumption amounts for the two previous years. Index figures are calculated by multiplying, i.e. chaining together, annual links (via the full year) and ending with the link for the relevant month. In the period from 1980–2004, the calculation of the CPI was based on a different index construction, so the chain for those years consists of other links. For more information about index construction in the CPI, see the memorandum Förbättrad KPI-konstruktion från 2005: Teknisk beskrivning on Statistics Sweden’s website.
When calculating the index on a detailed level, the index is calculated using Jevon’s index formula – the geometrical mean value of price ratios. If the information is accessible, the price ratios are weighted with inverted sampling probabilities for products and retail outlets, respectively (when sampling probability is applied) and estimated market shares.
CPI with constant tax (CPI-CT) CPI-CT is an index figure with the base year 1980 = 100. It is a constant tax index where effects from changed taxes and subsidies are deducted from the actual price trend. The index calculation is based on the gross price; taxes and subsidies are included in the weight but do not affect the trend. Taxes and subsidies refer to such taxes and subsidies that are added directly to various
Statistical agency
Statistics Sweden
Quality declaration Page
2017-02-17 7 (21)
consumer products, such as value-added tax and various energy taxes that affect the consumer price on fuel. From a method perspective, the CPI-CT complies with former constant tax indices used by the Riksbank in its monetary policy analysis (such as the CPIX, previously called UND1X, and UNDINHX). For example, all tax changes are assumed to have an immediate and complete impact on consumer prices. A difference from the previous measure is that only tax changes that are in addition to the general price trend are adjusted for each period.
The inflation rate based on the CPI The inflation rate is calculated as the percentage change in the CPI over the past 12 months. Based on the CPI, related measures of inflation are also calculated, sometimes referred to as underlying inflation.
• CPI with fixed interest (CPIF); • CPI with fixed interest and constant tax (CPIF-CT); and • CPI with fixed interest and excluding energy products.
These measures are not included in the Official Statistics of Sweden; they are calculated on behalf of the Riksbank.
HICP (Harmonised Index of Consumer Prices) Index figures (2015 = 100), change in percent since the previous month, change in percent during the most recent 12-month period. Like the CPI, the HICP is a chain index with annual links, but with chaining via December.
1.2.4 Study domains In the regular dissemination of CPI and HICP, there are 12 main categories and some 90 sub-categories of products in private consumption according to the international standard for Classification of Individual Consumption by Purpose (COICOP). No regional dissemination is made, neither by industry or type of retail outlet.
Statistical agency
Statistics Sweden
Quality declaration Page
2017-02-17 8 (21)
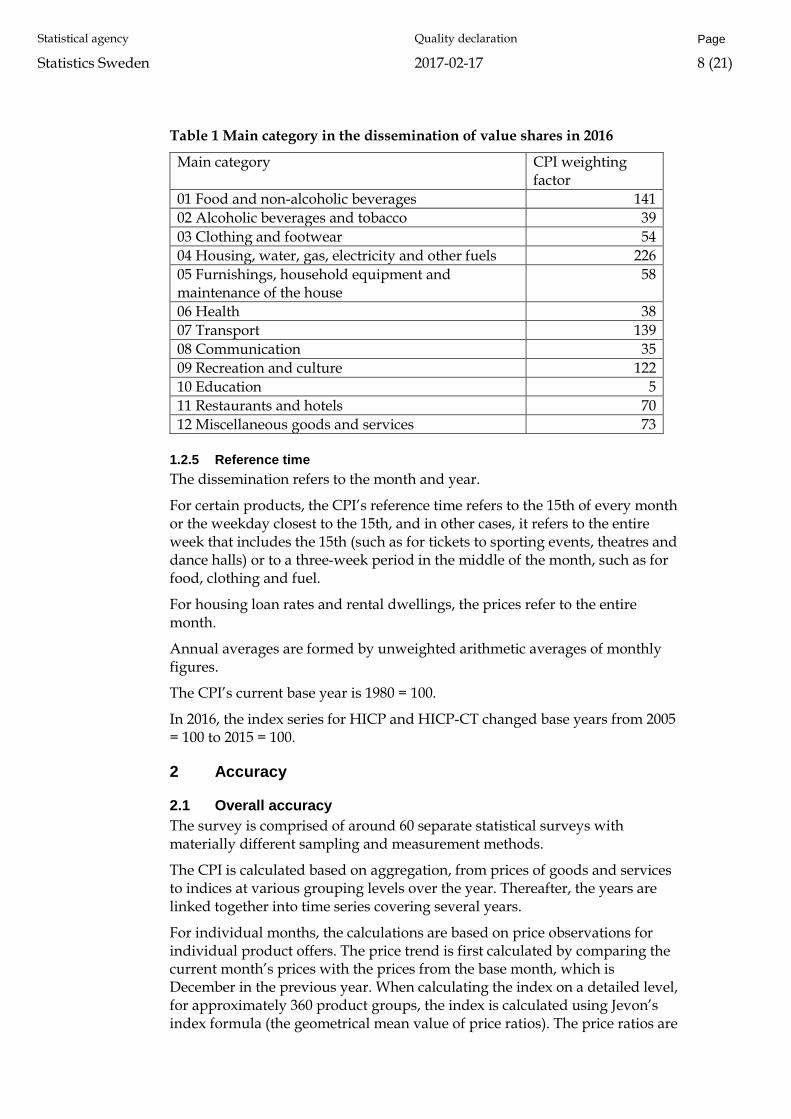
Table 1 Main category in the dissemination of value shares in 2016
Main category CPI weighting factor
01 Food and non-alcoholic beverages 141 02 Alcoholic beverages and tobacco 39 03 Clothing and footwear 54 04 Housing, water, gas, electricity and other fuels 226 05 Furnishings, household equipment and maintenance of the house
58
06 Health 38 07 Transport 139 08 Communication 35 09 Recreation and culture 122 10 Education 5 11 Restaurants and hotels 70 12 Miscellaneous goods and services 73
1.2.5 Reference time The dissemination refers to the month and year.
For certain products, the CPI’s reference time refers to the 15th of every month or the weekday closest to the 15th, and in other cases, it refers to the entire week that includes the 15th (such as for tickets to sporting events, theatres and dance halls) or to a three-week period in the middle of the month, such as for food, clothing and fuel.
For housing loan rates and rental dwellings, the prices refer to the entire month.
Annual averages are formed by unweighted arithmetic averages of monthly figures.
The CPI’s current base year is 1980 = 100.
In 2016, the index series for HICP and HICP-CT changed base years from 2005 = 100 to 2015 = 100.
2 Accuracy
2.1 Overall accuracy The survey is comprised of around 60 separate statistical surveys with materially different sampling and measurement methods.
The CPI is calculated based on aggregation, from prices of goods and services to indices at various grouping levels over the year. Thereafter, the years are linked together into time series covering several years.
For individual months, the calculations are based on price observations for individual product offers. The price trend is first calculated by comparing the current month’s prices with the prices from the base month, which is December in the previous year. When calculating the index on a detailed level, for approximately 360 product groups, the index is calculated using Jevon’s index formula (the geometrical mean value of price ratios). The price ratios are
Statistical agency
Statistics Sweden
Quality declaration Page
2017-02-17 9 (21)
weighted with inverted sampling probabilities for products and retail outlets, respectively, when sampling probability is applied and with estimated market shares when available.
At an overall level, accuracy is considered sufficient, but for various reasons, separate surveys are sometimes associated with inaccuracies. A detailed description of the sources of inaccuracy is provided in Section 2.2.
2.2 Sources of inaccuracy The most important sources of inaccuracy in the CPI and HICP are the composition of the basket of goods, i.e. the weighting factors, sampling of retail outlets, products and product offers and products that are new in the market.
It is believed that new products in the market are the greatest source of inaccuracy. The source of inaccuracy caused by sampling is relatively large, but it can be estimated and can therefore guide the users of the statistics. New products can be a source of bias, a systematic under- or overestimation, most likely an overestimation. Consumers choose products that are new in a market because they consider them to be better in relation to the price than existing products (which are priced in the CPI). The evaluation of quality differences in case of necessary changes is also very difficult. According to the principles, the valuation should be carried out based on the consumers’ valuations, which is very difficult in practice.
The method of calculation used for sub-surveys are also of relevance for the result. As the CPI is calculated using many sub-surveys, it can be a source of inaccuracy for the user of the statistics if the user does not have complete knowledge about the methods applied. This applies especially to the calculation of costs related to owner-occupied housing and tenant-owned dwellings.
2.2.1 Sampling
Sampling of retail outlets in the CPI’s local price collection A sample of retail outlets (shops, hypermarkets, restaurants, etc.) is drawn annually for the CPI, in two stages. Small municipalities that are located far away from Statistics Sweden’s price collectors, where the total commerce constitutes a maximum of 10 percent of all commerce in Sweden, can be excluded from the sampling frame. At the first stage, a sample of geographic areas (based on postal codes) are drawn, to concentrate travel for the price collectors. At the second stage, retail outlets are sampled according to the method rotated sequential Poisson sampling with sampling probabilities proportional to size (πps sampling). Every year, approximately 20 percent of units are intentionally replaced; an additional approximately 10 percent are replaced due to changes in the population. Accordingly, approximately 70 percent of units remain in the sample from the previous year. The units that are included in the CPI’s local price collection are divided into some 40 strata by industry according to the Swedish Standard Industrial Classification (SNI 2007).
The size of the retail outlets, measured by the number of employees and turnover according to VAT statistics, may be poorly correlated to the sales of
Statistical agency
Statistics Sweden
Quality declaration Page
2017-02-17 10 (21)
individual product groups. Among other things, this means that retail outlets with a high turnover per employee are underrepresented and that retail outlets with high sales to others than private consumers are overrepresented.
Sampling of products in the CPI’s collection of prices on everyday items Prices for packaged food, laundry detergent and other everyday items are collected from about 80 shops in three major retail chains. For every retail chain, Statistics Sweden selects a statistical sample of approximately 800 carefully specified representative products in some 90 product groups. The sample is based on statistics collected from the data systems of the shops, i.e. cash register data. The samples are randomly drawn with probability in proportion to total sales. Samples for price measurement at pharmacies (not pharmaceuticals, which are measured in a different survey), tobacco shops and health food stores are also selected using the same method. The sample of representative products is updated annually.
Sampling of representative products in the CPI’s other local price collection General specifications of representative products (generic definitions) are determined centrally for a large part of the remaining price collection, i.e. a deliberate sample is used here.
Sampling of product offers in the local price collection For each product, the price collectors are instructed to choose the most popular product offers, i.e. those that sell the most (in volume) during their first visit to the selected retail outlets. Product offers must be substituted in the sample as they disappear from the market. In such a case, the price collector shall choose a product that is both reasonably comparable with the former and representative.
Sampling in the CPI’s central price measurement The sampling of retail outlets and products in the central price collection is drawn using the methods πps sampling, modified ratio sampling and cut-off sampling. In cut-off sampling, the largest units in a population are usually selected. In some sub-surveys, all units are included in the sample. To some extent, the samples are renewed annually.
Weighting factor Price trends are calculated for approximately 360 product groups, with weighting factors that are based on preliminary annual calculations in the national accounts concerning households’ consumption expenditures, household budget surveys (HUT, HBU, HBS) and retail trade statistics as well as a number of other sources of information about the private consumption of various products. Many of the 360 product groups are weighted totals of groups at an even more detailed level, with available information regarding the weighting factor.
Estimating sampling inaccuracy in the CPI The major source of sampling inaccuracy is the price collector’s selection of product offers. For example, it is reasonable to assume that two furniture stores may have a comparable price trend for sofas, but that the listed price may vary considerably depending on whether price collector 1 selects sofa A and price collector 2 selects sofa B.
Statistical agency
Statistics Sweden
Quality declaration Page
2017-02-17 11 (21)
In general, sampling inaccuracy can be reduced by increasing the total size of the sample. More product offers make a greater difference than a greater sample of retail outlets and products (Norberg 2004).
In recent years, Statistics Sweden has increased the use of cash register data (bar code data) from retail chains. By using these data, sampling inaccuracy can be reduced, as well as the cost of the data collection. The sample for the retail sales of everyday items is currently generous enough for the variance from this part of the sub-survey to be negligible.
Inaccuracy in weighting factors leads to an inaccuracy in the CPI statistics that has not yet been evaluated.
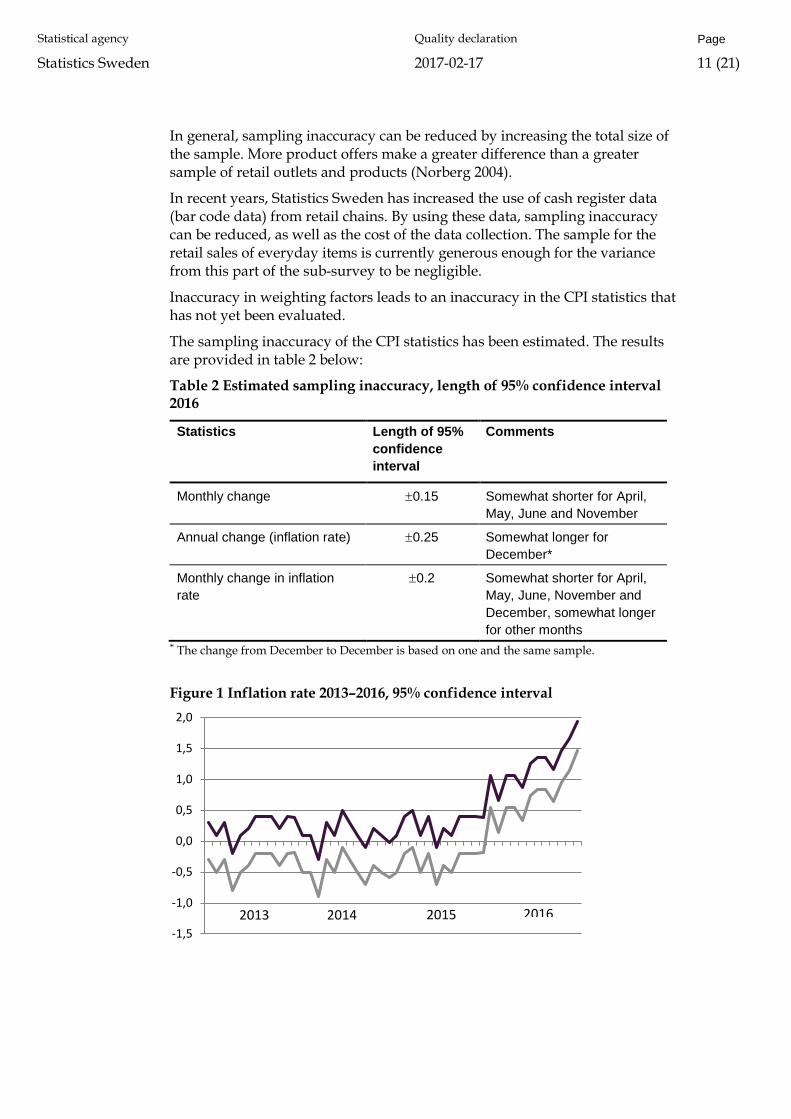
The sampling inaccuracy of the CPI statistics has been estimated. The results are provided in table 2 below:
Table 2 Estimated sampling inaccuracy, length of 95% confidence interval 2016
Statistics Length of 95% confidence interval
Comments
Monthly change ±0.15 Somewhat shorter for April, May, June and November
Annual change (inflation rate) ±0.25 Somewhat longer for December*
Monthly change in inflation rate
±0.2 Somewhat shorter for April, May, June, November and December, somewhat longer for other months
* The change from December to December is based on one and the same sample.
Figure 1 Inflation rate 2013–2016, 95% confidence interval
-1,5
-1,0
-0,5
0,0
0,5
1,0
1,5
2,0
201620142013 2015
Statistical agency
Statistics Sweden
Quality declaration Page
2017-02-17 12 (21)
2.2.2 Frame coverage
Retail outlets Sales via the Internet and mail order is possibly somewhat underrepresented. The coverage of shops is good otherwise. New retail outlets opened in the index year cannot be included according to the calculation method, which is based on annual links. This causes a bias (estimated to a mere 0.03–0.05 index points according to an investigation in 2001). No adjustment of this bias is made at present.
Products A current or complete sampling frame is often lacking for the product sample within each product category. For example, there is no list for dining tables that describes quantities/values concerning size, form, material, surface treatment, extra leaves, etc. For these kinds of product groups, one or several representative products is intentionally created with size intervals, form, materials, etc. Considering the ‘sampling method,’ statistical inaccuracy is insignificant due to coverage deficiency.
2.2.3 Measurement
Local price collection The price collection is carried out by approximately 40 of Statistics Sweden’s interviewers through visits to shops, telephone interviews and web sites. Price collection at the local level is done using tablets. The period for local price collection is three weeks: the week that includes the 15th of the month, as well as the weeks before and after this week. The month of December is an exception, since the measurement weeks are extended and brought forward.
Some minor studies have shown that interviewers sometimes note prices incorrectly. Evidently this is caused both by the interviewers’ collection and by shops marking products with the wrong price. The extent to which these errors affect the total inaccuracy of the CPI is not known.
Tablets have made it possible with different logical controls as well as automatic controls where the registered prices are related to historical values directly during the data collection, which is reasonably likely to have reduced the number of registration errors.
Central price collection Central price collection is carried out mainly per the 15th of every month or during the week that contains the 15th. Price collection is carried out centrally in cases where a product can be assumed to have uniform prices across the country, or where special methods must be used. Collection is made via the Internet and an e-mail questionnaire.
Central price collection is carried out in two steps by two employees, a price measurement and a control. The percentage of errors is therefore low.
Cash register data For everyday items excluding fresh foods, fruit and vegetables, Statistics Sweden receives cash register data directly from the retail chains. Every month, price information from three weeks is used.
Statistical agency
Statistics Sweden
Quality declaration Page
2017-02-17 13 (21)
Systembolaget AB provides Statistics Sweden with weekly sales data. The annual product sample is drawn from cash register-based data on annual turnover per article. If the articles are discontinued, exchanges are made.
For prescription drugs from all existing and new pharmacies, cash register data are also provided.
Studies of the quality of cash register data from retail sales of everyday items were provided in connection with the implementation and showed that the data are of good quality.
Quality assessment when exchanging goods, general The Consumer Price Index shall not be affected by price changes caused by changes in the quality of goods and services. When products are altered or must even be replaced (substituted), a quality assessment is carried out to remove the difference in observed prices due to different quantities and qualities.
Quality and quantity assessments when replacing everyday items Few quality assessments are made for everyday items. The same exactly specified product is measured every month as long as it is marketed (i.e. coffee medium roast for electrical brewing, brand A, package of 500 grams). In some cases, it is possible to find a fully comparable substitute, especially when the manufacturer only has made a minor change. Where applicable, prices are adjusted for changes of quantity, form of packaging, etc. If no sufficiently comparable replacement can be found, the price measurement ceases for the product in question for the rest of the year.
Quality and quantity assessments in case of replacements of everyday items are considered to have very little impact on the total inaccuracy of the CPI.
Quality assessment when replacing clothes and shoes In these groups of goods, the lifespan is very short and several replacements are generally needed during a twelve-month period. Using hedonic regression, considerable amounts of data are used concerning the goods' appearance and content in order to estimate the market value of these characteristics. In addition to prices, the interviewer therefore also collects data on the material, design, brand, etc. of the clothes.
For shoes, a tight product description is used, which means that the product offers that are replaced are usually reasonably similar to the ones they replace. Hedonic regression is used in product exchanges between brand groups to assess the market’s valuation of the difference between the brands.
It is difficult to assess the inaccuracies caused by quality assessments of clothes and shoes. In a wider perspective, it must be discussed what should be included in the quality concept for clothes. Aspects that were important in the beginning of the last century, such as durability, warmth and useful life, must now be considered secondary, as current fashion has become more important. Explanatory variables in the regression model have been chosen for this reason.
Quality assessment when replacing computers and mobile phones
Statistical agency
Statistics Sweden
Quality declaration Page
2017-02-17 14 (21)
For computers and mobile phones, a method called monthly chaining (MCR) is used to handle the exchanges. A new computer is not included in the index calculation until it has existed for two consecutive months. The index is calculated with links that refer to the change between two consecutive months. Each of these links includes the product offers that were available in the same form during both months. The sample is thus replaced gradually during the year since the lifespans for the products are short. An index for the change from December year y-1 to year y and month m is given by multiplying the monthly indices. The method is based on a market with fierce competition and the fact that technology develops quickly and that retailers therefore are motivated to check prices often and give updated price information to their customers.
To the extent that there are “clearance prices”, the method has a downward bias that is not negligible.
Quality assessment when replacing video games, books and certain other cultural media. Price collection for video games, books etc. is made from each store’s list of top-selling titles. This means that titles on the top-selling list are considered to be comparable over time. Any quality change upon replacement of titles on the top-selling list is not measured.
Quality assessment when replacing other products in local price measurements For other locally collected prices, the interviewer selects a new representative product offer when the previously measured product is no longer sold or no longer sold in any significant amount. The interviewer assesses the value of any quality difference between the new product and the old. For example, if an increase in quality can be considered to correspond to an observed price difference, the price index of the good will remain unchanged. If the quality of the change is considered equivalent to one-half of the price change, then one-half of the price difference may take effect as a price change, etc.
The model assumption is that the price collector is a representative of the average consumer and his or her assessment of a product’s quality. The problem with this approach is primarily that the population of price collectors does not have the same structure as the population of consumers.
Central collection of price information Prices are collected centrally at Statistics Sweden for products in about 100 product categories, including for products that are likely to have uniform prices across the country or where special methods must be used. One such product category is theatre tickets, where the products consist of different types of theatre tickets that can be purchased at various theatres around the country. Changes in quality are assessed in virtually the same way in the central price collection as for “other products in local price measurements” above. Consequently, the same assessment regarding inaccuracies is therefore carried out.
Measurement of housing costs The trend in housing costs is measured in part through a rental survey with a probability sample of dwellings and a similar survey regarding fees paid to tenant-owner associations by tenant-owners. In the cost calculations for
Statistical agency
Statistics Sweden
Quality declaration Page
2017-02-17 15 (21)
owner-occupied housing and tenant-owned dwellings, centrally collected interest rates on housing loans and building materials are important items in surveys regarding interest expenses, depreciation and internal repairs. In addition, price data is collected centrally for heating and electricity.
Summary The lack of clarity and inability to define quality and to measure quality differences comprise a relatively big problem for the CPI and HICP.
2.4.4 Non-response In visits to shops, telephone interviews, online data collection and direct collection from enterprises, non-response is nearly non-existent; for rental surveys, non-response is approximately 5 percent. For fees to tenant-owner associations, it is approximately 7 percent. Unweighted and weighted non-response in price measurements are a minor problem in comparison with other sources of inaccuracy. We do not know enough about the non-response to determine whether it should be considered random or systematic.
Household budget surveys form a basis for the weighting factors and have very high non-response, which in many cases renders the weighting factors uncertain at a detailed level. This inaccuracy has not been quantified.
2.2.5 Data processing A production system, Pi09, has been developed to perform most of the CPI calculations. Quality assurance of computer programs and IT systems are now in place and the risk for data processing errors is therefore minor. It is not possible to assess the impact of various types of data processing.
The observations collected are deliberately reviewed based on suspected errors and their suspected potential effect on the results. Contact is often made with the retail outlet where the observations were collected, or with the person collecting the data (the interviewer) in cases where price observations are collected locally.
2.2.6 Model assumptions
Deliberate undercoverage Many individual small product groups are not measured but instead represented at an aggregated level by a selection of other product groups. One such example is takeaway food that is often sold at a manned counter in many supermarkets these days. This consumption is represented by food in total, or by meat, fish or other sub-categories whenever possible.
Most representative products have been selected with a deliberate delimitation, which excludes many variations with small sales values; for example, wedding dresses are not included in dresses, fur is not included in leather clothes and sailboats are not included in pleasure boats.
By purpose, only some combinations of product groups and industries are measured. For example, sales of tobacco and magazines at petrol stations are therefore excluded. These are measured in other industries instead. These examples are considered to generate only minor inaccuracies in the statistics, however, as the price trend is generally determined through central decisions.
Statistical agency
Statistics Sweden
Quality declaration Page
2017-02-17 16 (21)
The sale of food at petrol stations is not negligible, at least not for certain products, but it is still not measured; instead, it is represented by grocery stores and hypermarkets.
Sales at marketplaces are not measured at all. The price trend for goods sold at marketplaces is assumed to follow the same price trend as corresponding goods sold in shops.
In the selection of retail outlets for local price measurement, trade that takes place far away from the price collector is excluded. The value excluded must not amount to more than 10 percent of the total trade. Excluded geographic areas are compensated for by region.
Consumption related to housing (homes) can be divided in four separate groups: rental dwellings, tenant-owner dwellings, owner-occupier housing and holiday homes. It is really only for the consumption value of multi-dwelling buildings that the measurements in the CPI and the national accounts have the same purpose. For the other areas, the measurement purpose is controversial; in short, a cost approach is used in the CPI and a rental equivalence approach is used in the national accounts to measure these consumption values.
Statistics Sweden would not use a model estimate unless the ensuing inaccuracy was considered to be negligible.
Measuring price The price trend for the cost of living in owner-occupied homes or tenant-owned dwellings in the CPI with the price development of the owners’ expenditure items. In addition to housing, price indices for all durable goods in the CPI are calculated using an acquisition approach. That means that the whole cost is recognised at the time of purchase. The good is consumed immediately, so to say, even if it remains in use for an extended period of time. Many examples of durable goods are treated this way in the CPI, such as washing machines and new cars. In the housing calculations, the cost is allocated to a period instead, so that the household’s cost of the housing service in principle is regarded an annual rent.
For electricity consumption and telecommunications services and similar, consumption profiles are used for which price trends are surveyed.
Measuring quality A hedonic method for quality adjustment is used in the measurement of price trends for clothing and shoes. “Consumer evaluations” of various characteristics of a garment are estimated using a statistical model applied to CPI data for one year. When garments are discontinued in a store’s range, these estimated evaluations are used to recalculate the prices of replacement garments so that their price level is comparable with the previous garments in terms of quality.
In general, the quality assessments described in 2.2.3 Measurement can be considered to constitute a relatively major source of inaccuracy of the model assumption type.
Statistical agency
Statistics Sweden
Quality declaration Page
2017-02-17 17 (21)
2.3 Preliminary statistics compared with final statistics After the official release of the CPI for a specific month, it cannot be reviewed; it will therefore apply in all contexts where references are made to the consumer price index, such as laws, ordinances or agreements.
On a few occasions, mistakes in the creation or processing of data have resulted in “incorrect” index numbers. As of 8 May 2000, the Statistical Database refers in part to the unrevised adopted total index numbers as of 1980 and in part to revised shadow index numbers for the total CPI and revised index numbers for product groups that are consistent with the shadow index numbers.
Published inflation figures can be revised, but it is rare2. CPI inflation is not calculated based on the adopted series but based on the shadow index numbers. According to the EU regulations, all HICP numbers can both be revised and disseminated in preliminarily form under certain circumstances. However, Eurostat and Statistics Sweden have different policies on when inflation figures should be revised. This means that Eurostat may revise Swedish HICP numbers while Statistics Sweden does not revise them. When such situations have occurred, however, Statistics Sweden have for practical reasons also chosen to revise HICP, to ensure that the statistics are consistent3.
3 Timeliness and punctuality
3.1 Production time Production time is about four weeks (five weeks for January). Publication is usually 10–14 days into the next month after the month of dissemination. However, the index figures for January are usually published a few days later than is the practice for other months, due to the calculation of the year's weighing factors.
3.2 Frequency CPI, CPI-CT, HICP, HICP-CT, CPIF and CPIF excluding energy and CPIF-CT are calculated and published monthly.
3.3 Punctuality The publishing follows the original publishing plan for the Official Statistics of Sweden. There are no statistics related to the occurrence of delayed publishing. Publishing delays have occurred due to the website. Those delays have never been longer than a few minutes.
The inflation rate for April–June was revised due to the so-called “shoe error”. In April 2009–May 2010, revisions were made due to new statistical materials on the tax deduction for building repairs and extensions. This tax deduction (involving renovation, conversion and extensions) is a tax subsidy granted to private individuals for certain types of work carried out in their homes). 3 On two occasions, in December 2012–January 2013 and in July 2013, the revision’s contribution to the inflation rate was less than 0.1 percentage points.
Statistical agency
Statistics Sweden
Quality declaration Page
2017-02-17 18 (21)
4 Accessibility and clarity
4.1 Access to the statistics The channel used to disseminate the statistics is chiefly Statistics Sweden’s website (scb.se) (in the form of statistical news, reports and in the Statistical Database). In the Statistical Database on scb.se, the users can produce their own tables and charts. This is where the CPI, CPI-CT, HICP, HIKP–CT, CPIF and CPIF-CT can be found.
4.2 Possibility of obtaining additional statistics Materials regarding interview surveys and retail outlet samples are stored in the SQL database. In the case of centrally collected prices, material is partly stored in the SQL database and partly stored in Excel files. Statistics Sweden conducts special processing of the material on a commission basis. The lowest level of dissemination is the product category, for example according to index table YM1 where the index and weighting factors are disseminated at the four-digit COICOP level.
4.3 Presentation CPI’s change figure and the contribution to monthly and inflation figures are also described in more detail in a statistical unit. Pursuant to COICOP, the change figure and contribution to/from all main groups are disseminated in a separate table. The inflation according to the CPI and some measures of inflation related to the CPI are also disseminated in a diagram in the statistical news.
4.4 Documentation The production of the statistical register and the statistics are described in Documentation of the statistics (SCBDOK). The quality of the statistics is described in the present document. Detailed information about microdata is described in Documentation of microdata (MetaPlus). All documentation is accessible on Statistics Sweden’s website: www.scb.se/PR0101
• Dalén, J. and Ohlsson, E.( 1995): Variance Estimation in the Swedish Consumer Price Index. Journal of Business and Economic Statistics, Vol. 13, No. 3, 347–356.
• Nilsson, H., Ribe, M. and Norberg, A. (2008) ”Variansberäkningar KPI” Project report, Statistics Sweden, 10 April 2008.
• Nilsson, P. (2014). KPI-KS (KPI med konstant skatt) och KPIF-KS (KPI med fast ränta och konstant skatt) www.scb.se/contentassets/a937c5a16b79458891bca7f273693dec/kpi-ks-och-kpif-ks-pm-2014-02-17.pdf
• Norberg, A. (2004). Comparison of Variance Estimators for the Consumer Price Index. 8th Ottawa Group Meeting – Helsinki – 23–25 August 2004.
• Norberg, A. (2013). Detaljerat underlag för variansskattning. Memorandum to the Consumer Price Index Board, 15 October 2013.
• Konsumentprisindex: Betänkande från utredningen om översyn av konsumentprisindex SOU 1999:124
Statistical agency
Statistics Sweden
Quality declaration Page
2017-02-17 19 (21)
• SM PR 15: Konsumentprisindextal 1914–2005.
• Memoranda and minutes from the Consumer Price Index Board.
• Proposal to the Riksdag: Riksdagens revisorers förslag angående konsumentprisindex (Förs. 1991/92:16).
• Commissioning of Statistics Sweden to calculate the Consumer Price Index etc., His Majesty's (Ministry of Finance) decision of 28 June 1962.
• 1955 års bostadsindexutrednings betänkande Bostadsposten i konsumentprisindex.
• The basis of the CPI, etc.: 1952 års indexkommittés betänkande (SOU 1953:23) Konsumentprisindex; Prop. 1954:1, bilaga 2; Statsutskottets utlåtande 1954:13; Riksdagens skr 1954:92.
5 Comparability and coherence
5.1 Comparability over time The CPI is a chain index with annual links. Methodology changes usually take place at the end of the year, that is, before a new annual link. Time series breaks in the form of “jumps” are therefore uncommon, as the new link, with potential new methods, is chained to the former. Times series breaks in the form of new seasonal patterns may occur.
Major changes over time are described below.
• For everyday items (non-perishable goods), price lists instead of measurements in retail outlets were used from 1983 through 1992.
• For clothing, a new measurement method was introduced as of 1991 and a new method for valuation of quality differences was introduced as of 1994.
• As of April, a new method was introduced for weighing up the individual price notations on which the index is based. During the period of January–March 1990, a deviating method was used.
As of 1984, calculations for owner-occupied housing costs were modified regarding interest and depreciation.
• Seasonal adjustments for fresh vegetables and fresh fruit ceased as of 1992.
• As of April 1997, a new method is used for calculating costs for owner-occupied housing with regards to interest rates. The change in method means that shifts in weighting during the year between loans with different fixed rate periods do not affect the index. The change also means that the cost for early redemption fees payable on early repayment of housing loans are taken into account.
New construction of the index as of 2005
In 2005, the CPI index construction changed. For more information on the changes to the index construction and how the calculations were made before the change, refer to the following memorandum:
http://www.scb.se/statistik/PR/PR0101/2004M03/Pm11307.pdf
Statistical agency
Statistics Sweden
Quality declaration Page
2017-02-17 20 (21)
5.2 Comparability among groups The CPI calculates the average price trend using the same index formula for all sub-categories included in the CPI. There is full comparability of price trends among the product groups.
5.3 Other coherence The CPI can be used in several contexts for deflating (calculating constant prices), such as in the national accounts and the service industry statistics. Comparisons of price trends for producer and import prices are difficult for several reasons. For example, taxes are handled differently and weighting factors differ. There are also methodological differences between the two statistical products; quality evaluations, for example, are made according to different principles.
5.4 Numerical consistency As far as we know, there are no problems related to the numerical consistency between different statistical values.
General information
A The classification Official Statistics of Sweden The CPI is included in the Official Statistics of Sweden.
Special rules apply for surveys that are included in the Official Statistics of Sweden concerning quality and accessibility. See the Official Statistics Ordinance (2001:100).
The Consumer Price Index (CPI) also forms the basis for the calculation of CPI with constant tax (CPI-CT), which is also included in the Official Statistics of Sweden. For more information about CPI-CT, see the memorandum on Statistics Sweden’s website under Consumer Price Index.
B Confidentiality and the handling of personal data Agencies’ specific task of producing new statistics is subject to confidentiality according to Chapter 24, Section 8, of the Public Access to Information and Secrecy Act (2009:400). There is no handling of personal data.
C Storage and elimination On 24 October 2014, the National Archives decided to repeal the National Archives’ culling decision no. 391 of 4 September 1973 for Statistics Sweden (regarding the Consumer Price Index). Accordingly, RA-MS 1998:7 and RA-MS 2006:57 are applied to the Consumer Price Index.
D Obligation to provide information There is an obligation to provide information according to the Official Statistics Act (SFS 2001:99).
E EU regulation and international reporting The CPI is the starting point for the calculation of the EU measure Harmonised Index of Consumer Prices (HICP). It is regulated is in accordance with Regulation (EU) 2016/792 of the European Parliament and of the
Statistical agency
Statistics Sweden
Quality declaration Page
2017-02-17 21 (21)
Council. The different countries shall use a common methodology in certain important respects of the HICP, such as in the selection of index formula and aggregation principles. Compared to the CPI, the HICP does not include the majority of the housing costs of owner-occupied homes, tenant-owned dwellings or state gambling proceeds. Unlike the CPI, the HICP includes costs for hospital services as well as certain financial services (where the fees are proportional to the size of the transaction).
F History As of July 1954, the CPI is calculated on a monthly basis. Quarterly data is accessible calculated from 1949 through June 1954. Historical series with yearly index figures (based on cost of living index and Myrdal-Bouvin’s consumer price index) are accessible as of 1830.
The HICP has been calculated monthly since January 1995.
G Contact details
Statistical Agency Statistics Sweden
Contact information
Statistics Service, weekdays 09:00–12:00, 13:00–16:30
E-mail [email protected]
Telephone 010-479 50 00