Embed Size (px)
Citation preview
Consumers and Mobile Financial Services 2016
March 2016
B O A R D O F G O V E R N O R S O F T H E F E D E R A L R E S E R V E S Y S T E M

Consumers and Mobile Financial Services 2016
March 2016
B O A R D O F G O V E R N O R S O F T H E F E D E R A L R E S E R V E S Y S T E M
This and other Federal Reserve Board reports and publications are available online at
www.federalreserve.gov/publications/default.htm.
To order copies of Federal Reserve Board publications offered in print,
see the Board’s Publication Order Form (www.federalreserve.gov/pubs/orderform.pdf)
or contact:
Publications Fulfillment
Mail Stop N-127
Board of Governors of the Federal Reserve System
Washington, DC 20551
(ph) 202-452-3245
(fax) 202-728-5886
(e-mail) [email protected]
Preface
The survey and report were prepared by the Con-
sumer and Community Development Research Sec-
tion of the Federal Reserve Board’s Division of Con-
sumer and Community Affairs (DCCA).
DCCA directs consumer-related functions performed
by the Board, including conducting research on con-
sumer and community financial services, and com-
munity economic development opportunities and
challenges.
DCCA staff members Sam Dodini, Alejandra
Lopez-Fernandini, Ellen Merry, and Logan Thomas
prepared this report. Valuable comments and feed-
back on the design of the survey and drafting of the
report were provided by DCCA staff members Mario
Arthur-Bentil, Anna Alvarez Boyd, Alexandra
Brown, David Buchholz, Allen Fishbein, Arturo
Gonzalez, Jeff Larrimore, Barbara Robles, and Jenny
Schuetz, as well as by Federal Reserve System staff
members Andrea Brachtesende, Marianne Crowe,
Geoffrey Gerdes, Christopher Olson, and Elisa
Tavilla.
Mention or display of a trademark, proprietary
product, or firm in the report does not constitute an
endorsement or criticism by the Federal Reserve
System and does not imply approval to the exclusion
of other suitable products or firms.
iii

Executive Summary ................................................................................................................. 1 Key Findings .............................................................................................................................. 1
Introduction ............................................................................................................................... 3 Survey Background .................................................................................................................... 3
Consumer Access to Mobile Phones ........................................................................................... 4
Trends in the Utilization of Mobile Banking and Payments ............................................................. 5
Accessing Financial Services ................................................................................................ 7
Mobile Banking ........................................................................................................................... 7
Mobile Payments ...................................................................................................................... 15
Mobile Security and Privacy .............................................................................................. 21
Perceptions of Safety and Risks ................................................................................................ 21
Security Behaviors and Information Sharing ............................................................................... 22
Use of Mobile Phones in Financial Decisionmaking ................................................ 25
Account Monitoring and Decisionmaking ................................................................................... 25
Shopping and Mobile Financial Management ............................................................................. 26
Conclusion ................................................................................................................................ 27
Appendix A: Technical Appendix on Survey Methodology .................................... 29
Appendix B: Survey of Consumers’ Use of Mobile Financial Services 2015—Questionnaire ............................................................................................................ 33
Appendix C: Consumer Responses to Survey Questionnaire ................................. 61
v
Contents

Executive Summary
Mobile phones have increasingly become tools that
consumers use for banking, payments, budgeting,
and shopping. Given the rapid pace of change in the
area of mobile finance, the Federal Reserve Board
began conducting annual surveys of consumers’ use
of mobile financial services in 2011. The series exam-
ines trends in the adoption and use of mobile bank-
ing, payments, and shopping behavior and how the
evolution of mobile financial services affects consum-
ers’ interaction with financial institutions.
This report presents findings from the latest survey,
fielded in November 2015, which focused on consum-
ers’ use of mobile technology to access financial ser-
vices and make financial decisions. Where applicable,
the findings from the current survey are also com-
pared with the findings from previous surveys. Topics
include consumer access to bank services using
mobile phones (“mobile banking”), consumer pay-
ment for goods and services using mobile phones
(“mobile payments”), mobile security, and consumer
financial management and shopping decisions facili-
tated by the use of mobile phones. Details about the
survey, its methodology, and limitations can be found
in the body of the report and in a methodological
appendix. Survey data, as well as reports and data
from previous years of the survey, are available on
the Board’s website at www.federalreserve.gov/
communitydev/mobile_finance.htm.
Key Findings
Key findings of the 2015 survey include:
• Mobile phones, particularly Internet-enabled smart-
phones, are in widespread use.
—Eighty-seven percent of the U.S. adult population
has a mobile phone, the same as in 2014 and 2013.
—Seventy-seven percent of mobile phones are
smartphones (Internet-enabled), up from 71 per-
cent in 2014 and 61 percent in 2013.
• Adoption of mobile financial services continues to
increase. A majority of consumers using these ser-
vices cite convenience or getting a smartphone as
their reason for adoption.
—Use of mobile banking continues to rise. Forty-
three percent of all mobile phone owners with a
bank account had used mobile banking in the
12 months prior to the survey, up from 39 per-
cent in 2014 and 33 percent in 2013.
—Fifty-three percent of smartphone owners with a
bank account had used mobile banking in the
12 months prior to the survey, up from 52 per-
cent a year earlier.
—Consistent with previous years, the three most
common mobile banking activities among
mobile banking users were checking account bal-
ances or recent transactions (94 percent), trans-
ferring money between an individual’s own
accounts (58 percent), and receiving an alert
(e.g., a text message, push notification, or e-mail)
from their bank (56 percent).
—Use of mobile payments continues to be less
common than use of mobile banking. Twenty-
four percent of all mobile phone owners
reported having made a mobile payment in the
12 months prior to the survey.
—Twenty-eight percent of smartphone users made
a mobile payment in the 12 months prior to the
survey.
—The three most common mobile payment activi-
ties among mobile payments users with smart-
phones were paying bills through a mobile phone
web browser or app (65 percent), purchasing a
physical item or digital content remotely using a
mobile phone (42 percent), and paying for some-
thing in a store using a mobile phone (33 percent).
• Use of mobile financial services varies across demo-
graphic groups.
—Higher shares of younger adults, Hispanics, and
non-Hispanic blacks reported using mobile
banking and mobile payments than the overall
survey averages. Smartphone ownership among
1
those with mobile phones is higher for Hispanics
than for non-Hispanic whites in this survey.
• The main impediments to the adoption of mobile
financial services cited by some consumers continue
to be a preference for other methods of banking and
making payments as well as concerns about security.
—Of those not using mobile banking, the primary
reason respondents cited was a belief that their
banking needs were being met without the use of
mobile banking (88 percent).
—The primary reason non-mobile-payment users
gave for not using mobile payments was that
they believe it is easier to pay with cash or credit/
debit cards (80 percent).
—Concern about the security of the technology
was a common reason given for not using mobile
banking or mobile payments (73 percent and
67 percent, respectively, of non-users).
• Most consumers with bank accounts reported using a
mix of online and offline channels to interact with
their financial institution. For those who have
adopted mobile banking, use of the mobile channel
appears to complement their use of other banking
channels.
—Among all respondents with bank accounts, the
share using mobile banking is higher than the
share using telephone banking but lower than
the shares that have visited a branch, used an
ATM, or used online banking in the last
12 months.
—Among mobile banking users with smartphones,
54 percent cited the mobile channel as one of the
three most important ways they interact with
their bank, below the shares that cited online
(65 percent) and ATM (62 percent), but above
the share that cited a teller at a branch
(51 percent).
• The security and privacy of personal information
remain common concerns for mobile phone users,
and many smartphone users reported taking steps to
guard against possible risks.
—Among those with a mobile phone, 42 percent
think that people’s personal information is “very
unsafe” or “somewhat unsafe” when they use
mobile banking, and an additional 15 percent
“don’t know” how safe these activities are.
—The majority of smartphone users reported tak-
ing actions that can reduce harm in case of a
security incident. The most common actions
were installing updates (84 percent), password-
protecting the phone (70 percent), and customiz-
ing privacy settings (58 percent).
—Consumer awareness of security threats may
influence behavior: 78 percent of smartphone
users reported they do not download or install
apps from sources outside their primary app
store, and 76 percent reported they do not send
or access sensitive data over public WiFi
networks.
• Consumers use their smartphones to inform financial
decisions.
—Most mobile banking users who receive low-
balance alerts from their bank reported taking
some action in response, such as transferring
money into the account with the low balance
(43 percent), depositing money into the account
(36 percent), or reducing their spending
(32 percent).
—Sixty-two percent of mobile banking users
checked their account balance on their phone
before making a large purchase in the 12 months
prior to the survey. Half (50 percent) of them
decided not to purchase an item as a result of
their account balance or credit limit.
—Forty-one percent of persons with smartphones
used their phone to browse product reviews or
get product information while shopping at a
retail store, and 79 percent of them changed the
item they purchased based on this information.
• Mobile phones are prevalent among unbanked and
underbanked consumers.
—Nine percent of consumers were unbanked at the
time of the survey. Forty percent of the
unbanked had access to a smartphone, 28 per-
cent had access to a feature phone, and 32 per-
cent lacked access to any type of mobile phone.
—Twenty-two percent of consumers were under-
banked, meaning they had a bank account and
had used one or more alternative financial ser-
vices (typically from a nonbank) within the past
year. Seventy percent of the underbanked were
smartphone owners, and 17 percent owned a fea-
ture phone.
—Among the underbanked with mobile phones,
55 percent used mobile banking.
2 Consumers and Mobile Financial Services 2016

Introduction
In 2011, the Federal Reserve Board’s Division of
Consumer and Community Affairs conducted its
first Survey of Consumers’ Use of Mobile Financial
Services (the “Mobile Survey”). Since that time, the
adoption of mobile financial services has continued
to increase, along with the range of services offered.
As part of its ongoing efforts to monitor develop-
ments in the financial services arena and to gain
insights into consumers’ usage of, and attitudes
toward, mobile financial services, the Board has con-
tinued to conduct the survey annually.1 The fifth sur-
vey, conducted in November 2015, included a sample
of respondents who had responded to both the 2013
and 2014 surveys, as well as a random sample of new
respondents. The subsample of respondents who vol-
untarily completed both the 2014 and 2015 surveys
allows for the analysis of changes in behavior over
the past year among these individuals.
Survey Background
The original survey instrument and subsequent years
of the survey were designed in consultation with a
mobile financial services advisory group made up of
key Federal Reserve System staff with relevant con-
sumer research and payments backgrounds. The
2012, 2013, 2014, and 2015 survey samples were all
composed of a mix of respondents to the previous
year’s survey and new survey respondents.
The 2015 survey was again administered by GfK, an
online consumer research company, on behalf of the
Board. The survey was conducted in English using a
sample of adults ages 18 and over from Knowl-
edgePanel®, a proprietary, probability-based web
panel of more than 50,000 individuals from ran-
domly sampled households; the sample was designed
to be representative of the U.S. population. After
pretesting, the data collection for the survey began
on November 4, 2015, and concluded on Novem-
ber 23, 2015.
As shown in table 1, e-mails were sent to 1,364 indi-
viduals who had responded to both the 2013 and
2014 surveys and 2,324 randomly selected individuals
from the remaining members of KnowledgePanel®.
The respondents completed the survey in approxi-
mately 12 minutes (median time). Of the 2,510 quali-
fied respondents used for analysis in this report,
1,064 had responded to the 2013 and 2014 surveys,
while 1,446 were new survey respondents drawn from
the general population.2 Further details on the survey
methodology are included in appendix A.
As with any survey method, Internet panels can be
subject to biases resulting from undercoverage or
nonresponse and, in this case, potential underrepre-
sentation of adults who may be uncomfortable with
technology. Not everyone in the United States has
access to the Internet, and there are demographic
(income, education, age) and geographic (urban and
rural) differences between those who do have readily
available access and those who do not. These con-
cerns about survey error for Internet surveys are
addressed by GfK providing Internet access to
respondents who do not have it in order to include
the portion of the population that does not have
Internet access in KnowledgePanel®, and by using
1 See the “Consumers and Mobile Financial Services” reports series for previous years’ survey findings. Results of the 2011, 2012, 2013, and 2014 surveys (published in March 2012, 2013, 2014, and 2015, respectively) are available at www.federalreserve.gov/communitydev/mobile_finance_publications.htm.
2 The 2015 survey also included an oversample of non-Hispanic black and Hispanic respondents. For comparability with prior years of the survey, the oversample was not used in computing the results in this report; therefore, respondents from the over-sample are not included in table 1.
Table 1. Key survey response statistics: Main interview
Sample type Number
sampled for main survey
Qualified completesfor analysis
2013–14 re-interviews 1,364 1,064
Fresh cases 2,324 1,446
Total primary sample 3,688 2,510
3
sample weights to ensure that the Internet usage and
key demographics of the sample population match
the U.S. adult population. See appendix A for a more
detailed discussion.
While these steps have been taken to make the survey
results generalizable to the U.S. adult population,
some caveats apply to interpretation of the results,
particularly for subpopulations. This survey was con-
ducted in English, and thus may not reflect the atti-
tudes and behaviors of those in the U.S. population
whose dominant language is not English. In addition,
survey estimates about technology use may be
affected by the mode of the survey, as a respondent’s
use of or views about technology could be correlated
with the choice to participate in an Internet survey.
Thus, these results may be more representative of
those who would be willing and able to respond in
English to an Internet survey. In particular instances,
comparisons to outside data sources are included
where they may shed some light on these issues.
The full survey questionnaire is presented in appen-
dix B. In the cases in which questions were only
asked of certain respondents conditional on their
answer to a prior question, such information is also
reported on the questionnaire. Responses to the sur-
vey questions are presented in appendix C in the
order that the questions were asked of respondents.
Tables of summary statistics for the respondent
demographic characteristics by mobile phone usage
are also included as tables C.64 to C.67. Beginning at
table C.68, cross-tabulations are presented of con-
sumers’ use of mobile phones, mobile banking, and
mobile payments by age, race, gender, education, and
income.
The remaining sections of this report summarize key
findings from the Federal Reserve Board’s survey of
consumers conducted by GfK, with a focus on how
consumers use mobile phones to conduct their bank-
ing and make payments, as well as on how consumers
perceive and protect the security of mobile transac-
tions and manage their finances. All data were
weighted to yield estimates for the U.S. adult popula-
tion. The numbers cited in this report are derived
from the Mobile Survey unless otherwise noted.
Consumer Access to Mobile Phones
As of November 2015, 87 percent of the U.S. popu-
lation ages 18 and above owned or had regular access
to a mobile phone. While the percent of the adult
population with mobile phones has remained con-
stant over the previous three years, an increasing pro-
portion owns a smartphone: this survey’s 77 percent
smartphone ownership rate among those with mobile
phones is a substantial increase over the 71 percent
rate reported in 2014, 61 percent in 2013, 52 percent
rate in 2012, and 44 percent rate in 2011.3
Rates of mobile phone usage remain high and consis-
tent across demographic and socioeconomic groups.
The prevalence of mobile phones demonstrates the
extent to which they have become ingrained in mod-
ern culture. Mobile phone usage in the 2015 survey is
higher among younger age groups: 91 percent for
persons ages 18 to 44, 90 percent for persons 30 to
44, and 89 percent for persons 44 to 59. Mobile
phone usage declines somewhat, to 81 percent for
persons ages 60 and over. Smartphone adoption is
similarly higher among younger generations, with the
differences being more pronounced among age
groups: 91 percent of those ages 18 to 29 and 88 per-
cent of those ages 30 to 44 who own a mobile phone
have a smartphone, while 72 percent of mobile phone
owners ages 45 to 59 and 56 percent of mobile phone
owners ages 60 and over have a smartphone.
Consistent with the results of prior years of this sur-
vey, results for the 2015 survey suggest that mobile
phone ownership varies slightly by race and ethnicity,
with non-Hispanic whites, Hispanics, and non-
Hispanic blacks having ownership rates of 88 per-
cent, 90 percent, and 83 percent, respectively. Adop-
tion of smartphones in the Mobile Survey varies in a
somewhat more pronounced way: 82 percent of His-
panic mobile phone users have a smartphone, com-
pared to 74 percent of non-Hispanic whites and
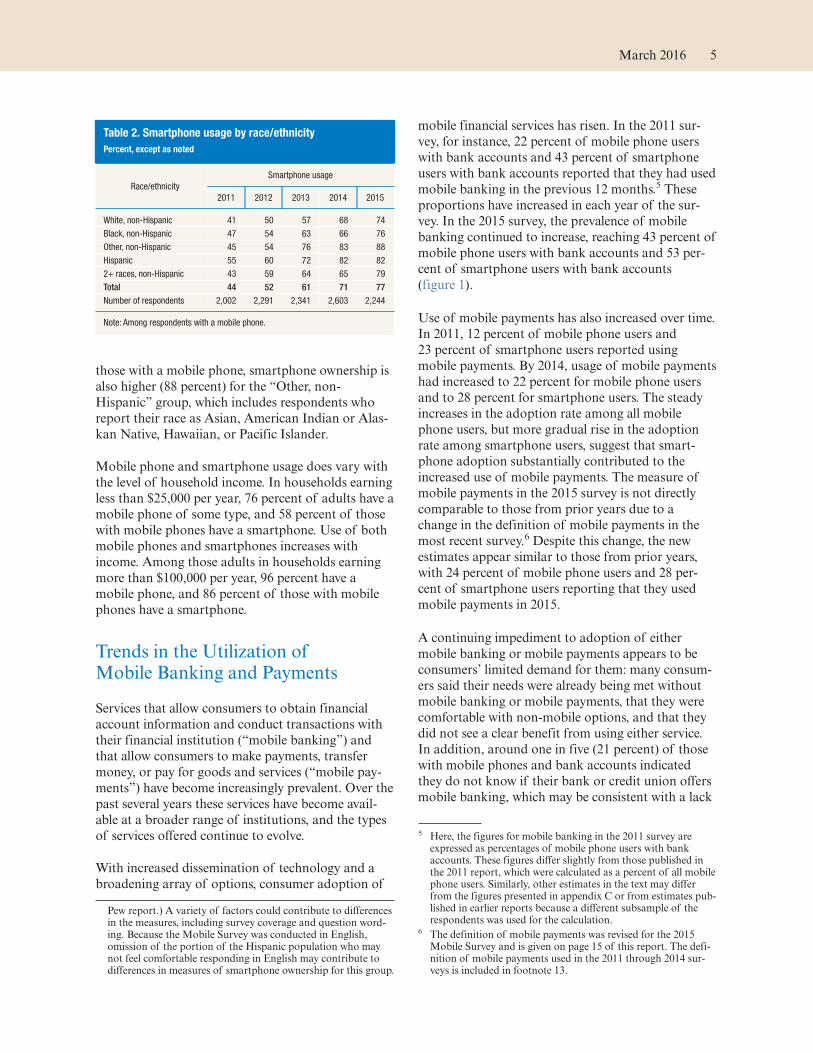
76 percent of non-Hispanic blacks (table 2).4 Among
3 Throughout this report, percentages are calculated as a share of all those who were asked a question, including those who did not respond. Based on surveys conducted in 2015, the Pew Research Center reported that 92 percent of U.S. adults owned a mobile phone and 68 percent of U.S. adults had a smart-phone. Expressed as a share of all adults for comparison, smart-phone ownership for the 2015 Mobile Survey was 67 percent of U.S. adults. (See www.pewinternet.org/files/2015/10/PI_2015-10-29_device-ownership_FINAL.pdf.)
4 Estimates from the 2015 Mobile Survey show larger differences between racial/ethnic groups in smartphone ownership rates than those found by the Pew Research Center. Results from a survey fielded by Pew in 2015 indicated that smartphone owner-ship rates were similar for the three largest groups: 66 percent for non-Hispanic whites, 68 percent for non-Hispanic blacks, and 64 percent for Hispanics. Expressed as a share of all adults for comparison, smartphone ownership rates for the 2015 Mobile Survey respondents used in this report were 65 percent for non-Hispanic whites, 63 percent for non-Hispanic blacks, and 74 percent for Hispanics. (See footnote 3 for a link to the
4 Consumers and Mobile Financial Services 2016
those with a mobile phone, smartphone ownership is
also higher (88 percent) for the “Other, non-
Hispanic” group, which includes respondents who
report their race as Asian, American Indian or Alas-
kan Native, Hawaiian, or Pacific Islander.
Mobile phone and smartphone usage does vary with
the level of household income. In households earning
less than $25,000 per year, 76 percent of adults have a
mobile phone of some type, and 58 percent of those
with mobile phones have a smartphone. Use of both
mobile phones and smartphones increases with
income. Among those adults in households earning
more than $100,000 per year, 96 percent have a
mobile phone, and 86 percent of those with mobile
phones have a smartphone.
Trends in the Utilization of Mobile Banking and Payments
Services that allow consumers to obtain financial
account information and conduct transactions with
their financial institution (“mobile banking”) and
that allow consumers to make payments, transfer
money, or pay for goods and services (“mobile pay-
ments”) have become increasingly prevalent. Over the
past several years these services have become avail-
able at a broader range of institutions, and the types
of services offered continue to evolve.
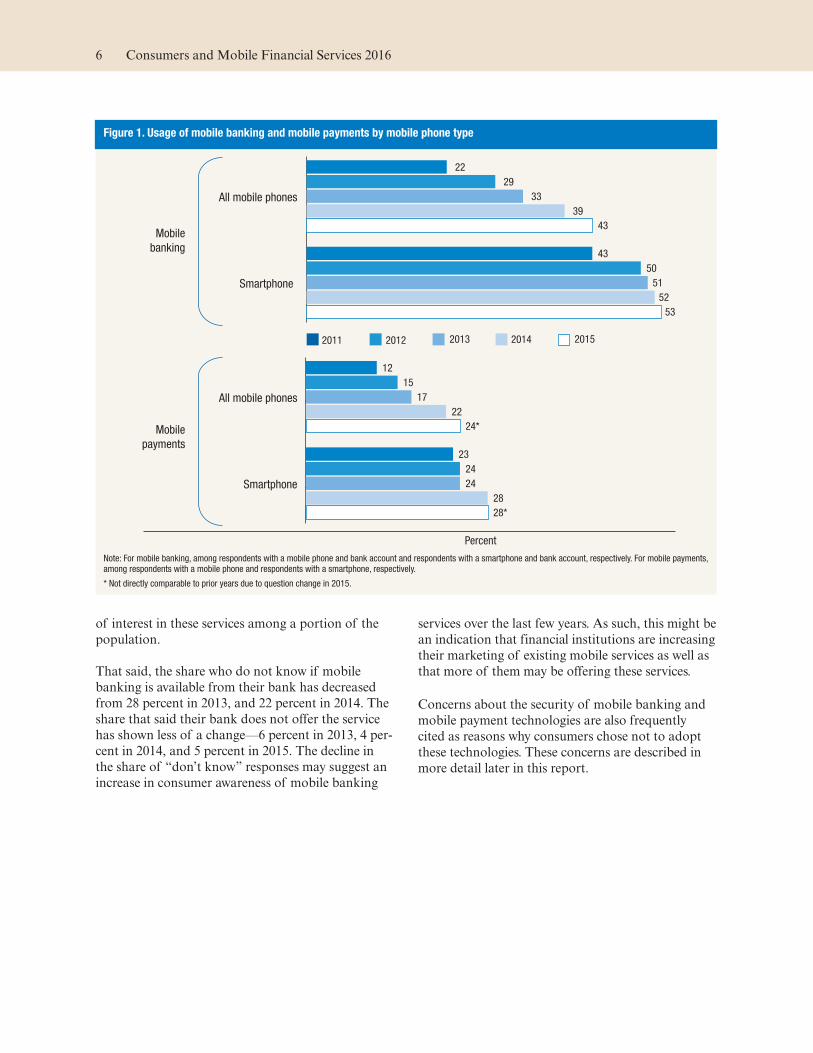
With increased dissemination of technology and a
broadening array of options, consumer adoption of
mobile financial services has risen. In the 2011 sur-
vey, for instance, 22 percent of mobile phone users
with bank accounts and 43 percent of smartphone
users with bank accounts reported that they had used
mobile banking in the previous 12 months.5 These
proportions have increased in each year of the sur-
vey. In the 2015 survey, the prevalence of mobile
banking continued to increase, reaching 43 percent of
mobile phone users with bank accounts and 53 per-
cent of smartphone users with bank accounts
(figure 1).
Use of mobile payments has also increased over time.
In 2011, 12 percent of mobile phone users and
23 percent of smartphone users reported using
mobile payments. By 2014, usage of mobile payments
had increased to 22 percent for mobile phone users
and to 28 percent for smartphone users. The steady
increases in the adoption rate among all mobile
phone users, but more gradual rise in the adoption
rate among smartphone users, suggest that smart-
phone adoption substantially contributed to the
increased use of mobile payments. The measure of
mobile payments in the 2015 survey is not directly
comparable to those from prior years due to a
change in the definition of mobile payments in the
most recent survey.6 Despite this change, the new
estimates appear similar to those from prior years,
with 24 percent of mobile phone users and 28 per-
cent of smartphone users reporting that they used
mobile payments in 2015.
A continuing impediment to adoption of either
mobile banking or mobile payments appears to be
consumers’ limited demand for them: many consum-
ers said their needs were already being met without
mobile banking or mobile payments, that they were
comfortable with non-mobile options, and that they
did not see a clear benefit from using either service.
In addition, around one in five (21 percent) of those
with mobile phones and bank accounts indicated
they do not know if their bank or credit union offers
mobile banking, which may be consistent with a lack
Pew report.) A variety of factors could contribute to differences in the measures, including survey coverage and question word-ing. Because the Mobile Survey was conducted in English, omission of the portion of the Hispanic population who may not feel comfortable responding in English may contribute to differences in measures of smartphone ownership for this group.
5 Here, the figures for mobile banking in the 2011 survey are expressed as percentages of mobile phone users with bank accounts. These figures differ slightly from those published in the 2011 report, which were calculated as a percent of all mobile phone users. Similarly, other estimates in the text may differ from the figures presented in appendix C or from estimates pub-lished in earlier reports because a different subsample of the respondents was used for the calculation.
6 The definition of mobile payments was revised for the 2015 Mobile Survey and is given on page 15 of this report. The defi-nition of mobile payments used in the 2011 through 2014 sur-veys is included in footnote 13.
Table 2. Smartphone usage by race/ethnicity
Percent, except as noted
Race/ethnicity
Smartphone usage
2011 2012 2013 2014 2015
White, non-Hispanic 41 50 57 68 74
Black, non-Hispanic 47 54 63 66 76
Other, non-Hispanic 45 54 76 83 88
Hispanic 55 60 72 82 82
2+ races, non-Hispanic 43 59 64 65 79
Total 44 52 61 71 77
Number of respondents 2,002 2,291 2,341 2,603 2,244
Note: Among respondents with a mobile phone.
March 2016 5
of interest in these services among a portion of the
population.
That said, the share who do not know if mobile
banking is available from their bank has decreased
from 28 percent in 2013, and 22 percent in 2014. The
share that said their bank does not offer the service
has shown less of a change—6 percent in 2013, 4 per-
cent in 2014, and 5 percent in 2015. The decline in
the share of “don’t know” responses may suggest an
increase in consumer awareness of mobile banking
services over the last few years. As such, this might be
an indication that financial institutions are increasing
their marketing of existing mobile services as well as
that more of them may be offering these services.
Concerns about the security of mobile banking and
mobile payment technologies are also frequently
cited as reasons why consumers chose not to adopt
these technologies. These concerns are described in
more detail later in this report.
Figure 1. Usage of mobile banking and mobile payments by mobile phone type
43
53
39
52
33
51
29
50
22
43
20152014201320122011
Smartphone
All mobile phones
Mobile
payments
Mobile
banking
24*
28*
22
28
17
24
15
24
12
23
Smartphone
All mobile phones
Percent
Note: For mobile banking, among respondents with a mobile phone and bank account and respondents with a smartphone and bank account, respectively. For mobile payments, among respondents with a mobile phone and respondents with a smartphone, respectively.
* Not directly comparable to prior years due to question change in 2015.
6 Consumers and Mobile Financial Services 2016
Accessing Financial Services
Survey respondents were given a set of screening
questions that asked if they had access to a bank
account, the Internet, and a mobile phone. They were
further asked about the various ways in which they
access their financial accounts. Of the 91 percent of
American consumers who have a checking, savings,
or money market account, the majority use some
form of technology to interact with their financial
institution. (For a discussion of Internet access
among Mobile Survey respondents, see box 1.)
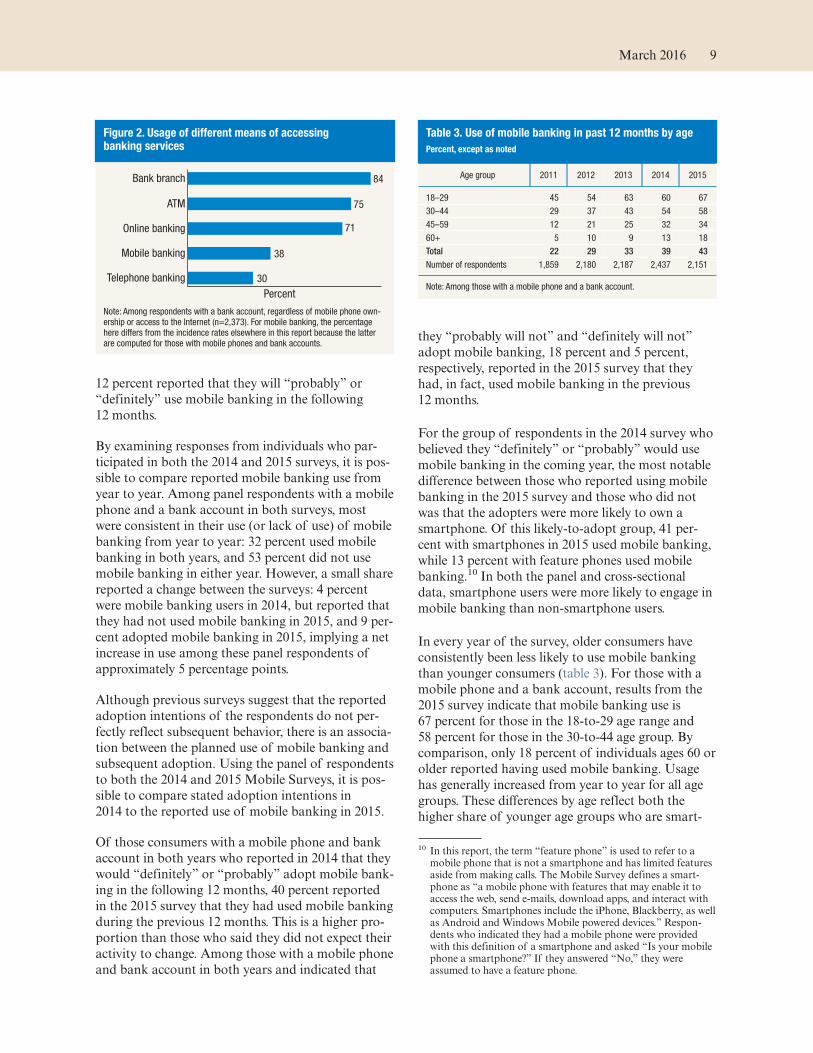
As shown in figure 2, the most common way of
interacting with a financial institution is in-person at
a branch, with 84 percent of consumers who have a
bank account reporting that they had visited a
branch and spoken with a teller in the 12 months
prior to the survey.7 The second-most common
means of access in the previous 12 months was using
an automated teller machine (ATM) at 75 percent,
followed by online banking at 71 percent. Thirty-
eight percent of all consumers with bank accounts
used mobile banking, up from 35 percent the previ-
ous year, while 30 percent used telephone banking.8
The share of respondents with bank accounts who
use mobile banking has risen steadily since the 2011
Mobile Survey, surpassing the use of telephone
banking.9 Although use of online banking has risen
modestly over this period, use of the bank channels
other than mobile has been generally consistent.
Because these measures capture use of a channel in
the past year—not frequency of use or activities over
time and across channels—they cannot adequately
capture the possible substitution between mobile
banking and other ways of interacting with a finan-
cial institution. Yet, they suggest that most consum-
ers appear to be making use of multiple bank chan-
nels, and that for many who have adopted it, mobile
banking is a complement to other ways of conduct-
ing banking business.
Mobile Banking
The Mobile Survey defines mobile banking as using
“a mobile phone to access your bank or credit union
account. This can be done either by accessing your
bank or credit union’s web page through the web
browser on your mobile phone, via text messaging, or
by using an app downloaded to your mobile phone.”
This section takes a more detailed look at mobile
banking usage, focusing on mobile banking adop-
tion, activities, and motivations for use.
Adoption Rates
The adoption of mobile banking has continued to
increase in the past year. When asked about usage in
the previous 12 months, 43 percent of mobile phone
users with a bank account reported that they used
mobile banking, a proportion that has been steadily
climbing (figure 1). Mobile banking among smart-
phone users with a bank account is higher at 53 per-
cent. The higher incidence of mobile banking adop-
tion among smartphone users suggests that as smart-
7 To measure the use of a bank branch in the 2015 Mobile Survey, respondents were asked the following question: “Have you visited a bank branch and spoken with a teller or a bank employee in the past 12 months? Please do not include visits where your only activity was using an ATM/Cash machine located at a branch.” In prior years of the survey, the second sentence requesting that respondents exclude branch visits that only involved the use of an ATM was not included. Thus, the question from the 2015 survey may not be directly comparable to the measures from earlier sur-veys. This change in the question would likely reduce the measure of branch use in the last year, and thus could be a component of any year-over-year change.
8 The relative prevalence and ranking of channel usage in the 2013 Mobile Survey is similar to results from the 2013 FDIC Survey of Unbanked and Underbanked Households. See www.economicinclusion.gov/surveys/2013household/. However, the incidence of online banking and of households with Internet access are notably higher in the 2013 Mobile Survey than in the Federal Deposit Insurance Corporation (FDIC) survey. This may be due in part to differences in the survey methodology, as the FDIC survey is conducted by phone and in person while the Mobile Survey is conducted via an online panel.
9 For an overview of the use of all five channels in previous Mobile Surveys, see figure 2 of the 2015 report, available at www.federalreserve.gov/econresdata/consumers-and-mobile-financial-services-report-201503.pdf.
7
phone adoption continues to increase, mobile
banking usage may also increase.
A significant fraction of mobile banking users have
only recently adopted the technology. Although the
majority of mobile banking users reported that they
started using it more than one year ago, 9 percent
reported that they adopted mobile banking in the last
six months, and 14 percent reported that they
adopted mobile banking between six and twelve
months ago. Among those consumers with mobile
phones who do not currently use mobile banking,
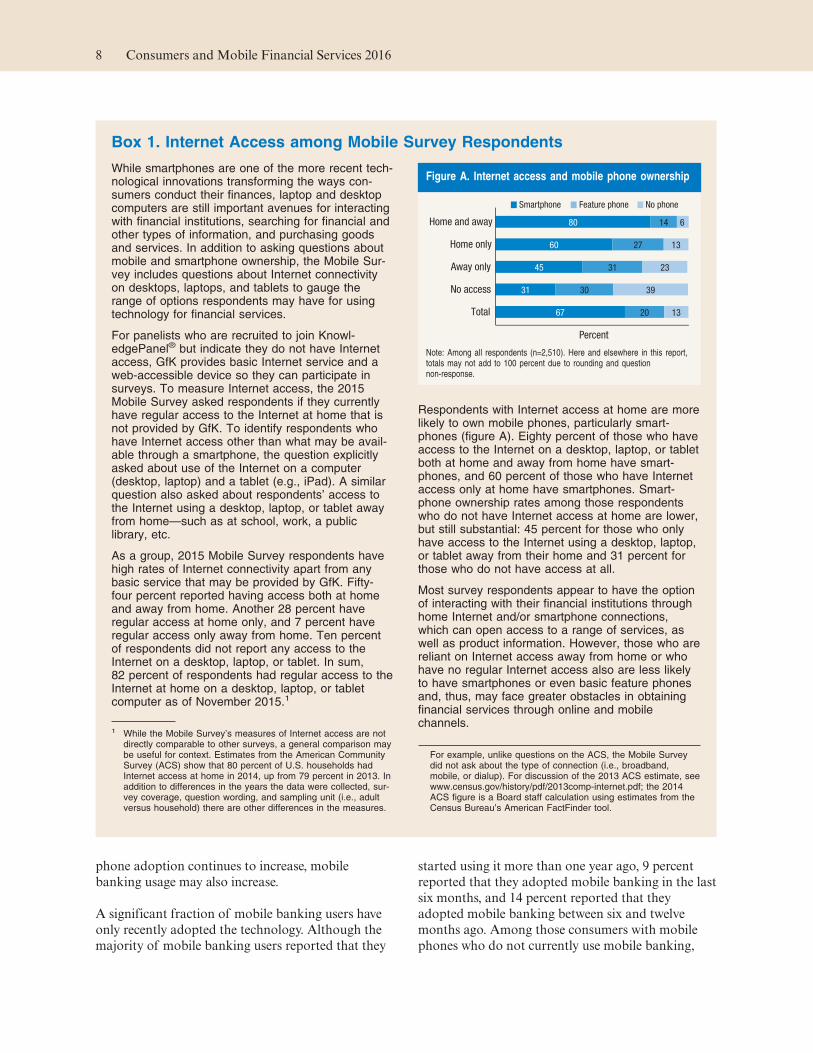
Box 1. Internet Access among Mobile Survey Respondents
While smartphones are one of the more recent tech-nological innovations transforming the ways con-sumers conduct their finances, laptop and desktopcomputers are still important avenues for interactingwith financial institutions, searching for financial andother types of information, and purchasing goodsand services. In addition to asking questions aboutmobile and smartphone ownership, the Mobile Sur-vey includes questions about Internet connectivityon desktops, laptops, and tablets to gauge therange of options respondents may have for usingtechnology for financial services.
For panelists who are recruited to join Knowl-edgePanel® but indicate they do not have Internetaccess, GfK provides basic Internet service and aweb-accessible device so they can participate insurveys. To measure Internet access, the 2015Mobile Survey asked respondents if they currentlyhave regular access to the Internet at home that isnot provided by GfK. To identify respondents whohave Internet access other than what may be avail-able through a smartphone, the question explicitlyasked about use of the Internet on a computer(desktop, laptop) and a tablet (e.g., iPad). A similarquestion also asked about respondents’ access tothe Internet using a desktop, laptop, or tablet awayfrom home—such as at school, work, a publiclibrary, etc.
As a group, 2015 Mobile Survey respondents havehigh rates of Internet connectivity apart from anybasic service that may be provided by GfK. Fifty-four percent reported having access both at homeand away from home. Another 28 percent haveregular access at home only, and 7 percent haveregular access only away from home. Ten percentof respondents did not report any access to theInternet on a desktop, laptop, or tablet. In sum,82 percent of respondents had regular access to theInternet at home on a desktop, laptop, or tabletcomputer as of November 2015.1
Respondents with Internet access at home are morelikely to own mobile phones, particularly smart-phones (figure A). Eighty percent of those who haveaccess to the Internet on a desktop, laptop, or tabletboth at home and away from home have smart-phones, and 60 percent of those who have Internetaccess only at home have smartphones. Smart-phone ownership rates among those respondentswho do not have Internet access at home are lower,but still substantial: 45 percent for those who onlyhave access to the Internet using a desktop, laptop,or tablet away from their home and 31 percent forthose who do not have access at all.
Most survey respondents appear to have the optionof interacting with their financial institutions throughhome Internet and/or smartphone connections,which can open access to a range of services, aswell as product information. However, those who arereliant on Internet access away from home or whohave no regular Internet access also are less likelyto have smartphones or even basic feature phonesand, thus, may face greater obstacles in obtainingfinancial services through online and mobilechannels.
1 While the Mobile Survey’s measures of Internet access are notdirectly comparable to other surveys, a general comparison maybe useful for context. Estimates from the American CommunitySurvey (ACS) show that 80 percent of U.S. households hadInternet access at home in 2014, up from 79 percent in 2013. Inaddition to differences in the years the data were collected, sur-vey coverage, question wording, and sampling unit (i.e., adultversus household) there are other differences in the measures.
For example, unlike questions on the ACS, the Mobile Surveydid not ask about the type of connection (i.e., broadband,mobile, or dialup). For discussion of the 2013 ACS estimate, seewww.census.gov/history/pdf/2013comp-internet.pdf; the 2014ACS figure is a Board staff calculation using estimates from theCensus Bureau’s American FactFinder tool.
Figure A. Internet access and mobile phone ownership
67
31
45
60
80
20
30
31
27
14
13
39
23
13
6
Total
No access
Away only
Home only
Home and away
Percent
Smartphone Feature phone No phone
Note: Among all respondents (n=2,510). Here and elsewhere in this report,totals may not add to 100 percent due to rounding and questionnon-response.
8 Consumers and Mobile Financial Services 2016
12 percent reported that they will “probably” or
“definitely” use mobile banking in the following
12 months.
By examining responses from individuals who par-
ticipated in both the 2014 and 2015 surveys, it is pos-
sible to compare reported mobile banking use from
year to year. Among panel respondents with a mobile
phone and a bank account in both surveys, most
were consistent in their use (or lack of use) of mobile
banking from year to year: 32 percent used mobile
banking in both years, and 53 percent did not use
mobile banking in either year. However, a small share
reported a change between the surveys: 4 percent
were mobile banking users in 2014, but reported that
they had not used mobile banking in 2015, and 9 per-
cent adopted mobile banking in 2015, implying a net
increase in use among these panel respondents of
approximately 5 percentage points.
Although previous surveys suggest that the reported
adoption intentions of the respondents do not per-
fectly reflect subsequent behavior, there is an associa-
tion between the planned use of mobile banking and
subsequent adoption. Using the panel of respondents
to both the 2014 and 2015 Mobile Surveys, it is pos-
sible to compare stated adoption intentions in
2014 to the reported use of mobile banking in 2015.
Of those consumers with a mobile phone and bank
account in both years who reported in 2014 that they
would “definitely” or “probably” adopt mobile bank-
ing in the following 12 months, 40 percent reported
in the 2015 survey that they had used mobile banking
during the previous 12 months. This is a higher pro-
portion than those who said they did not expect their
activity to change. Among those with a mobile phone
and bank account in both years and indicated that
they “probably will not” and “definitely will not”
adopt mobile banking, 18 percent and 5 percent,
respectively, reported in the 2015 survey that they
had, in fact, used mobile banking in the previous
12 months.
For the group of respondents in the 2014 survey who
believed they “definitely” or “probably” would use
mobile banking in the coming year, the most notable
difference between those who reported using mobile
banking in the 2015 survey and those who did not
was that the adopters were more likely to own a
smartphone. Of this likely-to-adopt group, 41 per-
cent with smartphones in 2015 used mobile banking,
while 13 percent with feature phones used mobile
banking.10 In both the panel and cross-sectional
data, smartphone users were more likely to engage in
mobile banking than non-smartphone users.
In every year of the survey, older consumers have
consistently been less likely to use mobile banking
than younger consumers (table 3). For those with a
mobile phone and a bank account, results from the
2015 survey indicate that mobile banking use is
67 percent for those in the 18-to-29 age range and
58 percent for those in the 30-to-44 age group. By
comparison, only 18 percent of individuals ages 60 or
older reported having used mobile banking. Usage
has generally increased from year to year for all age
groups. These differences by age reflect both the
higher share of younger age groups who are smart-
10 In this report, the term “feature phone” is used to refer to a mobile phone that is not a smartphone and has limited features aside from making calls. The Mobile Survey defines a smart-phone as “a mobile phone with features that may enable it to access the web, send e-mails, download apps, and interact with computers. Smartphones include the iPhone, Blackberry, as well as Android and Windows Mobile powered devices.” Respon-dents who indicated they had a mobile phone were provided with this definition of a smartphone and asked “Is your mobile phone a smartphone?” If they answered “No,” they were assumed to have a feature phone.
Figure 2. Usage of different means of accessing banking services
30Telephone banking
38Mobile banking
71Online banking
75ATM
Bank branch 84
Percent
Note: Among respondents with a bank account, regardless of mobile phone own-ership or access to the Internet (n=2,373). For mobile banking, the percentage here differs from the incidence rates elsewhere in this report because the latter are computed for those with mobile phones and bank accounts.
Table 3. Use of mobile banking in past 12 months by age
Percent, except as noted
Age group 2011 2012 2013 2014 2015
18–29 45 54 63 60 67
30–44 29 37 43 54 58
45–59 12 21 25 32 34
60+ 5 10 9 13 18
Total 22 29 33 39 43
Number of respondents 1,859 2,180 2,187 2,437 2,151
Note: Among those with a mobile phone and a bank account.
March 2016 9

phone owners, as well as differences in the propensity
to use mobile banking for those with a given type of
phone. Among smartphone owners, this pattern of
higher mobile banking adoption for the younger age
groups is still very apparent.
Consistent with the data from previous surveys,
minorities continue to be more likely to use mobile
banking than non-Hispanic whites. In particular,
Hispanic mobile phone users with bank accounts
show a higher rate of use of mobile banking (56 per-
cent) relative to mobile phone users with bank
accounts overall (43 percent) (table 4).
Among those with a mobile phone and bank
account, mobile banking use is more common for
those with higher levels of education. Usage for those
with a college degree or some college (47 percent) is
greater than for those with a high school degree or
less (35 percent). In addition, mobile banking usage
for those mobile phone users with bank accounts
with household incomes of $40,000 and above
(45 percent) is greater than for those with incomes
below $40,000 (38 percent). (For further discussion
Box 2. Banking Status and the Use of Mobile Banking and Payments
The relatively high prevalence of mobile phone andsmartphone use among younger generations,minorities, and those with low levels of income—groups that are more likely to be unbanked orunderbanked—makes mobile phones a potentialplatform for expanding financial access andinclusion.
In the 2015 Mobile Survey, 9 percent of respondentswere unbanked, having reported that neither theynor their spouse have a checking, savings, ormoney market account.1 Twenty-two percent of con-sumers were underbanked in 2015—defined here ashaving a bank account but also using an alternativefinancial service (typically from a nonbank provider),including a money order, check-cashing service, taxrefund anticipation loan, pawn shop loan, paydayloan, auto title loan, or a paycheck advance/depositadvance.2 The remaining share of consumers who
reported having a bank account but not using one ofthese alternative financial services (the “fullybanked” group) was 69 percent.
Among both the unbanked and underbankedgroups, transaction-based products such as moneyorders and check-cashing services were the primarytypes of alternative financial services used. Fifty-one percent of the unbanked and 92 percent of theunderbanked reported using at least one of thesetwo financial services, with money orders beingmore common. Usage of credit-based products—taxrefund anticipation loans, pawn shop loans, paydayloans, auto title loans, or a paycheck advance/de-posit—is much lower, with 14 percent of theunbanked and 29 percent of the underbanked hav-ing reported utilizing at least one of these services.Fifty-six percent of the unbanked (and, by definition,100 percent of the underbanked) used at least onetype of alternative financial service.
Seventy percent of both the underbanked and fullybanked groups reported owning a smartphone,whereas only 40 percent of the unbanked consum-ers do the same. Though unbanked respondentsreported higher ownership rates of feature phones,
(continued on next page)
1 In 2015, the wording of the bank account question was changedfrom that used in earlier years, so the measure of the unbankedis not comparable to the prior years. The 2015 question wording,which conforms to the language from the Board’s Survey ofHousehold Economics and Decisionmaking, was, “Do you[“and/or your spouse” / “and/or your partner”] currently have achecking, savings, or money market account?” In the 2013 and2014 surveys, the question about bank accounts was, “Do youor does your spouse/partner currently have some type of bankor credit union account such as a checking, savings, or moneymarket account?”
2 Due to changes in the questions about the use of alternativefinancial services in different years of the Mobile Survey, the2015 figure for underbanked households is not directly compa-rable to results from earlier years. Of particular note is the inclu-sion of paycheck advance/deposit advance as an alternative
financial service, despite this type of service being available atsome banks. Also, the list of alternative financial servicesincluded in this survey differ from those included in the FDIC’swork on unbanked and underbanked groups, and thus compara-bility of underbanked figures across the two surveys must beapproached with these differences in mind.
Table 4. Use of mobile banking in the past 12 months by race/ethnicity
Percent, except as noted
Race/ethnicity 2011 2012 2013 2014 2015
White, non-Hispanic 19 26 30 34 37
Black, non-Hispanic 35 39 42 43 50
Other, non-Hispanic 23 31 35 48 55
Hispanic 29 36 45 53 56
2+ races, non-Hispanic 21 36 31 41 46
Total 22 29 33 39 43
Number of respondents 1,859 2,180 2,187 2,437 2,151
Note: Among those with a mobile phone and a bank account.
10 Consumers and Mobile Financial Services 2016
about mobile banking use among the unbanked and
underbanked, see box 2).
Common Mobile Banking Activities
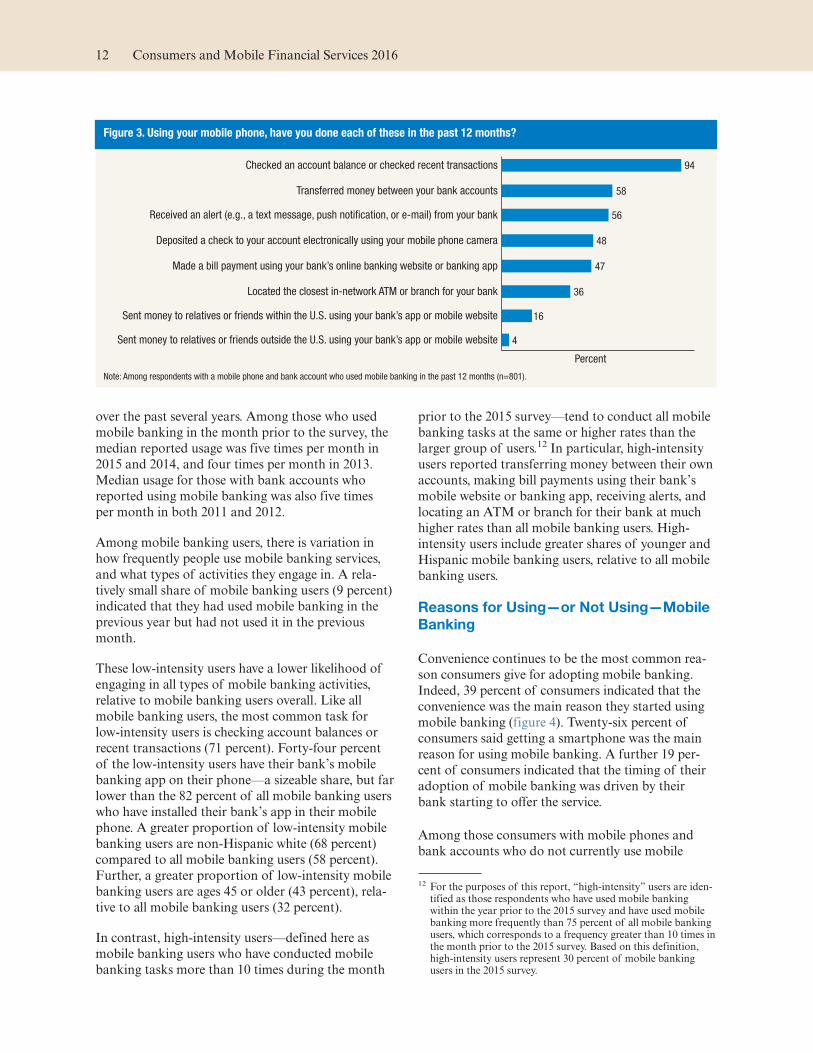
Among those who reported using mobile banking in
2015, the most common mobile banking activity was
checking financial account balances or transaction
inquiries, with 94 percent of mobile banking users
having performed this function in the 12 months
prior to the survey (figure 3).11 This was followed by
transferring money between accounts, which was per-
formed by 58 percent of users. In addition, 56 per-
cent of mobile banking users received an alert from
their financial institution through a text message,
push notification, or e-mail. Depositing a check to an
account electronically using a mobile phone camera
(known as remote deposit capture) and making an
online bill payment from a bank account using a
mobile phone were the next most common activities,
done by 48 percent and 47 percent of mobile banking
users, respectively. Mobile banking users appear to be
using mobile applications to conduct their banking
transactions, as 82 percent of mobile banking users
have installed their bank’s application on their
phones.
Among all mobile banking users, the frequency of
mobile banking use has been relatively consistent
11 An alternative way of measuring mobile banking use would be to look at the share of respondents who report they have done one or more mobile banking activities in the last 12 months. For the 2015 Mobile Survey, 58 percent of those with a bank account and a mobile phone reported doing at least one mobile banking activity from the list in the survey. When limiting to only those with a bank account and smartphone, this number increases to 69 percent. This may suggest that the share of
people using mobile banking may be somewhat higher than the measure obtained using the general definition.
Box 2. Banking Status and the Use of Mobile Banking andPayments—continued
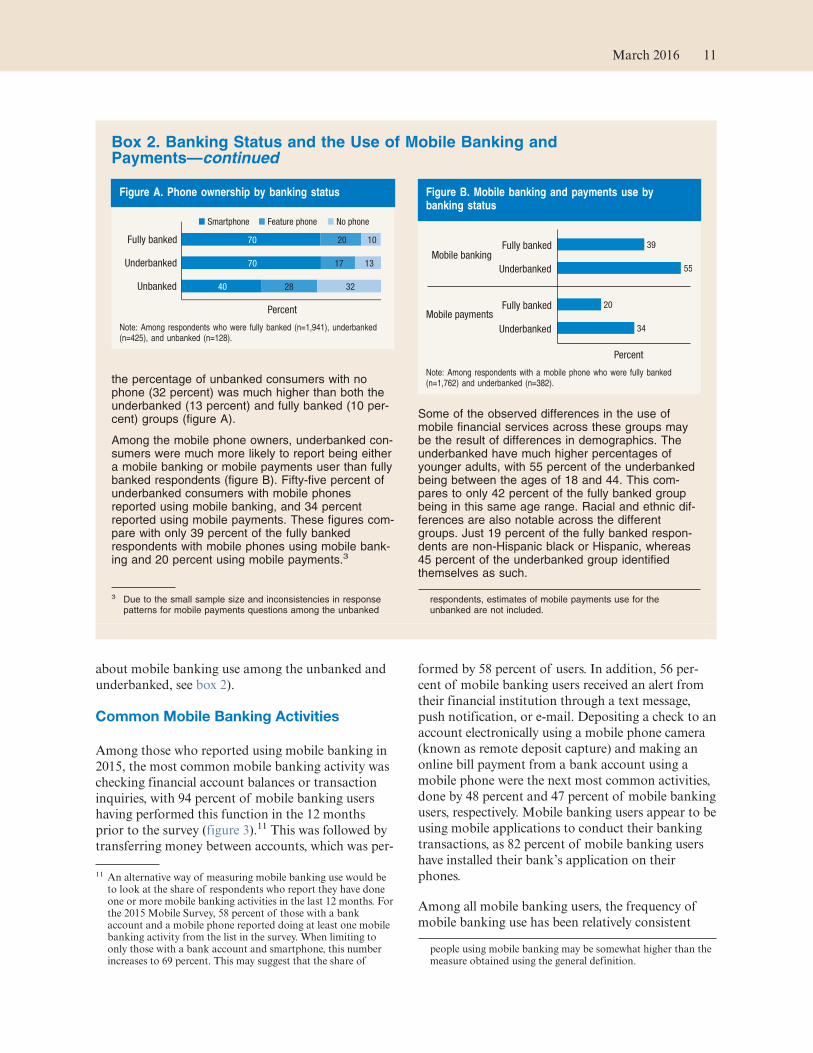
the percentage of unbanked consumers with nophone (32 percent) was much higher than both theunderbanked (13 percent) and fully banked (10 per-cent) groups (figure A).
Among the mobile phone owners, underbanked con-sumers were much more likely to report being eithera mobile banking or mobile payments user than fullybanked respondents (figure B). Fifty-five percent ofunderbanked consumers with mobile phonesreported using mobile banking, and 34 percentreported using mobile payments. These figures com-pare with only 39 percent of the fully bankedrespondents with mobile phones using mobile bank-ing and 20 percent using mobile payments.3
Some of the observed differences in the use ofmobile financial services across these groups maybe the result of differences in demographics. Theunderbanked have much higher percentages ofyounger adults, with 55 percent of the underbankedbeing between the ages of 18 and 44. This com-pares to only 42 percent of the fully banked groupbeing in this same age range. Racial and ethnic dif-ferences are also notable across the differentgroups. Just 19 percent of the fully banked respon-dents are non-Hispanic black or Hispanic, whereas45 percent of the underbanked group identifiedthemselves as such.
3 Due to the small sample size and inconsistencies in responsepatterns for mobile payments questions among the unbanked
respondents, estimates of mobile payments use for theunbanked are not included.
Figure A. Phone ownership by banking status
40
70
70
28
17
20
32
13
10
Unbanked
Underbanked
Fully banked
Percent
Smartphone Feature phone No phone
Note: Among respondents who were fully banked (n=1,941), underbanked(n=425), and unbanked (n=128).
Figure B. Mobile banking and payments use bybanking status
34
20
55
39
Underbanked
Fully banked
Underbanked
Fully banked
Mobile payments
Mobile banking
Percent
Note: Among respondents with a mobile phone who were fully banked(n=1,762) and underbanked (n=382).
March 2016 11
over the past several years. Among those who used
mobile banking in the month prior to the survey, the
median reported usage was five times per month in
2015 and 2014, and four times per month in 2013.
Median usage for those with bank accounts who
reported using mobile banking was also five times
per month in both 2011 and 2012.
Among mobile banking users, there is variation in
how frequently people use mobile banking services,
and what types of activities they engage in. A rela-
tively small share of mobile banking users (9 percent)
indicated that they had used mobile banking in the
previous year but had not used it in the previous
month.
These low-intensity users have a lower likelihood of
engaging in all types of mobile banking activities,
relative to mobile banking users overall. Like all
mobile banking users, the most common task for
low-intensity users is checking account balances or
recent transactions (71 percent). Forty-four percent
of the low-intensity users have their bank’s mobile
banking app on their phone—a sizeable share, but far
lower than the 82 percent of all mobile banking users
who have installed their bank’s app in their mobile
phone. A greater proportion of low-intensity mobile
banking users are non-Hispanic white (68 percent)
compared to all mobile banking users (58 percent).
Further, a greater proportion of low-intensity mobile
banking users are ages 45 or older (43 percent), rela-
tive to all mobile banking users (32 percent).
In contrast, high-intensity users—defined here as
mobile banking users who have conducted mobile
banking tasks more than 10 times during the month
prior to the 2015 survey—tend to conduct all mobile
banking tasks at the same or higher rates than the
larger group of users.12 In particular, high-intensity
users reported transferring money between their own
accounts, making bill payments using their bank’s
mobile website or banking app, receiving alerts, and
locating an ATM or branch for their bank at much
higher rates than all mobile banking users. High-
intensity users include greater shares of younger and
Hispanic mobile banking users, relative to all mobile
banking users.
Reasons for Using—or Not Using—Mobile
Banking
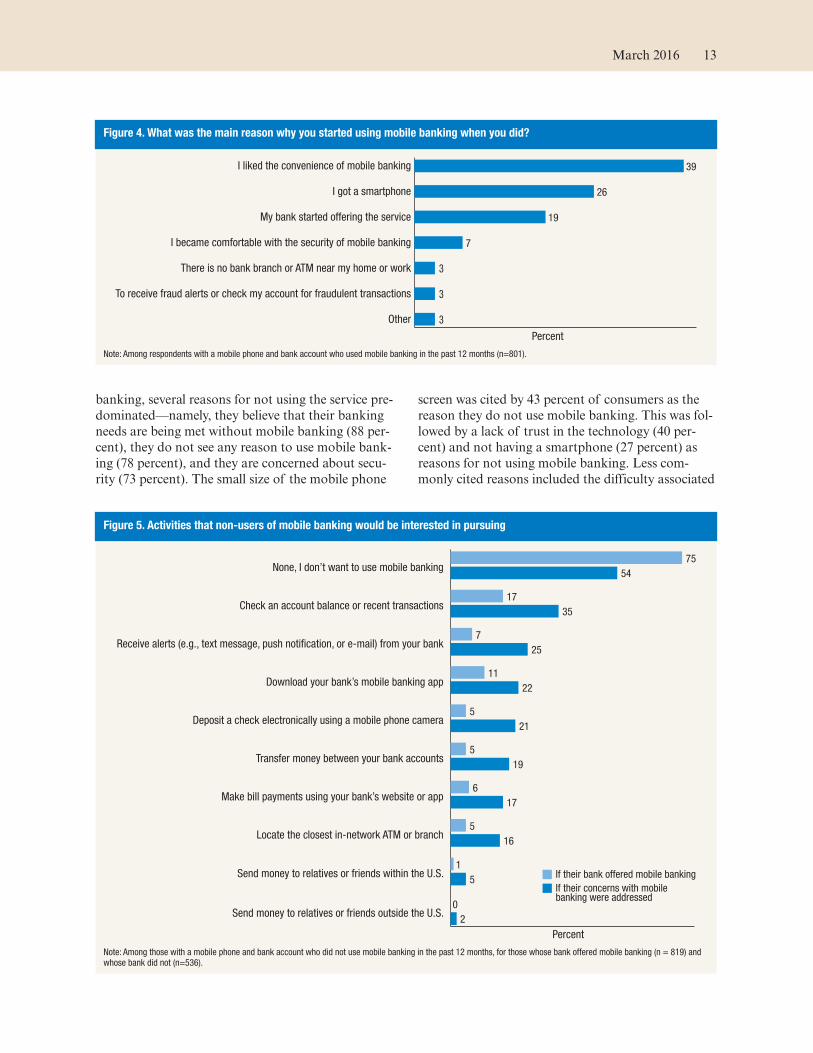
Convenience continues to be the most common rea-
son consumers give for adopting mobile banking.
Indeed, 39 percent of consumers indicated that the
convenience was the main reason they started using
mobile banking (figure 4). Twenty-six percent of
consumers said getting a smartphone was the main
reason for using mobile banking. A further 19 per-
cent of consumers indicated that the timing of their
adoption of mobile banking was driven by their
bank starting to offer the service.
Among those consumers with mobile phones and
bank accounts who do not currently use mobile
12 For the purposes of this report, “high-intensity” users are iden-tified as those respondents who have used mobile banking within the year prior to the 2015 survey and have used mobile banking more frequently than 75 percent of all mobile banking users, which corresponds to a frequency greater than 10 times in the month prior to the 2015 survey. Based on this definition, high-intensity users represent 30 percent of mobile banking users in the 2015 survey.
Figure 3. Using your mobile phone, have you done each of these in the past 12 months?
4Sent money to relatives or friends outside the U.S. using your bank’s app or mobile website
16Sent money to relatives or friends within the U.S. using your bank’s app or mobile website
36Located the closest in-network ATM or branch for your bank
47Made a bill payment using your bank’s online banking website or banking app
48Deposited a check to your account electronically using your mobile phone camera
56Received an alert (e.g., a text message, push noti!cation, or e-mail) from your bank
58Transferred money between your bank accounts
94Checked an account balance or checked recent transactions
Percent
Note: Among respondents with a mobile phone and bank account who used mobile banking in the past 12 months (n=801).
12 Consumers and Mobile Financial Services 2016
banking, several reasons for not using the service pre-
dominated—namely, they believe that their banking
needs are being met without mobile banking (88 per-
cent), they do not see any reason to use mobile bank-
ing (78 percent), and they are concerned about secu-
rity (73 percent). The small size of the mobile phone
screen was cited by 43 percent of consumers as the
reason they do not use mobile banking. This was fol-
lowed by a lack of trust in the technology (40 per-
cent) and not having a smartphone (27 percent) as
reasons for not using mobile banking. Less com-
monly cited reasons included the difficulty associated
Figure 4. What was the main reason why you started using mobile banking when you did?
I liked the convenience of mobile banking 39
I got a smartphone 26
My bank started offering the service 19
I became comfortable with the security of mobile banking 7
There is no bank branch or ATM near my home or work 3
To receive fraud alerts or check my account for fraudulent transactions 3
Other 3
Percent
Note: Among respondents with a mobile phone and bank account who used mobile banking in the past 12 months (n=801).
Figure 5. Activities that non-users of mobile banking would be interested in pursuing
If their bank offered mobile banking
If their concerns with mobilebanking were addressed
None, I don’t want to use mobile banking75
54
Check an account balance or recent transactions17
35
Receive alerts (e.g., text message, push noti!cation, or e-mail) from your bank7
25
Download your bank’s mobile banking app11
22
Deposit a check electronically using a mobile phone camera5
21
Transfer money between your bank accounts5
19
Make bill payments using your bank’s website or app6
17
Locate the closest in-network ATM or branch5
16
Send money to relatives or friends within the U.S.1
5
Send money to relatives or friends outside the U.S.0
2
Percent
Note: Among those with a mobile phone and bank account who did not use mobile banking in the past 12 months, for those whose bank offered mobile banking (n = 819) and whose bank did not (n=536).
March 2016 13
with using mobile banking (18 percent) and not
doing the banking in the household (15 percent).
The reasons respondents have given for not using
mobile banking have been generally consistent
among the 2013, 2014, and 2015 surveys. However,
over time, a smaller share of respondents have
reported that not having a smartphone (44 percent in
2013, 32 percent in 2014) was a reason why they had
not used mobile banking. (For more information on
the use of various banking channels by smartphone
users, see box 3.)
Consumers who indicated their bank offers mobile
banking but they did not use it were asked what
mobile banking activities they would be interested in
performing if their concerns were addressed. Their
top responses included several of the most common
activities of current mobile banking users. Checking
financial account balances or recent transactions was
the most commonly cited (35 percent), followed by
receiving alerts from their bank (25 percent), down-
loading their bank’s mobile banking app (22 per-
cent), and depositing checks electronically (21 per-
cent) (figure 5). However, 54 percent of these respon-
dents who do not use mobile banking indicated that
they had no interest in performing any mobile bank-
ing activities even if their concerns were addressed.
Separately, those who indicated that their bank did
not offer mobile banking or that they did not know if
their bank offered it were asked what mobile banking
activities they would be interested in doing if their
bank began to offer the service (figure 5). Checking
financial account balances or recent transactions
topped the list (17 percent), followed by downloading
Box 3. Channel Use among Smartphone Users
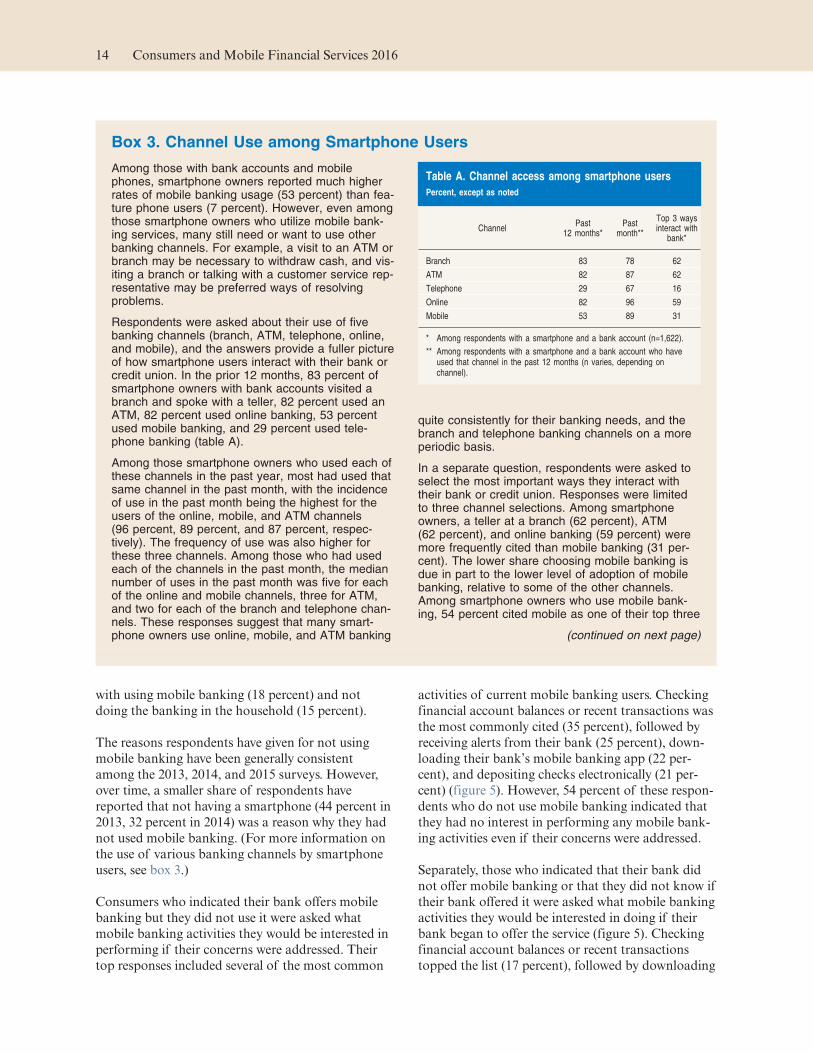
Among those with bank accounts and mobilephones, smartphone owners reported much higherrates of mobile banking usage (53 percent) than fea-ture phone users (7 percent). However, even amongthose smartphone owners who utilize mobile bank-ing services, many still need or want to use otherbanking channels. For example, a visit to an ATM orbranch may be necessary to withdraw cash, and vis-iting a branch or talking with a customer service rep-resentative may be preferred ways of resolvingproblems.
Respondents were asked about their use of fivebanking channels (branch, ATM, telephone, online,and mobile), and the answers provide a fuller pictureof how smartphone users interact with their bank orcredit union. In the prior 12 months, 83 percent ofsmartphone owners with bank accounts visited abranch and spoke with a teller, 82 percent used anATM, 82 percent used online banking, 53 percentused mobile banking, and 29 percent used tele-phone banking (table A).
Among those smartphone owners who used each ofthese channels in the past year, most had used thatsame channel in the past month, with the incidenceof use in the past month being the highest for theusers of the online, mobile, and ATM channels(96 percent, 89 percent, and 87 percent, respec-tively). The frequency of use was also higher forthese three channels. Among those who had usedeach of the channels in the past month, the mediannumber of uses in the past month was five for eachof the online and mobile channels, three for ATM,and two for each of the branch and telephone chan-nels. These responses suggest that many smart-phone owners use online, mobile, and ATM banking
quite consistently for their banking needs, and thebranch and telephone banking channels on a moreperiodic basis.
In a separate question, respondents were asked toselect the most important ways they interact withtheir bank or credit union. Responses were limitedto three channel selections. Among smartphoneowners, a teller at a branch (62 percent), ATM(62 percent), and online banking (59 percent) weremore frequently cited than mobile banking (31 per-cent). The lower share choosing mobile banking isdue in part to the lower level of adoption of mobilebanking, relative to some of the other channels.Among smartphone owners who use mobile bank-ing, 54 percent cited mobile as one of their top three
(continued on next page)
Table A. Channel access among smartphone users
Percent, except as noted
ChannelPast
12 months*Past
month**
Top 3 waysinteract with
bank*
Branch 83 78 62
ATM 82 87 62
Telephone 29 67 16
Online 82 96 59
Mobile 53 89 31
* Among respondents with a smartphone and a bank account (n=1,622).
** Among respondents with a smartphone and a bank account who haveused that channel in the past 12 months (n varies, depending onchannel).
14 Consumers and Mobile Financial Services 2016
their bank’s mobile banking app (11 percent). While
other mobile banking activities did garner interest
from smaller shares of this group, the dominant
response was that most had no interest in performing
any mobile banking activities (75 percent).
Mobile Payments
For purposes of this survey, mobile payments are
defined as “purchases, bill payments, charitable
donations, payments to another person, or any other
payments made using a mobile phone. This includes
using your phone to pay for something in a store as
well as payments made through an app, a mobile web
browser or a text message.”13 This section takes a
more detailed look at mobile payment usage, focus-
ing on mobile payment adoption, activities, and
motivations for use.
13 The definition of mobile payments was revised for the 2015 Mobile Survey. For the 2011 through 2014 surveys, the follow-ing definition of mobile payments was provided to respondents: “Mobile payments are purchases, bill payments, charitable donations, payments to another person, or any other payments made using a mobile phone. You can do this either by accessing a web page through the web browser on your mobile device, by sending a text message (SMS), or by using a downloadable application on your mobile device. The amount of the payment may be applied to your phone bill (for example, Red Cross text message donation), charged to your credit card, or withdrawn directly from your bank account.”
Box 3. Channel Use among Smartphone Users–continued
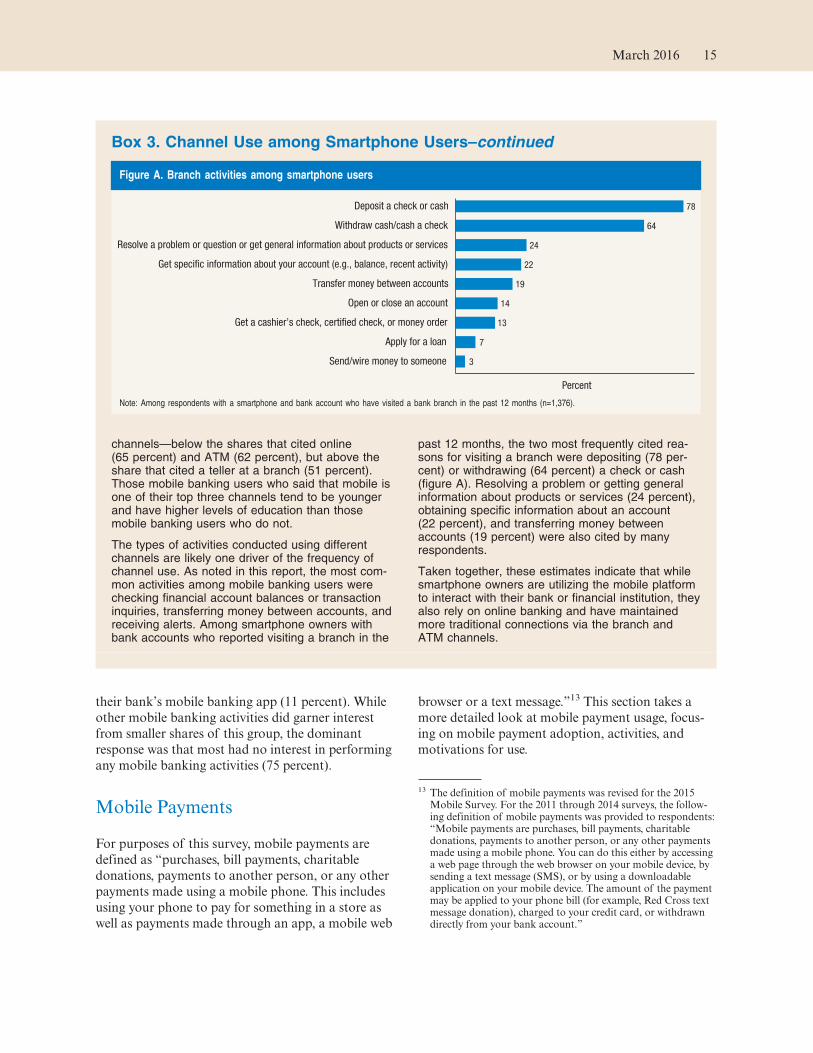
channels—below the shares that cited online(65 percent) and ATM (62 percent), but above theshare that cited a teller at a branch (51 percent).Those mobile banking users who said that mobile isone of their top three channels tend to be youngerand have higher levels of education than thosemobile banking users who do not.
The types of activities conducted using differentchannels are likely one driver of the frequency ofchannel use. As noted in this report, the most com-mon activities among mobile banking users werechecking financial account balances or transactioninquiries, transferring money between accounts, andreceiving alerts. Among smartphone owners withbank accounts who reported visiting a branch in the
past 12 months, the two most frequently cited rea-sons for visiting a branch were depositing (78 per-cent) or withdrawing (64 percent) a check or cash(figure A). Resolving a problem or getting generalinformation about products or services (24 percent),obtaining specific information about an account(22 percent), and transferring money betweenaccounts (19 percent) were also cited by manyrespondents.
Taken together, these estimates indicate that whilesmartphone owners are utilizing the mobile platformto interact with their bank or financial institution, theyalso rely on online banking and have maintainedmore traditional connections via the branch andATM channels.
Figure A. Branch activities among smartphone users
3
7
13
14
19
22
24
64
78
Send/wire money to someone
Apply for a loan
Get a cashier’s check, certi�ed check, or money order
Open or close an account
Transfer money between accounts
Get speci�c information about your account (e.g., balance, recent activity)
Resolve a problem or question or get general information about products or services
Withdraw cash/cash a check
Deposit a check or cash
Percent
Note: Among respondents with a smartphone and bank account who have visited a bank branch in the past 12 months (n=1,376).
March 2016 15
Adoption Rates
Mobile payments continue to be less common than
mobile banking. Based on the responses to the
broad definition of mobile payments listed above,
24 percent of those with access to a mobile phone
reported that they made a mobile payment in the
12 months prior to the survey. Rates of mobile pay-
ment usage are somewhat higher among smartphone
users: 28 percent of smartphone users reported
having made a mobile payment in the previous
12 months.
Of current mobile payments users, 10 percent had
started using mobile payments in the prior six
months, while 16 percent began using mobile pay-
ments six to twelve months prior to the survey. An
additional 20 percent reported that they started using
mobile payments in the prior one to two years, and
30 percent reported that they began using mobile
payments more than two years prior to the survey.
Twenty-one percent of users are unable to recall
when they began using mobile payments.
Younger consumers are more likely to make mobile
payments (table 5). Of those with a mobile phone in
2015, 30 percent of individuals ages 18 to 29 and
32 percent of individuals ages 30 to 44 had made
mobile payments. By comparison, 13 percent of
those ages 60 or over reported making mobile pay-
ments. This pattern of use by age has been evident
across all five years of the survey.
Among those owning a mobile phone, minorities are
more likely to make mobile payments (table 6). In
2014, 32 percent of non-Hispanic blacks with mobile
phones and 29 percent of Hispanics with mobile
phones had made mobile payments, while 19 percent
of non-Hispanic whites reported making mobile pay-
ments. The pattern of minorities making mobile pay-
ments at a higher rate than white, non-Hispanic con-
sumers has persisted over time in the Mobile Survey.
There is no clear relationship between mobile pay-
ment usage and income or education level among
those who own a mobile phone.
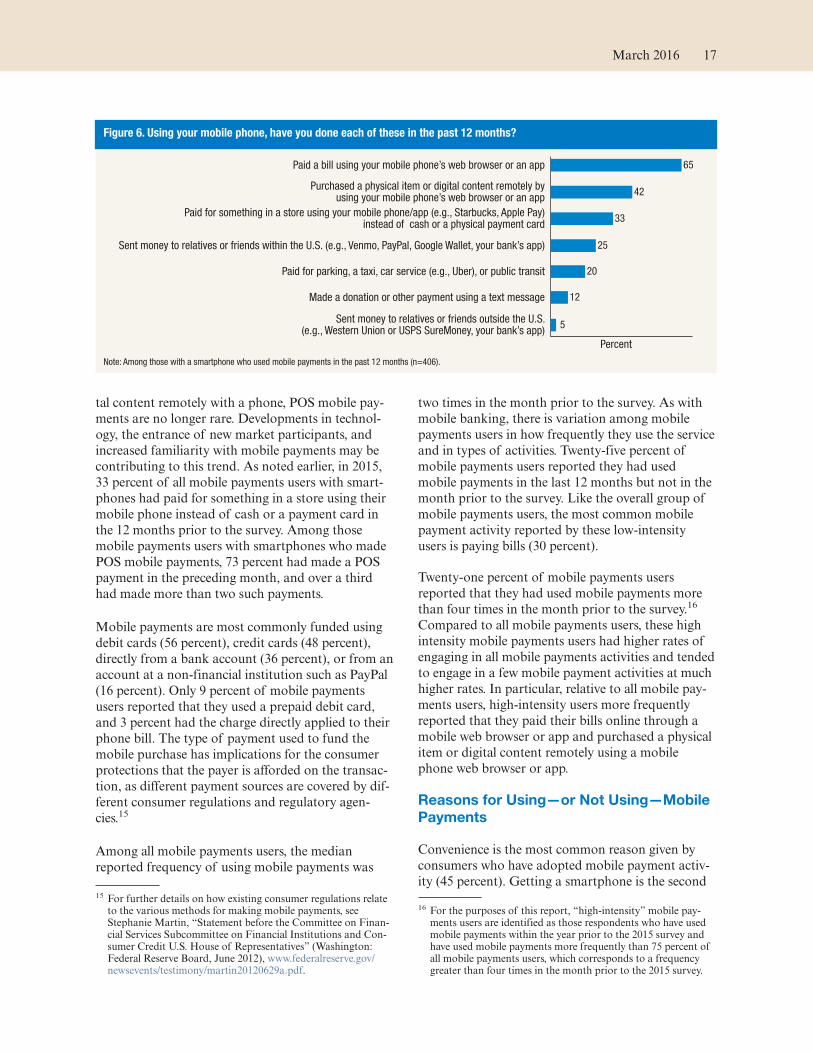
Common Mobile Payment Activities
Focusing only on those smartphone owners who
reported that they had made a mobile payment in the
prior 12 months, the most common mobile payment
activity was paying bills (65 percent), followed by
purchasing a physical item or digital content remotely
using a mobile phone web browser or app (42 per-
cent) (figure 6). The next most common activities
reported by mobile payments users were paying for
something in a store (33 percent) and sending money
to friends or relatives within the United States
(25 percent). Less common activities were paying for
parking, a taxi, car service, or public transit using a
mobile phone (20 percent); making a donation or
payment by text message (12 percent); and sending
money to relatives or friends outside the United
States (5 percent).14
Although using a mobile phone to pay for a retail
purchase at the point-of-sale (POS) is less common
than paying bills or purchasing physical items or digi-
14 An alternative way of measuring mobile payments use would be to look at the share of respondents who report they have done one or more mobile payments activities in the last 12 months. For the 2015 Mobile Survey, 30 percent of those with a mobile phone and 38 percent of those with a smartphone reported doing at least one mobile payment activity from the list in the survey. This may suggest that the share of people using mobile payments may be somewhat higher than the measure obtained using the general definition.
Table 5. Use of mobile payments in the past 12 months by age
Percent, except as noted
Age group 2011 2012 2013 2014 2015*
18–29 20 26 28 34 30
30–44 16 18 21 31 32
45–59 8 9 13 16 20
60+ 5 8 7 7 13
Total 12 15 17 22 24
Number of respondents 2,002 2,291 2,341 2,603 2,244
Note: Among respondents with a mobile phone.
* Not directly comparable to prior years due to question change in 2015.
Table 6. Use of mobile payments in the past 12 months by race/ethnicity
Percent, except as noted
Race/ethnicity 2011 2012 2013 2014 2015*
White, non-Hispanic 10 13 12 17 19
Black, non-Hispanic 14 18 34 34 32
Other, non-Hispanic 15 17 16 24 45
Hispanic 20 18 26 32 29
2+ races, non-Hispanic 9 13 31 23 26
Total 12 15 17 22 24
Number of respondents 2,002 2,291 2,341 2,603 2,244
Note: Among respondents with a mobile phone.
* Not directly comparable to prior years due to question change in 2015.
16 Consumers and Mobile Financial Services 2016
tal content remotely with a phone, POS mobile pay-
ments are no longer rare. Developments in technol-
ogy, the entrance of new market participants, and
increased familiarity with mobile payments may be
contributing to this trend. As noted earlier, in 2015,
33 percent of all mobile payments users with smart-
phones had paid for something in a store using their
mobile phone instead of cash or a payment card in
the 12 months prior to the survey. Among those
mobile payments users with smartphones who made
POS mobile payments, 73 percent had made a POS
payment in the preceding month, and over a third
had made more than two such payments.
Mobile payments are most commonly funded using
debit cards (56 percent), credit cards (48 percent),
directly from a bank account (36 percent), or from an
account at a non-financial institution such as PayPal
(16 percent). Only 9 percent of mobile payments
users reported that they used a prepaid debit card,
and 3 percent had the charge directly applied to their
phone bill. The type of payment used to fund the
mobile purchase has implications for the consumer
protections that the payer is afforded on the transac-
tion, as different payment sources are covered by dif-
ferent consumer regulations and regulatory agen-
cies.15
Among all mobile payments users, the median
reported frequency of using mobile payments was
two times in the month prior to the survey. As with
mobile banking, there is variation among mobile
payments users in how frequently they use the service
and in types of activities. Twenty-five percent of
mobile payments users reported they had used
mobile payments in the last 12 months but not in the
month prior to the survey. Like the overall group of
mobile payments users, the most common mobile
payment activity reported by these low-intensity
users is paying bills (30 percent).
Twenty-one percent of mobile payments users
reported that they had used mobile payments more
than four times in the month prior to the survey.16
Compared to all mobile payments users, these high
intensity mobile payments users had higher rates of
engaging in all mobile payments activities and tended
to engage in a few mobile payment activities at much
higher rates. In particular, relative to all mobile pay-
ments users, high-intensity users more frequently
reported that they paid their bills online through a
mobile web browser or app and purchased a physical
item or digital content remotely using a mobile
phone web browser or app.
Reasons for Using—or Not Using—Mobile
Payments
Convenience is the most common reason given by
consumers who have adopted mobile payment activ-
ity (45 percent). Getting a smartphone is the second 15 For further details on how existing consumer regulations relate
to the various methods for making mobile payments, see Stephanie Martin, “Statement before the Committee on Finan-cial Services Subcommittee on Financial Institutions and Con-sumer Credit U.S. House of Representatives” (Washington: Federal Reserve Board, June 2012), www.federalreserve.gov/newsevents/testimony/martin20120629a.pdf.
16 For the purposes of this report, “high-intensity” mobile pay-ments users are identified as those respondents who have used mobile payments within the year prior to the 2015 survey and have used mobile payments more frequently than 75 percent of all mobile payments users, which corresponds to a frequency greater than four times in the month prior to the 2015 survey.
Figure 6. Using your mobile phone, have you done each of these in the past 12 months?
5Sent money to relatives or friends outside the U.S.
(e.g., Western Union or USPS SureMoney, your bank’s app)
12Made a donation or other payment using a text message
20Paid for parking, a taxi, car service (e.g., Uber), or public transit
25Sent money to relatives or friends within the U.S. (e.g., Venmo, PayPal, Google Wallet, your bank’s app)
33Paid for something in a store using your mobile phone/app (e.g., Starbucks, Apple Pay)
instead of cash or a physical payment card
42Purchased a physical item or digital content remotely by
using your mobile phone’s web browser or an app
65Paid a bill using your mobile phone’s web browser or an app
Percent
Note: Among those with a smartphone who used mobile payments in the past 12 months (n=406).
March 2016 17
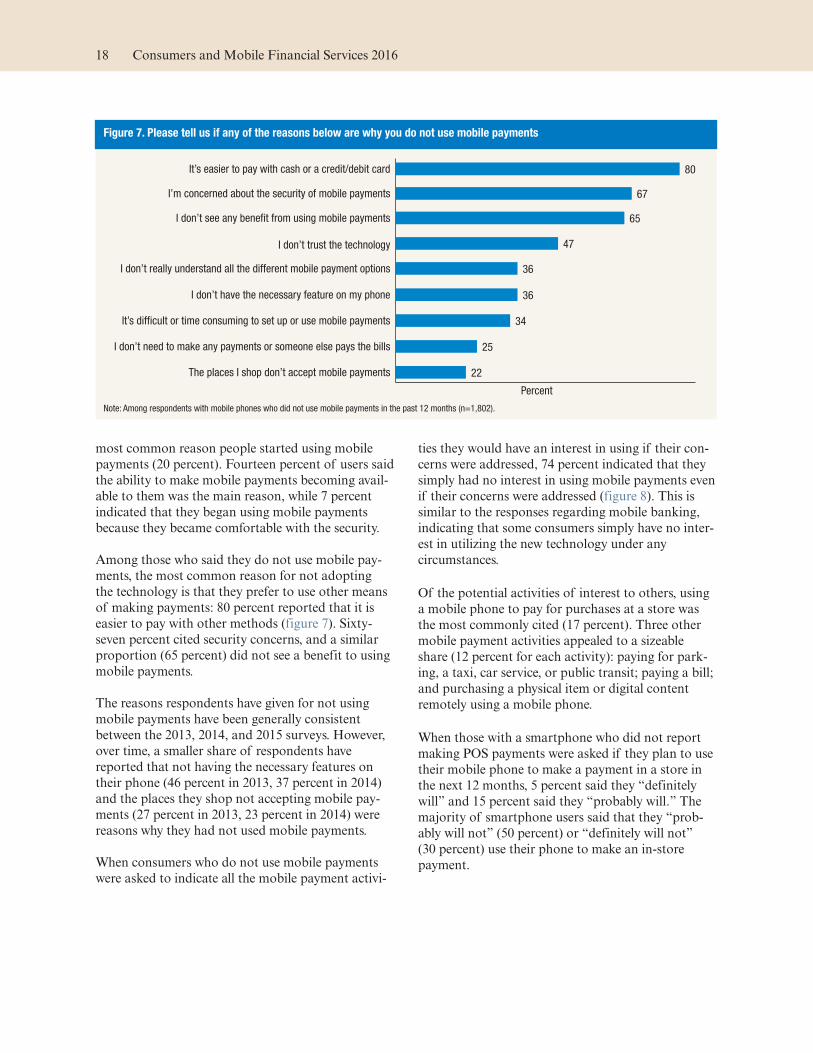
most common reason people started using mobile
payments (20 percent). Fourteen percent of users said
the ability to make mobile payments becoming avail-
able to them was the main reason, while 7 percent
indicated that they began using mobile payments
because they became comfortable with the security.
Among those who said they do not use mobile pay-
ments, the most common reason for not adopting
the technology is that they prefer to use other means
of making payments: 80 percent reported that it is
easier to pay with other methods (figure 7). Sixty-
seven percent cited security concerns, and a similar
proportion (65 percent) did not see a benefit to using
mobile payments.
The reasons respondents have given for not using
mobile payments have been generally consistent
between the 2013, 2014, and 2015 surveys. However,
over time, a smaller share of respondents have
reported that not having the necessary features on
their phone (46 percent in 2013, 37 percent in 2014)
and the places they shop not accepting mobile pay-
ments (27 percent in 2013, 23 percent in 2014) were
reasons why they had not used mobile payments.
When consumers who do not use mobile payments
were asked to indicate all the mobile payment activi-
ties they would have an interest in using if their con-
cerns were addressed, 74 percent indicated that they
simply had no interest in using mobile payments even
if their concerns were addressed (figure 8). This is
similar to the responses regarding mobile banking,
indicating that some consumers simply have no inter-
est in utilizing the new technology under any
circumstances.
Of the potential activities of interest to others, using
a mobile phone to pay for purchases at a store was
the most commonly cited (17 percent). Three other
mobile payment activities appealed to a sizeable
share (12 percent for each activity): paying for park-
ing, a taxi, car service, or public transit; paying a bill;
and purchasing a physical item or digital content
remotely using a mobile phone.
When those with a smartphone who did not report
making POS payments were asked if they plan to use
their mobile phone to make a payment in a store in
the next 12 months, 5 percent said they “definitely
will” and 15 percent said they “probably will.” The
majority of smartphone users said that they “prob-
ably will not” (50 percent) or “definitely will not”
(30 percent) use their phone to make an in-store
payment.
Figure 7. Please tell us if any of the reasons below are why you do not use mobile payments
22The places I shop don’t accept mobile payments
25I don’t need to make any payments or someone else pays the bills
34It’s dif!cult or time consuming to set up or use mobile payments
36I don’t have the necessary feature on my phone
36I don’t really understand all the different mobile payment options
47I don’t trust the technology
65I don’t see any bene!t from using mobile payments
67I’m concerned about the security of mobile payments
80It’s easier to pay with cash or a credit/debit card
Percent
Note: Among respondents with mobile phones who did not use mobile payments in the past 12 months (n=1,802).
18 Consumers and Mobile Financial Services 2016
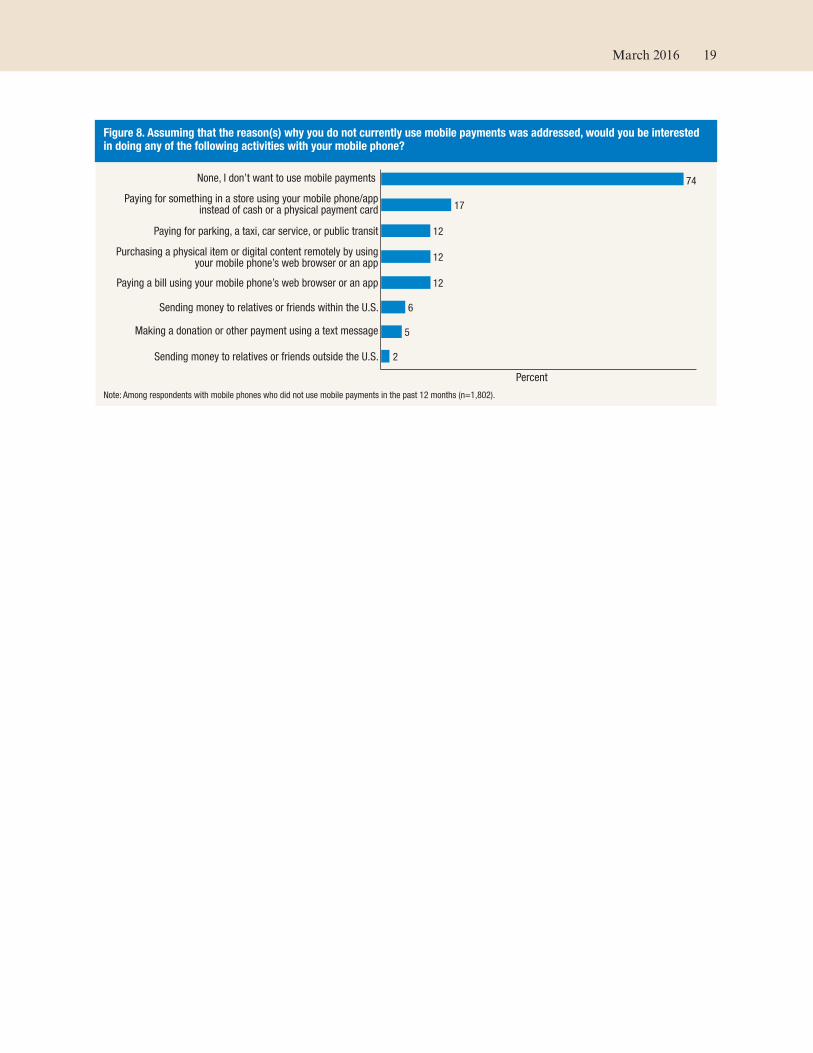
Figure 8. Assuming that the reason(s) why you do not currently use mobile payments was addressed, would you be interested in doing any of the following activities with your mobile phone?
2Sending money to relatives or friends outside the U.S.
5Making a donation or other payment using a text message
6Sending money to relatives or friends within the U.S.
12Paying a bill using your mobile phone’s web browser or an app
12Purchasing a physical item or digital content remotely by using
your mobile phone’s web browser or an app
12Paying for parking, a taxi, car service, or public transit
17Paying for something in a store using your mobile phone/app
instead of cash or a physical payment card
74None, I don’t want to use mobile payments
Percent
Note: Among respondents with mobile phones who did not use mobile payments in the past 12 months (n=1,802).
March 2016 19

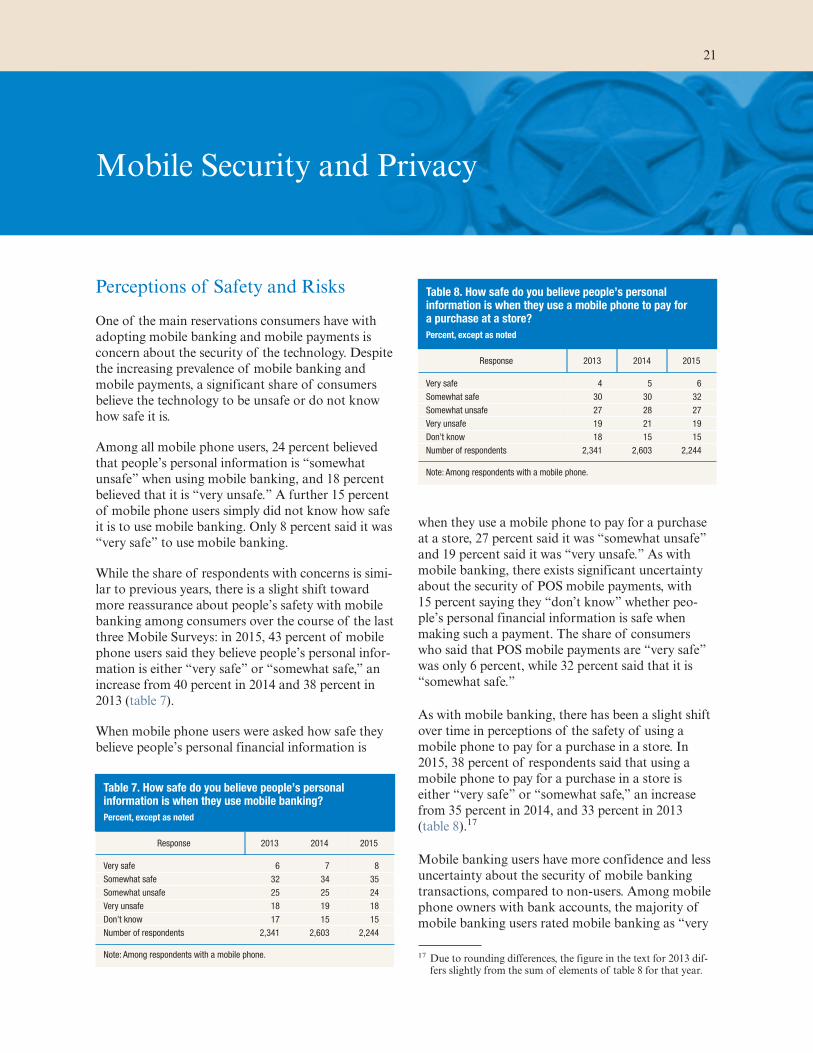
Mobile Security and Privacy
Perceptions of Safety and Risks
One of the main reservations consumers have with
adopting mobile banking and mobile payments is
concern about the security of the technology. Despite
the increasing prevalence of mobile banking and
mobile payments, a significant share of consumers
believe the technology to be unsafe or do not know
how safe it is.
Among all mobile phone users, 24 percent believed
that people’s personal information is “somewhat
unsafe” when using mobile banking, and 18 percent
believed that it is “very unsafe.” A further 15 percent
of mobile phone users simply did not know how safe
it is to use mobile banking. Only 8 percent said it was
“very safe” to use mobile banking.
While the share of respondents with concerns is simi-
lar to previous years, there is a slight shift toward
more reassurance about people’s safety with mobile
banking among consumers over the course of the last
three Mobile Surveys: in 2015, 43 percent of mobile
phone users said they believe people’s personal infor-
mation is either “very safe” or “somewhat safe,” an
increase from 40 percent in 2014 and 38 percent in
2013 (table 7).
When mobile phone users were asked how safe they
believe people’s personal financial information is
when they use a mobile phone to pay for a purchase
at a store, 27 percent said it was “somewhat unsafe”
and 19 percent said it was “very unsafe.” As with
mobile banking, there exists significant uncertainty
about the security of POS mobile payments, with
15 percent saying they “don’t know” whether peo-
ple’s personal financial information is safe when
making such a payment. The share of consumers
who said that POS mobile payments are “very safe”
was only 6 percent, while 32 percent said that it is
“somewhat safe.”
As with mobile banking, there has been a slight shift
over time in perceptions of the safety of using a
mobile phone to pay for a purchase in a store. In
2015, 38 percent of respondents said that using a
mobile phone to pay for a purchase in a store is
either “very safe” or “somewhat safe,” an increase
from 35 percent in 2014, and 33 percent in 2013
(table 8).17
Mobile banking users have more confidence and less
uncertainty about the security of mobile banking
transactions, compared to non-users. Among mobile
phone owners with bank accounts, the majority of
mobile banking users rated mobile banking as “very
17 Due to rounding differences, the figure in the text for 2013 dif-fers slightly from the sum of elements of table 8 for that year.
Table 7. How safe do you believe people’s personal information is when they use mobile banking?
Percent, except as noted
Response 2013 2014 2015
Very safe 6 7 8
Somewhat safe 32 34 35
Somewhat unsafe 25 25 24
Very unsafe 18 19 18
Don’t know 17 15 15
Number of respondents 2,341 2,603 2,244
Note: Among respondents with a mobile phone.
Table 8. How safe do you believe people’s personal information is when they use a mobile phone to pay for a purchase at a store?
Percent, except as noted
Response 2013 2014 2015
Very safe 4 5 6
Somewhat safe 30 30 32
Somewhat unsafe 27 28 27
Very unsafe 19 21 19
Don’t know 18 15 15
Number of respondents 2,341 2,603 2,244
Note: Among respondents with a mobile phone.
21
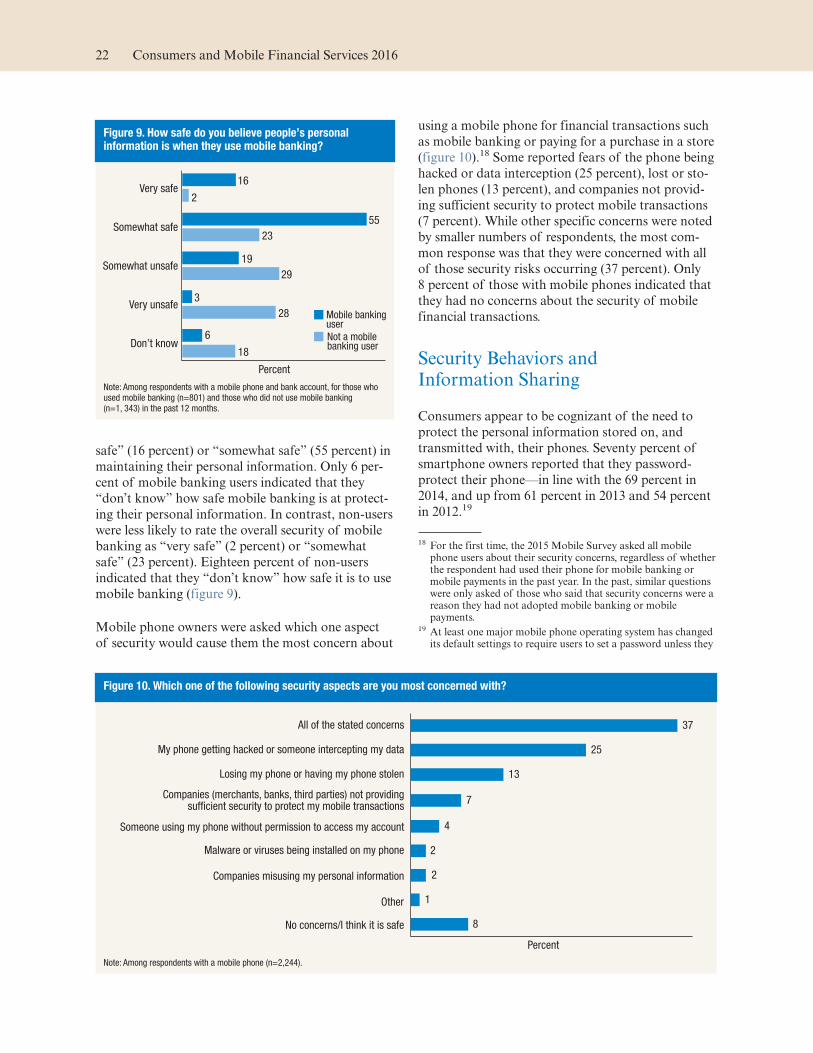
safe” (16 percent) or “somewhat safe” (55 percent) in
maintaining their personal information. Only 6 per-
cent of mobile banking users indicated that they
“don’t know” how safe mobile banking is at protect-
ing their personal information. In contrast, non-users
were less likely to rate the overall security of mobile
banking as “very safe” (2 percent) or “somewhat
safe” (23 percent). Eighteen percent of non-users
indicated that they “don’t know” how safe it is to use
mobile banking (figure 9).
Mobile phone owners were asked which one aspect
of security would cause them the most concern about
using a mobile phone for financial transactions such
as mobile banking or paying for a purchase in a store
(figure 10).18 Some reported fears of the phone being
hacked or data interception (25 percent), lost or sto-
len phones (13 percent), and companies not provid-
ing sufficient security to protect mobile transactions
(7 percent). While other specific concerns were noted
by smaller numbers of respondents, the most com-
mon response was that they were concerned with all
of those security risks occurring (37 percent). Only
8 percent of those with mobile phones indicated that
they had no concerns about the security of mobile
financial transactions.
Security Behaviors and Information Sharing
Consumers appear to be cognizant of the need to
protect the personal information stored on, and
transmitted with, their phones. Seventy percent of
smartphone owners reported that they password-
protect their phone—in line with the 69 percent in
2014, and up from 61 percent in 2013 and 54 percent
in 2012.19
18 For the first time, the 2015 Mobile Survey asked all mobile phone users about their security concerns, regardless of whether the respondent had used their phone for mobile banking or mobile payments in the past year. In the past, similar questions were only asked of those who said that security concerns were a reason they had not adopted mobile banking or mobile payments.
19 At least one major mobile phone operating system has changed its default settings to require users to set a password unless they
Figure 9. How safe do you believe people’s personal information is when they use mobile banking?
Not a mobilebanking user
Mobile bankinguser
18
6Don’t know
28
3Very unsafe
29
19Somewhat unsafe
23
55Somewhat safe
2
16Very safe
Percent
Note: Among respondents with a mobile phone and bank account, for those who used mobile banking (n=801) and those who did not use mobile banking (n=1, 343) in the past 12 months.
Figure 10. Which one of the following security aspects are you most concerned with?
8No concerns/I think it is safe
1Other
2Companies misusing my personal information
2Malware or viruses being installed on my phone
4Someone using my phone without permission to access my account
7Companies (merchants, banks, third parties) not providing
suf!cient security to protect my mobile transactions
13Losing my phone or having my phone stolen
25My phone getting hacked or someone intercepting my data
37All of the stated concerns
Percent
Note: Among respondents with a mobile phone (n=2,244).
22 Consumers and Mobile Financial Services 2016

In the 2015 Mobile Survey, smartphone owners were
also asked a new question about other specific
actions they may have taken with their smartphone
that affect mobile security and privacy.20 Eighty-
four percent of smartphone owners installed or
updated their mobile operating system or apps, and
58 percent customized privacy settings, such as
restricting which apps can track their location. Forty-
three percent changed the password on their phone
or apps, and 39 percent password-protected apps that
store sensitive data. Thirty-three percent used anti-
malware software or apps or other means to protect
their smartphone, and 33 percent used an app or ser-
vice that allows them to locate, remotely access, erase,
or disable the phone in cases of loss or theft.
For the two actions on the list that increase mobile
security risks, responses from smartphone owners
also suggested that they avoid potential risks: 78 per-
cent did not download or install apps from sources
outside the primary app store for their phone, and
76 percent did not send or access sensitive data over
public WiFi networks.
The sizable share of smartphone users who have
restricted privacy settings on their phone is consistent
with the preferences this group expressed about shar-
ing their location. Smartphone users were asked
about their level of agreement with the statement “I
am willing to allow my mobile phone to provide my
location to companies I shop with regularly so that
they can offer me discounts, promotions, or services
based on where I am.” There appears to be signifi-
cant discomfort with providing one’s location to
companies, as 33 percent indicated that they “dis-
agree” and 26 percent “strongly disagree” (figure 11).
When smartphone owners were asked about their
level of agreement with the statement “I am willing
to answer security questions or provide additional
information to my bank or credit union when I log
into mobile banking so that my bank can enhance
the security of my mobile transaction,” the response
pattern was quite different. In this case, the majority
agreed—32 percent indicated they “strongly agree”
and 42 percent that they “agree.” Thirteen percent
said they “disagree” and 12 percent indicated they
“strongly disagree.”
opt out. This change in default setting could also increase the incidence of password protection.
20 Questions about password protection and specific actions taken to enhance security were only posed to respondents with smart-phones. Feature phone users are likely to use their phones for a more limited set of tasks, and may not have given as much thought to potential security risks given the more limited func-tionality of these types of phones. Also, feature phones may not have password protection or other security options.
Figure 11. Willingness to provide information using mobile phone
12
26Strongly disagree
13
33Disagree
42
35Agree
32
6Strongly agree
I am willing to allow my mobile phone to provide my location to companies I shop with regularly so that they can offer me discounts, promotions, or services based on where I am.
I am willing to answer security questions or provide additional information to my bank or credit union when I log into mobile banking so my bank can enhance the security of my mobile transaction.
Percent
Note: Among smartphone users (n=1,680).
March 2016 23

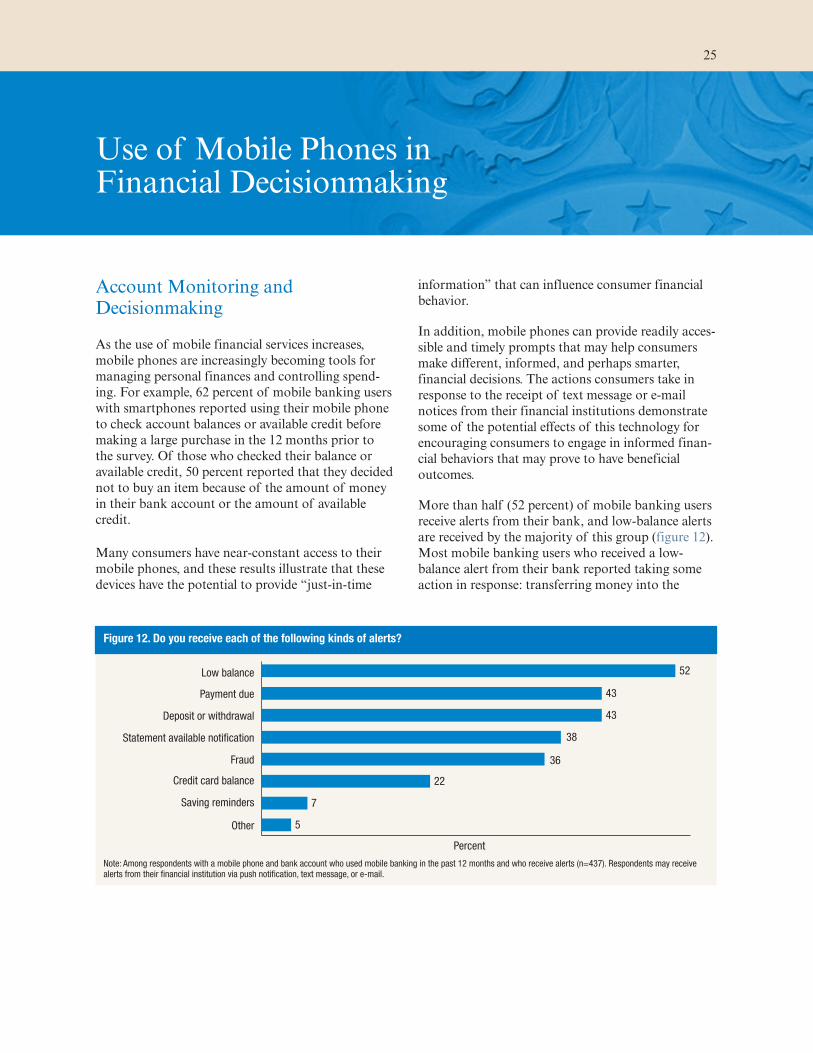
Use of Mobile Phones in Financial Decisionmaking
Account Monitoring and Decisionmaking
As the use of mobile financial services increases,
mobile phones are increasingly becoming tools for
managing personal finances and controlling spend-
ing. For example, 62 percent of mobile banking users
with smartphones reported using their mobile phone
to check account balances or available credit before
making a large purchase in the 12 months prior to
the survey. Of those who checked their balance or
available credit, 50 percent reported that they decided
not to buy an item because of the amount of money
in their bank account or the amount of available
credit.
Many consumers have near-constant access to their
mobile phones, and these results illustrate that these
devices have the potential to provide “just-in-time
information” that can influence consumer financial
behavior.
In addition, mobile phones can provide readily acces-
sible and timely prompts that may help consumers
make different, informed, and perhaps smarter,
financial decisions. The actions consumers take in
response to the receipt of text message or e-mail
notices from their financial institutions demonstrate
some of the potential effects of this technology for
encouraging consumers to engage in informed finan-
cial behaviors that may prove to have beneficial
outcomes.
More than half (52 percent) of mobile banking users
receive alerts from their bank, and low-balance alerts
are received by the majority of this group (figure 12).
Most mobile banking users who received a low-
balance alert from their bank reported taking some
action in response: transferring money into the
Figure 12. Do you receive each of the following kinds of alerts?
5Other
7Saving reminders
22Credit card balance
36Fraud
38Statement available noti!cation
43Deposit or withdrawal
43Payment due
52Low balance
Percent
Note: Among respondents with a mobile phone and bank account who used mobile banking in the past 12 months and who receive alerts (n=437). Respondents may receive alerts from their financial institution via push notification, text message, or e-mail.
25
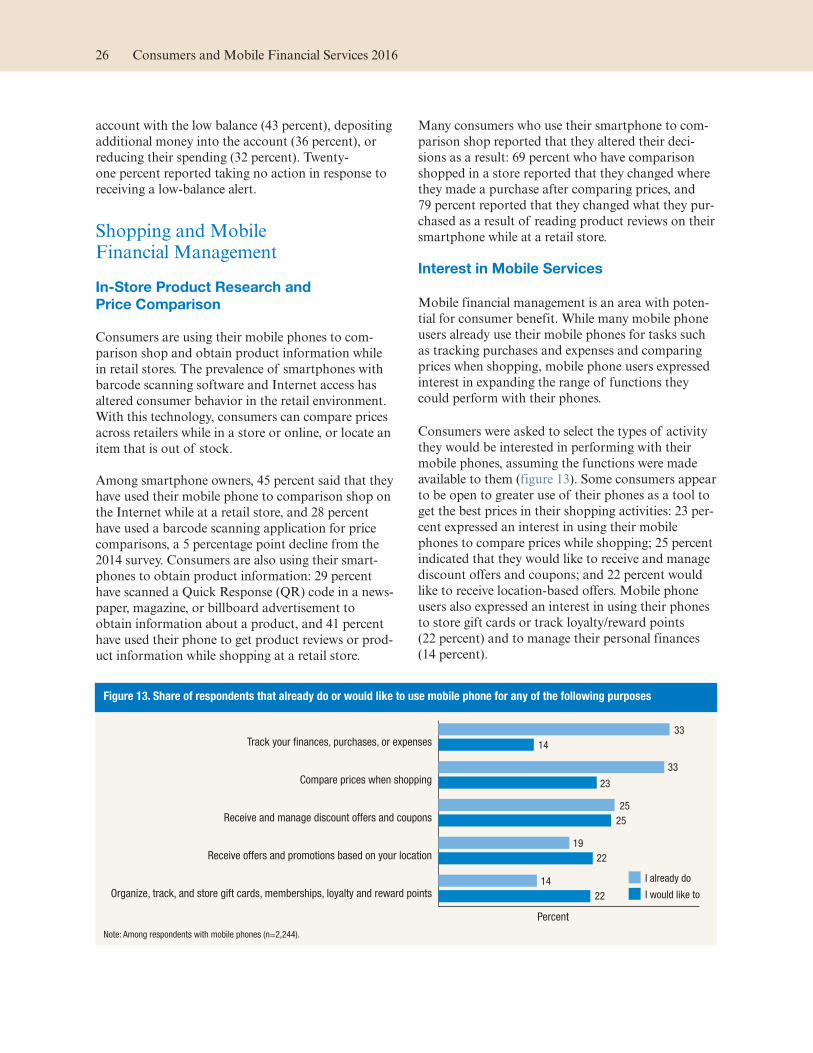
account with the low balance (43 percent), depositing
additional money into the account (36 percent), or
reducing their spending (32 percent). Twenty-
one percent reported taking no action in response to
receiving a low-balance alert.
Shopping and Mobile Financial Management
In-Store Product Research and
Price Comparison
Consumers are using their mobile phones to com-
parison shop and obtain product information while
in retail stores. The prevalence of smartphones with
barcode scanning software and Internet access has
altered consumer behavior in the retail environment.
With this technology, consumers can compare prices
across retailers while in a store or online, or locate an
item that is out of stock.
Among smartphone owners, 45 percent said that they
have used their mobile phone to comparison shop on
the Internet while at a retail store, and 28 percent
have used a barcode scanning application for price
comparisons, a 5 percentage point decline from the
2014 survey. Consumers are also using their smart-
phones to obtain product information: 29 percent
have scanned a Quick Response (QR) code in a news-
paper, magazine, or billboard advertisement to
obtain information about a product, and 41 percent
have used their phone to get product reviews or prod-
uct information while shopping at a retail store.
Many consumers who use their smartphone to com-
parison shop reported that they altered their deci-
sions as a result: 69 percent who have comparison
shopped in a store reported that they changed where
they made a purchase after comparing prices, and
79 percent reported that they changed what they pur-
chased as a result of reading product reviews on their
smartphone while at a retail store.
Interest in Mobile Services
Mobile financial management is an area with poten-
tial for consumer benefit. While many mobile phone
users already use their mobile phones for tasks such
as tracking purchases and expenses and comparing
prices when shopping, mobile phone users expressed
interest in expanding the range of functions they
could perform with their phones.
Consumers were asked to select the types of activity
they would be interested in performing with their
mobile phones, assuming the functions were made
available to them (figure 13). Some consumers appear
to be open to greater use of their phones as a tool to
get the best prices in their shopping activities: 23 per-
cent expressed an interest in using their mobile
phones to compare prices while shopping; 25 percent
indicated that they would like to receive and manage
discount offers and coupons; and 22 percent would
like to receive location-based offers. Mobile phone
users also expressed an interest in using their phones
to store gift cards or track loyalty/reward points
(22 percent) and to manage their personal finances
(14 percent).
Figure 13. Share of respondents that already do or would like to use mobile phone for any of the following purposes
I already do
I would like to Organize, track, and store gift cards, memberships, loyalty and reward points
Receive offers and promotions based on your location
Receive and manage discount offers and coupons
Compare prices when shopping
Track your !nances, purchases, or expenses
Percent
22
22
25
23
14
14
19
25
33
33
Note: Among respondents with mobile phones (n=2,244).
26 Consumers and Mobile Financial Services 2016
Conclusion
The use of mobile banking continued to rise in the
past year and appears likely to continue to increase
as more consumers use smartphones or recognize the
convenience of this service, and as more financial
institutions offer mobile banking. The most common
tasks for mobile banking users continued to be
checking account balances, transferring funds, and
receiving alerts. The use of mobile payments, broadly
defined, was lower than the use of mobile banking.
As in the previous survey, the most common mobile
payments activities were paying bills through a
mobile phone or web browser, purchasing a physical
item or digital content remotely using a mobile
phone, and paying for something in a store using a
mobile phone.
The main factors limiting consumer adoption of
mobile banking and payments were a preference for
using other methods for banking or making pay-
ments and security concerns. In terms of the value
proposition to consumers, the significant number of
mobile users who reported an interest in using their
phones to receive discounts, coupons, and promo-
tions or to track rewards and loyalty points suggests
that tying these services to a mobile payment service
may increase the attractiveness of mobile phones as a
means of payment.
As smartphones become more common and more
versatile, they can play an increasingly large role in
the interactions between consumers and financial ser-
vice providers, retailers, and other businesses. The
near-constant presence of mobile phones in consum-
ers’ lives also makes them a potentially useful tool for
the delivery of just-in-time financial information or
as an aid in decisionmaking. Given the prevalence of
mobile phones—particularly smartphones—among
minorities, low-income individuals, and younger per-
sons, mobile technology has the potential to
empower consumers and expand access to financial
services for underserved populations. However, con-
sumers will need to understand and weigh the per-
ceived benefits and potential risks to their security
and privacy presented by the use of this evolving
technology.
27

Appendix A: Technical Appendix on Survey Methodology
In order to create a nationally representative
probability-based sample, GfK’s KnowledgePanel®
has selected respondents based on both random digit
dialing and address-based sampling (ABS). Since
2009, new respondents have been recruited using
ABS. To recruit respondents, GfK sends out mailings
to a random selection of residential postal addresses.
Out of 100 mailings, approximately 14 households
respond to GfK and express an interest in joining the
panel. Of those who express an interest in joining,
around 64 percent complete the process and become
members of the panel.21 If the person contacted is
interested in participating but indicates he or she
does not have a computer or Internet access, GfK
provides him or her with a web-enabled device and
basic Internet service. Panel respondents are continu-
ously lost to attrition and added to replenish the
panel, so the recruitment rate and enrollment rate
may vary over time.
For the 2015 Mobile Survey, a total of 5,461 Knowl-
edgePanel® members received e-mail invitations to
complete the survey, including both the primary
sample and an oversample of non-Hispanic black
and Hispanic respondents. The primary sample
included 1,364 out of the 1,489 KnowledgePanel®
respondents who participated in the Mobile Surveys
for both 2013 and 2014 and who were still a part of
KnowledgePanel® and could be assigned to the 2015
survey. (See table 1 in main text.) From this group of
re-interviewed respondents, 1,071 people (excluding
breakoffs) responded to the e-mail request to partici-
pate and completed the survey, yielding a final stage
completion rate of 78.5 percent. The recruitment rate
for the re-interviewed respondents, reported by GfK,
was 15.9 percent and the profile rate was 63.4 per-
cent, for a cumulative response rate for this sample
of 7.9 percent. The primary sample also included
an additional 2,324 randomly selected Knowl-
edgePanel® respondents who did not participate in
the previous Mobile Survey. From this sample of
fresh cases, a total of 1,458 people (excluding
breakoffs) responded to the e-mail request to partici-
pate and completed the survey, yielding a final stage
completion rate of 62.7 percent. The recruitment rate
for the fresh sample, reported by GfK, was 12.8 per-
cent and the profile rate was 64.3 percent, for a
cumulative response rate of 5.2 percent. From the
2,529 primary sample respondents who completed
the survey, 9 were excluded due to the study qualifi-
cation criterion, and 10 were excluded based on data
quality concerns.22 Answers from the remaining
2,510 respondents were used to compute statistics
presented in this report, including the tables in
appendix C.
The 2015 survey also included an oversample of non-
Hispanic black and Hispanic respondents who were
randomly selected from KnowledgePanel® respon-
dents in these racial and ethnic groups who did not
participate as primary sample respondents in the pre-
vious Mobile Survey. Of these additional 1,773
KnowledgePanel® members who received invitations
as a part of the non-Hispanic black and Hispanic
oversample, 773 people (excluding breakoffs)
responded to the e-mail request to participate and
completed the survey, yielding a final stage comple-
tion rate of 43.6 percent for the oversample. The
recruitment rate for the non-Hispanic black and His-
panic oversample, reported by GfK, was 11.6 percent
and the profile rate was 64.8 percent, for a cumula-
tive response rate of 3.3 percent. From the 773 over-
sample respondents who completed the survey, 2
were excluded due to the study qualification crite-
rion, and 2 were excluded based on data quality con-
cerns, yielding 769 responses for analysis. For compa-
rability with the sample design from prior years of
21 For further details on the KnowledgePanel® sampling method-ology and comparisons between KnowledgePanel® and tele-phone surveys see www.knowledgenetworks.com/accuracy/spring2010/disogra-spring10.html.
22 Respondents who refused to answer whether they own or have regular access to a mobile phone (Q19) were not qualified for the study. Respondents who completed the survey in less than one-fourth of the median time for their respective survey paths or who refused to answer more than one-half of the substantive survey questions were excluded due to data quality concerns.
29
the Mobile Survey, answers from these respondents
are not included in the statistics in this report.
After pretesting, the data collection for the survey
began on November 4, 2015. For the re-interviewed
sample, the survey was closed to responses on
November 9, 2015. For the fresh sample and over-
sample respondents, the survey concluded on
November 23, 2015. To enhance the completion rate,
GfK sent e-mail reminders to non-responders from
all samples on day three of the field period. Two
additional e-mail reminders were sent to the non-
responders from the oversample on days 8 and 12 of
the field period. Three additional e-mail reminders
were sent to the non-responders from the fresh gen-
eral population sample on days 8, 12, and 16 of the
field period. GfK maintains an ongoing modest
incentive program to encourage KnowledgePanel®
members to participate. Incentives take the form of
raffles and lotteries with cash and other prizes.
Significant resources and infrastructure are devoted
to the recruitment process for the KnowledgePanel®
so that the resulting panel can properly represent the
adult population of the United States. Consequently,
the raw distribution of KnowledgePanel® mirrors
that of U.S. adults fairly closely, barring occasional
disparities that may emerge for certain subgroups due
to differential attrition rates among recruited panel
members.
The selection methodology for general population
samples from the KnowledgePanel® ensures that the
resulting samples behave as equal probability of
selection method (EPSEM) samples. This methodol-
ogy starts by weighting the entire KnowledgePanel®
to the benchmarks secured from the latest March
supplement of the Current Population Survey (CPS)
along several dimensions. This way, the weighted dis-
tribution of the KnowledgePanel® matches that of
U.S. adults. Typically, the geo-demographic dimen-
sions used for weighting the entire KnowledgePanel®
include gender, age, race/ethnicity, education, Census
region, household income, home ownership status,
metropolitan area status, and Internet access.
Using the above weights as the measure of size
(MOS) for each panel member, in the next step a
probability proportional to size (PPS) procedure is
used to select study specific samples. For studies that
include any oversampling of particular subgroups,
the departure from an EPSEM design caused by the
oversample is corrected by adjusting the correspond-
ing design weights accordingly with the CPS bench-
marks serving as reference points.
Once the sample has been selected and fielded, and
all the study data are collected and made final, a
post-stratification process is used to adjust for any
survey non-response as well as any non-coverage or
under- and over-sampling resulting from the study-
specific sample design. The following variables were
used for the adjustment of weights for this study:
gender, age, race/ethnicity, Census region, metropoli-
tan area status, education, and access to the Internet.
Demographic and geographic distributions for the
general population of adults ages 18 and over from
the March 2015 CPS, and the July 2013 CPS for
Internet access, were used as benchmarks in this
adjustment.
Although weights allow the sample population to
match the U.S. population based on observable char-
acteristics, similar to all survey methods, it remains
possible that non-coverage or non-response results in
differences between the sample population and the
U.S. population that are not corrected using weights.
There are several reasons that a probability-based
Internet panel was selected as the method for this
survey rather than an alternative survey method. The
first reason is that these types of Internet surveys
have been found to be representative of the popula-
tion.23 The second reason is that the ABS Internet
panel allows the same respondents to be
re-interviewed in subsequent surveys with relative
ease, as they remain in the panel for several years.
The third reason is that Internet panel surveys have
numerous existing data points on respondents from
previously administered surveys, including detailed
demographic and economic information. This allows
for the inclusion of additional information on
respondents without increasing respondent burden.
Lastly, collecting data through an ABS Internet panel
survey is cost effective, and can be done relatively
quickly.
There are possible questions about the extent to
which results from an online survey of technology
use can be interpreted as being representative of the
technology use of the U.S. population. As with any
23 David S. Yeager, Jon A. Krosnick, LinChiat Chang, Harold S. Javitz, Matthew S. Levendusky, Alberto Simpser, and Rui Wang, “Comparing the Accuracy of RDD Telephone Surveys and Internet Surveys Conducted with Probability and Non-Probability Samples,” Public Opinion Quarterly 75, no. 4 (2011):709–47.
30 Consumers and Mobile Financial Services 2016
survey method, Internet panels can be subject to
biases resulting from undercoverage or nonresponse
and, in this case, potential underrepresentation of
adults who are physically or cognitively impaired or
who may prefer not to use some forms of technol-
ogy.24 Not everyone in the United States has access
to the Internet, and there are demographic (income,
education, age) and geographic (urban and rural) dif-
ferences between those who do have access and those
who do not. These concerns about survey error for
Internet surveys are partially corrected by GfK pro-
viding Internet access to respondents who do not
have it in order to include the portion of the popula-
tion that does not have Internet access in Knowl-
edgePanel®. They are further corrected by the use of
post-stratification weights to ensure that the Internet
usage and key demographics of the weighted sample
population matches the entire U.S. population.
While these steps have been taken to make the survey
results generalizable to the adult U.S. population,
some caveats apply to interpretation of the results,
particularly for subpopulations. This survey was con-
ducted in English, and thus may not reflect the atti-
tudes and behaviors of those in the U.S. population
whose dominant language is not English. In addition,
participation in this type of survey may require a cer-
tain level of skill and interest in responding online,
which could limit coverage of some groups, particu-
larly among those in the population who are less
likely to use computers or the Internet. As a result, to
the extent that these differences cannot be incorpo-
rated into the sample weights, technology usage
among survey respondents may differ along key
dimensions from that of the overall U.S. population.
24 For a discussion of differences in measures from a web-only sur-vey and a web-plus-mail survey design, including a comparison of technology and Internet measures, see Pew Research Center, September 2015, “Coverage Error in Internet Surveys,” avail-able at www.pewresearch.org/files/2015/09/2015-09-22_coverage-error-in-internet-surveys.pdf.
March 2016 31

Appendix B: Survey of Consumers’ Use of Mobile Financial Services 2015—Questionnaire
Below is a reproduction of the survey instrument in its entirety. The bracketed text
are programming instructions that (1) indicate whether or not a question is single
choice [S] or multiple choice [M] and (2) represent any skip pattern used to reach
that question and which questions should be grouped together on a page. The
respondents only saw the questions and response options; they did not see the pro-
gram code.
I. INTRODUCTION
[DISPLAY]
OMB Control Number: 7100-0359
Expiration Date: 04/30/2017
For more information, click here.
The Federal Reserve Board is interested in learning more about how people man-
age their finances, shop, and make payments. We are also interested in how people
interact with financial institutions, and how mobile phones and other technology
facilitate these interactions. The information collected in this survey will be used
for research, analysis, and policymaking. A dataset containing anonymized
responses may also be released publicly on the Federal Reserve Board’s website.
We appreciate your participation in this survey.
To begin, we are going to ask a few questions about the types of financial products
and services that you use.
SCRIPTER: IF “FOR MORE INFORMATION…” CLICKED, DISPLAY THIS TEXT IN A NEW
TAB OR WINDOW
The Federal Reserve may not conduct or sponsor, and an organization is not
required to respond to, a collection of information unless it displays a currently
valid OMB control number. Public reporting burden for this information collec-
tion is estimated to average 0.18 hours, including the time to gather data in the
required form and to review instructions and complete the information collection.
Send comments regarding this burden estimate or any other aspect of this collec-
tion of information, including suggestions for reducing this burden to: Secretary,
Board of Governors of the Federal Reserve System, 20th and C Streets, NW,
Washington, DC 20551, and to the Office of Management and Budget, Paperwork
Reduction Project (7100-0359), Washington, DC 20503.
33
II. MAIN QUESTIONNAIRE
SCRIPTER: USE DEFAULT INSTRUCTION TEXT FOR EACH QUESTION TYPE UNLESS OTH-
ERWISE SPECIFIED.
SCRIPTER: DO NOT PROMPT ON ALL QUESTIONS.
Standard response labels include:
S = Single Select (only one answer possible)
M = Multi Select (multiple answers are possible)
Grid = Grid (one answer per row assumed by default, specify if other response
type needed)
Q = Quantity (numeric response)
O = Open End (free form text response; indicate size of text response box)
OL = Open List (text response boxes for unaided recall; 10 boxes set-up as
standard)
A. Banking Section
Base: All respondents
Q1 [S]
Do you [IF PPMARIT=1, INSERT:“and/or your spouse” / IF PPMARIT=6,
INSERT:“and/or your partner”] currently have a checking, savings or money mar-
ket account?
1. Yes
2. No
Base: Q1=2
Q2 [S]
Have you [IF PPMARIT=1, INSERT:“and/or your spouse”/ IF PPMARIT=6,
INSERT:“and/or your partner”] ever had a checking, savings or money market
account?
1. Yes
2. No
34 Consumers and Mobile Financial Services 2016
Base: All respondents
Q3 [S]
Have you used a general-purpose reloadable prepaid card in the past 12 months?
General-purpose reloadable prepaid cards typically have a Visa, MasterCard,
American Express, or Discover logo and can be used like debit cards to purchase
goods in stores and online, pay bills, and withdraw cash from an ATM. Money
must be loaded onto the card before it is used, and the card can be reloaded with
money as well. (Please do NOT include nonreloadable cards, such as gift and
rebate cards.)
1. Yes
2. No
Base: All respondents
Q4 [GRID]
SCRIPTER: SHOW THIS TEXT INSTEAD OF DEFAULT INSTRUCTIONS: Please answer yes
or no to each option
In the past 12 months, have you:
Statement in row:
1. used a money order
2. used a check-cashing service
3. used a tax refund anticipation loan
4. used a pawn shop loan, a payday loan, an auto title loan, or a paycheck
advance/deposit advance
5. sent money to a relative or friend (not a business) living outside of the U.S.
using a service other than a bank (e.g. WesternUnion, USPS SureMoney, etc.)
Answers in column:
1. Yes
2. No
Base: IF Q1 = 1
[DISPLAY; SHOW ON THE SAME SCREEN AS Q5]
In this section we would like to ask you about how you interact with your bank or
credit union.
March 2016 35
Base: IF Q1 = 1
SCRIPTER: ALLOW RESPONDENTS TO CHOOSE UP TO 3 ANSWER OPTIONS. REPLACE
DEFAULT INSTRUCTIONS WITH: Select up to 3 answers
Q5 [M – allow 3 selections maximum]
SCRIPTER: RANGE: 1–3; Unique Values; SHOW ON SAME SCREEN AS DISPLAY, USE
SAME FORMAT AS Q16 in SNO19247, NOTE RANGE CHANGE
What do you consider to be the most important ways you interact with your bank
or credit union?
1. ATM/Cash machine
2. A teller in person at a branch
3. Over the internet using a computer/tablet
4. Mobile phone app, mobile web browser or SMS/text message
5. Phone – Talking or using touchtone service
6. Mail
7. Family member, friend, or neighbor does the banking for me
8. Other (Please specify):[TXT]________________________________
Base: IF Q1 = 1
Q6 [S]
Have you visited a bank branch and spoken with a teller or a bank employee in the
past 12 months? Please do not include visits where your only activity was using an
ATM/Cash machine located at a branch.
1. Yes
2. No
36 Consumers and Mobile Financial Services 2016
Base: Q6 = 1
Q7 [Q; RANGE: 0-99]
In the past month, about how many times have you visited a branch and spoken
with a teller or a bank employee? If none enter “0”.
_____times in the past month
Base: Q1 = 1
Q8 [Q; RANGE: 0-999]
About how long does it take you to travel to the branch you typically visit (one
way)?
_____ minutes
□ Check this box if you don’t visit a branch [S]
Base: Respondents who chose checkbox for Q8
Q8a [S]
Which of the following best describes the location of your bank or credit union
branch where you can speak with a teller or bank employee, if needed?
1. I have a branch close to my home, work, school, or other place I go frequently.
2. I must go out of my way or travel for a while to visit a branch.
3. I am not able to visit a branch because my bank does not have a branch in my
area.
March 2016 37
Base: Q6 = 1
Q9 [GRID]
SCRIPTER: SHOW THIS TEXT INSTEAD OF DEFAULT INSTRUCTIONS: Please answer yes
or no to each option
In the past 12 months when you visited a branch and spoke with a teller or cus-
tomer service representative, did you do each of the following in any of those vis-
its? (Please do not include ATM/Cash machine transactions.)
Statement in row:
1. Deposit a check or cash
2. Withdraw cash/cash a check
3. Get a cashier’s check, certified check, or money order
4. Send/wire money to someone
5. Transfer money between accounts
6. Apply for a loan
7. Open or close an account
8. Resolve a problem or question or get general information about products or
services
9. Get specific information about your account (e.g., balance, recent activity)
10. Other (please specify): [TXT]
Answers in column:
1. Yes
2. No
Base: Q1 = 1
Q10 [S]
Have you used an ATM for any banking transactions in the past 12 months?
1. Yes
2. No
Base: Q10 = 1
Q11 [Q; RANGE: 0-99]
In the past month, about how many times have you used an ATM for banking
transactions? If none enter “0”.
______times in the past month
38 Consumers and Mobile Financial Services 2016

Base: Q1 = 1
Q12 [Q; RANGE: 0-999]
About how long does it take you to travel to the ATM you typically use (one way)?
____minutes
□ Check this box if you don’t use an ATM.[S]
Base: Respondents who chose checkbox for Q12
Q12a [S]
Which of the following best describes the location of the ATM you can use for
banking transactions, if needed?
1. I have an ATM close to my home, work, school, or other place I go frequently.
2. I must go out of my way or travel for a while to access the ATM.
3. I am not able to use an ATM for banking transactions because there is not an
ATM in my area.
Base: Q1 = 1
Q13 [S]
Telephone banking is when you access your account by calling a phone number that
your bank has provided. You interact with the system using either voice com-
mands, your phone’s numeric keypad, or speaking with a live customer service rep-
resentative. It does not include accessing your bank using the internet or apps on
your mobile phone.
Have you used telephone banking in the past 12 months, either with a land-line
phone or your mobile phone?
1. Yes
2. No
Base: Q13 = 1
Q14 [Q; RANGE: 0-99]
In the past month, about how many times have you used telephone banking to
access your account? If none enter “0”.
______times in the past month
March 2016 39
Base: All respondents
[DISPLAY; SHOW ON THE SAME SCREEN AS Q15]
In this section, we’ll ask a few questions about your use of the internet. Right now
we are just interested in your use of the internet on a computer (desktop, laptop) or
tablet. Later on we will ask about use of the internet on mobile phones.
Base: All respondents
Q15 [GRID]
SCRIPTER: SHOW THIS TEXT INSTEAD OF DEFAULT INSTRUCTIONS: Please answer yes
or no to each option
Do you currently have regular access to the internet at your home that is not pro-
vided by GfK, formerly Knowledge Networks?
Statement in row:
1. Using a computer (desktop, laptop)?
2. Using a tablet (e.g., iPad)?
Answers in column:
1. Yes
2. No
Base: All respondents
Q16 [GRID]
SCRIPTER: SHOW THIS TEXT INSTEAD OF DEFAULT INSTRUCTIONS: Please answer yes
or no to each option
Do you currently have regular access to the internet outside your home (e.g., at
school, work, public library, etc.)?
Statement in row:
1. Using a computer (desktop, laptop)?
2. Using a tablet (e.g., iPad)?
Answers in column:
1. Yes
2. No
40 Consumers and Mobile Financial Services 2016

Base: Q1=1
Q17 [S]
Online banking involves checking your account balance and recent transactions,
transferring money, paying bills, or conducting other related transactions with
your bank or credit union using the internet.
Have you used online banking on a desktop, laptop, or tablet (e.g., iPad) computer
in the past 12 months?
1. Yes
2. No
Base: Q17=1
Q18 [Q; RANGE: 0-99]
In the past month, about how many times have you used online banking on a desk-
top, laptop, or tablet (e.g., iPad) computer? If none enter “0”.
______times in the past month
B. Mobile Phone Usage
Base: All respondents
[DISPLAY; SHOW ON SAME SCREEN AS Q19]
In this section we would like to ask you about your use of mobile phones (cell
phones).
Base: All respondents
Q19 [S][PROMPT, TERMINATE IF SKIPPED]
Do you own or have regular access to a mobile phone (cell phone)?
1. Yes → [MOBILE = “YES”]
2. No → [MOBILE = “NO”]
SCRIPTER: TERMINATE IF REFUSED Q19
CREATE DOV: MOBILE
DOV_MOBILE =1 IF Q19=1
DOV_MOBILE =2 IF Q19=2
March 2016 41
Base: DOV_MOBILE=1
Q20 [S]
A smartphone is a mobile phone with features that may enable it to access the web,
send e-mails, download apps, and interact with computers. Smartphones include
the iPhone, Blackberry, as well as Android and Windows Mobile powered devices.
Is your mobile phone a smartphone?
1. Yes
2. No
Base: Q20=1
Q21 [S]
Which type of smartphone do you have?
1. Android
2. Blackberry
3. iPhone
4. Windows Mobile
5. Other
6. Don’t know
Base: DOV_MOBILE=1
Q22 [S]
How confident are you in your ability to understand and navigate the technology
and features of your mobile phone?
1. Very confident
2. Somewhat confident
3. Not confident
Base: Q20=1
Q23 [S]
Do you password protect your smart phone? Please count using a PIN, drawing a
pattern, fingerprint or facial recognition, and other methods of securing your
phone as password protection.
1. Yes
2. No
42 Consumers and Mobile Financial Services 2016
Base: Q20=1
Q24 [GRID]
SCRIPTER: SHOW THIS TEXT INSTEAD OF DEFAULT INSTRUCTIONS: Please answer yes
or no to each option
In the past 12 months, have you taken any of the following actions with your
smartphone?
PROGRAMMING NOTE: CODE “Yes” AS 1, “No” AS 0, AND REFUSED AS -1.
Statement in row:
1. Install updates to your mobile operating system or your apps
2. Change password on your phone or apps
3. Use anti-malware software or other means to protect your smartphone
4. Download or install apps from sources outside the primary app store for your
phone (e.g., from sources other than Apple iTunes, Google Play, or Windows
Phone stores)
5. Customize privacy settings (e.g., restricting which apps can track your location)
6. Password protect apps that store sensitive data (e.g., mobile wallet)
7. Send or access sensitive data over public WiFi networks
8. Use an app or other service that allows you to locate, remotely access, erase, or
disable your smartphone in case of loss or theft (e.g., Apple “Find my iPhone”
or BullGuard)
Answer in columns:
1. Yes
2. No
C. Mobile Banking Users
Base: DOV_MOBILE=1 AND Q1=1
[DISPLAY; SHOW ON THE SAME SCREEN AS Q25 and Q26]
Mobile banking uses a mobile phone to access your bank or credit union account.
This can be done either by accessing your bank or credit union’s web page through
the web browser on your mobile phone, via text messaging, or by using an app
downloaded to your mobile phone.
March 2016 43
Base: DOV_MOBILE=1 AND Q1=1
Q25 [S; SHOWN ON SAME SCREEN AS Q26]
Does your bank or credit union offer mobile banking?
1. Yes
2. No
3. Don’t know
Base: DOV_MOBILE=1 AND Q1=1
Q26 [S; SHOWN ON SAME SCREEN AS Q25]
Have you used mobile banking in the past 12 months?
1. Yes → [MOBILEBANK = “YES”]
2. No → [MOBILEBANK = “NO”]
CREATE DOV: MOBILEBANK
1. “YES”
2. “NO”
Base: DOV_MOBILEBANK=2
Q27 [S]
Do you plan to use mobile banking in the next 12 months?
1. Definitely will use
2. Probably will use
3. Probably will not use
4. Definitely will not use
44 Consumers and Mobile Financial Services 2016
Base: DOV_MOBILE=1 AND Q1=1
Q28 [GRID]
SCRIPTER: SHOW THIS TEXT INSTEAD OF DEFAULT INSTRUCTIONS: Please answer yes
or no to each option
Using your mobile phone, have you done each of the following in the past
12 months?
PROGRAMMING NOTE: CODE “Yes” AS 1, “No” AS 0, AND REFUSED AS -1.
Statement in rows:
1. Checked an account balance or checked recent transactions
2. Made a bill payment using your bank’s online banking website or banking app
3. Received an alert (e.g., a text message, push notification or email) from
your bank
4. Transferred money between your bank accounts
5. Sent money to relatives or friends within the U.S. using your bank’s app or
mobile website
6. Sent money to relatives or friends outside the U.S. using your bank’s app or
mobile website
7. Deposited a check to your account electronically using your mobile phone
camera
8. Located the closest in-network ATM or branch for your bank
Answers in columns:
1. Yes
2. No
Base: DOV_MOBILE=1 AND Q1=1
Q29 [S]
Do you have your bank’s mobile banking app on your mobile phone?
1. Yes
2. No
Base: DOV_MOBILEBANK=1
Q30 [Q; RANGE: 0-999]
In the past month, about how many times have you personally used mobile bank-
ing? If none enter “0”.
______ times in the past month
March 2016 45
Base: DOV_MOBILEBANK=1
SCRIPTER: SHOW ON THE SAME SCREEN AS Q30
Q31 [S]
When did you start using mobile banking?
1. In the last 6 months
2. 6 to 12 months ago
3. 1 to 2 years ago
4. More than 2 years ago
5. I don’t remember
Base: DOV_MOBILEBANK=1
Q32 [S]
What was the main reason why you started using mobile banking when you did?
1. I got a smartphone
2. My bank started offering the service
3. There is no bank branch or ATM near my home or work
4. I became comfortable with the security of mobile banking
5. I liked the convenience of mobile banking
6. To receive fraud alerts or check my account for fraudulent transactions
7. Other (Please specify):[TXT]_____________
D. Mobile Payments Users
Base: DOV_MOBILE=1
[DISPLAY; SHOW ON THE SAME SCREEN AS Q33]
Mobile payments are purchases, bill payments, charitable donations, payments to
another person, or any other payments made using a mobile phone. This includes
using your phone to pay for something in a store as well as payments made
through an app, a mobile web browser or a text message.
46 Consumers and Mobile Financial Services 2016
Base: DOV_MOBILE=1
Q33 [S] [MOBILE = “YES”]
Have you made a mobile payment in the past 12 months?
1. Yes → [MOBILEPAY = “YES”]
2. No → [MOBILEPAY = “NO”]
CREATE DOV: MOBILEPAY
1. “YES”
2. “NO”
Base: DOV_MOBILE=1
Q34 [GRID]
SCRIPTER: SHOW THIS TEXT INSTEAD OF DEFAULT INSTRUCTIONS: Please answer yes
or no to each option
Using your mobile phone, have you done each of the following in the past
12 months? Please include payments you made through your bank as well as
through other companies that are not your bank.
PROGRAMMING NOTE: CODE “Yes” AS 1, “No” AS 0, AND REFUSED AS -1.
Statement in rows:
1. Sent money to relatives or friends within the U.S. (e.g., Venmo, PayPal, Google
Wallet, your bank’s app)
2. Sent money to relatives or friends outside the U.S. (e.g., WesternUnion or
USPS SureMoney, your bank’s app)
3. Paid for something in a store using your mobile phone/app (e.g., Starbucks,
Apple Pay) instead of cash or a physical payment card
4. Paid for parking, a taxi, car service (e.g., Uber), or public transit
5. Paid a bill using your mobile phone’s web browser or an app
6. Purchased a physical item or digital content remotely by using your mobile
phone’s web browser or an app
7. Made a donation or other payment using a text message
Answer in columns:
1. Yes
2. No
March 2016 47
Base: DOV_MOBILEPAY=1
SCRIPTER: SHOW Q35 AND Q36 ON THE SAME SCREEN
Q35 [Q; RANGE: 0-99]
In the past month, about how many times have you used your mobile phone to
make any type of mobile payment? If none please enter “0”.
______times in the past month
Base: Q34C=1
Q36 [Q; RANGE: 0-99]
In the past month, about how many times have you used your mobile phone to pay
for a product or service at a store? If none please enter “0”.
______times in the past month
Base: Q34C=2
Q34a [S]
You indicated that you have not made a mobile payment in a store in the past
12 months. Do you plan to use your mobile phone to make a payment in a store in
the next 12 months?
1. Definitely will use
2. Probably will use
3. Probably will not use
4. Definitely will not use
Base: DOV_MOBILEPAY=1
Q37 [M]
When making mobile payments, which of the following payment methods do
you use?
1. Credit card
2. Debit card
3. Prepaid debit card
4. Bank account
5. Charge to your phone bill
6. Account at a non-financial institution (e.g., PayPal)
7. Other (Please specify):[TXT]_______________
48 Consumers and Mobile Financial Services 2016

Base: DOV_MOBILEPAY=1
SCRIPTER: SHOW ON THE SAME SCREEN AS Q39
Q38 [S]
When did you start using mobile payments?
1. In the last 6 months
2. 6 to 12 months ago
3. 1 to 2 years ago
4. More than 2 years ago
5. I don’t remember
Base: DOV_MOBILEPAY=1
SCRIPTER: SHOW ON THE SAME SCREEN AS Q38
Q39 [S]
What was the main reason why you started using mobile payments when you did?
1. I got a smartphone
2. The ability to make mobile payments became available
3. I became comfortable with the security of mobile payments
4. I liked the convenience of mobile payments
5. A store I visit started offering the service
6. To take advantage of loyalty or rewards points and discounts
7. Other (Please specify):[TXT]_____________
E. Non-Mobile Banking Users
Base: DOV_MOBILEBANK=2 AND Q25=1
[DISPLAY; SHOW ON SAME PAGE AS Q40]
We would like to ask you about some of your reasons for not using mobile
banking.
March 2016 49
Base: DOV_MOBILEBANK=2 AND Q25=1
Q40 [GRID]
SCRIPTER: SHOW THIS TEXT INSTEAD OF DEFAULT INSTRUCTIONS: Please answer yes
or no to each option
Please tell us if each of the reasons below are why you do not use mobile banking.
PROGRAMMING NOTE: CODE “Yes” AS 1, “No” AS 0, AND REFUSED AS -1.
Statements in rows:
1. I’m concerned about the security of mobile banking
2. My banking needs are being met without mobile banking
3. I don’t see any reason to use mobile banking
4. The mobile phone screen is too small
5. I don’t have a smartphone
6. My bank charges a fee for using mobile banking
7. I don’t do the banking in my household
8. I don’t trust the technology
9. It’s too difficult to use mobile banking
Answers in columns:
1. Yes
2. No
Base: DOV_MOBILEBANK=2 AND Q25=1
Q41 [M]
Assuming that the concerns that you have about using mobile banking were
addressed, would you be interested in doing any of the following activities with
your mobile phone?
1. Download your bank’s mobile banking app
2. Check an account balance or recent transactions
3. Make bill payments using your bank’s website or app
4. Receive alerts (e.g., text message, push notification or email) from your bank
5. Deposit a check electronically using a mobile phone camera
6. Transfer money between your bank accounts
7. Send money to relatives or friends within the U.S.
8. Send money to relatives or friends outside the U.S.
9. Locate the closest in-network ATM or branch
10. None, I don’t want to use mobile banking [Exclusive]
50 Consumers and Mobile Financial Services 2016
Base:Q25=2 OR Q25=3
Q42 [M]
You mentioned that your bank does not offer mobile banking or you are not sure
if you bank offers it. If your bank or credit union were to offer mobile banking,
would you be interested in doing any of the following activities with your mobile
phone?
1. Download your bank’s mobile banking app
2. Check an account balance or recent transactions
3. Make bill payments using your bank’s website or app
4. Receive alerts (e.g., text message, push notification or email) from your bank
5. Deposit a check electronically using a mobile phone camera
6. Transfer money between your accounts
7. Send money to relatives or friends within the U.S.
8. Send money to relatives or friends outside the U.S.
9. Locate the closest in-network ATM or branch
10. None, I don’t want to use mobile banking [Exclusive]
F. Non-Mobile Payments Users
Base: DOV_MOBILEPAY=2
[DISPLAY; shown on the same page as Q43]
We would like to ask you about some of your reasons for not using mobile
payments.
March 2016 51
Base: DOV_MOBILEPAY=2 AND DOV_MOBILE=1
Q43 [GRID]
SCRIPTER: SHOW THIS TEXT INSTEAD OF DEFAULT INSTRUCTIONS: Please answer yes
or no to each option
Please tell us if any of the reasons below are why you do not use mobile payments.
PROGRAMMING NOTE: CODE “Yes” AS 1, “No” AS 0, AND REFUSED AS -1.
Statements in rows:
1. I’m concerned about the security of mobile payments
2. It’s easier to pay with cash or a credit/debit card
3. I don’t see any benefit from using mobile payments
4. The places I shop don’t accept mobile payments
5. I don’t have the necessary feature on my phone
6. I don’t trust the technology
7. It’s difficult or time consuming to set up or use mobile payments
8. I don’t need to make any payments or someone else pays the bills
9. I don’t really understand all the different mobile payment options
Answers in columns:
1. Yes
2. No
52 Consumers and Mobile Financial Services 2016
Base: DOV_MOBILEPAY=2
Q44 [M]
Assuming that the reason(s) why you do not currently use mobile payments was
addressed, would you be interested in doing any of the following activities with
your mobile phone?
1. Sending money to relatives or friends within the U.S.
2. Sending money to relatives or friends outside the U.S.
3. Paying for something in a store using your mobile phone/app instead of cash
or a physical payment card
4. Paying for parking, a taxi, car service or public transit
5. Paying a bill using your mobile phone’s web browser or an app
6. Purchasing a physical item or digital content remotely by using your mobile
phone’s web browser or an app
7. Making a donation or other payment using a text message
8. None, I don’t want to use mobile payments [S]
G. Mobile Financial Services Security Questions
Base: DOV_MOBILE=1
[DISPLAY; SHOW ON THE SAME SCREEN WITH Q45 AND Q46]
Please rate your perception of the level of security for each of the following mobile
financial services from Very Safe to Very Unsafe.
Base: DOV_MOBILE=1
SCRIPTER: SHOW ON THE SAME SCREEN AS Q46
Q45 [S]
How safe do you believe people’s personal information is when they use mobile
banking?
1. Very safe
2. Somewhat safe
3. Somewhat unsafe
4. Very unsafe
5. Don’t know
March 2016 53
Base: DOV_MOBILE=1
SCRIPTER: SHOW ON THE SAME SCREEN AS Q45
Q46 [S]
How safe do you believe people’s personal information is when they use a mobile
phone to pay for a purchase at a store?
1. Very safe
2. Somewhat safe
3. Somewhat unsafe
4. Very unsafe
5. Don’t know
Base: DOV_MOBILE=1
Q47 [S]
Which one of the following security aspects would cause you the most concern
about using your mobile phone for financial transactions such as mobile banking
or paying for a purchase in a store?
1. My phone getting hacked or someone intercepting my data
2. Someone using my phone without permission to access my account
3. Losing my phone or having my phone stolen
4. Malware or viruses being installed on my phone
5. Companies misusing my personal information
6. Companies (merchants, banks, third parties) not providing sufficient security
to protect my mobile transactions
7. All of the above
8. Other (Please specify): [TXT][ADD SPACE]
9. No concerns/I think it is safe
54 Consumers and Mobile Financial Services 2016
Base: DOV_MOBILE=1
Q48 [GRID]
Do you already use, would like to use, or are unlikely to use your mobile phone for
each of the following purposes?
Statements in rows:
1. Track your finances, purchases or expenses
2. Organize, track and store gift cards, memberships, loyalty and reward points
3. Compare prices when shopping
4. Receive and manage discount offers and coupons
5. Receive offers and promotions based on your location
Answers in columns:
1. I already do
2. I would like to
3. I am unlikely to
Base: Q20=1
[DISPLAY; SHOW ON THE SAME SCREEN AS Q49 and Q50]
For the following two questions please rate how much you agree or disagree with
the statement on a scale from strongly agree to strongly disagree.
Base: Q20=1
SCRIPTER: SHOW ON THE SAME SCREEN AS Q50
Q49 [S]
I am willing to allow my mobile phone to provide my location to companies I shop
with regularly so that they can offer me discounts, promotions, or services based
on where I am.
1. Strongly agree
2. Agree
3. Disagree
4. Strongly disagree
March 2016 55
Base: Q20=1
SCRIPTER: SHOW ON THE SAME SCREEN AS Q49
Q50 [S]
I am willing to answer security questions or provide additional information to my
bank or credit union when I log into mobile banking so that my bank can enhance
the security of my mobile transaction.
1. Strongly agree
2. Agree
3. Disagree
4. Strongly disagree
H. Shopping Behavior Questions
Base: DOV_MOBILE=1 AND Q20=1
SCRIPTER: SHOW ON SAME SCREEN AS Q51
[DISPLAY]
In this section, we would like to ask you about your shopping habits.
Base: DOV_MOBILE=1 AND Q20=1
SCRIPTER: SHOW ON SAME SCREEN AS Q52
Q51 [S]
Have you ever used your mobile phone to comparison shop over the internet while
at a retail store?
1. Yes
2. No
Base: DOV_MOBILE=1 AND Q20=1
SCRIPTER: SHOW ON SAME SCREEN AS Q51
Q52 [S]
Have you ever used a barcode scanning app on your mobile phone while shopping
at a retail store to find the best price for an item?
1. Yes
2. No
56 Consumers and Mobile Financial Services 2016
Base: Q51=1 OR Q52=1
Q53 [S]
Has using your mobile phone to compare prices while you were shopping at a
retail store ever changed where you made your purchase?
1. Yes
2. No
Base: DOV_MOBILE=1 AND Q20=1
SCRIPTER: SHOWN ON THE SAME SCREEN AS Q55
Q54 [S]
Have you ever scanned a QR code (similar to a barcode) in a retail store, newspa-
per, magazine, or billboard advertisement to obtain information about a product
on your mobile phone?
1. Yes
2. No
Base: DOV_MOBILE=1 AND Q20=1
SCRIPTER: SHOWN ON THE SAME SCREEN AS Q54
Q55 [S]
Have you ever used your mobile phone to browse product reviews or get product
information while shopping at a retail store? This could be done by, for example,
googling the product on your mobile browser or scanning a QR code.
1. Yes
2. No
Base: Q55=1
Q56 [S]
Has reading product reviews on your mobile phone while shopping at a retail store
ever changed which item you ended up purchasing?
1. Yes
2. No
March 2016 57
Base: DOV_MOBILEBANK=1 AND Q20=1
Q57 [S]
In the past 12 months, have you used your mobile phone to check your account
balance or available credit before making a large purchase?
1. Yes
2. No
Base: Q57=1
Q58 [S]
Thinking of the most recent time that you checked your account balance or avail-
able credit before making a large purchase, did you decide not to buy that particu-
lar item because of the amount of money left in your account or the amount of
your available credit?
1. Yes
2. No
I. Financial Management (Saving, Budgeting) Questions
Base: Q28C=1
Q59 [M]
You previously mentioned that you receive text message, push notification or email
alerts from your financial institution. Do you receive each of the following kinds
of alerts?
1. Low balance
2. Payment due
3. Saving reminders
4. Fraud
5. Credit card balance
6. Deposit or withdrawal
7. Statement available notification
8. Other (Please specify):[TXT]___________________________
58 Consumers and Mobile Financial Services 2016
Base: Q59=1
Q60 [M]
Thinking of the most recent low-balance alert you received, which of the following
actions did you take after receiving the alert?
1. Transferred money into the account with the low balance from another
account
2. Deposited money into the account with the low balance
3. Reduced my spending
4. None of the above [S]
III. STANDARD SCREENED OUT TEXT FOR PANEL SAMPLE
<INSERT STANDARD CLOSE>
END OF QUESTIONNAIRE
March 2016 59

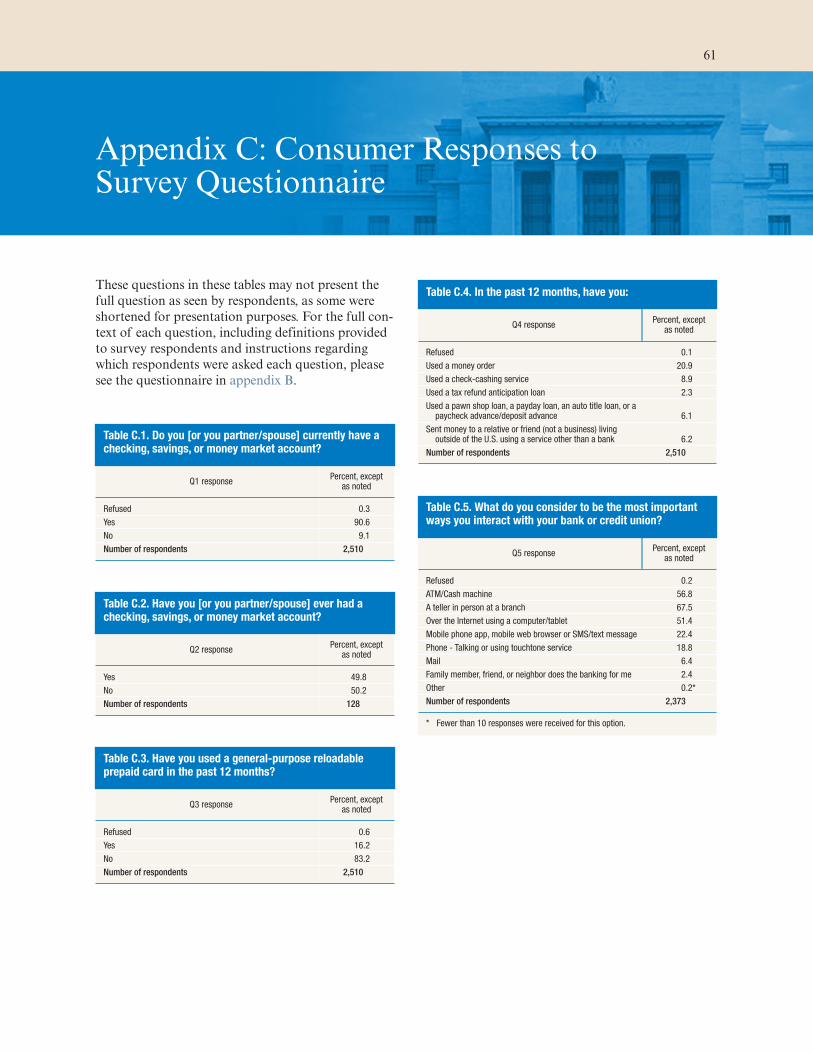
Appendix C: Consumer Responses to Survey Questionnaire
These questions in these tables may not present the
full question as seen by respondents, as some were
shortened for presentation purposes. For the full con-
text of each question, including definitions provided
to survey respondents and instructions regarding
which respondents were asked each question, please
see the questionnaire in appendix B.
Table C.1. Do you [or you partner/spouse] currently have a checking, savings, or money market account?
Q1 response Percent, except
as noted
Refused 0.3
Yes 90.6
No 9.1
Number of respondents 2,510
Table C.2. Have you [or you partner/spouse] ever had a checking, savings, or money market account?
Q2 response Percent, except
as noted
Yes 49.8
No 50.2
Number of respondents 128
Table C.3. Have you used a general-purpose reloadable prepaid card in the past 12 months?
Q3 response Percent, except
as noted
Refused 0.6
Yes 16.2
No 83.2
Number of respondents 2,510
Table C.4. In the past 12 months, have you:
Q4 response Percent, except
as noted
Refused 0.1
Used a money order 20.9
Used a check-cashing service 8.9
Used a tax refund anticipation loan 2.3
Used a pawn shop loan, a payday loan, an auto title loan, or a paycheck advance/deposit advance 6.1
Sent money to a relative or friend (not a business) living outside of the U.S. using a service other than a bank 6.2
Number of respondents 2,510
Table C.5. What do you consider to be the most important ways you interact with your bank or credit union?
Q5 response Percent, except
as noted
Refused 0.2
ATM/Cash machine 56.8
A teller in person at a branch 67.5
Over the Internet using a computer/tablet 51.4
Mobile phone app, mobile web browser or SMS/text message 22.4
Phone - Talking or using touchtone service 18.8
Mail 6.4
Family member, friend, or neighbor does the banking for me 2.4
Other 0.2*
Number of respondents 2,373
* Fewer than 10 responses were received for this option.
61
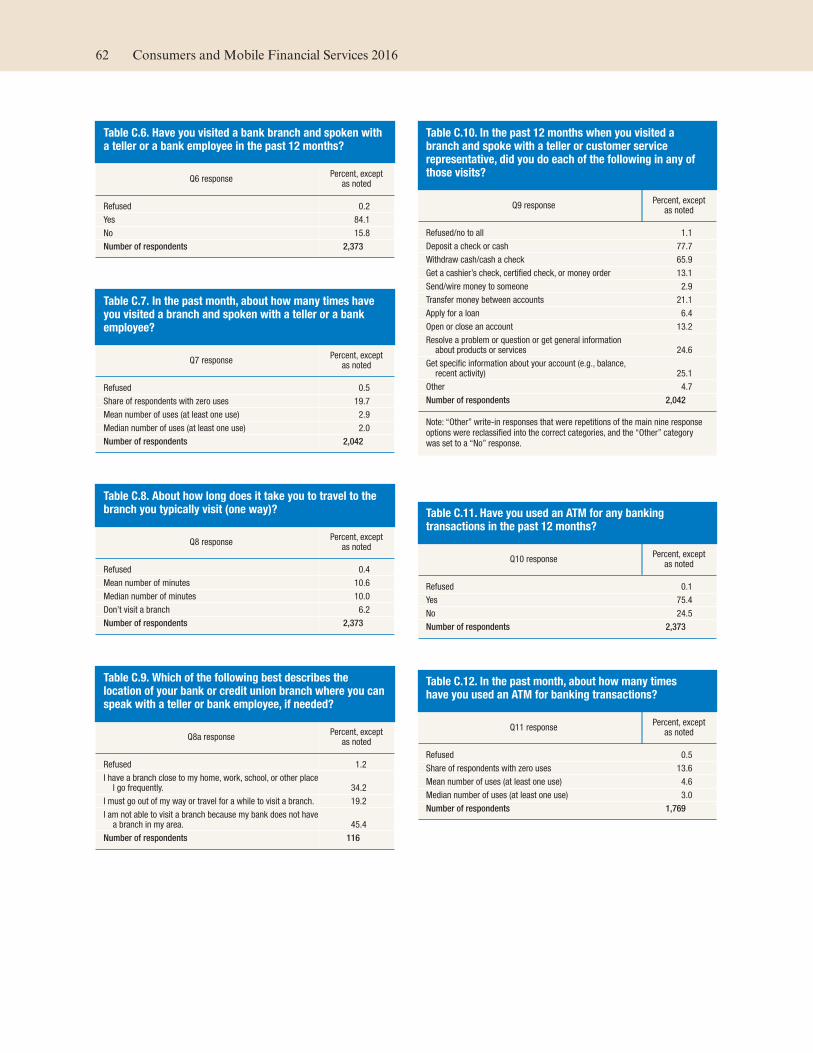
Table C.6. Have you visited a bank branch and spoken with a teller or a bank employee in the past 12 months?
Q6 response Percent, except
as noted
Refused 0.2
Yes 84.1
No 15.8
Number of respondents 2,373
Table C.7. In the past month, about how many times have you visited a branch and spoken with a teller or a bank employee?
Q7 response Percent, except
as noted
Refused 0.5
Share of respondents with zero uses 19.7
Mean number of uses (at least one use) 2.9
Median number of uses (at least one use) 2.0
Number of respondents 2,042
Table C.8. About how long does it take you to travel to the branch you typically visit (one way)?
Q8 response Percent, except
as noted
Refused 0.4
Mean number of minutes 10.6
Median number of minutes 10.0
Don’t visit a branch 6.2
Number of respondents 2,373
Table C.9. Which of the following best describes the location of your bank or credit union branch where you can speak with a teller or bank employee, if needed?
Q8a response Percent, except
as noted
Refused 1.2
I have a branch close to my home, work, school, or other place I go frequently. 34.2
I must go out of my way or travel for a while to visit a branch. 19.2
I am not able to visit a branch because my bank does not have a branch in my area. 45.4
Number of respondents 116
Table C.10. In the past 12 months when you visited a branch and spoke with a teller or customer service representative, did you do each of the following in any of those visits?
Q9 response Percent, except
as noted
Refused/no to all 1.1
Deposit a check or cash 77.7
Withdraw cash/cash a check 65.9
Get a cashier’s check, certified check, or money order 13.1
Send/wire money to someone 2.9
Transfer money between accounts 21.1
Apply for a loan 6.4
Open or close an account 13.2
Resolve a problem or question or get general information about products or services 24.6
Get specific information about your account (e.g., balance, recent activity) 25.1
Other 4.7
Number of respondents 2,042
Note: “Other” write-in responses that were repetitions of the main nine response options were reclassified into the correct categories, and the “Other” category was set to a “No” response.
Table C.11. Have you used an ATM for any banking transactions in the past 12 months?
Q10 response Percent, except
as noted
Refused 0.1
Yes 75.4
No 24.5
Number of respondents 2,373
Table C.12. In the past month, about how many times have you used an ATM for banking transactions?
Q11 response Percent, except
as noted
Refused 0.5
Share of respondents with zero uses 13.6
Mean number of uses (at least one use) 4.6
Median number of uses (at least one use) 3.0
Number of respondents 1,769
62 Consumers and Mobile Financial Services 2016
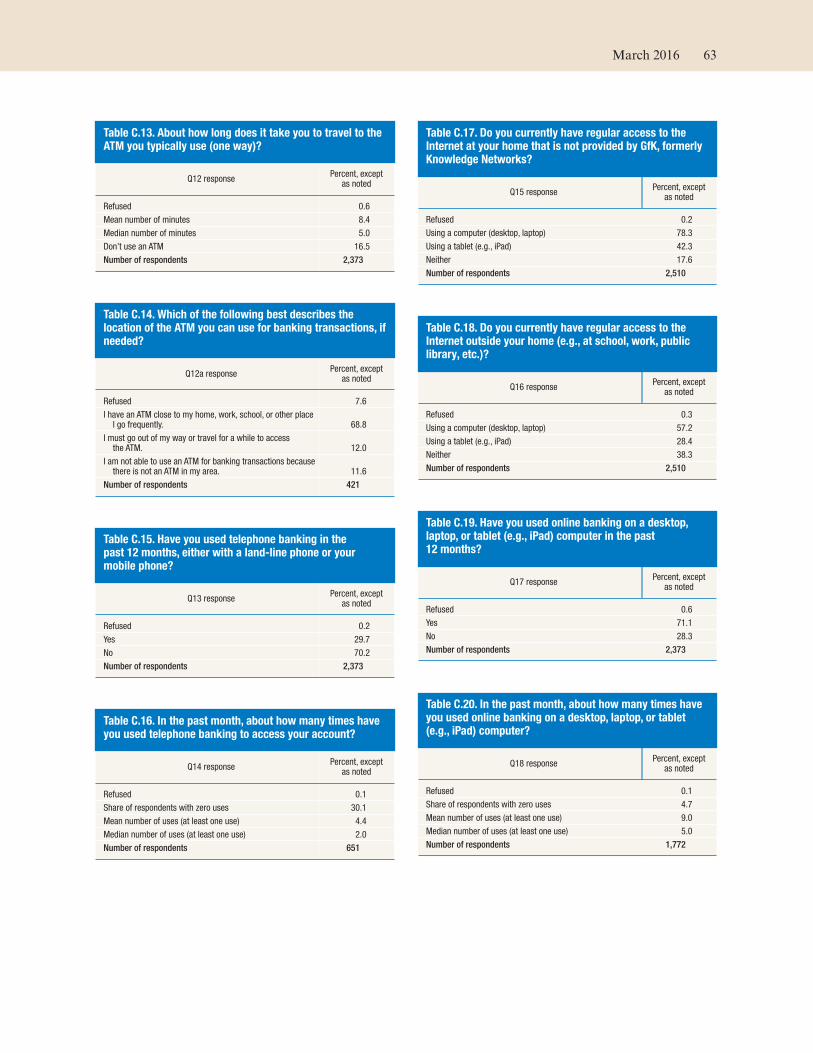
Table C.13. About how long does it take you to travel to the ATM you typically use (one way)?
Q12 response Percent, except
as noted
Refused 0.6
Mean number of minutes 8.4
Median number of minutes 5.0
Don’t use an ATM 16.5
Number of respondents 2,373
Table C.14. Which of the following best describes the location of the ATM you can use for banking transactions, if needed?
Q12a response Percent, except
as noted
Refused 7.6
I have an ATM close to my home, work, school, or other place I go frequently. 68.8
I must go out of my way or travel for a while to access the ATM. 12.0
I am not able to use an ATM for banking transactions because there is not an ATM in my area. 11.6
Number of respondents 421
Table C.15. Have you used telephone banking in the past 12 months, either with a land-line phone or your mobile phone?
Q13 response Percent, except
as noted
Refused 0.2
Yes 29.7
No 70.2
Number of respondents 2,373
Table C.16. In the past month, about how many times have you used telephone banking to access your account?
Q14 response Percent, except
as noted
Refused 0.1
Share of respondents with zero uses 30.1
Mean number of uses (at least one use) 4.4
Median number of uses (at least one use) 2.0
Number of respondents 651
Table C.17. Do you currently have regular access to the Internet at your home that is not provided by GfK, formerly Knowledge Networks?
Q15 response Percent, except
as noted
Refused 0.2
Using a computer (desktop, laptop) 78.3
Using a tablet (e.g., iPad) 42.3
Neither 17.6
Number of respondents 2,510
Table C.18. Do you currently have regular access to the Internet outside your home (e.g., at school, work, public library, etc.)?
Q16 response Percent, except
as noted
Refused 0.3
Using a computer (desktop, laptop) 57.2
Using a tablet (e.g., iPad) 28.4
Neither 38.3
Number of respondents 2,510
Table C.19. Have you used online banking on a desktop, laptop, or tablet (e.g., iPad) computer in the past 12 months?
Q17 response Percent, except
as noted
Refused 0.6
Yes 71.1
No 28.3
Number of respondents 2,373
Table C.20. In the past month, about how many times have you used online banking on a desktop, laptop, or tablet (e.g., iPad) computer?
Q18 response Percent, except
as noted
Refused 0.1
Share of respondents with zero uses 4.7
Mean number of uses (at least one use) 9.0
Median number of uses (at least one use) 5.0
Number of respondents 1,772
March 2016 63
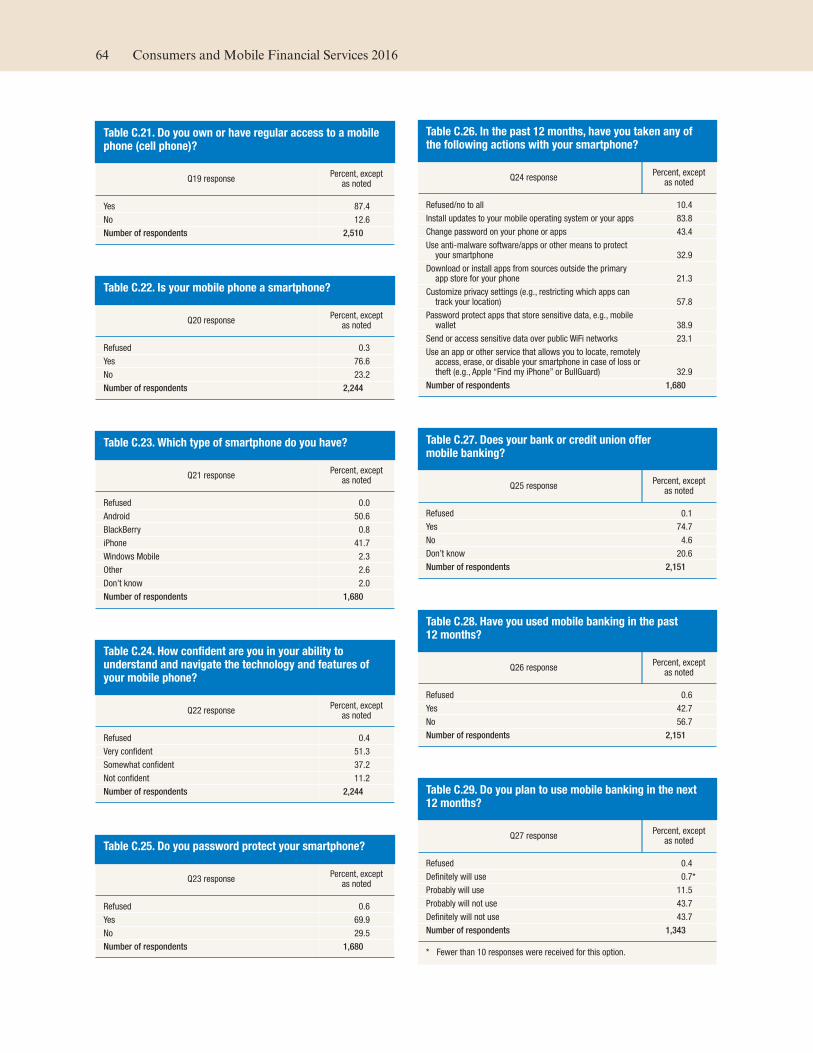
Table C.21. Do you own or have regular access to a mobile phone (cell phone)?
Q19 response Percent, except
as noted
Yes 87.4
No 12.6
Number of respondents 2,510
Table C.22. Is your mobile phone a smartphone?
Q20 response Percent, except
as noted
Refused 0.3
Yes 76.6
No 23.2
Number of respondents 2,244
Table C.23. Which type of smartphone do you have?
Q21 response Percent, except
as noted
Refused 0.0
Android 50.6
BlackBerry 0.8
iPhone 41.7
Windows Mobile 2.3
Other 2.6
Don’t know 2.0
Number of respondents 1,680
Table C.24. How confident are you in your ability to understand and navigate the technology and features of your mobile phone?
Q22 response Percent, except
as noted
Refused 0.4
Very confident 51.3
Somewhat confident 37.2
Not confident 11.2
Number of respondents 2,244
Table C.25. Do you password protect your smartphone?
Q23 response Percent, except
as noted
Refused 0.6
Yes 69.9
No 29.5
Number of respondents 1,680
Table C.26. In the past 12 months, have you taken any of the following actions with your smartphone?
Q24 response Percent, except
as noted
Refused/no to all 10.4
Install updates to your mobile operating system or your apps 83.8
Change password on your phone or apps 43.4
Use anti-malware software/apps or other means to protect your smartphone 32.9
Download or install apps from sources outside the primary app store for your phone 21.3
Customize privacy settings (e.g., restricting which apps can track your location) 57.8
Password protect apps that store sensitive data, e.g., mobile wallet 38.9
Send or access sensitive data over public WiFi networks 23.1
Use an app or other service that allows you to locate, remotely access, erase, or disable your smartphone in case of loss or theft (e.g., Apple “Find my iPhone” or BullGuard) 32.9
Number of respondents 1,680
Table C.27. Does your bank or credit union offer mobile banking?
Q25 response Percent, except
as noted
Refused 0.1
Yes 74.7
No 4.6
Don’t know 20.6
Number of respondents 2,151
Table C.28. Have you used mobile banking in the past 12 months?
Q26 response Percent, except
as noted
Refused 0.6
Yes 42.7
No 56.7
Number of respondents 2,151
Table C.29. Do you plan to use mobile banking in the next 12 months?
Q27 response Percent, except
as noted
Refused 0.4
Definitely will use 0.7*
Probably will use 11.5
Probably will not use 43.7
Definitely will not use 43.7
Number of respondents 1,343
* Fewer than 10 responses were received for this option.
64 Consumers and Mobile Financial Services 2016
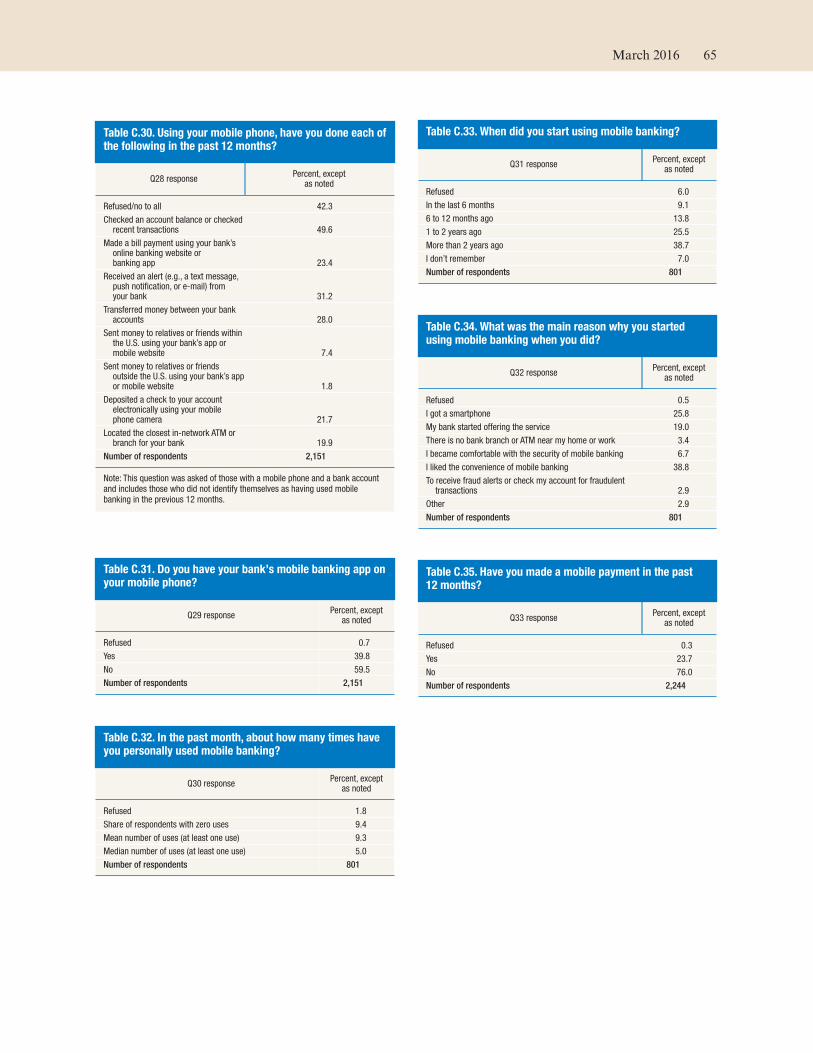
Table C.30. Using your mobile phone, have you done each of the following in the past 12 months?
Q28 response Percent, except
as noted
Refused/no to all 42.3
Checked an account balance or checked recent transactions 49.6
Made a bill payment using your bank’s online banking website or banking app 23.4
Received an alert (e.g., a text message, push notification, or e-mail) from your bank 31.2
Transferred money between your bank accounts 28.0
Sent money to relatives or friends within the U.S. using your bank’s app or mobile website 7.4
Sent money to relatives or friends outside the U.S. using your bank’s app or mobile website 1.8
Deposited a check to your account electronically using your mobile phone camera 21.7
Located the closest in-network ATM or branch for your bank 19.9
Number of respondents 2,151
Note: This question was asked of those with a mobile phone and a bank account and includes those who did not identify themselves as having used mobile banking in the previous 12 months.
Table C.31. Do you have your bank’s mobile banking app on your mobile phone?
Q29 response Percent, except
as noted
Refused 0.7
Yes 39.8
No 59.5
Number of respondents 2,151
Table C.32. In the past month, about how many times have you personally used mobile banking?
Q30 response Percent, except
as noted
Refused 1.8
Share of respondents with zero uses 9.4
Mean number of uses (at least one use) 9.3
Median number of uses (at least one use) 5.0
Number of respondents 801
Table C.33. When did you start using mobile banking?
Q31 response Percent, except
as noted
Refused 6.0
In the last 6 months 9.1
6 to 12 months ago 13.8
1 to 2 years ago 25.5
More than 2 years ago 38.7
I don’t remember 7.0
Number of respondents 801
Table C.34. What was the main reason why you started using mobile banking when you did?
Q32 response Percent, except
as noted
Refused 0.5
I got a smartphone 25.8
My bank started offering the service 19.0
There is no bank branch or ATM near my home or work 3.4
I became comfortable with the security of mobile banking 6.7
I liked the convenience of mobile banking 38.8
To receive fraud alerts or check my account for fraudulent transactions 2.9
Other 2.9
Number of respondents 801
Table C.35. Have you made a mobile payment in the past 12 months?
Q33 response Percent, except
as noted
Refused 0.3
Yes 23.7
No 76.0
Number of respondents 2,244
March 2016 65
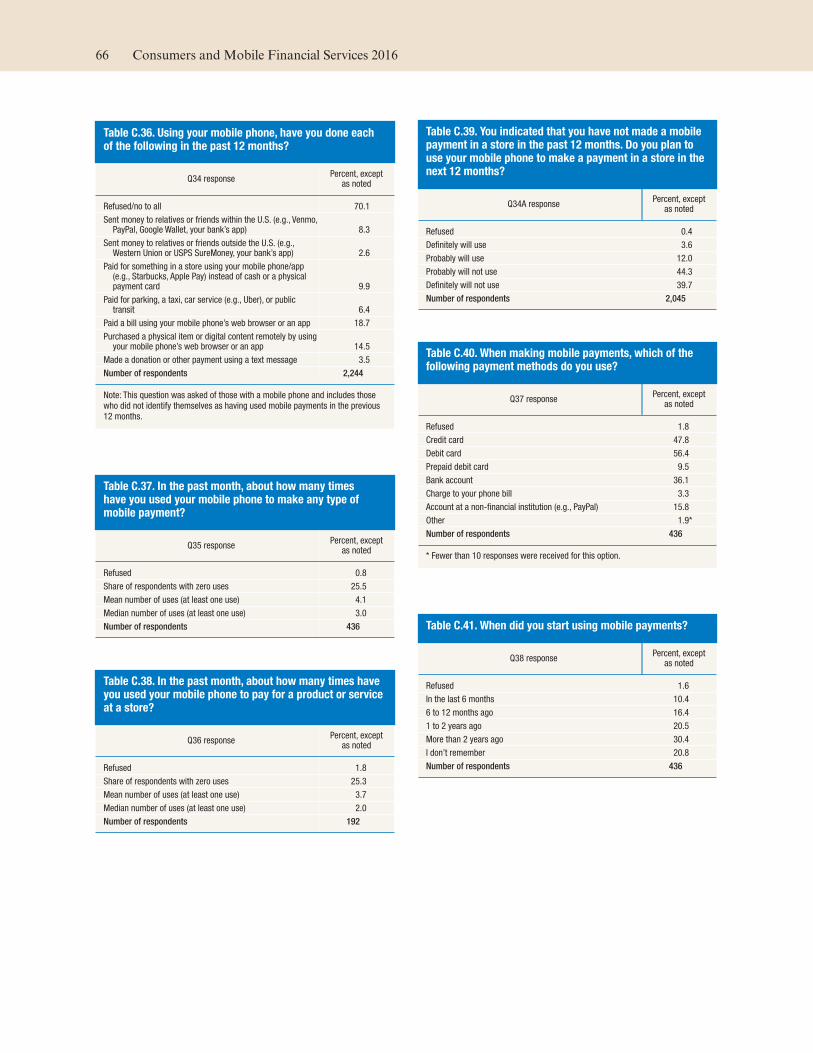
Table C.36. Using your mobile phone, have you done each of the following in the past 12 months?
Q34 response Percent, except
as noted
Refused/no to all 70.1
Sent money to relatives or friends within the U.S. (e.g., Venmo, PayPal, Google Wallet, your bank’s app) 8.3
Sent money to relatives or friends outside the U.S. (e.g., Western Union or USPS SureMoney, your bank’s app) 2.6
Paid for something in a store using your mobile phone/app (e.g., Starbucks, Apple Pay) instead of cash or a physical payment card 9.9
Paid for parking, a taxi, car service (e.g., Uber), or public transit 6.4
Paid a bill using your mobile phone’s web browser or an app 18.7
Purchased a physical item or digital content remotely by using your mobile phone’s web browser or an app 14.5
Made a donation or other payment using a text message 3.5
Number of respondents 2,244
Note: This question was asked of those with a mobile phone and includes those who did not identify themselves as having used mobile payments in the previous 12 months.
Table C.37. In the past month, about how many times have you used your mobile phone to make any type of mobile payment?
Q35 response Percent, except
as noted
Refused 0.8
Share of respondents with zero uses 25.5
Mean number of uses (at least one use) 4.1
Median number of uses (at least one use) 3.0
Number of respondents 436
Table C.38. In the past month, about how many times have you used your mobile phone to pay for a product or service at a store?
Q36 response Percent, except
as noted
Refused 1.8
Share of respondents with zero uses 25.3
Mean number of uses (at least one use) 3.7
Median number of uses (at least one use) 2.0
Number of respondents 192
Table C.39. You indicated that you have not made a mobile payment in a store in the past 12 months. Do you plan to use your mobile phone to make a payment in a store in the next 12 months?
Q34A response Percent, except
as noted
Refused 0.4
Definitely will use 3.6
Probably will use 12.0
Probably will not use 44.3
Definitely will not use 39.7
Number of respondents 2,045
Table C.40. When making mobile payments, which of the following payment methods do you use?
Q37 response Percent, except
as noted
Refused 1.8
Credit card 47.8
Debit card 56.4
Prepaid debit card 9.5
Bank account 36.1
Charge to your phone bill 3.3
Account at a non-financial institution (e.g., PayPal) 15.8
Other 1.9*
Number of respondents 436
* Fewer than 10 responses were received for this option.
Table C.41. When did you start using mobile payments?
Q38 response Percent, except
as noted
Refused 1.6
In the last 6 months 10.4
6 to 12 months ago 16.4
1 to 2 years ago 20.5
More than 2 years ago 30.4
I don’t remember 20.8
Number of respondents 436
66 Consumers and Mobile Financial Services 2016
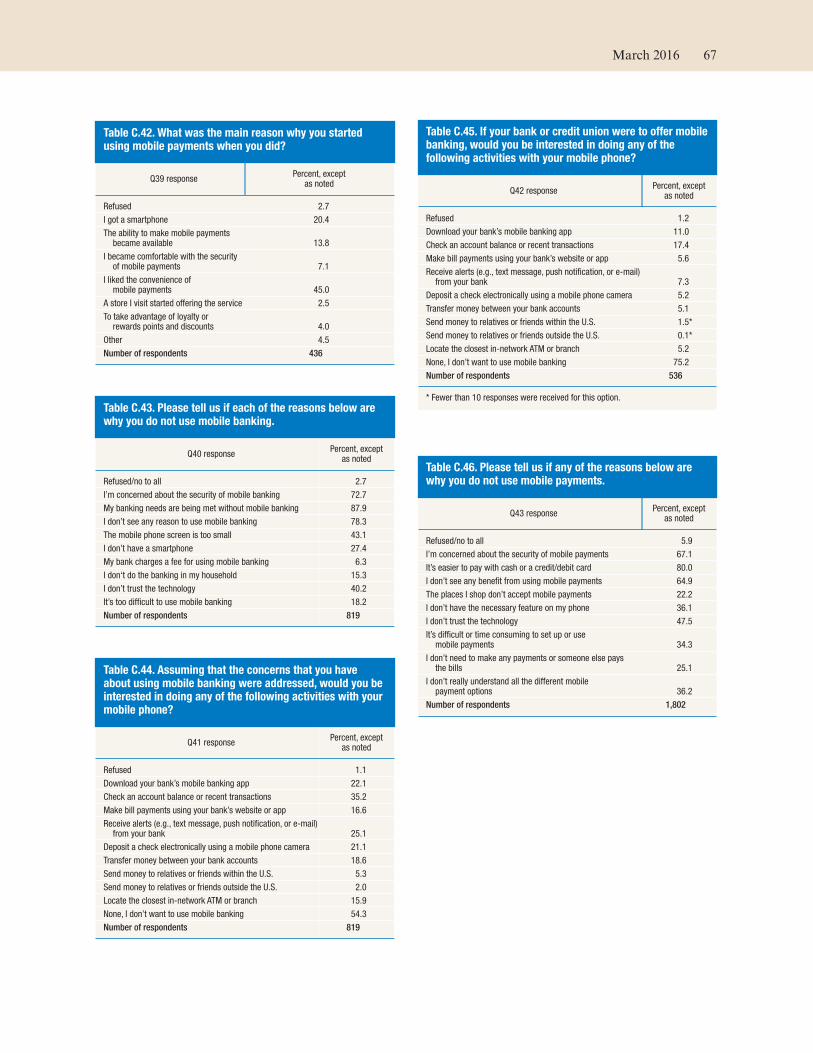
Table C.42. What was the main reason why you started using mobile payments when you did?
Q39 response Percent, except
as noted
Refused 2.7
I got a smartphone 20.4
The ability to make mobile payments became available 13.8
I became comfortable with the security of mobile payments 7.1
I liked the convenience of mobile payments 45.0
A store I visit started offering the service 2.5
To take advantage of loyalty or rewards points and discounts 4.0
Other 4.5
Number of respondents 436
Table C.43. Please tell us if each of the reasons below are why you do not use mobile banking.
Q40 response Percent, except
as noted
Refused/no to all 2.7
I’m concerned about the security of mobile banking 72.7
My banking needs are being met without mobile banking 87.9
I don’t see any reason to use mobile banking 78.3
The mobile phone screen is too small 43.1
I don’t have a smartphone 27.4
My bank charges a fee for using mobile banking 6.3
I don‘t do the banking in my household 15.3
I don’t trust the technology 40.2
It’s too difficult to use mobile banking 18.2
Number of respondents 819
Table C.44. Assuming that the concerns that you have about using mobile banking were addressed, would you be interested in doing any of the following activities with your mobile phone?
Q41 response Percent, except
as noted
Refused 1.1
Download your bank’s mobile banking app 22.1
Check an account balance or recent transactions 35.2
Make bill payments using your bank’s website or app 16.6
Receive alerts (e.g., text message, push notification, or e-mail) from your bank 25.1
Deposit a check electronically using a mobile phone camera 21.1
Transfer money between your bank accounts 18.6
Send money to relatives or friends within the U.S. 5.3
Send money to relatives or friends outside the U.S. 2.0
Locate the closest in-network ATM or branch 15.9
None, I don’t want to use mobile banking 54.3
Number of respondents 819
Table C.45. If your bank or credit union were to offer mobile banking, would you be interested in doing any of the following activities with your mobile phone?
Q42 response Percent, except
as noted
Refused 1.2
Download your bank’s mobile banking app 11.0
Check an account balance or recent transactions 17.4
Make bill payments using your bank’s website or app 5.6
Receive alerts (e.g., text message, push notification, or e-mail) from your bank 7.3
Deposit a check electronically using a mobile phone camera 5.2
Transfer money between your bank accounts 5.1
Send money to relatives or friends within the U.S. 1.5*
Send money to relatives or friends outside the U.S. 0.1*
Locate the closest in-network ATM or branch 5.2
None, I don’t want to use mobile banking 75.2
Number of respondents 536
* Fewer than 10 responses were received for this option.
Table C.46. Please tell us if any of the reasons below are why you do not use mobile payments.
Q43 response Percent, except
as noted
Refused/no to all 5.9
I’m concerned about the security of mobile payments 67.1
It’s easier to pay with cash or a credit/debit card 80.0
I don’t see any benefit from using mobile payments 64.9
The places I shop don’t accept mobile payments 22.2
I don’t have the necessary feature on my phone 36.1
I don’t trust the technology 47.5
It’s difficult or time consuming to set up or use mobile payments 34.3
I don’t need to make any payments or someone else pays the bills 25.1
I don’t really understand all the different mobile payment options 36.2
Number of respondents 1,802
March 2016 67
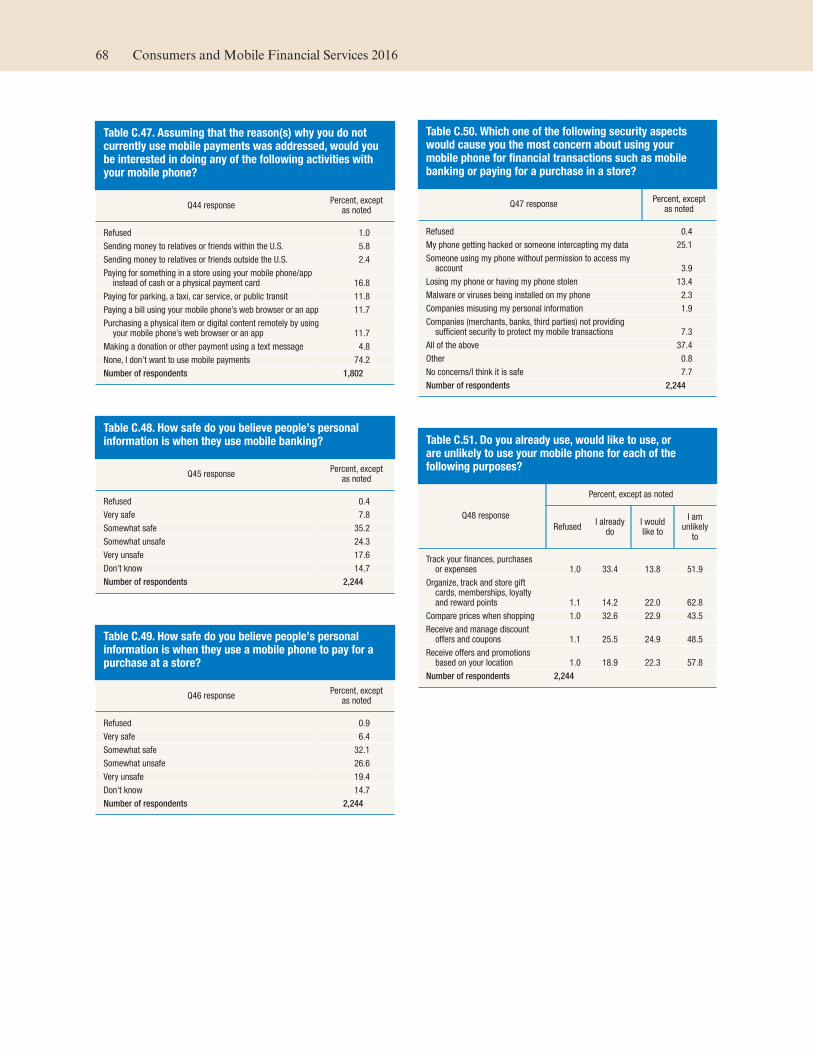
Table C.47. Assuming that the reason(s) why you do not currently use mobile payments was addressed, would you be interested in doing any of the following activities with your mobile phone?
Q44 response Percent, except
as noted
Refused 1.0
Sending money to relatives or friends within the U.S. 5.8
Sending money to relatives or friends outside the U.S. 2.4
Paying for something in a store using your mobile phone/app instead of cash or a physical payment card 16.8
Paying for parking, a taxi, car service, or public transit 11.8
Paying a bill using your mobile phone’s web browser or an app 11.7
Purchasing a physical item or digital content remotely by using your mobile phone’s web browser or an app 11.7
Making a donation or other payment using a text message 4.8
None, I don’t want to use mobile payments 74.2
Number of respondents 1,802
Table C.48. How safe do you believe people’s personal information is when they use mobile banking?
Q45 response Percent, except
as noted
Refused 0.4
Very safe 7.8
Somewhat safe 35.2
Somewhat unsafe 24.3
Very unsafe 17.6
Don’t know 14.7
Number of respondents 2,244
Table C.49. How safe do you believe people’s personal information is when they use a mobile phone to pay for a purchase at a store?
Q46 response Percent, except
as noted
Refused 0.9
Very safe 6.4
Somewhat safe 32.1
Somewhat unsafe 26.6
Very unsafe 19.4
Don’t know 14.7
Number of respondents 2,244
Table C.50. Which one of the following security aspects would cause you the most concern about using your mobile phone for financial transactions such as mobile banking or paying for a purchase in a store?
Q47 response Percent, except
as noted
Refused 0.4
My phone getting hacked or someone intercepting my data 25.1
Someone using my phone without permission to access my account 3.9
Losing my phone or having my phone stolen 13.4
Malware or viruses being installed on my phone 2.3
Companies misusing my personal information 1.9
Companies (merchants, banks, third parties) not providing sufficient security to protect my mobile transactions 7.3
All of the above 37.4
Other 0.8
No concerns/I think it is safe 7.7
Number of respondents 2,244
Table C.51. Do you already use, would like to use, or are unlikely to use your mobile phone for each of the following purposes?
Q48 response
Percent, except as noted
Refused I already
do I would like to
I am unlikely
to
Track your finances, purchases or expenses 1.0 33.4 13.8 51.9
Organize, track and store gift cards, memberships, loyalty and reward points 1.1 14.2 22.0 62.8
Compare prices when shopping 1.0 32.6 22.9 43.5
Receive and manage discount offers and coupons 1.1 25.5 24.9 48.5
Receive offers and promotions based on your location 1.0 18.9 22.3 57.8
Number of respondents 2,244
68 Consumers and Mobile Financial Services 2016
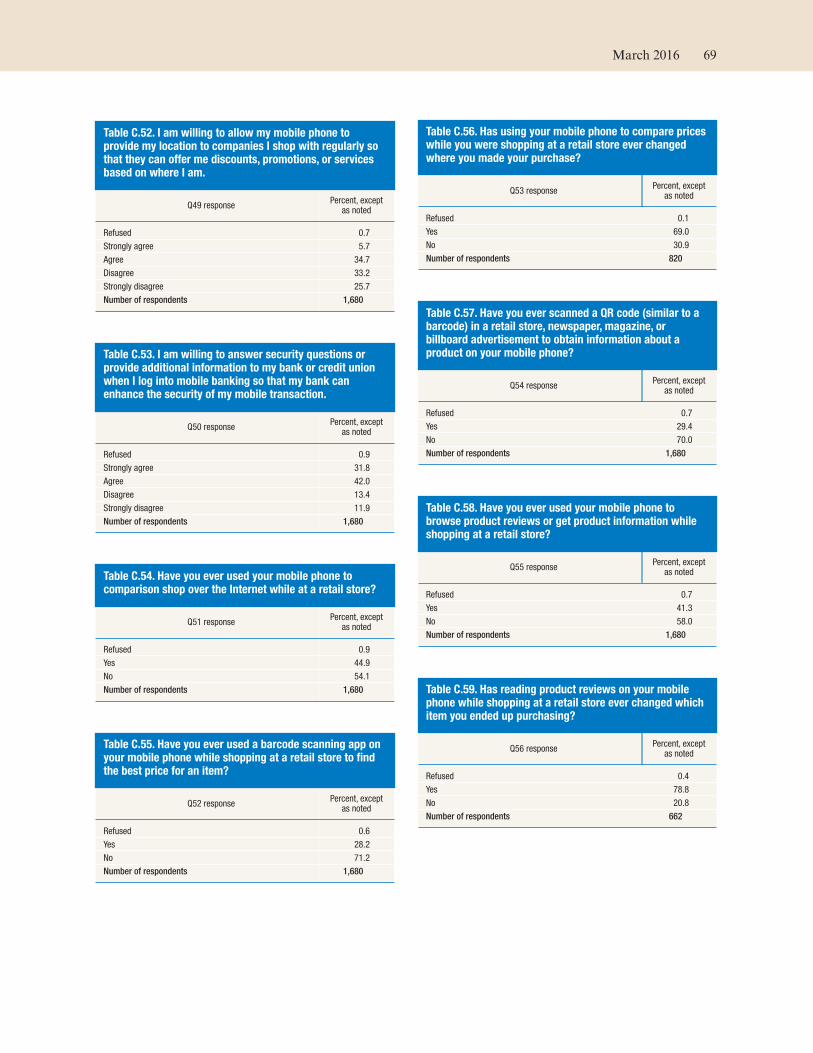
Table C.52. I am willing to allow my mobile phone to provide my location to companies I shop with regularly so that they can offer me discounts, promotions, or services based on where I am.
Q49 response Percent, except
as noted
Refused 0.7
Strongly agree 5.7
Agree 34.7
Disagree 33.2
Strongly disagree 25.7
Number of respondents 1,680
Table C.53. I am willing to answer security questions or provide additional information to my bank or credit union when I log into mobile banking so that my bank can enhance the security of my mobile transaction.
Q50 response Percent, except
as noted
Refused 0.9
Strongly agree 31.8
Agree 42.0
Disagree 13.4
Strongly disagree 11.9
Number of respondents 1,680
Table C.54. Have you ever used your mobile phone to comparison shop over the Internet while at a retail store?
Q51 response Percent, except
as noted
Refused 0.9
Yes 44.9
No 54.1
Number of respondents 1,680
Table C.55. Have you ever used a barcode scanning app on your mobile phone while shopping at a retail store to find the best price for an item?
Q52 response Percent, except
as noted
Refused 0.6
Yes 28.2
No 71.2
Number of respondents 1,680
Table C.56. Has using your mobile phone to compare prices while you were shopping at a retail store ever changed where you made your purchase?
Q53 response Percent, except
as noted
Refused 0.1
Yes 69.0
No 30.9
Number of respondents 820
Table C.57. Have you ever scanned a QR code (similar to a barcode) in a retail store, newspaper, magazine, or billboard advertisement to obtain information about a product on your mobile phone?
Q54 response Percent, except
as noted
Refused 0.7
Yes 29.4
No 70.0
Number of respondents 1,680
Table C.58. Have you ever used your mobile phone to browse product reviews or get product information while shopping at a retail store?
Q55 response Percent, except
as noted
Refused 0.7
Yes 41.3
No 58.0
Number of respondents 1,680
Table C.59. Has reading product reviews on your mobile phone while shopping at a retail store ever changed which item you ended up purchasing?
Q56 response Percent, except
as noted
Refused 0.4
Yes 78.8
No 20.8
Number of respondents 662
March 2016 69
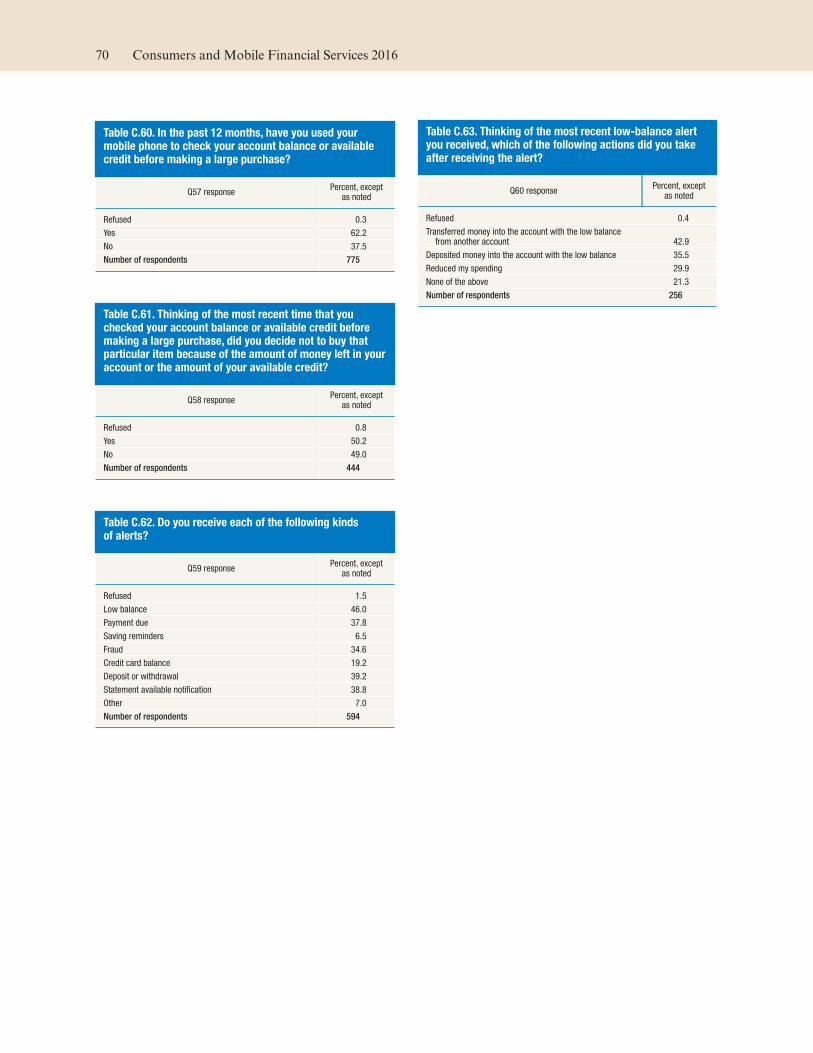
Table C.60. In the past 12 months, have you used your mobile phone to check your account balance or available credit before making a large purchase?
Q57 response Percent, except
as noted
Refused 0.3
Yes 62.2
No 37.5
Number of respondents 775
Table C.61. Thinking of the most recent time that you checked your account balance or available credit before making a large purchase, did you decide not to buy that particular item because of the amount of money left in your account or the amount of your available credit?
Q58 response Percent, except
as noted
Refused 0.8
Yes 50.2
No 49.0
Number of respondents 444
Table C.62. Do you receive each of the following kinds of alerts?
Q59 response Percent, except
as noted
Refused 1.5
Low balance 46.0
Payment due 37.8
Saving reminders 6.5
Fraud 34.6
Credit card balance 19.2
Deposit or withdrawal 39.2
Statement available notification 38.8
Other 7.0
Number of respondents 594
Table C.63. Thinking of the most recent low-balance alert you received, which of the following actions did you take after receiving the alert?
Q60 response Percent, except
as noted
Refused 0.4
Transferred money into the account with the low balance from another account 42.9
Deposited money into the account with the low balance 35.5
Reduced my spending 29.9
None of the above 21.3
Number of respondents 256
70 Consumers and Mobile Financial Services 2016
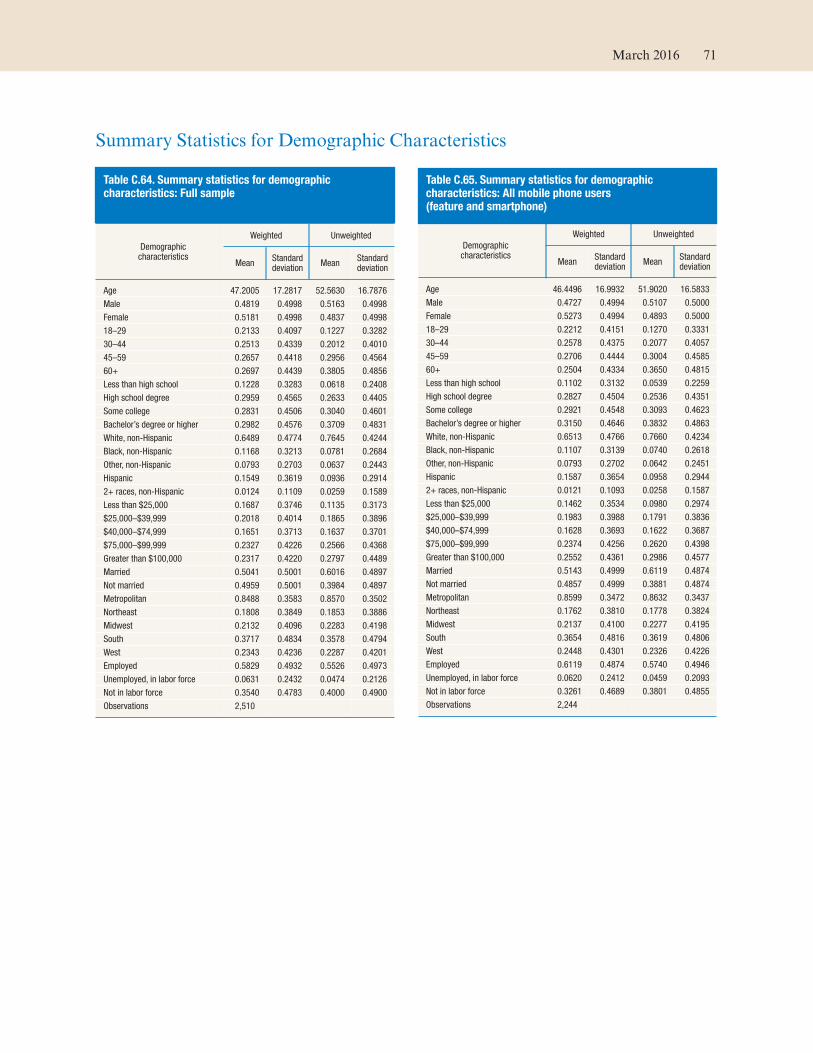
Summary Statistics for Demographic Characteristics
Table C.64. Summary statistics for demographic characteristics: Full sample
Demographic characteristics
Weighted Unweighted
Mean Standard deviation
Mean Standard deviation
Age 47.2005 17.2817 52.5630 16.7876
Male 0.4819 0.4998 0.5163 0.4998
Female 0.5181 0.4998 0.4837 0.4998
18–29 0.2133 0.4097 0.1227 0.3282
30–44 0.2513 0.4339 0.2012 0.4010
45–59 0.2657 0.4418 0.2956 0.4564
60+ 0.2697 0.4439 0.3805 0.4856
Less than high school 0.1228 0.3283 0.0618 0.2408
High school degree 0.2959 0.4565 0.2633 0.4405
Some college 0.2831 0.4506 0.3040 0.4601
Bachelor’s degree or higher 0.2982 0.4576 0.3709 0.4831
White, non-Hispanic 0.6489 0.4774 0.7645 0.4244
Black, non-Hispanic 0.1168 0.3213 0.0781 0.2684
Other, non-Hispanic 0.0793 0.2703 0.0637 0.2443
Hispanic 0.1549 0.3619 0.0936 0.2914
2+ races, non-Hispanic 0.0124 0.1109 0.0259 0.1589
Less than $25,000 0.1687 0.3746 0.1135 0.3173
$25,000–$39,999 0.2018 0.4014 0.1865 0.3896
$40,000–$74,999 0.1651 0.3713 0.1637 0.3701
$75,000–$99,999 0.2327 0.4226 0.2566 0.4368
Greater than $100,000 0.2317 0.4220 0.2797 0.4489
Married 0.5041 0.5001 0.6016 0.4897
Not married 0.4959 0.5001 0.3984 0.4897
Metropolitan 0.8488 0.3583 0.8570 0.3502
Northeast 0.1808 0.3849 0.1853 0.3886
Midwest 0.2132 0.4096 0.2283 0.4198
South 0.3717 0.4834 0.3578 0.4794
West 0.2343 0.4236 0.2287 0.4201
Employed 0.5829 0.4932 0.5526 0.4973
Unemployed, in labor force 0.0631 0.2432 0.0474 0.2126
Not in labor force 0.3540 0.4783 0.4000 0.4900
Observations 2,510
Table C.65. Summary statistics for demographic characteristics: All mobile phone users (feature and smartphone)
Demographic characteristics
Weighted Unweighted
Mean Standard deviation
Mean Standard deviation
Age 46.4496 16.9932 51.9020 16.5833
Male 0.4727 0.4994 0.5107 0.5000
Female 0.5273 0.4994 0.4893 0.5000
18–29 0.2212 0.4151 0.1270 0.3331
30–44 0.2578 0.4375 0.2077 0.4057
45–59 0.2706 0.4444 0.3004 0.4585
60+ 0.2504 0.4334 0.3650 0.4815
Less than high school 0.1102 0.3132 0.0539 0.2259
High school degree 0.2827 0.4504 0.2536 0.4351
Some college 0.2921 0.4548 0.3093 0.4623
Bachelor’s degree or higher 0.3150 0.4646 0.3832 0.4863
White, non-Hispanic 0.6513 0.4766 0.7660 0.4234
Black, non-Hispanic 0.1107 0.3139 0.0740 0.2618
Other, non-Hispanic 0.0793 0.2702 0.0642 0.2451
Hispanic 0.1587 0.3654 0.0958 0.2944
2+ races, non-Hispanic 0.0121 0.1093 0.0258 0.1587
Less than $25,000 0.1462 0.3534 0.0980 0.2974
$25,000–$39,999 0.1983 0.3988 0.1791 0.3836
$40,000–$74,999 0.1628 0.3693 0.1622 0.3687
$75,000–$99,999 0.2374 0.4256 0.2620 0.4398
Greater than $100,000 0.2552 0.4361 0.2986 0.4577
Married 0.5143 0.4999 0.6119 0.4874
Not married 0.4857 0.4999 0.3881 0.4874
Metropolitan 0.8599 0.3472 0.8632 0.3437
Northeast 0.1762 0.3810 0.1778 0.3824
Midwest 0.2137 0.4100 0.2277 0.4195
South 0.3654 0.4816 0.3619 0.4806
West 0.2448 0.4301 0.2326 0.4226
Employed 0.6119 0.4874 0.5740 0.4946
Unemployed, in labor force 0.0620 0.2412 0.0459 0.2093
Not in labor force 0.3261 0.4689 0.3801 0.4855
Observations 2,244
March 2016 71
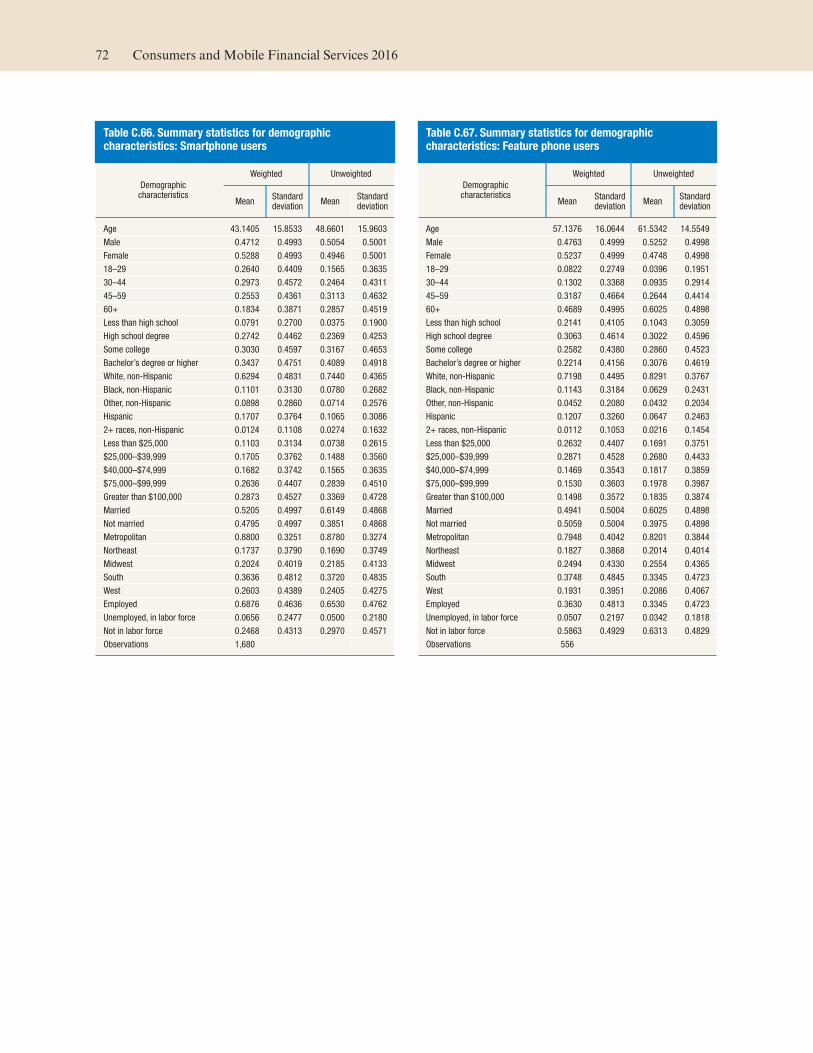
Table C.66. Summary statistics for demographic characteristics: Smartphone users
Demographic characteristics
Weighted Unweighted
Mean Standard deviation
Mean Standard deviation
Age 43.1405 15.8533 48.6601 15.9603
Male 0.4712 0.4993 0.5054 0.5001
Female 0.5288 0.4993 0.4946 0.5001
18–29 0.2640 0.4409 0.1565 0.3635
30–44 0.2973 0.4572 0.2464 0.4311
45–59 0.2553 0.4361 0.3113 0.4632
60+ 0.1834 0.3871 0.2857 0.4519
Less than high school 0.0791 0.2700 0.0375 0.1900
High school degree 0.2742 0.4462 0.2369 0.4253
Some college 0.3030 0.4597 0.3167 0.4653
Bachelor’s degree or higher 0.3437 0.4751 0.4089 0.4918
White, non-Hispanic 0.6294 0.4831 0.7440 0.4365
Black, non-Hispanic 0.1101 0.3130 0.0780 0.2682
Other, non-Hispanic 0.0898 0.2860 0.0714 0.2576
Hispanic 0.1707 0.3764 0.1065 0.3086
2+ races, non-Hispanic 0.0124 0.1108 0.0274 0.1632
Less than $25,000 0.1103 0.3134 0.0738 0.2615
$25,000–$39,999 0.1705 0.3762 0.1488 0.3560
$40,000–$74,999 0.1682 0.3742 0.1565 0.3635
$75,000–$99,999 0.2636 0.4407 0.2839 0.4510
Greater than $100,000 0.2873 0.4527 0.3369 0.4728
Married 0.5205 0.4997 0.6149 0.4868
Not married 0.4795 0.4997 0.3851 0.4868
Metropolitan 0.8800 0.3251 0.8780 0.3274
Northeast 0.1737 0.3790 0.1690 0.3749
Midwest 0.2024 0.4019 0.2185 0.4133
South 0.3636 0.4812 0.3720 0.4835
West 0.2603 0.4389 0.2405 0.4275
Employed 0.6876 0.4636 0.6530 0.4762
Unemployed, in labor force 0.0656 0.2477 0.0500 0.2180
Not in labor force 0.2468 0.4313 0.2970 0.4571
Observations 1,680
Table C.67. Summary statistics for demographic characteristics: Feature phone users
Demographiccharacteristics
Weighted Unweighted
Mean Standard deviation
Mean Standard deviation
Age 57.1376 16.0644 61.5342 14.5549
Male 0.4763 0.4999 0.5252 0.4998
Female 0.5237 0.4999 0.4748 0.4998
18–29 0.0822 0.2749 0.0396 0.1951
30–44 0.1302 0.3368 0.0935 0.2914
45–59 0.3187 0.4664 0.2644 0.4414
60+ 0.4689 0.4995 0.6025 0.4898
Less than high school 0.2141 0.4105 0.1043 0.3059
High school degree 0.3063 0.4614 0.3022 0.4596
Some college 0.2582 0.4380 0.2860 0.4523
Bachelor’s degree or higher 0.2214 0.4156 0.3076 0.4619
White, non-Hispanic 0.7198 0.4495 0.8291 0.3767
Black, non-Hispanic 0.1143 0.3184 0.0629 0.2431
Other, non-Hispanic 0.0452 0.2080 0.0432 0.2034
Hispanic 0.1207 0.3260 0.0647 0.2463
2+ races, non-Hispanic 0.0112 0.1053 0.0216 0.1454
Less than $25,000 0.2632 0.4407 0.1691 0.3751
$25,000–$39,999 0.2871 0.4528 0.2680 0.4433
$40,000–$74,999 0.1469 0.3543 0.1817 0.3859
$75,000–$99,999 0.1530 0.3603 0.1978 0.3987
Greater than $100,000 0.1498 0.3572 0.1835 0.3874
Married 0.4941 0.5004 0.6025 0.4898
Not married 0.5059 0.5004 0.3975 0.4898
Metropolitan 0.7948 0.4042 0.8201 0.3844
Northeast 0.1827 0.3868 0.2014 0.4014
Midwest 0.2494 0.4330 0.2554 0.4365
South 0.3748 0.4845 0.3345 0.4723
West 0.1931 0.3951 0.2086 0.4067
Employed 0.3630 0.4813 0.3345 0.4723
Unemployed, in labor force 0.0507 0.2197 0.0342 0.1818
Not in labor force 0.5863 0.4929 0.6313 0.4829
Observations 556
72 Consumers and Mobile Financial Services 2016
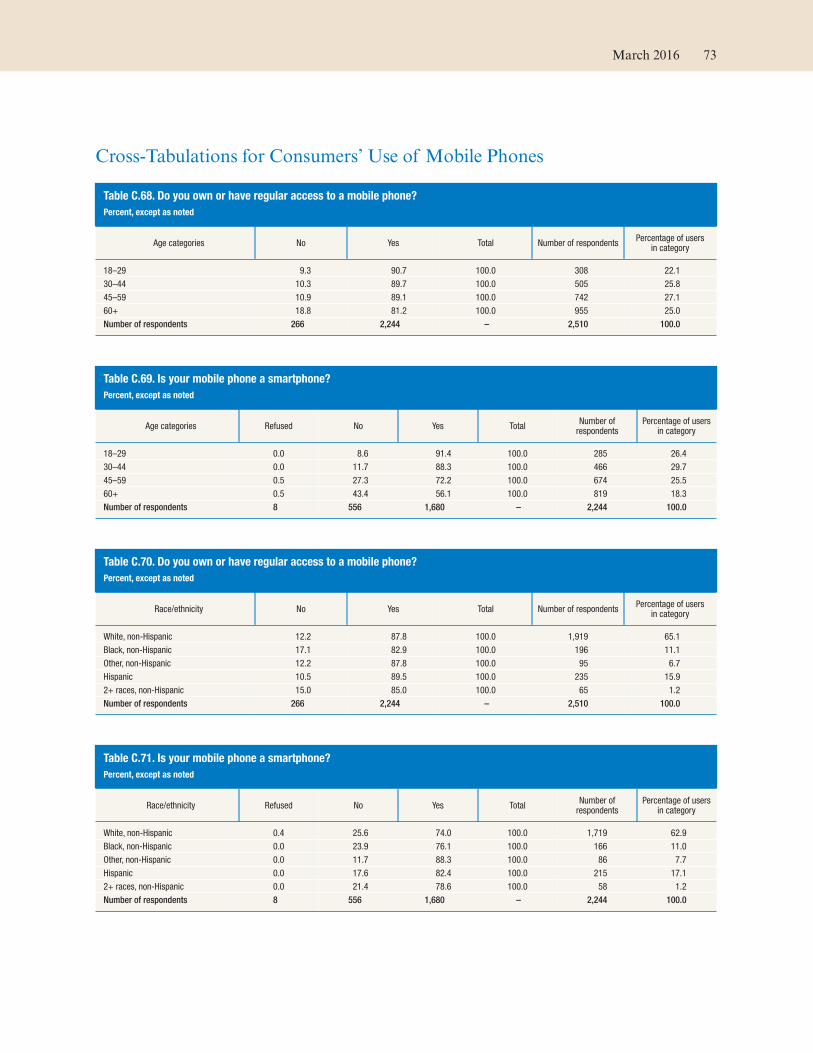
Cross-Tabulations for Consumers’ Use of Mobile Phones
Table C.68. Do you own or have regular access to a mobile phone?
Percent, except as noted
Age categories No Yes Total Number of respondents Percentage of users
in category
18–29 9.3 90.7 100.0 308 22.1
30–44 10.3 89.7 100.0 505 25.8
45–59 10.9 89.1 100.0 742 27.1
60+ 18.8 81.2 100.0 955 25.0
Number of respondents 266 2,244 – 2,510 100.0
Table C.69. Is your mobile phone a smartphone?
Percent, except as noted
Age categories Refused No Yes Total Number of
respondents Percentage of users
in category
18–29 0.0 8.6 91.4 100.0 285 26.4
30–44 0.0 11.7 88.3 100.0 466 29.7
45–59 0.5 27.3 72.2 100.0 674 25.5
60+ 0.5 43.4 56.1 100.0 819 18.3
Number of respondents 8 556 1,680 – 2,244 100.0
Table C.70. Do you own or have regular access to a mobile phone?
Percent, except as noted
Race/ethnicity No Yes Total Number of respondents Percentage of users
in category
White, non-Hispanic 12.2 87.8 100.0 1,919 65.1
Black, non-Hispanic 17.1 82.9 100.0 196 11.1
Other, non-Hispanic 12.2 87.8 100.0 95 6.7
Hispanic 10.5 89.5 100.0 235 15.9
2+ races, non-Hispanic 15.0 85.0 100.0 65 1.2
Number of respondents 266 2,244 – 2,510 100.0
Table C.71. Is your mobile phone a smartphone?
Percent, except as noted
Race/ethnicity Refused No Yes Total Number of
respondents Percentage of users
in category
White, non-Hispanic 0.4 25.6 74.0 100.0 1,719 62.9
Black, non-Hispanic 0.0 23.9 76.1 100.0 166 11.0
Other, non-Hispanic 0.0 11.7 88.3 100.0 86 7.7
Hispanic 0.0 17.6 82.4 100.0 215 17.1
2+ races, non-Hispanic 0.0 21.4 78.6 100.0 58 1.2
Number of respondents 8 556 1,680 – 2,244 100.0
March 2016 73
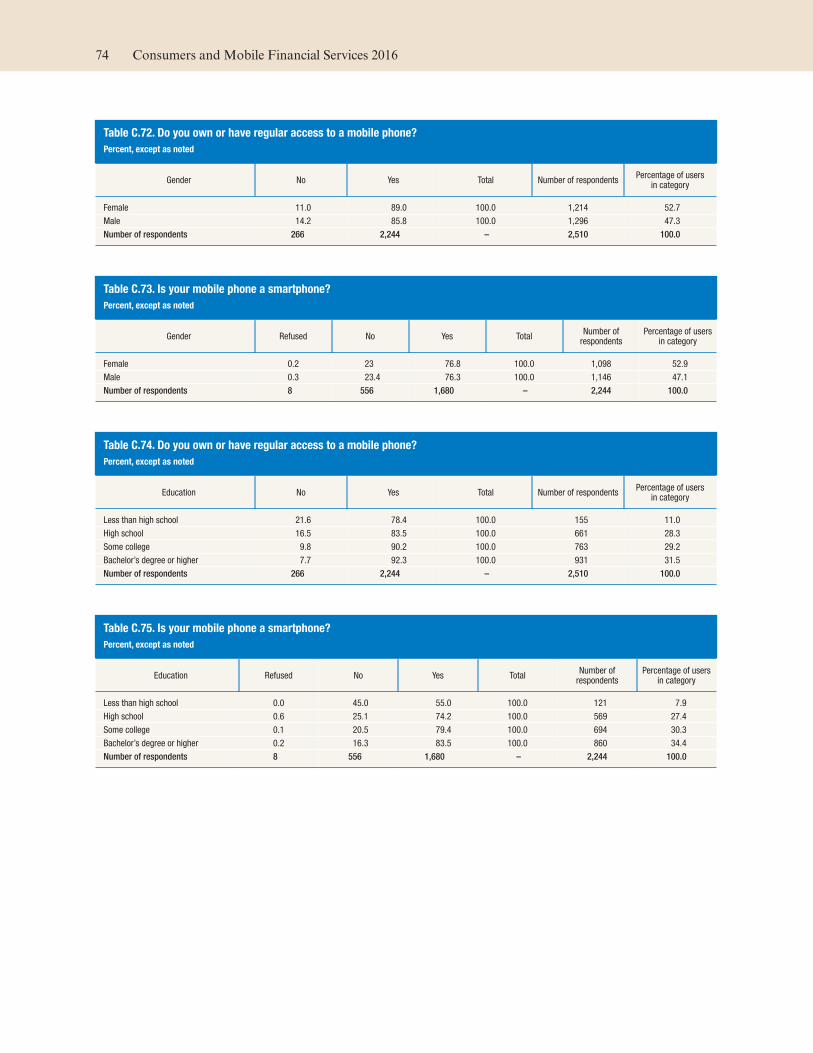
Table C.72. Do you own or have regular access to a mobile phone?
Percent, except as noted
Gender No Yes Total Number of respondents Percentage of users
in category
Female 11.0 89.0 100.0 1,214 52.7
Male 14.2 85.8 100.0 1,296 47.3
Number of respondents 266 2,244 – 2,510 100.0
Table C.73. Is your mobile phone a smartphone?
Percent, except as noted
Gender Refused No Yes Total Number of
respondents Percentage of users
in category
Female 0.2 23 76.8 100.0 1,098 52.9
Male 0.3 23.4 76.3 100.0 1,146 47.1
Number of respondents 8 556 1,680 – 2,244 100.0
Table C.74. Do you own or have regular access to a mobile phone?
Percent, except as noted
Education No Yes Total Number of respondents Percentage of users
in category
Less than high school 21.6 78.4 100.0 155 11.0
High school 16.5 83.5 100.0 661 28.3
Some college 9.8 90.2 100.0 763 29.2
Bachelor’s degree or higher 7.7 92.3 100.0 931 31.5
Number of respondents 266 2,244 – 2,510 100.0
Table C.75. Is your mobile phone a smartphone?
Percent, except as noted
Education Refused No Yes Total Number of
respondents Percentage of users
in category
Less than high school 0.0 45.0 55.0 100.0 121 7.9
High school 0.6 25.1 74.2 100.0 569 27.4
Some college 0.1 20.5 79.4 100.0 694 30.3
Bachelor’s degree or higher 0.2 16.3 83.5 100.0 860 34.4
Number of respondents 8 556 1,680 – 2,244 100.0
74 Consumers and Mobile Financial Services 2016
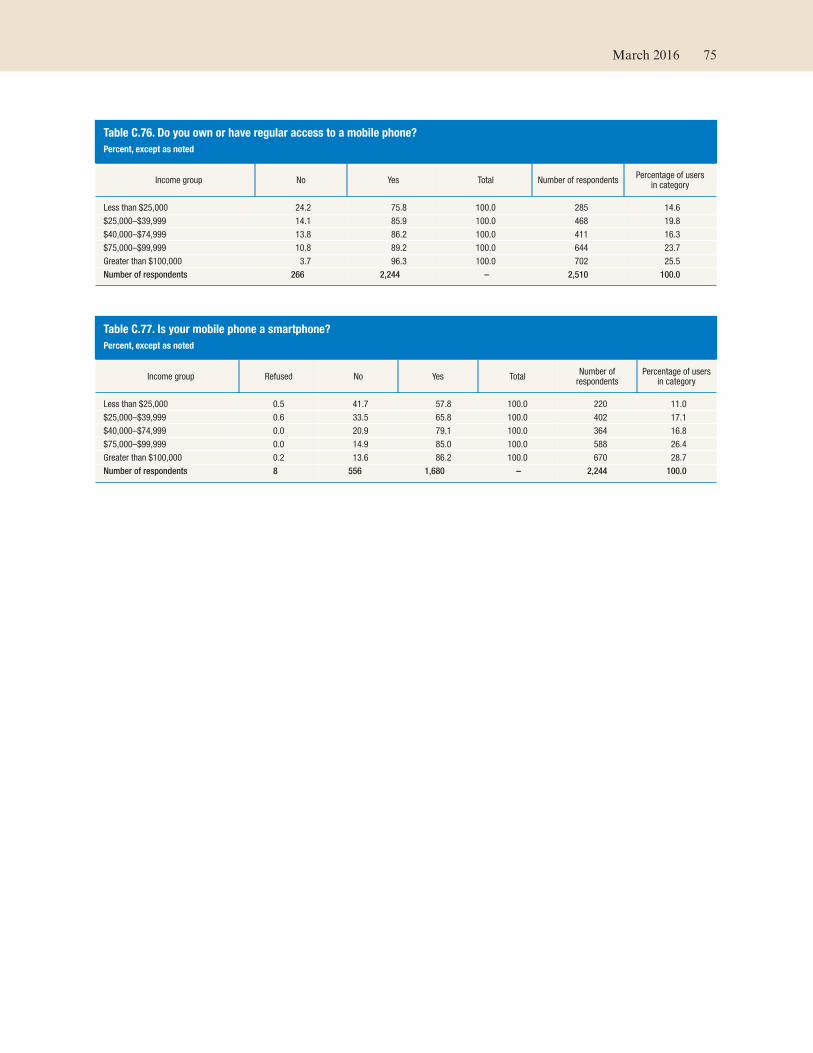
Table C.76. Do you own or have regular access to a mobile phone?
Percent, except as noted
Income group No Yes Total Number of respondents Percentage of users
in category
Less than $25,000 24.2 75.8 100.0 285 14.6
$25,000–$39,999 14.1 85.9 100.0 468 19.8
$40,000–$74,999 13.8 86.2 100.0 411 16.3
$75,000–$99,999 10.8 89.2 100.0 644 23.7
Greater than $100,000 3.7 96.3 100.0 702 25.5
Number of respondents 266 2,244 – 2,510 100.0
Table C.77. Is your mobile phone a smartphone?
Percent, except as noted
Income group Refused No Yes Total Number of
respondents Percentage of users
in category
Less than $25,000 0.5 41.7 57.8 100.0 220 11.0
$25,000–$39,999 0.6 33.5 65.8 100.0 402 17.1
$40,000–$74,999 0.0 20.9 79.1 100.0 364 16.8
$75,000–$99,999 0.0 14.9 85.0 100.0 588 26.4
Greater than $100,000 0.2 13.6 86.2 100.0 670 28.7
Number of respondents 8 556 1,680 – 2,244 100.0
March 2016 75
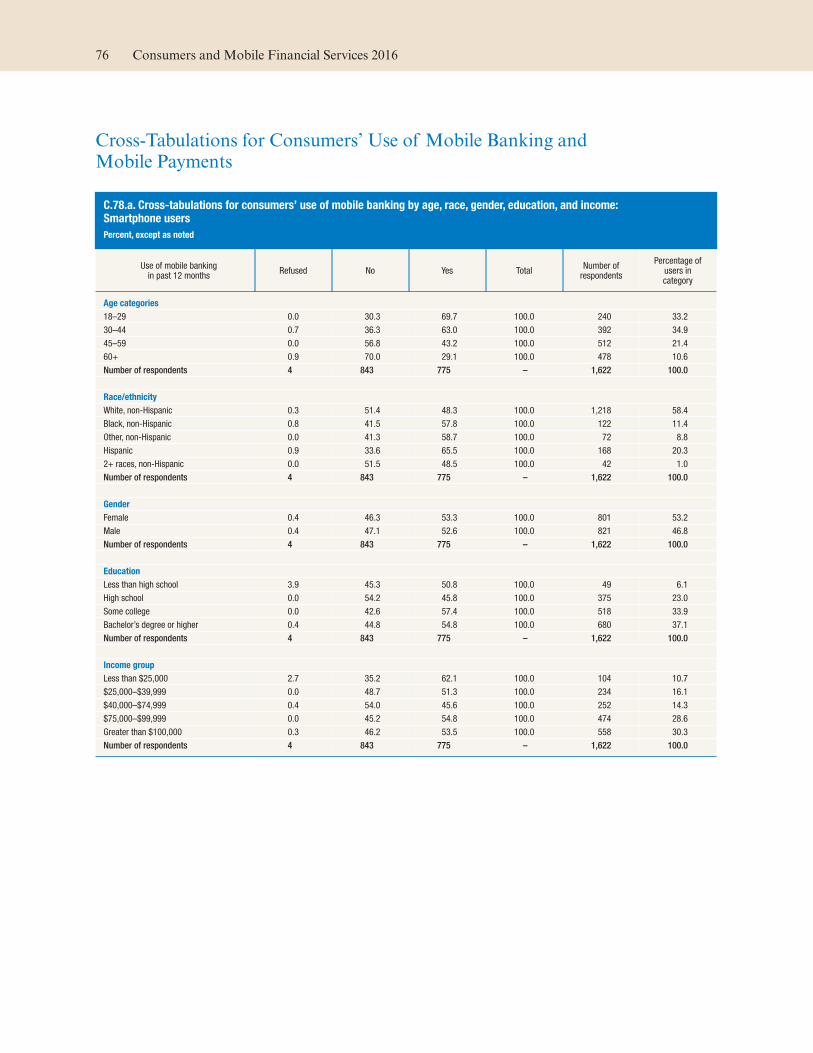
Cross-Tabulations for Consumers’ Use of Mobile Banking and Mobile Payments
C.78.a. Cross-tabulations for consumers’ use of mobile banking by age, race, gender, education, and income: Smartphone users
Percent, except as noted
Use of mobile bankingin past 12 months
Refused No Yes Total Number of
respondents
Percentage of users in category
Age categories
18–29 0.0 30.3 69.7 100.0 240 33.2
30–44 0.7 36.3 63.0 100.0 392 34.9
45–59 0.0 56.8 43.2 100.0 512 21.4
60+ 0.9 70.0 29.1 100.0 478 10.6
Number of respondents 4 843 775 – 1,622 100.0
Race/ethnicity
White, non-Hispanic 0.3 51.4 48.3 100.0 1,218 58.4
Black, non-Hispanic 0.8 41.5 57.8 100.0 122 11.4
Other, non-Hispanic 0.0 41.3 58.7 100.0 72 8.8
Hispanic 0.9 33.6 65.5 100.0 168 20.3
2+ races, non-Hispanic 0.0 51.5 48.5 100.0 42 1.0
Number of respondents 4 843 775 – 1,622 100.0
Gender
Female 0.4 46.3 53.3 100.0 801 53.2
Male 0.4 47.1 52.6 100.0 821 46.8
Number of respondents 4 843 775 – 1,622 100.0
Education
Less than high school 3.9 45.3 50.8 100.0 49 6.1
High school 0.0 54.2 45.8 100.0 375 23.0
Some college 0.0 42.6 57.4 100.0 518 33.9
Bachelor’s degree or higher 0.4 44.8 54.8 100.0 680 37.1
Number of respondents 4 843 775 – 1,622 100.0
Income group
Less than $25,000 2.7 35.2 62.1 100.0 104 10.7
$25,000–$39,999 0.0 48.7 51.3 100.0 234 16.1
$40,000–$74,999 0.4 54.0 45.6 100.0 252 14.3
$75,000–$99,999 0.0 45.2 54.8 100.0 474 28.6
Greater than $100,000 0.3 46.2 53.5 100.0 558 30.3
Number of respondents 4 843 775 – 1,622 100.0
76 Consumers and Mobile Financial Services 2016
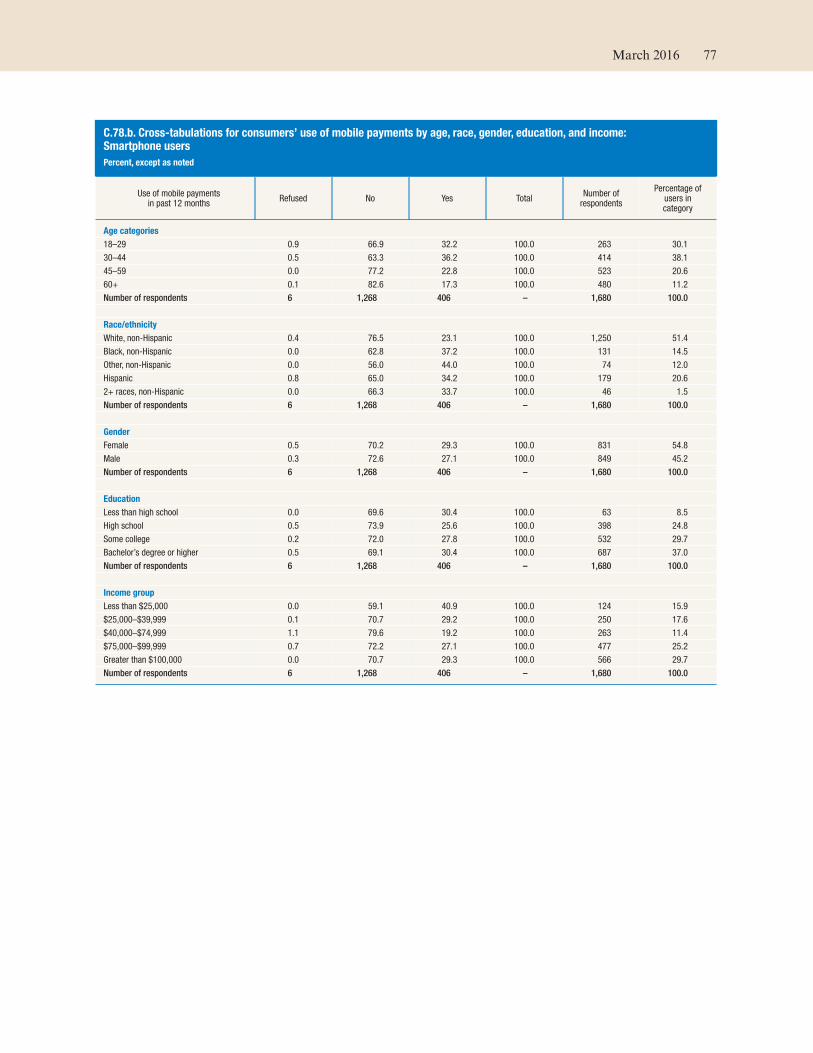
C.78.b. Cross-tabulations for consumers’ use of mobile payments by age, race, gender, education, and income: Smartphone users
Percent, except as noted
Use of mobile payments in past 12 months
Refused No Yes Total Number of
respondents
Percentage of users in category
Age categories
18–29 0.9 66.9 32.2 100.0 263 30.1
30–44 0.5 63.3 36.2 100.0 414 38.1
45–59 0.0 77.2 22.8 100.0 523 20.6
60+ 0.1 82.6 17.3 100.0 480 11.2
Number of respondents 6 1,268 406 – 1,680 100.0
Race/ethnicity
White, non-Hispanic 0.4 76.5 23.1 100.0 1,250 51.4
Black, non-Hispanic 0.0 62.8 37.2 100.0 131 14.5
Other, non-Hispanic 0.0 56.0 44.0 100.0 74 12.0
Hispanic 0.8 65.0 34.2 100.0 179 20.6
2+ races, non-Hispanic 0.0 66.3 33.7 100.0 46 1.5
Number of respondents 6 1,268 406 – 1,680 100.0
Gender
Female 0.5 70.2 29.3 100.0 831 54.8
Male 0.3 72.6 27.1 100.0 849 45.2
Number of respondents 6 1,268 406 – 1,680 100.0
Education
Less than high school 0.0 69.6 30.4 100.0 63 8.5
High school 0.5 73.9 25.6 100.0 398 24.8
Some college 0.2 72.0 27.8 100.0 532 29.7
Bachelor’s degree or higher 0.5 69.1 30.4 100.0 687 37.0
Number of respondents 6 1,268 406 – 1,680 100.0
Income group
Less than $25,000 0.0 59.1 40.9 100.0 124 15.9
$25,000–$39,999 0.1 70.7 29.2 100.0 250 17.6
$40,000–$74,999 1.1 79.6 19.2 100.0 263 11.4
$75,000–$99,999 0.7 72.2 27.1 100.0 477 25.2
Greater than $100,000 0.0 70.7 29.3 100.0 566 29.7
Number of respondents 6 1,268 406 – 1,680 100.0
March 2016 77

0316
www.federalreserve.gov
@FederalReserve Flickr.com/FederalReserve YouTube.com/FedReserveBoard