Embed Size (px)
Citation preview
© 2021 Uddin and Gallardo563
International Food and Agribusiness Management ReviewVolume 24, Issue 3, 2021; DOI: 10.22434/IFAMR2020.0127
Received: 3 August 2020 / Accepted: 23 January 2021
OPEN ACCESS
Consumers’ willingness to pay for organic, clean label, and processed with a new food technology: an application to ready meals
RESEARCH ARTICLE
Azhar Uddina and R. Karina Gallardo b
aGraduate Student, School of Economic Sciences, Washington State University, P.O. Box 646214, Pullman, WA 99164, USA
bAssociate Professor, School of Economic Sciences, Puyallup Research and Extension Center, Washington State University, 2606 W. Pioneer Ave. Puyallup, WA 99371, USA
Abstract
Agri-food companies face the challenge that clean labels and organic are not possible for some processed foods – such as shelf-stable ready meals – with existing processing technologies. This study uses data collected via an online survey and estimates consumers’ willingness to pay for the attributes organic, clean label, and processed with a new food technology in a ready meal. Based on previous literature, one would expect that consumers who prefer a clean label would also prefer a product that is certified organic. However, it was found that consumers who frequently purchase ready meals, prefer a clean label over the organic certification. Results from a latent class analysis identified three classes of consumers within the sample of respondents, the pro-organic and clean label consumer, the pro-clean label and new technology, and the indifferent consumer. The classes of consumers identified in this study, showed heterogeneous preferences towards the organic and clean label attributions, which emphasizes the need to complement the consumer preference assessment with a segmentation analysis. Our findings highlight the importance of technological innovations and the need of presenting consumers with complete information on the new food technologies to mitigate potential neophobias due to unfamiliarity.
Keywords: convenience, healthiness, segmentation analyses, willingness to payJEL code: Q10, Q13
Corresponding author: [email protected] http
s://w
ww
.wag
enin
gena
cade
mic
.com
/doi
/10.
2243
4/IF
AM
R20
20.0
127
- W
edne
sday
, Apr
il 21
, 202
1 12
:01:
50 P
M -
IP
Add
ress
:73.
109.
121.
97
International Food and Agribusiness Management Review564
Uddin and Gallardo Volume 24, Issue 3, 2021
1. Introduction
Changing societal lifestyles leaving individuals with less time available to prepare meals at home has resulted in an increased demand for convenience food products. In the last few decades, household expenditures on convenience food have been on the rise in the United States (Funk and Kennedy, 2016). However, for some consumers, the preference for convenience foods comes at the expense of perceived healthiness and freshness (Amani and Gadde, 2015; Cavaliere and Ventura, 2018), and in some instances, taste and nutritional content (Barnett et al., 2019; Cook et al., 2007). For example, sodium is a typical ingredient in convenience processed foods, as it is needed to provide taste, flavor, and functional properties. However, sodium intake at high levels results in health issues, including high blood pressure, increased risk of cardiovascular disease, renal disease, and strokes (Cook et al., 2007; Barnett et al., 2019). Similar to sodium, other food preservatives are added to processed foods to ensure an acceptable taste, flavor, and stable shelf life.
In the pursuit of healthy and convenience foods, consumers have resorted to organic processed foods based on the notion that organic foods are free of chemicals and would contain less artificial ingredients compared to conventional processed foods (Batte et al., 2007; Peterson and Li, 2011). Growing demand for organic food products is commonly related to consumer values and beliefs about health (e.g. fewer pesticide residues and greater nutrient content), environment stewardship (e.g. better soil management and more biodiversity), and social equity (e.g. farmworker treatment and support for local farms) (Hartman Group, 1996, 1997). Although consumers associate the aforementioned aspects with organic food production and processing in a general way, they often misunderstand the details of organic food production and processing and often confuse the meaning of organic with other unrelated aspects such as locally produced (Campbell et al., 2013, 2014).
Fresh fruits, vegetables, and dairy are among the most popular organic food categories. When analyzing the probability of consumers’ expanding the purchases of organic food categories, it was found that the convenience shelf-stable category, canned foods, would be the last organic food to be purchased (Juhl et al., 2017). The main determinant of the sequence of adoption of organic food categories is given by its popularity and availability. On availability, note that it is challenging to produce organic, convenience, shelf-stable processed foods with existing food processing technologies, such as retort, the status quo sterilization food technology.
Alternative and promising food processing technologies include Microwave Assisted Thermal Sterilization (MATS). This technology uses microwave energy, through polymeric packaging, which enables short-time, in-package sterilization, leading to a shelf-stable, convenience, ready meal with an enhanced flavor and texture. MATS processed foods display higher retention of flavor, enabling both the reduction of flavor-enhancing food additives, such as salt and other artificial ingredients and the production of organic and clean labeled shelf-stable processed foods (Tang, 2015).
Consumers’ aversion to new technologies in food processing and agricultural production (that is, the use of genetically modified seeds or ingredients) could jeopardize the rapid adoption of new food processing technologies and the potential benefits derived from them (Cardello, 2003; Cox and Evans, 2008). Consumers most often are unaware of the benefits of consuming a food product developed with new technologies, and one questions if consumers’ neophobia could be lessened if they were aware of such benefits.
In light of this situation, it would be useful to increase consumers’ awareness that convenience processed food products can be healthy and that new food processing technologies could be conducive to achieve such products. Clean labels could be a promising option to communicate the healthfulness of processed food products. A clean label often refers to an ingredient list that is short, simple, with familiar terms to the consumer, and that indicates no artificial or chemical-sounding ingredients (Asioli et al., 2017). In the strict sense, there is no consensus on the definition of clean label, and it is subject to consumers’ interpretation and perception of the ingredients contained in the food product (Busken, 2013). It is often claimed that consumers’ expectations of clean labels overlap with the idea of natural, organic, free from additives/
http
s://w
ww
.wag
enin
gena
cade
mic
.com
/doi
/10.
2243
4/IF
AM
R20
20.0
127
- W
edne
sday
, Apr
il 21
, 202
1 12
:01:
50 P
M -
IP
Add
ress
:73.
109.
121.
97
International Food and Agribusiness Management Review565
Uddin and Gallardo Volume 24, Issue 3, 2021
preservatives, and less processed, as well as transparent information on the ingredients and practices of the processed food (Hartman Group, 2018; Ingredion, 2014). Others define a clean label as ‘no more than five ingredients or ingredients you cannot pronounce’ (Pollan, 2008), while others mix the concept of ‘free of chemical additives’ with ‘easy-to-understand list of ingredients’ and ‘produced using traditional techniques with limited processing’ (Edwards, 2013).
Considering that consumers often confuse the meaning of organic one wonders if consumers would discern between a clean label and organic certification. Therefore, the objective of this study is to estimate consumers’ willingness to pay (WTP) for the attributes organic, clean label, and processed with a new technology in a convenience food. The attributes organic and clean label are independent but share a common motivation, the pursuit of healthiness when choosing a food product. We include the feature processed with a new technology in the mix of attributes because the production of a convenience food that is organic and exhibits a clean label is not possible with existing technologies. A sub-objective is to investigate if consumers are homogeneous in their preferences towards the aforementioned attributes in a convenience food. We use a discrete choice experiment to elicit the WTP for the attributes organic, convenience, and processed with a new technology; and a latent class segmentation model to investigate the presence of segments within our sample of respondents.
2. Literature review
This section presents studies that provide background on the issues that are the focus of this manuscript: (1) consumers’ motivations to consume organic food, including studies that focus on organic processed foods and the sociodemographic profile of organic purchases; (2) consumers’ preferences for clean labels, healthfulness and naturalness aspects of foods; and (3) consumers’ perception of new food technologies.
On the consumers’ motivations to purchase organic foods, most studies focus on organic fresh foods. These studies concur in that impactful reasons associated with a preference for organic, fresh foods include: the nutritional quality and lack of pesticides (Aktar et al., 2009; Huang, 1996), strong environmental and food safety concerns (Juhl et al., 2017; Loureiro et al., 2001), and concerns over food freshness and nutrition (Loureiro and Hine, 2002). Overall, preferences for organic fresh foods are associated with the perceived environmental and food safety benefits as well as benefits to local food production. This is further supported by Aertsens et al. (2009) who conducted a comprehensive literature review and concluded that the biggest motivator for consuming organic food is the perception that it is healthy, environmentally friendly, and tastier than conventionally produced foods.
Studies centering on organic processed foods concluded that consumers relate organic with chemical-free or GMO-free ingredients and therefore are willing to pay a price premium for these attributes (Batte et al., 2007; Bernard et al., 2006; Peterson and Li, 2011). A handful of studies found that consumers with greater health concerns are more likely to consume products with organic and GMO-free ingredients in processed foods (Asif et al., 2018; Basha et al., 2015; Ditlevsen et al., 2019). Yiridoe et al. (2005) found that consumers were willing to pay less for processed food products with a longer shelf life, such as cereals, compared to their willingness to pay more for organic fresh foods with a shorter shelf life, such as fruits and vegetables. Batte et al. (2007) estimated that consumers are willing to pay premium prices for organic processed foods, even if these foods contained less than 100% organic ingredients. He and Bernard (2011) found that prices for organic processed foods were more elastic than for their fresh food counterpart, implying that consumers are more loyal to organic fresh foods than they are to organic processed foods.
On the sociodemographic profile of organic food purchasers, literature concurs that females, individuals with a higher disposable income, and the younger aged are more likely to purchase organic foods (Bernard et al., 2006; Govindasamy and Italia, 1999; He and Bernard, 2011; Lin et al., 2008; Loureiro and Hine, 2002; Wolf et al., 2002; Yiridoe et al., 2005). The effect of education attained is non-conclusive. Wolf et al. (2002) estimated a positive effect (heightened willingness to buy) whereas Govindasamy and Italia (1999)
http
s://w
ww
.wag
enin
gena
cade
mic
.com
/doi
/10.
2243
4/IF
AM
R20
20.0
127
- W
edne
sday
, Apr
il 21
, 202
1 12
:01:
50 P
M -
IP
Add
ress
:73.
109.
121.
97
International Food and Agribusiness Management Review566
Uddin and Gallardo Volume 24, Issue 3, 2021
estimated a negative effect of the education attained on the willingness to pay for organic food. Meanwhile, Lin et al. (2008) found a non-statistically significant effect. Also, non-conclusive is the effect of the presence of children in a household. Loureiro and Hine (2002) found that the presence of children negatively impacted the willingness to pay for potatoes whereas Batte et al. (2007) found that for multi-ingredient foods, the presence of children had no impact on the probability of paying a price premium for organic; however, conditioned on the willingness to pay a premium price, families with children were willing to pay higher premia for goods with organic ingredients compared to families with no children. Meanwhile, Yue and Tong (2009) and Freyer and Haberkorn (2008) found a positive effect of the presence of children on the willingness to pay for organic food.
Concerning studies centering on consumers’ preferences for clean labels, Asioli et al. (2017) concluded that the most important factor driving consumers’ preference for clean labels is the notion of ‘free-from’ or ‘natural’. The primary motivators consumers had to prefer products with a clean label were the health aspects of the food, whether it is the health claims, the healthiness of the product, or a consumer’s health concerns about the food purchased. Other several studies have shown that the naturalness of food products is of great importance to consumers and is often associated with healthiness (Abouab and Gomez, 2015; Bredahl, 1999; Dickson-Spillman et al., 2011; Evans et al., 2010; Moscato and Machin, 2018; Rozin et al., 2004).
About studies centering on consumers’ acceptance of new food processing technologies, findings suggest that nowadays consumers show interest in knowing more about the technologies used to produce and prepare the food they consume (Dickson-Spillman et al., 2011; Hwang et al., 2005; Kiesel et al., 2005). Along with the increased interest is also the increased concerns towards new food processing technologies (Cardello, 2003; Cox and Evans, 2008; Ronteltap et al., 2007). Among new food technologies, greater concerns are shown for genetic modification compared to others, like pasteurization, the use of artificial colors, and the use of food preservatives (Hwang et al., 2005). The present study focuses on MATS, a new technology based on the exposure of the food to microwaves. Microwave technology itself is not new, as it has been used as a safe means for heating and cooking food. In fact, in 1992 alone, an estimated 92% of households in the United States had a microwave oven (Giese, 1992). Considering that consumers are familiar with microwave technology and that its application results in an improved product (clean label and organic) could make this technology more favored than others.
3. Data
The data from the choice experiments were collected online via the survey platform Qualtrics (Qualtrics, Drive Provo, UT, USA), and used the Qualtrics consumer panel research. The survey was administered from September 13th until October 1st, 2017. Qualtrics randomly selected a sample of 350 consumers for the survey, based on the following criteria: (1) random representation of the U.S. demographics in terms of age and geographical locations; (2) be in charge of the grocery shopping in the household; (3) have consumed a shelf-stable ready meal at least once during the last three months. To ensure the latter was accomplished, a screening question was included, asking to indicate consumption of the meal in question within the time-frame indicated above. In addition to the choice experiment questions, participants were asked about grocery store shopping habits, general food consumption habits, and food consumption habits focusing on ready meals. Moreover, questions concerning attitudes towards microwave technology and the importance of labels in food purchasing decisions were also included. Finally, socio-demographic related questions were asked.
To ascertain choice behavior, each consumer was given eight scenarios to mimic a grocery shopping experience for shelf-stable, ready meals. Before the scenario was presented, respondents were provided with information about each technology ‘MATS’ and retort, as follows:
http
s://w
ww
.wag
enin
gena
cade
mic
.com
/doi
/10.
2243
4/IF
AM
R20
20.0
127
- W
edne
sday
, Apr
il 21
, 202
1 12
:01:
50 P
M -
IP
Add
ress
:73.
109.
121.
97
International Food and Agribusiness Management Review567
Uddin and Gallardo Volume 24, Issue 3, 2021
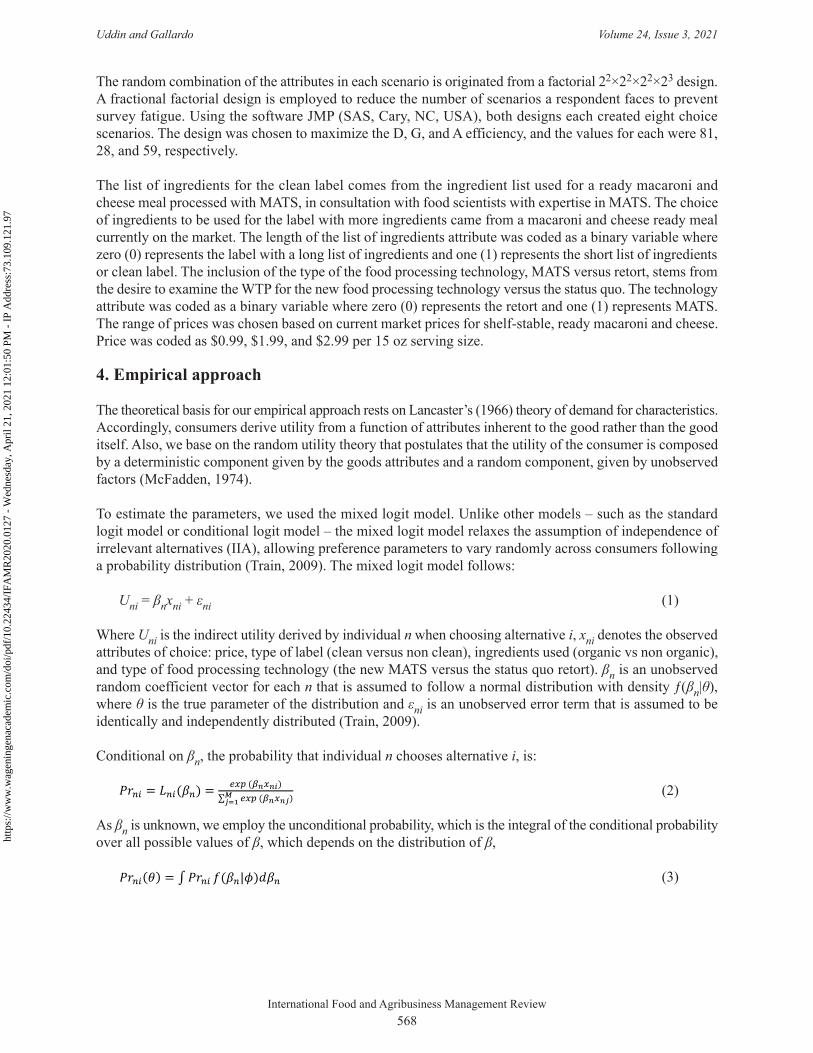
Processing technologies:Shelf-stable ready-to-eat meals found in the canned/packaged food section at grocery stores are sterilized for food safety. Many of the foods we eat have been sterilized, such as canned soup or salmon pouches. Food that has been sterilized is heated up to a certain temperature and length of time to kill off bacteria. Consider a new processing technology that allows meals to be produced with fewer ingredients while improving the food’s quality.
Retort:This is the traditional thermal treatment applied to ready-to-eat processed food products. This is the CURRENT technology used for most shelf stable ready-to-eat foods. Typically, it is performed under pressure in pressure cookers, called retorts. The product is sterilized and its shelf life without refrigeration is prolonged, for example up to 2 years. However, food generally does not preserve its original quality characteristics.
Microwave sterilization:Microwave Assisted Thermal Sterilization (MATS) is an effective means to deliver energy to food through polymeric package materials, offering the potential for developing short-time in-package sterilization processes. This is the SAME principle used for the microwave oven you have at home. Food prepared using MATS have quality characteristics close to those prepared at homes or in restaurants. Also, food prepared with MATS require minimal processing, allowing food products to be made with fewer ingredients than traditional sterilized foods.
Each scenario consisted of two options, each containing the same ready meal randomly assigned with option A or B, which differed in the length of the list of ingredients (e.g. if clean label or not), the type of the food processing technology (MATS versus retort), if the product is certified organic or not, and the price. In each scenario, consumers were asked to select only one option they were willing to buy, they could always choose none of the options presented, option C. An example of the scenario presented to survey respondents is presented in Figure 1.
Figure 1. Example of a discrete choice scenario used in the survey.
http
s://w
ww
.wag
enin
gena
cade
mic
.com
/doi
/10.
2243
4/IF
AM
R20
20.0
127
- W
edne
sday
, Apr
il 21
, 202
1 12
:01:
50 P
M -
IP
Add
ress
:73.
109.
121.
97
International Food and Agribusiness Management Review568
Uddin and Gallardo Volume 24, Issue 3, 2021
The random combination of the attributes in each scenario is originated from a factorial 22×22×22×23 design. A fractional factorial design is employed to reduce the number of scenarios a respondent faces to prevent survey fatigue. Using the software JMP (SAS, Cary, NC, USA), both designs each created eight choice scenarios. The design was chosen to maximize the D, G, and A efficiency, and the values for each were 81, 28, and 59, respectively.
The list of ingredients for the clean label comes from the ingredient list used for a ready macaroni and cheese meal processed with MATS, in consultation with food scientists with expertise in MATS. The choice of ingredients to be used for the label with more ingredients came from a macaroni and cheese ready meal currently on the market. The length of the list of ingredients attribute was coded as a binary variable where zero (0) represents the label with a long list of ingredients and one (1) represents the short list of ingredients or clean label. The inclusion of the type of the food processing technology, MATS versus retort, stems from the desire to examine the WTP for the new food processing technology versus the status quo. The technology attribute was coded as a binary variable where zero (0) represents the retort and one (1) represents MATS. The range of prices was chosen based on current market prices for shelf-stable, ready macaroni and cheese. Price was coded as $0.99, $1.99, and $2.99 per 15 oz serving size.
4. Empirical approach
The theoretical basis for our empirical approach rests on Lancaster’s (1966) theory of demand for characteristics. Accordingly, consumers derive utility from a function of attributes inherent to the good rather than the good itself. Also, we base on the random utility theory that postulates that the utility of the consumer is composed by a deterministic component given by the goods attributes and a random component, given by unobserved factors (McFadden, 1974).
To estimate the parameters, we used the mixed logit model. Unlike other models – such as the standard logit model or conditional logit model – the mixed logit model relaxes the assumption of independence of irrelevant alternatives (IIA), allowing preference parameters to vary randomly across consumers following a probability distribution (Train, 2009). The mixed logit model follows:
Uni = βnxni + εni (1)
Where Uni is the indirect utility derived by individual n when choosing alternative i, xni denotes the observed attributes of choice: price, type of label (clean versus non clean), ingredients used (organic vs non organic), and type of food processing technology (the new MATS versus the status quo retort). βn is an unobserved random coefficient vector for each n that is assumed to follow a normal distribution with density ƒ(βn|θ), where θ is the true parameter of the distribution and εni is an unobserved error term that is assumed to be identically and independently distributed (Train, 2009).
Conditional on βn, the probability that individual n chooses alternative i, is:
𝑃𝑃𝑃𝑃𝑛𝑛𝑛𝑛 = 𝐿𝐿𝑛𝑛𝑛𝑛(𝛽𝛽𝑛𝑛) =𝑒𝑒𝑒𝑒𝑒𝑒(𝛽𝛽𝑛𝑛𝑒𝑒𝑛𝑛𝑛𝑛)
∑ 𝑒𝑒𝑒𝑒𝑒𝑒(𝛽𝛽𝑛𝑛𝑒𝑒𝑛𝑛𝑛𝑛)𝑀𝑀𝑛𝑛=1
(2)
𝑃𝑃𝑃𝑃𝑛𝑛𝑛𝑛(𝜃𝜃) = ∫𝑃𝑃𝑃𝑃𝑛𝑛𝑛𝑛 𝑓𝑓(𝛽𝛽𝑛𝑛|𝜙𝜙)𝑑𝑑𝛽𝛽𝑛𝑛 (3)
𝑃𝑃𝑃𝑃𝑛𝑛 = ∏ ( 𝑒𝑒𝑒𝑒𝑒𝑒(𝛽𝛽𝑛𝑛𝑒𝑒𝑛𝑛𝑛𝑛)∑ 𝑒𝑒𝑒𝑒𝑒𝑒(𝛽𝛽𝑛𝑛𝑒𝑒𝑛𝑛𝑛𝑛)𝑀𝑀𝑛𝑛=1
)𝑦𝑦𝑛𝑛𝑛𝑛𝑀𝑀
𝑛𝑛=1 (4)
###→ �̂�𝛽
𝑙𝑙𝑙𝑙𝐿𝐿 = ∑ ∑ 𝑦𝑦𝑛𝑛𝑛𝑛𝑙𝑙𝑙𝑙(𝑃𝑃𝑃𝑃𝑛𝑛𝑛𝑛)𝑀𝑀𝑛𝑛=1
𝑁𝑁𝑛𝑛=1 (5)
𝑊𝑊𝑊𝑊𝑃𝑃𝑎𝑎𝑎𝑎𝑎𝑎𝑎𝑎𝑛𝑛𝑎𝑎𝑎𝑎𝑎𝑎𝑒𝑒 =−𝛽𝛽𝑛𝑛𝑎𝑎𝑎𝑎𝑎𝑎𝑎𝑎𝑛𝑛𝑎𝑎𝑎𝑎𝑎𝑎𝑎𝑎
𝛽𝛽𝑛𝑛𝑝𝑝𝑎𝑎𝑛𝑛𝑝𝑝𝑎𝑎(6)
𝑃𝑃𝑛𝑛(𝑐𝑐) = ∏ ( 𝑒𝑒𝑒𝑒𝑒𝑒(𝛽𝛽𝑝𝑝𝑒𝑒𝑛𝑛𝑛𝑛)∑ 𝑒𝑒𝑒𝑒𝑒𝑒(𝛽𝛽𝑝𝑝𝑒𝑒𝑛𝑛𝑛𝑛)𝑀𝑀𝑛𝑛=1
)𝑦𝑦𝑛𝑛𝑛𝑛𝐼𝐼
𝑛𝑛=1 (7)
𝜋𝜋𝑛𝑛𝑛𝑛(𝜃𝜃) = ( 𝑒𝑒𝑒𝑒𝑒𝑒(𝜃𝜃𝑝𝑝𝑧𝑧𝑛𝑛)1+∑ 𝑒𝑒𝑒𝑒𝑒𝑒(𝜃𝜃𝑞𝑞𝑧𝑧𝑛𝑛)𝐶𝐶−1
𝑞𝑞=1) (8)
(2)
As βn is unknown, we employ the unconditional probability, which is the integral of the conditional probability over all possible values of β, which depends on the distribution of β,
𝑃𝑃𝑃𝑃𝑛𝑛𝑛𝑛 = 𝐿𝐿𝑛𝑛𝑛𝑛(𝛽𝛽𝑛𝑛) =𝑒𝑒𝑒𝑒𝑒𝑒(𝛽𝛽𝑛𝑛𝑒𝑒𝑛𝑛𝑛𝑛)
∑ 𝑒𝑒𝑒𝑒𝑒𝑒(𝛽𝛽𝑛𝑛𝑒𝑒𝑛𝑛𝑛𝑛)𝑀𝑀𝑛𝑛=1
(2)
𝑃𝑃𝑃𝑃𝑛𝑛𝑛𝑛(𝜃𝜃) = ∫𝑃𝑃𝑃𝑃𝑛𝑛𝑛𝑛 𝑓𝑓(𝛽𝛽𝑛𝑛|𝜙𝜙)𝑑𝑑𝛽𝛽𝑛𝑛 (3)
𝑃𝑃𝑃𝑃𝑛𝑛 = ∏ ( 𝑒𝑒𝑒𝑒𝑒𝑒(𝛽𝛽𝑛𝑛𝑒𝑒𝑛𝑛𝑛𝑛)∑ 𝑒𝑒𝑒𝑒𝑒𝑒(𝛽𝛽𝑛𝑛𝑒𝑒𝑛𝑛𝑛𝑛)𝑀𝑀𝑛𝑛=1
)𝑦𝑦𝑛𝑛𝑛𝑛𝑀𝑀
𝑛𝑛=1 (4)
###→ �̂�𝛽
𝑙𝑙𝑙𝑙𝐿𝐿 = ∑ ∑ 𝑦𝑦𝑛𝑛𝑛𝑛𝑙𝑙𝑙𝑙(𝑃𝑃𝑃𝑃𝑛𝑛𝑛𝑛)𝑀𝑀𝑛𝑛=1
𝑁𝑁𝑛𝑛=1 (5)
𝑊𝑊𝑊𝑊𝑃𝑃𝑎𝑎𝑎𝑎𝑎𝑎𝑎𝑎𝑛𝑛𝑎𝑎𝑎𝑎𝑎𝑎𝑒𝑒 =−𝛽𝛽𝑛𝑛𝑎𝑎𝑎𝑎𝑎𝑎𝑎𝑎𝑛𝑛𝑎𝑎𝑎𝑎𝑎𝑎𝑎𝑎
𝛽𝛽𝑛𝑛𝑝𝑝𝑎𝑎𝑛𝑛𝑝𝑝𝑎𝑎(6)
𝑃𝑃𝑛𝑛(𝑐𝑐) = ∏ ( 𝑒𝑒𝑒𝑒𝑒𝑒(𝛽𝛽𝑝𝑝𝑒𝑒𝑛𝑛𝑛𝑛)∑ 𝑒𝑒𝑒𝑒𝑒𝑒(𝛽𝛽𝑝𝑝𝑒𝑒𝑛𝑛𝑛𝑛)𝑀𝑀𝑛𝑛=1
)𝑦𝑦𝑛𝑛𝑛𝑛𝐼𝐼
𝑛𝑛=1 (7)
𝜋𝜋𝑛𝑛𝑛𝑛(𝜃𝜃) = ( 𝑒𝑒𝑒𝑒𝑒𝑒(𝜃𝜃𝑝𝑝𝑧𝑧𝑛𝑛)1+∑ 𝑒𝑒𝑒𝑒𝑒𝑒(𝜃𝜃𝑞𝑞𝑧𝑧𝑛𝑛)𝐶𝐶−1
𝑞𝑞=1) (8)
(3)
http
s://w
ww
.wag
enin
gena
cade
mic
.com
/doi
/10.
2243
4/IF
AM
R20
20.0
127
- W
edne
sday
, Apr
il 21
, 202
1 12
:01:
50 P
M -
IP
Add
ress
:73.
109.
121.
97
International Food and Agribusiness Management Review569
Uddin and Gallardo Volume 24, Issue 3, 2021
Then, the probability of each individual n making a sequence of choices is:
𝑃𝑃𝑃𝑃𝑛𝑛𝑛𝑛 = 𝐿𝐿𝑛𝑛𝑛𝑛(𝛽𝛽𝑛𝑛) =𝑒𝑒𝑒𝑒𝑒𝑒(𝛽𝛽𝑛𝑛𝑒𝑒𝑛𝑛𝑛𝑛)
∑ 𝑒𝑒𝑒𝑒𝑒𝑒(𝛽𝛽𝑛𝑛𝑒𝑒𝑛𝑛𝑛𝑛)𝑀𝑀𝑛𝑛=1
(2)
𝑃𝑃𝑃𝑃𝑛𝑛𝑛𝑛(𝜃𝜃) = ∫𝑃𝑃𝑃𝑃𝑛𝑛𝑛𝑛 𝑓𝑓(𝛽𝛽𝑛𝑛|𝜙𝜙)𝑑𝑑𝛽𝛽𝑛𝑛 (3)
𝑃𝑃𝑃𝑃𝑛𝑛 = ∏ ( 𝑒𝑒𝑒𝑒𝑒𝑒(𝛽𝛽𝑛𝑛𝑒𝑒𝑛𝑛𝑛𝑛)∑ 𝑒𝑒𝑒𝑒𝑒𝑒(𝛽𝛽𝑛𝑛𝑒𝑒𝑛𝑛𝑛𝑛)𝑀𝑀𝑛𝑛=1
)𝑦𝑦𝑛𝑛𝑛𝑛𝑀𝑀
𝑛𝑛=1 (4)
### → �̂�𝛽
𝑙𝑙𝑙𝑙𝐿𝐿 = ∑ ∑ 𝑦𝑦𝑛𝑛𝑛𝑛𝑙𝑙𝑙𝑙(𝑃𝑃𝑃𝑃𝑛𝑛𝑛𝑛)𝑀𝑀𝑛𝑛=1
𝑁𝑁𝑛𝑛=1 (5)
𝑊𝑊𝑊𝑊𝑃𝑃𝑎𝑎𝑎𝑎𝑎𝑎𝑎𝑎𝑛𝑛𝑎𝑎𝑎𝑎𝑎𝑎𝑒𝑒 =−𝛽𝛽𝑛𝑛𝑎𝑎𝑎𝑎𝑎𝑎𝑎𝑎𝑛𝑛𝑎𝑎𝑎𝑎𝑎𝑎𝑎𝑎
𝛽𝛽𝑛𝑛𝑝𝑝𝑎𝑎𝑛𝑛𝑝𝑝𝑎𝑎 (6)
𝑃𝑃𝑛𝑛(𝑐𝑐) = ∏ ( 𝑒𝑒𝑒𝑒𝑒𝑒(𝛽𝛽𝑝𝑝𝑒𝑒𝑛𝑛𝑛𝑛)∑ 𝑒𝑒𝑒𝑒𝑒𝑒(𝛽𝛽𝑝𝑝𝑒𝑒𝑛𝑛𝑛𝑛)𝑀𝑀𝑛𝑛=1
)𝑦𝑦𝑛𝑛𝑛𝑛𝐼𝐼
𝑛𝑛=1 (7)
𝜋𝜋𝑛𝑛𝑛𝑛(𝜃𝜃) = ( 𝑒𝑒𝑒𝑒𝑒𝑒(𝜃𝜃𝑝𝑝𝑧𝑧𝑛𝑛)1+∑ 𝑒𝑒𝑒𝑒𝑒𝑒(𝜃𝜃𝑞𝑞𝑧𝑧𝑛𝑛)𝐶𝐶−1
𝑞𝑞=1) (8)
(4)
where yni denotes an indicator function that is one (1) if consumer n chooses alternative i, and zero (0) otherwise. The maximum likelihood estimation that solves for
𝑃𝑃𝑃𝑃𝑛𝑛𝑛𝑛 = 𝐿𝐿𝑛𝑛𝑛𝑛(𝛽𝛽𝑛𝑛) =𝑒𝑒𝑒𝑒𝑒𝑒(𝛽𝛽𝑛𝑛𝑒𝑒𝑛𝑛𝑛𝑛)
∑ 𝑒𝑒𝑒𝑒𝑒𝑒(𝛽𝛽𝑛𝑛𝑒𝑒𝑛𝑛𝑛𝑛)𝑀𝑀𝑛𝑛=1
(2)
𝑃𝑃𝑃𝑃𝑛𝑛𝑛𝑛(𝜃𝜃) = ∫𝑃𝑃𝑃𝑃𝑛𝑛𝑛𝑛 𝑓𝑓(𝛽𝛽𝑛𝑛|𝜙𝜙)𝑑𝑑𝛽𝛽𝑛𝑛 (3)
𝑃𝑃𝑃𝑃𝑛𝑛 = ∏ ( 𝑒𝑒𝑒𝑒𝑒𝑒(𝛽𝛽𝑛𝑛𝑒𝑒𝑛𝑛𝑛𝑛)∑ 𝑒𝑒𝑒𝑒𝑒𝑒(𝛽𝛽𝑛𝑛𝑒𝑒𝑛𝑛𝑛𝑛)𝑀𝑀𝑛𝑛=1
)𝑦𝑦𝑛𝑛𝑛𝑛𝑀𝑀
𝑛𝑛=1 (4)
###→ �̂�𝛽
𝑙𝑙𝑙𝑙𝐿𝐿 = ∑ ∑ 𝑦𝑦𝑛𝑛𝑛𝑛𝑙𝑙𝑙𝑙(𝑃𝑃𝑃𝑃𝑛𝑛𝑛𝑛)𝑀𝑀𝑛𝑛=1
𝑁𝑁𝑛𝑛=1 (5)
𝑊𝑊𝑊𝑊𝑃𝑃𝑎𝑎𝑎𝑎𝑎𝑎𝑎𝑎𝑛𝑛𝑎𝑎𝑎𝑎𝑎𝑎𝑒𝑒 =−𝛽𝛽𝑛𝑛𝑎𝑎𝑎𝑎𝑎𝑎𝑎𝑎𝑛𝑛𝑎𝑎𝑎𝑎𝑎𝑎𝑎𝑎
𝛽𝛽𝑛𝑛𝑝𝑝𝑎𝑎𝑛𝑛𝑝𝑝𝑎𝑎(6)
𝑃𝑃𝑛𝑛(𝑐𝑐) = ∏ ( 𝑒𝑒𝑒𝑒𝑒𝑒(𝛽𝛽𝑝𝑝𝑒𝑒𝑛𝑛𝑛𝑛)∑ 𝑒𝑒𝑒𝑒𝑒𝑒(𝛽𝛽𝑝𝑝𝑒𝑒𝑛𝑛𝑛𝑛)𝑀𝑀𝑛𝑛=1
)𝑦𝑦𝑛𝑛𝑛𝑛𝐼𝐼
𝑛𝑛=1 (7)
𝜋𝜋𝑛𝑛𝑛𝑛(𝜃𝜃) = ( 𝑒𝑒𝑒𝑒𝑒𝑒(𝜃𝜃𝑝𝑝𝑧𝑧𝑛𝑛)1+∑ 𝑒𝑒𝑒𝑒𝑒𝑒(𝜃𝜃𝑞𝑞𝑧𝑧𝑛𝑛)𝐶𝐶−1
𝑞𝑞=1) (8)
that maximizes the log-likelihood function is specified as:
𝑃𝑃𝑃𝑃𝑛𝑛𝑛𝑛 = 𝐿𝐿𝑛𝑛𝑛𝑛(𝛽𝛽𝑛𝑛) =𝑒𝑒𝑒𝑒𝑒𝑒(𝛽𝛽𝑛𝑛𝑒𝑒𝑛𝑛𝑛𝑛)
∑ 𝑒𝑒𝑒𝑒𝑒𝑒(𝛽𝛽𝑛𝑛𝑒𝑒𝑛𝑛𝑛𝑛)𝑀𝑀𝑛𝑛=1
(2)
𝑃𝑃𝑃𝑃𝑛𝑛𝑛𝑛(𝜃𝜃) = ∫𝑃𝑃𝑃𝑃𝑛𝑛𝑛𝑛 𝑓𝑓(𝛽𝛽𝑛𝑛|𝜙𝜙)𝑑𝑑𝛽𝛽𝑛𝑛 (3)
𝑃𝑃𝑃𝑃𝑛𝑛 = ∏ ( 𝑒𝑒𝑒𝑒𝑒𝑒(𝛽𝛽𝑛𝑛𝑒𝑒𝑛𝑛𝑛𝑛)∑ 𝑒𝑒𝑒𝑒𝑒𝑒(𝛽𝛽𝑛𝑛𝑒𝑒𝑛𝑛𝑛𝑛)𝑀𝑀𝑛𝑛=1
)𝑦𝑦𝑛𝑛𝑛𝑛𝑀𝑀
𝑛𝑛=1 (4)
### → �̂�𝛽
𝑙𝑙𝑙𝑙𝐿𝐿 = ∑ ∑ 𝑦𝑦𝑛𝑛𝑛𝑛𝑙𝑙𝑙𝑙(𝑃𝑃𝑃𝑃𝑛𝑛𝑛𝑛)𝑀𝑀𝑛𝑛=1
𝑁𝑁𝑛𝑛=1 (5)
𝑊𝑊𝑊𝑊𝑃𝑃𝑎𝑎𝑎𝑎𝑎𝑎𝑎𝑎𝑛𝑛𝑎𝑎𝑎𝑎𝑎𝑎𝑒𝑒 =−𝛽𝛽𝑛𝑛𝑎𝑎𝑎𝑎𝑎𝑎𝑎𝑎𝑛𝑛𝑎𝑎𝑎𝑎𝑎𝑎𝑎𝑎
𝛽𝛽𝑛𝑛𝑝𝑝𝑎𝑎𝑛𝑛𝑝𝑝𝑎𝑎 (6)
𝑃𝑃𝑛𝑛(𝑐𝑐) = ∏ ( 𝑒𝑒𝑒𝑒𝑒𝑒(𝛽𝛽𝑝𝑝𝑒𝑒𝑛𝑛𝑛𝑛)∑ 𝑒𝑒𝑒𝑒𝑒𝑒(𝛽𝛽𝑝𝑝𝑒𝑒𝑛𝑛𝑛𝑛)𝑀𝑀𝑛𝑛=1
)𝑦𝑦𝑛𝑛𝑛𝑛𝐼𝐼
𝑛𝑛=1 (7)
𝜋𝜋𝑛𝑛𝑛𝑛(𝜃𝜃) = ( 𝑒𝑒𝑒𝑒𝑒𝑒(𝜃𝜃𝑝𝑝𝑧𝑧𝑛𝑛)1+∑ 𝑒𝑒𝑒𝑒𝑒𝑒(𝜃𝜃𝑞𝑞𝑧𝑧𝑛𝑛)𝐶𝐶−1
𝑞𝑞=1) (8)
(5)
where lnL denotes the sum of the likelihood functions across options (Train, 2009). The coefficient estimates of each attribute and price were obtained using the software STATA (StataCorp LLC, College Station, TX, USA). In general, the WTP is obtained by dividing the coefficient estimate of each attribute divided by the coefficient estimate of price, multiplied by -1.
𝑃𝑃𝑃𝑃𝑛𝑛𝑛𝑛 = 𝐿𝐿𝑛𝑛𝑛𝑛(𝛽𝛽𝑛𝑛) =𝑒𝑒𝑒𝑒𝑒𝑒(𝛽𝛽𝑛𝑛𝑒𝑒𝑛𝑛𝑛𝑛)
∑ 𝑒𝑒𝑒𝑒𝑒𝑒(𝛽𝛽𝑛𝑛𝑒𝑒𝑛𝑛𝑛𝑛)𝑀𝑀𝑛𝑛=1
(2)
𝑃𝑃𝑃𝑃𝑛𝑛𝑛𝑛(𝜃𝜃) = ∫𝑃𝑃𝑃𝑃𝑛𝑛𝑛𝑛 𝑓𝑓(𝛽𝛽𝑛𝑛|𝜙𝜙)𝑑𝑑𝛽𝛽𝑛𝑛 (3)
𝑃𝑃𝑃𝑃𝑛𝑛 = ∏ ( 𝑒𝑒𝑒𝑒𝑒𝑒(𝛽𝛽𝑛𝑛𝑒𝑒𝑛𝑛𝑛𝑛)∑ 𝑒𝑒𝑒𝑒𝑒𝑒(𝛽𝛽𝑛𝑛𝑒𝑒𝑛𝑛𝑛𝑛)𝑀𝑀𝑛𝑛=1
)𝑦𝑦𝑛𝑛𝑛𝑛𝑀𝑀
𝑛𝑛=1 (4)
### → �̂�𝛽
𝑙𝑙𝑙𝑙𝐿𝐿 = ∑ ∑ 𝑦𝑦𝑛𝑛𝑛𝑛𝑙𝑙𝑙𝑙(𝑃𝑃𝑃𝑃𝑛𝑛𝑛𝑛)𝑀𝑀𝑛𝑛=1
𝑁𝑁𝑛𝑛=1 (5)
𝑊𝑊𝑊𝑊𝑃𝑃𝑎𝑎𝑎𝑎𝑎𝑎𝑎𝑎𝑛𝑛𝑎𝑎𝑎𝑎𝑎𝑎𝑒𝑒 =−𝛽𝛽𝑛𝑛𝑎𝑎𝑎𝑎𝑎𝑎𝑎𝑎𝑛𝑛𝑎𝑎𝑎𝑎𝑎𝑎𝑎𝑎
𝛽𝛽𝑛𝑛𝑝𝑝𝑎𝑎𝑛𝑛𝑝𝑝𝑎𝑎 (6)
𝑃𝑃𝑛𝑛(𝑐𝑐) = ∏ ( 𝑒𝑒𝑒𝑒𝑒𝑒(𝛽𝛽𝑝𝑝𝑒𝑒𝑛𝑛𝑛𝑛)∑ 𝑒𝑒𝑒𝑒𝑒𝑒(𝛽𝛽𝑝𝑝𝑒𝑒𝑛𝑛𝑛𝑛)𝑀𝑀𝑛𝑛=1
)𝑦𝑦𝑛𝑛𝑛𝑛𝐼𝐼
𝑛𝑛=1 (7)
𝜋𝜋𝑛𝑛𝑛𝑛(𝜃𝜃) = ( 𝑒𝑒𝑒𝑒𝑒𝑒(𝜃𝜃𝑝𝑝𝑧𝑧𝑛𝑛)1+∑ 𝑒𝑒𝑒𝑒𝑒𝑒(𝜃𝜃𝑞𝑞𝑧𝑧𝑛𝑛)𝐶𝐶−1
𝑞𝑞=1) (8)
(6)
where, WTPattribute is the WTP for each attribute, -βnattribute is the estimated coefficient for each attribute included in the choice scenario, and βnprice is the estimated coefficient for price. The WTP statistic for each attribute is calculated via bootstrap in STATA.
4.1 Latent class model
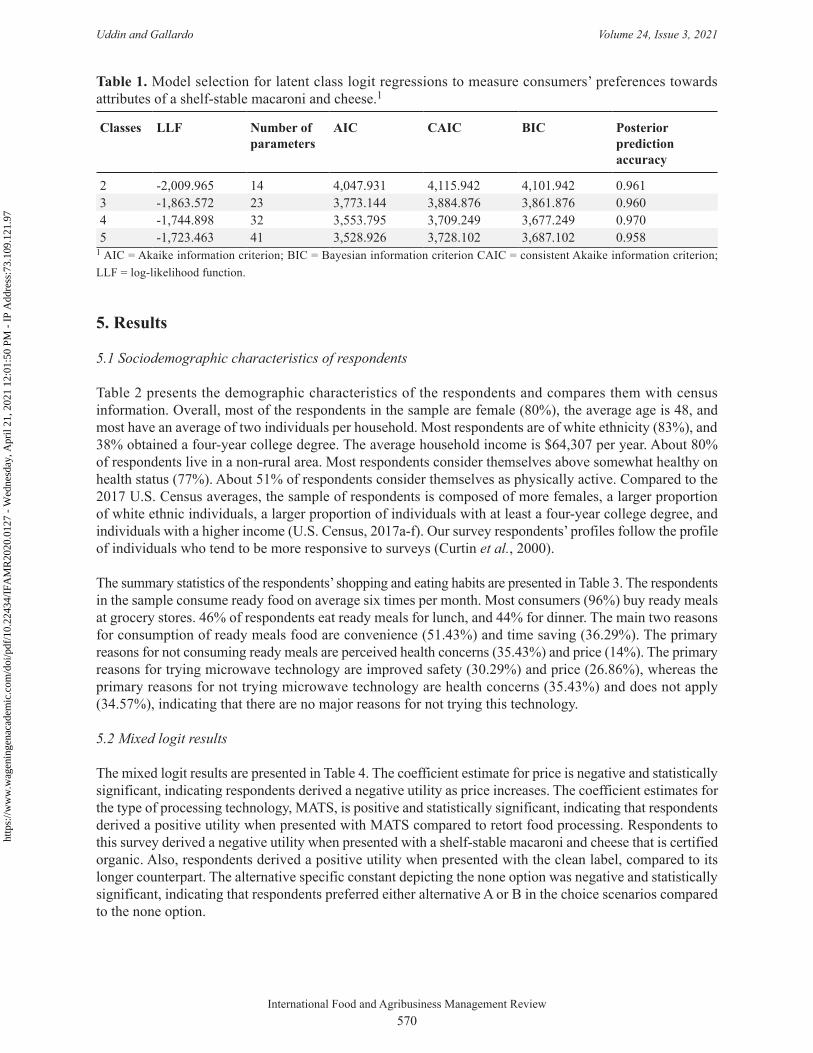
A latent class model is comprised of C classes, where consumers’ preferences differ across classes but remain homogeneous within a class (Boxall and Adamowicz, 2002). Different criteria are used to select the optimal number of classes. Practitioners usually analyze the measures of goodness of fit, such as the Akaike information criterion (AIC), consistent Akaike information criterion (CAIC), Bayesian information criterion (BIC); jointly with the examination of the posterior prediction accuracy distribution of each model. However, other criteria, such as the significance and interpretability of parameter estimates and sample size, are deemed important (Boxall and Adamowicz, 2002; Greene and Hensher, 2003; Pacifico and Yoo, 2012). The criteria to select the optimal number of classes are presented in Table 1. Following the measures of goodness of fit, the optimal number of classes would be four. However, considering the significance and interpretability of the parameter estimates, we opt for three classes.
The probability of individual n belonging to class c, choosing alternative i, is:
𝑃𝑃𝑃𝑃𝑛𝑛𝑛𝑛 = 𝐿𝐿𝑛𝑛𝑛𝑛(𝛽𝛽𝑛𝑛) =𝑒𝑒𝑒𝑒𝑒𝑒(𝛽𝛽𝑛𝑛𝑒𝑒𝑛𝑛𝑛𝑛)
∑ 𝑒𝑒𝑒𝑒𝑒𝑒(𝛽𝛽𝑛𝑛𝑒𝑒𝑛𝑛𝑛𝑛)𝑀𝑀𝑛𝑛=1
(2)
𝑃𝑃𝑃𝑃𝑛𝑛𝑛𝑛(𝜃𝜃) = ∫𝑃𝑃𝑃𝑃𝑛𝑛𝑛𝑛 𝑓𝑓(𝛽𝛽𝑛𝑛|𝜙𝜙)𝑑𝑑𝛽𝛽𝑛𝑛 (3)
𝑃𝑃𝑃𝑃𝑛𝑛 = ∏ ( 𝑒𝑒𝑒𝑒𝑒𝑒(𝛽𝛽𝑛𝑛𝑒𝑒𝑛𝑛𝑛𝑛)∑ 𝑒𝑒𝑒𝑒𝑒𝑒(𝛽𝛽𝑛𝑛𝑒𝑒𝑛𝑛𝑛𝑛)𝑀𝑀𝑛𝑛=1
)𝑦𝑦𝑛𝑛𝑛𝑛𝑀𝑀
𝑛𝑛=1 (4)
###→ �̂�𝛽
𝑙𝑙𝑙𝑙𝐿𝐿 = ∑ ∑ 𝑦𝑦𝑛𝑛𝑛𝑛𝑙𝑙𝑙𝑙(𝑃𝑃𝑃𝑃𝑛𝑛𝑛𝑛)𝑀𝑀𝑛𝑛=1
𝑁𝑁𝑛𝑛=1 (5)
𝑊𝑊𝑊𝑊𝑃𝑃𝑎𝑎𝑎𝑎𝑎𝑎𝑎𝑎𝑛𝑛𝑎𝑎𝑎𝑎𝑎𝑎𝑒𝑒 =−𝛽𝛽𝑛𝑛𝑎𝑎𝑎𝑎𝑎𝑎𝑎𝑎𝑛𝑛𝑎𝑎𝑎𝑎𝑎𝑎𝑎𝑎
𝛽𝛽𝑛𝑛𝑝𝑝𝑎𝑎𝑛𝑛𝑝𝑝𝑎𝑎(6)
𝑃𝑃𝑛𝑛(𝑐𝑐) = ∏ ( 𝑒𝑒𝑒𝑒𝑒𝑒(𝛽𝛽𝑝𝑝𝑒𝑒𝑛𝑛𝑛𝑛)∑ 𝑒𝑒𝑒𝑒𝑒𝑒(𝛽𝛽𝑝𝑝𝑒𝑒𝑛𝑛𝑛𝑛)𝑀𝑀𝑛𝑛=1
)𝑦𝑦𝑛𝑛𝑛𝑛𝐼𝐼
𝑛𝑛=1 (7)
𝜋𝜋𝑛𝑛𝑛𝑛(𝜃𝜃) = ( 𝑒𝑒𝑒𝑒𝑒𝑒(𝜃𝜃𝑝𝑝𝑧𝑧𝑛𝑛)1+∑ 𝑒𝑒𝑒𝑒𝑒𝑒(𝜃𝜃𝑞𝑞𝑧𝑧𝑛𝑛)𝐶𝐶−1
𝑞𝑞=1) (8)
(7)
where xni represents the vector of attributes, and βc represents the parameter estimates. πnc(θ) is the weight for class c which represents the population share for that class, and is modelled using a multinomial logit model as,
𝑃𝑃𝑃𝑃𝑛𝑛𝑛𝑛 = 𝐿𝐿𝑛𝑛𝑛𝑛(𝛽𝛽𝑛𝑛) =𝑒𝑒𝑒𝑒𝑒𝑒(𝛽𝛽𝑛𝑛𝑒𝑒𝑛𝑛𝑛𝑛)
∑ 𝑒𝑒𝑒𝑒𝑒𝑒(𝛽𝛽𝑛𝑛𝑒𝑒𝑛𝑛𝑛𝑛)𝑀𝑀𝑛𝑛=1
(2)
𝑃𝑃𝑃𝑃𝑛𝑛𝑛𝑛(𝜃𝜃) = ∫𝑃𝑃𝑃𝑃𝑛𝑛𝑛𝑛 𝑓𝑓(𝛽𝛽𝑛𝑛|𝜙𝜙)𝑑𝑑𝛽𝛽𝑛𝑛 (3)
𝑃𝑃𝑃𝑃𝑛𝑛 = ∏ ( 𝑒𝑒𝑒𝑒𝑒𝑒(𝛽𝛽𝑛𝑛𝑒𝑒𝑛𝑛𝑛𝑛)∑ 𝑒𝑒𝑒𝑒𝑒𝑒(𝛽𝛽𝑛𝑛𝑒𝑒𝑛𝑛𝑛𝑛)𝑀𝑀𝑛𝑛=1
)𝑦𝑦𝑛𝑛𝑛𝑛𝑀𝑀
𝑛𝑛=1 (4)
###→ �̂�𝛽
𝑙𝑙𝑙𝑙𝐿𝐿 = ∑ ∑ 𝑦𝑦𝑛𝑛𝑛𝑛𝑙𝑙𝑙𝑙(𝑃𝑃𝑃𝑃𝑛𝑛𝑛𝑛)𝑀𝑀𝑛𝑛=1
𝑁𝑁𝑛𝑛=1 (5)
𝑊𝑊𝑊𝑊𝑃𝑃𝑎𝑎𝑎𝑎𝑎𝑎𝑎𝑎𝑛𝑛𝑎𝑎𝑎𝑎𝑎𝑎𝑒𝑒 =−𝛽𝛽𝑛𝑛𝑎𝑎𝑎𝑎𝑎𝑎𝑎𝑎𝑛𝑛𝑎𝑎𝑎𝑎𝑎𝑎𝑎𝑎
𝛽𝛽𝑛𝑛𝑝𝑝𝑎𝑎𝑛𝑛𝑝𝑝𝑎𝑎(6)
𝑃𝑃𝑛𝑛(𝑐𝑐) = ∏ ( 𝑒𝑒𝑒𝑒𝑒𝑒(𝛽𝛽𝑝𝑝𝑒𝑒𝑛𝑛𝑛𝑛)∑ 𝑒𝑒𝑒𝑒𝑒𝑒(𝛽𝛽𝑝𝑝𝑒𝑒𝑛𝑛𝑛𝑛)𝑀𝑀𝑛𝑛=1
)𝑦𝑦𝑛𝑛𝑛𝑛𝐼𝐼
𝑛𝑛=1 (7)
𝜋𝜋𝑛𝑛𝑛𝑛(𝜃𝜃) = ( 𝑒𝑒𝑒𝑒𝑒𝑒(𝜃𝜃𝑝𝑝𝑧𝑧𝑛𝑛)1+∑ 𝑒𝑒𝑒𝑒𝑒𝑒(𝜃𝜃𝑞𝑞𝑧𝑧𝑛𝑛)𝐶𝐶−1
𝑞𝑞=1) (8)
(8)
where zn represents a vector of individual-specific characteristics and was specified using demographic variables and attitudes towards label-related variables, and θc are the parameters of the membership function, zn. The membership function also included how important given food labels are when buying food that included low sodium, no preservatives, and phytonutrient content (e.g. vitamins, antioxidants).
http
s://w
ww
.wag
enin
gena
cade
mic
.com
/doi
/10.
2243
4/IF
AM
R20
20.0
127
- W
edne
sday
, Apr
il 21
, 202
1 12
:01:
50 P
M -
IP
Add
ress
:73.
109.
121.
97
International Food and Agribusiness Management Review570
Uddin and Gallardo Volume 24, Issue 3, 2021
5. Results
5.1 Sociodemographic characteristics of respondents
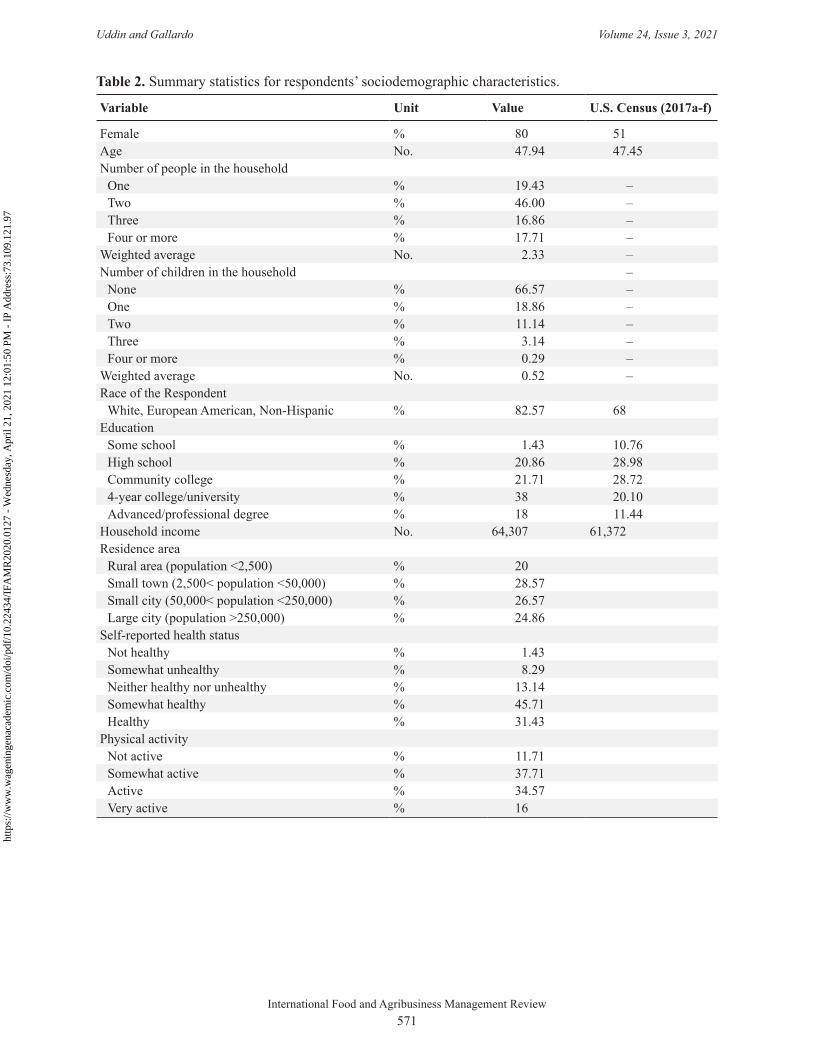
Table 2 presents the demographic characteristics of the respondents and compares them with census information. Overall, most of the respondents in the sample are female (80%), the average age is 48, and most have an average of two individuals per household. Most respondents are of white ethnicity (83%), and 38% obtained a four-year college degree. The average household income is $64,307 per year. About 80% of respondents live in a non-rural area. Most respondents consider themselves above somewhat healthy on health status (77%). About 51% of respondents consider themselves as physically active. Compared to the 2017 U.S. Census averages, the sample of respondents is composed of more females, a larger proportion of white ethnic individuals, a larger proportion of individuals with at least a four-year college degree, and individuals with a higher income (U.S. Census, 2017a-f). Our survey respondents’ profiles follow the profile of individuals who tend to be more responsive to surveys (Curtin et al., 2000).
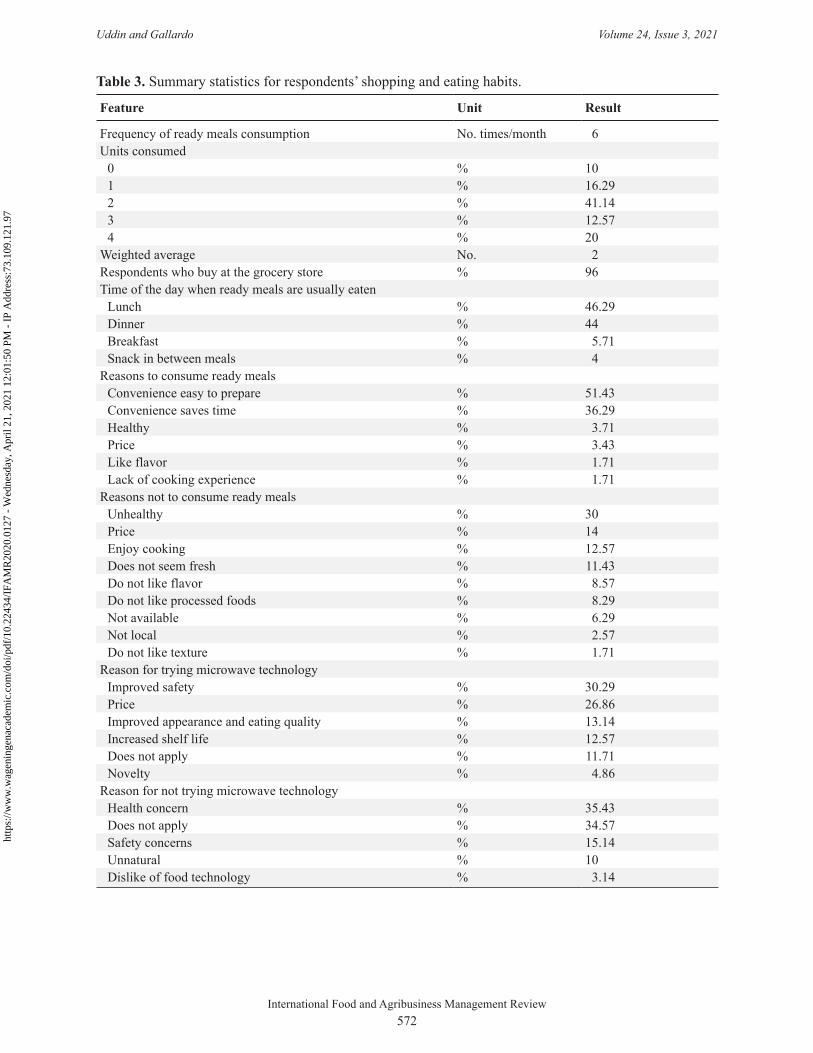
The summary statistics of the respondents’ shopping and eating habits are presented in Table 3. The respondents in the sample consume ready food on average six times per month. Most consumers (96%) buy ready meals at grocery stores. 46% of respondents eat ready meals for lunch, and 44% for dinner. The main two reasons for consumption of ready meals food are convenience (51.43%) and time saving (36.29%). The primary reasons for not consuming ready meals are perceived health concerns (35.43%) and price (14%). The primary reasons for trying microwave technology are improved safety (30.29%) and price (26.86%), whereas the primary reasons for not trying microwave technology are health concerns (35.43%) and does not apply (34.57%), indicating that there are no major reasons for not trying this technology.
5.2 Mixed logit results
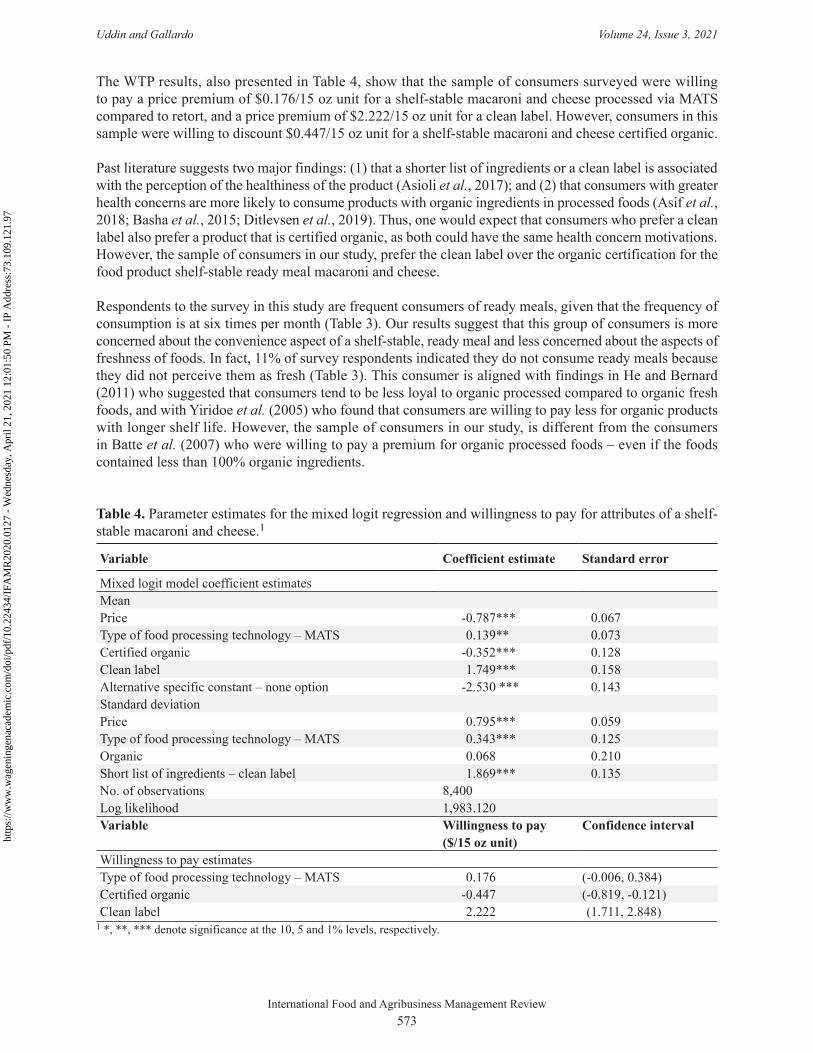
The mixed logit results are presented in Table 4. The coefficient estimate for price is negative and statistically significant, indicating respondents derived a negative utility as price increases. The coefficient estimates for the type of processing technology, MATS, is positive and statistically significant, indicating that respondents derived a positive utility when presented with MATS compared to retort food processing. Respondents to this survey derived a negative utility when presented with a shelf-stable macaroni and cheese that is certified organic. Also, respondents derived a positive utility when presented with the clean label, compared to its longer counterpart. The alternative specific constant depicting the none option was negative and statistically significant, indicating that respondents preferred either alternative A or B in the choice scenarios compared to the none option.
Table 1. Model selection for latent class logit regressions to measure consumers’ preferences towards attributes of a shelf-stable macaroni and cheese.1
Classes LLF Number of parameters
AIC CAIC BIC Posterior prediction accuracy
2 -2,009.965 14 4,047.931 4,115.942 4,101.942 0.9613 -1,863.572 23 3,773.144 3,884.876 3,861.876 0.9604 -1,744.898 32 3,553.795 3,709.249 3,677.249 0.9705 -1,723.463 41 3,528.926 3,728.102 3,687.102 0.958
1 AIC = Akaike information criterion; BIC = Bayesian information criterion CAIC = consistent Akaike information criterion; LLF = log-likelihood function.
http
s://w
ww
.wag
enin
gena
cade
mic
.com
/doi
/10.
2243
4/IF
AM
R20
20.0
127
- W
edne
sday
, Apr
il 21
, 202
1 12
:01:
50 P
M -
IP
Add
ress
:73.
109.
121.
97
International Food and Agribusiness Management Review571
Uddin and Gallardo Volume 24, Issue 3, 2021
Table 2. Summary statistics for respondents’ sociodemographic characteristics.
Variable Unit Value U.S. Census (2017a-f)
Female % 80 51Age No. 47.94 47.45Number of people in the household
One % 19.43 –Two % 46.00 –Three % 16.86 –Four or more % 17.71 –
Weighted average No. 2.33 –Number of children in the household –
None % 66.57 –One % 18.86 –Two % 11.14 –Three % 3.14 –Four or more % 0.29 –
Weighted average No. 0.52 –Race of the Respondent
White, European American, Non-Hispanic % 82.57 68Education
Some school % 1.43 10.76High school % 20.86 28.98Community college % 21.71 28.724-year college/university % 38 20.10Advanced/professional degree % 18 11.44
Household income No. 64,307 61,372Residence area
Rural area (population <2,500) % 20Small town (2,500< population <50,000) % 28.57Small city (50,000< population <250,000) % 26.57Large city (population >250,000) % 24.86
Self-reported health statusNot healthy % 1.43Somewhat unhealthy % 8.29Neither healthy nor unhealthy % 13.14Somewhat healthy % 45.71Healthy % 31.43
Physical activityNot active % 11.71Somewhat active % 37.71Active % 34.57Very active % 16
http
s://w
ww
.wag
enin
gena
cade
mic
.com
/doi
/10.
2243
4/IF
AM
R20
20.0
127
- W
edne
sday
, Apr
il 21
, 202
1 12
:01:
50 P
M -
IP
Add
ress
:73.
109.
121.
97
International Food and Agribusiness Management Review572
Uddin and Gallardo Volume 24, Issue 3, 2021
Table 3. Summary statistics for respondents’ shopping and eating habits.
Feature Unit Result
Frequency of ready meals consumption No. times/month 6Units consumed
0 % 101 % 16.292 % 41.143 % 12.574 % 20
Weighted average No. 2Respondents who buy at the grocery store % 96Time of the day when ready meals are usually eaten
Lunch % 46.29Dinner % 44Breakfast % 5.71Snack in between meals % 4
Reasons to consume ready mealsConvenience easy to prepare % 51.43Convenience saves time % 36.29Healthy % 3.71Price % 3.43Like flavor % 1.71Lack of cooking experience % 1.71
Reasons not to consume ready mealsUnhealthy % 30Price % 14Enjoy cooking % 12.57Does not seem fresh % 11.43Do not like flavor % 8.57Do not like processed foods % 8.29Not available % 6.29Not local % 2.57Do not like texture % 1.71
Reason for trying microwave technologyImproved safety % 30.29Price % 26.86Improved appearance and eating quality % 13.14Increased shelf life % 12.57Does not apply % 11.71Novelty % 4.86
Reason for not trying microwave technology Health concern % 35.43Does not apply % 34.57Safety concerns % 15.14Unnatural % 10Dislike of food technology % 3.14
http
s://w
ww
.wag
enin
gena
cade
mic
.com
/doi
/10.
2243
4/IF
AM
R20
20.0
127
- W
edne
sday
, Apr
il 21
, 202
1 12
:01:
50 P
M -
IP
Add
ress
:73.
109.
121.
97
International Food and Agribusiness Management Review573
Uddin and Gallardo Volume 24, Issue 3, 2021
The WTP results, also presented in Table 4, show that the sample of consumers surveyed were willing to pay a price premium of $0.176/15 oz unit for a shelf-stable macaroni and cheese processed via MATS compared to retort, and a price premium of $2.222/15 oz unit for a clean label. However, consumers in this sample were willing to discount $0.447/15 oz unit for a shelf-stable macaroni and cheese certified organic.
Past literature suggests two major findings: (1) that a shorter list of ingredients or a clean label is associated with the perception of the healthiness of the product (Asioli et al., 2017); and (2) that consumers with greater health concerns are more likely to consume products with organic ingredients in processed foods (Asif et al., 2018; Basha et al., 2015; Ditlevsen et al., 2019). Thus, one would expect that consumers who prefer a clean label also prefer a product that is certified organic, as both could have the same health concern motivations. However, the sample of consumers in our study, prefer the clean label over the organic certification for the food product shelf-stable ready meal macaroni and cheese.
Respondents to the survey in this study are frequent consumers of ready meals, given that the frequency of consumption is at six times per month (Table 3). Our results suggest that this group of consumers is more concerned about the convenience aspect of a shelf-stable, ready meal and less concerned about the aspects of freshness of foods. In fact, 11% of survey respondents indicated they do not consume ready meals because they did not perceive them as fresh (Table 3). This consumer is aligned with findings in He and Bernard (2011) who suggested that consumers tend to be less loyal to organic processed compared to organic fresh foods, and with Yiridoe et al. (2005) who found that consumers are willing to pay less for organic products with longer shelf life. However, the sample of consumers in our study, is different from the consumers in Batte et al. (2007) who were willing to pay a premium for organic processed foods – even if the foods contained less than 100% organic ingredients.
Table 4. Parameter estimates for the mixed logit regression and willingness to pay for attributes of a shelf-stable macaroni and cheese.1
Variable Coefficient estimate Standard error
Mixed logit model coefficient estimatesMeanPrice -0.787*** 0.067Type of food processing technology – MATS 0.139** 0.073Certified organic -0.352*** 0.128Clean label 1.749*** 0.158Alternative specific constant – none option -2.530 *** 0.143Standard deviationPrice 0.795*** 0.059Type of food processing technology – MATS 0.343*** 0.125Organic 0.068 0.210Short list of ingredients – clean label 1.869*** 0.135No. of observations 8,400Log likelihood 1,983.120Variable Willingness to pay
($/15 oz unit)Confidence interval
Willingness to pay estimatesType of food processing technology – MATS 0.176 (-0.006, 0.384)Certified organic -0.447 (-0.819, -0.121)Clean label 2.222 (1.711, 2.848)
1 *, **, *** denote significance at the 10, 5 and 1% levels, respectively.
http
s://w
ww
.wag
enin
gena
cade
mic
.com
/doi
/10.
2243
4/IF
AM
R20
20.0
127
- W
edne
sday
, Apr
il 21
, 202
1 12
:01:
50 P
M -
IP
Add
ress
:73.
109.
121.
97
International Food and Agribusiness Management Review574
Uddin and Gallardo Volume 24, Issue 3, 2021
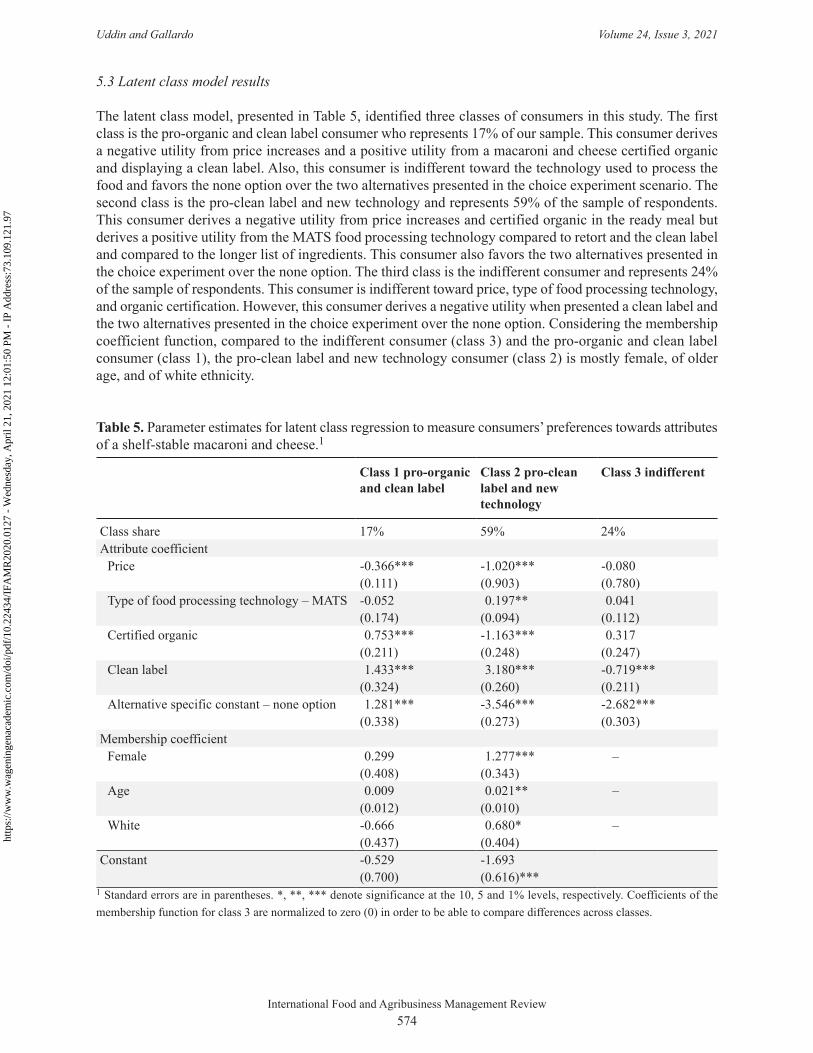
5.3 Latent class model results
The latent class model, presented in Table 5, identified three classes of consumers in this study. The first class is the pro-organic and clean label consumer who represents 17% of our sample. This consumer derives a negative utility from price increases and a positive utility from a macaroni and cheese certified organic and displaying a clean label. Also, this consumer is indifferent toward the technology used to process the food and favors the none option over the two alternatives presented in the choice experiment scenario. The second class is the pro-clean label and new technology and represents 59% of the sample of respondents. This consumer derives a negative utility from price increases and certified organic in the ready meal but derives a positive utility from the MATS food processing technology compared to retort and the clean label and compared to the longer list of ingredients. This consumer also favors the two alternatives presented in the choice experiment over the none option. The third class is the indifferent consumer and represents 24% of the sample of respondents. This consumer is indifferent toward price, type of food processing technology, and organic certification. However, this consumer derives a negative utility when presented a clean label and the two alternatives presented in the choice experiment over the none option. Considering the membership coefficient function, compared to the indifferent consumer (class 3) and the pro-organic and clean label consumer (class 1), the pro-clean label and new technology consumer (class 2) is mostly female, of older age, and of white ethnicity.
Table 5. Parameter estimates for latent class regression to measure consumers’ preferences towards attributes of a shelf-stable macaroni and cheese.1
Class 1 pro-organic and clean label
Class 2 pro-clean label and new technology
Class 3 indifferent
Class share 17% 59% 24%Attribute coefficient
Price -0.366***(0.111)
-1.020***(0.903)
-0.080(0.780)
Type of food processing technology – MATS -0.052(0.174)
0.197**(0.094)
0.041(0.112)
Certified organic 0.753***(0.211)
-1.163***(0.248)
0.317(0.247)
Clean label 1.433***(0.324)
3.180***(0.260)
-0.719***(0.211)
Alternative specific constant – none option 1.281***(0.338)
-3.546***(0.273)
-2.682***(0.303)
Membership coefficientFemale 0.299
(0.408)1.277***
(0.343)–
Age 0.009(0.012)
0.021**(0.010)
–
White -0.666(0.437)
0.680*(0.404)
–
Constant -0.529(0.700)
-1.693(0.616)***
1 Standard errors are in parentheses. *, **, *** denote significance at the 10, 5 and 1% levels, respectively. Coefficients of the membership function for class 3 are normalized to zero (0) in order to be able to compare differences across classes.
http
s://w
ww
.wag
enin
gena
cade
mic
.com
/doi
/10.
2243
4/IF
AM
R20
20.0
127
- W
edne
sday
, Apr
il 21
, 202
1 12
:01:
50 P
M -
IP
Add
ress
:73.
109.
121.
97
International Food and Agribusiness Management Review575
Uddin and Gallardo Volume 24, Issue 3, 2021
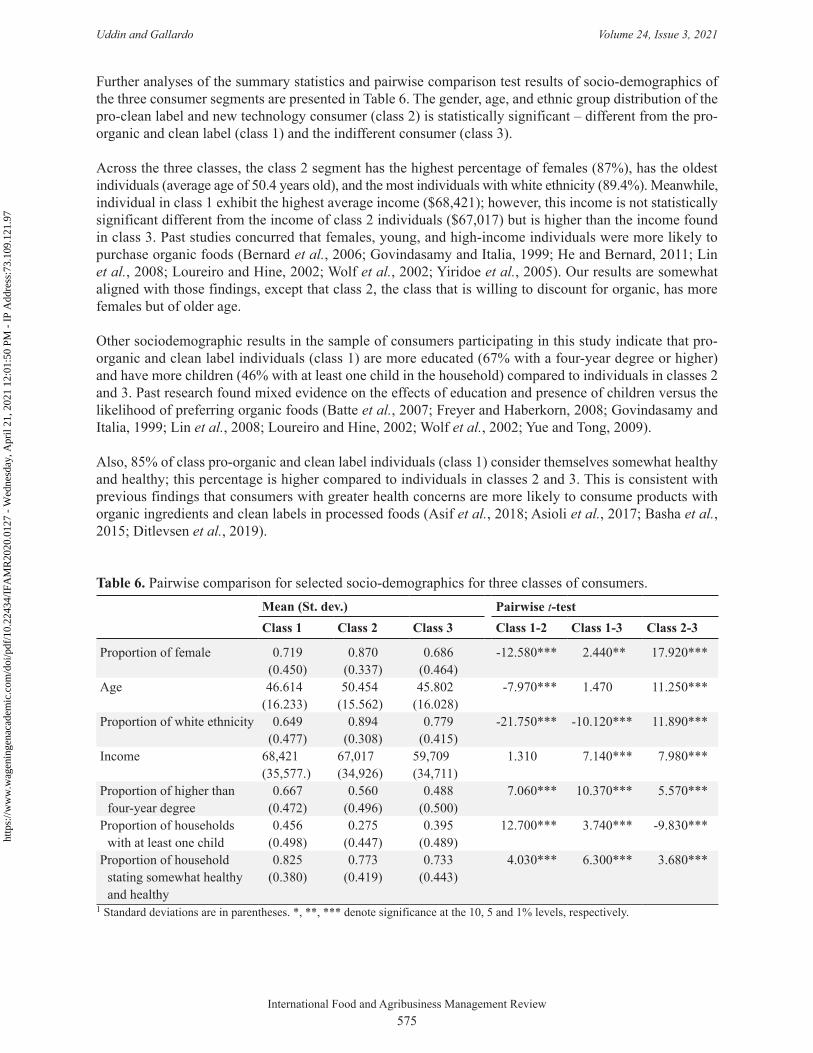
Further analyses of the summary statistics and pairwise comparison test results of socio-demographics of the three consumer segments are presented in Table 6. The gender, age, and ethnic group distribution of the pro-clean label and new technology consumer (class 2) is statistically significant – different from the pro-organic and clean label (class 1) and the indifferent consumer (class 3).
Across the three classes, the class 2 segment has the highest percentage of females (87%), has the oldest individuals (average age of 50.4 years old), and the most individuals with white ethnicity (89.4%). Meanwhile, individual in class 1 exhibit the highest average income ($68,421); however, this income is not statistically significant different from the income of class 2 individuals ($67,017) but is higher than the income found in class 3. Past studies concurred that females, young, and high-income individuals were more likely to purchase organic foods (Bernard et al., 2006; Govindasamy and Italia, 1999; He and Bernard, 2011; Lin et al., 2008; Loureiro and Hine, 2002; Wolf et al., 2002; Yiridoe et al., 2005). Our results are somewhat aligned with those findings, except that class 2, the class that is willing to discount for organic, has more females but of older age.
Other sociodemographic results in the sample of consumers participating in this study indicate that pro-organic and clean label individuals (class 1) are more educated (67% with a four-year degree or higher) and have more children (46% with at least one child in the household) compared to individuals in classes 2 and 3. Past research found mixed evidence on the effects of education and presence of children versus the likelihood of preferring organic foods (Batte et al., 2007; Freyer and Haberkorn, 2008; Govindasamy and Italia, 1999; Lin et al., 2008; Loureiro and Hine, 2002; Wolf et al., 2002; Yue and Tong, 2009).
Also, 85% of class pro-organic and clean label individuals (class 1) consider themselves somewhat healthy and healthy; this percentage is higher compared to individuals in classes 2 and 3. This is consistent with previous findings that consumers with greater health concerns are more likely to consume products with organic ingredients and clean labels in processed foods (Asif et al., 2018; Asioli et al., 2017; Basha et al., 2015; Ditlevsen et al., 2019).
Table 6. Pairwise comparison for selected socio-demographics for three classes of consumers.Mean (St. dev.) Pairwise t-testClass 1 Class 2 Class 3 Class 1-2 Class 1-3 Class 2-3
Proportion of female 0.719(0.450)
0.870(0.337)
0.686(0.464)
-12.580*** 2.440** 17.920***
Age 46.614(16.233)
50.454(15.562)
45.802(16.028)
-7.970*** 1.470 11.250***
Proportion of white ethnicity 0.649(0.477)
0.894(0.308)
0.779(0.415)
-21.750*** -10.120*** 11.890***
Income 68,421(35,577.)
67,017(34,926)
59,709(34,711)
1.310 7.140*** 7.980***
Proportion of higher than four-year degree
0.667(0.472)
0.560(0.496)
0.488(0.500)
7.060*** 10.370*** 5.570***
Proportion of households with at least one child
0.456(0.498)
0.275(0.447)
0.395(0.489)
12.700*** 3.740*** -9.830***
Proportion of household stating somewhat healthy and healthy
0.825(0.380)
0.773(0.419)
0.733(0.443)
4.030*** 6.300*** 3.680***
1 Standard deviations are in parentheses. *, **, *** denote significance at the 10, 5 and 1% levels, respectively.
http
s://w
ww
.wag
enin
gena
cade
mic
.com
/doi
/10.
2243
4/IF
AM
R20
20.0
127
- W
edne
sday
, Apr
il 21
, 202
1 12
:01:
50 P
M -
IP
Add
ress
:73.
109.
121.
97
International Food and Agribusiness Management Review576
Uddin and Gallardo Volume 24, Issue 3, 2021
6. Conclusions
Consumers are increasingly demanding foods that have been processed in a healthy manner. However, the processing of convenience foods is not possible to achieve with current food technologies. In light of this situation, this study estimates consumers’ willingness to pay for the attributes organic, clean label and processed with a new food technology in a ready meal. Moreover, we conducted a latent class segmentation analysis to infer if consumers in this study, are homogeneous in their preferences towards the aforementioned attributes of a processed food. This study is poised to be the first to include the clean label and organic features, along with a new food processing technology, when analyzing preferences for a processed food.
One would expect that the motivation to prefer a clean label and organic certification stems from the same core preference, that is, the preference for a healthy food option. In other words, consumers who prefer a processed food exhibiting a clean label would also prefer a processed food that is certified organic. However, the findings in this study suggest that consumers who frequently purchase ready meals, prefer a clean label over an organic certification. This indicates that consumers of this type of food products, when thinking of a healthy food choice, relate a clean label rather than organic to the idea of healthiness. Another interesting implication is that this type of consumer distinguishes the concept of organic from the implications of a shorter list of ingredients. This finding contrasts with past studies that suggest consumers often confuse organic with the idea of free of chemicals, locally produced, or environmentally sustainable (Campbell et al., 2013, 2014).
A latent class analysis identified three classes of consumers within our sample of respondents, the pro-organic and clean label consumer, the pro-clean label and new technology, and the indifferent consumer. The different segments showed different preferences towards the organic attribution, which emphasizes the need to complement the consumer preference assessment with a segmentation analysis. Results from the sociodemographic profile of consumers preferring clean labels and organic processed products, are product and context specific. For example, previous literature suggests that females, the young, and high-income individuals are likely to purchase organic (Bernard et al., 2006; Govindasamy and Italia, 1999; He and Bernard, 2011; Lin et al., 2008; Loureiro and Hine, 2002; Wolf et al., 2002; Yiridoe et al., 2005). Whereas the results from this study, suggest that those in the category older and those in the category female are not willing to purchase organic; however, these two categories are frequent consumers of convenience ready meals.
Agri-food companies face the challenge that clean labels and organic are not possible for some processed foods – such as shelf-stable ready meals – with existing processing technologies. Therefore, our findings highlight the importance of technological innovations to successfully meet this challenge. Considering that consumers are often reluctant to accept new food processing technologies, such aversion can be mitigated if improvements resulting from the new technology are explicitly communicated and if the consumers have some level of familiarity with the new technology. To avoid consumers perceiving new food technologies as risky due to unfamiliarity, they should be presented with all information about the new technology to reduce information asymmetries and potential neophobias.
Acknowledgements
This work was funded by the USDA National Institute of Food and Agriculture, Agriculture and Food Research Initiative project: Center of Excellence for Food Safety Using Microwave Energy. Project Number 2016-68003-24840.
http
s://w
ww
.wag
enin
gena
cade
mic
.com
/doi
/10.
2243
4/IF
AM
R20
20.0
127
- W
edne
sday
, Apr
il 21
, 202
1 12
:01:
50 P
M -
IP
Add
ress
:73.
109.
121.
97
International Food and Agribusiness Management Review577
Uddin and Gallardo Volume 24, Issue 3, 2021
References
Abouab, N. and P. Gomez. 2015. Human contact imagined during the production process increases food naturalness perceptions. Appetite 91(1): 273-277. https://doi.org/10.1016/j.appet.2015.04.002
Aertsens, J., W. Verbeke, K. Mondelaers and G. Van Huylenbroeck. 2009. Personal determinants of organic food consumption: a review. British Food Journal 111(1): 1140-1167. https://doi.org/10.1108/00070700910992961
Aktar, W., D. Sengupta and A. Chowdhury. 2009. Impact of pesticide use in agriculture: their benefits and hazards. Interdisciplinary Toxicology 2(1): 1-12. https://doi.org/10.2478/v10102-009-0001-7
Amani, P. and L.E. Gadde. 2015. Shelf life extension and food waste reduction. International European Forum on System Dynamics and Innovation in Food Networks, 144th EAAE Seminar. February 9-13, 2015. Innsbruck-Igls, Austria.
Asif, M., W. Xuhui, A. Nasiri and S. Ayyub. 2018. Determinant factors influencing organic food purchase intention and the moderating role of awareness: a comparative analysis. Food Quality and Preference 68(1): 144-150. https://doi.org/10.1016/j.foodqual.2017.08.006
Asioli, D., J. Aschemann-Witzel, V. Caputo, R. Vecchio, A. Annunziata, T. Naes and P. Varela. 2017. Making sense of the ‘clean label’ trends: a review of consumer food choice behavior and discussion of industry implications. Food Research International 99: 58-71. https://doi.org/10.1016/j.foodres.2017.07.022
Barnett, S.M., S.S. Sablani, J. Tang and C.F. Ross. 2019. Utilizing herbs and microwave assisted thermal sterilization to enhance saltiness perception in a chicken pasta meal. Journal of Food Science 84(8): 2313-2324. https://doi.org/10.1111/1750-3841.14736
Basha, M.B., C. Mason, M.F. Shamshudin, H.I. Hussain and M.A. Salem. 2015. Consumers attitude towards organic food. Procedia Economics and Finance 31(1): 444-452. https://doi.org/10.1016/S2212-5671(15)01219-8
Batte, M.T., N.H. Hooker, T.C. Haab and J. Beaverson. 2007. Putting their money where their mouths are: consumer willingness to pay to multi-ingredient, processed organic food products. Food Policy 32: 145-159. https://doi.org/10.1016/j.foodpol.2006.05.003
Bernard, J.C., C. Zhang and K. Gifford. 2006. An experimental investigation of consumer willingness to pay for non-GM foods when an organic option is present. Agricultural and Resource Economics Review 35(2): 374-385. https://doi.org/10.22004/ag.econ.10226
Boxall, P.C. and W.L. Adamowicz. 2002. Understanding heterogeneous preferences in random utility models: a latent class approach. Environmental and Resource Economics 23: 421-446. https://doi.org/10.1023/A:1021351721619
Bredahl, L. 1999. Consumers cognitions with regard to genetically modified foods. Results of a qualitative study in four countries. Appetite 33(3): 343-360. https://doi.org/10.1006/appe.1999.0267
Busken, D.F. 2013. Cleaning it up – what is a ‘clean label’ ingredient? Cereal Foods World 60: 112-113. https://doi.org/10.1094/CFW-60-2-0112
Campbell, B., H. Khachatryan, B. Behe, J. Dennis and C. Hall. 2014. U.S. and Canadian consumer perception of local and organic terminology. International Food and Agribusiness Management Review 17(2): 21-40. https://doi.org/10.22004/ag.econ.167903
Campbell, B., S. Mhlanga and I. Lesschaeve. 2013. Perception versus reality: Canadian consumer views of local and organic. Canadian Journal of Agricultural Economics 61(4): 531-558. https://doi.org/10.1111/j.1744-7976.2012.01267.x
Cardello, A.V. 2003. Consumer concerns and expectations about novel food processing technologies: effects on product liking. Appetite 40(3): 217-233. https://doi.org/10.1016/S0195-6663(03)00008-4
Cavaliere, A. and V. Ventura. 2018. Mismatch between food sustainability and consumer acceptance toward innovation technologies among millennial students: the case of shelf life extension. Journal of Cleaner Production 175(1): 641-650. https://doi.org/10.1016/j.jclepro.2017.12.087
Cook, N.R., J.A. Cutler, E. Obarzanek, J.E. Buring, K.M. Rexrode, S.K. Kumanyika and P.K. Whelton. 2007. Long term effects of dietary sodium reduction on cardiovascular disease outcomes: observational follow-up of the trials of hypertension prevention (TOPH). BMJ 334(7599): 885-885. https://doi.org/10.1136/bmj.39147.604896.55
http
s://w
ww
.wag
enin
gena
cade
mic
.com
/doi
/10.
2243
4/IF
AM
R20
20.0
127
- W
edne
sday
, Apr
il 21
, 202
1 12
:01:
50 P
M -
IP
Add
ress
:73.
109.
121.
97
International Food and Agribusiness Management Review578
Uddin and Gallardo Volume 24, Issue 3, 2021
Cox, D.N. and G. Evans. 2008. Construction and validation of a psychometric scale to measure consumers’ fears of novel food technologies: the food technology neophobia scale. Food Quality and Preference 19(8): 704-710. https://doi.org/10.1016/j.foodqual.2008.04.005
Curtin, R., S. Presser and E. Singer. 2000. The effects of response rate changes on the index of consumer sentiment. Public Opinion Quarterly 64: 413-428. https://doi.org/10.1086/318638
Dickson-Spillman, M., M. Siegrist and C. Keller. 2011. Development and validation of a short, consumer-oriented nutrition knowledge questionnaire. Appetite 56(3): 617-620. https://doi.org/10.1016/j.appet.2011.01.034
Ditlevsen, K., P. Sandøe and J. Lassen. 2019. Healthy food is nutritious, but organic food is healthy because it is pure: the negotiation of healthy food choices by Danish consumers of organic food. Food Quality and Preference 71(1): 46-53. https://doi.org/10.1016/j.foodqual.2018.06.001
Edwards, A. 2013. Natural & clean label trends. Ingredion, Manchester, UK. Evans, G., B. de Challemaison and D.N. Cox. 2010. Consumers’ ratings of the natural and unnatural qualities
of food. Appetite 54(3): 557-563. https://doi.org/10.1016/j.appet.2010.02.014Freyer, B. and A. Haberkorn. 2008. Influence of young children (3-6 years) on organic food consumption in
their families. At cultivating the future based on science: 2nd Conference of the International Society of Organic Agriculture Research ISOFAR. June 18-20, 2008. Modena, Italy.
Funk, C. and B. Kennedy. 2016. The new food fights: U.S. public divides over food science. Pew Research Center, Washington, DC, USA.
Giese, J. 1992. Advances in microwave food processing. Food Technology 46(9): 118-123.Govindasamy, R. and J. Italia. 1999. Predicting willingness-to-pay for organically grown fresh produce.
Journal of Food Distribution Research 30(2): 1-10. https://doi.org/10.22004/ag.econ.27385Greene, W.H. and D.A. Hensher. 2003. A latent class model for discrete choice analysis: contrasts with mixed
logit. Transportation Research Part B 37: 681-698. https://doi.org/10.1016/S0191-2615(02)00046-2Hartman Group. 1996. The Hartman Report: food and the environment, a consumer’s perspective, phase 1.
Hartman Group, Bellevue, WA, USA, 60 pp.Hartman Group. 1997. The Hartman Report: food and the environment, a consumer’s perspective, phase 2.
Hartman Group, Bellevue, WA, USA, 64 pp.Hartman Group. 2018. The ‘clean label’ trend: when food companies say, ‘clean label’, here’s what consumers
understand. Infographic. Hartman Group, Bellevue, WA, USA. Available at: https://www.hartman-group.com/infographics/1859150243/the-clean-label-trend-when-food-companies-say-clean-label-here-s-what-consumers-understand
He, N. and J.C. Bernard. 2011. Differences in WTP and consumer demand for organic and non-GM fresh and processed foods. Agricultural and Resource Economics Review 40(2): 218-232. https://doi.org/10.1017/S1068280500008029
Huang, C.L. 1996. Consumer preference and attitudes toward organically grown produce. European Review of Agricultural Economics 23(3): 331-342. https://doi.org/10.1093/erae/23.3.331
Hwang, Y.J., B.E. Roe and M.F. Teisl. 2005. An empirical analysis of United States consumers’ concerns about eight food production and processing technologies. Agricultural and Applied Economics Association Annual Meeting. July 24-27, 2005. Providence, RI, USA.
Ingredion. 2014. The ‘clean label’ guide to Europe. Ingredion, Manchester, UK. Available at: http://www.alimentatec.com/wp-content/uploads/2014/10/The-Clean-Label-Guide-To-Europe.pdf
Juhl, H.J., M.H.J. Fenger and J. Thogersen. 2017. Will the consistent organic food consumer step forward? An empirical analysis. Journal of Consumer Research 44: 519-535. https://doi.org/10.1093/jcr/ucx052
Kiesel, K., D. Buschena and V. Smith. 2005. Do voluntary biotechnology labels matter to the consumer? Evidence from the fluid milk market. American Journal of Agricultural Economics 87(2): 378-392. https://doi.org/10.1111/j.1467-8276.2005.00729.x
Lancaster, K.J. 1966. A new approach to consumer theory. The Journal of Political Economy 74(2): 1132-157. https://doi.org/10.1007/978-3-642-51565-1_34
Lin, B.H., T.A. Smith and C.L. Huang. 2008. Organic premiums of U.S. fresh produce. Renewable Agriculture and Food Systems 23(3): 208-216. https://doi.org/10.1017/S1742170508002238
http
s://w
ww
.wag
enin
gena
cade
mic
.com
/doi
/10.
2243
4/IF
AM
R20
20.0
127
- W
edne
sday
, Apr
il 21
, 202
1 12
:01:
50 P
M -
IP
Add
ress
:73.
109.
121.
97
International Food and Agribusiness Management Review579
Uddin and Gallardo Volume 24, Issue 3, 2021
Loureiro, M.L. and S. Hine. 2002. Discovering niche markets: a comparison of consumer willingness to pay for local (Colorado grown), organic, and GMO-free products. Journal of Agricultural and Applied Economics 34(3): 477-487. https://doi.org/10.22004/ag.econ.20630
Loureiro, M.L., J. McCluskey and R.C. Mittelhammer. 2001. Assessing consumer response to organic, ecolabel, and regular apples. Journal of Agricultural and Resource Economics 26(2): 404-416. https://doi.org/10.22004/ag.econ.31039
McFadden, D. 1974. Conditional logit analysis of qualitative choice behavior. In: P. Zarembka (ed.) Frontiers in econometrics. Academic Press, New York, NY, USA, pp. 105-142.
Moscato, E.M. and J.E. Machin. 2018. Mother natural: motivations and associations for consuming natural foods. Appetite 121(1): 18-28. https://doi.org/10.1016/j.appet.2017.10.031
Pacifico, D. and H.I. Yoo. 2012. A Stata module for estimating latent class conditional logit models via the expectation maximization algorithm. Australian School of Business Research Paper, University of New South Wales, Sydney, Australia.
Peterson, H.H. and X. Li. 2011. Consumer preferences for product origin and processing scale: the case of organic baby foods. American Journal of Agricultural Economics 93(2): 590-596. https://doi.org/10.1093/ajae/aaq153
Pollan, M. 2008. In defense of food: an eater’s manifesto. Penguin Press, New York, NY, USA.Ronteltap, A., J.C.M. Van Trijp, R.J. Renes and L.J. Frewer. 2007. Consumer acceptance of technology-
based food innovations: lessons for the future of nutrigenomics. Appetite 49(1): 1-17. https://doi.org/10.1016/j.appet.2007.02.002
Rozin, P., M. Spranca, Z. Krieger, R. Neuhaus, D. Surillo, A. Swerdin and K. Wood. 2004. Preference for natural: instrumental and ideational/moral motivations, and the contrast between foods and medicines. Appetite 43(2): 147-154. https://doi.org/10.1016/j.appet.2004.03.005
Tang, J. 2015. Unlocking potentials of microwaves for food safety and quality. Journal of Food Science 80(8): 1776-1793. https://doi.org/10.1111/1750-3841.12959
Train, K. 2009. Discrete choice methods with simulation. Cambridge University Press, Cambridge, UK, 334 pp.U.S. Census Bureau. 2017a. Hispanic or Latino origin by race American community survey 1-year estimates.
American Community Survey Office, Washington, DC, USA.U.S. Census Bureau. 2017b. Age and sex 2017 American community survey 1-year estimates. American
Community Survey Office, Washington, DC, USA.U.S. Census Bureau. 2017c. Educational attainment 2017 American community survey 1-year estimates.
American Community Survey Office, Washington, DC, USA.U.S. Census Bureau. 2017d. Employment status American community survey 1-year estimates. American
Community Survey Office, Washington, DC, USA.U.S. Census Bureau. 2017e. S1901.Income in the past 12 months American community survey 1-year
estimates. U.S. Census Bureau’s American Community Survey Office, Washington, DC, USA.U.S. Census Bureau. 2017f. Selected economic characteristics for the noninstitutionalized population by
disability status American community survey 1-year estimates. American Community Survey Office, Washington, DC, USA.
Wolf, M.M., J. Bradey, C. Kerry and H. Lynn. 2002. Consumer attitudes toward organically grown lettuce. Journal of Food Distribution Research 33(1): 155-160. https://doi.org/10.22004/ag.econ.27628
Yiridoe, E.K., S. Bonti-Ankomah and R.C. Martin. 2005. Comparison of consumer perceptions and preference toward organic versus conventionally produced foods: a review and update of the literature. Renewable Agriculture and Food Systems 20(4): 193-205. https://doi.org/10.1079/RAF2005113
Yue, C. and C. Tong. 2009. Organic or local? Investigating consumer preference for fresh produce using a choice experiment with real economic incentives. HortScience 44(2): 366-371. https://doi.org/10.21273/HORTSCI.44.2.366
http
s://w
ww
.wag
enin
gena
cade
mic
.com
/doi
/10.
2243
4/IF
AM
R20
20.0
127
- W
edne
sday
, Apr
il 21
, 202
1 12
:01:
50 P
M -
IP
Add
ress
:73.
109.
121.
97

http
s://w
ww
.wag
enin
gena
cade
mic
.com
/doi
/10.
2243
4/IF
AM
R20
20.0
127
- W
edne
sday
, Apr
il 21
, 202
1 12
:01:
50 P
M -
IP
Add
ress
:73.
109.
121.
97