Embed Size (px)
Citation preview

www.masoncom.com
Contact Centres: Improving Performance and managing costs
Presented by: Vivin AcharyaPublic Sector Forum 26th May 2004

-2-Catalyst-gov.PPT
© Copyright 2002 - Mason Group Ltd
A couple of quotes.. something to remember…remember Gordon Ramsey,having a customer focus….
• “Don’t let your mistakes leave the kitchen”
– They cause unnecessary customer interactions… Measure what matters..
• “Its like a finger pointing to the moon, don’t concentrate on the finger or you will miss the heavenly glory” Bruce Lee.
– KPIs sometimes mean nothing…gauging the experience counts

-3-Catalyst-gov.PPT
© Copyright 2002 - Mason Group Ltd
Key learnings for you from Mr. Ramsey
Whatever part of the Journey you are in, base line the services you provide as a pre cursor for change
You need to clarify how the customer drivers impact on specific processes, Customer experience is king, but expectations need to be managed!
You need Staff and Organisational Development in a new customer focused organisation- empowerment, skills, training and change management- Invest to save!
Evaluate the existing processes- to provide insights into where processes can be segregated, prioritise these as there are many!
Don’t be embarrassed to go for quick wins, from small acorns…
Establish current service levels! You have something to evaluate for return on investment purposes and can then justify your actions..
Ditch complex KPI portfolios – use the ones that matter!

-4-Catalyst-gov.PPT
© Copyright 2002 - Mason Group Ltd
Key Issues: Public Access and Interaction Management
• Improve customer focus & be inclusive• Fulfil or resolve enquiries at first point of contact• Realise Cultural Change throughout the organisation• Provide easy access services and information for the
whole community that is– Rapid– Accurate– Consistent
• Empower front office staff via knowledge transfer• Continuous improvement of service levels year-on-
year on baseline• Improve customer satisfaction put citizens and
customers first• Assure investment in quality systems and processes
end-to-end• Empowering staff and users with knowledge and
resources• Having the right partner to support you throughout.
Key drivers for Public Sector Interaction Management Programmes:

www.masoncom.com
Managing costs-where do we start
-6-Catalyst-gov.PPT
© Copyright 2002 - Mason Group Ltd
Lets start at Set Up Costs
30%
25%22%
10%8% 5%
Software and system integration
Telephone switch
Process mapping and projectmanagement
Accommodation fit out
Hardware
Staff recruitment and training
Don’t spend Prematurely here
Leverage legacy to the hiltInvest here, However review theValue of detail BPR

-7-Catalyst-gov.PPT
© Copyright 2002 - Mason Group Ltd
Running Costs
60%
6%6%
13%
11% 4%
Staff
Software maintenanceand support
Office expenses
Accommodation
Recharges fromsupport functions
Asset Rental
Clearly staff costs are a point of focus, this doesn’t mean job losses necessarily
Use professionalContract negotiation here Invest to save:
•Empower &Train•Develop•Retain•Optimise
www.masoncom.com
Performance Optimisation

-9-Catalyst-gov.PPT
© Copyright 2002 - Mason Group Ltd
Where do we start…Baseline and Benchmark
ComparativeComparativeBenchmarkingBenchmarking
OperationalOperationalBenchmarkingBenchmarking
Performance Performance ImprovementImprovement
ComparativeComparativeBenchmarkingBenchmarking
OperationalOperationalBenchmarkingBenchmarking
Performance Performance ImprovementImprovement
Oxford CC Footprint (Registration)
0
0.5
1
1.5
2Lower Manager / Agent Ratio
High Level Of Training
More Products Per Agent
Larger Number Of Paid Leave Days
Higher Than Average Salary
Extensive Opening Hours
Lots Of Standard Technology Used
Lots Of Advanced Technology UsedLower Agent Turnover
Shorter Call Duration
Better % Calls Ans In Time Target
Better Actual % Calls Ans In Time
Better % Calls Abandoned Target
Better Actual % Calls Abandoned
Lower Admin / Agent Ratio
Lower Agent Absenteeism
Industry Ave
Registration

-10-Catalyst-gov.PPT
© Copyright 2002 - Mason Group Ltd
Framework for Optimisation
Overall Performance Optimisation
Efficiency(in use of resource)
Effectiveness(outcomes)
Reduce Workload
Maximise Productivity
Maximise Organisational
Capacity
AccurateResource Planning
& Management
GreaterCustomer
Focus
People Levers Process Levers Technology Levers
Strategic Management Enablers

-11-Catalyst-gov.PPT
© Copyright 2002 - Mason Group Ltd
There are four main mechanisms for contact centre optimisation…easy?
Service andEfficiency
ImprovementStrategies
Reduce TotalW orkload
Shift W ork outof Peaks
Increase Abilityto Deal W ith
W ork
Better AllocateResources to
Match Demand
W ork
Time of Day
Demand
Capacity
ExcessDemand
ExcessCapacity
Demand
Capacity
Demand
Capacity
Demand
Capacity
Demand
Capacity
ModifyDemand
ModifyCapacity
Call Avoidance
Peak lopping
SmarterResource Management
AHT reduction

-12-Catalyst-gov.PPT
© Copyright 2002 - Mason Group Ltd
Just look how complex it might be…..
MaximiseOperationalEfficiency
R e d u c eWorkload
C all A vo idance
ReduceMisroutedCalls(calls forotherbusinessunits)
ReduceTransfers
ReduceRepeatChase-up Calls
SubstituteCommodityCalls Via SelfService
Contract withCustomer tosetExpectations
OptimiseOne andDone Rate
ActiveMonitoring ofService Levelsfor Work inProgress
O p t i m i s eC a ll D ura t io n
Minimise"Preamble"Customer IDand Reasonfor Call
AutomateHighVolumeCoreFunctions
MinimiseWrap andAfter CallWork
Access toCustomerDetails
ContactHistory &CurrentStatus
FormalCallStructures
Talk andTypeSkills
AutomatedFulfilmentand NextActions"Workflow"
Minimisethe NeedforAgentSupport
OngoingCoachingandDevelopment
On-lineHelp
AutomateTransfers
Multi-SkilledAgents
M a x i m i s eR e s o u r c eU t i l i s a t i o n
I n c r e a s eA c c u r a c y o fForecasting andS c h e d u l i n g
DevelopSpecialistExpertiseand Tools
MeasureForecastingAccuracy
MaximiseShiftEfficiency
Introduce"SwingGroups"for Periodsof HighDemand
EnsureAgents areQueueConscious
TraininginWorkloadDynamics
Provisionof RealTime MI
OutboundRestrictions
M a x i m i s eO rganisa t io na lC a p a c i t y
MaximiseEconomiesof Scale
Multi-SiteQueuing -Virtual CC
DevelopOngoingPerformanceOptimisationFramework
Optimisenon-ProductiveTime
DevelopBestPracticeRoleModels
"How doI do?"
Status ofWork inProgress
InformationRetrieval
IncreaseCoaching bySupervisorsandCoaches

-13-Catalyst-gov.PPT
© Copyright 2002 - Mason Group Ltd
Staff Optimisation-effective resource management
• Eastern
Shift_One (3)
Shift_Two (1)
Shift_Three (2)
Shift_Four (2)
Shift_Five (3)
Shift_Six (1)
Shift_Six (1)
•1100 •1600 •2100 •0200 •0700
• Staff Optimisation provides detailed models for the number of contact handlers needed to staff a contact centre at a given service level.
• Optimising break patterns
• Optimises shift overlaps and agent utilisation
• Provide multiple organisational scenarios, to display the relative merits and risks of each.
Shift Name Break Name From To No.AgentsShift_One 07:00 17:00 5
Lunch 11:00 2Lunch 12:00 2Lunch 13:00 1
Shift_Three 11:00 21:00 2Lunch 16:00 2
Shift_Four 17:00 03:00 3Lunch 22:00 2Lunch 23:00 1
Shift_Five 21:00 07:00 3Lunch 01:00 2Lunch 02:00 1

-14-Catalyst-gov.PPT
© Copyright 2002 - Mason Group Ltd
Many contacts are inappropriate or due to service failure…• Core sales opportunity calls account for only 47%
of all calls
• 28% of calls were not meant for the call centres
• 12% of calls were‘chase-ups’
FTB12%
Home Imp. Loan6%
Home Movers14%
Non Dept Query28%
Switcher4%
Tele Service Enquiry2% Branch Call Enquiry
1%
FPS- Life Cover1%
Existing Cust. Rate Change3%
FPS- Pensions1%
FPS- Savings & Investment3%
Complaint1%
Chase Up 12%
Re- Schedual Appointment1%
Re- Mortgages11%

-15-Catalyst-gov.PPT
© Copyright 2002 - Mason Group Ltd
How are calls structured- look for un productive time
Ready17%
ReasonKnown5%
AppSelectn7%
CallBody33%
Hold6%
Transfer2%
WrapUp18%
HangUp0%
Unavailable9%
CustKnown2%
Greet1%
• 44% time is not spent on calls
• only 41% of time is spentspeaking with customers
• 7% of time thesystem is updating
30 min per dayfor a 7 hr shift= 6 calls
• 18% inWrap
• 8% inHold & Transfer

-16-Catalyst-gov.PPT
© Copyright 2002 - Mason Group Ltd
Why are customers put on ‘hold’?
Admin4%
Back Office Consultation
3%
Data Retrieval24%
Expert Consultation8%
FPA (another team)19%
FPA (in team)7%
MA (another team)6%
MA (in team)3%
Other17%
Supervisor Consultation
7%
System Delay2%
• 50% of hold time is spent consulting with other agents or supervisors
• The majority of hold occurrences required agents to leave their desks
• Average time spent on hold at any one time was 75 sec

-17-Catalyst-gov.PPT
© Copyright 2002 - Mason Group Ltd
AHT management- complexity analysis Registration Reason for Call by number of Calls
1%1%1%1%1%1%1%1%1%1%1%
2%2%2%2%
2%2%2%
3%3%3%
23%Appt to Register a Birth15%Make Appt for Marriage15%App to Register a Death
10%General Marriage Enquiry6%General Birth Enquiry
Make Appt for Notice of MarriageMake Appt for NOM/Marriage
General Death Reg Enquiry•Identify FAQs and take a view on complexity of calls ( 80 /20 rule.
•Helps establish demarcation &
•Training needs
Check App Time/venue/Dates for MarriageCancel Death Reg Appt
Birth Reg adviceCopy of Birth Certificate
Check Process for MarriageAppt to Correct an Death Entry
Appt to add/amend NameMarriage Discussion AppsInfo on add/amend Names
Foreign Country Marriage RegistrationCopy of Death certificate
Checking of Coroners PaperworkCheck Availability Marriage
Change Marriage AppsChange an Marriage Apps
Change an Death AppsChange an Birth AppointmentCancellation of Marriage Apps

www.masoncom.com
Conclusions and Case study

-19-Catalyst-gov.PPT
© Copyright 2002 - Mason Group Ltd
• A lot has happened in Four years.. Volumes and staff levels have doubled for example
• Baselining and a non partisan review gets to the bottom of their service issues. This was far reaching –people, processes and technology.
• The DVLA didn’t know what they didn’t know… Baselining provides insights..
• Timescales demonstrate that change takes time• Staffing:
– Who should provide the service? Do existing staff have the right skill sets? If not DVLA has made it so.
– Change management – get the enthusiasm and skills correct
• Helped them answer questions such as what is the level customer demand for:
– Specific services– Media channels– Opening hours– IVR usage
Discovery enables Design and Deployment of change.
A Case in Point
-20-Catalyst-gov.PPT
© Copyright 2002 - Mason Group Ltd
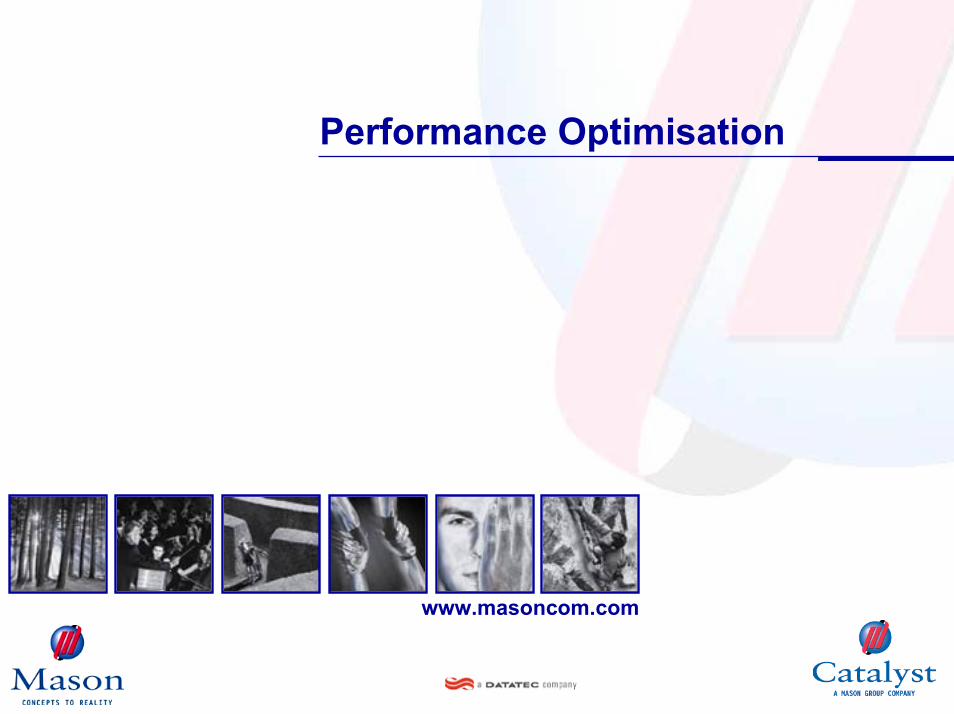
Some things we could be getting on with right now
• An analysis of the “As is” processes in order to establish the potential for improvements and benefits from both a citizen and organisational perspective
• Documentation of the “To be” processes and associated benefits
• Validate the operational model that underpins the Business Process Models
• Validate the technical model that underpin the Business Process Models- Don’t go an buy technology without a case for it.
• Validate (and where necessary define and describe the Key Performance Indicator(s) associated with the Business Processes, depending on your maturity level
• Transfer of Business Process Modelling skills to operations staff – offer career development in areas such as Business Improvement and Business Change Management

-21-Catalyst-gov.PPT
© Copyright 2002 - Mason Group Ltd
Conclusions and some actions• Customer focus requires a balance between People, Process
and Technology – Optimisation is the key
• Prioritise the (say) top three issues, and focus on them to drive benefits, reduce cost or release latency
• Integrated service level management is not managed well today and will remain a challenge in the short to medium term.
• Efficiency and Effectiveness can be dramatically improved through review of the contact life cycle and streamlining process end-to-end- you don’t need to have a contact centre to do this! Start with Effectiveness!
• Develop a channel management strategy based on the unique needs of your Citizens Demographic. It enables choice and provides opportunity for savings – e.g. self-help.
• The best service propositions and products are meaningless without Employee satisfaction, retention and productivity being a focus for the business as it supports the delivery of the value proposition