Embed Size (px)
Citation preview
1
IINDUSTRIALNDUSTRIAL EECOLOGYCOLOGY AAPPLICATIONSPPLICATIONS: : Contaminant Sources and Fate Contaminant Sources and Fate in the NYin the NY--NJ Harbor WatershedNJ Harbor Watershed
Earth Institute Seminars on Sustainable Development Earth Institute Seminars on Sustainable Development Columbia UniversityColumbia University
October 12October 12th, th, 20062006
Marta A. Panero, Ph.D.Marta A. Panero, Ph.D.Director, Harbor Project, NYASDirector, Harbor Project, NYAS
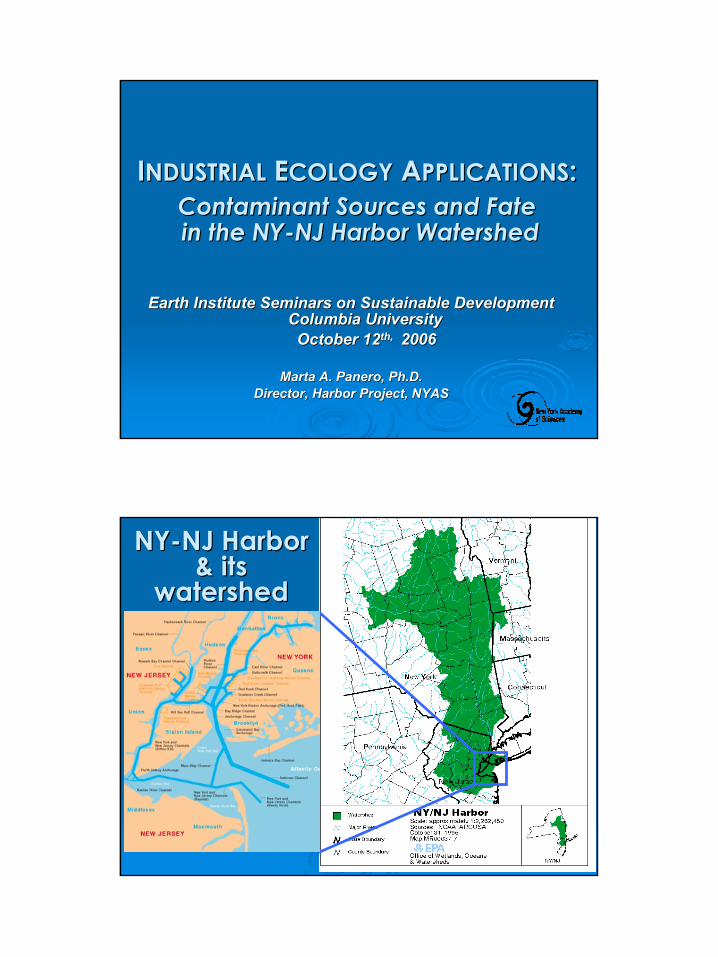
NYNY--NJ Harbor NJ Harbor & its & its
watershedwatershed

2
Why use Industrial Ecology?Why use Industrial Ecology?SystemsSystems--based approach based approach –– concerned with the concerned with the interrelationships of anthropogenic systems and their interrelationships of anthropogenic systems and their impact on the environment: impact on the environment:
Model interactions among and between industries and consumers baModel interactions among and between industries and consumers based sed upon a natural analogue (Descriptive)upon a natural analogue (Descriptive)Seeks to optimize the total industrial materials cycle from virgSeeks to optimize the total industrial materials cycle from virgin material to in material to finished product to waste disposal in order to lessen the impactfinished product to waste disposal in order to lessen the impact of these of these processes on the environment (Prescriptive)processes on the environment (Prescriptive)
Goal: materials and energy optimizationGoal: materials and energy optimizationDeDe--materialization: minimize extraction & usematerialization: minimize extraction & useMaterial integration: reuse; recycling Material integration: reuse; recycling Cradle to cradle approach Cradle to cradle approach
Analytical toolsAnalytical tools: : material flows, mass balance, life cycle analysismaterial flows, mass balance, life cycle analysis
Overall Goals of Project:Overall Goals of Project:Identify Identify the locations in five toxicant cycles (Hg, Cd, the locations in five toxicant cycles (Hg, Cd, PCBs, dioxins and PAHs) where pollution prevention PCBs, dioxins and PAHs) where pollution prevention (P2) would most efficiently contribute to long(P2) would most efficiently contribute to long--term term reductions in loadings to the harborreductions in loadings to the harbor
Develop with a stakeholders consortium Develop with a stakeholders consortium practical P2 practical P2 strategies that address toxicantstrategies that address toxicant releases / emissions. releases / emissions.
Encourage implementationEncourage implementation of the recommended of the recommended actions by integrating stakeholders into the research actions by integrating stakeholders into the research and policy making process and policy making process
3
ResearchResearchIdentify sourcesIdentify sources, flows and sinks for contaminants , flows and sinks for contaminants through the region including products, processes and through the region including products, processes and sectors that produce, use and/or release these sectors that produce, use and/or release these contaminantscontaminants
Develop a Substance Flow AssessmentDevelop a Substance Flow Assessment, , quantifying contaminant flows and transformations quantifying contaminant flows and transformations (from extraction, production, consumption, to post(from extraction, production, consumption, to post--consumption, including disposal rates) [Industrial consumption, including disposal rates) [Industrial Ecology assessment]Ecology assessment]
Quantify contaminant flows in and out of the Quantify contaminant flows in and out of the HarborHarbor –– through air, water and land [Harbor Mass through air, water and land [Harbor Mass Balance]Balance]
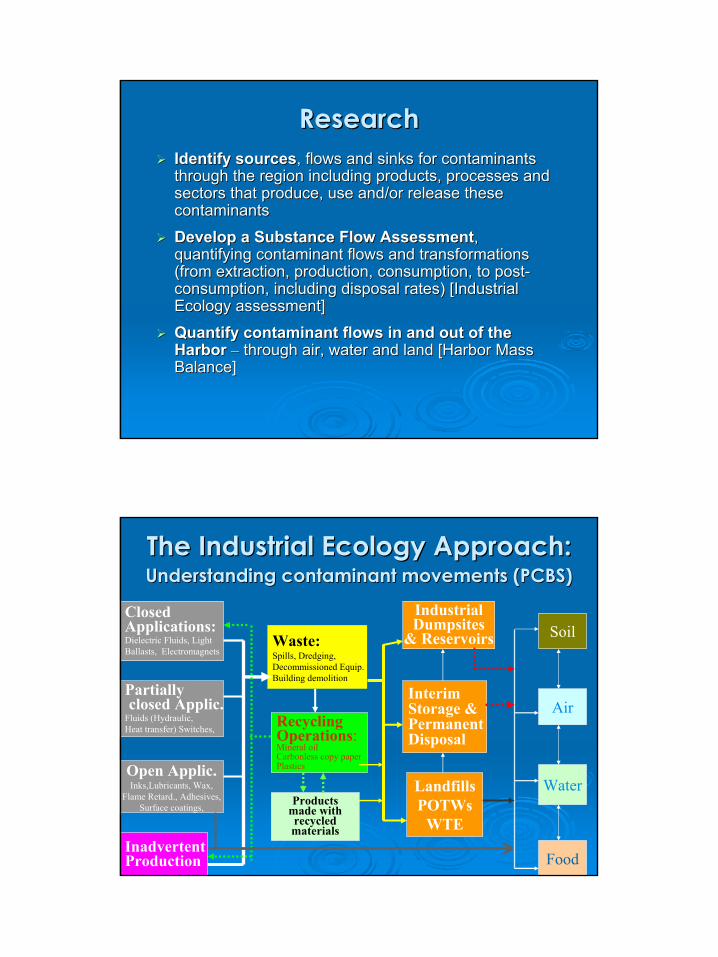
The Industrial Ecology Approach:The Industrial Ecology Approach:Understanding contaminant movements (PCBS)Understanding contaminant movements (PCBS)
Closed Applications:Dielectric Fluids, Light Ballasts, Electromagnets
Partiallyclosed Applic.
Fluids (Hydraulic, Heat transfer) Switches,
Open Applic.Inks,Lubricants, Wax,
Flame Retard., Adhesives,Surface coatings,
Waste:Spills, Dredging,Decommissioned Equip.Building demolition
Recycling Operations:Mineral oilCarbonless copy paperPlastics
Interim Storage & Permanent Disposal
IndustrialDumpsites
& Reservoirs
LandfillsPOTWs
WTEProducts
made withrecycledmaterials
Soil
Food
Water
Air
Inadvertent Production
4
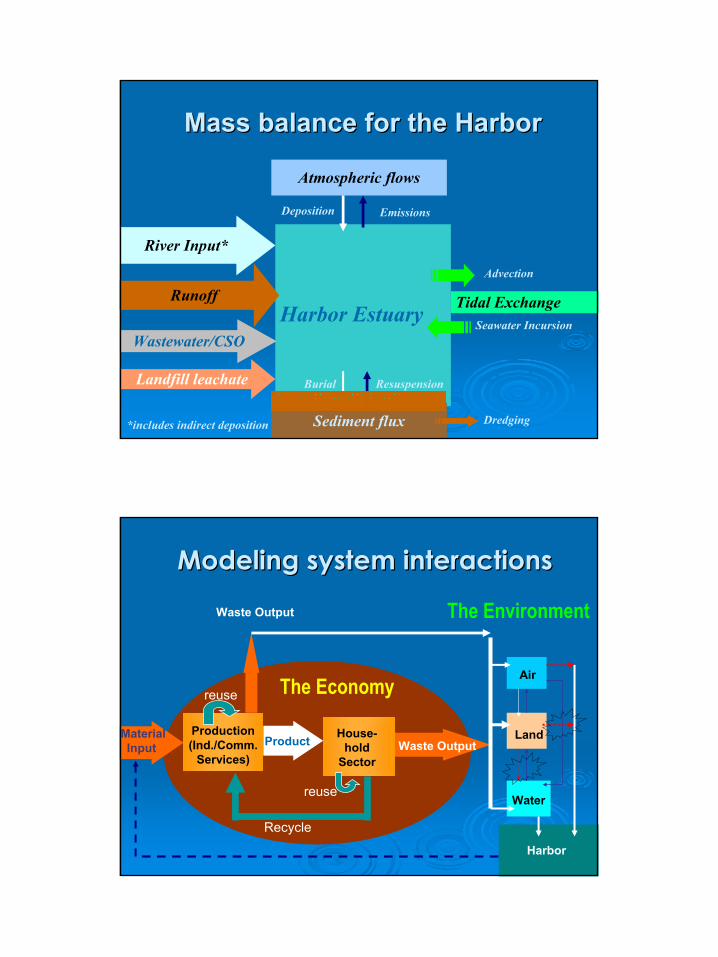
Mass balance for the HarborMass balance for the Harbor
Harbor Estuary
River Input*
Atmospheric flows
EmissionsDeposition
Wastewater/CSO
Tidal Exchange
Advection
Resuspension
Sediment flux
Burial
Seawater Incursion
*includes indirect deposition
Runoff
Landfill leachate
Dredging
Modeling system interactionsModeling system interactions
The Environment
MaterialInput
The Economy Air
House-hold
Sector
reuse
Product Waste OutputLand
Water
Production(Ind./Comm.
Services)
Harbor
Waste Output
Recycle
reuse
5
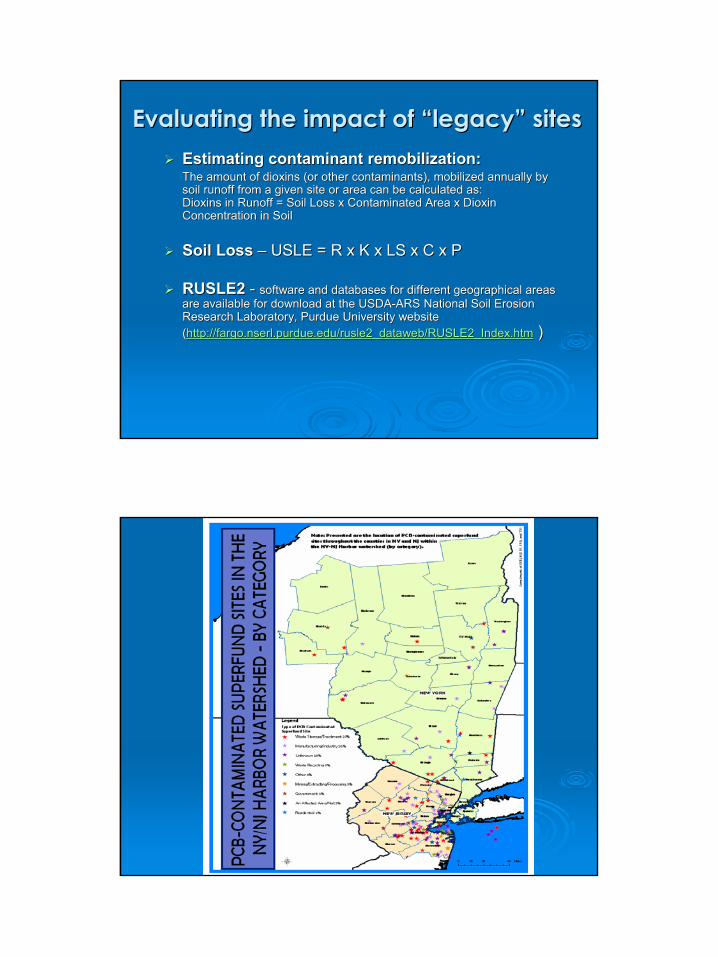
Evaluating the impact of “legacy” sitesEvaluating the impact of “legacy” sitesEstimating contaminant remobilization:Estimating contaminant remobilization:The amount of dioxins (or other contaminants), mobilized annuallThe amount of dioxins (or other contaminants), mobilized annually by y by soil runoff from a given site or area can be calculated as:soil runoff from a given site or area can be calculated as:Dioxins in Runoff = Soil Loss x Contaminated Area x Dioxin Dioxins in Runoff = Soil Loss x Contaminated Area x Dioxin Concentration in SoilConcentration in Soil
Soil LossSoil Loss –– USLE = R x K x LS x C x PUSLE = R x K x LS x C x P
RUSLE2RUSLE2 -- software and databases for different geographical areas software and databases for different geographical areas are available for download at the USDAare available for download at the USDA--ARS National Soil Erosion ARS National Soil Erosion Research Laboratory, Purdue University website Research Laboratory, Purdue University website ((http://fargo.nserl.purdue.edu/rusle2_dataweb/RUSLE2_Index.htmhttp://fargo.nserl.purdue.edu/rusle2_dataweb/RUSLE2_Index.htm ))
6
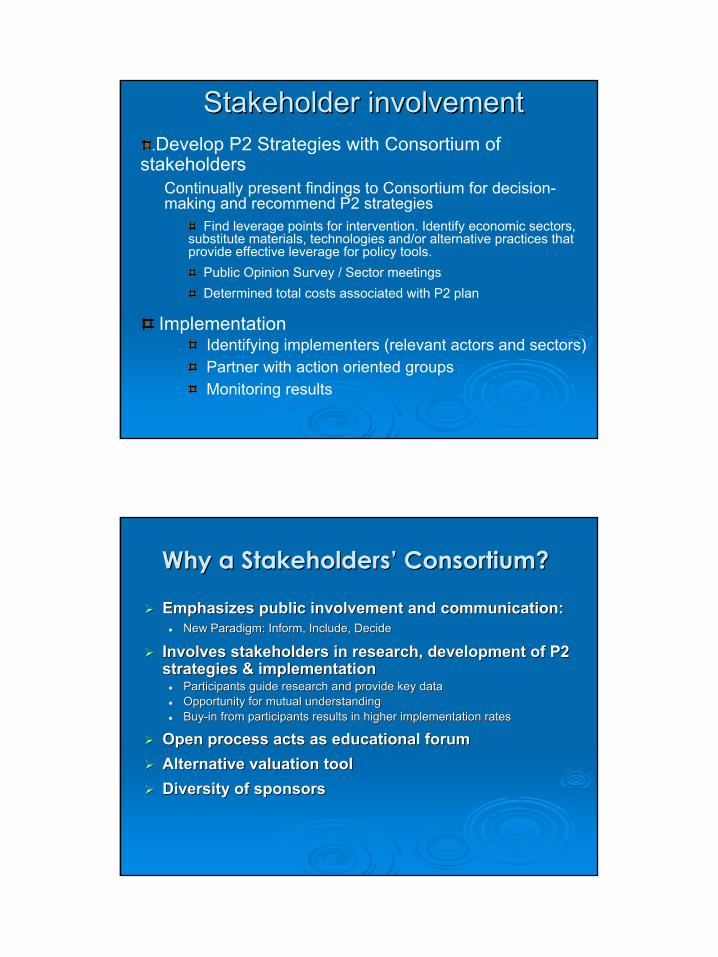
Stakeholder involvementStakeholder involvement.Develop P2 Strategies with Consortium of
stakeholdersContinually present findings to Consortium for decision-making and recommend P2 strategies
Find leverage points for intervention. Identify economic sectors, substitute materials, technologies and/or alternative practices that provide effective leverage for policy tools.
Public Opinion Survey / Sector meetingsDetermined total costs associated with P2 plan
ImplementationIdentifying implementers (relevant actors and sectors)Partner with action oriented groupsMonitoring results
Why a Stakeholders’ Consortium?Why a Stakeholders’ Consortium?
Emphasizes public involvement and communication: Emphasizes public involvement and communication: New Paradigm: Inform, Include, DecideNew Paradigm: Inform, Include, Decide
Involves stakeholders in research, development of P2 Involves stakeholders in research, development of P2 strategies & implementationstrategies & implementation
Participants guide research and provide key dataParticipants guide research and provide key dataOpportunity for mutual understanding Opportunity for mutual understanding BuyBuy--in from participants results in higher implementation rates in from participants results in higher implementation rates
Open process acts as educational forumOpen process acts as educational forumAlternative valuation toolAlternative valuation toolDiversity of sponsorsDiversity of sponsors
7
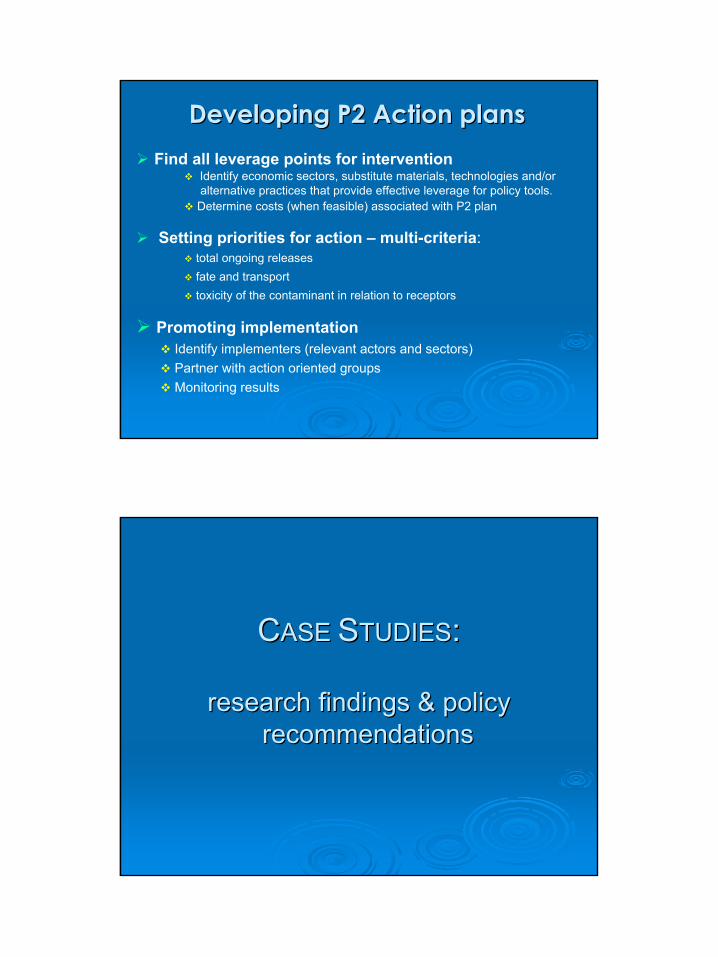
Developing P2 Action plansDeveloping P2 Action plansFind all leverage points for intervention
Identify economic sectors, substitute materials, technologies and/or alternative practices that provide effective leverage for policy tools.Determine costs (when feasible) associated with P2 plan
Setting priorities for action – multi-criteria:total ongoing releasesfate and transporttoxicity of the contaminant in relation to receptors
Promoting implementationIdentify implementers (relevant actors and sectors)Partner with action oriented groupsMonitoring results
CCASEASE SSTUDIESTUDIES: :
research findings & policy research findings & policy recommendationsrecommendations

8
Research Findings: Research Findings: Hg initial releases to all media (kg/yr), by sectorHg initial releases to all media (kg/yr), by sector
0
1000
2000
3000
4000
kg/y
r
Dental Facilities Hospitals HouseholdsSwitches: Auto Fluorescent Lamps LaboratoriesThermostats Coal comb:Utilties Coal Comb: IndustrialAutos: fuel combustion Switches: Lighting BatteriesCrematoria Switches Appliances
Mercury Inputs to the HarborMercury Inputs to the Harbor
Proportion of Mercury Contributed by Each Pool
9%51%
40%
Landfill Wastewater Air
Proportion of Methyl-mercury Contributed by
Each Pool
71%
17%
12%
9
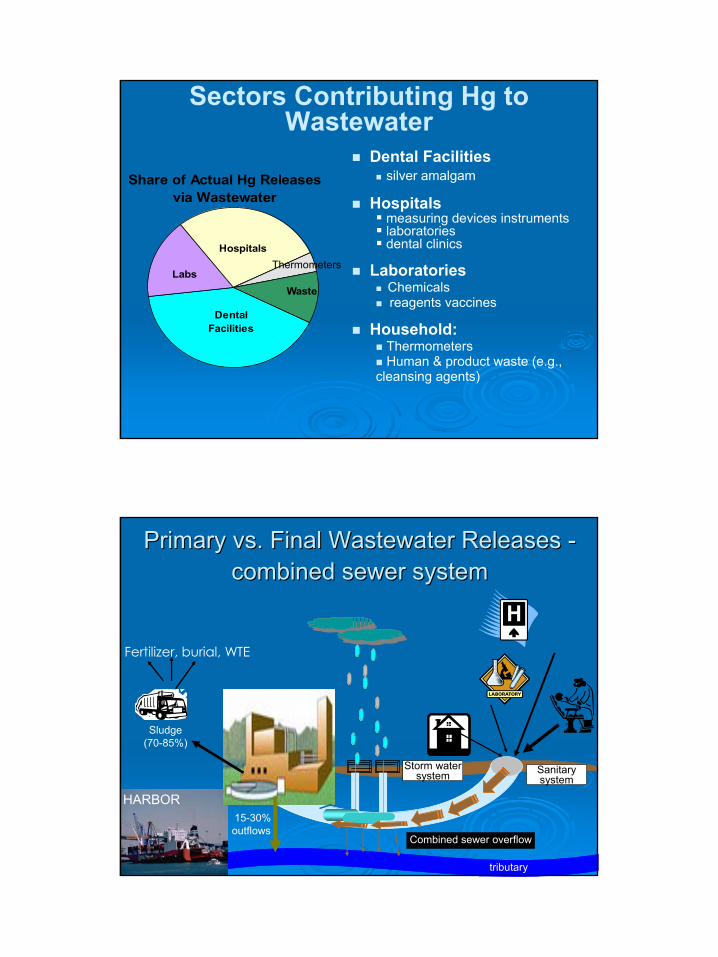
Sectors Contributing Hg to Wastewater
Dental Facilitiessilver amalgam
Hospitalsmeasuring devices instrumentslaboratories dental clinics
LaboratoriesChemicalsreagents vaccines
Household:ThermometersHuman & product waste (e.g.,
cleansing agents)
Share of Actual Hg Releases via Wastewater
Waste
Hospitals
Labs
Dental Facilities
Thermometers
Primary vs. Final Wastewater Releases Primary vs. Final Wastewater Releases --combined sewer systemcombined sewer system
HARBOR
POTW
Sludge (70-85%)
15-30% outflows
Fertilizer, burial, WTE
Sanitary system
Storm water system
tributary
Combined sewer overflow
10
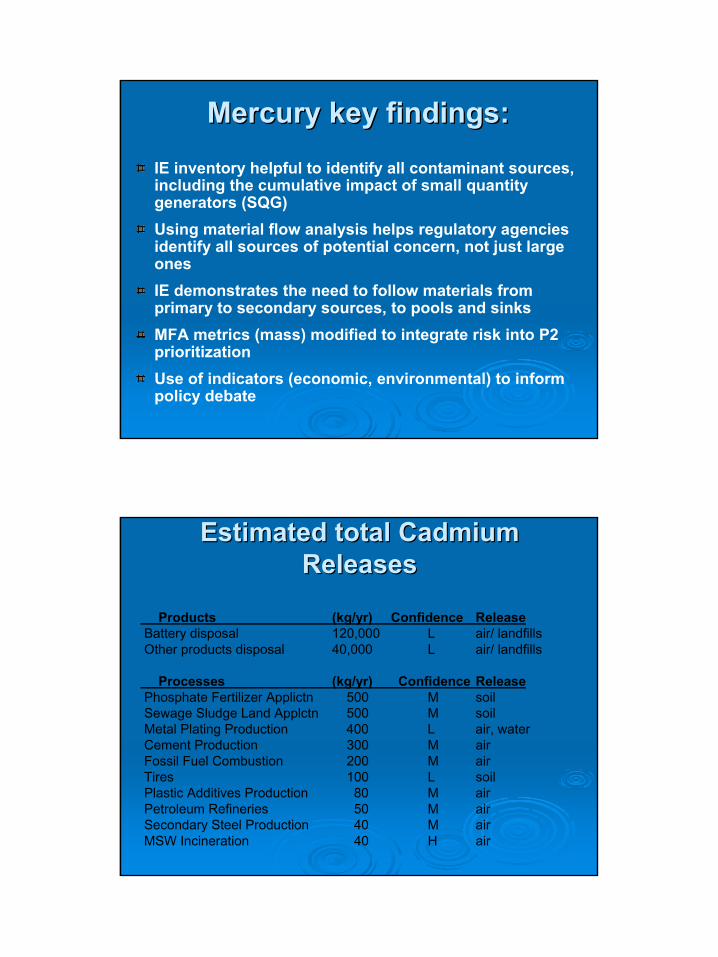
Mercury key findings:Mercury key findings:
IE inventory helpful to identify all contaminant sources, including the cumulative impact of small quantity generators (SQG)Using material flow analysis helps regulatory agencies identify all sources of potential concern, not just large onesIE demonstrates the need to follow materials from primary to secondary sources, to pools and sinksMFA metrics (mass) modified to integrate risk into P2 prioritization Use of indicators (economic, environmental) to inform policy debate
Estimated total Cadmium Estimated total Cadmium ReleasesReleases
Products (kg/yr) Confidence ReleaseBattery disposal 120,000 L air/ landfillsOther products disposal 40,000 L air/ landfills
Processes (kg/yr) Confidence ReleasePhosphate Fertilizer Applictn 500 M soilSewage Sludge Land Applctn 500 M soilMetal Plating Production 400 L air, waterCement Production 300 M airFossil Fuel Combustion 200 M airTires 100 L soilPlastic Additives Production 80 M airPetroleum Refineries 50 M airSecondary Steel Production 40 M airMSW Incineration 40 H air
11
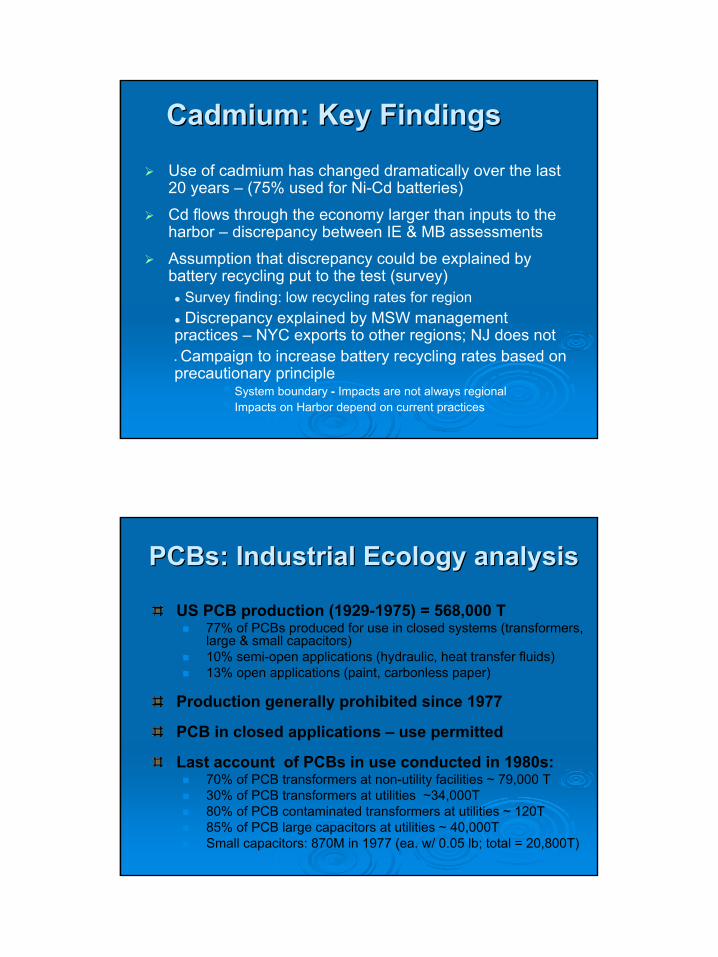
Cadmium: Key FindingsCadmium: Key Findings
Use of cadmium has changed dramatically over the last 20 years – (75% used for Ni-Cd batteries)
Cd flows through the economy larger than inputs to the harbor – discrepancy between IE & MB assessments
Assumption that discrepancy could be explained by battery recycling put to the test (survey)
Survey finding: low recycling rates for regionDiscrepancy explained by MSW management
practices – NYC exports to other regions; NJ does notCampaign to increase battery recycling rates based on
precautionary principle System boundary - Impacts are not always regionalImpacts on Harbor depend on current practices
PCBs: Industrial Ecology analysisPCBs: Industrial Ecology analysis
US PCB production (1929-1975) = 568,000 T 77% of PCBs produced for use in closed systems (transformers, large & small capacitors)10% semi-open applications (hydraulic, heat transfer fluids)13% open applications (paint, carbonless paper)
Production generally prohibited since 1977
PCB in closed applications – use permitted
Last account of PCBs in use conducted in 1980s:70% of PCB transformers at non-utility facilities ~ 79,000 T30% of PCB transformers at utilities ~34,000T80% of PCB contaminated transformers at utilities ~ 120T85% of PCB large capacitors at utilities ~ 40,000TSmall capacitors: 870M in 1977 (ea. w/ 0.05 lb; total = 20,800T)
12
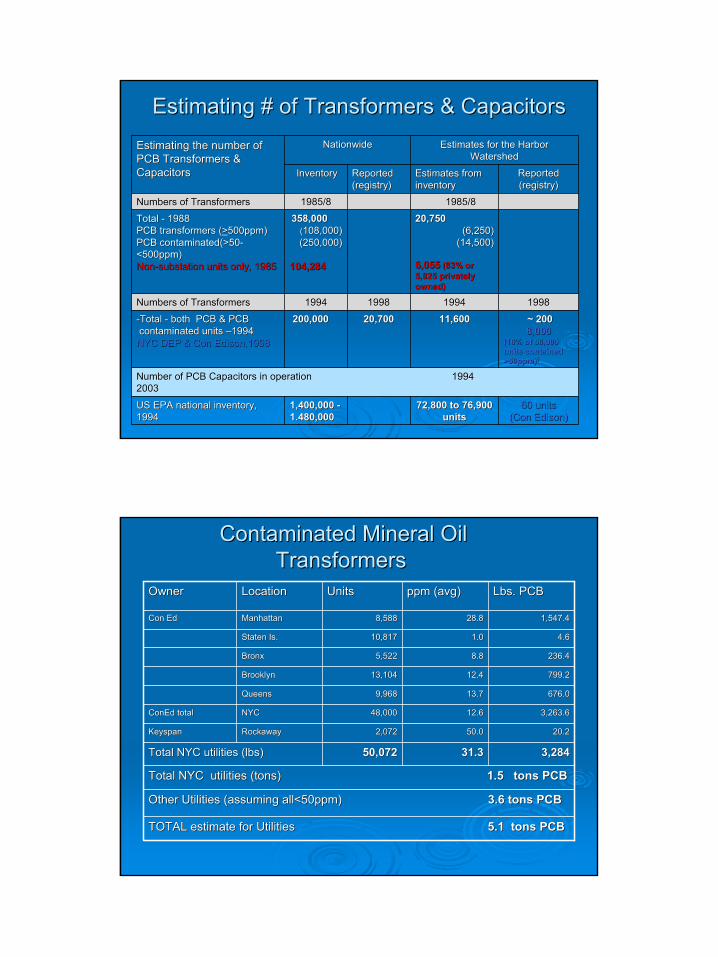
Estimating # of Transformers & CapacitorsEstimating # of Transformers & Capacitors
Number of PCB Capacitors in operation Number of PCB Capacitors in operation 1994 1994 20032003
~ 200 ~ 200 8,0008,000
(16% of 50,000 (16% of 50,000 units contained units contained >50ppm)>50ppm)††
11,60011,60020,70020,700200,000200,000--Total Total -- both PCB & PCB both PCB & PCB contaminated units contaminated units ––19941994
NYC DEP & Con Edison,1998NYC DEP & Con Edison,1998
60 units 60 units (Con Edison)(Con Edison)
72,800 to 76,90072,800 to 76,900unitsunits
1,400,000 1,400,000 --1.480,0001.480,000
US EPA national inventory, US EPA national inventory, 19941994
19981998199419941998199819941994Numbers of TransformersNumbers of Transformers
20,75020,750(6,250) (6,250)
(14,500) (14,500)
6,0556,055 (83% or (83% or 5,025 privately 5,025 privately owned)owned)
358,000358,000((108,000)108,000)(250,000) (250,000)
104,284104,284
Total Total -- 19881988PCB transformers (PCB transformers (>>500ppm) 500ppm) PCB contaminated(>50PCB contaminated(>50--<500ppm)<500ppm)NonNon--substation units only, 1985substation units only, 1985
1985/81985/81985/81985/8Numbers of TransformersNumbers of Transformers
ReportedReported(registry)(registry)
Estimates from Estimates from inventory inventory
Reported Reported (registry)(registry)
Inventory Inventory
Estimates for the Harbor Estimates for the Harbor WatershedWatershed
NationwideNationwideEstimating the number of Estimating the number of PCB Transformers & PCB Transformers & CapacitorsCapacitors
Contaminated Mineral Oil Contaminated Mineral Oil Transformers Transformers
TOTAL estimate for Utilities TOTAL estimate for Utilities 5.1 tons PCB5.1 tons PCB
Other Utilities (assuming all<50ppm) Other Utilities (assuming all<50ppm) 3.6 tons PCB3.6 tons PCB
Total NYC utilities (tons) Total NYC utilities (tons) 1.5 tons PCB1.5 tons PCB
3,2843,28431.331.350,07250,072Total NYC utilities (lbs)Total NYC utilities (lbs)
20.220.250.050.02,0722,072RockawayRockawayKeyspanKeyspan
3,263.63,263.612.612.648,00048,000NYCNYCConEd totalConEd total
676.0676.013.713.79,9689,968QueensQueens
799.2799.212.412.413,10413,104BrooklynBrooklyn
236.4236.48.88.85,5225,522BronxBronx
4.64.61.01.010,81710,817Staten Is.Staten Is.
1,547.41,547.428.828.88,5888,588ManhattanManhattanCon EdCon Ed
Lbs. PCBLbs. PCBppm (avg)ppm (avg)UnitsUnitsLocationLocationOwnerOwner

13
Small PCB CapacitorsSmall PCB CapacitorsOver 100 million small PCB capacitors produced in US
PCB capacitors sold in the watershed: 5.2M – 5.8M Average quantity: 24 grams each~ 120 - 140 tons PCBs in small capacitors in watershed
High uncertainty about their fate If only 10%-30% still in use - 12-14 tons PCBs
Small PCB capacitors are not regulated as hazardous waste and may be sent to landfills or municipal waste incinerators
Landfills that accept “fluff” material (e.g.metal shredding) have higher concentrations of PCBs in leachate
Limited funding for PCB small capacitors collection programs
Limited public awareness about household products containing PCBs
Products containing PCBsProducts containing PCBs
Small capacitors in:Fluorescent lamp ballastsCertain household appliances such as old refrigerators & microwave ovens
Paints – oldCarbonless paper – oldCertain pigments and dyesGlossy papers with special inks Kaofin Certain flocculants used at POTWs
14
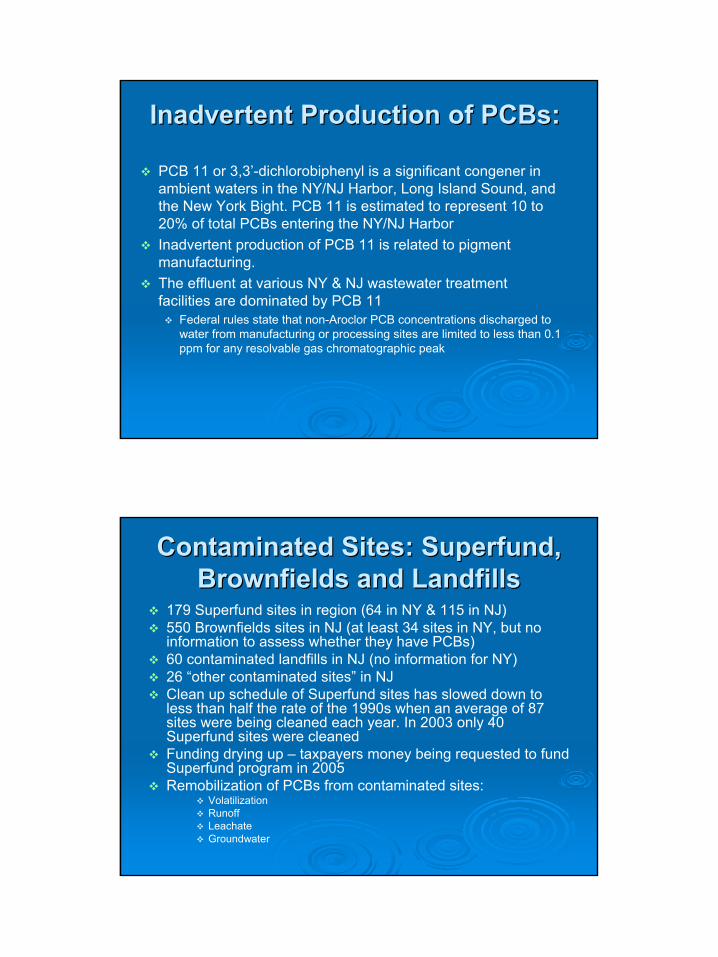
Inadvertent Production of PCBs:Inadvertent Production of PCBs:
PCB 11 or 3,3’-dichlorobiphenyl is a significant congener in ambient waters in the NY/NJ Harbor, Long Island Sound, and the New York Bight. PCB 11 is estimated to represent 10 to 20% of total PCBs entering the NY/NJ Harbor Inadvertent production of PCB 11 is related to pigment manufacturing. The effluent at various NY & NJ wastewater treatment facilities are dominated by PCB 11
Federal rules state that non-Aroclor PCB concentrations discharged to water from manufacturing or processing sites are limited to less than 0.1 ppm for any resolvable gas chromatographic peak
Contaminated Sites: Superfund, Contaminated Sites: Superfund, Brownfields and LandfillsBrownfields and Landfills
179 Superfund sites in region (64 in NY & 115 in NJ)550 Brownfields sites in NJ (at least 34 sites in NY, but no information to assess whether they have PCBs)60 contaminated landfills in NJ (no information for NY)26 “other contaminated sites” in NJClean up schedule of Superfund sites has slowed down to less than half the rate of the 1990s when an average of 87 sites were being cleaned each year. In 2003 only 40 Superfund sites were cleanedFunding drying up – taxpayers money being requested to fund Superfund program in 2005Remobilization of PCBs from contaminated sites:
VolatilizationRunoff Leachate Groundwater

15
PCBs: Mass balance findingsPCBs: Mass balance findingsOngoing releases from upriver (including the Hudson
River Superfund Site) account for ~50-55 % of PCB inputs to the Harbor
The remaining 45-50% is local inputs and the homolog distributions are different than the upstream sourceStormwater runoff (17%); CSO (17%); WWTP are minor input (5-10%);Inadvertent ongoing production/use (10-15%); PCB 11, 35, 77, 209
Hudson
East River
Atm Dep
Wastew ater
CSOs
RunoffHudson
East Ri ver
Atm Dep
Wastewater
CSOs
Runof f
Homologs 3, 4, 5 Homologs 7, 8, 9
PCBs PCBs -- key findingskey findingsHR Upstream and downstream PCB inputs –
different homologue patterns
SQG: cumulative impact of small capacitors overlooked:US (2004) : 40M – 50M units (960 – 1,200 tons) ?Harbor watershed (2004) : ~2.5M - 3M (60 – 70 tons) ?
10-20% disposal rate/yr: (6 - 14 T/yr)
Inadvertent production: ~ 10-15% of current PCB loadingsUsage/disposal:
uneven reporting requirements on usage/disposal (large capacitors)Regulatory gapLimited recycling opportunities
Opportunities for P2 / BMPsImpact of 179 Superfund sites in Harbor region
27% - waste storage/treatment & 8% - recycling26% - manufacturing/industry23% - unknown; other – 9%mining/extracting/processing – 3%Government – 3%; residential – 2%
16
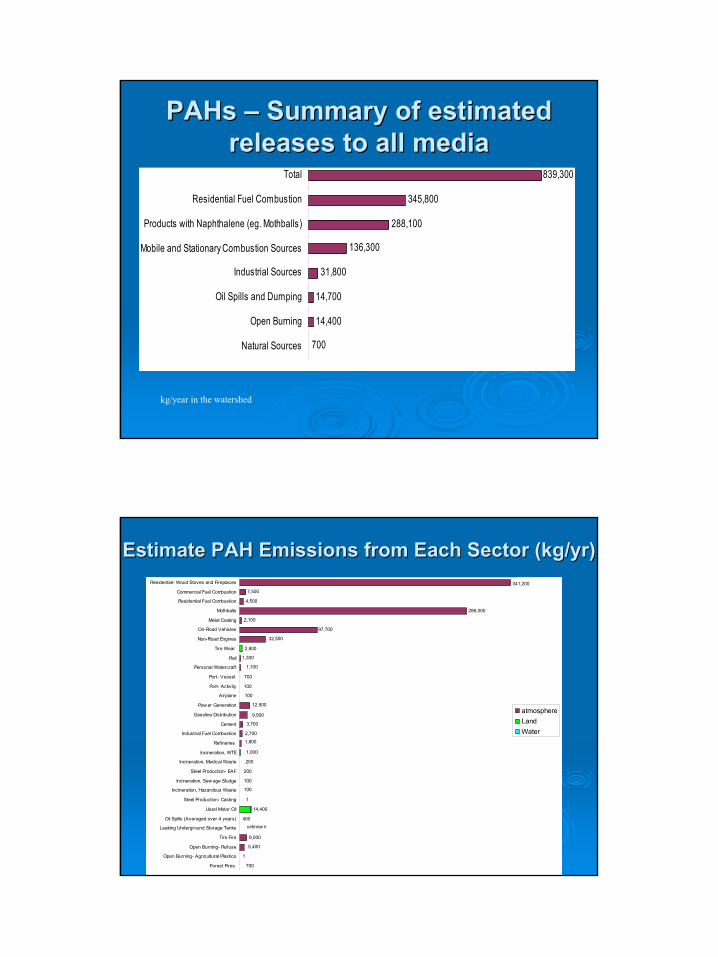
PAHs PAHs –– Summary of estimated Summary of estimated releases to all mediareleases to all media
kg/year in the watershed
839,300
345,800
288,100
136,300
31,800
14,700
14,400
700
Total
Residential Fuel Combustion
Products with Naphthalene (eg. Mothballs)
Mobile and Stationary Combustion Sources
Industrial Sources
Oil Spills and Dumping
Open Burning
Natural Sources
2,100
97,700
286,000
341,200
4,500
7,500
1,300
1,100
32,500
700
100
100
12,500
9,500
3,700
2,700
1,800
200
200
100
100
1
9,000
5,400
1
700
400
14,400
2,800
1,000
Residential- Wood Stoves and Fireplaces
Commercial Fuel Combustion
Residential Fuel Combustion
Mothballs
Metal Coating
On-Road Vehicles
Non-Road Engines
Tire Wear
Rail
Personal Watercraft
Port- Vessel
Port- Activity
Airplane
Pow er Generation
Gasoline Distribution
Cement
Industrial Fuel Combustion
Refineries
Incineration, WTE
Incineration, Medical Waste
Steel Production- EAF
Incineration, Sew age Sludge
Incineration, Hazardous Waste
Steel Production- Casting
Used Motor Oil
Oil Spills (Averaged over 4 years)
Leaking Underground Storage Tanks
Tire Fire
Open Burning- Refuse
Open Burning- Agricultural Plastics
Forest Fires
atmosphereLandWater
unknow n
Estimate PAH Emissions from Each Sector (kg/yr)Estimate PAH Emissions from Each Sector (kg/yr)
17
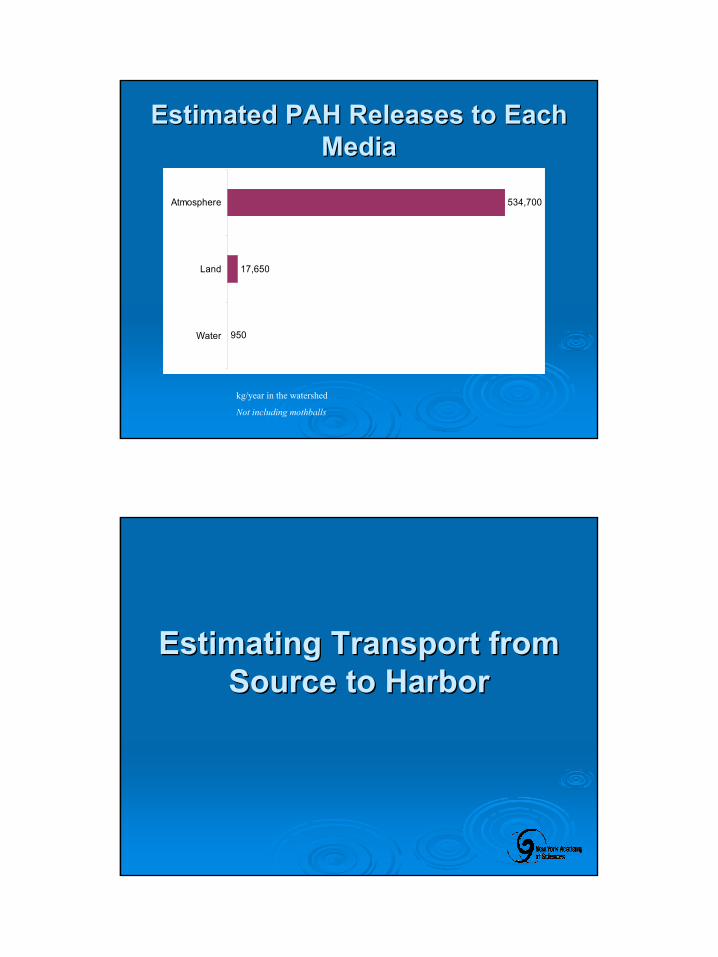
Estimated PAH Releases to Each Estimated PAH Releases to Each MediaMedia
kg/year in the watershed
Not including mothballs
950
534,700
17,650
Water
Land
Atmosphere
Estimating Transport from Estimating Transport from Source to HarborSource to Harbor

18
Fate & Transport via WaterFate & Transport via Water
BiodegradationAdvectionDredging
Sediment
Dissolved/Particulate
Spills & wastewaterSpills & wastewater
Photo oxidationAdvection
Evaporation/Deposition
Regional Water Regional Water EmissionsEmissions

19
Fate & Transport via AirFate & Transport via Air
Particulate/GaseousPhoto oxidationAdvection
Particulate/DissolvedBiodegradationAdvectionDredging
Runoff
Sediment
Region I:(NJ) Bergen, Passaic, Essex, Union, Hudson(NY) 5 Boroughs NYC
Region II:(NJ) Sussex, Morris, Somerset, Middlesex, Monmouth(NY) Rockland, Westchester, Orange, Putnam
Region III: (near Hudson)Ulster, Dutchess, Greene, Columbia, Albany, Rensselear
20
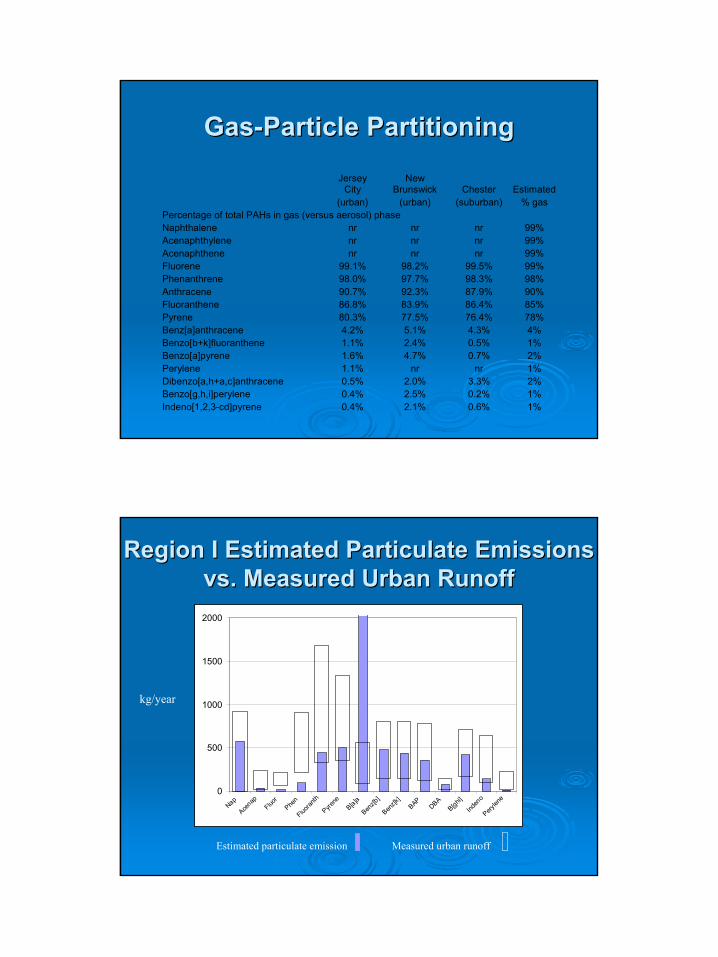
GasGas--Particle PartitioningParticle Partitioning
Jersey
City New
Brunswick Chester Estimated (urban) (urban) (suburban) % gas
Percentage of total PAHs in gas (versus aerosol) phase Naphthalene nr nr nr 99% Acenaphthylene nr nr nr 99% Acenaphthene nr nr nr 99% Fluorene 99.1% 98.2% 99.5% 99% Phenanthrene 98.0% 97.7% 98.3% 98% Anthracene 90.7% 92.3% 87.9% 90% Fluoranthene 86.8% 83.9% 86.4% 85% Pyrene 80.3% 77.5% 76.4% 78% Benz[a]anthracene 4.2% 5.1% 4.3% 4% Benzo[b+k]fluoranthene 1.1% 2.4% 0.5% 1% Benzo[a]pyrene 1.6% 4.7% 0.7% 2% Perylene 1.1% nr nr 1% Dibenzo[a,h+a,c]anthracene 0.5% 2.0% 3.3% 2% Benzo[g,h,i]perylene 0.4% 2.5% 0.2% 1% Indeno[1,2,3-cd]pyrene 0.4% 2.1% 0.6% 1%
Region I Estimated Particulate Emissions Region I Estimated Particulate Emissions vs. Measured Urban Runoffvs. Measured Urban Runoff
0
500
1000
1500
2000
Nap
Acenap
Fluor
Phen
Fluoran
th
Pyrene
B[a]a
Benz[b
]
Benz[k
]BAP
DBAB[ghi]
Inden
o
Perylen
e
kg/year
Estimated particulate emission Measured urban runoff
21
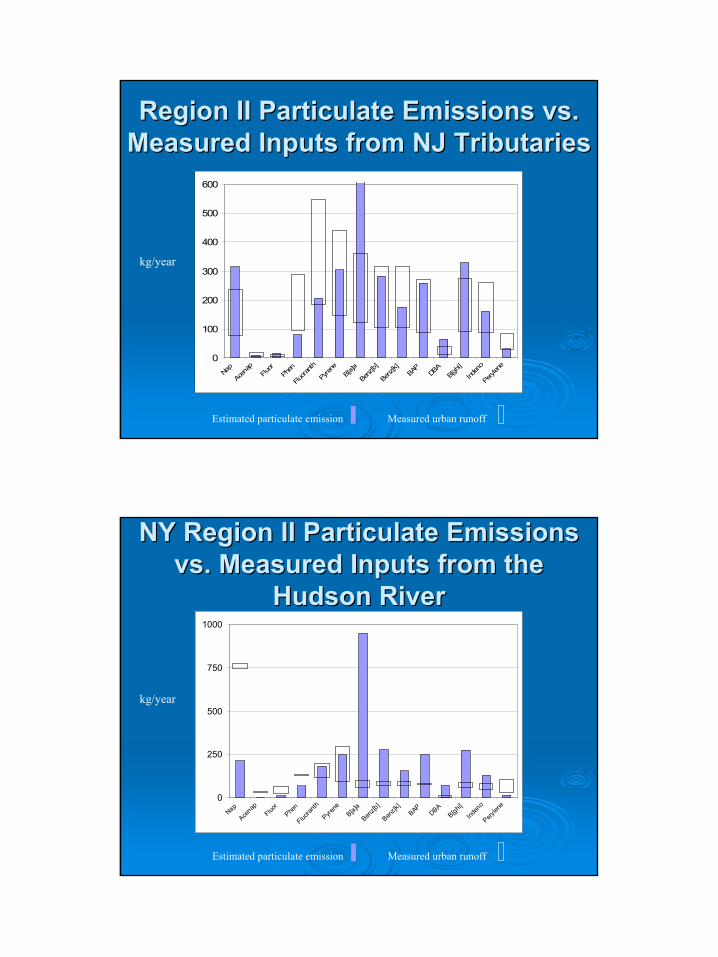
Region II Particulate Emissions vs. Region II Particulate Emissions vs. Measured Inputs from NJ TributariesMeasured Inputs from NJ Tributaries
0
100
200
300
400
500
600
Nap
Acen
apFlu
or
Phen
Fluora
nth
Pyren
eB[a
]a
Benz
[b]
Benz
[k]BA
PDB
AB[g
hi]
Inden
o
Peryl
ene
Estimated particulate emission Measured urban runoff
kg/year
NY Region II Particulate Emissions NY Region II Particulate Emissions vs. Measured Inputs from the vs. Measured Inputs from the
Hudson RiverHudson River
0
250
500
750
1000
Nap
Acenap
Fluor
Phen
Fluoran
th
Pyrene
B[a]a
Benz[b
]
Benz[k
]BAP
DBAB[ghi]
Inden
o
Perylen
e
Estimated particulate emission Measured urban runoff
kg/year
22
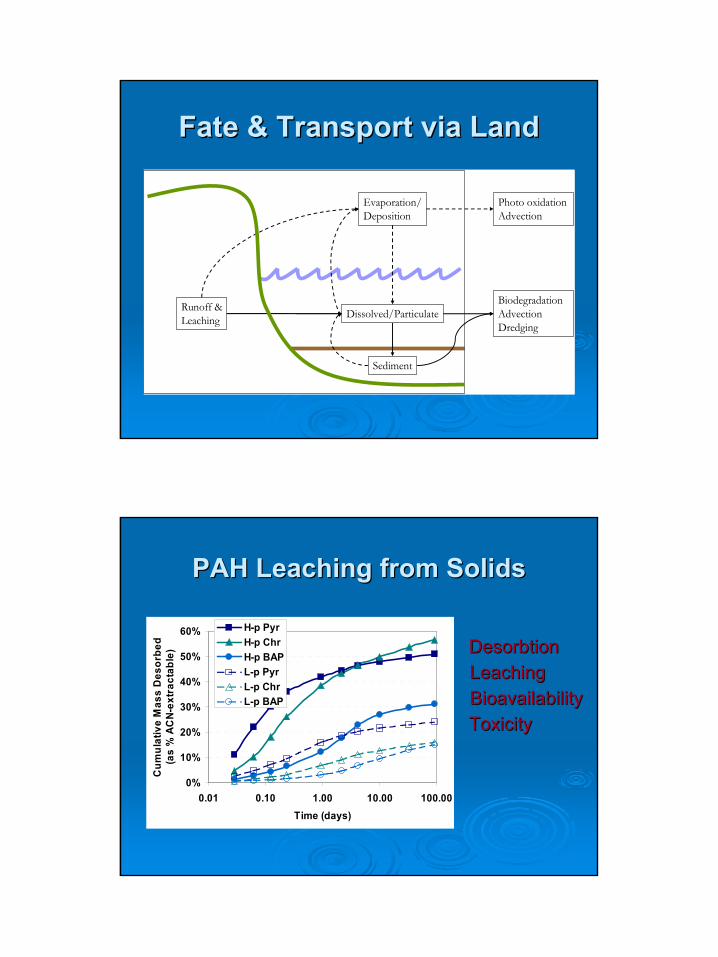
Fate & Transport via LandFate & Transport via Land
BiodegradationAdvectionDredging
Sediment
Dissolved/ParticulateRunoff &Leaching
Photo oxidationAdvection
Evaporation/Deposition
PAH Leaching from SolidsPAH Leaching from Solids
DesorbtionDesorbtionLeachingLeachingBioavailabilityBioavailabilityToxicityToxicity
0%
10%
20%
30%
40%
50%
60%
0.01 0.10 1.00 10.00 100.00Time (days)
Cum
ulat
ive
Mas
s D
esor
bed
(as
% A
CN-
extr
acta
ble)
H-p PyrH-p ChrH-p BAPL-p PyrL-p ChrL-p BAP
23
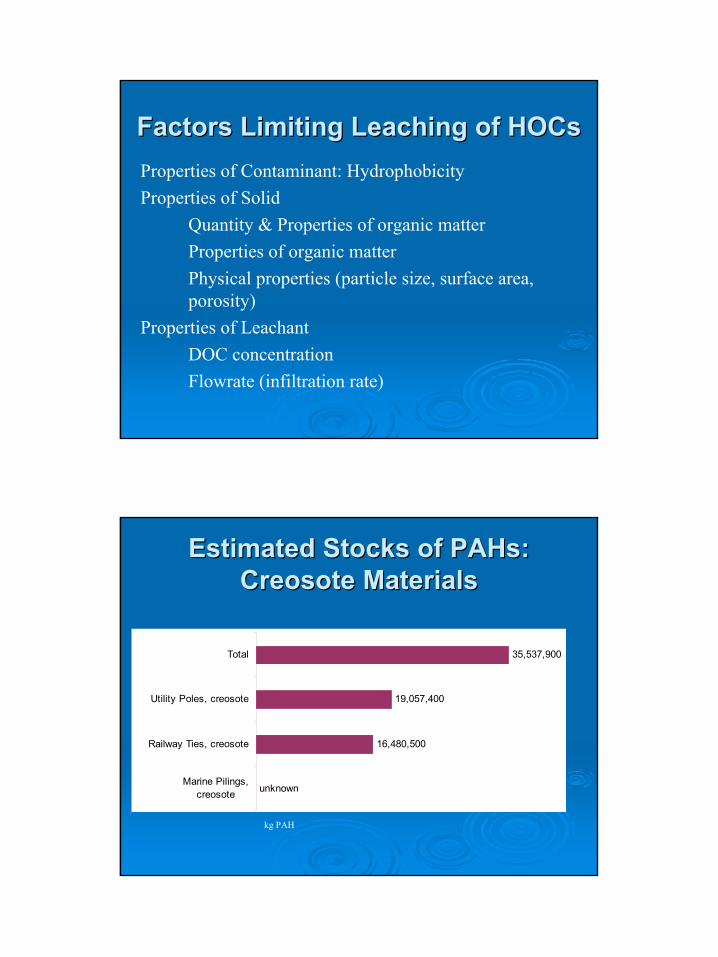
Factors Limiting Leaching of Factors Limiting Leaching of HOCsHOCsProperties of Contaminant: HydrophobicityProperties of Solid
Quantity & Properties of organic matterProperties of organic matterPhysical properties (particle size, surface area, porosity)
Properties of LeachantDOC concentrationFlowrate (infiltration rate)
Estimated Stocks of PAHs: Estimated Stocks of PAHs: Creosote MaterialsCreosote Materials
unknown
19,057,400
16,480,500
35,537,900
Marine Pilings,creosote
Railway Ties, creosote
Utility Poles, creosote
Total
kg PAH

24
Parking Lot SealantsParking Lot SealantsBackground:
• Sealants used to protect asphalt surfaces (i.e. parking lots and driveways).
• Two types of sealant: Asphalt based and Coal-tar based. (coal-tar sealants predominately used east of the Rockies)
• Concern with coal-tar and asphalt based sealants:
• Contain PAHs
• Abrade from surface over time and are transported via runoff.
• Data:
•Peter VanMetre, U.S. Geological Survey
• Robert P. DeMott, Pavements Coating Technology Center
Parking Lot Sealants, cont.Parking Lot Sealants, cont.
Problem: how do yields change over time?
Parking lot Sealants
Yield (µg PAH/m2 /rain event) = 946 (according to Mahler et al, 2005)
Coal tar sealant consumed in the watershed area (gallons/yr) = 5,800,000
Can we calculate a release in the watershed?
25 kg PAH for 1 rain event in the watershed.
~118 days of rain per year in watershed area
What if only asphalt based sealant was used?
11 kg PAH for 1 rain event in the watershed.
25
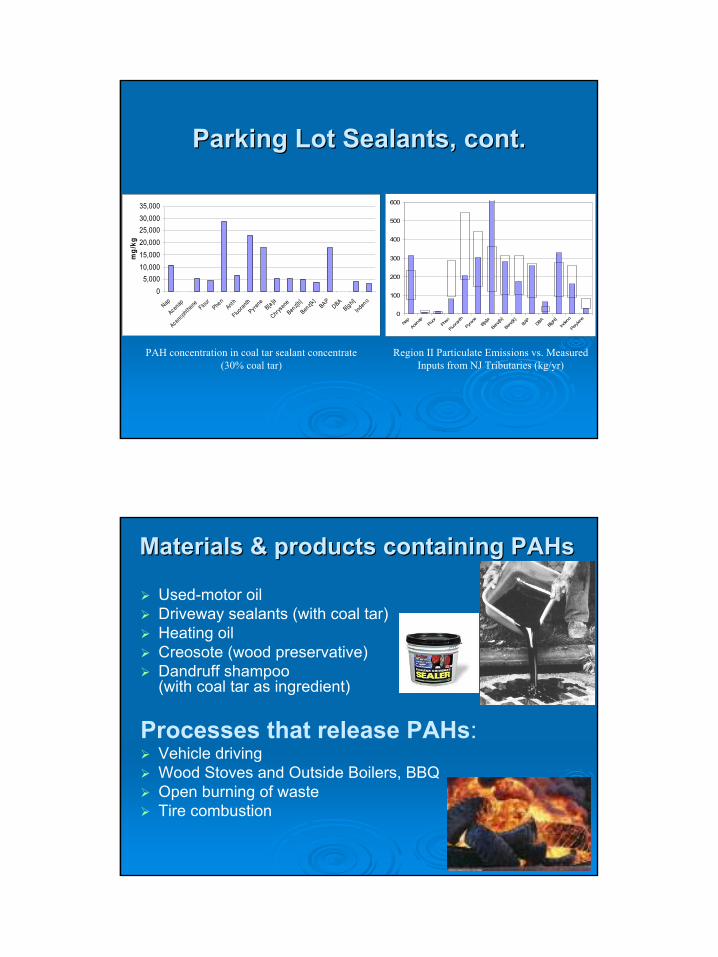
Parking Lot Sealants, cont.Parking Lot Sealants, cont.
05,000
10,00015,00020,00025,00030,00035,000
Nap
Acenap
Acenaph
thene Flour
Phen
Anth
Fluoranth
Pyrene
B[a ]a
Chrysene
Benz[b
]
Benz[k]
BAPDBA
B[ghi]
Inden
o
mg/
kg
0
100
200
300
400
500
600
Nap
Acen
apFlu
or
Phen
Fluora
nth
Pyren
eB[a
]a
Benz
[b]
Benz
[k]BA
PDB
AB[g
hi]
Inden
o
Peryl
ene
PAH concentration in coal tar sealant concentrate (30% coal tar)
Region II Particulate Emissions vs. Measured Inputs from NJ Tributaries (kg/yr)
ND ND
Materials & products containing PAHsMaterials & products containing PAHs
Used-motor oil Driveway sealants (with coal tar)Heating oil Creosote (wood preservative)Dandruff shampoo (with coal tar as ingredient)
Processes that release PAHs:Vehicle driving Wood Stoves and Outside Boilers, BBQOpen burning of waste Tire combustion
26
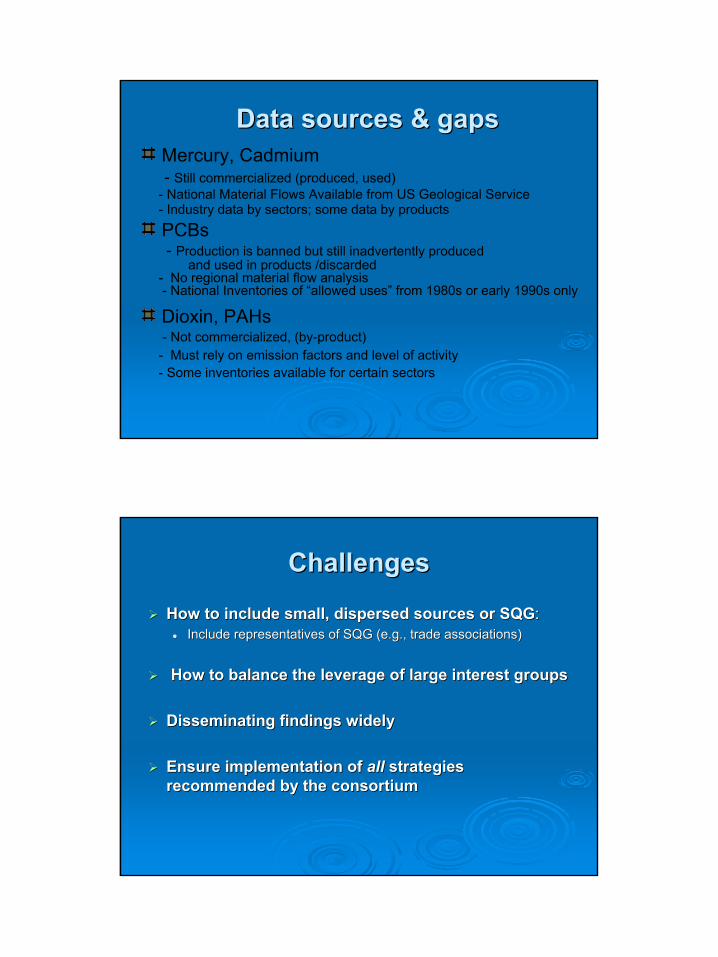
Data sources & gapsData sources & gapsMercury, Cadmium- Still commercialized (produced, used)
- National Material Flows Available from US Geological Service- Industry data by sectors; some data by products
PCBs- Production is banned but still inadvertently produced
and used in products /discarded - No regional material flow analysis- National Inventories of “allowed uses” from 1980s or early 1990s only
Dioxin, PAHs- Not commercialized, (by-product)
- Must rely on emission factors and level of activity- Some inventories available for certain sectors
ChallengesChallenges
How to include small, dispersed sources or SQGHow to include small, dispersed sources or SQG::Include representatives of SQG (e.g., trade associations)Include representatives of SQG (e.g., trade associations)
How to balance the leverage of large interest groupsHow to balance the leverage of large interest groups
Disseminating findings widelyDisseminating findings widely
Ensure implementation of Ensure implementation of allall strategies strategies recommended by the consortiumrecommended by the consortium
27
What aids the process?What aids the process?Systems approach (Industrial Ecology)
ID all sources & pathways provides new opportunities for interventionID all sectors & parties that are stakeholders
Stakeholder frameworksets its own learning & policy making dynamicdifferent points of view and interests co-existflexibility integrating different levels of participantsEducational forum
For copies of documents and more For copies of documents and more information about our project:information about our project:
http://www.nyas.org/programs/harbor.asp
“Pollution Prevention and Management Strategies for Mercury in the NY/NJ Harbor”
“Survey of Public Opinion: Opinions of Stakeholders on Issues that Concern the Future of the Harbor”
“Pollution Prevention and Management Strategies for Cadmium in the NY/NJ Harbor”
“Pollution Prevention and Management Strategies for PCBs in the NY/NJ Harbor”